1. Introduction
The paper by Salmon and Pizzo in this Special Issue [
1] refers to fundamental contributions of Jack Herring to the theories of two-dimensional (2D) and quasigeostrophic turbulence [
2,
3,
4]. The authors notice that much of the theoretical developments in these areas were accomplished in planar geometry in the hope that the
-plane approximation would capture the most important features of flows in the spherical geometry. Their primary conclusion, however, was that this is not the case, and that 2D incompressible flows on the sphere are significantly different from 2D flows on a
-plane, even in the case of vanishing rotation.
The situation is different for fast rotating flows with a
-effect, however, as on the largest scales,
-effect becomes predominant, and the interaction of the Rossby waves, or Rossby-Haurwitz waves (RHWs) in the spherical geometry, and turbulence leads to strong turbulence anisotropization, establishment of the regime of zonostrophic turbulence, see e.g. [
5,
6], and formation of zonal jets. As was demonstrated in [
7,
8], various features of zonostrophic turbulence, including its spectral properties, are amicable to representation in both planar and spherical geometries. Many facets of this dynamics are detailed in the recent book [
9].
An important feature of the zonostrophic regime is the excitation of non-dispersive nonlinear waves termed zonons first described in [
10]. These waves coexist with the linear RHWs and their physics is at the focus of the present study. In [
10] it was established that zonons are forced oscillations induced by RHWs in other modes via nonlinear interactions, and their dispersion relation differs from that of the RHWs. Zonons reside in regions with a strong shear between opposing jets acting as wave guides for the long-living coherent wave packets. In the physical space, as shown in [
11], zonons form westward propagating coherent eddies with zonal velocity equal to the phase speed of the most energetic RHWs.
Zonons can be viewed as a product of the interaction between energetic, or “ringing” RHWs and their overtones excited in other modes, the phenomenon reminiscent of enslaved vibrations excited by forced, ringing strings of a musical instrument in quiescent, echoing strings. Once excited, the sound waves from the echoing strings blend with those from the ringing strings and form a specific chromatic signal slowly emanating from the body of the musical instrument as a virtually self-preserving “acoustic soliton”, see e.g. [
12]. The underlying mechanism behind the integration of ringing and echoing vibrations is the nonlinear interaction between the energetic and enslaved modes.
Is there anything in common between zonons and another type of ringing waves, recently discovered in [
13]? They found that randomly excited global-scale atmospheric modes may come to a resonance with the lunar and solar atmospheric tidal waves described by the Laplace equation. In their words, these resonant interactions can make the atmosphere “ring like a bell”.
While the resonant wave interactions are linear, the processes underlying the formation and maintenance of zonons are not. As they emerge from the typical for solitary waves non-linear interaction between wave packets and the shear, one may hypothesize that zonons are indeed solitary waves, such as those studied in [
14,
15]. The latter papers focused on long waves in a homogeneous atmosphere with a uniform zonal flow and small velocity shear and arrived at the Korteweg - de Vries (KdV) equation. Following up studies [
16,
17] and others developed a general theory of solitary waves in a planetary zonal shear flow and demonstrated that the amplitude of long Rossby waves is governed by either the KdV equation or the modified KdV (mKdV) equation, dependent on the density stratification, see e.g. [
18]. Later, a multi-scale method utilized in [
19,
20] showed that the primitive governing equation can be reduced to the KdV equation controlling the evolution of long, small-amplitude Rossby waves.
In [
11], the connection between the solitary Rossby waves (SRWs) and zonons was outlined in the framework of the 2D barotropic vorticity equation on a
-plane. That study was akin to [
16] where SRWs were investigated on a
-plane using the vorticity equation expanded around latitude
in the absence of forcing and damping. A direct mathematical link between zonons and solitary Rossby waves was not established, however. Substantiating such link is one of the main goals of this paper.
Other studies were concerned with eddies’ energetics. In [
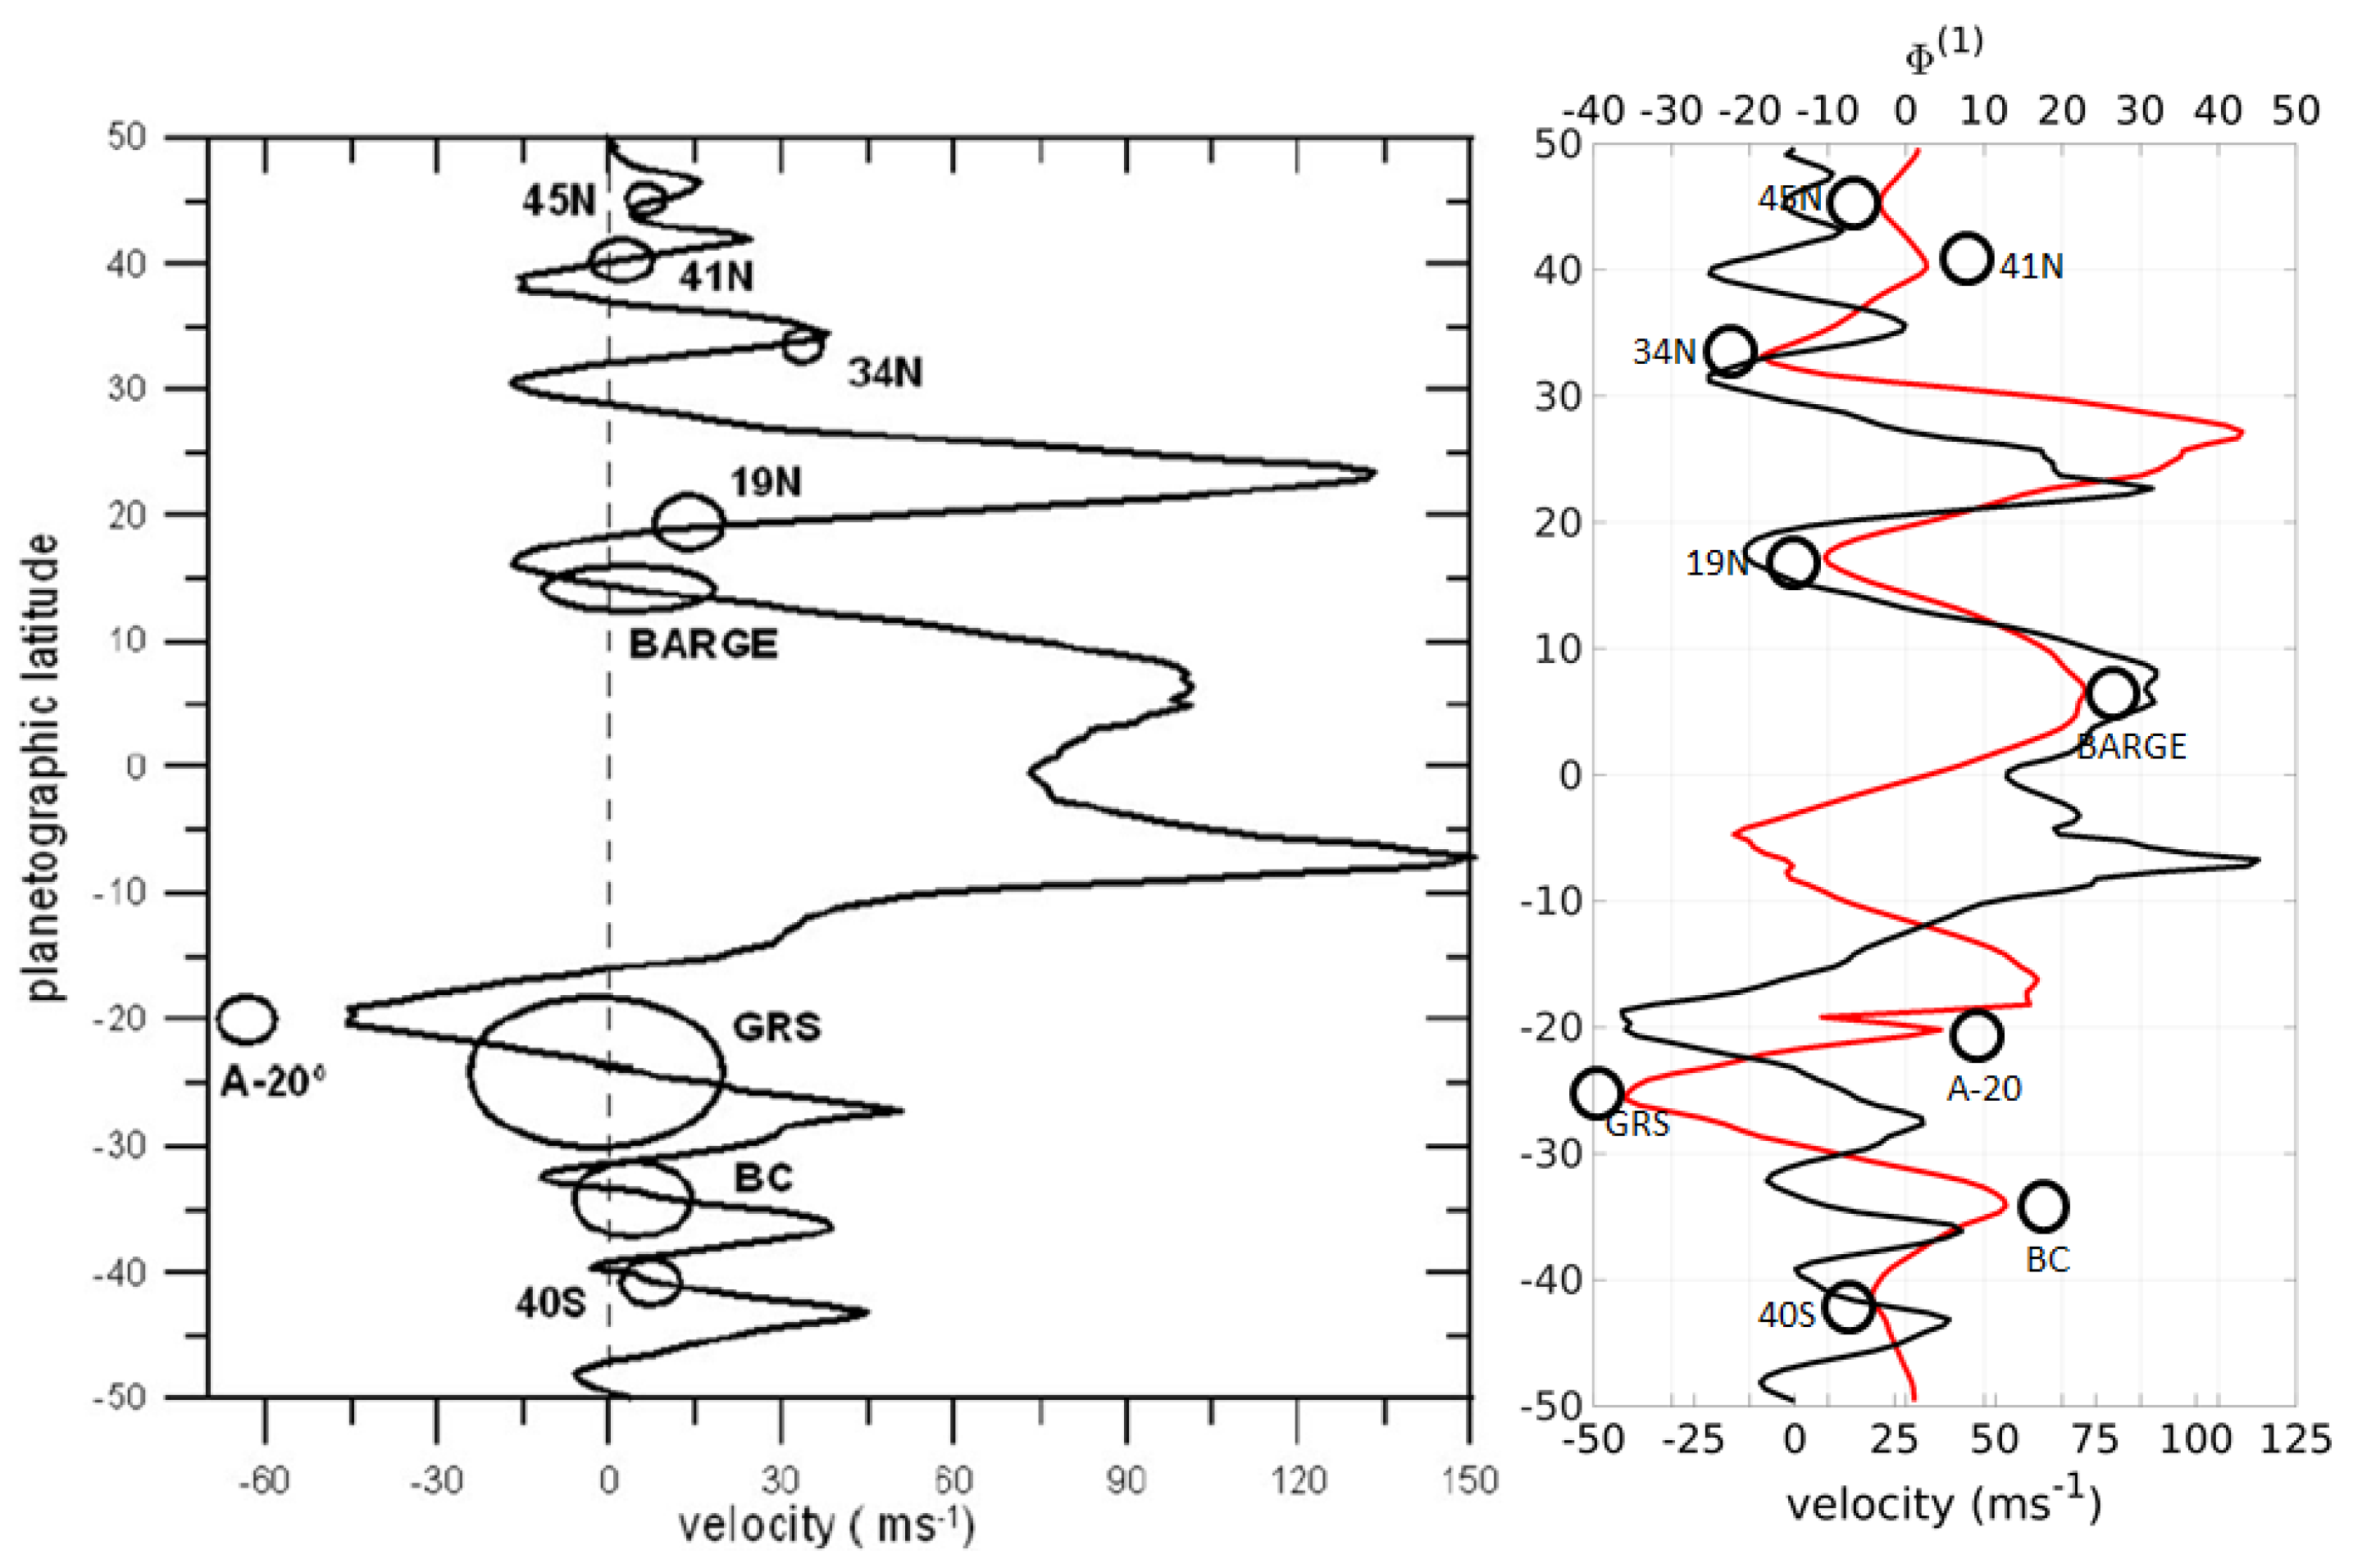
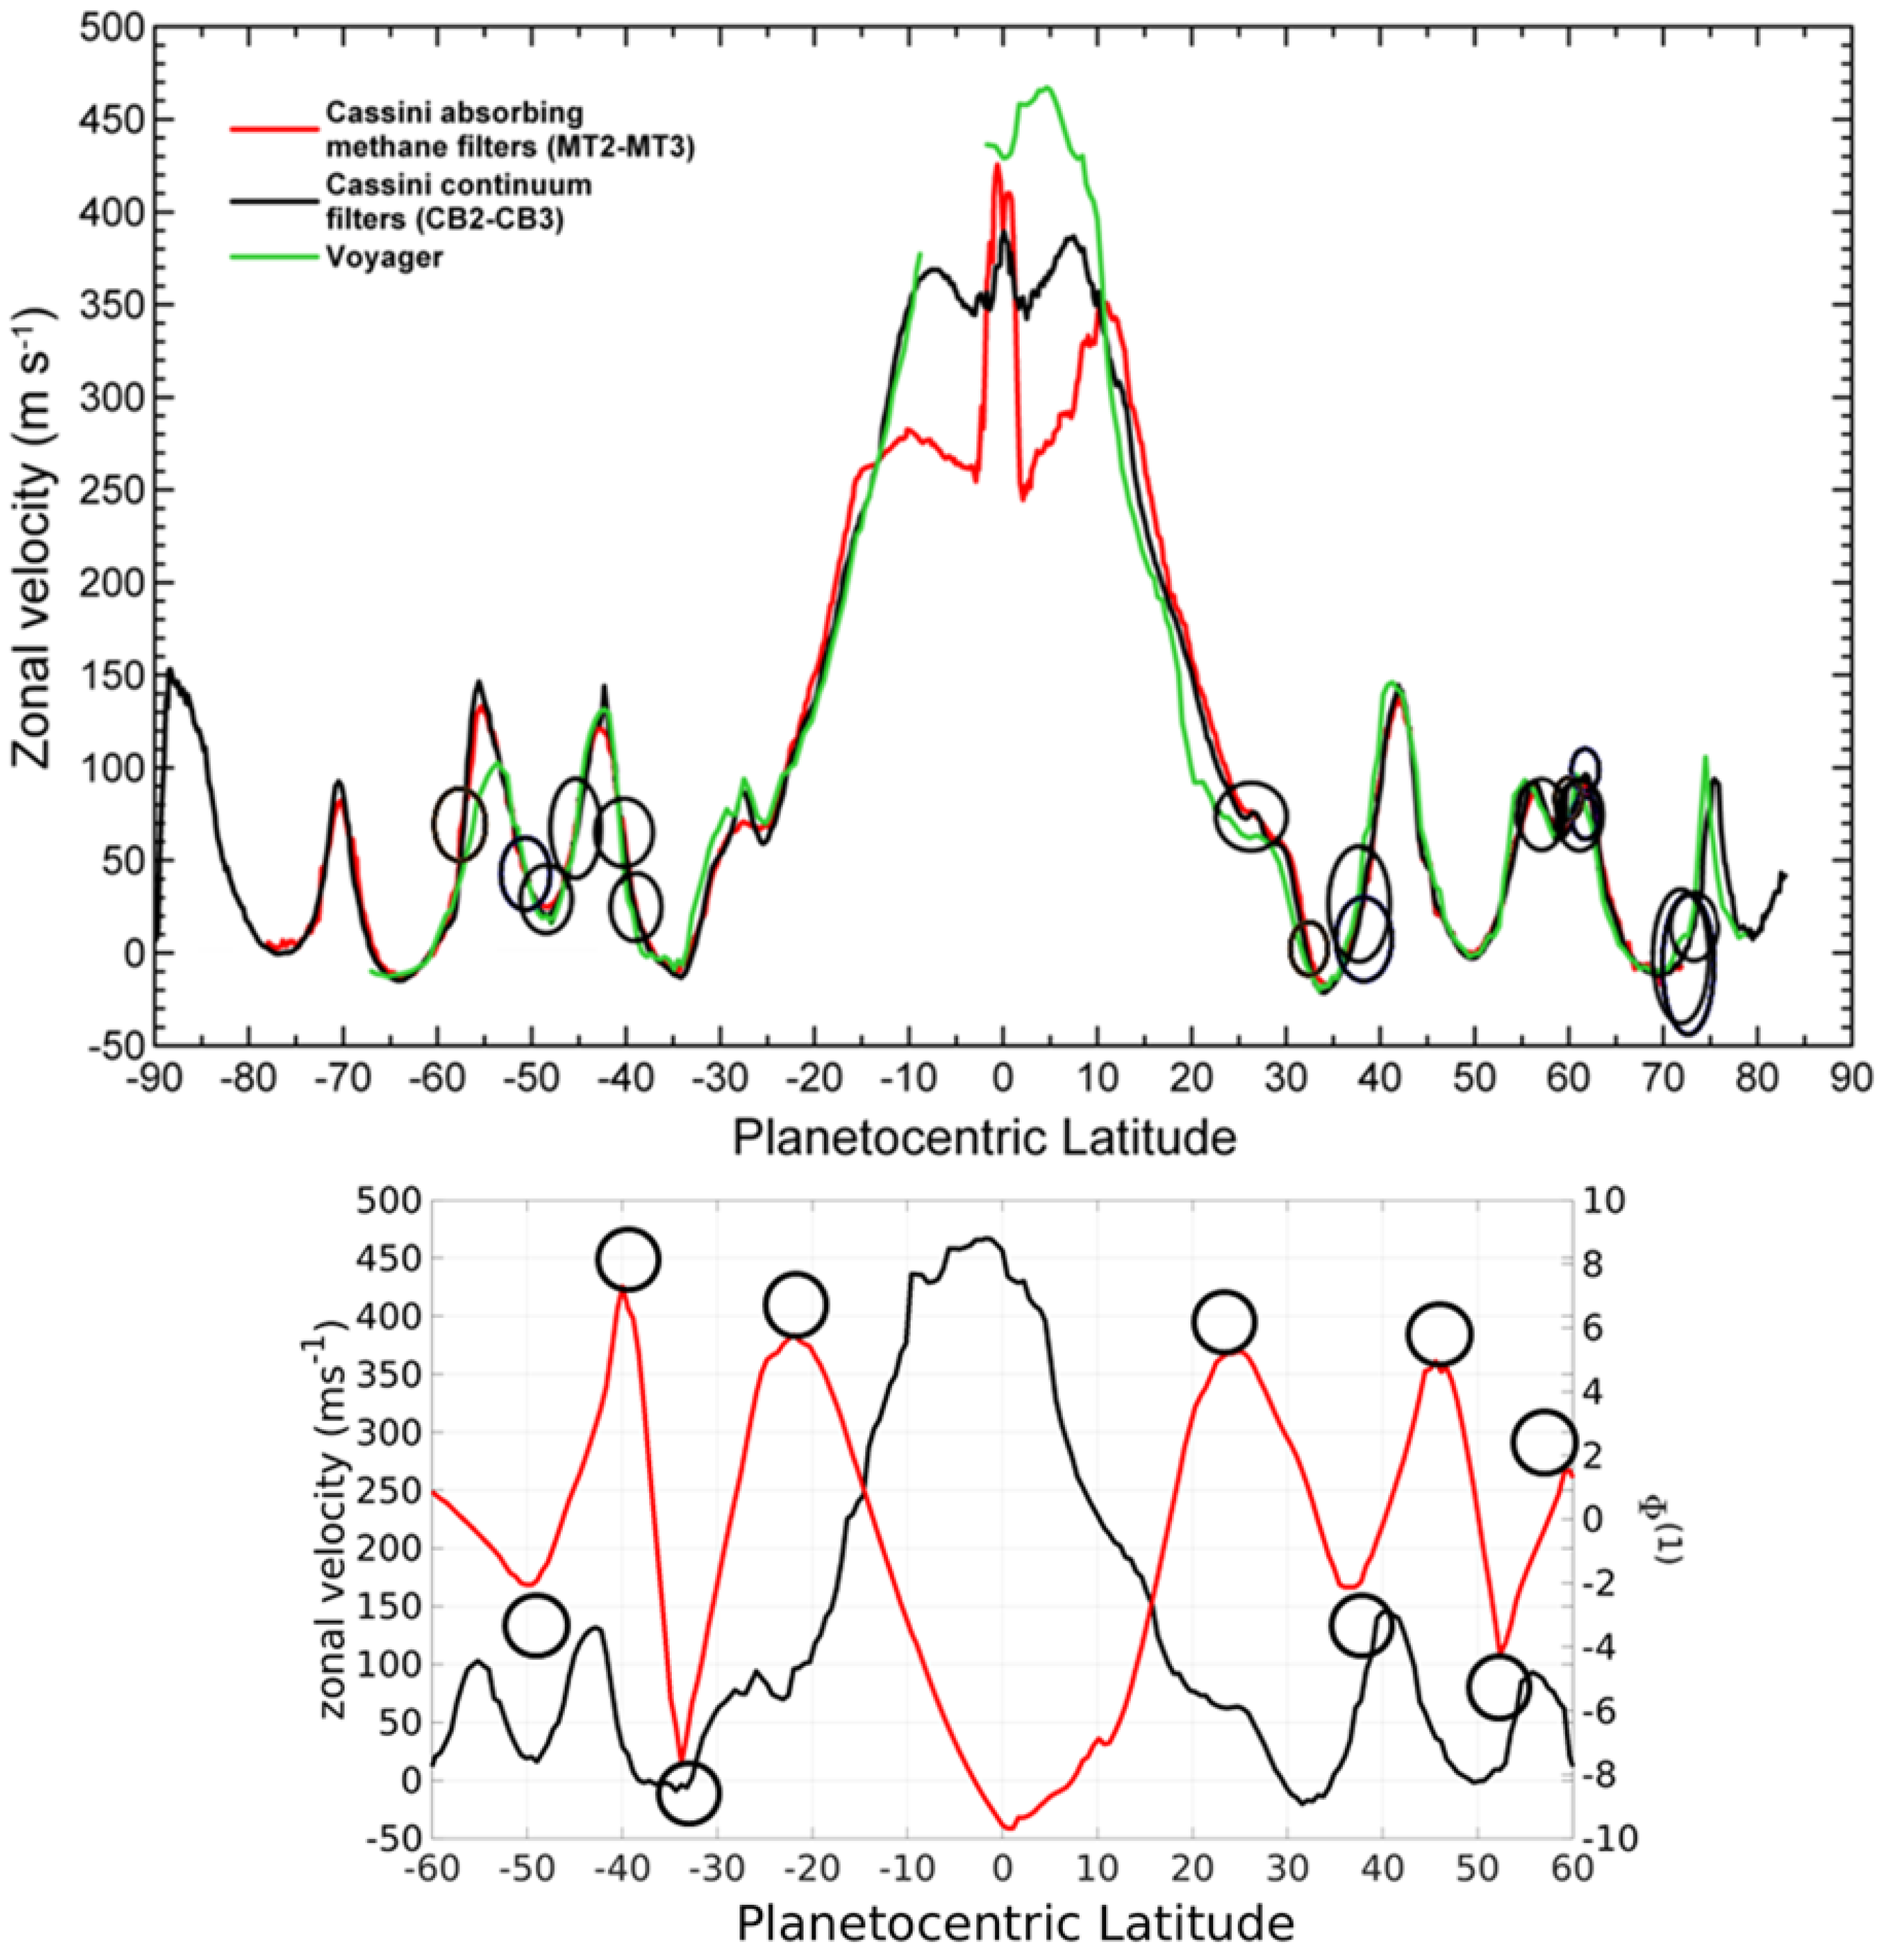
21], this issue was considered through the prism of the zonal asymmetry of the Rossby wave propagation. The asymmetry prompts a sharp difference between the eastward and westward jets. The eastward jets are stable and sharp, while the westward ones are unstable and blunt. For Jupiter and Saturn, this asymmetry is illuminated in Figs.
Figure 8 and
Figure 9 below and also in [
22]. Westward jets are prone to barotropic and baroclinic instabilities that lead to eddy shedding [
23,
24], mixing of the potential vorticity (PV), and flattening of its profile across the jets [
25]. The instabilities not only evoke eddies but also sustain them. The coexistence of eddies and jets can be viewed as eddy-jet symbiosis. The continuous two-way energy exchange between jets and eddies is facilitated by upscale and downscale turbulent cascades [
11,
26,
27,
28].
The dynamics of giant planets’ atmospheres is strongly affected by the eddy - jet flow interaction [
29,
30,
31,
32]. For instance, almost all westward jets on Jupiter and Saturn are barotropically unstable [
33,
34,
35] and shed cyclonic/anticyclonic eddies of various shapes and sizes.
Similar features are typical of the westward south-equatorial currents in all terrestrial oceans [
21], where under the action of a seasonal forcing, the currents periodically become unstable and radiate the Tropical Instability Waves (TIWs), e.g. [
36,
37,
38].
Do zonons and the SRWs [solitary Rossby-Haurwitz waves (SRHWs) on a sphere] represent different aspects of the same mathematical objects? This is an important non-trivial question as RHWs are spectral characteristics of a flow while zonons construe it in the physical space.
The purpose of the present study is to answer this question for flows in the zonostrophic regime and thereby extend the results in [
11]. The RHWs in a zonal flow on a surface of a rotating sphere will be scrutinized using the asymptotic multi-scale analysis and the assumption of weak nonlinearity. This technique yields the KdV equation in the spherical geometry, the hallmark of the solitary Rossby waves. For a given zonal velocity profile, the SRHWs phase speeds will be estimated by solving the generalized eigenvalue problem pertinent to the KdV equation. The RHWs velocities for barotropic flows can be computed analytically. The quantitative agreement between the two will be taken as an indication that the SRHWs and zonons are indeed two sides of the same coin.
An important question arises regarding the consistency of a mathematical framework describing forced and dissipative regime of zonostrophic turbulence harbouring the inverse energy cascade and unforced and non-dissipative regime represented by the KdV equation featuring no cascades. We note that the backbone of both regimes is a quasi-steady zonal velocity profile that, while remaining intact, may develop shear instabilities.
In the KdV framework, the origin and the maintenance of the profile are immaterial yet the shear instabilities provide a waveguide for solitary waves [
11]. In the zonostrophic regime, the profile is a product of a balance between the small-scale forcing and the large-scale energy withdrawal. As was noticed earlier, the profile may become barotropically unstable and instigate eddy shedding. As shown in [
39], this process is sustained by the Available Rotational Kinetic Energy, or ARKE, which is a rotational equivalent of the available potential energy in flows with stable stratification. This energy, as well as the rate of the inverse cascade, can be estimated by a process of PV monotonizing in the horizontal plane [
40] that is analogous to Thorpe’s vertical reshuffling of fluid particles in stably stratified flows [
41]. In [
42] it was shown that the method of PV monotonizing allows one to estimate the inverse cascade rate on Jupiter and Saturn using a limited amount of data and with no information about details of the forcing. The mean zonal velocity profile not only contains information on the rate of the inverse cascade, but, as was shown in [
21] and in analogy to the KdV framework, it sustains the energy and guides the propagation of coherent eddies. As will be shown in
Section 3, the profile also reveals potential locations of the SRHWs and their trains.
Establishing the duality between SRHWs and zonons has important practical implications. For instance, it was found in [
43] that the KdV equation describes a flow adjacent to the African easterly jet and helps to understand the evolution of a proto-vortex [
44] growing into tropical storm Debby over West Africa in August 2006. That study hints that zonons may help to explain the formation of tropical cyclones and shed light upon their dynamics and evolution, at least during the initial stages.
The most far reaching application of the theory of Rossby solitons goes back to [
45] where it was suggested that the SRWs may explain some facets of the dynamics of the Great Red Spot (GRS) and other features of the Jovian atmosphere. The application of the soliton solutions to the GRS was revisited in [
46] while an extensive review of possible manifestations of SRWs in various planetary and geophysical environments was given in [
47]. We shall see later that using the observed zonal velocity profiles, the KdV equation can quite accurately predict the latitudinal locations of the major eddies on both Jupiter and Saturn, including the GRS.
The investigation of the similarity between RHWs and zonons will proceed in the following fashion. The next section provides description of direct numerical simulations of the regime of zonostrophic turbulence which will be followed by the derivation of the KdV equation in a 2D flow on the surface of a rotating sphere. The following up section elaborates the existence and the features of the SRHWs.
Section 3 elucidates the connections between the zonons and the SRHWs,
Section 4 investigates the relationship between zonons and large eddies on Jupiter and Saturn, and
Section 5 is discussion and conclusions.
2. The Regime of Zonostrophic Turbulence in Barotropic Simulations in Spherical Coordinate System
The barotropization of planetary atmospheres, i.e., accumulation of a large portion of their kinetic energy in the barotropic mode, was discussed in [
6,
26]. Both the barotropization and flow two-dimensionalization escalate with the increasing rate of rotation. Major features of the emerging flow regime can be represented by a mathematical model emulating barotropic, externally forced, dissipative 2D turbulence on the surface of a rotating sphere [e.g. [
6]. In a certain range of parameters, the flow attains the regime of zonostrophic turbulence with its inherent zonal jets and conjoined zonons. The model is based upon the vorticity evolution equation,
where
is the absolute vorticity,
is the stream function;
;
is the hyperviscosity coefficient in which
p was set to 4;
is the Coriolis parameter;
is the angular velocity of sphere’s rotation;
is the latitude, and
is the PV. Since
f is time-independent, Equation (
1) could also be written in terms of the PV conservation. The Jacobian,
, defined as
, with
R and
being sphere’s radius and longitude, respectively, represents the nonlinear term in (
1).
The flow governed by (
1) features a small-scale forcing,
, acting upon scales of the order of
, and a large-scale energy withdrawal represented by a linear friction with the coefficient
. The energy injected into the system by forcing drives the inverse cascade at a rate
. This cascade is terminated on large scales, of the order of
, by the linear friction that dominates on scales for which
. Under the action of forcing and friction, the flow eventually attains a steady state.
The stream function is decomposed into a series of spherical harmonics,
,
They are eigenfunctions of the horizontal Laplacian operator,
, and depend on non-dimensional total and zonal indices,
n and
m, respectively.
Linearized Equation (
1) that excludes forcing and dissipation admits a RHW solution whose dispersion relation is [
6,
48,
49,
50]
yielding the phase speed
where
. Equation (
3) is consistent with a
-plane approximation format [
49,
51,
52,
53].
Equation (
1) with the decomposition (
2) was used for numerical investigation of various aspects of the nonlinear dynamics. Details of the numerical scheme and the simulations are given in [
54].
Employing a unit radius,
, eliminates the difference between the spherical harmonics’ indices and the wave numbers. The energy spectrum can be computed following [
55,
56],
where the modal spectrum,
, is the spectral energy density per mode
, and the angular brackets stand for ensemble or time average. The spectrum,
, can be decomposed into a sum of zonal and nonzonal, i.e., residual components,
, where the zonal component is
.
In the regime of zonostrophic turbulence, the zonal and residual spectra acquire universal distributions [
57] given by
While the zonal spectrum (
6a) develops a very steep slope, its residual counterpart (6b) closely follows the classical theory of isotropic 2D turbulence [
58]. The intersection of (
6a) and (6b) defines the transitional index,
. The strength of anisotropy is characterized by the zonostrophy index,
[
54,
59], where
is the Rhines index,
, and
U is the RMS zonal velocity. The threshold of the zonostrophic flow regime corresponds to
[
6,
26,
54,
59,
60].
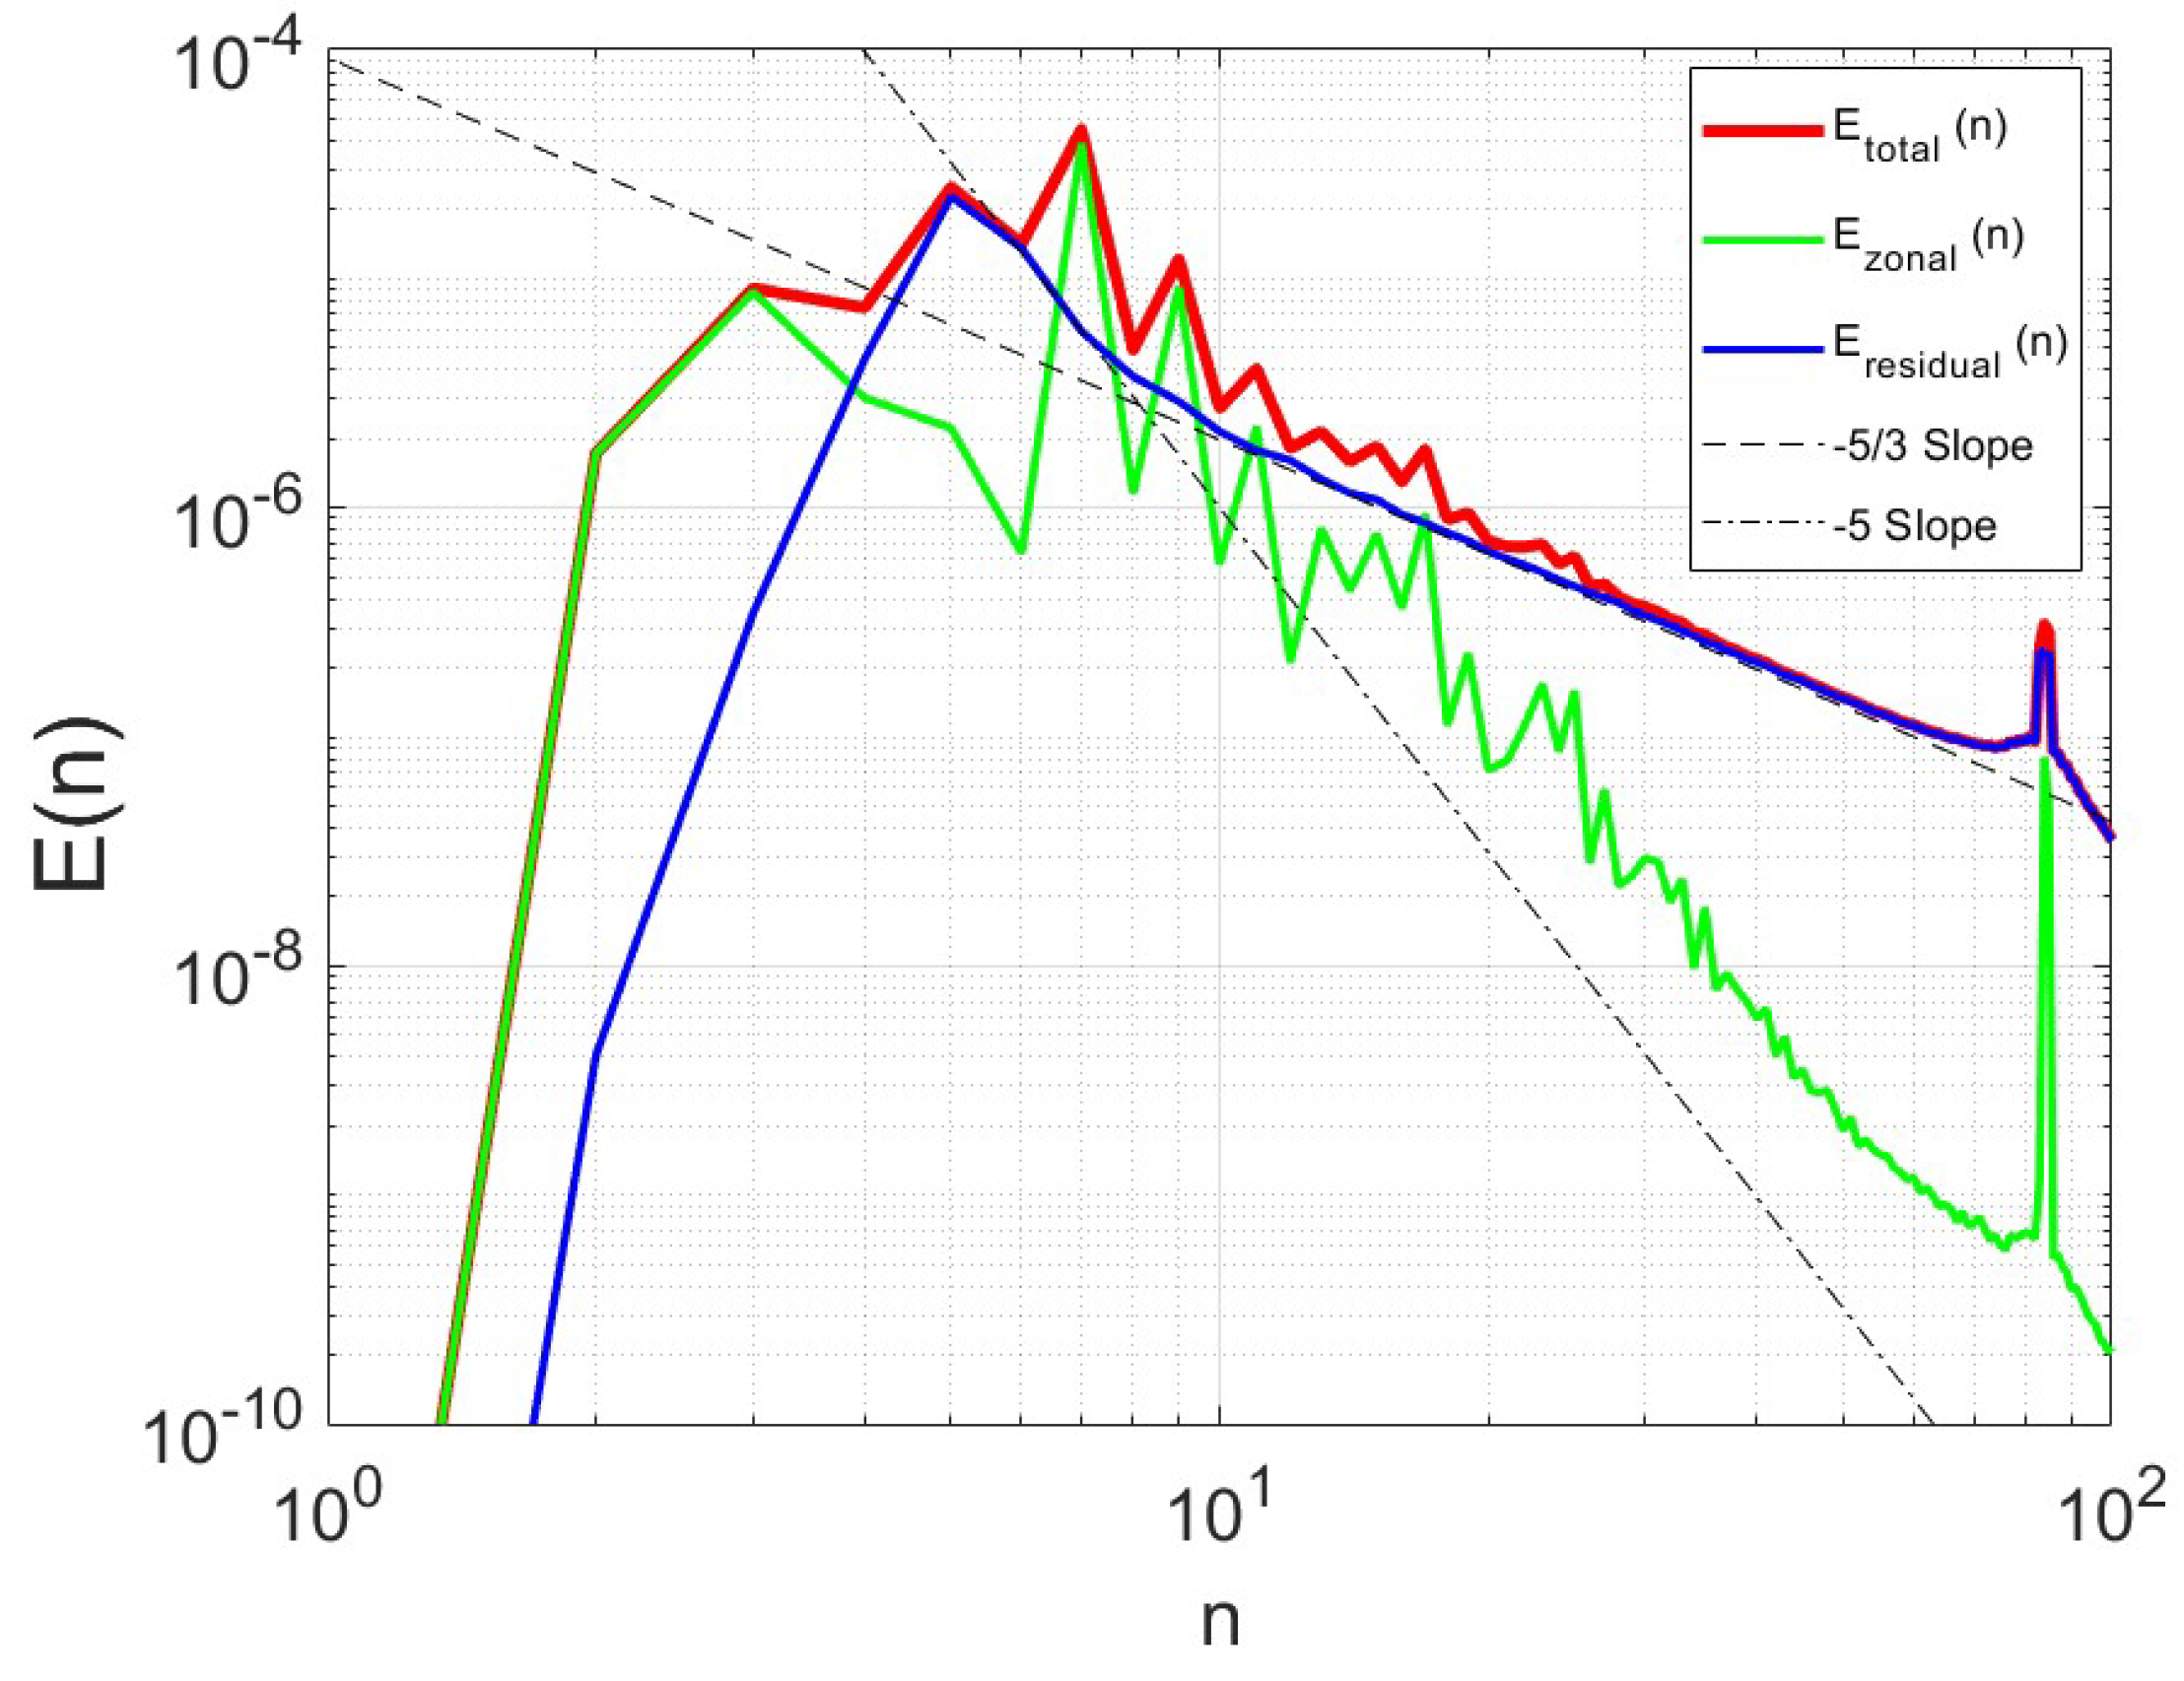
Figure 1 shows the zonal and residual kinetic energy spectra obtained in 2D simulation using Equation (
1). The parameters in this simulation were
,
, and
. The energy spectra in
Figure 1 are in good agreement with Equations (
6a) and (6b) and, thus, clearly demonstrate the signature of the zonostrophic regime. Both spectra attain their maxima at a scale close to
. On larger scales, friction becomes a dominant factor that causes the spectral amplitudes to rapidly decrease.
3. Rossby-Haurwitz Waves, Zonons, and Solitons
The zonal mode with the maximum energy, approximately quantified by
, dominates the zonal velocity profile while
divulges the corresponding number of alternating zonal jets [
61]. Some of the westward jets are barotropically unstable [
23,
30,
33,
62] and feature a strong shear. Energized by incipient instabilities, nonlinear interactions between the RHWs lead to formation of nondispersive, westward propagating wave packets. In the physical space, these packets appear as coherent eddies termed
zonons [
10]. Zonons appear as eddies or trains of eddies riding on the most energetic RHWs [
21,
63], their speed being
[
10,
11]. Later it will be shown that zonons’ dynamics is amenable to a description within the framework of the KdV equation, i.e., they possess properties of the solitary Rossby-Haurwitz waves (SRHWs). The congruity of RHWs, SRHWs and zonons will be demonstrated by exposing the consistency of their representations in the physical and Fourier spaces and closeness of their characteristic velocities. These issues will be addressed in the remainder of this section.
3.1. Flows on the Surface of a Rotating Sphere, the Mercator Projection, and the KdV Equation
As explained in the Introduction, the analysis of zonons is based upon consideration of a 2D flow on the surface of a rotating sphere absent external forcing, large-scale friction, and small-scale dissipation. The flow is governed by the barotropic vorticity equation (
1) modified to express the PV conservation [
52]:
The variables in (
7a), (7b) are nondimensionalized and marked by asterisks,
In the nondimensional form, Equations (
7a) and (7b) become
Further derivations are performed in the Mercator projection developed by the Flemish geographer and cartographer Gerardus Mercator in 1569. In this approach, the geographic map is projected from the globe to a tangential cylindrical surface touching the globe at the equator. The cylindrical surface is then unrolled into a planar map.
Another way of mapping a spherical surface onto a plane is by using a stereographic projection as done in [
1]. A detailed comparison between the Mercator and stereographic projections is elaborated in [
64]. Briefly, both techniques belong in a family of conformal mappings of a sphere onto a plane that only involve elementary calculus and trigonometry. In both cases, the equations governing 2D turbulence on a sphere become quite similar to the corresponding equations in the Cartesian coordinate system on a
-plane, e.g. [
43].
The nondimensional Mercator projection variables,
and
, are defined by
where
is the inverse Gudermannian, and
on a sphere with the radius R.
The Gudermannian function,
, maps a hyperbolic angle
onto a circular angle
(not to be confused with the stream function,
, and the latitude,
, above). Correspondingly, the inverse Gudermannian in (
10) maps
onto
. This function was introduced by Johann Heinrich Lambert circa 1760 and later named after Christoph Gudermann who derived the relationship between circular and hyperbolic functions in 1830 [
65]. The Gudermannian is also called the hyperbolic amplitude as it describes the limiting case of the Jacobi elliptic amplitude. Both
and
are used in the definition of the stereographic projection.
Using the new variables and dropping the asterisks, Equations (
9a) and (9b) become
where
.
Motivated by zonons’ properties, we employ the asymptotic multiscale method that focuses upon large-scale, long-time solutions of Equations (
11a) and (11b) using a long spatial,
X, and a slow temporal,
T, scales,
Here,
is a free parameter representing the speed of a coherent structure, and
is a small parameter,
, measuring the ratio of the fast and slow time scales. Using these notations, Equations (
11a) and (11b) can be written in terms of
X,
y and
T, and the stream function is then expanded in a series in powers of
[
11],
Retaining a small
term in (
13),
can be written as a sum of the basic mean stream function,
, and a stream function of the coherent disturbance,
,
A 2D velocity field on a sphere can be represented by its poloidal (meridional;
) and toroidal (azimuthal, zonal;
) components,
Numerical simulations presented in [
26,
54,
59] indicate that the zonal flow is comprised of alternating zonal jets with the amplitude
, where the mean velocity is
, and so the zero-order stream function can be expressed via
From (
16) one infers that
depends on
only and can be computed by straightforward integration,
In the Mercator projection, the zonal flow is
,
, and
where
.
We drop the tilde over
y and seek a solution to
,
, using the method of separation of variables,
which yields a power-series representation of (
13) in the form
By rewriting Equations (
11a) and (11b) in the new variables,
X,
y,
T, substituting (
13), and equating the terms with the same powers of the small parameter
, we arrive at a system of coupled differential equations. In the leading order,
, a second-order ordinary differential equation for
is obtained,
Equations (
21a) and (21b) have non-trivial solutions for a discrete set of values
,
, and so they form a generalized eigenvalue problem. The solution of this problem will be discussed later.
Equation (
21a) underscores the usefulness of the Mercator projection as it is similar to Equation (
17) derived in [
11] in a planar geometry using a
-plane approximation in the vicinity of a latitude
. The differences appear, firstly, in the numerator, where the potential vorticity on a
-plane,
, is replaced by the meridional gradient of (21b) and, secondly, in the denominator, where
is replaced by
V. It is assumed that
in (
21a), i.e., that the normal modes are non-singular.
The stationary Equations (
21a) and (21b) along with Equation (
19) describe the variation of
in the latitudinal direction. The evolution of the amplitude,
, is determined by invoking the next-order approximation,
, that yields the following equations:
Equation (22b) shows that the effect of a longitudinal dispersion represented by the term and that of the nonlinearity, , appear only in the order .
After multiplying (
21a) by
and (
22a) by
, subtracting the second product from the first one, and integrating the result over
y in the interval
using the integration by parts while utilizing the boundary conditions
(vanishing velocity component in the direction
at the poles), one finds:
This equation implies that either
is infinite, or
satisfies the KdV equation,
where
This KdV equation is fully analogous to the one derived in the
-plane approximation [see e.g. [
11] if
is replaced by
,
is replaced by
V, and the metric coefficient,
, appears in the expression for
.
A well-known soliton solution of the KdV equation is
This solution describes a solitary wave with a characteristic width
that travels with a constant speed
, the latter being a free parameter that represents the speed in the moving frame
.
3.2. Solitary Rossby waves in spherical coordinates
Computing the perturbation stream function,
, in spherical coordinates starts with its factorization,
and follows up by evaluation of
and
using Equations (
21a), (21b), and (
26a) - (26c). These equations are cast in terms of the slow variables. Inverting (
12) restores them back to the unscaled coordinates
. Next, by inverting (
10), one restores the original spherical coordinates,
, and arrives at a boundary-value/eigenvalue problem for
,
Here,
is computed from a given zonal velocity profile,
, and the Neumann boundary conditions, denoted N.B.C., follow from the requirement that both mean and coherent parts of the zonal velocity vanish at the poles.
The boundary value problem (
28a) - (28c) possesses an infinite set of the eigenvalues,
,
. They define a set of the eigenfunctions,
,
. To simplify the notations, we shall use
and
instead of
and
while keeping in mind that the lower indexes are introduced for the bookkeeping and not to denote differentiation.
In a weakly-nonlinear approximation,
By multiplying (
26a)-(26c) by
, reverting the variables back to the unscaled coordinates
, and then to the original coordinates
using (
12) and (
10), one derives
where
is soliton’s characteristic width,
is the next order correction to
that will be neglected, and the coefficients
and
are defined by
The parameters
and
depend on
and, thus, on the zonal velocity profile,
. The other two parameters,
and
, can be varied in certain ranges such as to explore properties of the solution of the system (
30a)-(31c).
A solitary wave appears stationary in a coordinate system moving along with it with the velocity
. The solitary waves’ amplitudes, (
30a), attain their maxima along the lines for which
.
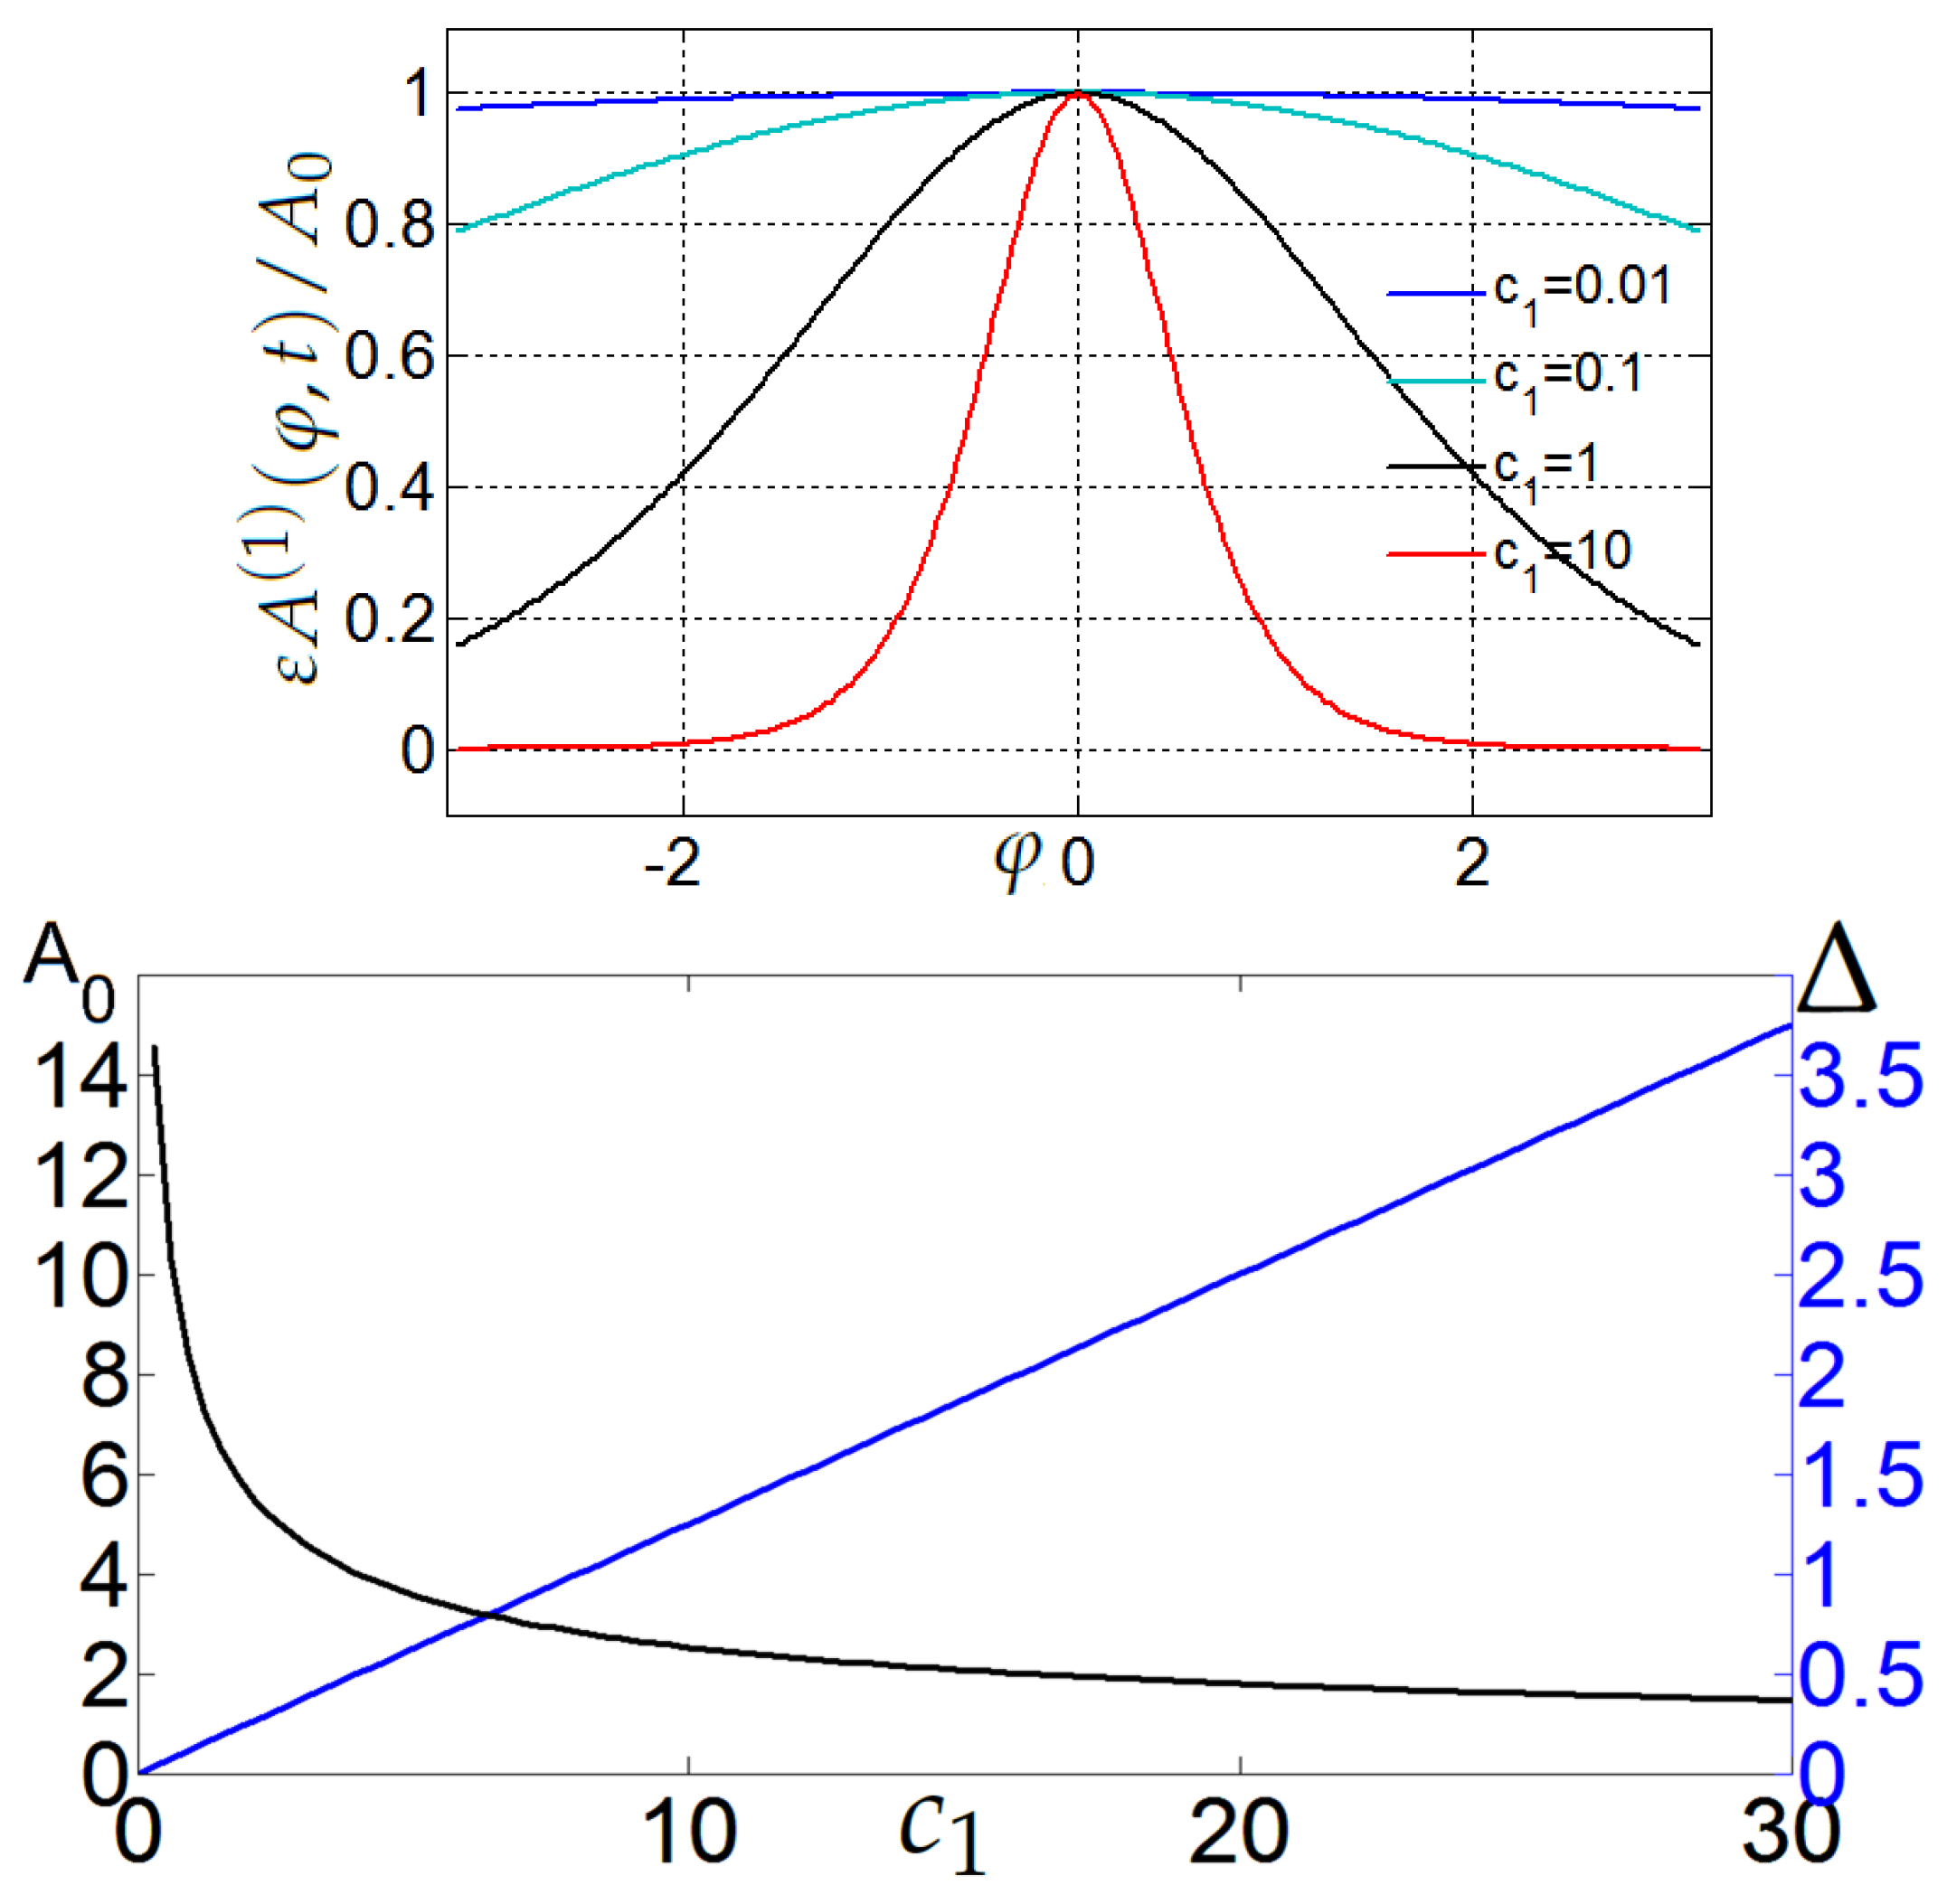
Figure 2 shows the normalized soliton solution,
, as given by (
30a), for different values of
with
. The wave propagates in the zonal direction along a latitude isoline (
= const) while preserving meridional symmetry about that isoline. For small
,
is nearly constant but with increasing
, it gradually evolves into a sharp pulse. The limit
brings on
, and the soliton morphs into evanescent wave. Increase in
raises wave’s amplitude,
, while its characteristic width,
, decreases. Since the analytical solutions obtained on a rotating sphere and on a
-plane are practically identical, see e.g. [
11] and [
43], both panels in
Figure 2 plotted here for a sphere are quite similar to Figs. 1 and 2 drawn in [
43] for a
-plane.
A system of equations (
30a)-(31c) can be used to diagnose whether or not a specific flow pattern gives rise to a solitary wave. The analysis is guided by the mean zonal velocity profile,
, that produces the pattern at hand, and the pattern’s propagation speed,
. The latitudinal structure of the SRHW is determined by the eigenfunction
given by (
28a). For
, one derives a system of equations describing a wave with an amplitude
traveling in the zonal direction with a constant speed
,
The initial system of equations can now be reduced to a single equation for the stream function
[
66] that yields an analytical expression for a SRHW,
In [
11] it was established that zonons are long-living coherent eddies that can survive in a flow even after the forcing and friction are turned off. In the vicinity of eddy’s center, the perturbation velocity inferred from
approaches zero in both forced and unforced flows, or, equivalently, both
and
attain their extrema. These requirements imply that
somewhere inside an eddy. Thus, the behaviors of
and its derivative divulge not only zonon’s presence but also its latitudinal position.
The next subsection demonstrates how these results can be utilized to identify zonons in the physical space in the regime of zonostrophic turbulence as presented in
Section 2 following [
10].
3.3. Mean Zonal Velocity, Eigenfunctions, and Eigenvalues
The zonal velocity profile,
, obtained in simulations described in
Section 2, is used to solve the eigenvalue problem (
28a) - (28c). A numerical solution of this problem, using Matlab, yields discrete sets of eigenvalues,
, and eigenfunctions,
,
. The normalized eigenfunctions,
,
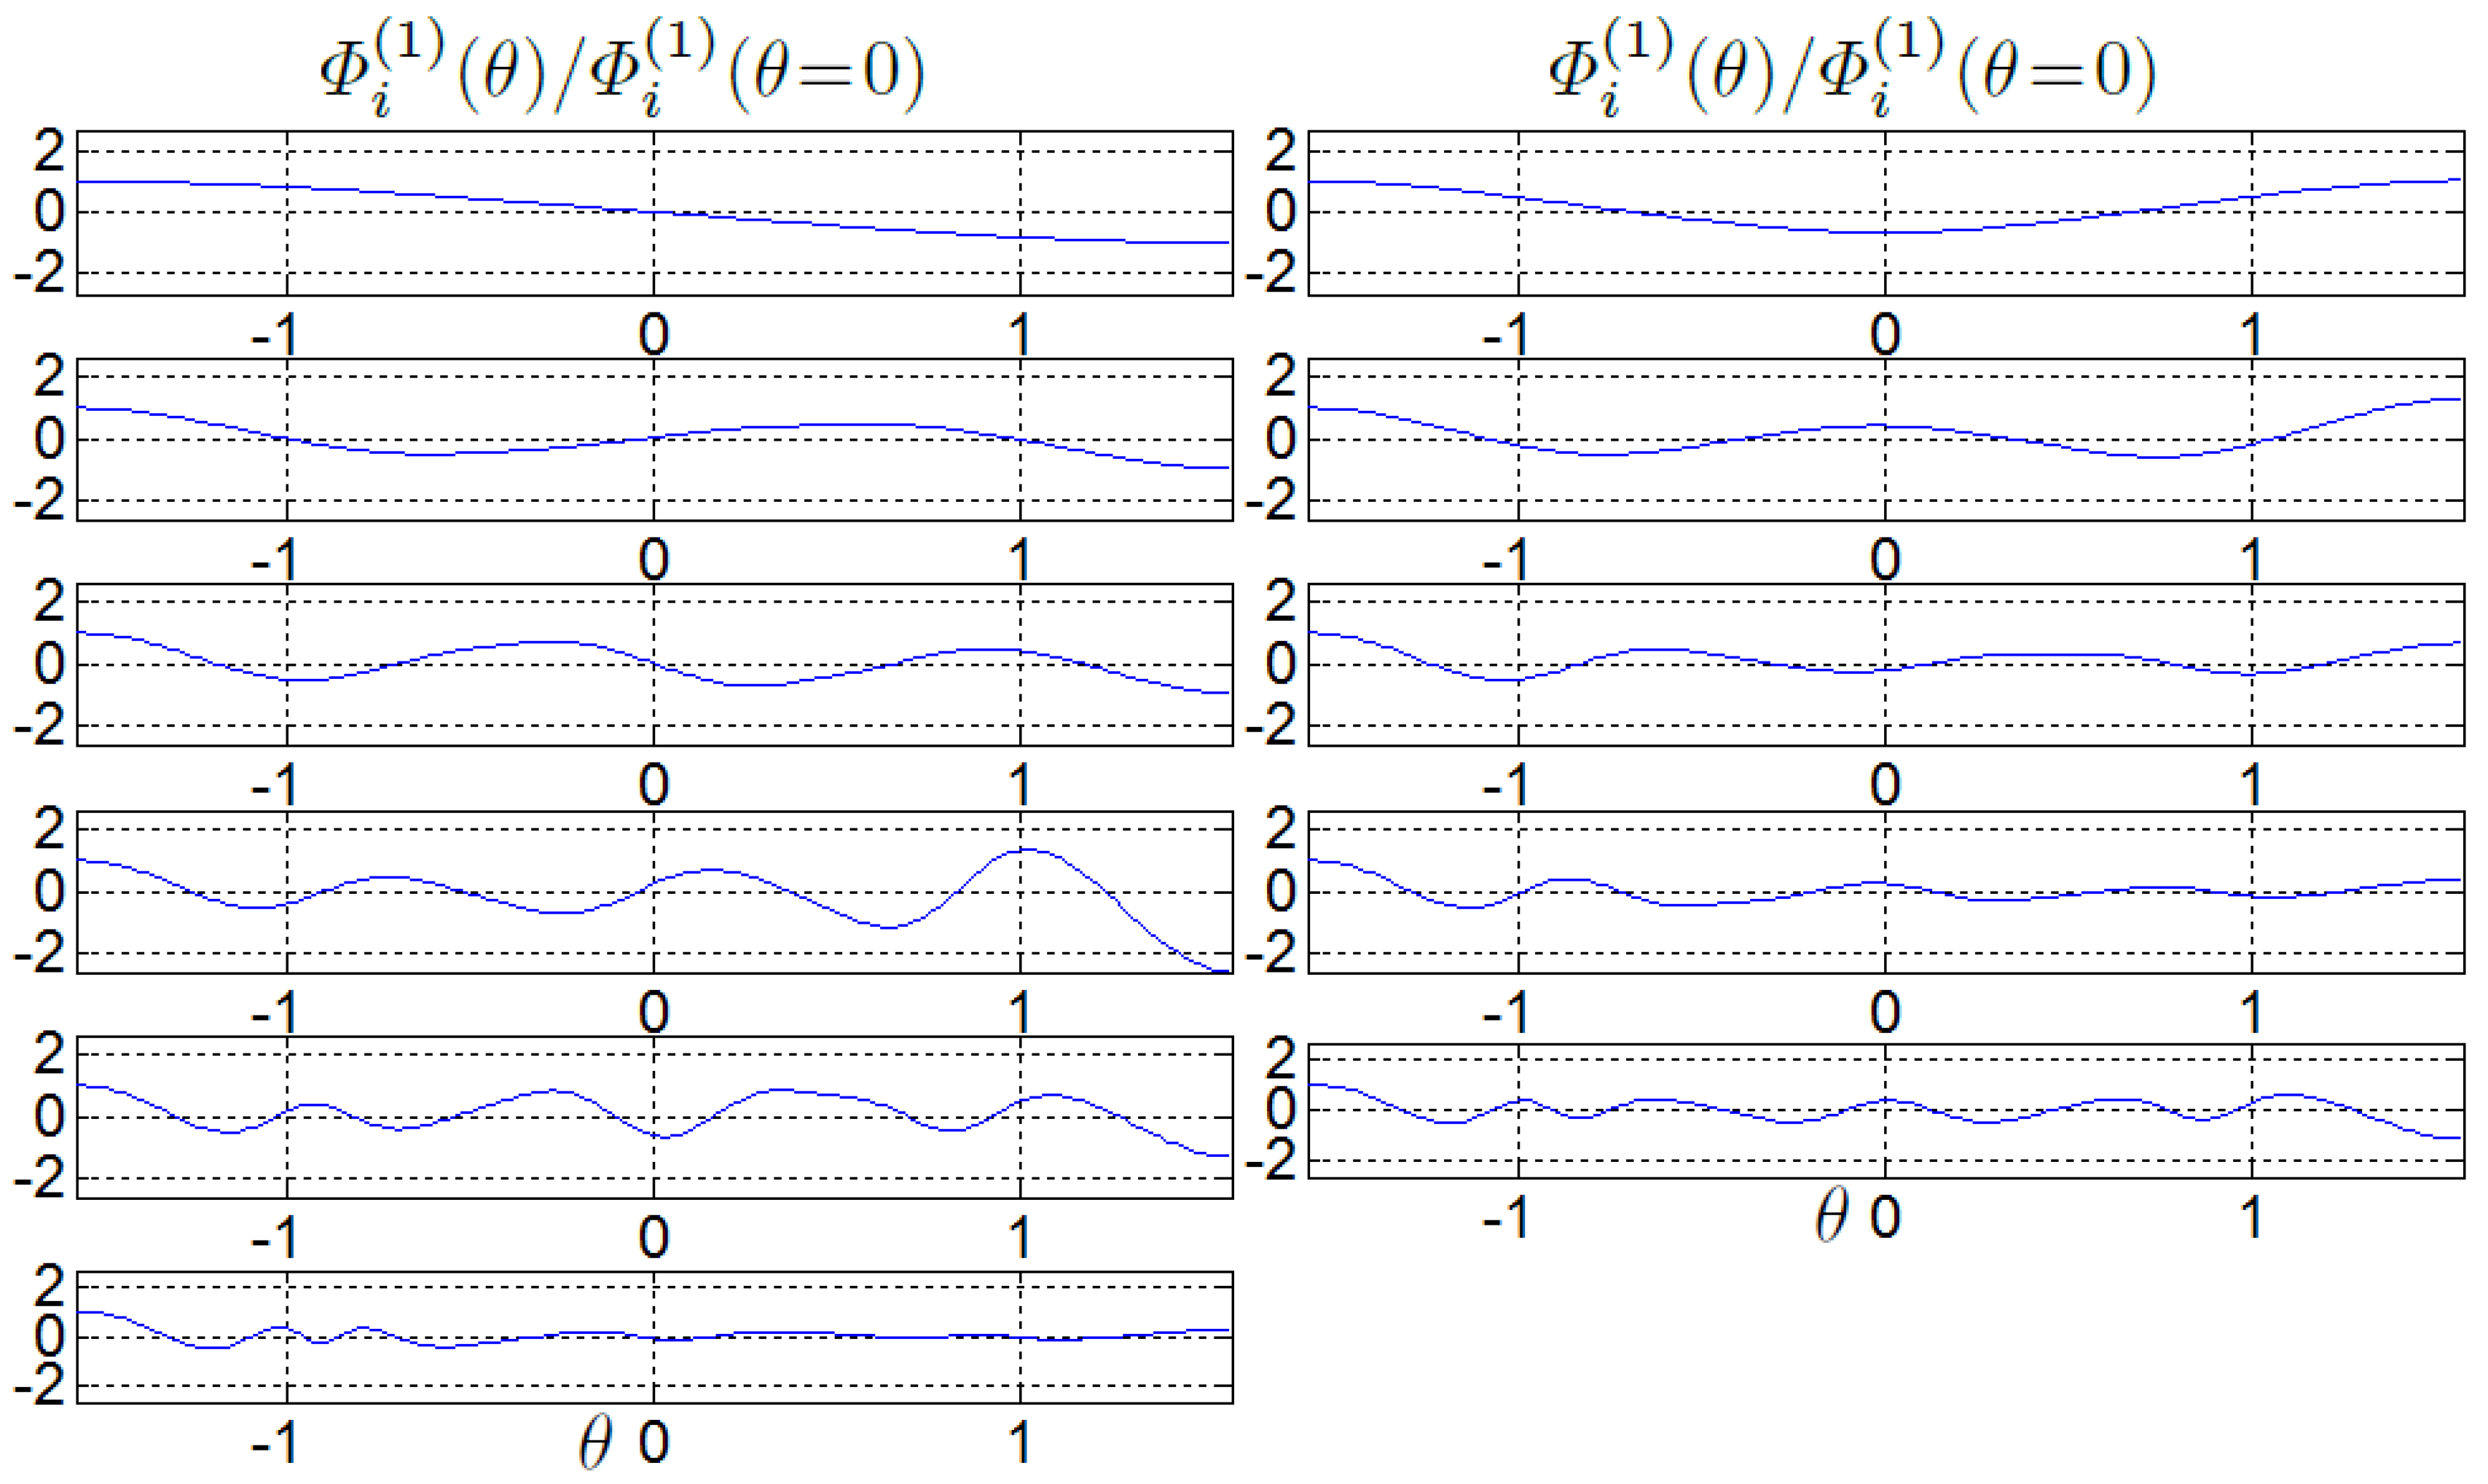
, are shown in
Figure 3.
Only
with
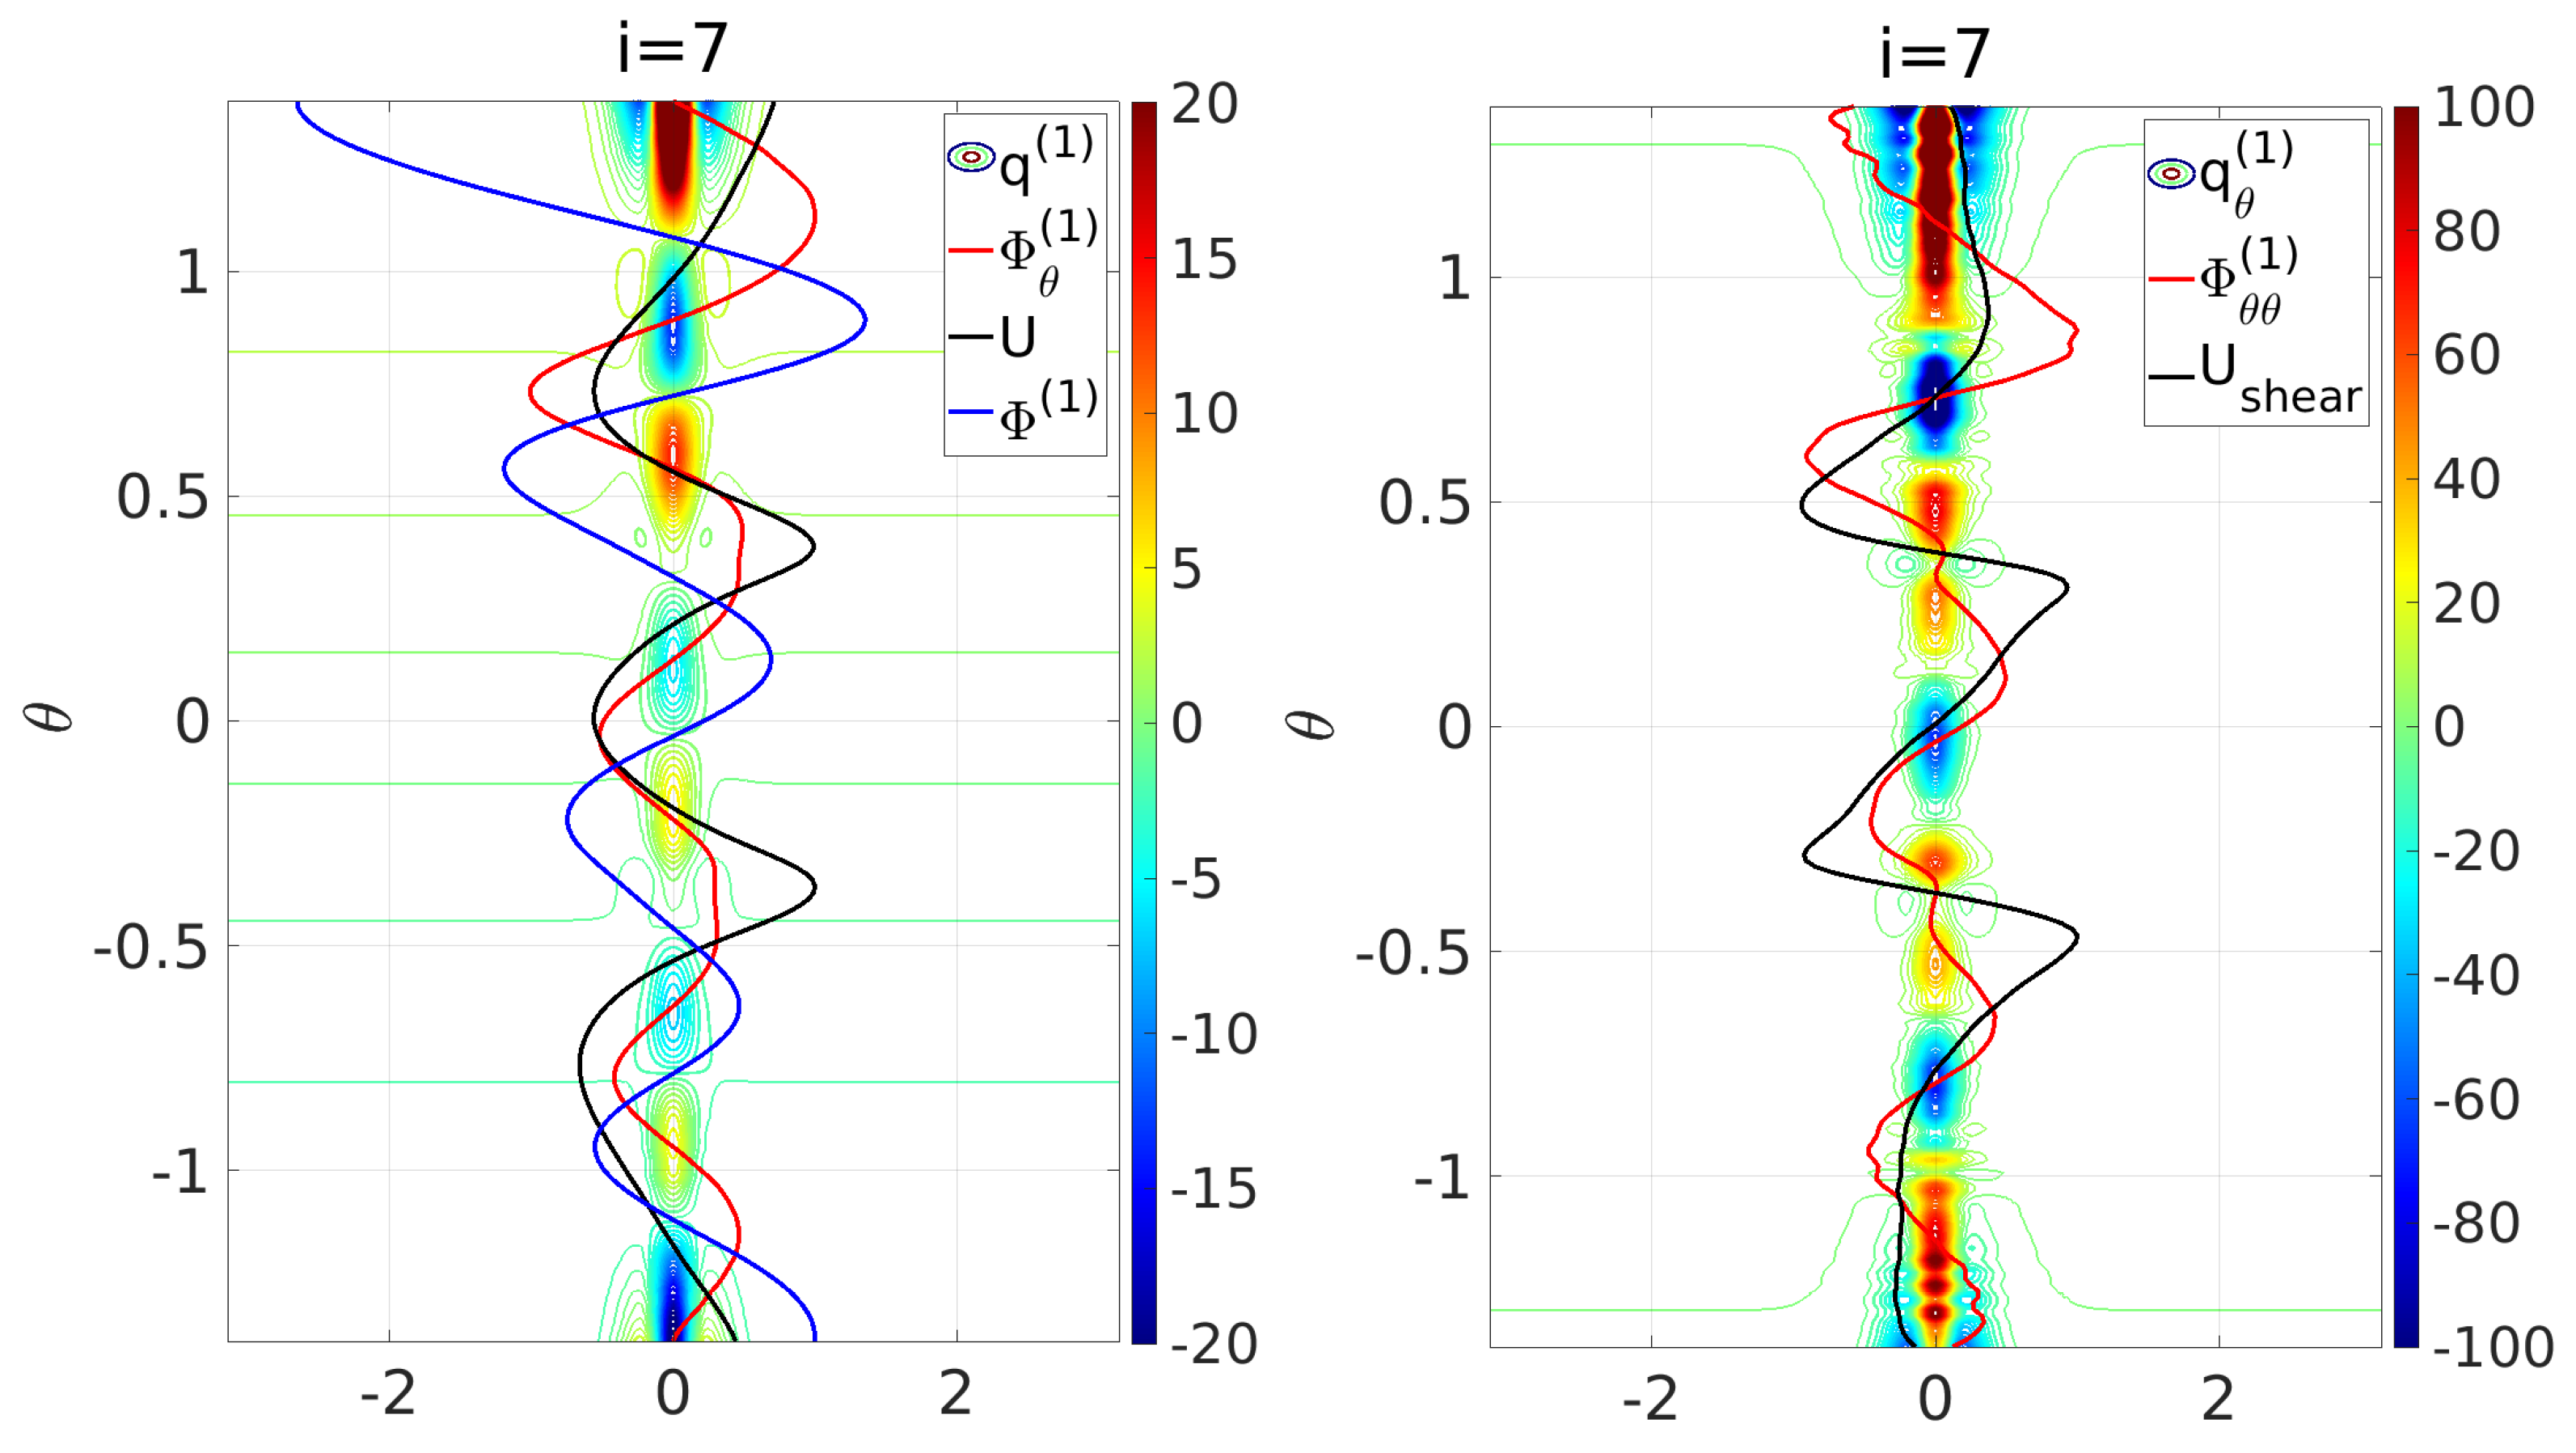
exhibits 6 extrema; those can be collocated with eddies emerging along both sides of the three westward jets shown in
Figure 4.
Figure 1 demonstrates that
is the most energetic zonal mode while the maximum energy RHW is at
. One infers that the closeness of the modes with most energy in either RHWs (residual spectrum) or zonal jets (zonal spectrum) may be a general feature of zonostrophic turbulence and so, in some situations where data is limited, one may be taken as a surrogate of the other.
Figure 4 also confirms that the extrema of
as well as the zeros of
coincide with the centers of the eddies as seen in the color maps of the potential vorticity perturbation,
.
In addition,
Figure 4 illuminates the fact that the vortices reside in the regions of maximum shear between zonal jets. These locations correspond to those at which the potential vorticity gradient crosses zero and which, according to the Charney-Stern stability criterion, are the epicenters of the barotropic instability.
Using a detailed analysis, such locations were associated with the hot spots of eddy formation in [
21] where the propagation speed of the traveling structures inferred from the stream function was compared with that derived from the centroids of different types of clusters construed via the Okubo–Weiss analysis. The results were compared with the theoretical phase speed of Rossby waves. The congruity of these two characteristics at the locations of maximum shear was quite remarkable. An important conclusion drawn from this analysis was that “the Rossby waves and eddies are inseparable as the former maintain the instability that sustains the latter. This symbiosis visually resembles the Rossby soliton.” Note that a similar idea about the coexistence of eddies and Rossby waves was discussed in [
63]. The hypothesis about the unity of Rossby waves and Rossby solitons, formulated in [
21], has not yet been substantiated within the framework of the KdV equation. The validation of this hypothesis within the KdV framework and its various applications are presented in the forthcoming sections.
3.4. Numerical Simulations: Zonons and Eddies
Table 1 compares a set of the first 11 eigenvalues,
,
, of the boundary value problem (
28a) - (28c) with a set of zonal phase speeds of the first 11 RHWs,
, given by (
4). The two sets are in a close agreement, both in their enumerations, as the phase speeds of the possible solitary waves,
, are close to
for
, and in the proximity of their numerical values. For the most energetic RHW,
, the difference between
and
is about 10%, and for the most energetic zonal mode,
, the difference is even smaller, only within 2%, blurring the contrast between waves and eddies. The eddy-wave duality was discussed in [
21,
44,
63]. Proximity of
and
for other wave numbers indicates that virtually all RHWs generate secondary, i.e., enslaved waves, see [
10], but their energies are much lower than those of the predominant zonons, and so they are less amenable to detection and observation. In addition, turbulence intensity raises with increasing
n causing turbulence-induced scrambling to overwhelm wave processes.
The eigenvalues obtained from the solution of the boundary value problem are used to evaluate the parameters , and needed to compute the coefficients of the KdV equations, and, ultimately, the amplitudes of the solitary waves.
3.5. Hovmöller Diagrams
The Hovmöller diagram technique highlights propagation of RHWs and SRHWs in the physical space. The diagram axes are usually chosen as longitude or latitude and time and the variable plotted is the velocity stream function relative to the zonal flow; its values are represented by a color table. The slopes of lines of the same color reveal the speed of propagating waves and structures, i.e., packets of RHWs and SRHWs, relative to the zonal flow.
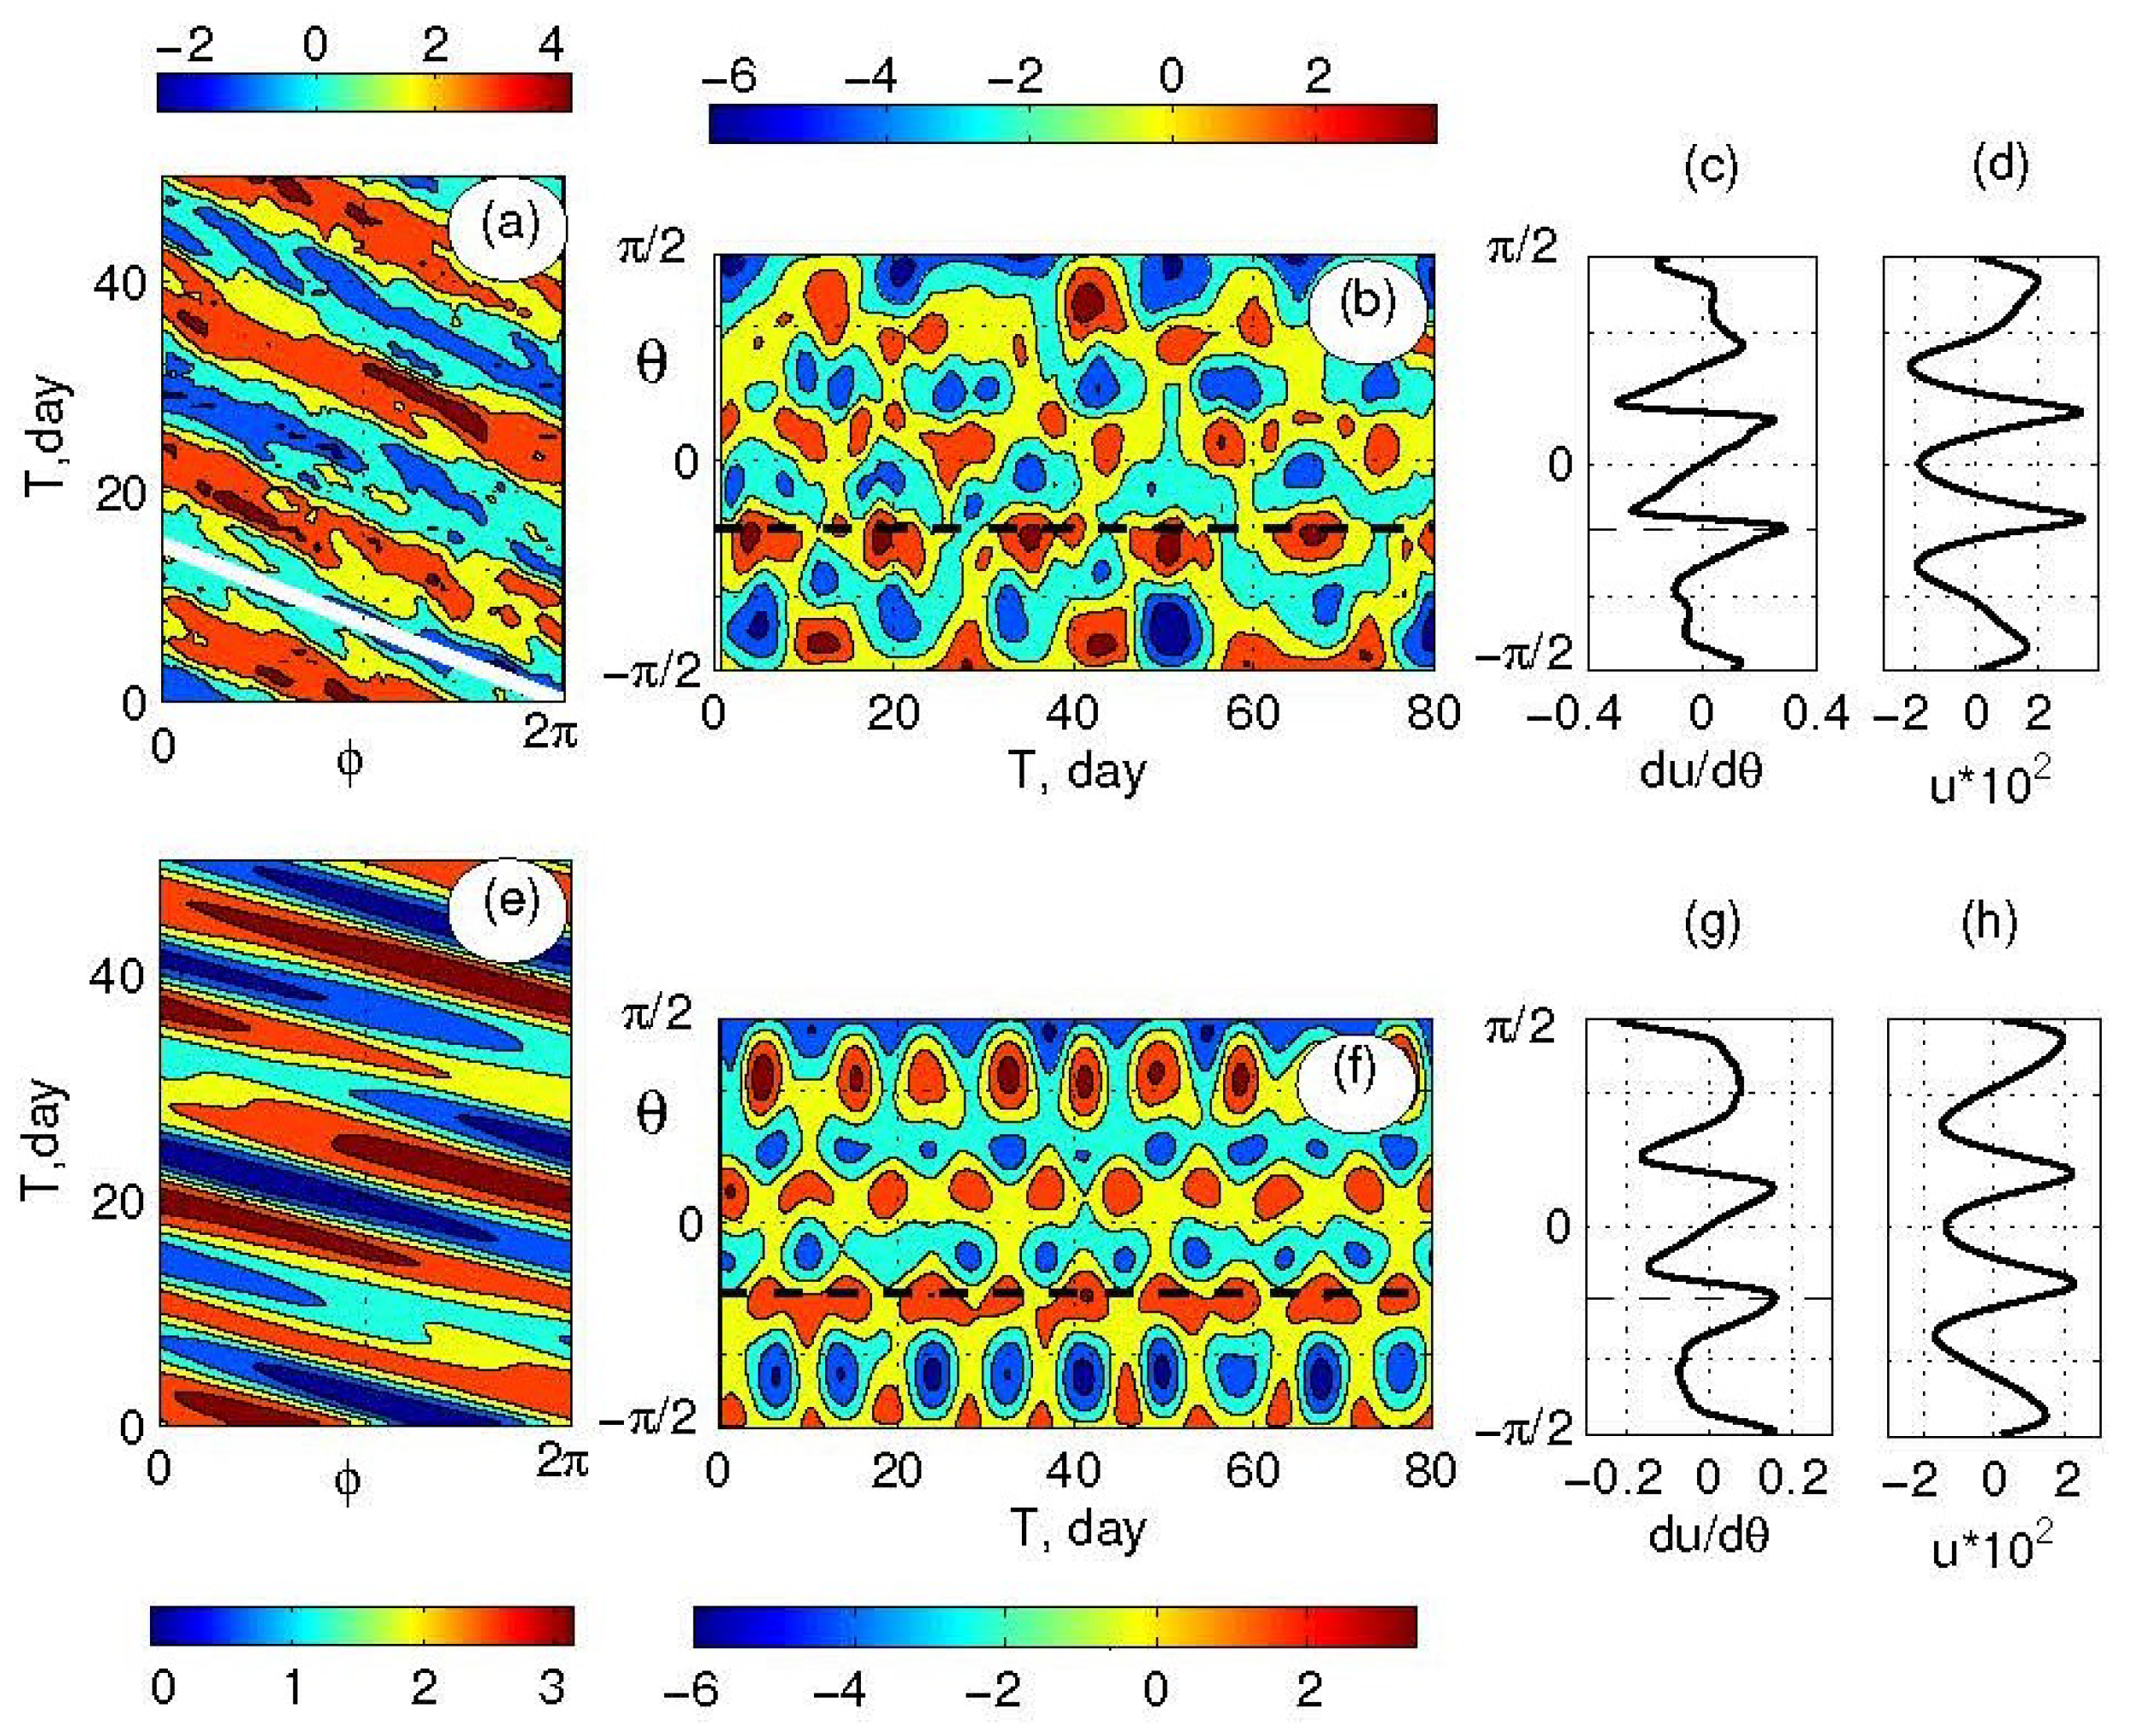
Figure 5 reproduces Hovmöller diagrams for zonostrophic regime (
) investigated in Sukoriansky et al. [
11].
Figure 5(a) reveals westward propagation of zonons that were identified by their spectral properties and confirms that their speed along the latitude of the maximum shear coincides with the phase speed of the most energetic RHW with
. The same result was obtained for other latitudes (not shown) thereby reiterating that the westward propagating eddies can indeed be identified with zonons moving with a constant speed relative to the zonal flow. Moreover,
Figure 5(b) underscores that zonons’ velocity in the meridional direction is zero.
Figure 5(b),(c) and (d) combined indicate that zonons reside in areas where the zonal velocity exhibits strong shear.
Figure 5(e-h) display similar results for the same flow 22000 days after the forcing and the large-scale drag were switched off. In this case, the energy of RHWs decreases while zonons preserve their energy and become the dominant feature of the flow.
In summary, zonons form long-living wave packets located between zonal jets. The shear exerted by opposing jets acts to tear the eddies apart while the nonlinearity opposes shear’s action and blocks eddies’ dispersion. As follows from the analysis employing the Hovmöller diagrams, whether the eddies are sustained by the shear instability or not, the summary action of two adjacent opposing jets results in their becoming a waveguide for the coherent wave packets. Such interaction between shear, nonlinearity, and wave propagation is typical of solitary waves, see e.g. [
16], that include zonons.
5. Discussion and Conclusions
This study outlines the connection between zonons and solitary Rossby-Haurwitz waves in the regime of zonostrophic turbulence. Zonons are ’slave’ waves excited by RHWs in other wave modes via non-linear interactions. One can also view zonons as a product of RHWs ringing in other wave modes. Zonons’ dispersion relation is different from that of the RHWs. They form long-lived, non-dispersive wave packets located between zonal jets that guide them around planets while replenishing their energy via shear instabilities. In the physical space, zonons form westward propagating coherent eddies whose zonal velocity is equal to the phase speed of the most energetic RHW.
Despite the dispersive action of the shear, the wave packets are being coagulated by the nonlinearity and preserve their identity. The balance between the effects of the shear and nonlinearity can be quantified within the KdV equation. The constructive interference between the effects of the shear and nonlinearity is typical of solitary waves [see e.g., [
16] and so one infers that zonons are solitary Rossby-Haurwitz waves.
In the preceding study of zonons in [
11], the solitary wave framework was established using the KdV equation in the Cartesian coordinate system. This framework was not validated against data, however. The present study goes farther and develops the KdV foundation for zonons in a spherical coordinate system. The derivations are performed in the Mercator projection that allows for smooth two-way transitions of the governing equations between spectral and physical space representations. This approach leads to a boundary value problem whose nontrivial solutions yield eigenvalues and eigenfunctions. The eigenvalues correspond to zonal velocities of zonons, while the respective eigenfunctions disclose their latitudinal locations.
This framework was tested and validated against the results of direct numerical simulations of two-dimensional turbulence on the surface of a rotating sphere. The main outcome of this initial study was that large coherent eddies emerging in the regime of zonostrophic turbulence, or zonons, can indeed be identified with the solitary Rossby-Haurwitz waves bound to westward zonal jets and propagating inside the rails formed by the opposing jets.
The KdV framework was then applied to probe coherent vortices on Jupiter and Saturn, the two giant planets that boast zonostrophic regime. These comparisons involved observed mean zonal winds and available kinetic energy spectra. Guided by the results deduced from direct numerical simulations, it was established that the zonal velocities of large coherent eddies on the planets are well represented by the eigenvalues of the boundary value problem and their latitudinal locations are disclosed by the extrema of the corresponding eigenfunctions.
One of the hallmarks of this theory is that much information on the planetary eddies can be deduced from the zonal velocity profile which is much easier to establish than other characteristics such as, for instance, the residual energy spectrum. Another hallmark of the theory is in the offering an analytical framework providing latitudinal locations of nearly all major eddies on a rotating planet given that its atmosphere obeys the zonostrophic regime. This framework may apply not only to our neighboring giant planets but also some of their satellites as the simulations presented in [
94] point to the possibility that the zonostrophic regime may dominate the circulation of subsurface oceans of Ganymede, Europa, Enceladus, and Titan. The KdV frame may apply to eddies on some exoplanets as well. The finding that zonons may include the Great Red Spot elevates the possibility that they may also be relevant to great spots on other planets [
95,
96] provided that those obey the zonostrophic regime.
These results may also be applicable in the terrestrial atmospheric environments where the zonostrophic regime is marginal. In
Section 1, for example, it was noted that the solitary Rossby waves may help to understand genesis and early evolution of the proto-vortices developing into tropical storms. Moreover, zonons may be helpful in clarifying the role of eddies and spirals in oceanic circulation [
97,
98,
99,
100] given that the oceanic turbulence is marginally zonostrophic [
6].
Figure 1.
The zonal, (green line), residual, (blue line), and total, (red line) kinetic energy spectra obtained in numerical simulations of 2D turbulence on the surface of a rotating sphere in the zonostrophic regime ().
Figure 1.
The zonal, (green line), residual, (blue line), and total, (red line) kinetic energy spectra obtained in numerical simulations of 2D turbulence on the surface of a rotating sphere in the zonostrophic regime ().
Figure 2.
Top panel: normalized soliton solution in the propagation direction for different values of at . The values of other parameters are: , , and . Bottom panel: soliton’s amplitude, , (solid black line) and width, , (solid blue line) as functions of .
Figure 2.
Top panel: normalized soliton solution in the propagation direction for different values of at . The values of other parameters are: , , and . Bottom panel: soliton’s amplitude, , (solid black line) and width, , (solid blue line) as functions of .
Figure 3.
The first 11 normalized eigenfunctions, , shown from left to right and from top to bottom, from top left (i = 1) to bottom left (i = 11) corners.
Figure 3.
The first 11 normalized eigenfunctions, , shown from left to right and from top to bottom, from top left (i = 1) to bottom left (i = 11) corners.
Figure 4.
Left panel shows normalized perturbation velocity eigenfunction, , along with its gradient, , and normalized mean zonal velocity profile, , vis-á-vis contours of the potential vorticity perturbation, . Right panel shows normalized second derivative of the perturbation velocity eigenfunction, , and the normalized shear of the mean zonal velocity, , vis-á-vis contours of the perturbation potential vorticity gradient, . For both panels, .
Figure 5.
Latitudinal (a,e) and longitudinal (b,f) Hovmöller diagrams for a flow in zonostrophic regime (
) analyzed in Sukoriansky et al. [
11]. The top and bottom rows represent forced and unforced flows, respectively. The white line on plate (a) corresponds to the phase speed of RHW with
. Plates (d) and (h) depict zonal velocity profiles while (c) and (g) show meridional shear of respective zonal velocities. The horizontal dashed lines on plates (b), (c) and (f), (g) correspond to the latitude of maximum shear that encompasses energetic zonons. After the forcing is switched off, the energy of velocity fluctuations decreases yet zonons retain their energy levels and integrity and become more apparent than RHWs.
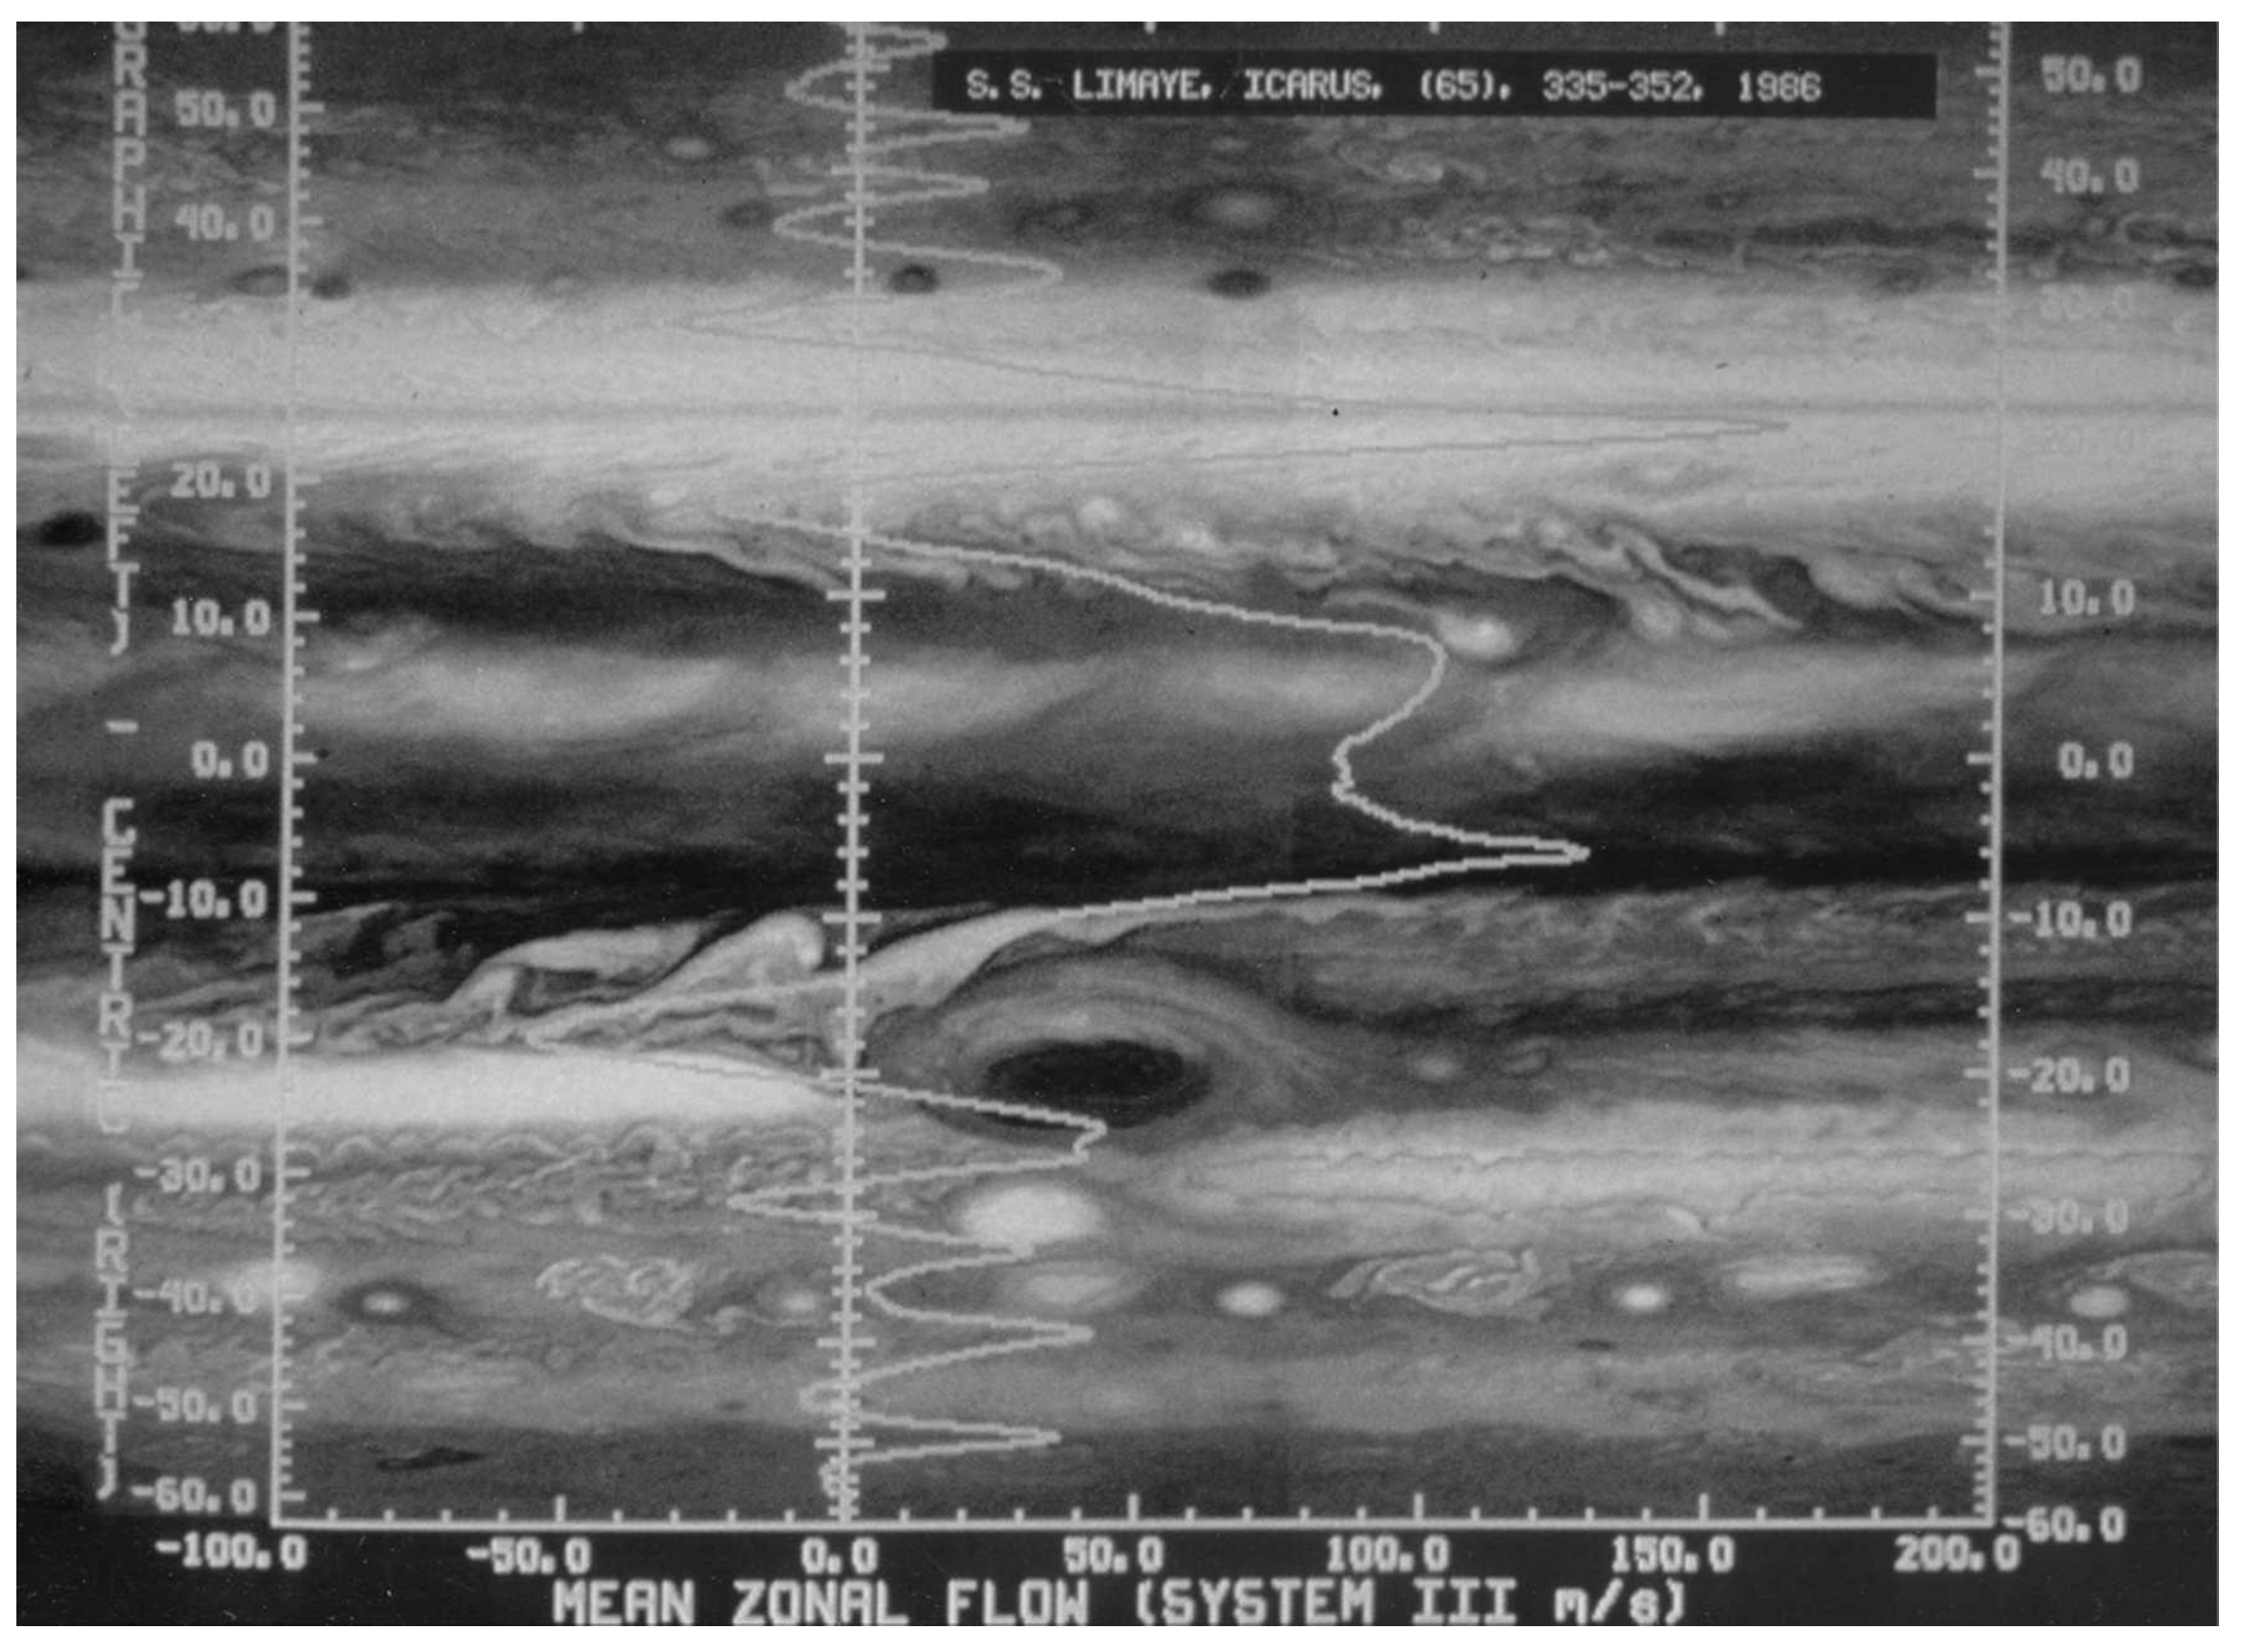
Figure 6.
Voyager mosaic used in [
23] and [
24]. The mean zonal velocity profile,
, is represented by the white line. Rows of cyclones and anticyclones ride on the westward jets with the cyclones or anticyclones attached, respectively, to the equatorial or poleward sides. While the anticyclones are compact and bright, the cyclones appear as diffused filaments.
Figure 7.
Jupiter’s zonal (line 1) and residual (line 2) spectra estimated from the Cassini data [
26]. The thick and thin dashed lines represent the zonostrophic
and Kolmogorov
spectra, Equations (
6a) and (6b), respectively. At
, both spectra exhibit peaks whose coincidence was discussed earlier. The residual energy peak discloses the most energetic Rossby wave that generates zonons. These zonons may be identifiable with the observed eddies shown in
Figure 8. The zonostrophy index for Jupiter is
such that its atmospheric circulation is in the zonostrophic regime [
26].
Table 1.
The zonal phase speeds of the RHWs vis-à-vis the zonal phase speeds of the SRHWs on a rotating sphere. The highlighted index corresponds to the eigenfunction that divulges latitudinal locations of zonons.
Table 1.
The zonal phase speeds of the RHWs vis-à-vis the zonal phase speeds of the SRHWs on a rotating sphere. The highlighted index corresponds to the eigenfunction that divulges latitudinal locations of zonons.
| |
Rotating sphere |
|
i or n
|
|
|
Relative |
| |
|
|
difference [%] |
| 1 |
|
|
|
| 2 |
|
|
|
| 3 |
|
|
|
| 4 |
|
|
|
| 5 |
|
|
11 |
| 6 |
|
|
|
|
7 |
|
|
2 |
| 8 |
|
|
|
| 9 |
|
|
0 |
| 10 |
|
|
0 |
| 11 |
|
|
|
Table 2.
Zonal phase speeds of the RHWs vis-à-vis zonal phase speeds of the SRWs on Jupiter.
Table 2.
Zonal phase speeds of the RHWs vis-à-vis zonal phase speeds of the SRWs on Jupiter.
| |
Jupiter |
|
i or n
|
|
|
Relative |
| |
|
|
difference [%] |
| 17 |
|
|
|
| 18 |
|
|
|
| 19 |
|
|
|
| 20 |
|
|
|
| 21 |
|
|
|
| 22 |
|
|
|
|
23 |
|
|
|
| 24 |
|
|
|
| 25 |
|
|
|
Table 3.
Zonal phase speeds of the RHWs vis-à-vis zonal phase speeds of the SRWs on Saturn in Systems III and IIIw.
Table 3.
Zonal phase speeds of the RHWs vis-à-vis zonal phase speeds of the SRWs on Saturn in Systems III and IIIw.
| |
System III |
System IIIw |
|
i or n
|
|
|
Relative |
|
|
Relative |
| |
|
|
difference [%] |
|
|
difference [%] |
| 9 |
|
|
|
|
|
|
| 10 |
|
|
|
|
|
|
| 11 |
|
|
|
|
|
|
| 12 |
|
|
|
|
|
|
| 13 |
|
|
|
|
|
|
| 14 |
|
|
|
|
|
|
|
15 |
|
|
|
|
|
|
| 16 |
|
|
|
|
|
|
| 17 |
|
|
|
|
|
|
| 18 |
|
|
|
|
|
|
| 19 |
|
|
|
|
|
|
