1. Introduction
Healthy soil is a fundamental requirement for continued existence of most species in the Tree of Life on Earth. Soil supports >99% of species diversity, if vascular plants are included it may be argued that soils support >99% biomass (and then >90% of global Net Primary Productivity too). Soil filters & stores nearly all freshwater stocks and provides >99% of human food as well as many of our essential medicines. Thus, an important metric must be scope and snapshot status of living (and dormant) soil biota. A recent review by Anthony et al. (2023) claimed “
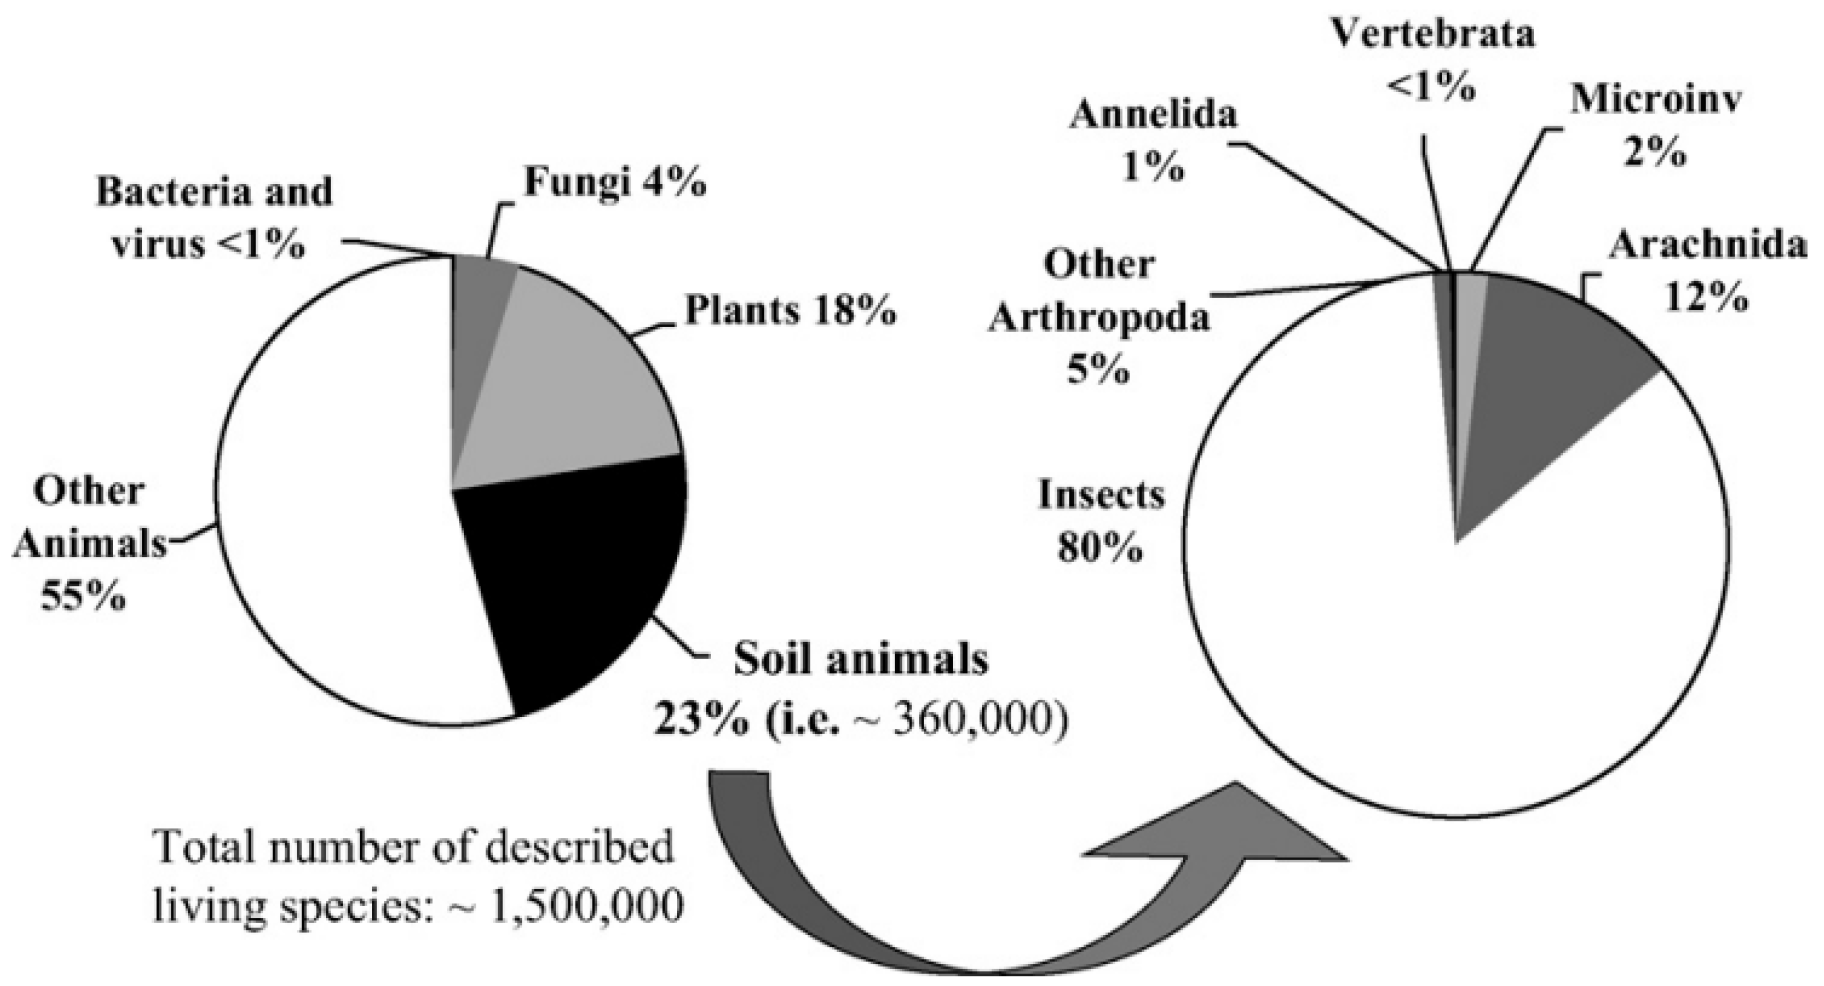
two times greater soil biodiversity than previous estimates”, seemingly because Decaëns et al. (2004) reported about 23% soil animals in the total number of described living species (
Figure 1). Both assertions are challenged for several reasons, not least >99.9% soil biota in Blakemore (2018b, 2022, 2023).
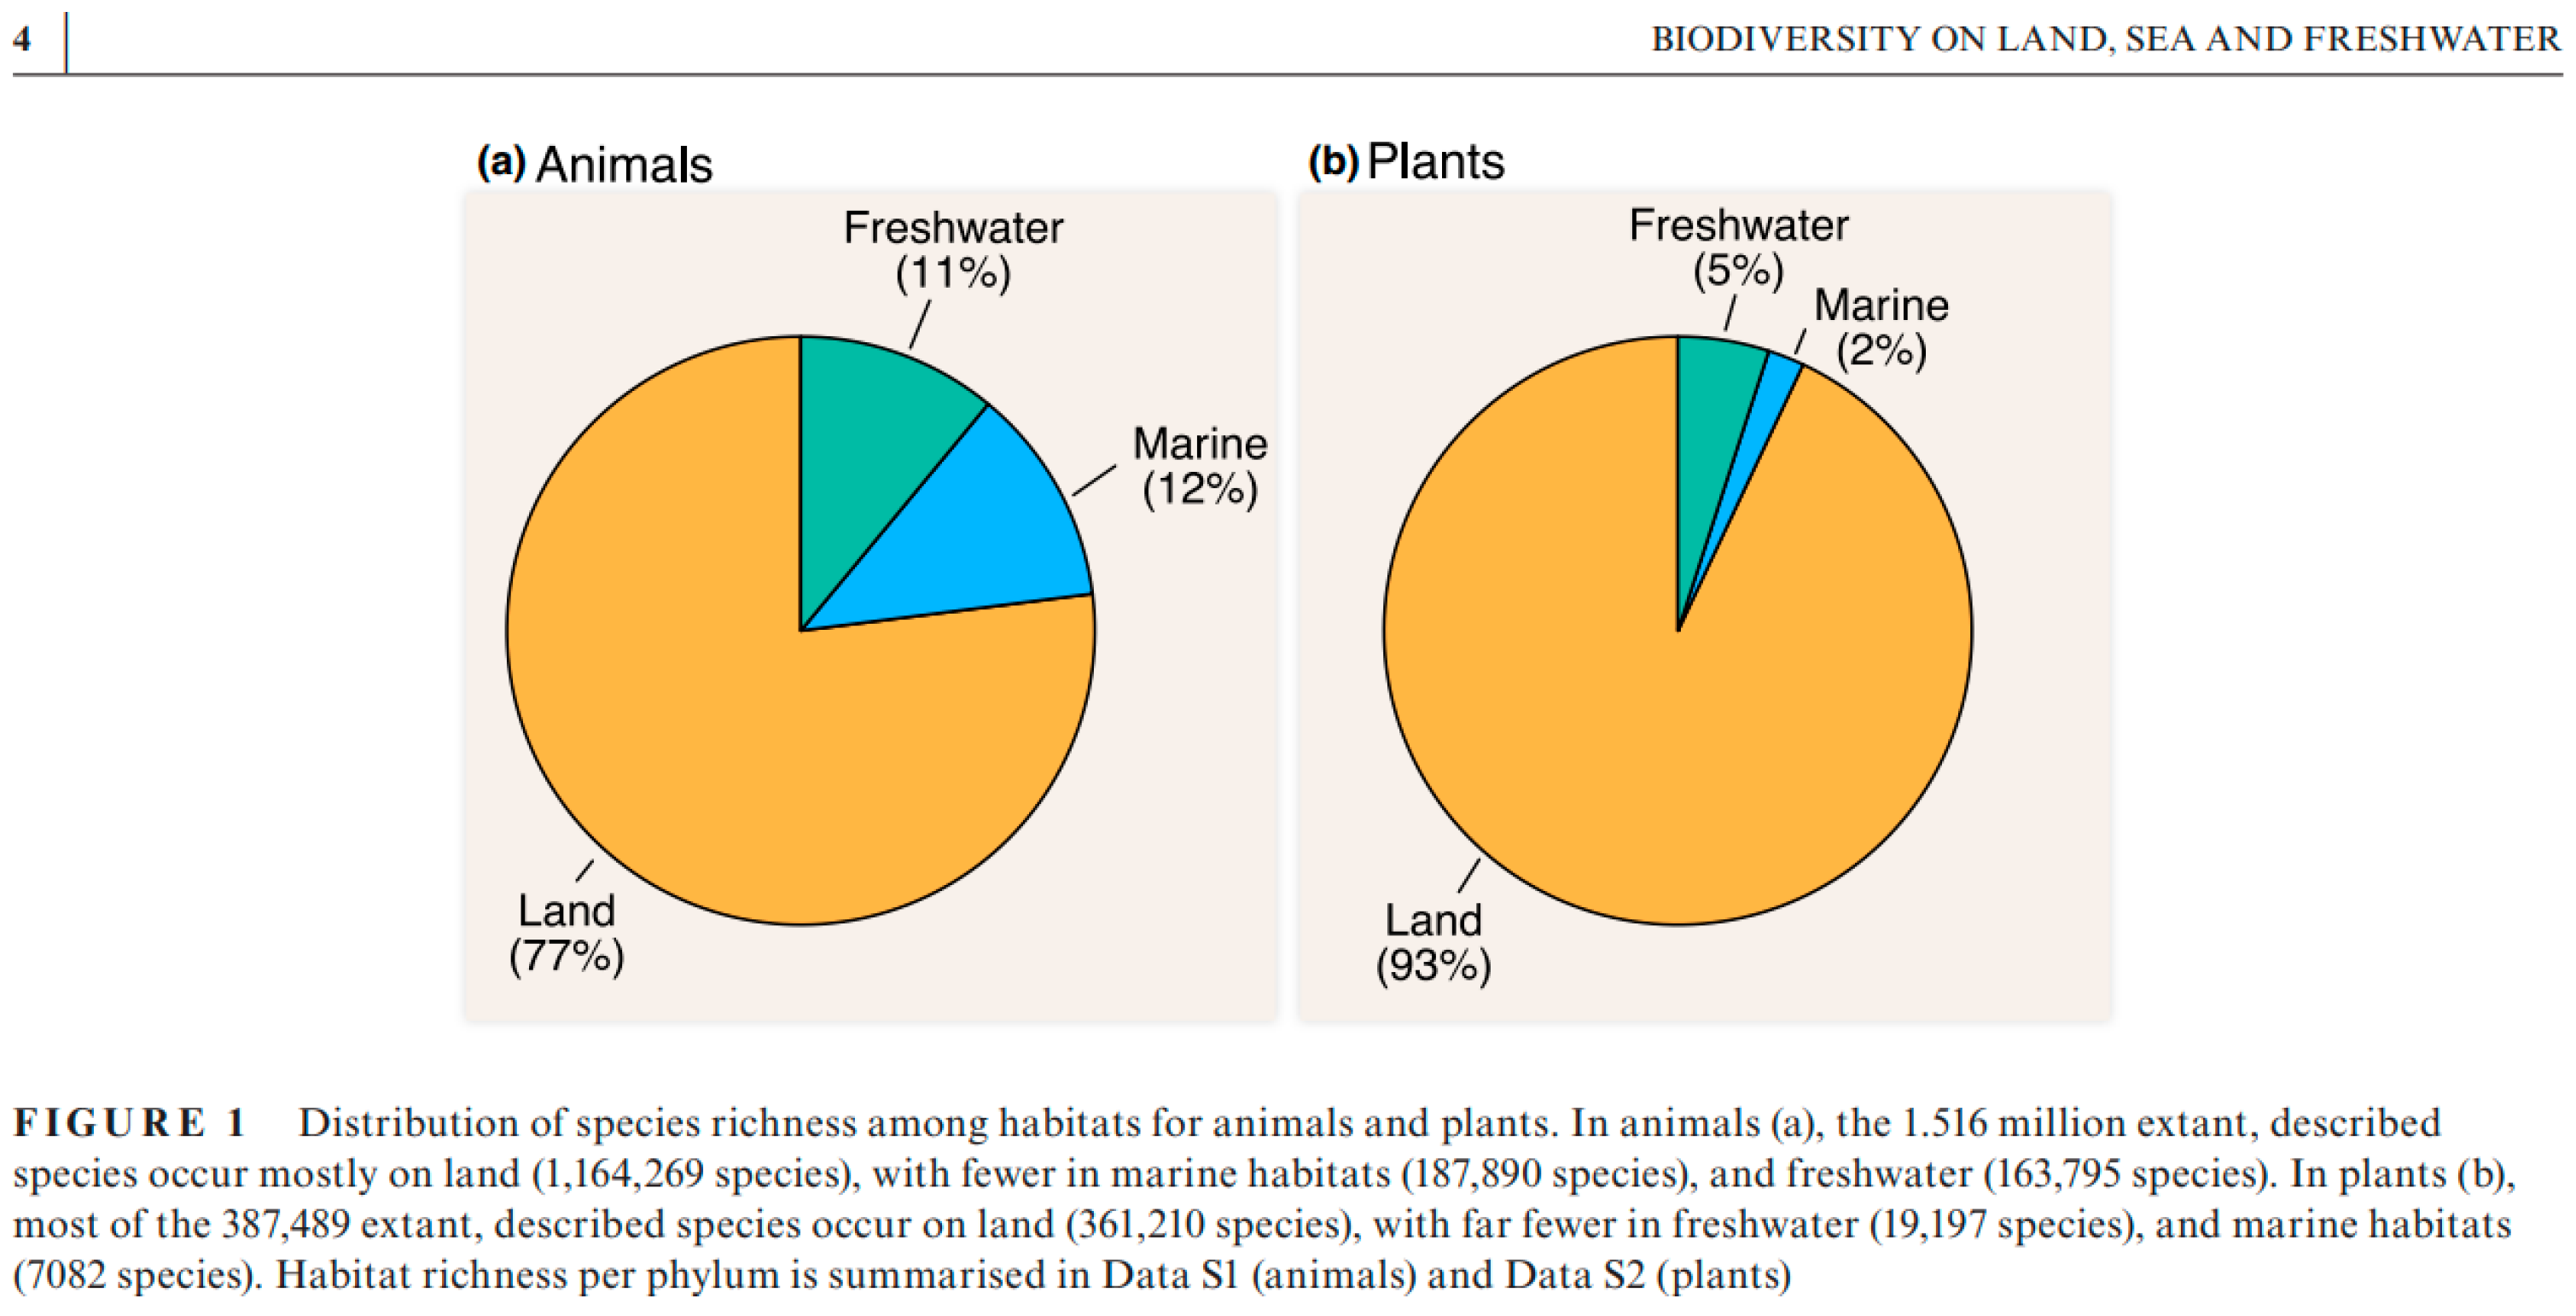
It is remarkable Decaëns et al.’s limited study was seemingly accepted, unchallenged, from 2006. A paper by Román-Palacios et al. (2022) has relative biota proportions in Land vs. Water (
Figure 2) but fail to mention soil at all. Such issues require critical re-evaluation.
Blakemore (2022) reported on further refinement of these Land vs. Water proportions stating: “Based on topographic field data, an argument is advanced that Soil houses ~2.1 x 10
24 taxa and supports >99.9% of global species biodiversity, mostly Bacteria or other microbes. Contradictory claims that Soil is home to only a quarter of biota while Ocean harbours 80–99% of Life on Earth are both dismissed
.” This statement now requires clarification against Anthony et al. (2023) claim Soil hosts only 59% of species whereas their tables show 10–50%. Rather than doubling of soil biota as intimated, in actuality, their data halved true proportion presenting totals reduced by many orders of magnitude. This seemingly due to their microbial counts being based upon older data, now far superseded (
Figure 3).
A simultaneous Global Soil Biodiversity Atlas (GBIF 2016:
Table 1) tallied 219,000 soil species and added 350,700 vascular plants – on the premise that plant seeds and roots are grounded in soil – raising totals up to 667,000 soil taxa (or about a third of all ~2 million formally described species). At around the same time, a 10-year,
$1 billion survey of marine biota (CoML, 2010) concluded a total of just ~230,000 described taxa from the Ocean (or about 12% out of 2 million). It was claimed that this was only about one tenth of Ocean’s expected total of another 2 million species, hence a new Ocean Census project “launched” on 27th April, 2023 to net the remainder. However, as most soil inventories are based upon unreality of planimetrically flat land areas, the true soil counts are likely more than doubled, and possibly quadrupled, for proper terrain and topography (Blakemore, 2018b) reducing further the marine majority claims. Thus, although soil is clearly more crucial and important, due to lack of equable support or funding, much less than 1% of its macrobiota are unearthed. Moreover, since only a tiny fraction of the enormous soil microbiome is identified, with the proportion of unknown soil microbiota likely <<0.0001% (as per Blakemore, 2023), most of the soil biota remain an unexplored mystery.
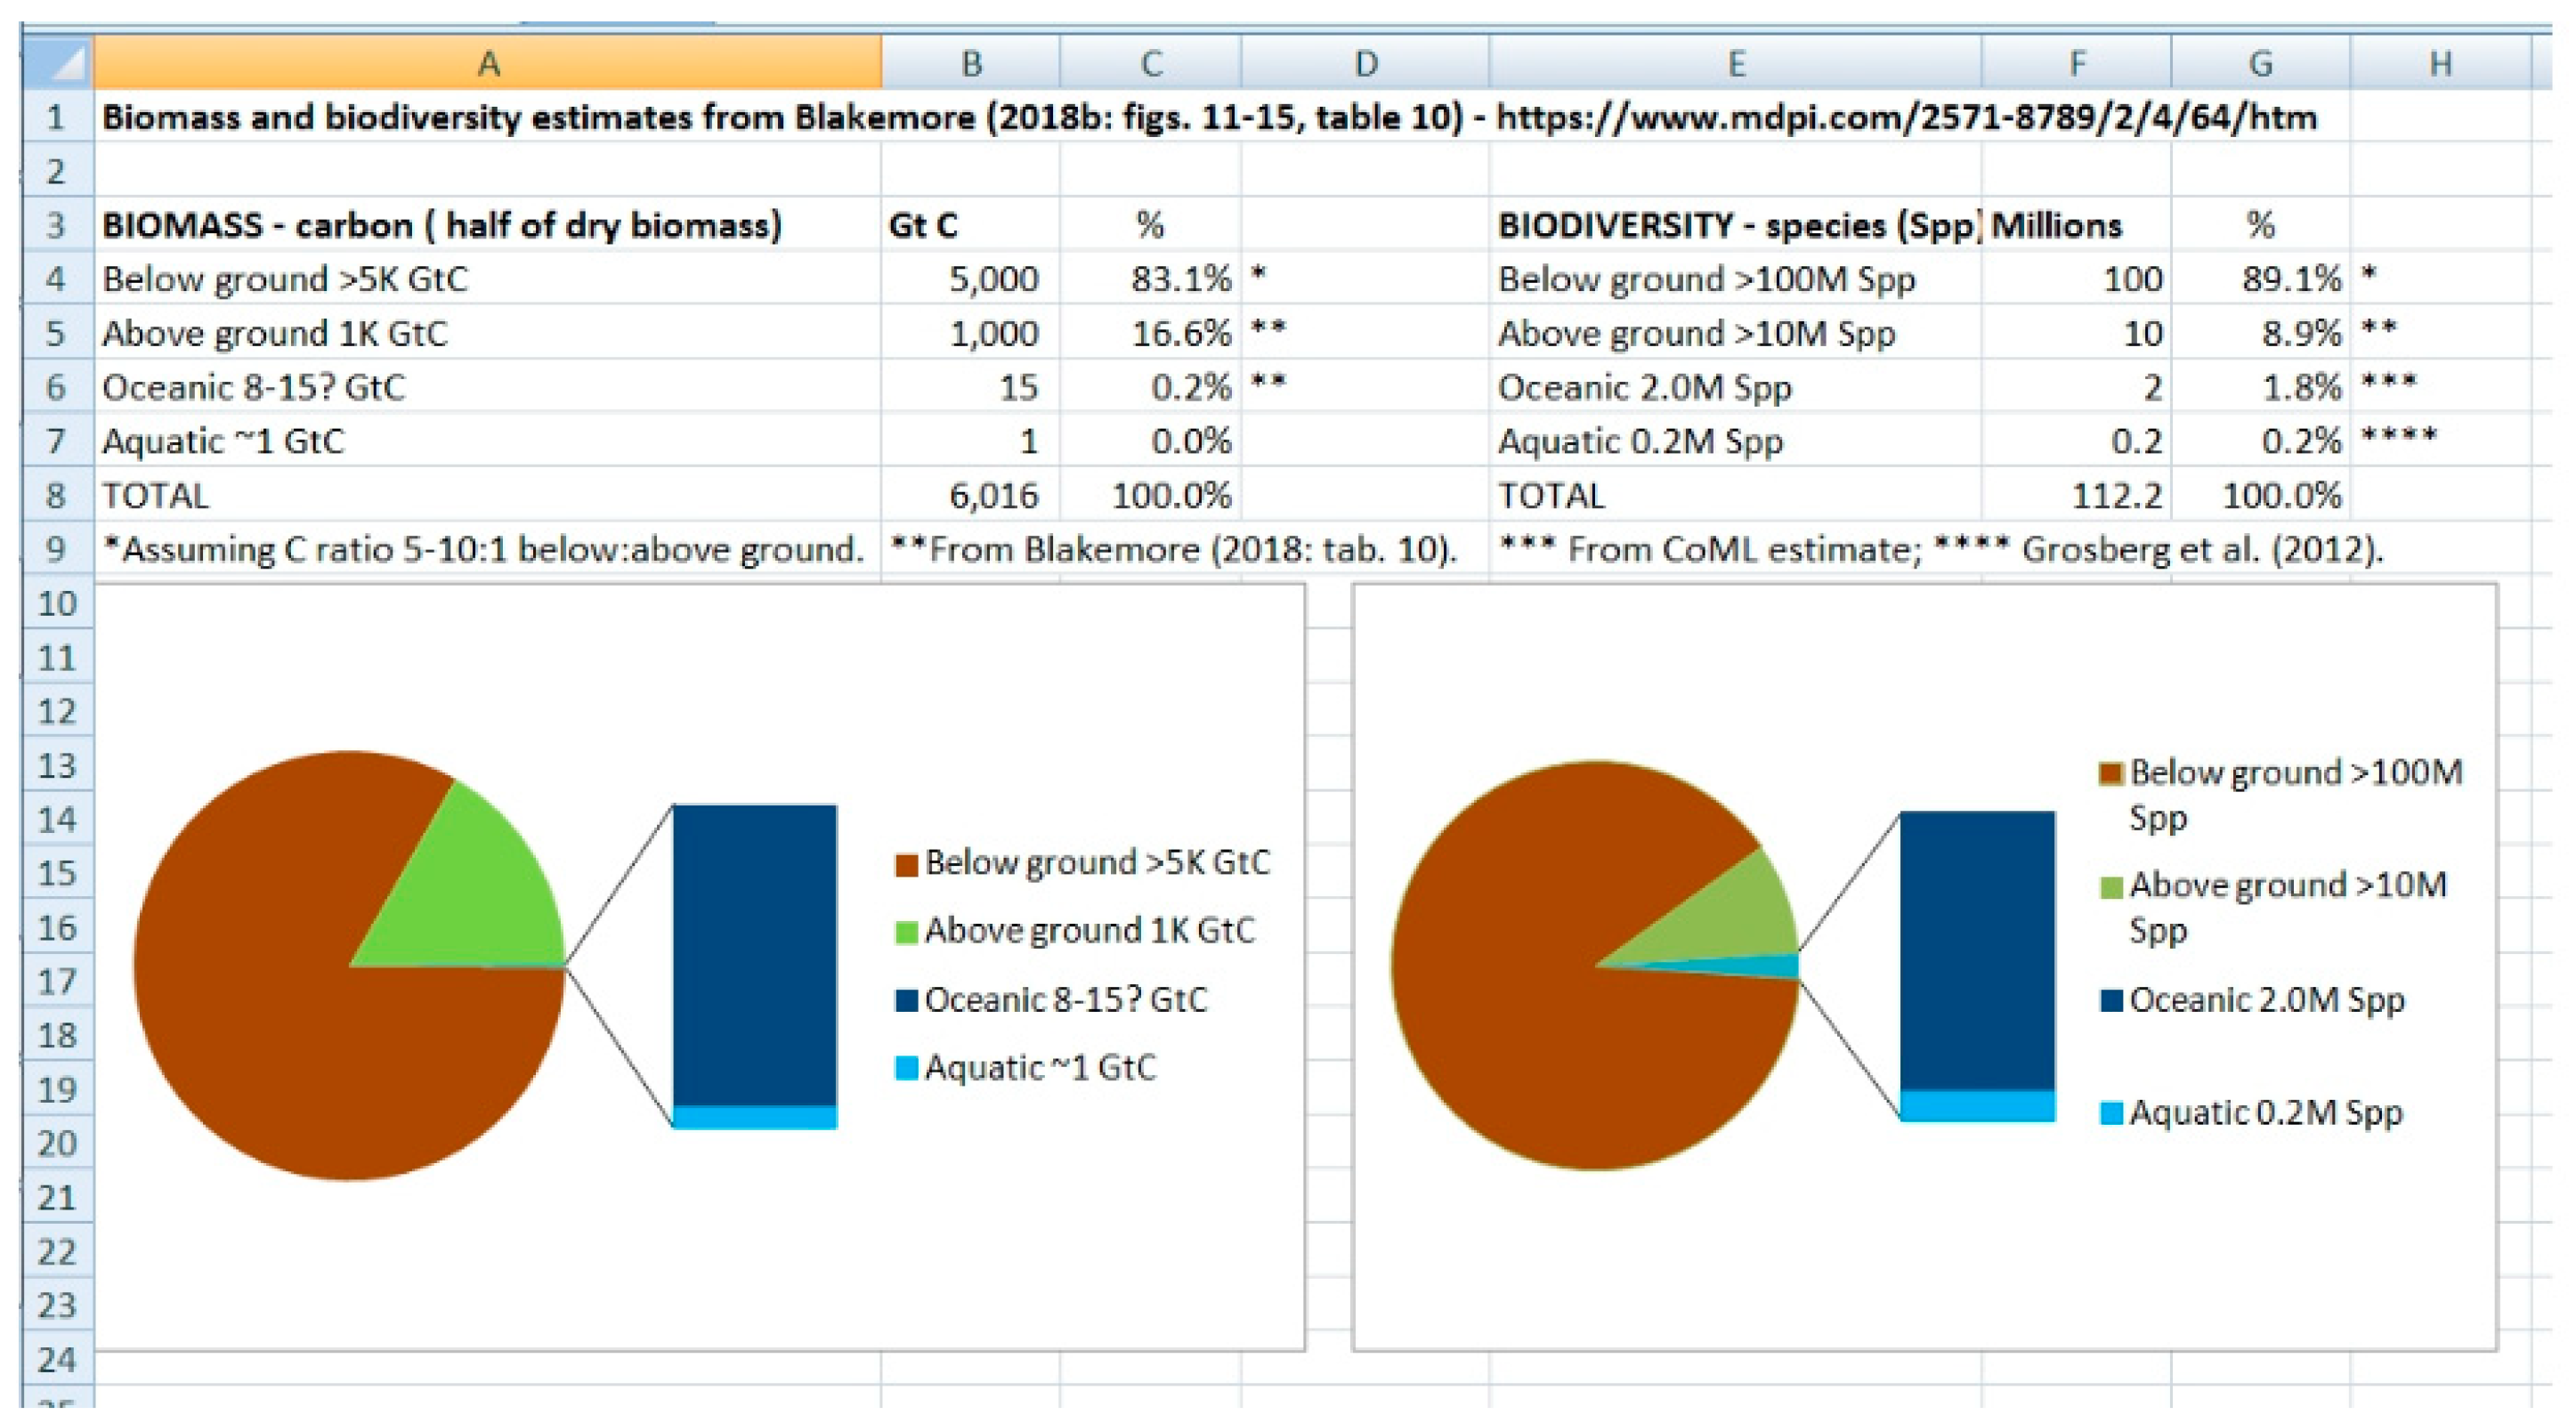
Blakemore (2023) graphic of soil biomass vs. biota allocation are modest (
Figure 5).
Preliminary global microbial abundance estimates by Whitman et al. (1998: tabs. 3-5) had 1.2 x 1029 vs. 2.6 x 1029 cells in Aquatic (Marine & freshwater) and Soils (with 2.2 vs. 26.0 Gt C), respectively, that should have been an indicator to anyone that Soil clearly supports twice the Ocean biota, and ten times its biomass. In other words, Soil likely supports >50-90% of Life on Earth. Deep sub-surface microbiota, which are largely irrelevant to most active Earth processes, were 3.6 x 1030 vs. 2.5 x 1030 cells in Oceanic vs. Terrestrial sub-surfaces, these revised by Kallmayer et al. (2012), Parkes, et al. (2014), Magnabosco et al. (2018) and Hoshino et al. (2020) to just 3–5 x 1029 vs. 2–6 x 1029 (biomass of ca. 4 vs. 23–31 Gt C), respectively. A global tally was thus up to ~1030 cells, as was also found by Blakemore (2023) but for somewhat different proportions as explained therein.
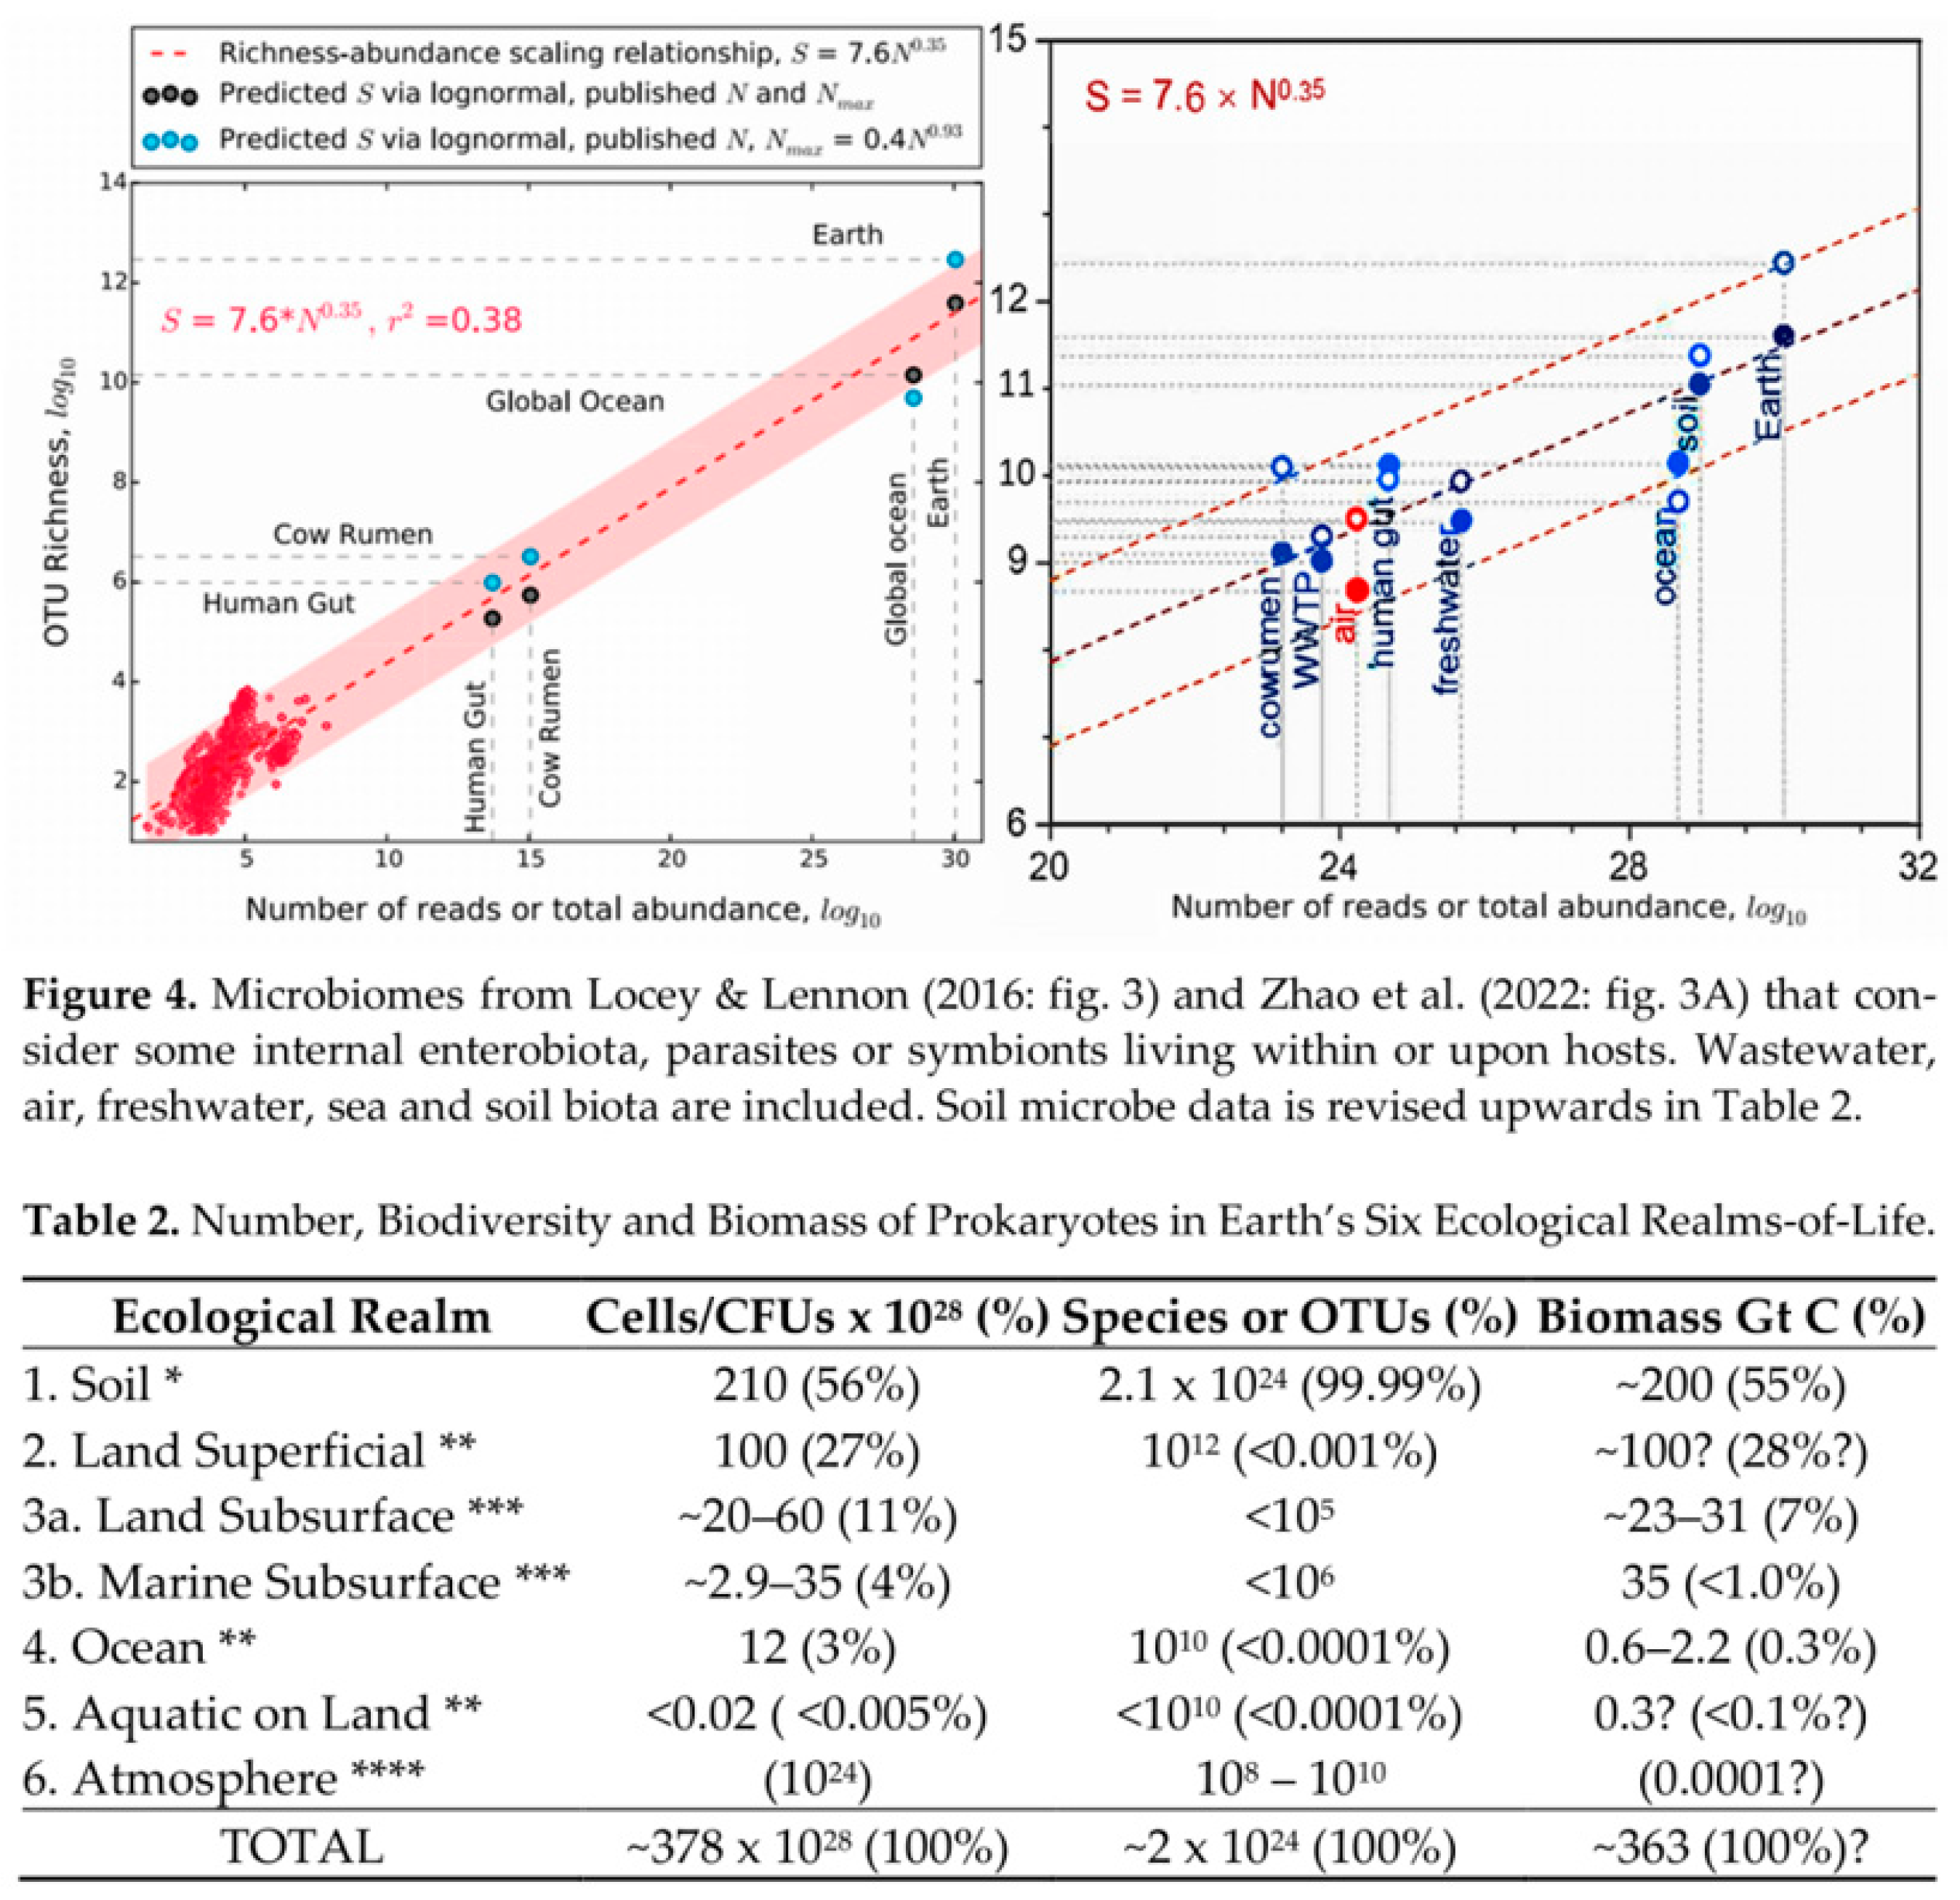
Relating to diversity, most recent developments of high-throughput genomic sequencing and bioinformatics (-omic) allow scaling values such as by Locey & Lennon (2016) to show Earth with ~10
12 microbial OTU taxa (just 10
10 or ~1% in global Ocean). These totals were soon raised to 10
12-14 microbial taxa by Lennon & Locey (2020) and then by Fishman & Lennon (2022) with “
a soft upper constraint of 1022 –
1023 due to neutral drift”. Summarizing microbial abundance and diversity, Zhao et al. (2022) said
: “soil is the most microbiologically abundant (1029) and diverse (1011) environment on the Earth”. Although their cell count may be within bounds, their diversity – albeit about ten times more than found in the Ocean – is disproportionately low for a current estimate of >10
24 taxa (
Figure 6).
Species values in table and figures above (
Figure 6) may be compared to Spp/OTU counts found in Anthony et al. (2023:
Table 1), here presented in revised format (
Table 1.).
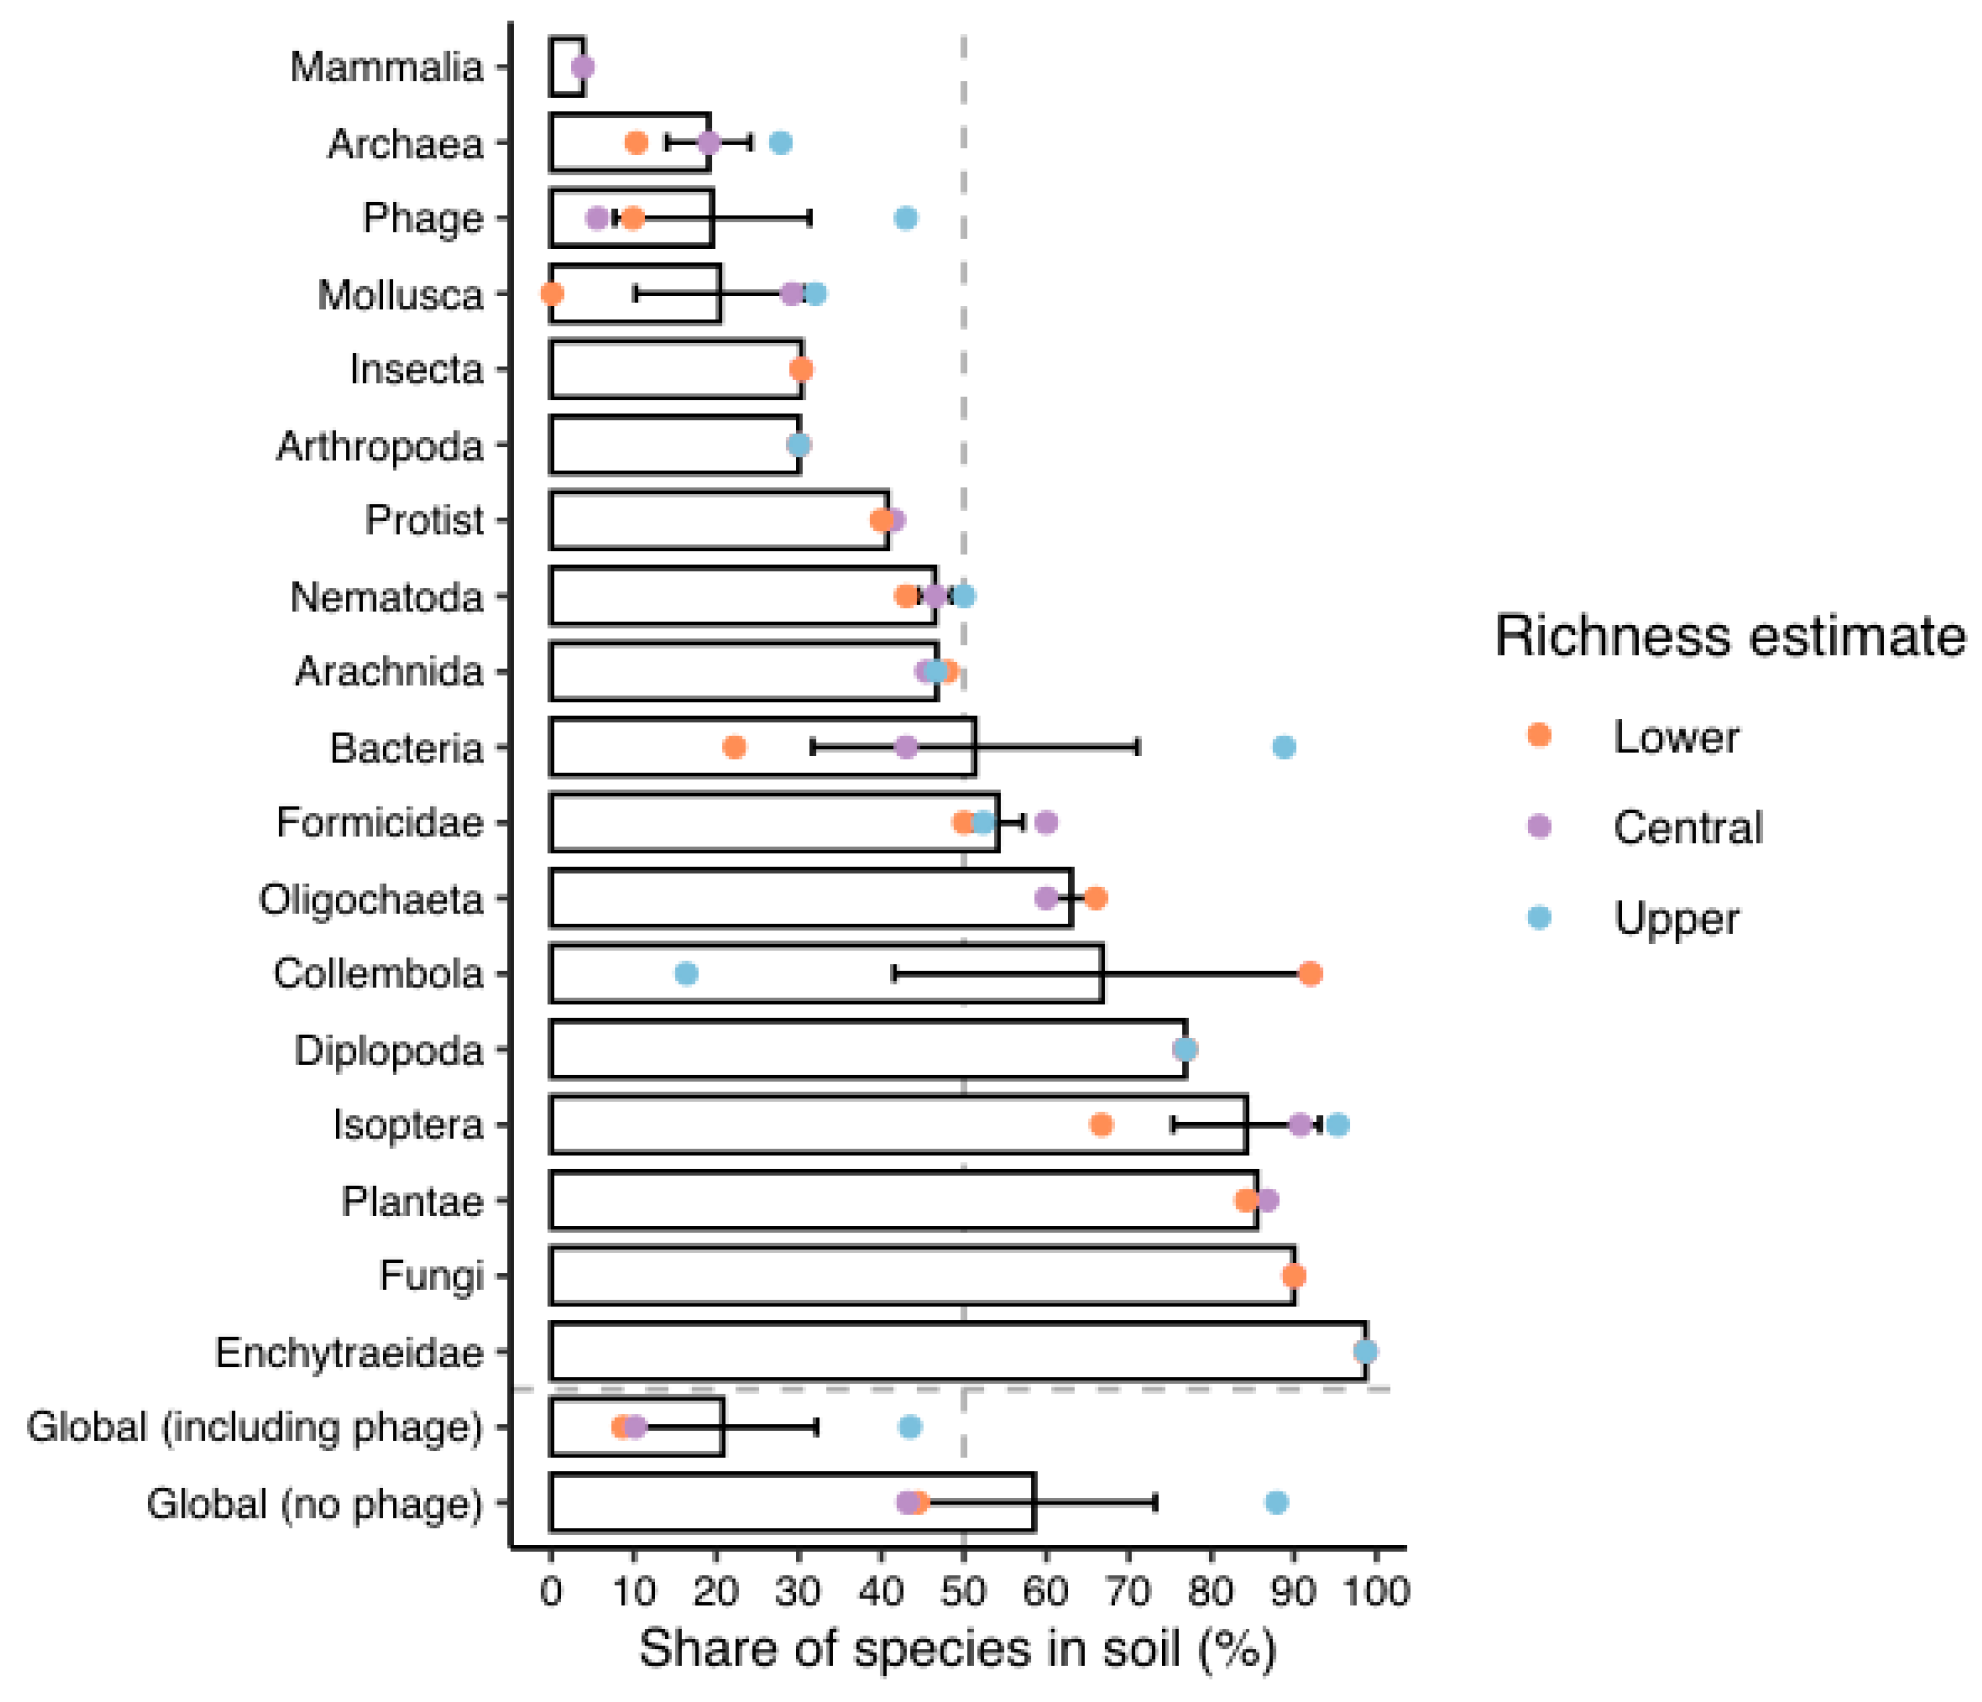
Bacteria upper richness is ~90%, both in Soil and in “Global (no phage)” in Anthony et al. (2023:
Figure 2), proving dominance (
Figure 7), but Earthworms are truly higher at 99%.
In the last few decades, the advent of rapid genetic analyses (-omics) has revealed the complete dominance of microbes in biotic tallies, especially in soils, and a need for realistic biodiversity estimation from projections of their unknown and undescribed components. Realizing our ignorance of vital soil microbes exposes a stark disparity: Most accounts of global richness reflect historic intensity of study rather than relativistic estimates due to an irrational fact that overwhelmingly research effort and funding is directed into Aqua, Oceans or Space, not Soils. Herein a summary of recent soil diversity progress is reported.
Unlike quantitative ground surveys, qualitative checklist unrelated to soil surface areas do not necessarily gain from topographical terrain extrapolation (Blakemore, 2018b).
2. Body of Review
2.1. Regarding Soil Enumeration Values Questioned with “?”
For well-researched Mammalia, Anthony et al. (2023:
Table 1) lower to median ranges were 75–250 soil species, with upper range progression marked with “?”. Although relatively unimportant, a nominal value in Decaens et al. (2006:
Figure 2) is of up to 1,000 soil mammals. Other groups in need of “?” clarification are presented in order below.
2.1.1. Regarding Annelida:Oligochaeta (Earthworms)
Anthony et al. (2023:
Table 1) have “?” questioning a possible upper range of their Oligochaeta which is surprising since they cite the “Global Soil Biodiversity Atlas” (GBIF 2016) -
https://esdac.jrc.ec.europa.eu/public_path/shared_folder/Atlases/JRC_global_soilbio_atlas_low_res-2019-06-13.pdf - that states: “
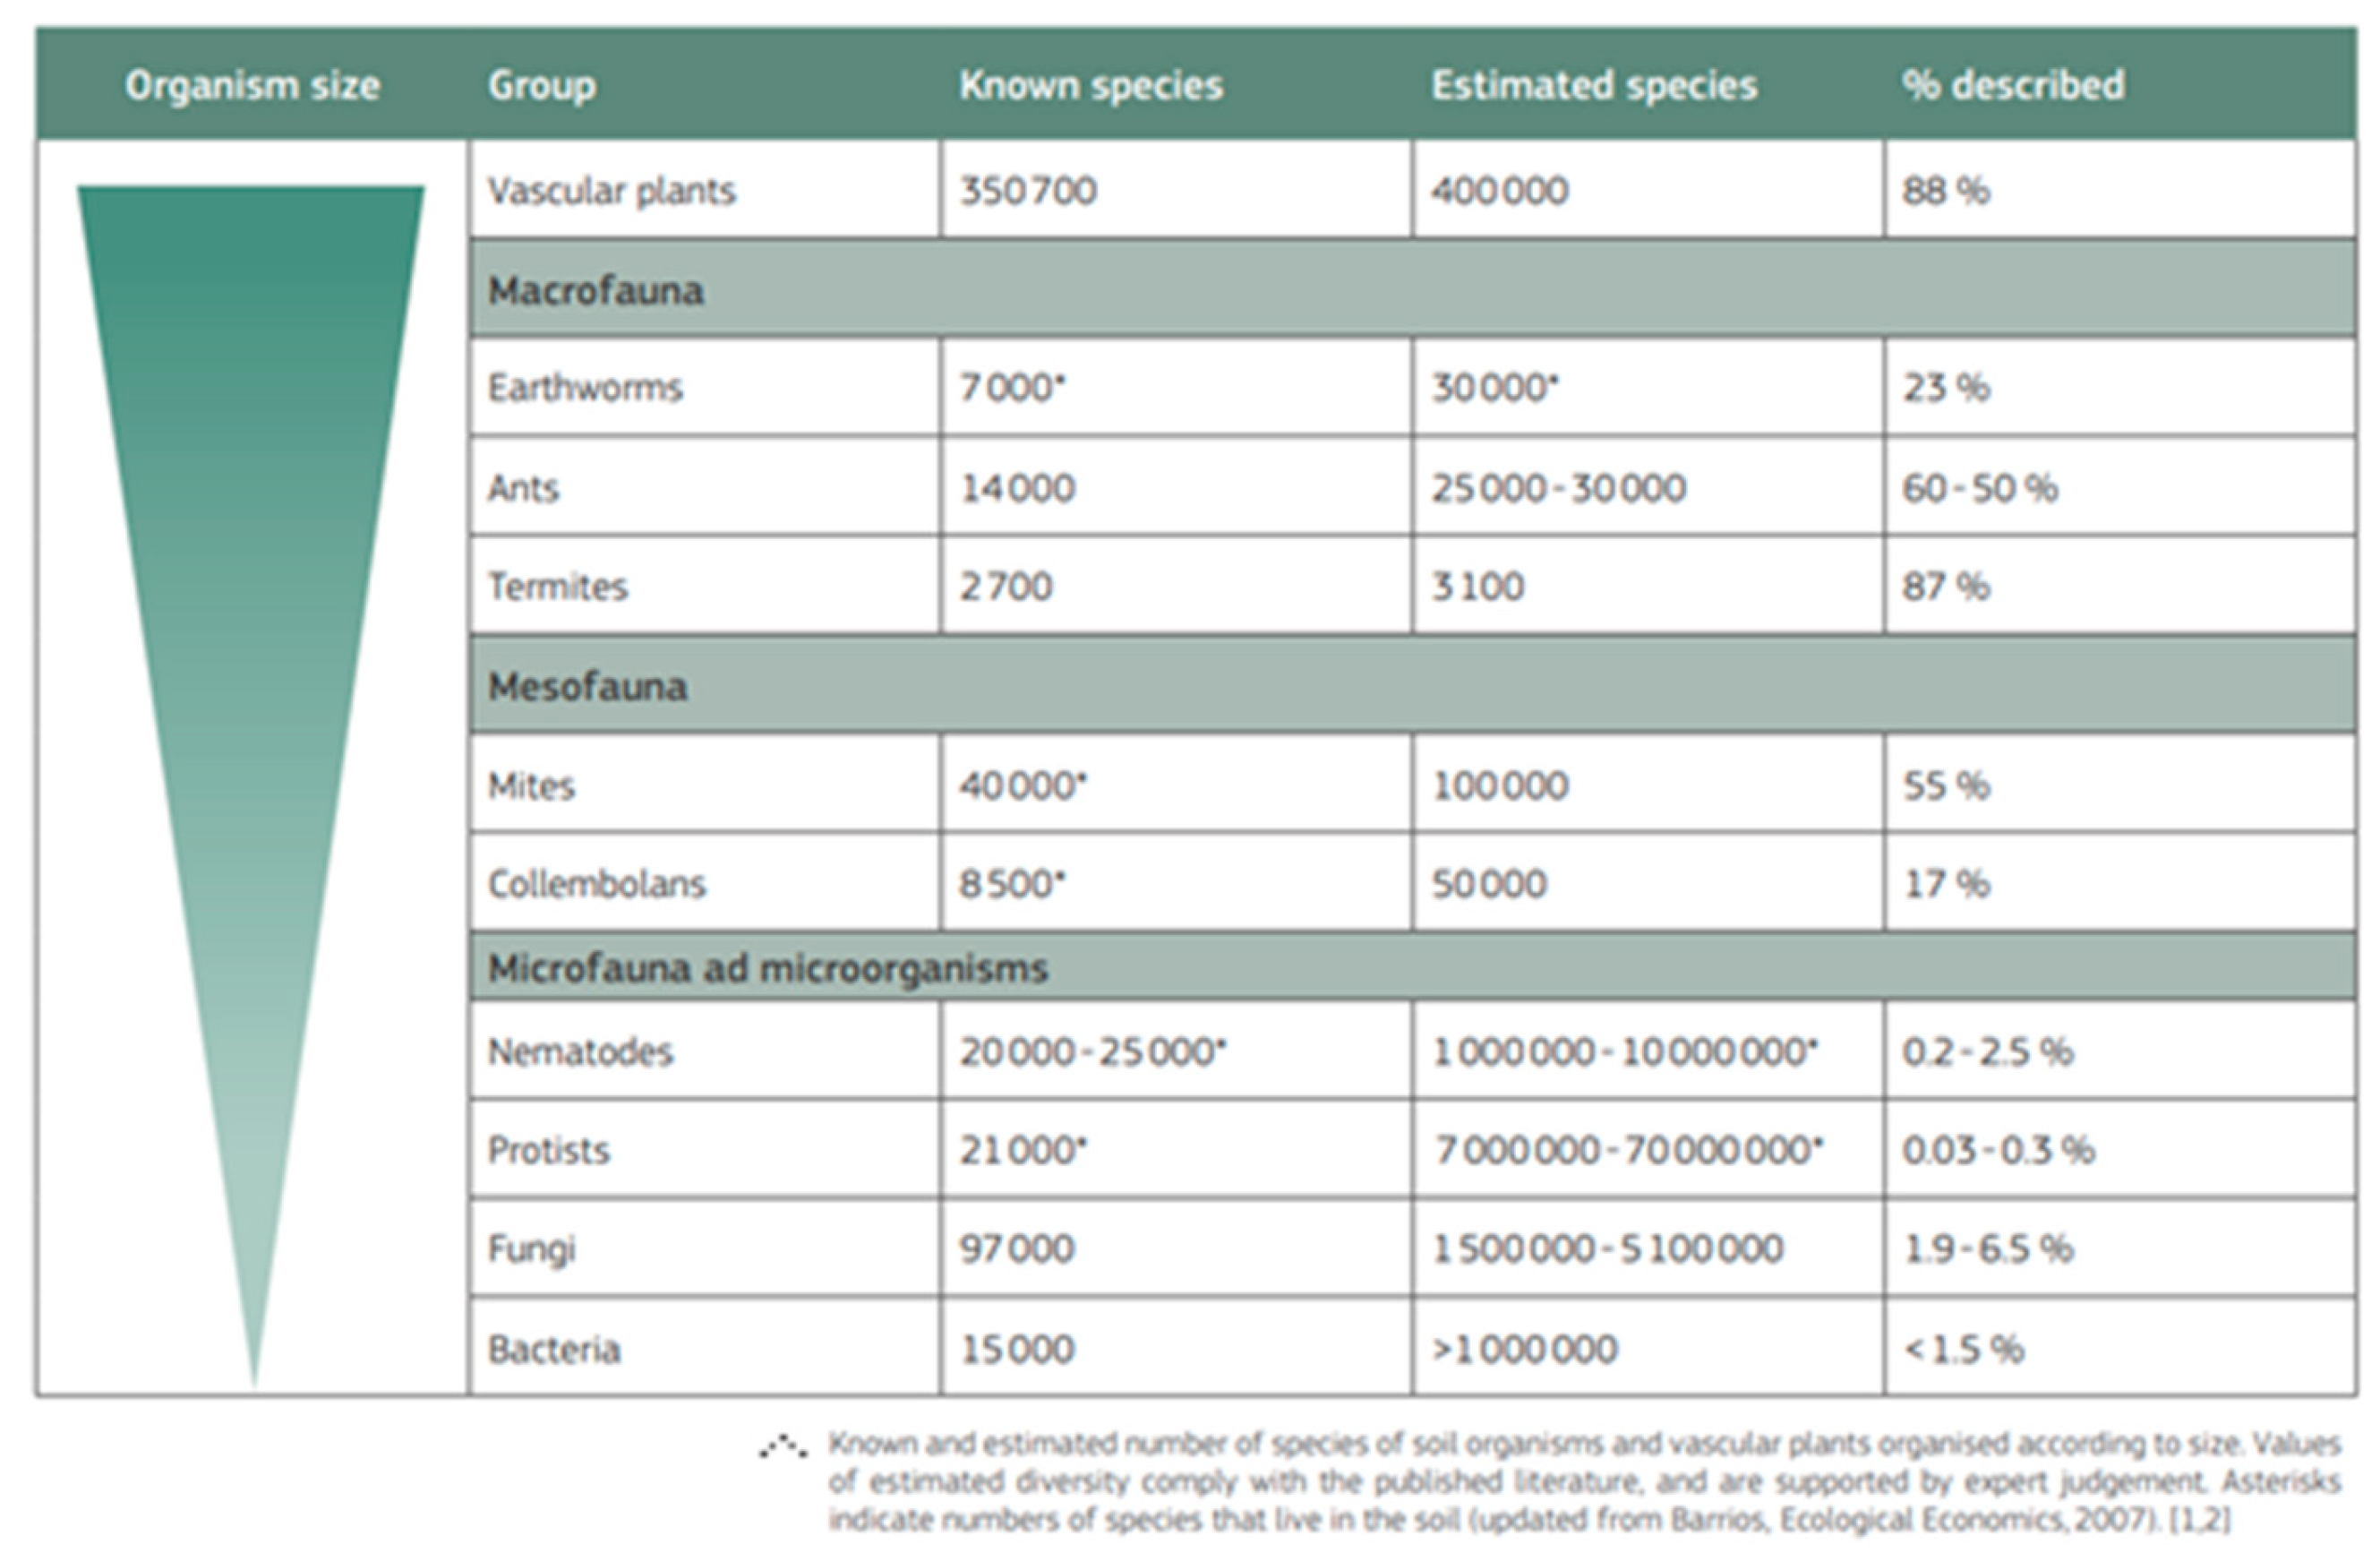
Earthworms belong to the phylum Annelida (class Clitellata, subclass Oligochaeta). The Oligochaeta contain 10 400 - 11 200 species in approximately 800 genera, and 38 families comprised of approximately 7 000 true earthworms.” They seem to have missed the subsequent statement: “
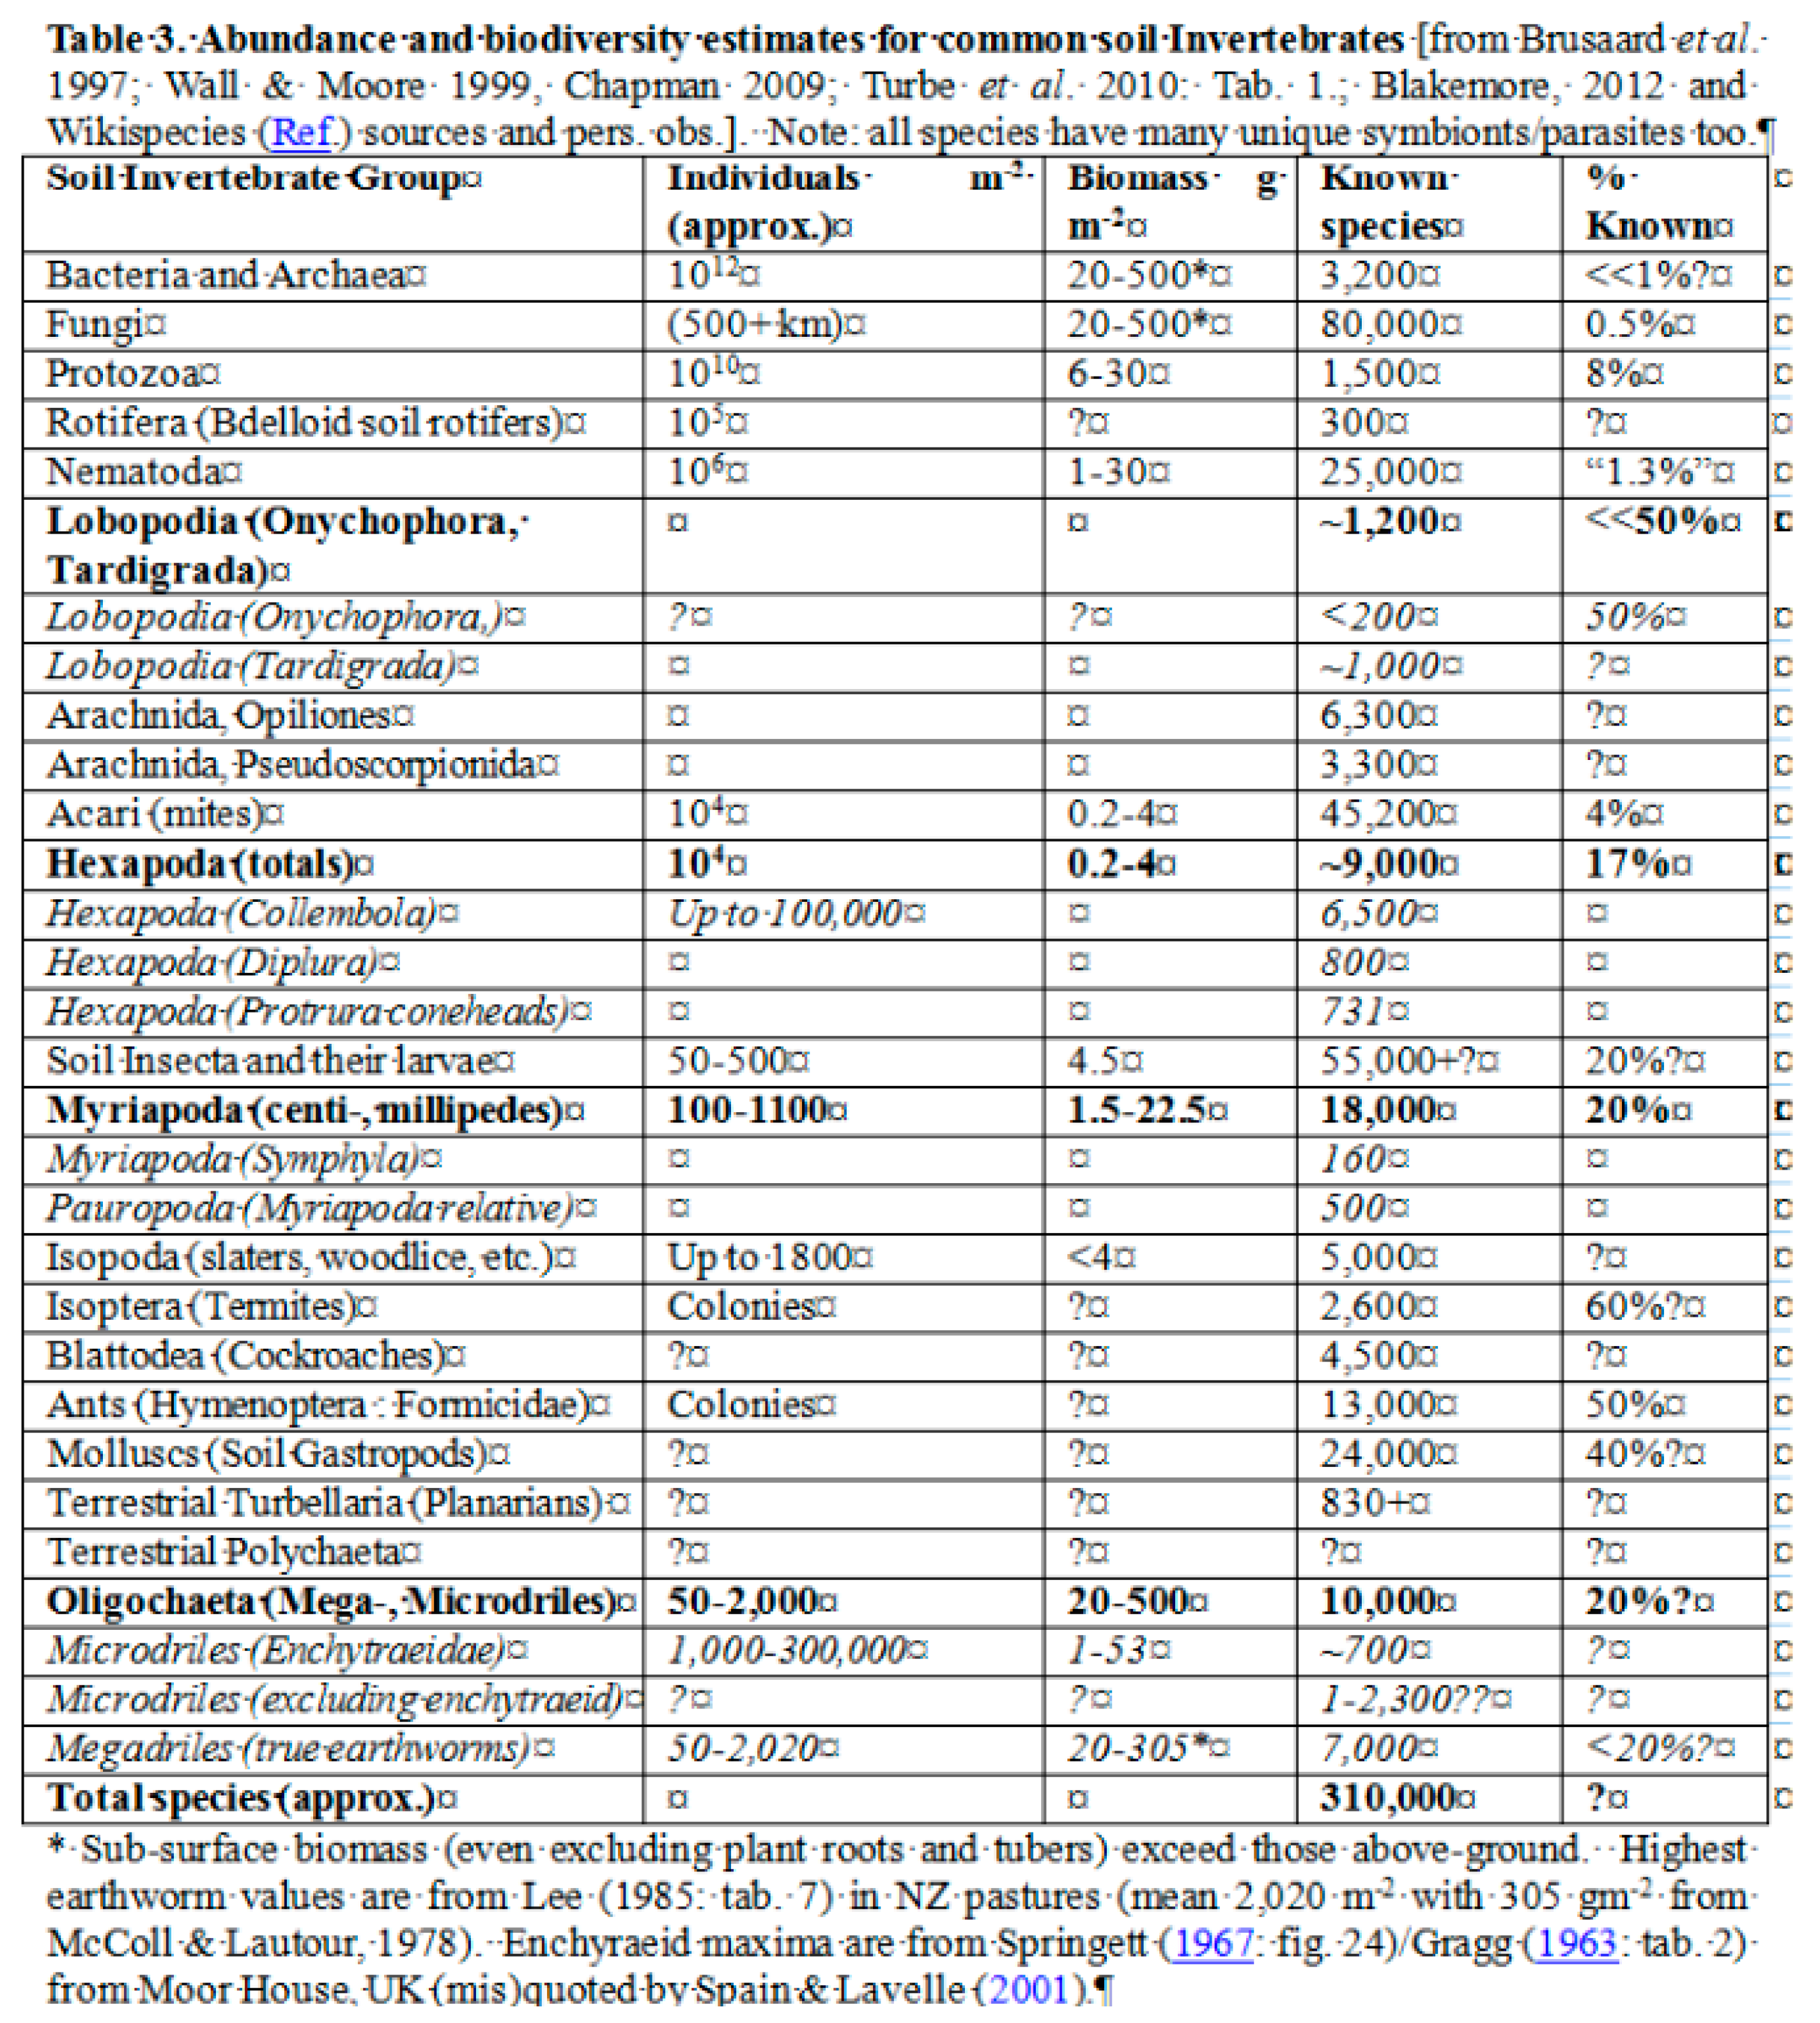
Although 7 000 ‘true’ earthworms (in 20 families) have been described to date, the total is probably around 30 000 species globally”. This is clearly shown in the GBIF (2016) Table reproduced below (
Figure 8).
Phylum Annelida includes Classes Oligochaeta (earthworms) and Polychaeta (marine worms). Due to an inordinate amount of funding for marine research efforts, about 13,000 polychaeta are now reported, but only about 8,000 are considered valid taxa. The mainly soil dwelling Oligochaeta are composed of Order ‘Megadrilacea’ from Benham (1890) – the “true” earthworms – and his Microdrilacea for smaller, mainly aquatic worms. In Anthony et al. (2023:
Table 1) has “Enchytraeids” un-italicized despite being a component of the Oligochaeta under most orthodox taxonomies. Their “Oligochaeta” has between 5,000–10,000 taxa total globally (apparently sourced from Martin et al., 2008 and some GBIF Checklist) and they further claim between 3,300–6,000 Oligochaeta in soil (from Martin et al., 2008; Decaens et al. 2006). These figures are reviewed in further detail below.
Martin et al. (2008:
Table 1) do indeed give 5,000 valid species of Oligochaeta
s. stricto and say that 4 of the 14 megadrile families (in actuality about six of twenty families!) have species that are aquatic or semi-aquatic (or, for
Pontodrilus spp., littoral). They further state that “
No fewer than 60 species of megadriles are also considered aquatic” and list total species in these stated genera [in square braces] as: Almidae [41 spp.], Criodrilidae [2], Lutodrilidae [1] and Sparganophilidae [14] with a dozen or so Lumbricidae claimed to be frequently found in aquatic situations (although this may be questioned as this is often adventitious rather than fixed). Surprisingly they omit megadrile genera with aquatic species include some Megascolecidae (e.g., those in NZ) and omit Pontodrilidae [2 spp.] that is wholly littoral. This biodiversity data also requires updating since at least 7,000 truly megadrile taxa are currently described (see Blakemore, 2000; 2008), and whereas names are continually added the more we search and discover, probably only ~20-30% of all species are currently described, as found by Lee (1959) in New Zealand, and Blakemore (2000) in Tasmania. Numbers of synonyms are un-estimated while claimed expansion of “cryptic species” needs clarification. As Blakemore (2022) noted that Larsen et al. (2017: tab. S1) found on average six cryptic species per morphologically described arthropod taxon (counterbalancing an approximate 18% of eukaryote synonyms noted in Mora et al., 2011).
Anthony et al.’s preliminary research also overlooked Australian ABRS (2009) global summary with: “7,684 Oligochaeta from Blakemore (2008 and pers. comm.)”. As Blakemore (2013) explained, taxonomic classification of true earthworms are: Annelida Lamarck, 1802; Oligochaeta Grube, 1850; Megadrilacea Benham, 1890 with about 20 or so families including Moniligastridae, Acanthodrilidae, Exxidae, Octochaetidae, Megascolecidae, Lumbricidae and Eudrilidae (all sensu Blakemore, 2000). Megadriles have, ~7,000 species as opposed to mainly aquatic Microdrilacea, including just one minor microdrile family that these authors – for some unsystematic reason – gave great import: Viz. the very minor microdrile family Enchytraeidae with only about 700 species. Whereas Anthony et al. claim this family is the most wholly soil-dwelling group with 98.6% terrestrial members, this is misconstrued as the Microdrile group on the whole is at least 50% aquatic or semi-aquatic, being small, pale and relatively ineffective. Microdrile researchers are classed as aquatic workers, rather than true soil-based, megadrile eco-taxonomists, consequently they too seem to enjoy greater support for no particularly justifiable nor rational reason.
Blakemore (2000, 2013, 2016) tallied a total of >6,800 megadriles names. and if the 3,600-4,400 or so microdrile names are added, this would give a total Oligochaeta of ~10,400-11,200 taxa. Specifically, Blakemore (2013) had about 7,000 valid Megadriles (with 20 Families) and about 3,000 microdriles (with just ca. 1,700 valid species according to Martin et al., 2008) to give Oligochaeta total around 10,000 total with an unknown number of synonyms or cryptics, these arranged in ca. 804 Genera and about 38 Families.
Another source is the GBIF database of García-Rosello et al. (2023:
Table 1) of Annelida: Clitellata with just 8,000 total species but which strangely claims 13.6% are Marine. In contrast, Anthony et al. state: “
Annelids, including the Enchytraeidae and Oligochaeta, with the lowest overall biodiversity but high specializations to soil. We estimate that there are 7.8 × 10² and 1 × 10³ Enchytraeidae and Oligochaeta species and that 98.6 ± 0.06% and 63 ± 4.2% of species live in soil, respectively.” That this is factually incorrect may be realized with the most basic of research since there are 7,000 described Oligochaeta, not just 1,000. Moreover, rather than just 63%, a majority proportion of Megadrile Oligochaeta that are wholly soil dwellers is >99%, as the name, “Earthworm”, suggests. Although this should be obvious, it is restated.
Thus, contrary to Anthony et al.’s indication, most of the true earthworm Families are terrestrial and nearly 100% resident in soils. Martin et al. (2008) cite 60 wholly aquatic megadriles which may be a reasonable number, that – in a megadrile group of about 7,000 taxa – is less than 1% making them likely the most specialized of wholly soil residents. Other candidates such as the termites or ants are insects with winged stages. Other hexapoda such as Collembola or mites are often superficial litter dwellers or depend upon earthworm burrows for their soil ingress. There are several other of less populous soil faunal and floral groups that may also have true edaphological species. For instance, components of the ubiquitous superficial cryptogamic biocrust and an extensive phytomenon that may rival marine phytoplankton for abundance, diversity and for productivity.
2.1.2. Regarding Soil Bacteria (Plus Archaea)
Anthony et al. (2023:
Table 1) had Bacteria included within Microbes often marked with a “?”. Global biodiversity is now dominated by Bacteria in the Soil Realm, as Blakemore (2022) showed, new totals of ~2.1 x 10
24 taxa in ~3.8 x 10
30 cells indicates that one species, or operational taxonomic unit (OUT), exists for nearly each 10
6 cells. In this review a justified argument is that a unique taxon per million cells is reasonably applicable. As there is no central registry – nor yet a dedicated Soil Ecology Institute – diversity data are compiled from diverse sources and updated or corrected as necessary in periodic reviews.
In Norway, Torsvik et al. (1990) found a ca. 1.5 x 10¹⁰ bacteria cells per g of dry forest soil. Distributed among 4,000 clones with standard genome sizes, a mean number was ~4 x 10⁶ bacteria per clone per g of dry soil. This indicated soil bacterial populations comprise many genetically separate clones, with a mean of around ~3.75 clones per million cells.
Worldwide, Roesch et al. (2007) estimated soil microbial populations limited to ~1 billion cells per gram of soil (109 g-1) comprising 103–106 Bacteria or Archaea species, or at least one up to as many as one thousand species per million cells. They also found 2,000–10,000 species g-1 were underestimates; thus a reasonable mean may be closer to 105 (per 109 g-1), suggesting an average possibly approaching 100 species per million cells in soils.
Conversely, Reynard & Nunan (2014) said: “The application of novel molecular techniques (such as high throughput sequencing) during the past two decades has uncovered a phenomenal bacterial diversity in soils.” They quoted “a single gram of soil can harbour up to 1010 bacterial cells and an estimated species diversity of between 4·x 103 to 5·x 104 species”. But they also noted “when bacterial density is 109 cells g−1 or less. α = 1107.53 corresponds to a species richness of 15000 species for 109 cells whereas α = 264.79 corresponds to a species richness of 4010 species for the same number of cells.” This diversity ratio of 4-15 species per million cells is closer to range estimated earlier: an average one to ten bacterial species per million cells.
Indeed, Bickel & Or (2020) concluded: “Soil hosts unparalleled bacterial diversity, ranking highest among all other compartments of the biosphere. The number of bacterial phylotypes ranges between 102 and 106 per gram of soil, with high values similar to the diversity in all of earths environments. This immense richness is often attributed to soil’s intrinsically heterogeneous physical and chemical micro-environments. The complex structure of soil pores offers numerous refugia for hosting diverse bacterial species. This wide range of microhabitats is particularly important for maintaining the rare components of the soil microbiome.” From their microbial biodiversity of ca. 10,000 taxonomic units per g dry soil, since soil may harbour 1010 cells g-1, this would also give an average of about one species (of Bacteria or Archaea) for each million cells.
This is consistent with Blakemore (2022) determining about one species per million cells (from 2.1 x 1024 species in 2.1 x 1030 cells in global soils). However, as noted, underestimations may also be by one or more orders of magnitude, so values are approximate.
2.2. Clarity in Soil Viruses
2.2.1. Virus-Like Particle (VLP) Counts
All viral estimates in Athony et al. (2023:
Table 1) had speculative uncertainty marked “?”. Indeed, Williamson et al. (2017) found soil viral diversity severely underestimated and under-sampled, albeit their measures of viral richness were higher for soils than for aquatic ecosystems. Many soil virus reports show up to 10
10–10
11 virions per gram of soil and a global best-estimate was of >10
31 virus-like-particles (VLP) infecting microbial populations at any one time (Mushegian, 2020 as originally from Hendrix et al., 1999).
If 1010–1011 virions per g occur, this is 1016–1017 per tonne of soil. Further, if in 2.1 x 10¹⁴ t topsoil (from Blakemore, 2022), a range is 2.1 x 1030–1031 virions (median ~1.2 x 1031).
This total is about the same as that calculated by other authors, e.g., Mushegian (2020) and Cobián-Güemes et al. (2014) who had between 10
31 and 4.8 × 10
31 viral phages on Earth. Comparatively, Suttle (2004) extrapolated counts of viruses from samples to the entire world, arriving at an estimate of 4 × 10
30 virus particles in oceanic waters (i.e., ~10%). Mushegian (2020:
Table 1) arrives at a similar estimate of just 2 × 10
30 virions in the ocean, i.e., a range of just 2–4% of Ocean virions in a global total of about 10
31 virions. As true soil counts are likely higher, as shown below, this proportional ocean value is reduced further.
Initial estimates, of virus abundance in soils ranged from 107 to 109 virus like particles (VLP) per gram of dry soil (Williamson et al., 2003; 2017) with a mean about 108. But Pratama et al. (2020) had a higher mean of 109 VLP g-1 from a range of catalogued soils. This agrees with Jansson (2023) for different soil types at ~108–1010 VLP per g dry soil (mean also 109), but she noted the true number may be higher than that obtained by microscopy because many soil viruses are intracellular and not able to be imaged separately. Kannoly et al. (2022) shows up to 1,430 plaque-forming-units (PFU) per lysogenic bacterial cell-burst. Thus, an order or two is easily added, possibly to give around 1010-11 VLP g-1?
Especially relevant, a study by Cobián-Güemes et al. (2016) estimated 4.80×10
31 VLPs on Earth but comprising an unrealistic minimum of 257,698 different viral genotypes. They quoted literature reports with only 3.9×10
6 up to 2×10
9 total varieties (or just one viral variety per 10
22–10
25 VLP!), which is highly unlikely. Their tabulated ratios are revised more appropriately with values from Blakemore (2022, 2023) giving, at least, a global total of 5.1 x 10
31 VLPs with about 4.1 x 10
31 (or 79.8%) virions in soils to full depth (
Table 2).
This updates the soil virus value, allowing for non-ice and non-desertified terrain, that Blakemore (2022) concluded to 1 m depth of ~2.1 x 1030 virions, based upon Bar-On et al.’s (2018: 55) summary which they admitted had a 32-fold uncertainty! Although most samples are superficial, often in just the top 10 cm of soils, viral activity persists throughout the soil profile, to at least 1 m depth (Muscatt et al. 2023). Interestingly, these latter authors concurred, stating: “Viral contributions to soil ecology are largely unknown due to the extreme diversity of the soil virosphere. Despite variation in estimates of soil viral abundances (107 to 1010 viruses per gram of soil), it is clear that soils are among the largest viral reservoirs on Earth. Early metagenomics investigations have revealed high genetic diversity in soil viruses, with putative impacts on global biogeochemistry. Still, less than 1% of publicly available viral metagenomic sequences are from soil, reflecting the lack of knowledge about soil viruses and their ecological roles”. Accordingly, as soil is yet again under-represented, Graham et al. (2003) argue that understanding the role of viruses in soil is a most pressing of our ecological challenges.
As indicative of the uncertainties, new soil virus data was provided in 2023 (
https://web.archive.org/web/20220301082457/https://www.soilviral.com/) having: “
1 billion viruses g-1, that if calculated over the whole globe amounts to about 4.9 x 1031 soil viruses”. Doubled for terrain, this is ~1 x 10
32 as a new upper value in a range, now of 10
31-10
32 VLPs. The mean value of >0.5 x 10
31 global total virions on Earth is a reasonable compromise.
2.2.2. Virus to Microbe/Bacteria Ratios (VTM/VBR) of Virus-Like Particles (VLPs)
Virus to microbe/bacteria ratios (VTM/VBR) indicate abundance & diversity.
2.2.3. VTM/VBR Abundances
As already noted, Mushegian (2020) had about a 10-fold excess of phages over bacterial cells (as per Bergh et al., 1989), whereas Cobián-Güemes et al. (2016:
Table 1) median VTM was around 12:1 and about 20:1 in Soil. Applied to
Table 2 totals, a 12:1 ratio for all ~3.8 x 10
30 global microbe cells would be about 4.6 x 10
31 VLPs with 4.1 x 10
31, or 89%, of viruses in Soil. But this too may be out by an order or more, not least to account for active intracellular virus particles that are not included in most surveys nor soil’s VTM ratios.
Early on, Ashelford et al. (2003) had average virus numbers in soil of 1.5 × 10
8 g
−1, which they said was equivalent to 4% of total bacteria population (of 3.6 × 10
9 g
−1) giving a virus-to-bacterium ratio (VBR) in their soil of 0.04:1. Subsequently, other authors found higher numbers, for example Cobián-Güemes et al. (2016:
Figure 1) had mean Soil VTM ratio ~100:1 but selected their median value of about 20:1 as in their
Table 1 (
Table 2 above).
Cao et al. (2022) reported highly variable virus-to-bacteria ratios (VBR) in soils as ranging from 0.001 to 8,200 [six orders of magnitude] although their study found abundance of virus-like particles (VLPs) ranged from 2.0 × 10
7 to 1.0 × 10
10 and microbial abundance ranged from 1.0 × 10
8 to 8.2 × 10
8 per gram of dry soil, to give a VTM ratio of about 0.1 to 98.3 [near three orders of magnitude range], settling around a median VTM ratio value of 10:1 as was determined by Berg et al. (1989) and compliant with Cobián-Güemes et al. (2016:
Table 1,
Figure 1) wide range estimations, especially for soil, varying 10:1 to 100:1.
2.2.4. VTM/VBR Ratios and Viral Diversity
Although an answer is complex, a preliminary estimate in Fierer et al. (2007: Table 3) show bacterial OTUs of 103-6 (median 104-5) while viral vOTUs ranged 103-8 (median 106) thus, extrapolating data, soil viruses do appear 10–100 times more diverse than Bacteria.
Yet Muscatt et al. (2023) determined that “overall vOTU per host ratio was 0.42 (median = 0), reflecting the predominance of unique host associations for individual vOTUs”. This suggests viral diversity is commensurate with Bacteria/Archaea diversity (vOTU:OTU) so, for 2.1 x 1024 soil microbe species, viral diversity would be (2.1 x 0.42 = 0.88) or around 0.88 x 10²³ vOTUs. Viral richness (of ca. 1023 per 1031-32 virions) would then be about 1 unique “variety” for each 108-9 virions, or roughly two or three order higher than bacterial richness which, as noted, is around one species per 106 cells, or one bacterial taxon per million cells.
Conversely, Roux & Emerson (2022) quote: “estimates of soil viral richness suggested the presence of 1000 to 1 000 000 genotypes per sample” and samples were traced as 200 g wet soil, say about 100 g dry, to give around 10-10,000 soil genotypes per gram (or around 103 in a mean of 109 virus particles per g – which is also about one vOTU per million virions).
A likely summary is that viruses are most abundant in soils and at least ten times as many as the Bacteria, their primary host. From Blakemore (2023), as both global and soil alone bacterial biodiversity are in the order of 2 x 1024, then virus diversity may range from at least as many up to 1025– 1026 viral species, possibly higher if further studies were made.
Support is found in Kuzyakov & Jones (2018): “The total number of viruses (including intracellular viruses inside bacteria) is probably 1-2 orders of magnitude higher than the bacterial populations.” Conversely, Bacteria are 1-2 orders less (so = 1029–31?). We may finally concur with Williamson et al. (2017) conclusion: “To understand the soil virome, much work remains.”
2.3. Review of Soil Abundance Enumerations
An upper diversity value for viral “Phage” in Anthony et al. (2023:
Table 1) was 3.7 × 10
11, well below current estimates of up to 10
26 varieties, mainly in soils. Before 2022, an often-repeated claim was that soils support 25% of global biota, this seemingly attributable to Decaens et al. (2006:
Figure 1 and
Figure 2) that had: “
A rapid survey of invertebrate and vertebrate groups reveals that at least 1/4 [i.e., >25%]
of described living species are strictly soil or litter dwellers, the main part of which is insects and arachnids (Figure 1).” These authors’ data had a total described number of species at ~1,500,000, thus soils would presumably total just 375,000 species (they show with an unrealistically low <5% Bacteria, virus and Fungi in this total, or about 18,750 microbial taxa). Of ~360,000 soil animals in their
Figure 2, they show 1% “Annelida” or just 3,600 earthworm species (about half the true count at that time).
Because Anthony et al. (2023) overlooked key studies, not least by Blakemore (2018b, 2022) and by Zhao et al. (2022), they improperly claimed Decaens et al. (2006) was the only previous work on soil biodiversity. Thus, Anthony et al. (2023) conceded that, rather than 25% as claimed by soil “experts”, soils now hold 59% (actually they claim “
an average of 58.5% of life inhabits soil” and “
considering most life on Earth together, the average proportion of species in soil across all three estimates (lower, central, and upper) is 58.5 ± 14.7%, excluding phage”) with a range of 44–74% of global biodiversity. Nevertheless, this conclusion seems unsupported in their
Table 1 data that has an Earth Total of 1.01 x 10
11 species and a Soil total of 1.04 x 10
10 species which is just about 10%. Mainly composed of “Phage”, their figures show a total 1 × 10
11 species with 9.9 × 10
9 (or just 9.9%) of species found in soil.
If these are excluded from their totals, the Earth and Soil taxa values of non-Phage biota are 1 x 10⁹ and 0.5 x 10⁹, respectively: or with ~50% biota in soil. This value, of 500 million soil species, is orders of magnitude lower than values of 1011 soil microbes (mainly Bacteria) reported by Zhao et al. (2022), up to 1023 in Fishman & Lennon (2022) and of 2.1 x 1024 taxa (almost all Bacteria) in Blakemore (2022, 2023). These latter also exclude viruses which are difficult to accommodate within most definitions of what living beings are.
In other words, of their total of 1.04 x 10¹⁰ soil species, just 500 million would be non-phages but, of these, seemingly 4.4 × 10⁸ are “Microbes” composed mainly of 4.3 × 10⁸ unitalicized “Bacteria”. Subtracted from 5.0 x 10⁸ non-phage soil species, implies there are about 0.7 x 10⁸ or 70 million non-phage, non-Bacterial species anticipated in the mean soil taxa total. Discrepancy in their table this figure appears to be higher than Earth’s Total 0.1 x 10⁸ or 10 million non-phage, non-Bacterial species. Such issues require revision.
Like the conclusions herein, Zhao et al. (2022) reasoned that “soil is the most microbiologically abundant (∼1029) and diverse (∼1011) environment on the Earth”. However, this data was updated in Blakemore (2022, 2023) to an abundance of 2.1 x 1030 cells and 2.1 x 1024 soil taxa which compares poorly with Anthony et al.’s central value of just 1.04 × 10¹⁰ total soil taxa. Differing by a factor of two and an order of 1014, or a hundred trillion times, this disparity needs remedy in more properly directed soil research as an urgent priority.
Resolution continues as Wiens (2023) pointed out shortcomings saying: “Mora and colleagues estimated approximately 10,000 bacterial species (roughly the number of described species). They acknowledged that these projections were likely underestimates. Yet, prokaryotes may be a major driver of Earth’s overall species richness. Recent studies have estimated a staggering range of species numbers for bacteria, from low millions, to hundreds of millions, to low trillions. All were based on extrapolations from molecular studies. Clearly, controversies about global biodiversity cannot be resolved without better resolving bacterial richness”.
2.4. Soil Species Extinction Losses
Albeit soil faunal lists grow exponentially, the on-the-ground reality is that our soils are being subjected to severe and accelerating destruction from erosion, desertification, chemical poisoning, capping and rapidly increasing soil acidity – a crucially important issue that is mostly ignored. Soil loss inevitably results in massive species extinction, mostly of microbes (as shown in this report), but also of more obvious macrobes. As a measure of the magnitude of macrobe loss, terrestrial Gastropoda (e.g., slugs or snails) are a useful model of proportionate loss extrapolation with regards to earthworm extinctions.
2.4.1. Earthworm Extinction Losses
An extinction website https://en.wikipedia.org/wiki/List_of_recently_extinct_invertebrates catalogues just three Annelida (earthworms), one each from Tasmania, NZ and Japan (as per Blakemore, 2018a), and 25 Arachnids (spiders). For terrestrial Mollusca (snails & slugs) their link - https://en.wikipedia.org/wiki/List_of_recently_extinct_molluscs has known total of up to 428 extinct Gastropods. Compared to just the three worms some confounding factors are approximately the same number of molluscs are marine or aquatic (although no marine snails are known to be extinct in the last 200 years), but a few earthworms are littoral or aquatic, so the approximations may be reasonable. These are published and presumably verified reports, whereas the true extinction total may be much higher. In both cases not all species currently existing nor all recent extinctions are known: For earthworms an estimated likely global total of 35,000 taxa corresponding to gastropods on soil/land with ~24,000 species but estimated totals also around 35,000 terrestrial species (Barker, 2001).
Although gastropods, mostly superficial feeders, are provisionally excluded from some soil fauna lists, they are like earthworms in two respects: They are wingless thus are often highly endemic, also the predicted number of soil taxa are similar at 30,000–35,000 species each. This is important because the better known and researched molluscs have a published extinction of ~400 species which may reasonably apply similarly to earthworms had they the same research effort as the Molluscs receive. About 42% all researched and reported animal extinctions occurred within this Gastropod group (Lydeard et al., 2004).
How supportable is a >400 earthworm species extinct estimate? Regnier et al. (2015) said: “Using data on terrestrial invertebrates, this study estimates that we may already have lost 7% of the [described living] species on Earth and that the biodiversity crisis is real.” And using this datum, Cardoso et al. (2020) stated: “However, it is likely that insect extinctions since the industrial era are around 5 to 10%, i.e., 250,000 to 500,000 species, based on estimates of 7% extinctions for land snails (Régnier et al., 2015). In total at least one million species are facing extinction in the coming decades, half of them being insects (IPBES, 2019).” Thus, for all ~7,000 currently described megadriles, a 7% loss would be ~490 species extinct. Q.E.D. Similar loss extrapolated to all 30,000 of likely total megadrile earthworms (in the unlikely event anyone attempts to describe them), would be loss of about 2,100 earthworm species. Fixing the issue of potential losses of such an essential soil fauna should be a major priority.
2.4.2. Microbial Extinction Losses
Regarding extinctions, Blakemore (2018a) recorded microbial declines under chemical farming when compared to organic. A recent study by Thaler (2021) presciently noted: “Darwin’s “tangled bank” of interdependent organisms may be composed mostly of other microbes. There is the likelihood that as some classes of microbes become extinct, others evolve and diversify.” And: “Lack of insight into the dynamics of evolution of microbial biodiversity is arguably the single most profound and consequential unknown with regard to human knowledge of the biosphere“.
An extrapolation of the rate of loss of invertebrates, as noted above, is that 23 microbial species may be extinct each second on average, mainly Bacteria (from Blakemore, 2023). This is tenuously supported by a recent paper (Kačergius et al., 2023) that found: “From these results, we can see that 20 years ago, when analyzing soil samples from the same agricultural fields, colonies of culturable bacteria and fungi were grown and up to 1–5 × 10⁶ CFU of organotrophic bacteria were counted, up to 1–2 × 10⁷ nitrifying bacteria. In 2022, we counted up to 1–4 × 10⁵ CFU during culturable bacterial colony counts, which is quite different than 20 years ago.” This represents a 10–1,000 times decline in microbes, or by a factor up to -10,000%, in just 20 years. If so, this should be a major concern for anyone, not just Soil Ecologists.
3. Summary Conclusions and Future Directions
Anthony et al. (2022) claimed their 1.04 × 10
10 soil species estimate is “
approximately two times greater soil biodiversity than previous estimates” but it is considerably less than Zhao et al. (2022:
Figure 3A) who already had 10
11 soil microbial OTU (species) that was revised upwards to 2.1 × 10
24 by Blakemore (2022, 2023). These prior studies surpass their findings.
This review aimed to clarify the scope, and areas of want, in our understanding of vital soil biota. The vast array of faunal, floral, fungal and microbial groups and their roles are mostly unexplored and open for investigation, emphasizing an urgent need to establish a Soil Ecology Institute. Until this is fully realized, in the interim, myriad Aquatic or Atmospheric facilities abound, although the Ocean and Space will remain regardless. Due most pressing issues of topsoil loss and irreversible extinctions, a new shift is realizing the importance and fragility of Soil. A need is for proportionate fund reallocation to support more relevant and directed soil research to be applied for the benefit of all Life on Earth.
Perpetuating earthworm activity in soils, as Blakemore (2022) noted, increases plant growth and provides microhabitats for soil fauna and flora: “microbes increase during digestion and after gut passage in their fresh castings by up to x 1,000 (Lee 1985: 27, 206) further enriching soils.” Presumably the viral abundance is increased too by a multi-fold magnitude due to such actions. Thus, a simple solution to soil degradation is to preserve worms.
Williamson et al. (2017) discuss similar issues, coming to a cogent Conclusion: “Soils represent the greatest reservoir of biodiversity on the planet; prokaryotic diversity in soils is estimated to be three orders of magnitude greater than in all other ecosystems combined… Soils remain the most poorly understood ecosystems on Earth. At the same time, viruses represent the largest pool of untapped genetic diversity and unexplored sequence space on the planet. In this regard, the soil virome comprises an unknown quantity within an unexplored territory: a vast new frontier, ripe with opportunities for discovery.” So, the current report is not alone in realizing such magnitudes, and in urging more support and funds for Soil Eco-taxonomic restoration.
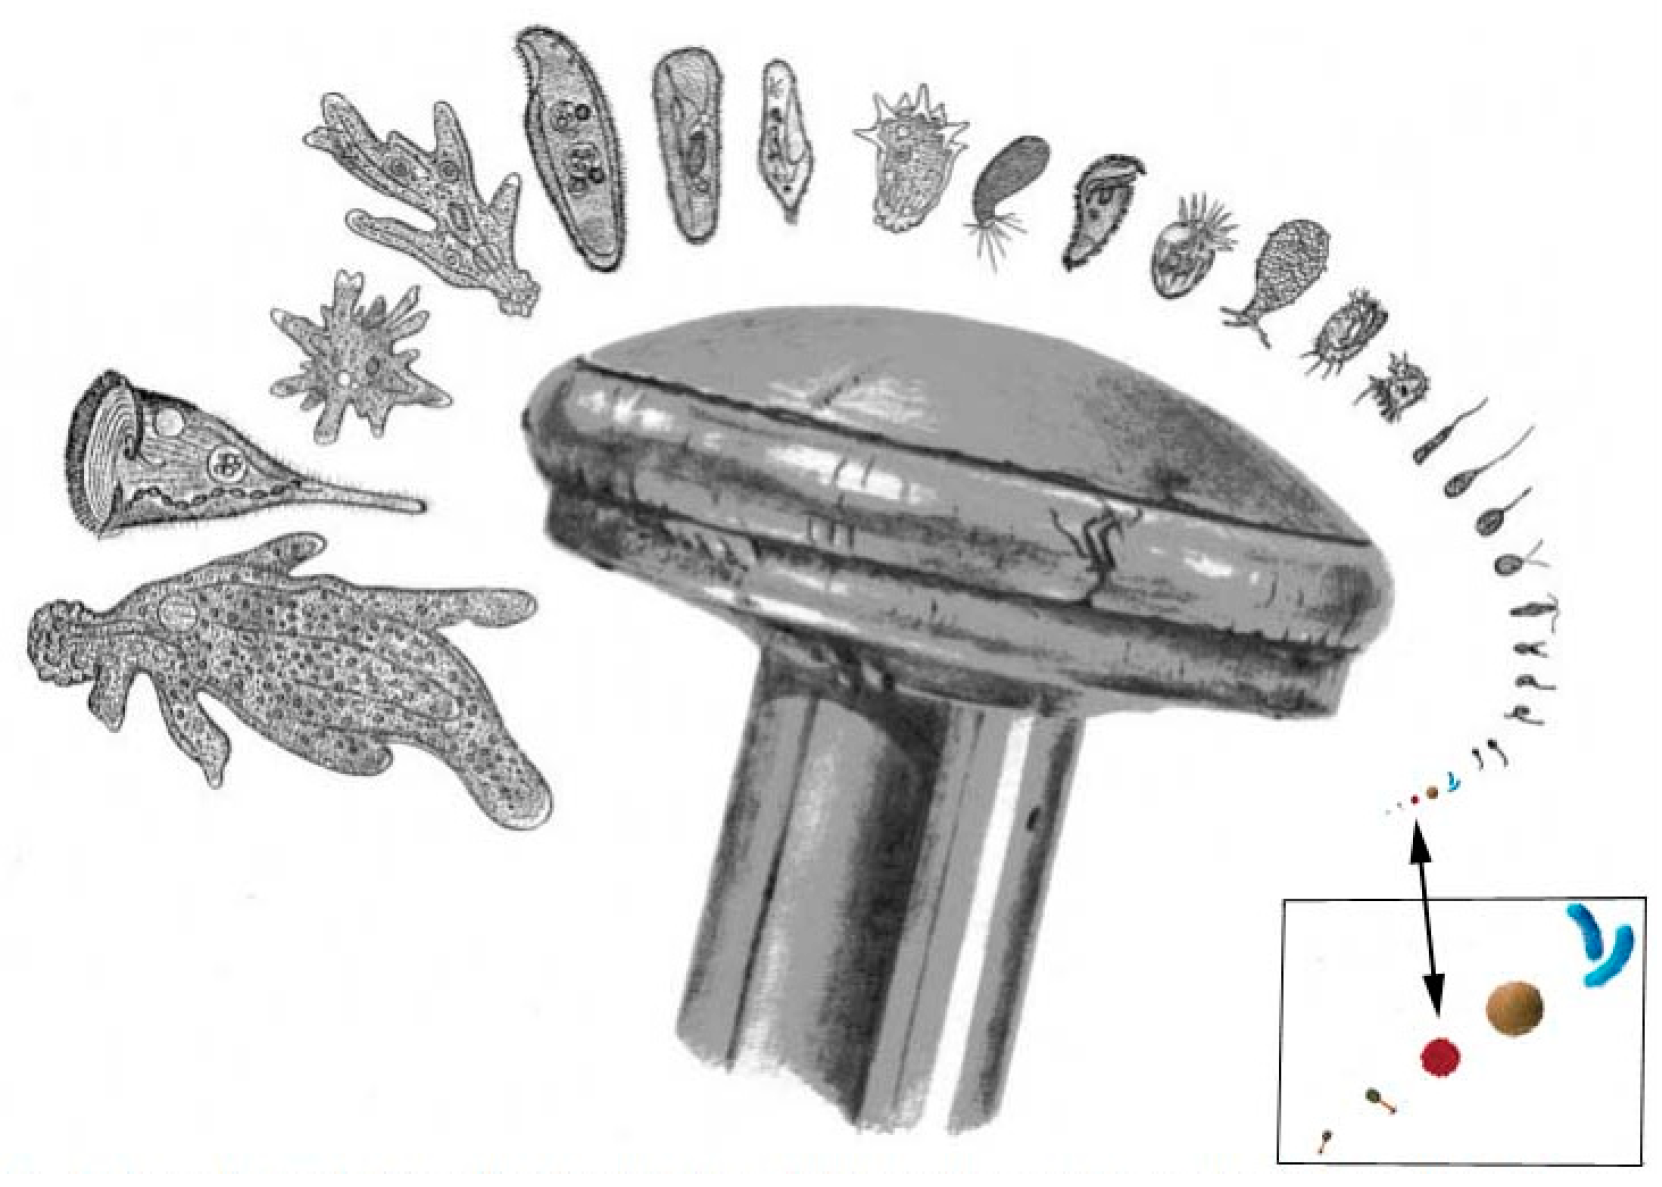
Soil microbiome biodiversity was recognized by Science journal, represented at a pin-head scale, for a wide diversity of protozoa, plus Bacteria, Archaea & viruses (
Figure 9).
