1. Introduction
Systemic autoimmune rheumatic diseases (SARDs) represent a spectrum of life-long, debilitating disorders. Systemic Lupus Erythematosus (SLE) and Rheumatoid Arthritis (RA) lead to increased morbidity and mortality due to multi-organ involvement and impose a significant healthcare burden for the high costs associated with their management. The management of these diseases is complicated by their unpredictable relapsing-remitting or flare patterns, which currently lack reliable predictors for frequency or severity. In this context, measuring levels of autoantibodies (auto-Abs), the primary hallmark of autoimmunity, serves as a critical diagnostic tool [
1,
2,
3].
Alongside autoantibodies, high circulating levels of free light chains (FLCs) - produced in excess of heavy chains during immunoglobulin synthesis by plasma cells [
4,
5,
6,
7,
8] - have been described in SARD patients not only as direct biomarkers of B cell activation but also with a suggested role in the pathogenesis and progression of the disease [
9,
10,
11]. Serum levels of FLCs have been found to correlate with disease activity indices in SLE patients [
10]. Similarly, Deng et al. showed that an elevation in serum FLC levels precedes the development RA and could be useful for monitoring B cell activity and disease progression [
9]. A comparison of FLC levels in RA, SLE, and other SARDs was made by Gulli et al., suggesting their potential as biomarkers for identifying more aggressive forms of the disease [
12].
Emerging research has begun to highlight other biomarkers with significant implications for autoimmunity, including Syndecan-1 (SDC-1) [
13,
14,
15]. Also known as CD138, SDC-1 is a transmembrane heparan sulfate proteoglycan ubiquitously found on the cell surface and nuclear membrane (
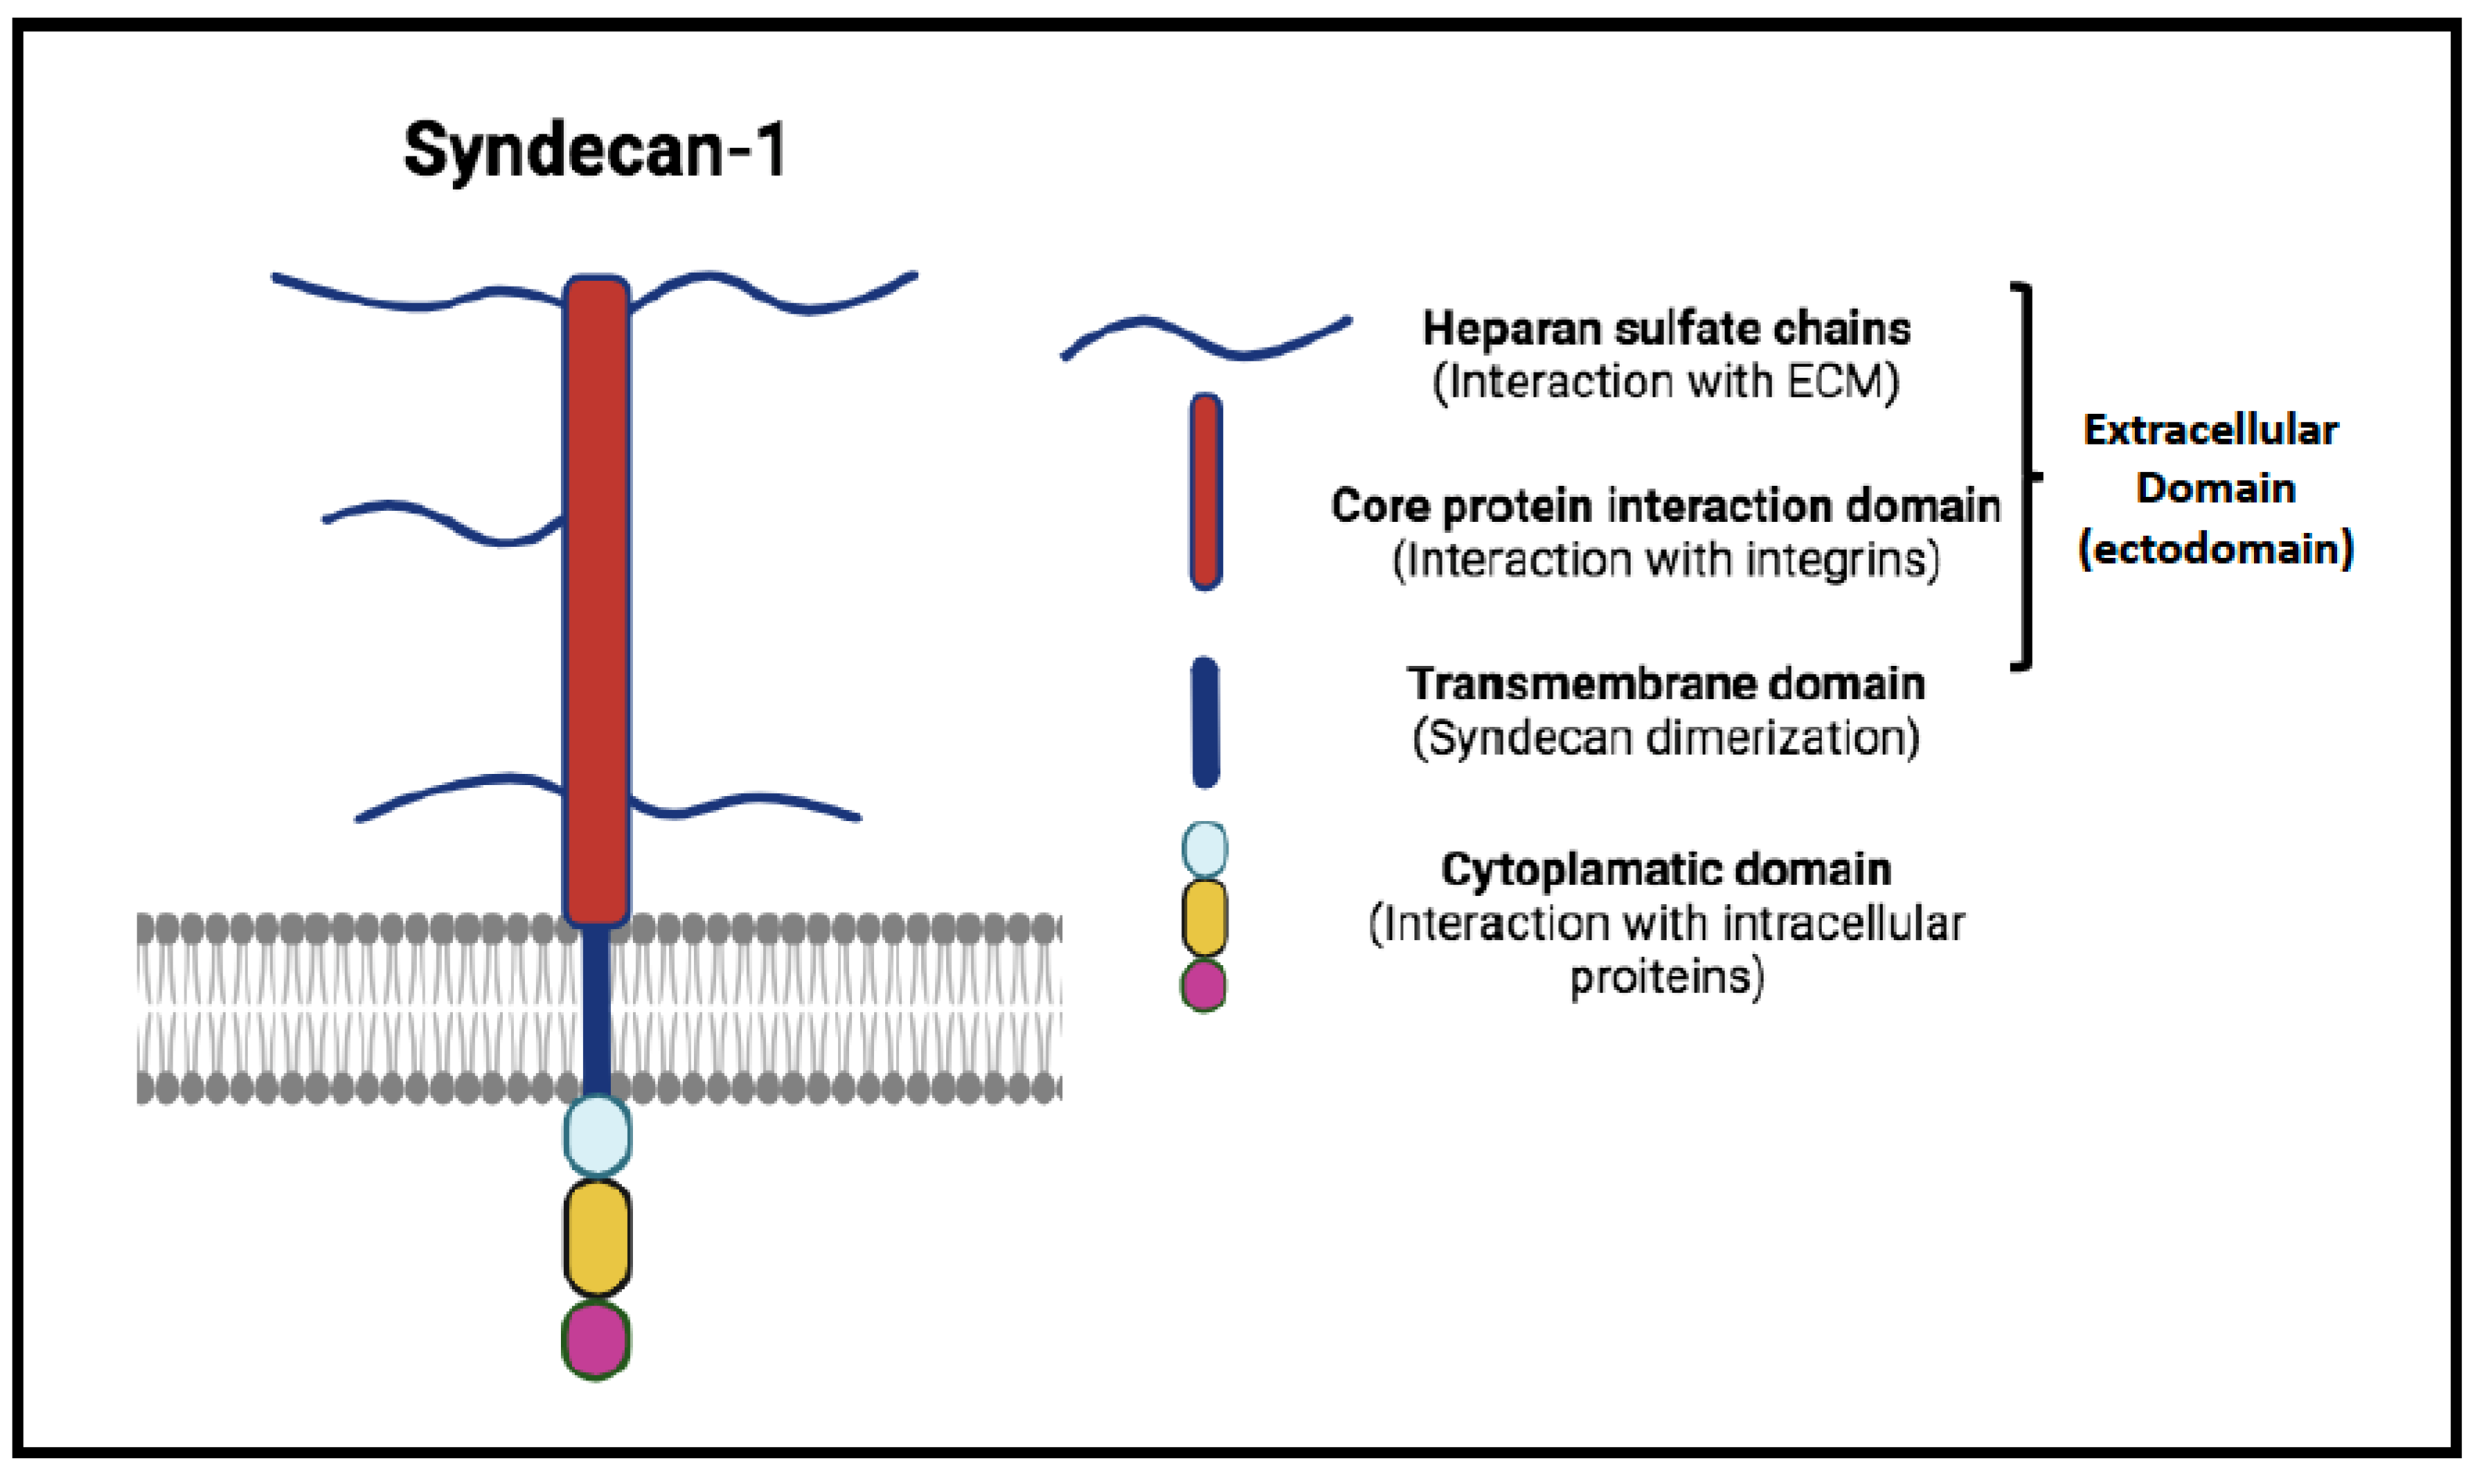
Figure 1) [
16]. It plays a pivotal role in cell adhesion, migration, and signaling, crucial for maintaining tissue integrity and controlling cellular behavior. Its regulation is mediated through proteolytic cleavage by enzymes such as heparanase, which releases its bioactive extracellular domain into the circulation, thereby amplifying its role as a cellular modulator (
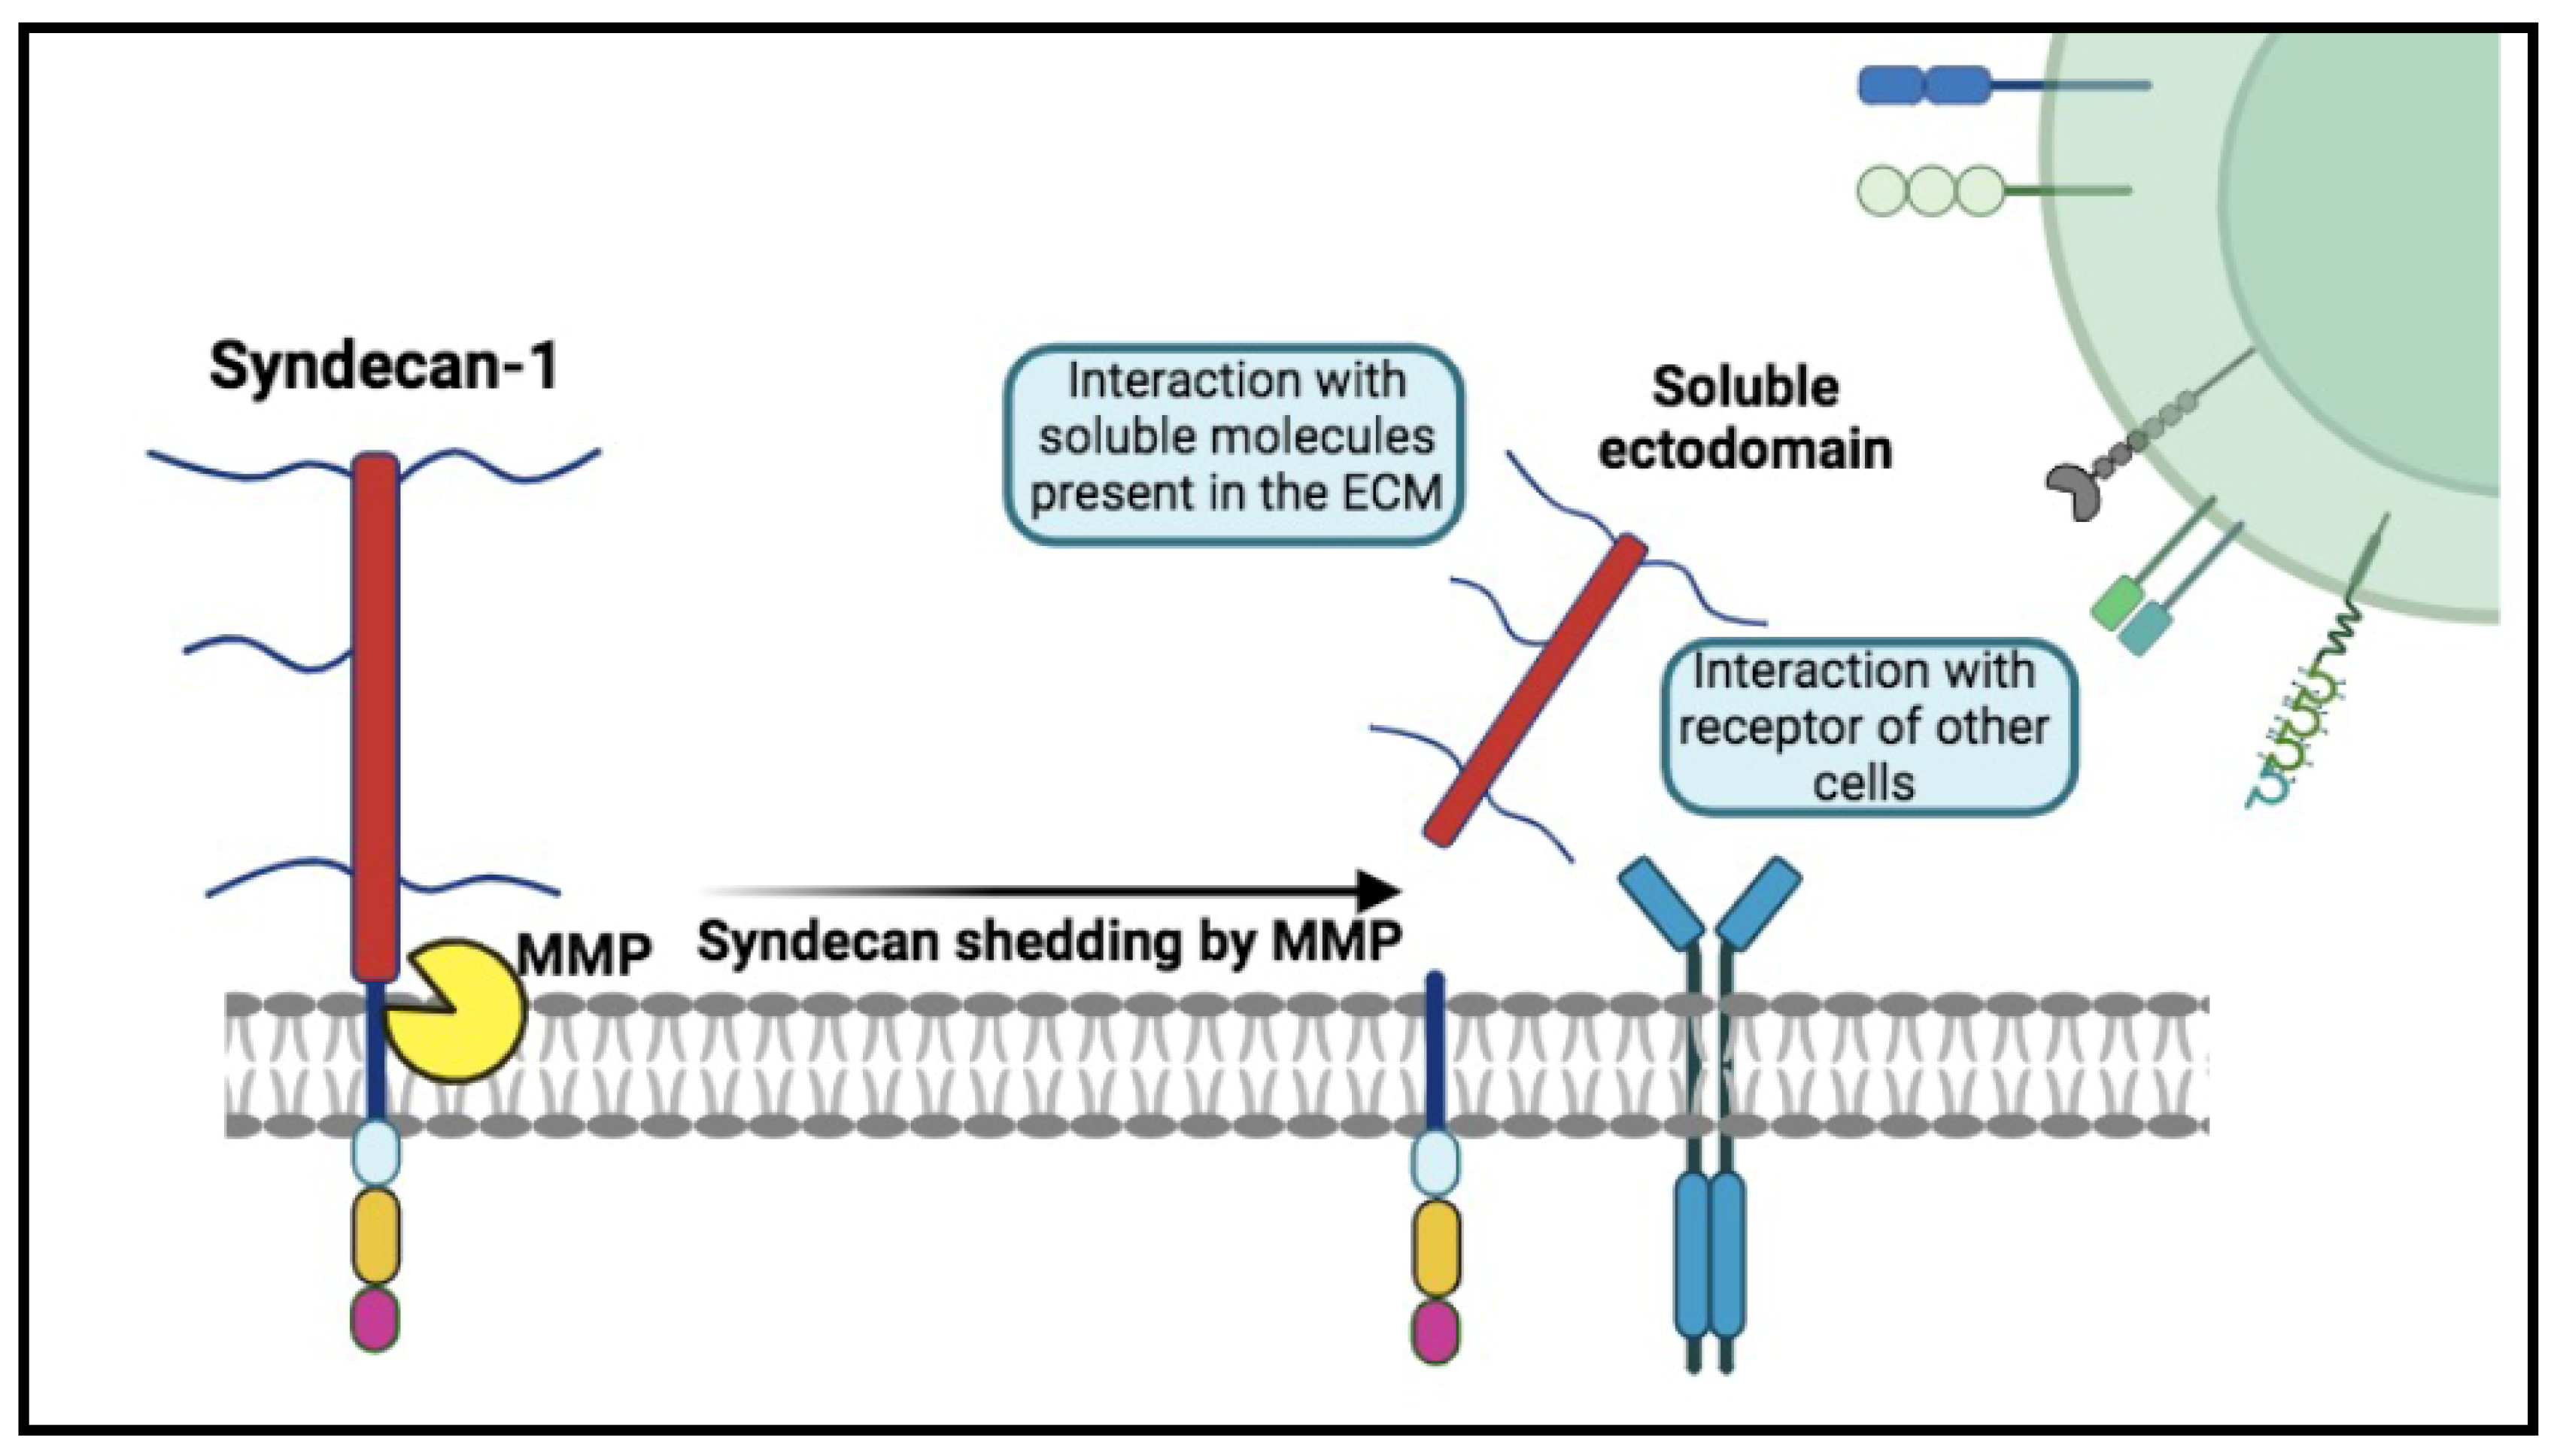
Figure 2). The release of soluble Syndecan-1 (sSDC-1) into the circulation and its accumulation in various tissues can alter the expression and availability of growth factors and signaling molecules, influencing the tissue microenvironment [
17,
18,
19,
20]. Actively shed by most myeloma cells, it has been suggested in the monitoring and follow-up of patients with plasma cells proliferative disorders and explored, in such settings, in parallel with FLCs [
21].
Intriguingly, dysregulation of SDC-1 has been also suggested to play a direct role or act as a trigger in autoimmune diseases [
22,
23,
24,
25,
26,
27,
28,
29]. Systemic inflammation leads to its cleavage and subsequent release into the circulation, a phenomenon particularly noted in SLE, especially among patients with Lupus nephritis. Kim and colleagues have proposed that residual SDC-1 molecules could activate quiescent autoreactive plasma cells to secrete autoantibodies, potentially leading to the development of SLE and at the basis of its flares [
24]. Furthermore, anti-rheumatic treatments in RA have been associated with reductions in serum SDC-1 levels, reflecting decreased shedding of syndecan-1 from the endothelial glycocalyx [
26]. This observation underscores the potential of SDC-1 levels not only as biomarkers for disease activity and severity but also as indicators of therapeutic response in RA and SLE, providing a new dimension to understanding and managing these complex autoimmune conditions.
At the best of our knowledge, FLCs and SDC-1 levels have been never investigated in parallel in the same group of SARD patients. In this study, we explored their increase in two groups of RA and SLE individuals in an active phase of disease, aimed to evaluate their potential as biomarkers and to discuss an existing relationship.
2. Results
In
Table 1, we present demographic variables (age and gender) alongside plasma levels of syndecan-1 (SDC-1) and free light chains (FLC), specifically k-FLC, lambda-FLC, and their k/λ ratio, measured in healthy donors (HD), rheumatoid arthritis (RA) patients, and systemic lupus erythematosus (SLE) patients.
The observed values are compared across the three groups using a non-parametric Kruskal-Wallis test.
Table 1 highlights statistically significant differences in age among HD patients (median age 45 years), SLE patients (median age 48 years), and RA patients (median age 56 years). No statistically significant differences are observed regarding gender.
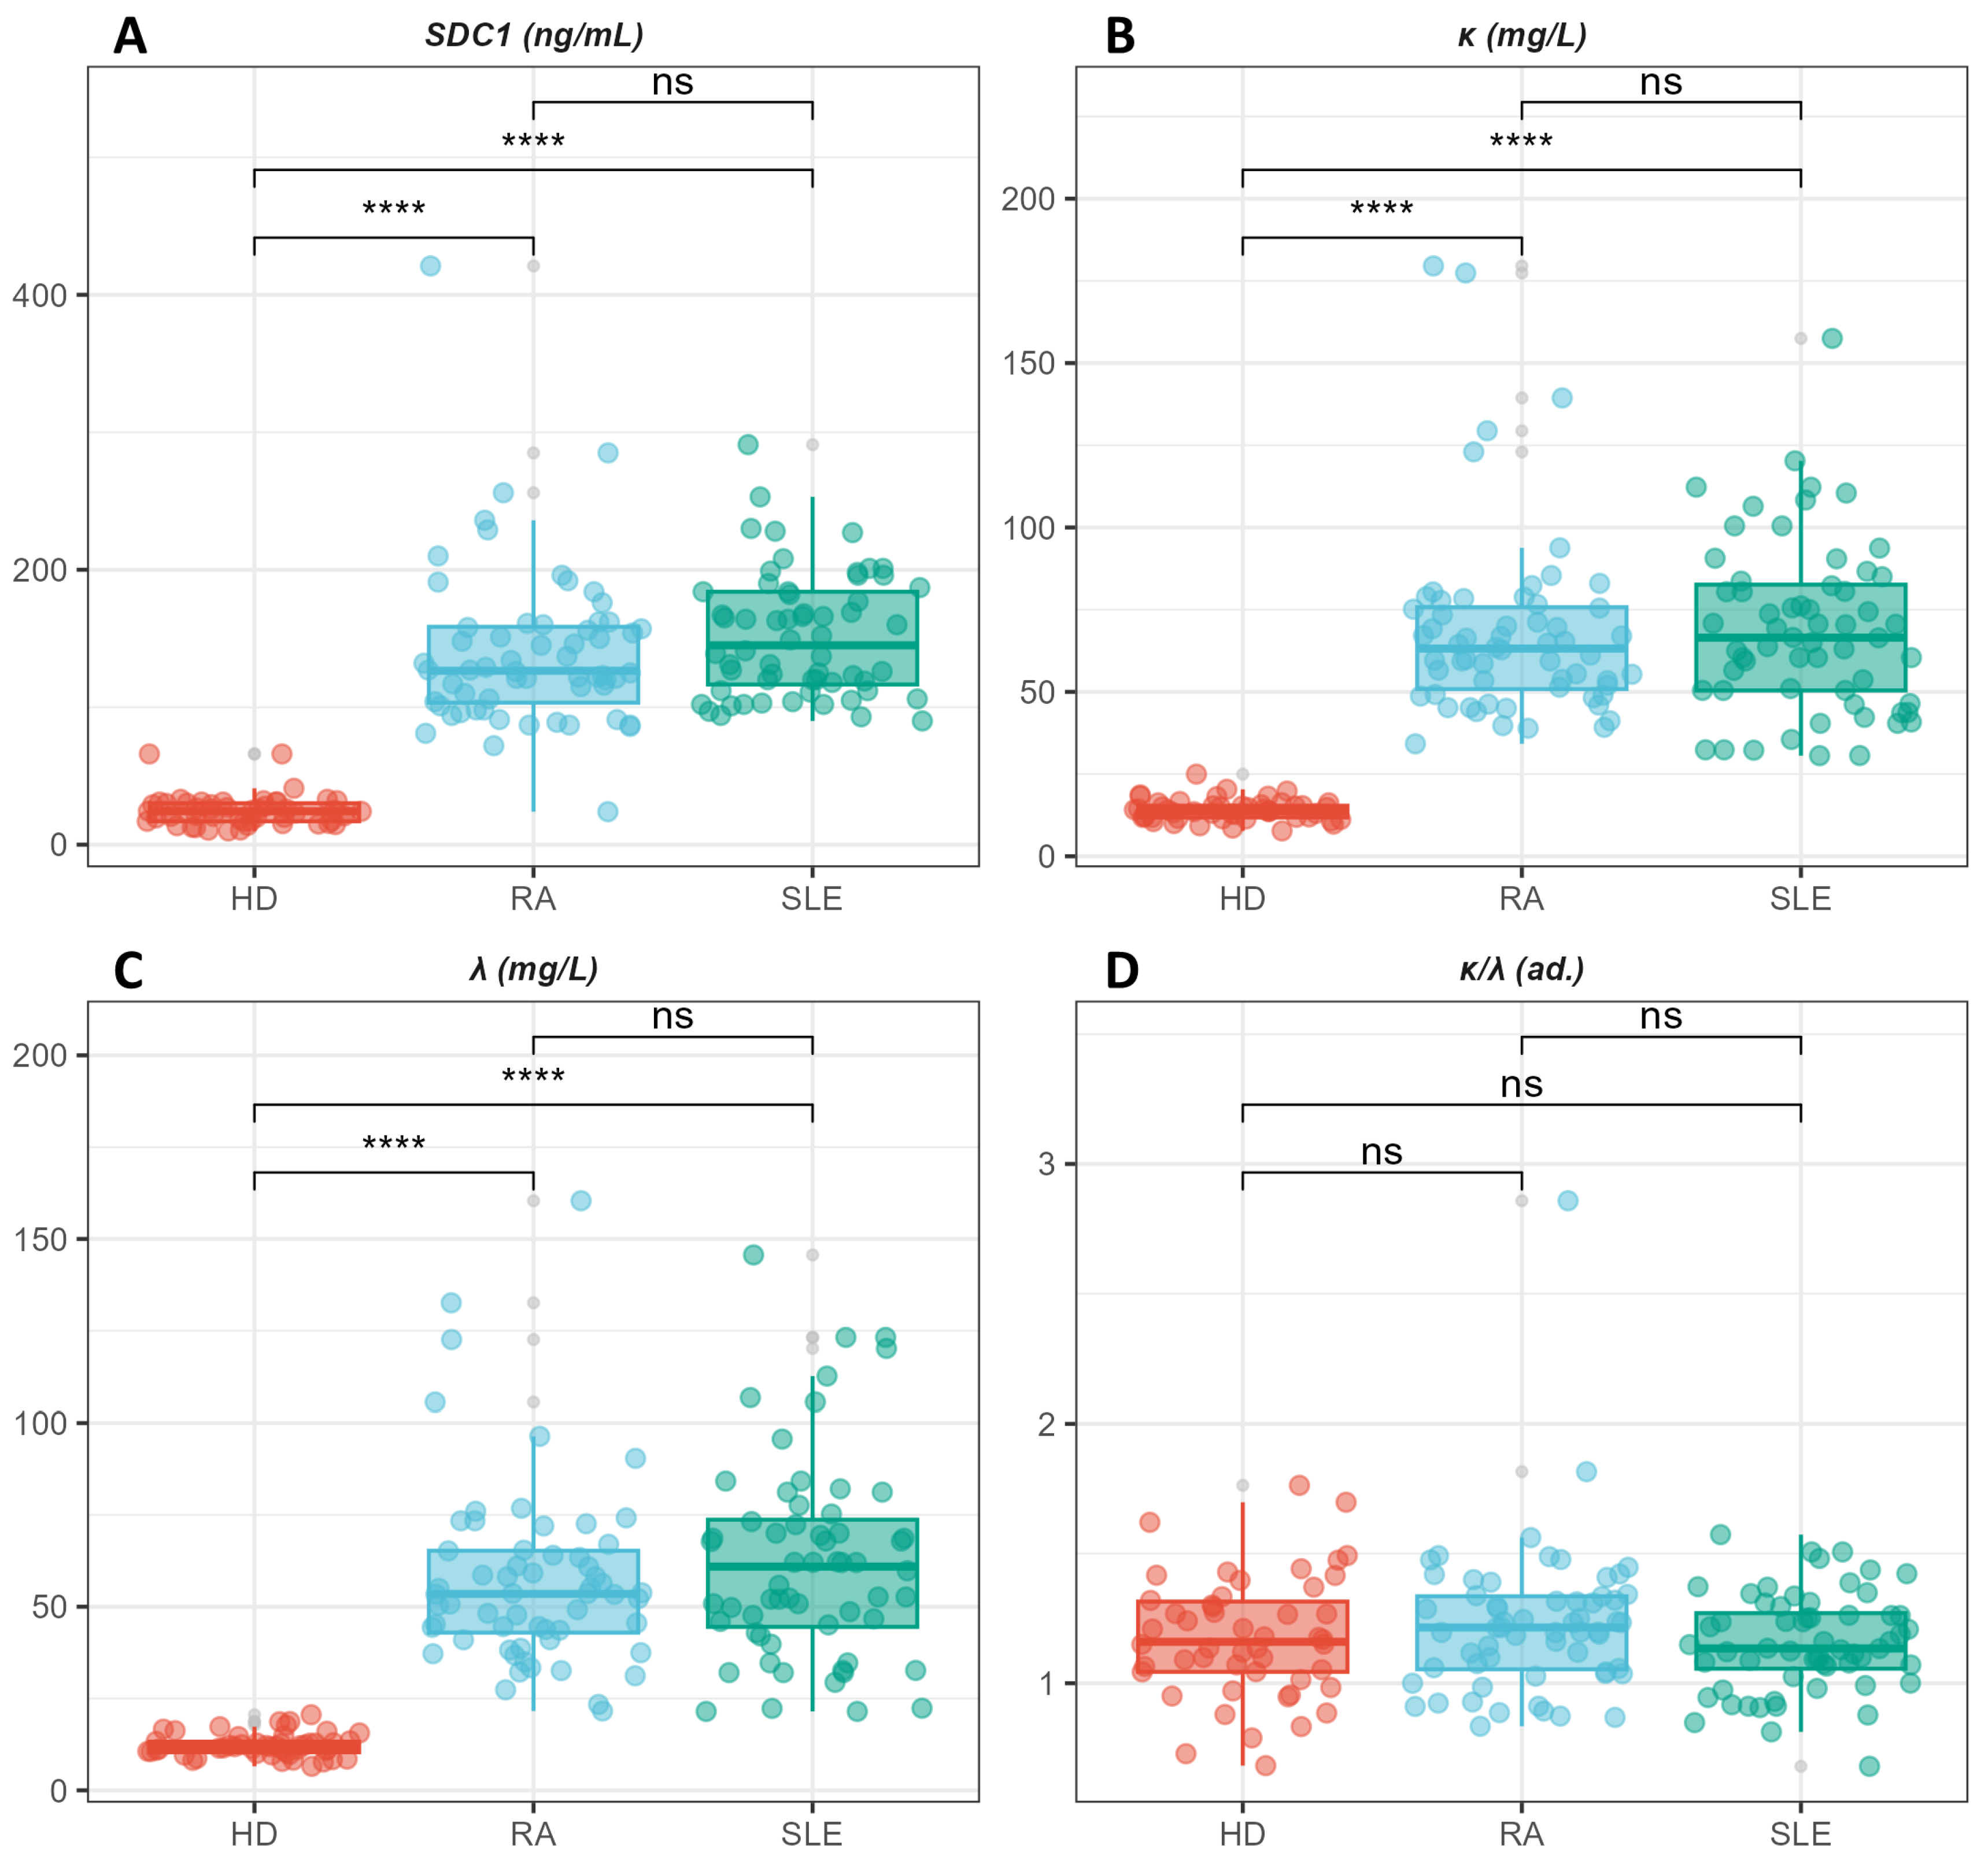
Statistically significant differences are observed in the levels of SDC1, k-FLC, and λ-FLC, which are higher in the pathological groups (RA and SLE) compared to healthy donors. Conversely, no statistically significant difference is observed in the k/λ ratio among the three groups.
The post-hoc analysis conducted with a Bonferroni-corrected Wilcoxon-Mann-Whitney U test points out that statistically significant differences are attributable to a distinction between the two pathological groups and healthy controls. In contrast, no statistically significant differences are observed between RA and SLE patients, despite the latter shows slightly higher values of all the investigated markers.
The potential confounding effect of age on the above-discussed univariate analysis is assessed in
Table 2, where we show the outcomes of three bivariate linear regression models. In these models, age, and group membership (HD, SLE, RA) are used as explanatory variables, while syndecan-1 (model 1), k-FLC (model 2), and λ-FLC (model 3) are employed as dependent variables. To achieve this, ages were centred on the mean age of the recruited subjects.
The models, conducted using the HD group as a reference, are all extremely significant with a p-value < 2.2 × 10⁻¹⁶ and with a substantial adjusted-R2 of approximately 50% of the dependent variable variance or greater. Specifically, the regression indicates that the coefficients related to the patient's clinical status (SLE, or RA) are highly statistically significant, while age is not significant. This suggests a small confounding effect due to age in the previously discussed univariate results, despite the high significance of this variable. The coefficients for RA and SLE offer an age-adjusted estimate of variations in the levels of the investigated markers compared to levels measured in a healthy donor with the mean age. Accordingly, the intercept provides an estimate of the levels of the investigated parameter in a healthy subject with an age equal to the mean age of the recruited subjects. The regression outcomes enable us to quantify an average significant increase of 113.5 (127.15) ng/ml, 53.9 (55.1) mg/dl, and 46.0 (50.2) mg/dl in syndecan-1, k-FLC, and λ-FLC in subjects with RA (SLE) compared to HD.
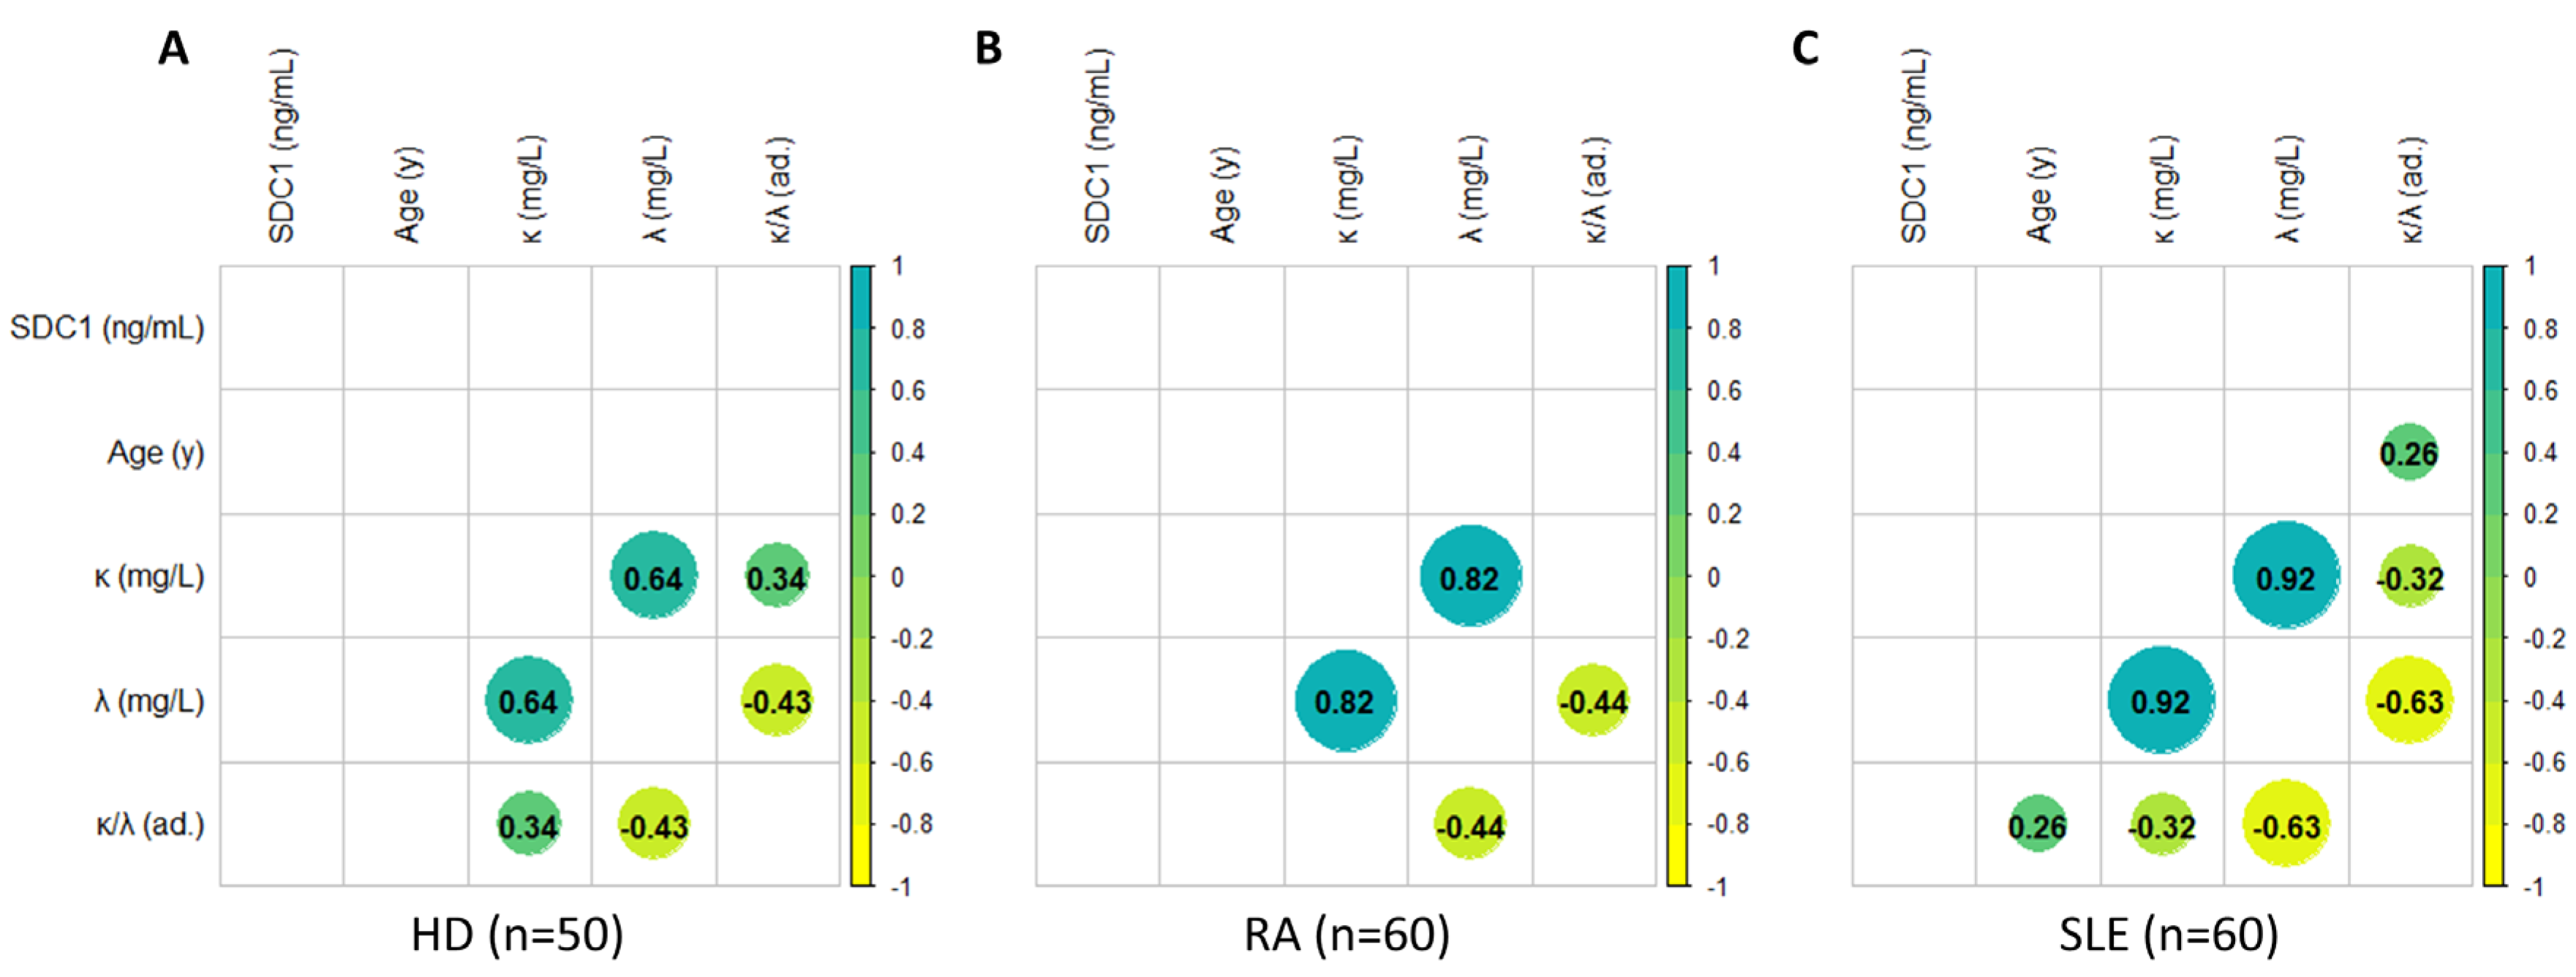
In
Figure 4, we present an analysis of correlation between demographic parameters (age) and plasma levels of syndecan-1 and FLCs (including k, λ, and their ratio). Consistent with the regression model in
Figure 4, no correlation is observed between age and syndecan-1 levels, nor with FLCs, which, however, exhibit mutual correlations among themselves, as expected. Additionally, the analysis does not reveal significant correlations between syndecan-1 levels and FLCs, neither k, nor λ, nor k/λ.
3. Discussion
In this paper, we focus on investigating the role of SDC-1 and FLCs as biomarkers for SARDs, using SLE and RA as model systems.
SDC-1, a member of the transmembrane proteoglycans, plays a significant role in the context of autoimmune diseases, with its complex involvement in both inflammation and tissue repair [
15,
20,
22,
25,
30,
31,
32]. Its ability to interact with a wide range of ligands is closely associated with its ectodomain, which encompasses chondroitin and heparan sulphate chains (
Figure 1) [
20]. This structural feature facilitates engagement with various cellular and extracellular molecules, including growth factors, adhesion receptors, cytokines, chemokines, proteinases, and other components of the extracellular matrix. Its predominant expression on epithelial and endothelial cells, as well as on plasma cells, coupled with its versatility in cellular signalling, positions SDC-1 as a key regulator in biological systems. The outcome of inflammation depends to the balance of pro anti-inflammatory signals so and, indirectly, to the persistence of the stimulus. Despite this pivotal role, the mechanisms behind SDC-1 action in inflammation and autoimmunity are still unclear and are a matter of debate in the literature. From the overall data, SDC-1 seems to be engaged for the initial recruitment of leukocyte whereas it negatively dictates the persistence of a sustained migration, to maintain an homeostatic response [
31,
33]. This complexity arises partly from its multifaceted behaviour, as it is capable of exhibiting both anti-inflammatory and pro-inflammatory properties depending on the tissue context, the investigated disease, and whether its soluble or membrane-bound form is involved [
31]. SDC-1 can be released from cells through the process of shedding (
Figure 2) in response to - among other factors - cellular stress, leukocyte-derived protease accumulation, and growth factor release, helping to maintain a proteolytic and growth factor balance, as well as mediating inflammation [
34]. Accordingly, the release of SDC-1 has been observed in various pathological conditions, suggesting its role as a potential biomarker for these diseases [
33].
In our study, we observed elevated levels of soluble SDC-1 in RA patients compared to controls, with an age- and gender-adjusted difference of approximately 114 ng/mL. These findings align with emerging data, primarily derived from animal studies, that suggest a potential role for this proteoglycan in the pathophysiological processes of RA. Specifically, research by Salminen-Mankonen et al. [
35] demonstrated an increase in SDC-1 expression in chondrocytes from cartilage that was damaged in the early stages of osteoarthritis, suggesting a potential involvement in the mechanisms that repair damaged joints. Jurjus et al. found that the absence of SDC-1 in a collagen II–induced arthritis mouse model led to more severe symptoms of rheumatoid arthritis, characterized by increased bone erosion, cartilage destruction, inflammation, and elevated TNF-α levels, confirming the SDC-1 protective role in this pathological setting [
15]. Consistently, it has been shown that antirheumatic drugs decrease the serum level of SDC-1, which might reflect a decrease in shedding [
26]. At variance with our results, a different scenario is presented in [
22], where the SDC-1 levels were comparable between RA patients and controls. This likely arises from specific difference in the clinical baseline of the recruited patients. In our case, indeed, reported values regard patients with untreated RA in an active state, a condition that might account for our elevated SDC-1 values in patients.
Notably, SDC-4, more often that SDC-1, is associated with RA [
36] a fact that might be related to the tendency of syndecans to influence the expression of each other [
31].
We also report elevated levels of SDC-1 in SLE patients compared to control subjects. These elevated levels support the role of SDC-1 in the pathogenesis of SLE, consistent with both clinical literature and experimental model findings. Specifically, Minowa et al. demonstrated that serum SDC-1 levels were significantly higher in SLE patients with active disease compared to those with inactive disease, and these levels were positively correlated with the percentage of CD138-positive plasma cells and the SLE Disease Activity Index (SLEDAI) [
37].
These findings are corroborated and expanded upon by Kim et al.[
22], who observed that serum SDC-1 levels were significantly higher in SLE patients with nephritis compared to those without. Similarly, a study focusing on Egyptian juvenile JSLE patients reported comparable findings regarding the correlation between soluble SDC-1 levels and disease activity [
25].
The overall consistency across various studies, including our own, further supports the utility of serum Syndecan-1 as a biomarker in SLE patients.
Interestingly, the literature indicates some uncertainty about whether the increase in soluble SDC-1 levels in SLE patients is only indicative of renal activity or if it also plays a role in glomerular pathology [
25]. Our results, which include data from SLE patients without any sign of renal damage, lean towards the latter.
As discussed previously, aside from autoimmune diseases, elevated levels of SDC-1 in serum have been associated with conditions that involve the expansion and activation of plasma cells, such as multiple myeloma [
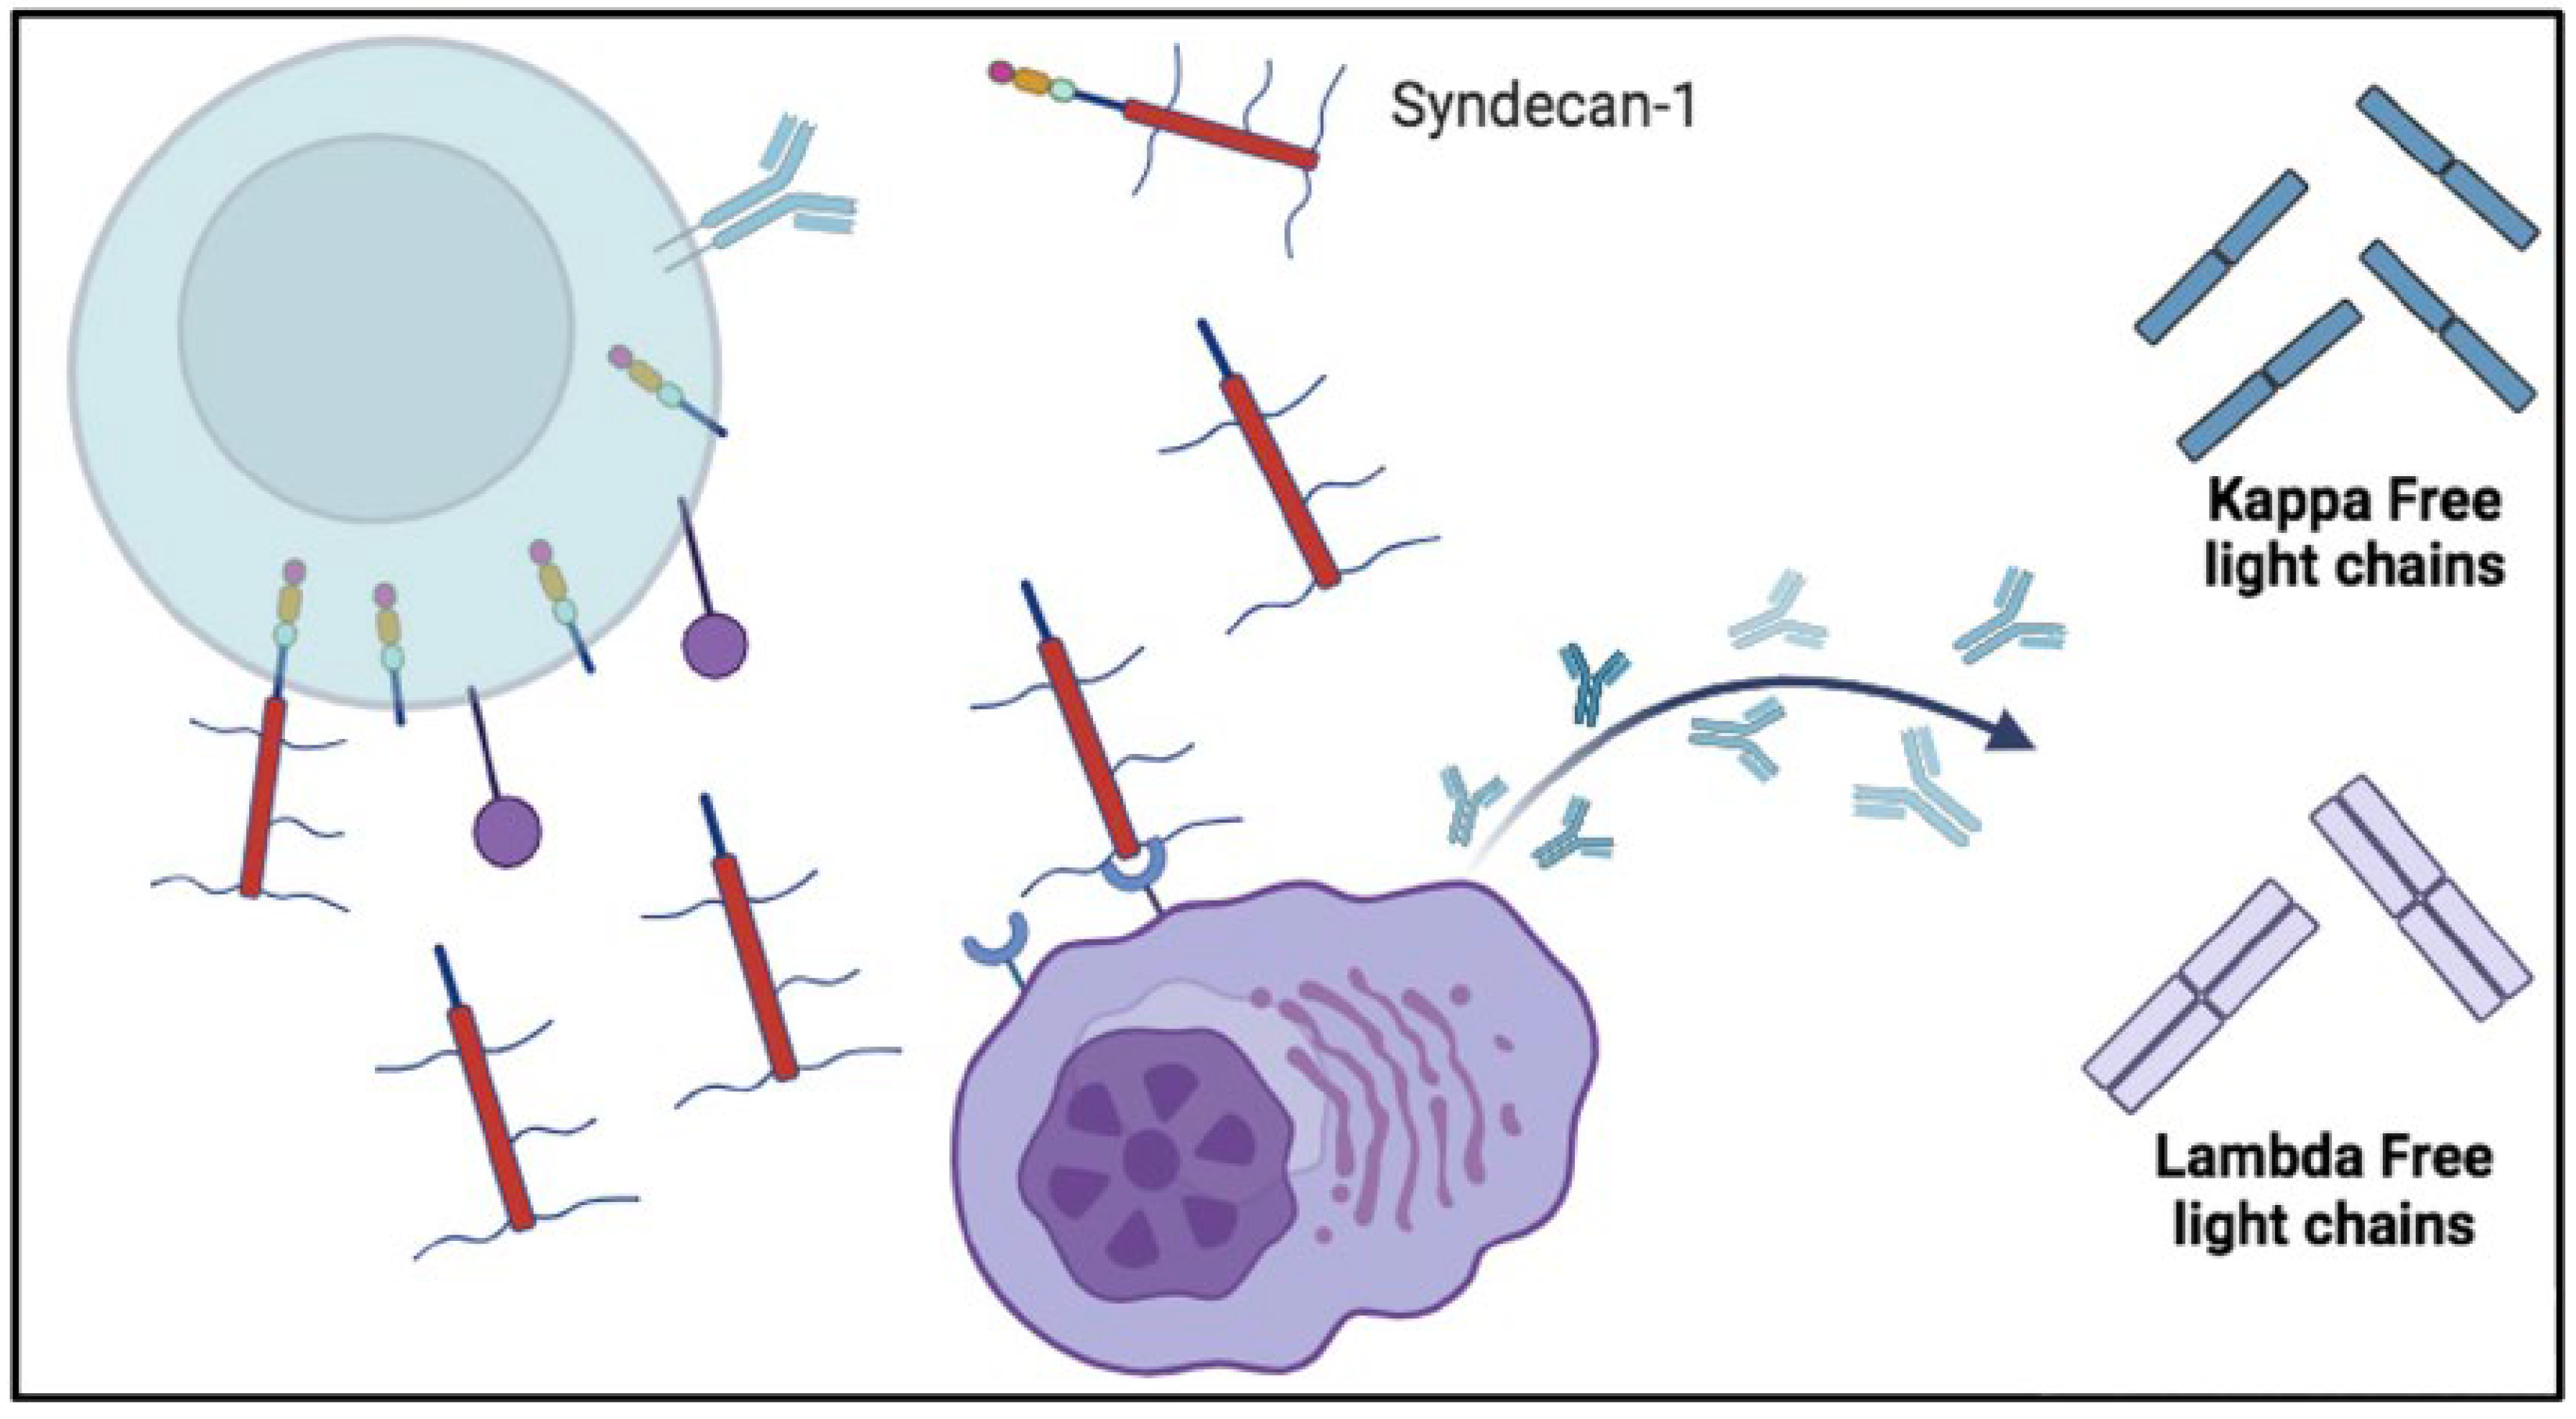
19]. Similarly, it has been suggested that high serum levels of SDC-1 in SLE could also be linked to an increased activation of plasma cells. Interestingly, the literature indicates a complex interplay between serum SDC-1 and activated plasma cells, which is likely bidirectional in nature. On the one hand, released SDC-1 into plasma remains active, affecting the behaviour of plasma cells. A possible mechanism behind this modulation is schematically drawn in
Figure 5. On the other hand, the serum levels of SDC-1 could be augmented as a consequence of plasma cell activation [
37]. Activation of plasma cells, in turn, contributes to the pathogenesis of SLE and RA by producing pathogenic autoantibodies [
38], and consequently, an excess of kappa and lambda FLCs. Indeed, aside from high levels of SDC-1, we also find elevated levels of kappa and lambda free light chains compared to controls in our patients. Notably, as these are not lymphoproliferative disorders, the kappa/lambda ratio is not altered.
While the activation of plasma cells likely contributes to the elevated levels of all markers investigated in this study, we do not observe a direct correlation between SDC-1 and the FLCs when examining the three groups separately—namely the controls, the SLE, and the RA. The absence of a direct correlation might be due to different mechanisms responsible for their release: FLCs as direct biomarker of B cell activation in systemic autoimmune diseases, well characterized by in intensive auto-Abs productions; SDCs as the signal of a chronic inflammation responsible of tissue damage triggered by the autoantigen dysregulating SDC physiological role of stop signal that could concur to sustain the expansion of an autoreactive clone of plasma cells (
Figure 5) [
31].
In the era of precision medicine characterized by a widely desire of new and reliable biomarkers to parallel each step of pathogenetic mechanisms of disease, the major goal of our findings is to keep in connection for the first time the level of FLCs with SDC-1 in the setting of systemic autoimmune rheumatic disorders; however, the elucidation of molecular pathway involving these two biomarkers deserves a farther investigation.
4. Patients and Methods
4.1. Patients
The study retrospectively analyzed sera from 120 patients (60 RA, 60 SLE) enrolled by the Dipartimento di Medicina Interna e Gastroenterologia, Fondazione Policlinico Universitario “A. Gemelli” I.R.C.C.S. (Rome, Italy); samples were collected between January 2010 and December 2016 for the determination of FLC and SDC-1 measurements.
Sera from 50 sex- and age-matched healthy blood donors (HD) were tested as control.
Inclusion criteria of RA patients: positivity for antibodies against cyclic citrullinated peptide (anti-CCP) at high levels, for Rheumatoid Factor (RF) and antinuclear antibodies (ANA) detected by indirect immunofluorescence assay (IIFA) on HEp-2 cells with a titer of 1:320 and with pattern coarse speckled [
15].
Inclusion criteria of SLE patients: ANA positive at titres ≥1:640 with homogeneous pattern, positive with an immunofluorescence assay for antibodies to native DNA, using the kinetoplast of
Crithidia luciliaea substrate [
15].
Subjects with diagnoses of plasma cell dyscrasia disorders, chronic diseases, cancer, and renal failure (estimated glomerular filtration rate was < 60 ml/min/1·73 m2) were excluded.
All the enrolled patients fulfilled the latest versions of the classification criteria for SLE and RA [
16,
17].
Demographic (age and sex), clinical and laboratory parameters were collected retrospectively. The clinical and laboratory features were considered from diagnosis to enrollment with absence of immunosuppressive therapy in the last six months, pregnancy, and breastfeeding.
4.2. Laboratory investigation
Sera were collected and stored at -80° C and all samples were tested at the same time. RF measurements were performed according to the manufacturer’s protocol on the BNII automated analyzer from Siemens Healthcare (Erlangen,Germany). An RF value of > 20 IU/ml was considered positive. Anti-CCP IgG evaluation was considered according 4 categories: negative (<20 units), weak (20–40 units), moderate (40–60 units), and strong (>60 units), employing a chemiluminescence immunoassay (CLIA) using QUANTA Flash® CCP3 (Inova, Werfen, San Diego, CA); serum levels are reported in U/ml, according to the manufacturer's instructions. Antinuclear antibodies (ANA) titres were determined by an indirect immunofluorescence assay (IIFA) on a HEp-2 cells line. ANA were considered positive at titres ≥1:80 [
15].
The detection of ANA with homogeneous pattern by IIFA was followed by a synthetic double strength DNA chemiluminescent immunoassay, and serum levels were reported in U/ml (9.8–35 negative; 35–45 uncertain; >45 positive), according to the manufacturer's instructions. Positive specimens were evaluated for antibodies to native DNA by an immunofluorescence test using the kinetoplast of Crithidia luciliaea substrate; this method set up for confirmation, has been assessed and appeared to have great specificity as a diagnostic test for SLE. FLCs were assessed by means of turbidimetric assay (Freelite Human Kappa and Lambda Free Kits, The Binding Site, Birmingham, UK) and performed with the Optilite® instrument (The Binding Site, Birmingham, UK; free κ normal range: 3.3–19.4 mg/l; free λ normal range: 5.7– 26.3 mg/l). A κ/λ ratio < 0.26 or > 1.65 was considered abnormal, according to the manufacturer’s recommendations; calibrators and controls were diluted to the appropriate concentrations for serum determinations, following the manufacturer’s instructions.
Serum SDC-1 levels were determined using ELISA kits specific for human SDC-1 (Diaclone Research, France). The assay was performed according to the manufacturer’s instructions, as follows: 100 ml of serum were added to pre-coated wells and incubated with anti-SDC-1 biotinylated antibody. The wells were washed, and horseradish peroxidase-streptavidin conjugate was added. After washing, the addition of substrate was on, the reaction was blocked, after 20 minutes and the absorbance was read at 450 nm. Serum concentrations of SDC-1 were expressed as ng/mL.
The analysis was performed by an operator without knowledge of the clinical information of handled sample; FLCs and SDC-1 were measured at least twice for each patient, with reproducible results.
4.3. Ethics statement
The study was approved by the ethical committee of Università Cattolica of Rome (Immuno-HVR; ID 2080). The protocol was carried out in accordance with the Declaration of Helsinki as revised in Seoul 2008. Upon assessment of the importance of the study and that the information resources were appropriately expressed; patients and HD gave their informed consent.
4.4. Statistical Analysis
The data visualization and statistical analyses were conducted using the R software package (version 4.2.1). Discrete variables were presented in terms of absolute frequency and/or percentages. Continuous variables underwent normality testing using the Shapiro-Wilk test and visual inspection of the QQ plot (data not shown). Several variables, particularly mechanical parameters, displayed significant deviations from normality. Consequently, continuous variables were represented as the median and interquartile range (Q3-Q1). Tabular data were reported using the R package “gtsummary” [
39]. For the comparison between the two recruited groups, the Chi-square test or Fisher's exact test was employed for categorical variables, and the Wilcoxon-Mann-Whitney U test was used for continuous variables. Statistical significance was set at p < 0.05.
Correlations among biochemical and clinical markers were assessed using Spearman’s correlation coefficients. Only statistically significant correlations, identified through a power analysis, were reported. The significance level was set to p < 0.05. Significant correlation coefficients were organized in a correlation matrix using the R package “Corrplot,” following procedures outlined in previous papers [
40,
41,
42].
Figure 1.
Syndecan-1 structure. Syndecan-1 is composed by three main domains: the extracellular domain (ectodomain) consists of core protein interaction domain and heparan sulfate chains that interact with growth factor and fibronectin; a single transmembrane domain that drives syndecan dimer formation, and the highly conserved cytoplasmic domain (composed of three sub-domains) that allows the interaction with intracellular proteins.
Figure 2.
The mechanism of Syndecan-1 shedding. The process involves the proteolytic cleavage of Syndecan-1 ectodomain near the plasma membrane domain by enzymes, such as metalloproteinases (MMP). Heparan sulfate (HS) chains can be additionally cleaved by heparanase. Soluble syndecans-1 are in a dynamic interplay with the extracellular matrix (ECM), cytokines, chemokines, several receptors, and various growth factors, for which they act as co-receptors, thus mediating numerous signaling pathways.
Figure 3.
Box plot analysis illustrating levels of syndecan-1(A), k-FLC (B), λ-FLC (C), and their ratio (D). Post-hoc analysis, using a Bonferroni-corrected Wilcoxon-Mann-Whitney U test, highlights significant differences between the pathological groups and healthy controls, while no significant differences are observed between RA and SLE patients.
Figure 4.
Correlations among demographic parameters (age) and serum levels of Syndecan-1, and FLC (κ, λ, and their ratio) in HD (A), RA (B), and SLE (C) patients. Correlations are assessed using the Spearman coefficient. The data are represented using a dual scale, employing dot size in the matrix and its coloring. Specifically, the larger the dot size and the more intense its color, the stronger the correlation, whether positive or negative. Positive correlations are indicated in green, while negative correlations are shown in yellow.
Figure 5.
Possible involvement of soluble syndecan-1 in the production of free light chains (FLC). The shedding of syndecan-1 could leave to activate autoreactive plasma cells and produce free light chains (FLC). Once syndecan-1 has been shed by enzymes, it enters in the circulation. In the bloodstream it can interact with plasma cell receptors and cause excessive production of autoantibodies that is associated by an excess of Kappa and Lambda FLC synthesis. Lambda free light chains are released as dimers ad Kappa free light chains as monomers.
Table 1.
Demographic Characteristics and Plasma Biomarker Levels in Healthy Donors (HD), Rheumatoid Arthritis (RA) Patients, and Systemic Lupus Erythematosus (SLE) Patients. Median ages were 45 years (HD), 56 years (RA), and 48 years (SLE). Plasma levels of syndecan-1 and specific free light chain (FLC) subtypes, namely k-FLC and lambda-FLC, along with their k/l ratio, were measured.
| Variable |
N |
HD, N = 501
|
RA, N = 601
|
SLE, N = 601
|
p-value2
|
| age (years) |
170 |
45 (38, 54) |
56 (52, 65) |
48 (41, 54) |
<0.001 |
| gender |
169 |
|
|
|
0.12 |
| F |
|
31 (63%) |
48 (80%) |
46 (77%) |
|
| M |
|
18 (37%) |
12 (20%) |
14 (23%) |
|
| SDC-1 (ng/mL) |
170 |
24 (17, 30) |
126 (103, 158) |
145 (116, 184) |
<0.001 |
| k-FLC (mg/L) |
170 |
14 (12, 15) |
63 (51, 76) |
66 (50, 83) |
<0.001 |
| λ-FLC (mg/L) |
170 |
12 (10, 13) |
54 (43, 65) |
61 (45, 74) |
<0.001 |
| k/λ |
170 |
1.16 (1.04, 1.31) |
1.22 (1.05, 1.34) |
1.13 (1.06, 1.27) |
0.4 |
|
1 Median (IQR); n (%) |
|
2 Kruskal-Wallis rank sum test; Pearson's Chi-squared test |
Table 2.
multiple linear regression models with syndecan-1 (Model 1), k-FLC (Model 2), and λ-FLC (Model 3), as functions of centered age (obtained by subtracting the mean age of recruited subjects from each patient's age), considering the presence of a diagnosis of RA or SLE. The regressions are conducted using healthy donors (HD) as a reference.
| |
Model’s coefficients |
|
|
|
| |
Model 1 |
Model 2 |
Model 3 |
|
|
| Independent/Dependent |
Syndecan-1(ng/ml) |
k-FLC (mg/dl) |
λ-FLC (mg/dl) |
|
|
| variable |
|
|
| Intercept (SE) |
25.5*** |
14.2*** |
12.0*** |
|
|
| Centered Age (SE) |
0.2 |
0.047 |
-0.05 |
|
|
| RA (SE) |
113.5*** |
53.9*** |
46.0*** |
|
|
| SLE (SE) |
127.15*** |
55.1*** |
50.2*** |
|
|
| P-value |
<2.2·10-16
|
<2.2·10-16
|
<2.2·10-16
|
|
|
|
R2
|
0.61 |
0.53 |
0.48 |
|
|
