1. Introduction
Lettuce (Lactuca sativa L.) is the most commercially produced leafy vegetable grown in moderate climates worldwide. Fresh lettuce is a desirable, but highly perishable product that should be consumed almost immediately after harvest or maintained in conditions that prevent its wilting, weight loss, enzymatic discoloration, senescence, and tissue deterioration (Peng and Simko, 2023). Lettuce produced in the United States can be grouped into three broad categories: whole heads and bulk harvest (for salad processing) that are commonly harvested at market maturity, and baby leaf grown at very high density and harvested at early stages of plant development (Simko et al., 2014). All lettuce products, including baby leaf lettuce, are a good source of bioactive compounds (Kim M.J. et al., 2016) beneficial to human health (Dillard and German, 2000).
Evaluation of lettuce composition is important for determining its overall quality; however, laboratory analyses are slow and costly. Therefore, more rapid, less expensive, and non-destructive approaches based on (hyper)spectral reflectance are being developed to assess plant phenotypes (Abebe et al., 2023), response to stress (Kumar et al., 2021), and postharvest quality (Simko et al., 2015). Recently, a substantial progress has been made in using reflectance data to estimate lettuce quality and composition, including pH value and the content of chlorophyll, anthocyanins, soluble solids, water, nitrogen (N), phosphorus (P), potassium (K), calcium (Ca), magnesium (Mg), and sulfur (S) (Ahsan et al., 2021; Eshkabilov et al., 2021; Eshkabilov et al., 2022; Kim C. and van Iersel, 2023; Martins et al., 2021; Pandey et al., 2023; Simko et al., 2016; Yu et al., 2022; Yu et al., 2023; Zhao et al., 2022). However, there is a lack of studies modeling the content of sugars, vitamins, and other compounds in baby leaf lettuce. Moreover, previous studies did not perform classification of lettuce composition based on the applied fertilizers treatments using hyperspectral data and machine learning algorithms. Therefore, the current study focuses on assessing the content of certain sugars, vitamins, and nutrients in baby leaf lettuce from hyperspectral data using partial least squares regression and machine learning models
2. Materials and Methods
2.1. Plant Material
Analyses were performed on a set of 300 greenhouse-grown plants from 50 accessions, which included 36 cultivars, seven plant introductions, six breeding lines, and an accession of Lactuca serriola L., the wild progenitor of cultivated lettuce (
Appendix A -
Table A1). These accessions were selected for the study based on our previous preliminary analyses and published information (Mou, 2005; Mou, 2009) to represent a broad range of phenotypic and composition diversity in lettuce.
Lettuce seeds were sown in potting soil (Premium Growers Mix, Sun Land Garden Products, Watsonville, CA, USA), then covered with ~5 mm of sand, watered, and kept in dark at 10 °C to enhance uniformity of germination. After two days the temperature was increased to 20 °C with 16h/8h light/dark photoperiod. Two weeks later, well-established, and uniformly looking plants were transplanted into 7.6 cm (~514 mL volume) pots. At this point, the plants were split into two groups that were planted into different substrates. One group of plants, later used to analyze the content of sugars and vitamins, was transplanted into a 1:1 mix of potting soil and sand and fertilized with 1.5 g of Osmocote Smart-Release Plant Food Flower & Vegetable (Scotts, Marysville, OH, USA). The second group of plants, later used for nutrient analyses, was transplanted into a 1:2 mix of Espoma VM8 8-Quart Organic Vermiculite (Espoma, Millville, New Jersey, USA) and sand. This group of plants was fertilized with five different combinations of nitrogen (N), phosphorus (P), and potassium (K) fertilizers to ensure a substantial difference in their nutrient composition. The ‘NPK’ (control) treatment provided a full recommended dose of N, P, and K; the ‘nPK’ treatment provided 1/3 of N and a full dose of P and K; the ‘PK’ treatment provided a full dose of P and K, but no N; the ‘NP’ treatment provided a full dose of N and P, but no K; and the ‘NK’ treatment provided a full dose of N and K, but no P. N, P, and K macronutrients were provided with Non-Coated Ammonium Nitrate 34-0-0 Prill Form Fertilizer (Intermountain Farmers Association, Salt Lake City, Utah, USA), Triple Super Phosphate 0-46-0 Easy Peasy Plants 99% pure (Easy Peasy Plants, Alvin, Illinois, USA), and All-Natural Muriate of Potash- Easy Peasy 0-0-60 Potassium (Easy Peasy Plants, Alvin, Illinois, USA). All plants were sprayed with the identical amount of micronutrient mix solution that was prepared by dissolving 1 g of Axilo Mix 5 (0-0-0) Micronutrient Mix (Valagro USA, Houston, Texas, USA) in 1 L of distilled water.
Plants from both groups were grown together in a greenhouse in the randomized complete block design with three replications. During the growing period, the average daily temperature in the greenhouse ranged from 20 to 24 °C with a natural day length between 13 to 14h. Outdoor average daily light integrals ranged from 40 to 55 mol m-2 d-1. Plants were watered daily as needed. When most plants from Osmocote and NPK treatments developed four true leaves about 10 cm long, all plants were evaluated for the content of pigments, scanned with a hyperspectral camera, and subsequently harvested for composition analyses. Plants used in composition analyses were evaluated for biomass production (fresh weight in g).
2.2. Content of Pigments
The content of pigments was determined two days before harvest with hand-held meters that use light transmittance to provide good in situ estimates of chlorophyll (SPAD-502 from Konica Minolta Sensing, Tokyo, Japan) and anthocyanins (ACM-200 plus from Opti-Sciences, Hudson, New Hampshire, USA). Measurements were taken on three leaves of similar age (avoiding youngest and oldest leaves) about 1 cm from the leaf edge and averaged for each plant. The content of chlorophylls is expressed in SPAD units; the content of anthocyanins is expressed in ACI (anthocyanins content index) units.
2.3. Hyperspectral Imaging
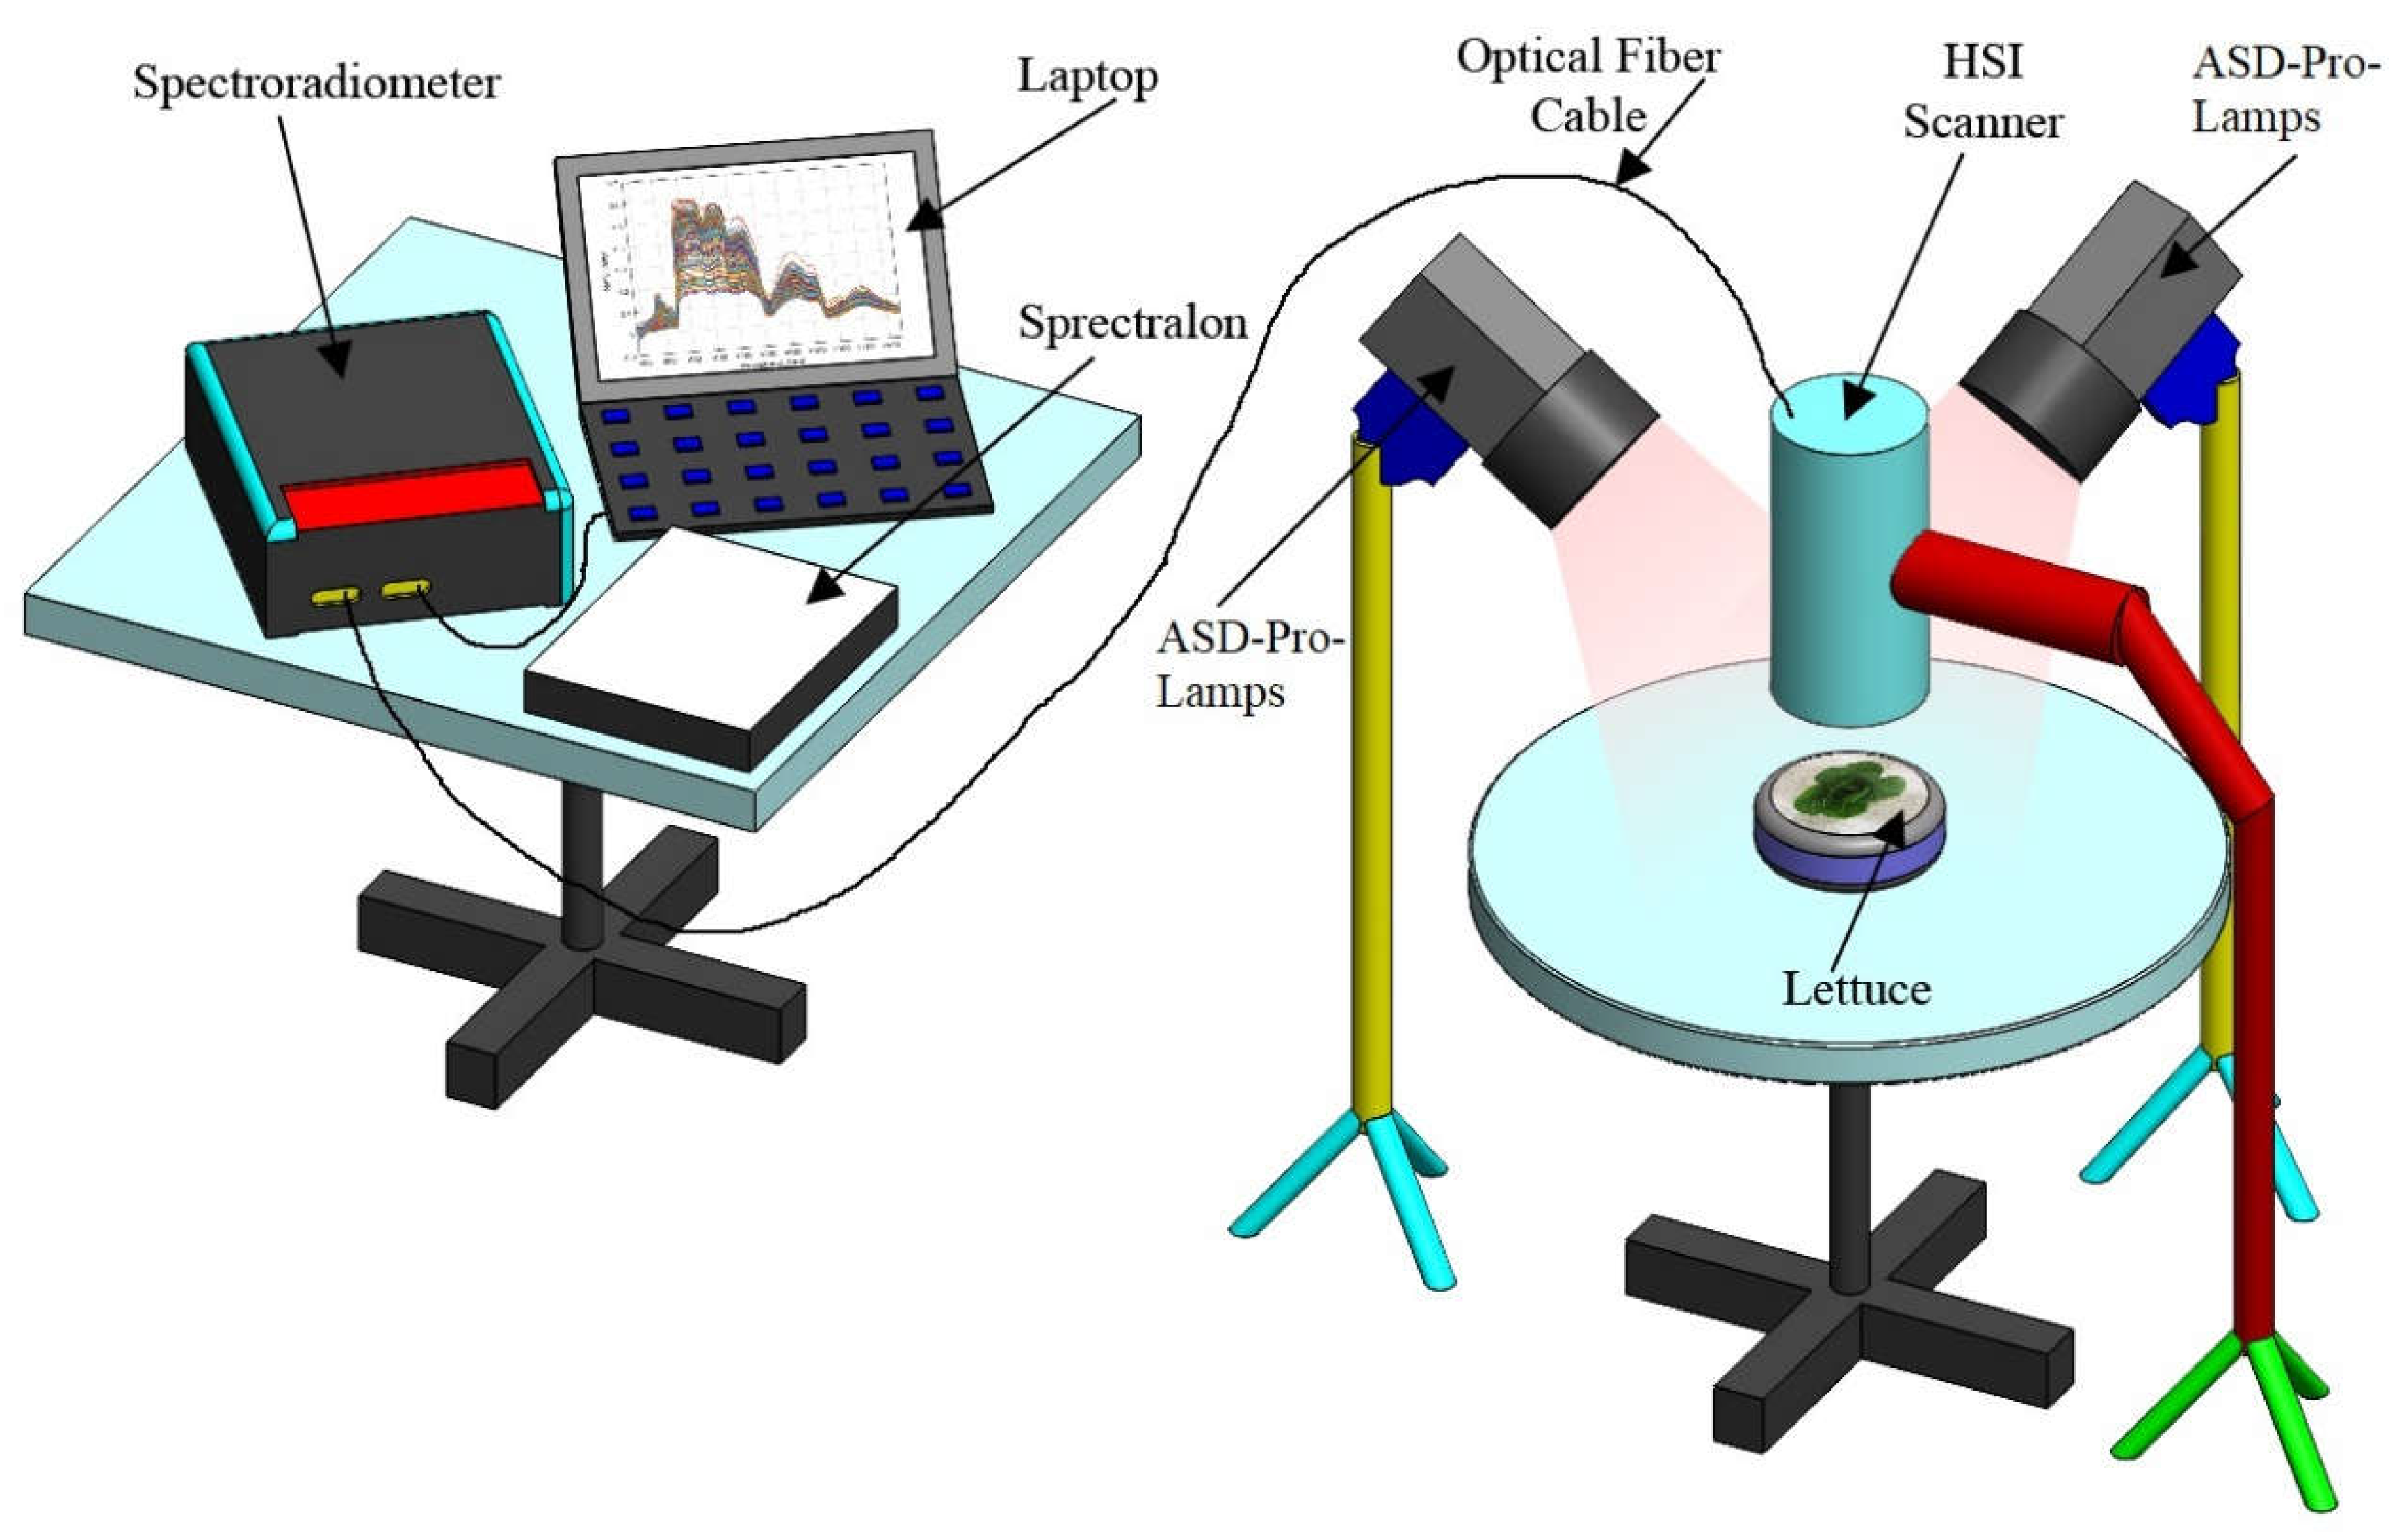
Lettuce plants' reflectance was measured with ASD FieldSpec 3 (Analytical Spectral Devices Inc., Boulder, Colorado, USA) which collects reflectance from 350 nm to 2,500 nm, with a 1.4 nm sampling interval between 350 and 1050, and a 2 nm sampling interval between 1000 and 2500 nm. Hyperspectral data were subdivided into 1 nm bandwidth using an ASD self-driven interpolation method. Spectral jump correction for 725 – 1000 nm and 1800 - 1950 nm bands was performed using the parabolic correction equations (Hueni and Bialek, 2017). The hyperspectral image (HSI) data acquisition set (
Figure 1) comprised ASD-Pro halogen lamps, ASD FieldSpec, computer, Spectralon reflectance standard, and connection wires.
The reflectance measurements were taken for individual plants in a dark room illuminated with four ASD-Pro-Lamps (Analytical Spectral Devices Inc., Boulder, USA). Black, non-reflective cloth was used to cover pots and soil. Hyperspectral images were taken at a height of about 10 cm above the plant. Each plant was scanned four times, with a 90° turn between each measurement. Reflectance calibration was performed using the Spectralon SRT- MS-100 reflectance standard (Labsphere, North Sutton, New Hampshire, USA).
2.4. Laboratory Quantification of Compounds
Immediately after taking reflectance measurements, all leaves from plants were harvested and submitted to the University of California Davis Analytical Laboratory to determine the content of sugars, vitamin C, β-carotene, N, P, and K using common quantification procedures developed for plant tissue samples (
https://anlab.ucdavis.edu). A detailed description of all analytical methods was previously provided (Simko, 2019; Simko, 2020), therefore they will be mentioned only briefly.
Samples for analyses of sugars were dried at 55ºC, ground, and extracted with hot deionized water (Johansen et al., 1996). The amounts of glucose, fructose, and sucrose in extracts were determined using PerkinElmer Series 200 Quaternary HPLC (PerkinElmer, Waltham, Massachusetts, USA) with Sciex API 200 mass spectrometer (Sciex, Redwood City, California, USA). Vitamin C (ascorbic acid) was quantified in leaf tissue according to the previously developed protocol (Bouzari et al., 2015) with minor modifications. β-carotene was quantified from a homogenized sample prepared from fresh tissue and deionized water using HPLC analysis with an isocratic mobile phase of methanol: acetonitrile (90:10). N, P, and K were quantified using the methods based on extraction of soluble nitrate (NO3-N) (Miller, 1998), phosphorus (PO4-P) (Prokopy, 1995), and potassium (Jones, 2001) from plant material with a solution of 2% acetic acid. The content of glucose, fructose, sucrose, N, P, and K is reported in g per kg of fresh weight (g kg-1 FW), and vitamin C and ß-carotene are reported in mg per kg of fresh weight (mg kg-1 FW). Another part of each sample was oven-dried at 105ºC to determine dry matter (DM) content. DM content at both 55ºC and 105ºC were expressed in percentages of fresh weight.
2.5. Hyperspectral Image Indexing and Extraction Models
The first order derivative of reflectance (FDR) of the filtered HSI data was computed using the formulas elaborated in our previous studies (Eshkabilov, et. al., 2021, Eshkabilov, et. al., 2022). The computed FDR values were explored to find the 13 most important principal components. The reflectance values at the found bandwidth indices were subsequently used to develop multivariate regression models based on the filtered HSI data and laboratory (ground truth) data by applying the PLS and PCA modeling approaches. The ground truth data were those for fresh leaf weight (FLW), percent dry matter content at 55ºC (55C DM) and 105ºC (105C DM), SPAD, ACI, content of glucose (Glu), fructose (Fru), sucrose (Suc), vitamin C (Vit-C), ß-carotene (ß-Carot), N, P, and K. A multi-variate linear regression modeling (Rangkuti et al., 2017) was applied to establish predictive models using PLSR and PCR approaches.
2.6. Machine Learning Models for Classification and Prediction
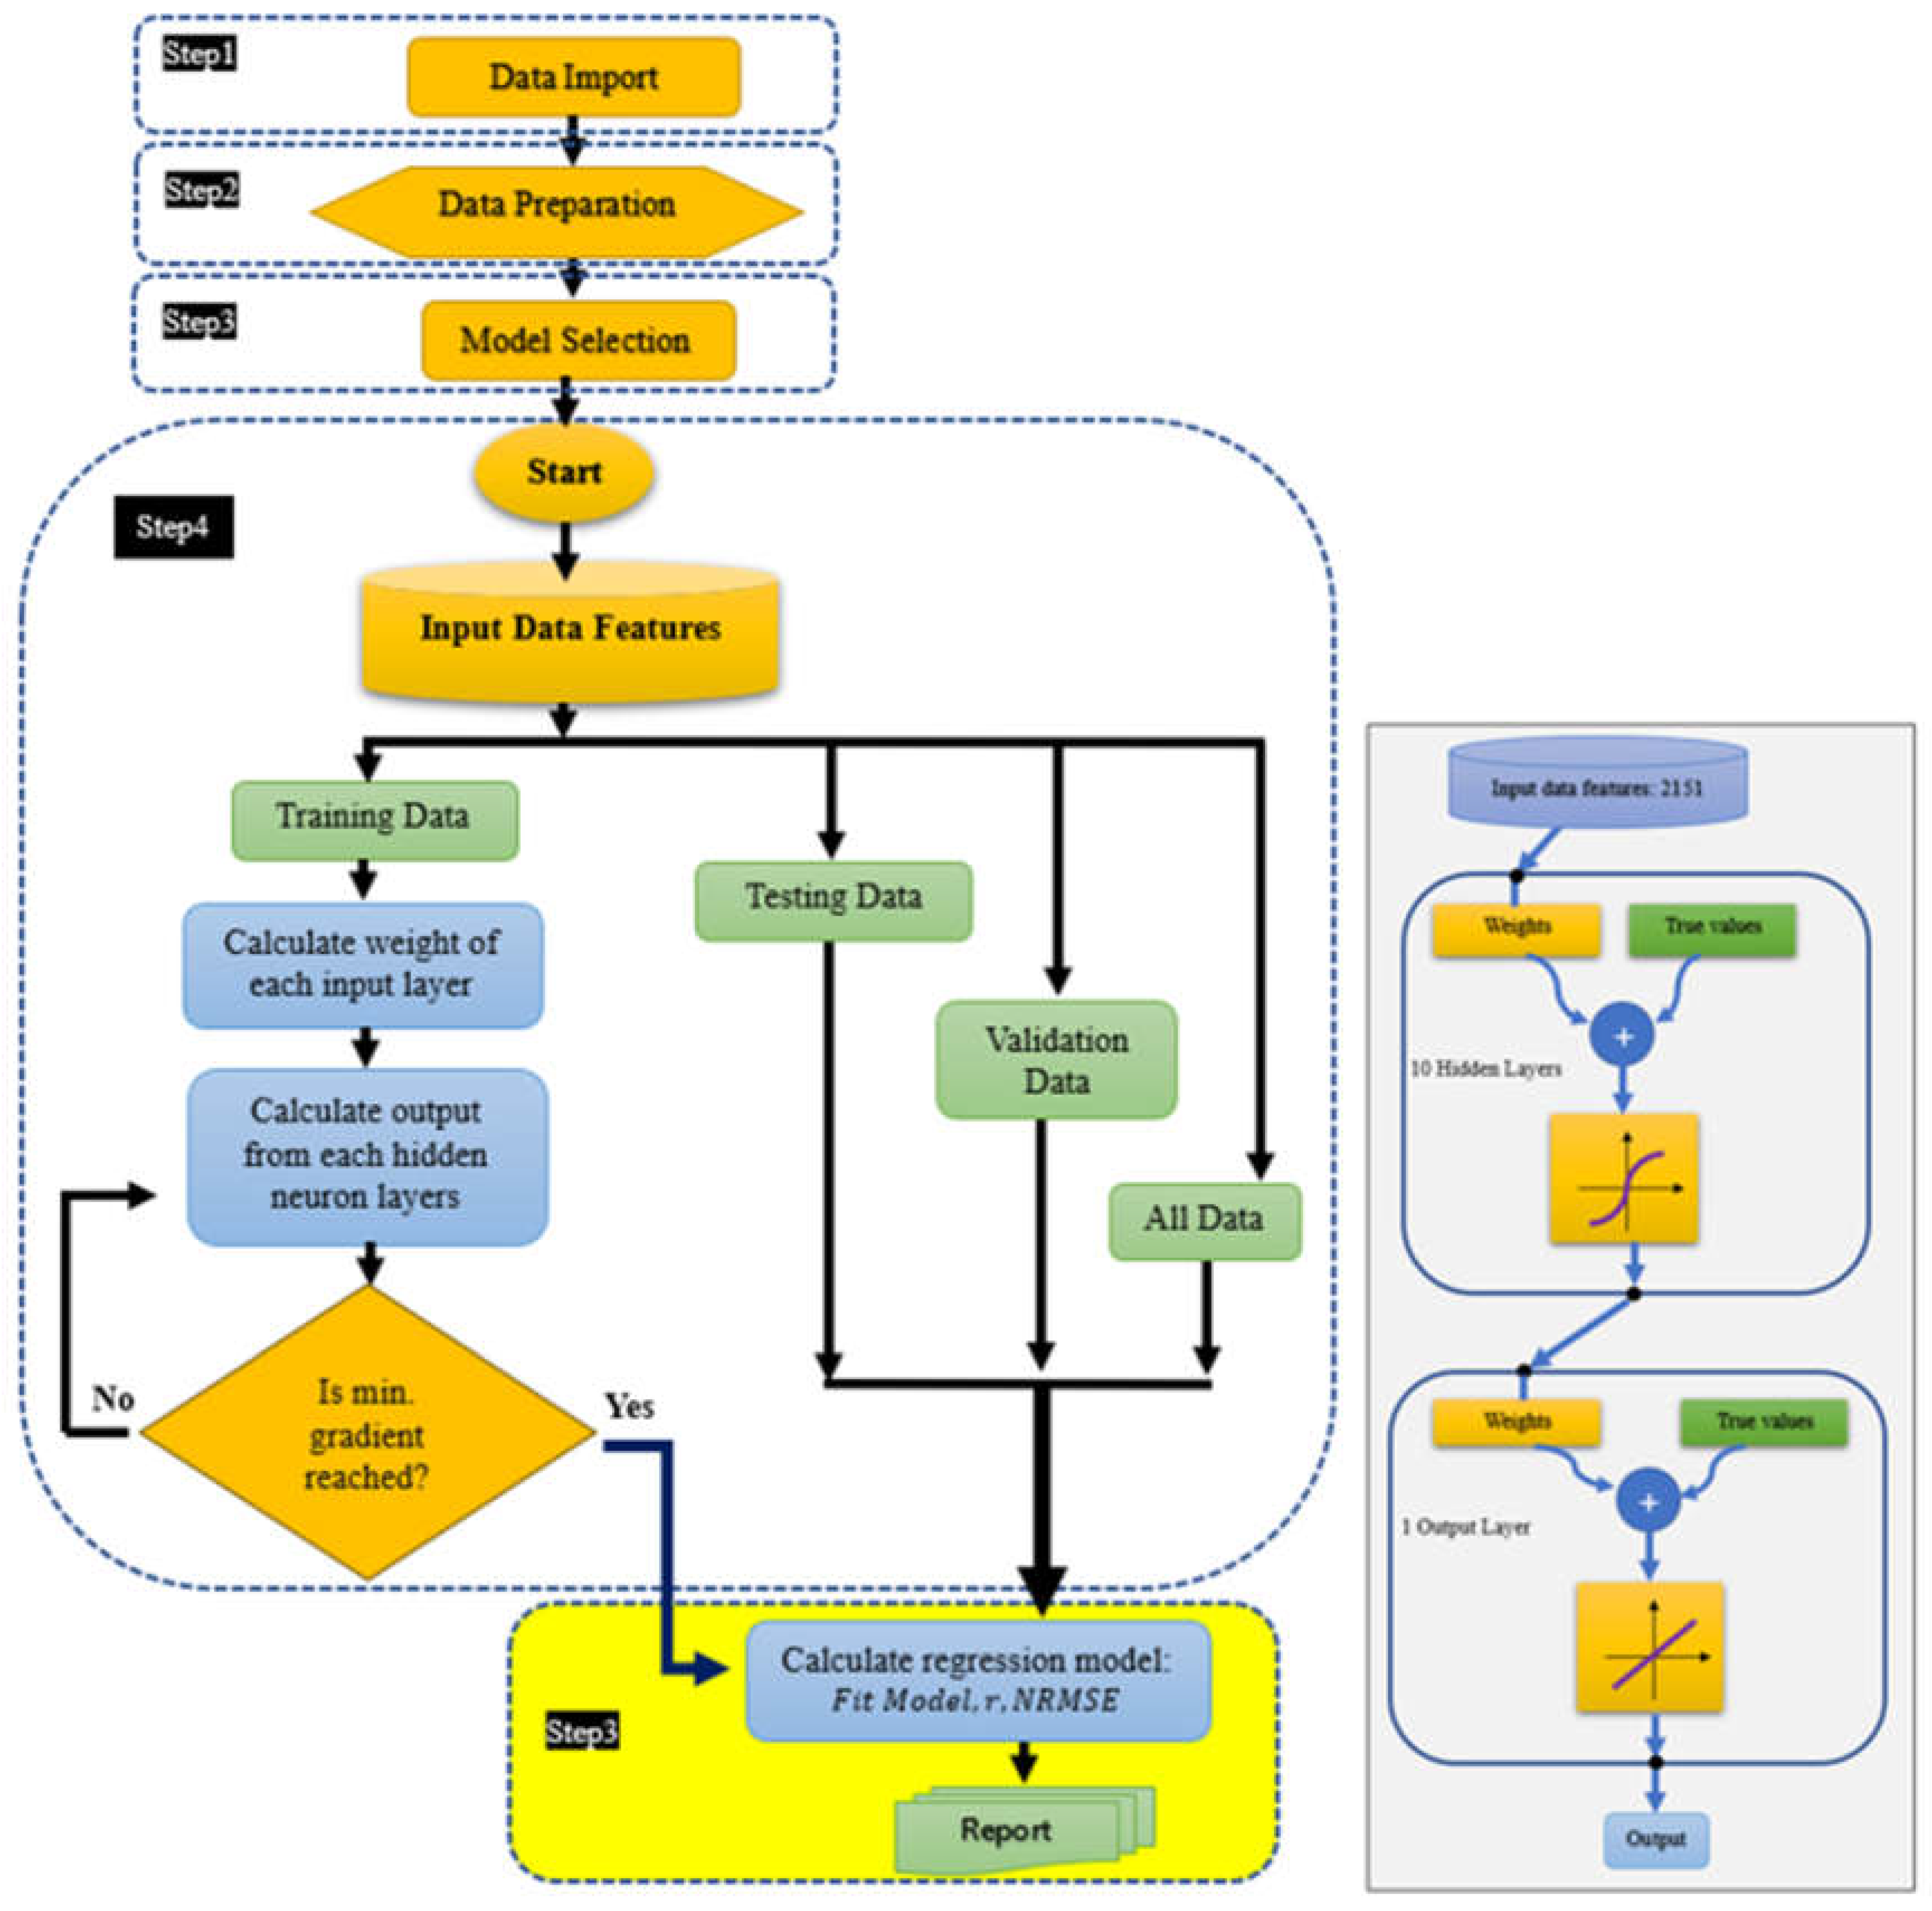
To classify and estimate the responses of the studied lettuces to fertilizer treatments using their hyperspectral reflectance data, five classification and regression models of machine learning algorithms were applied: support vector machine (SVM), ensemble, linear and quadratic discriminant, and artificial neural network (ANN). The classification of the studied lettuces based both on their response to fertilizers treatments (PK, NK, NP, NPK, nPK, Osmocote) and HSI data was performed. The estimation and prediction models were found using ANN algorithms. For that 80% of the input HSI data was used for model training, 10% of data for testing and 10% of data for validation. The predictive models were based on the least gradient of mean squared errors over simulation using 1000 epochs with 10 hidden layers and 1 output layer. The implementation of the ANN algorithm for multivariate linear predictive models (
Figure 2) composes of five major steps: data import, data preparation, model selection, model evaluation, and regression model performance.
In the training phase of the ANN model, we applied the Levenberg-Marquardt method (Moré, 1977) which is a built-in function in the MATLAB package (MathWorks, 2023) for linear and non-linear least squares methods.
2.7. Model Accuracy Metrics
Three accuracy metrics of the developed regression and ANN models were used that are correlation coefficient (r), normalized root mean squared error (NRMSE), and accuracy (%). The correlation between the ground truth and predicted values of response variables was computed from Eq (1).
where
and
are the laboratory-measured values of a response variable and their mean value, respectively;
and
are the predicted/estimated values of a response variable and their mean value, respectively.
Another metric used to assess the accuracy of the regression models was NRMSE which was computed from the following formulation – Eq (2).
where
is the number of data points in the response variable.
Four different classification models (SVM, ensemble, quadratic and linear discriminant) of machine learning algorithms were employed to classify the studied lettuce by the six applied fertilizers treatment (PK, NK, NP, NPK, nPK, Osmocote). The accuracy of the classification models was estimated using true positive (TP), true negative (TN), false positive (FP), and false negative (FN) values and computed using Eq (3) in % (Chollet, 2021).
The accuracy metric given in Eq (3) was applied for all six fertilizer treatments.
3. Results and Discussion
3.1. HSI Data
The captured hyperspectral data of the whole lettuce plant as elaborated in
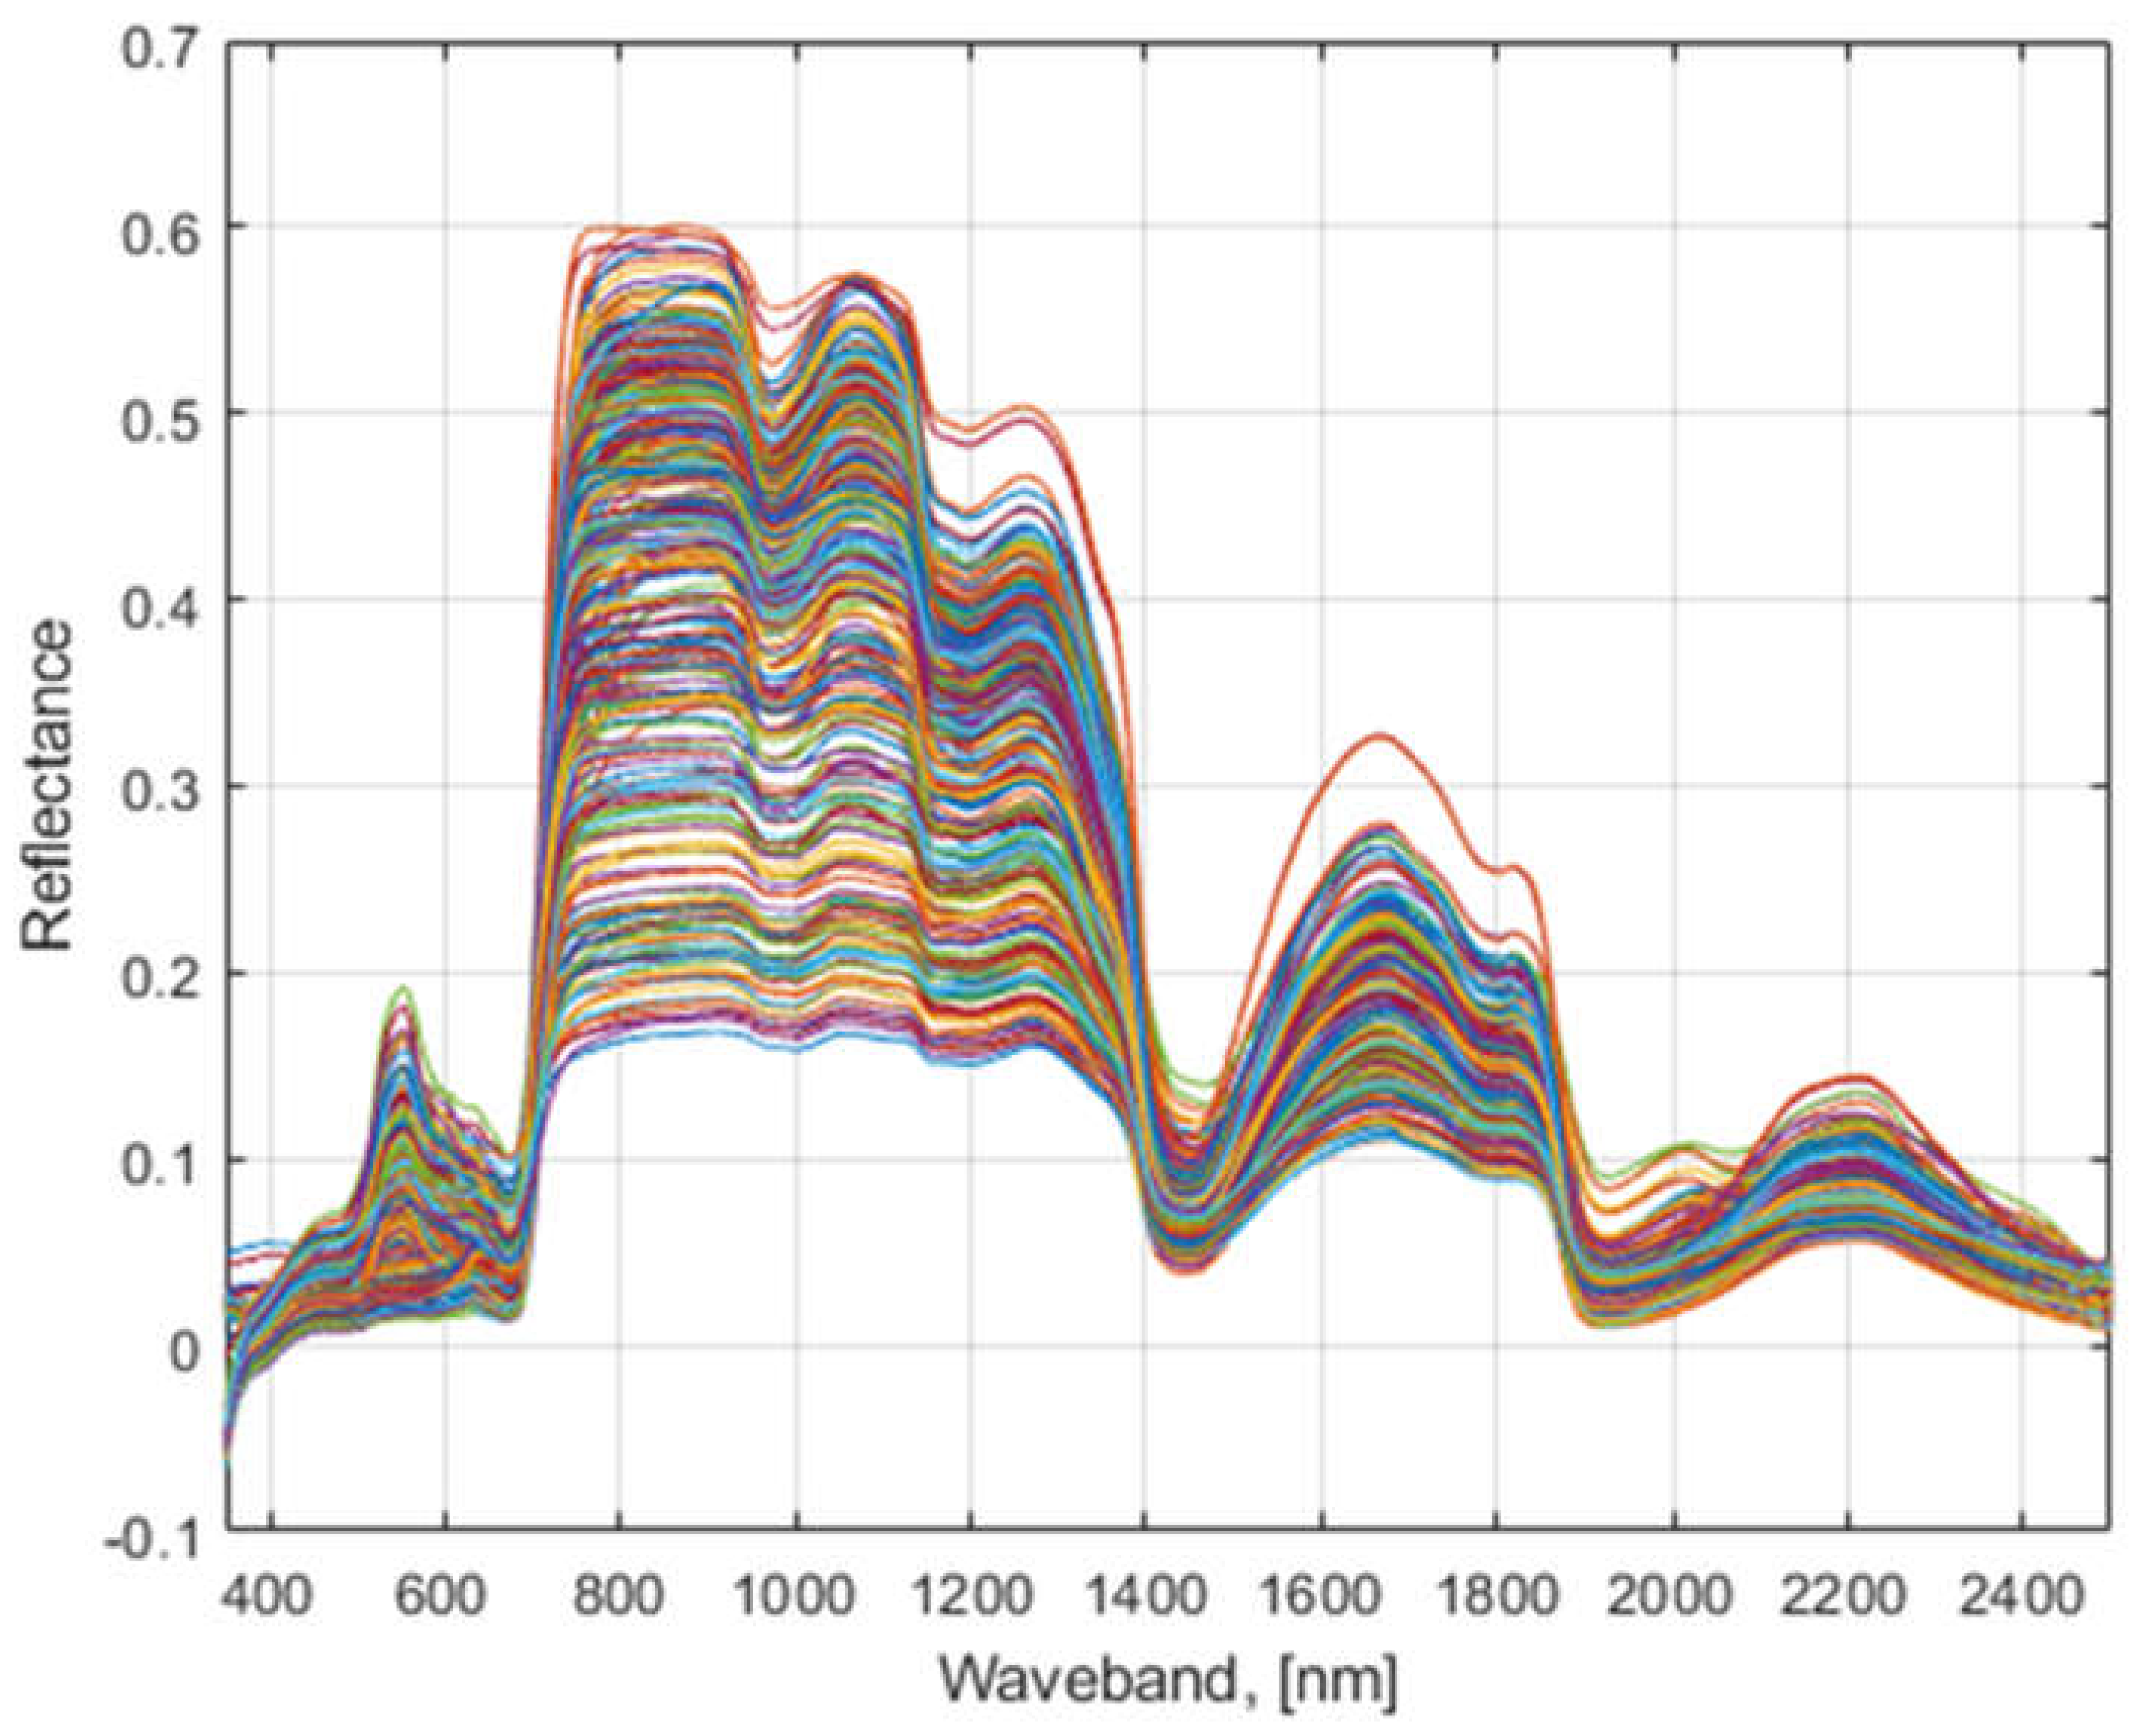
Section 2.3 were filtered using a seven-point moving average digital filter. The filtered hyperspectral reflectance data of all studied lettuce accessions (
Figure 3) exhibit six volatile bandwidth regions as found using FDR simulations.
3.2. PLSR and PCR Model Performances
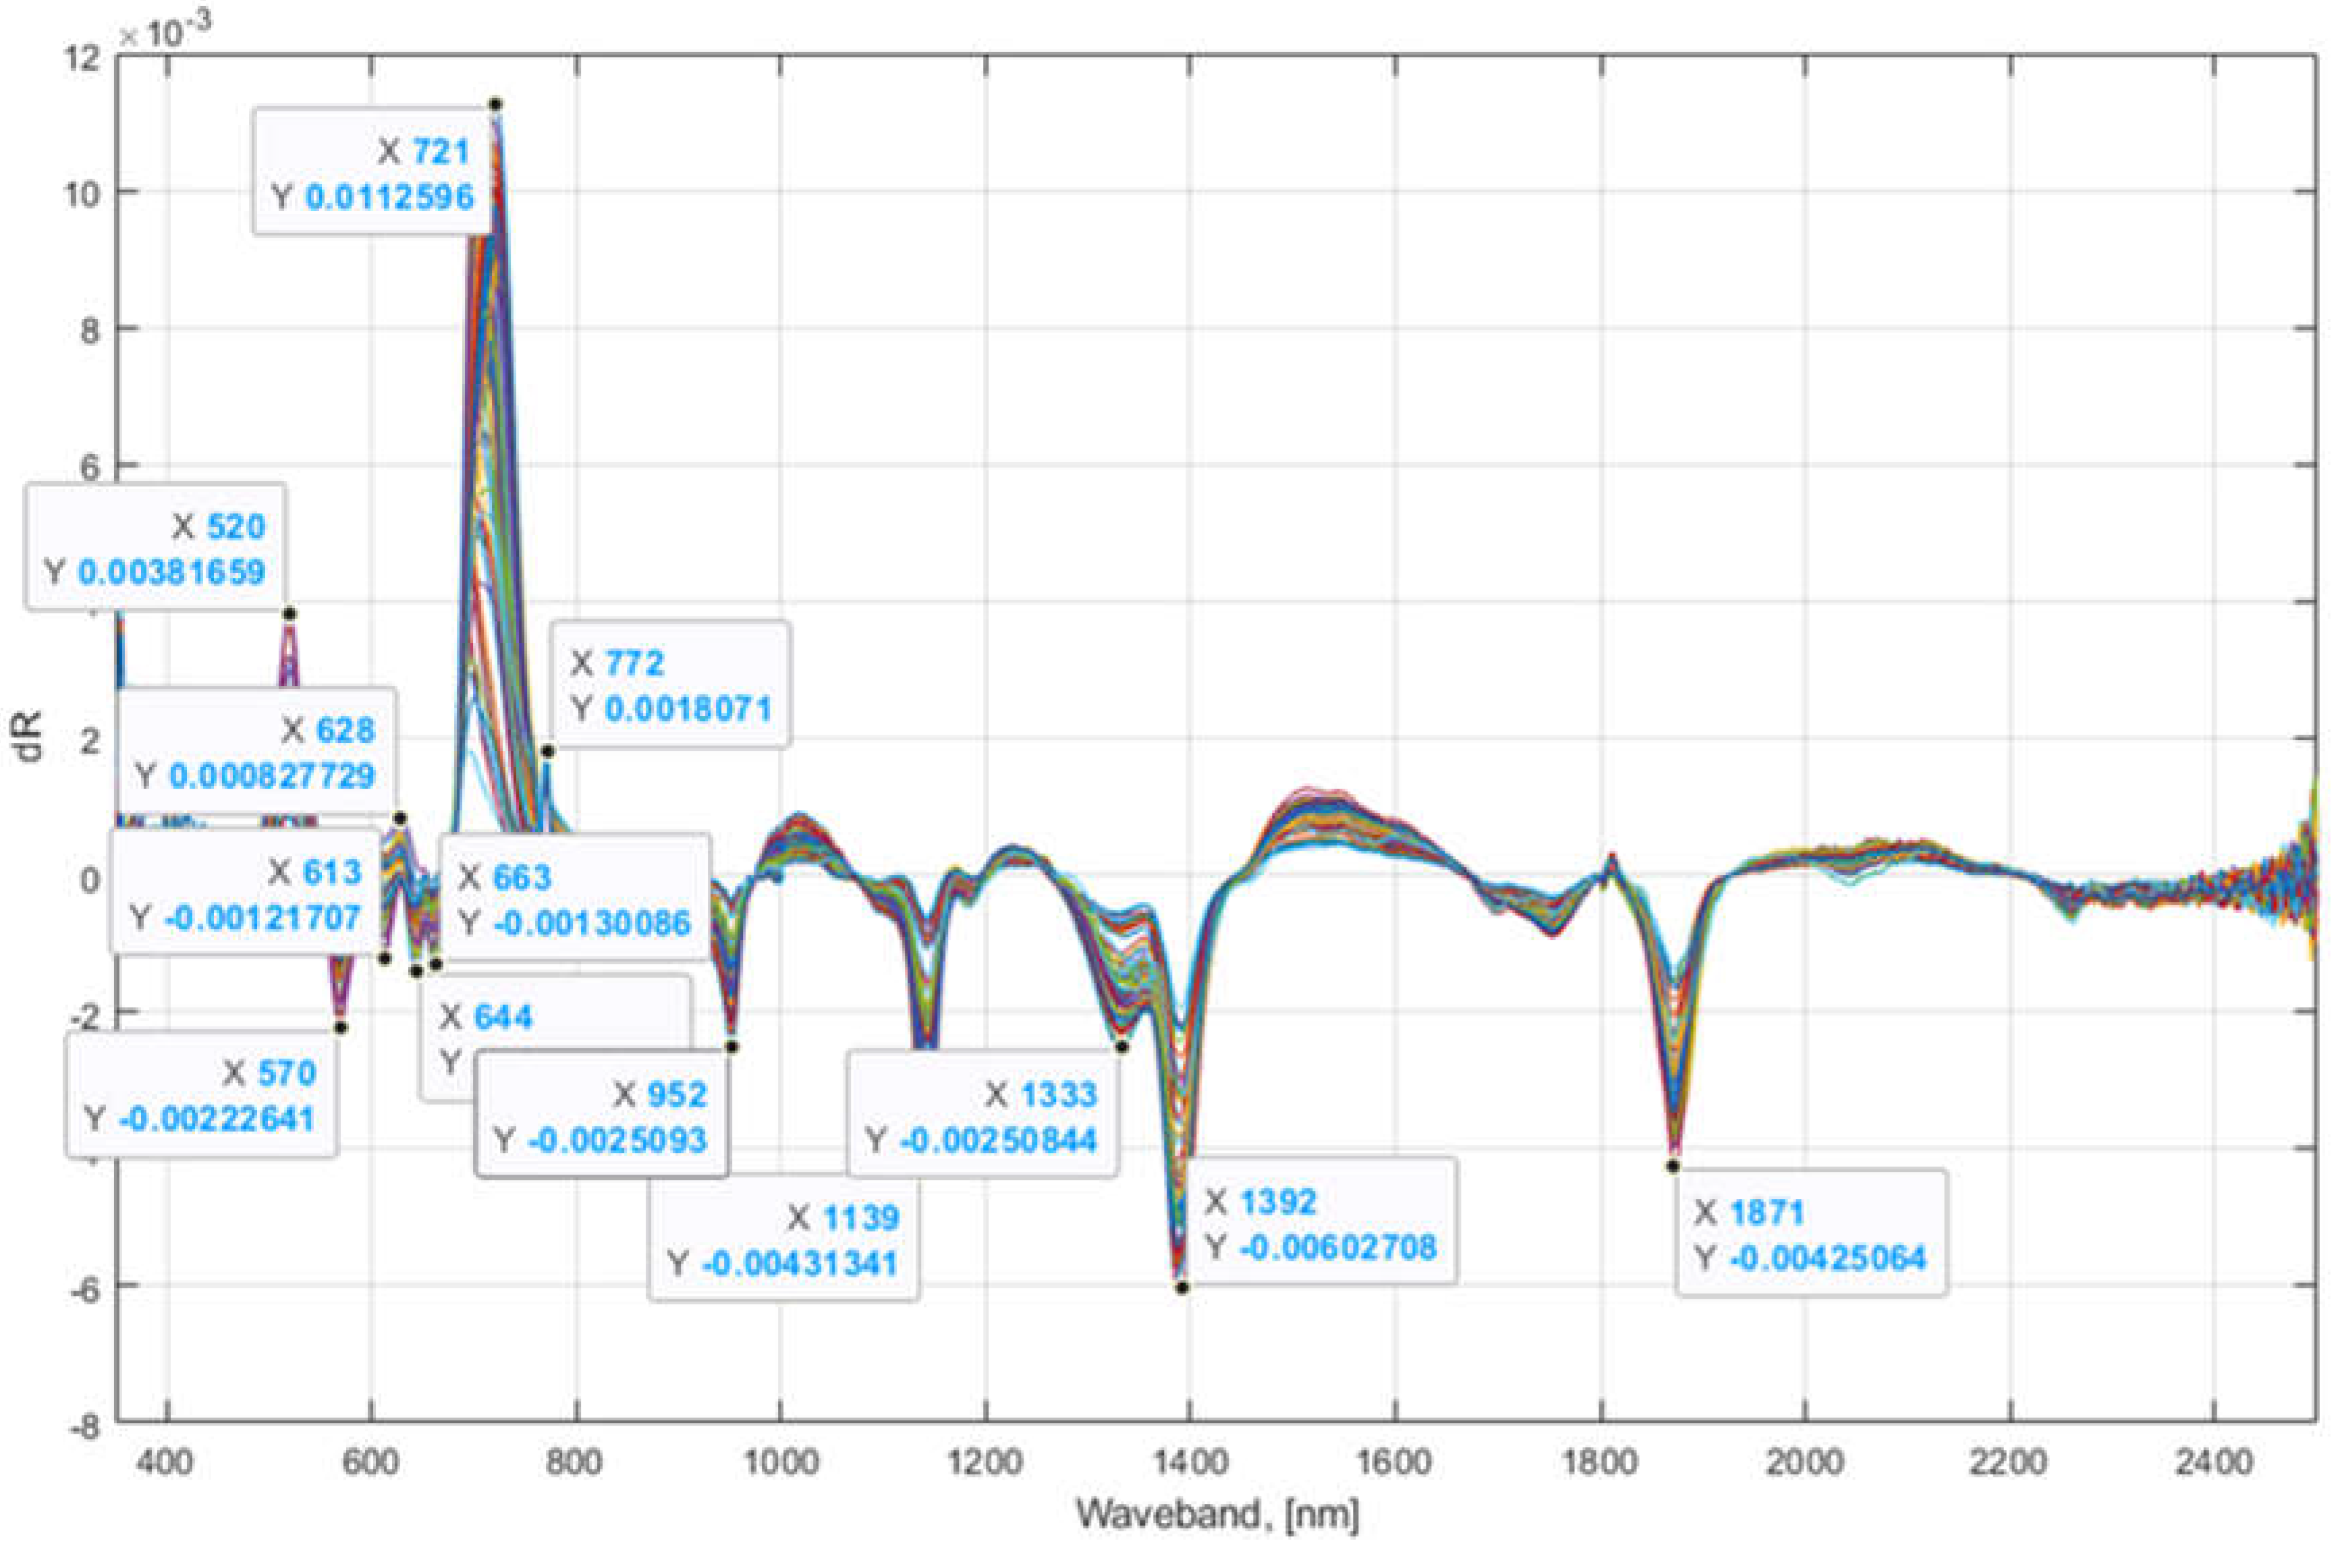
In addition to the laboratory-measured values for 13 response variables, two more adjusted values were calculated: a square root of SPAD and logarithm (base 2) of ACI as previously recommended (Simko 2020). The computed FDR of reflectance values show that the 13 most important principal components were found in seven different bandwidth regions, i.e., 500 – 575, 600 – 675, 700 – 775, 950 – 1000, 1100 - 1150, 1300 - 1400, and 1875 – 2000 nm based on the maximum or minimum reflectance derivative values (
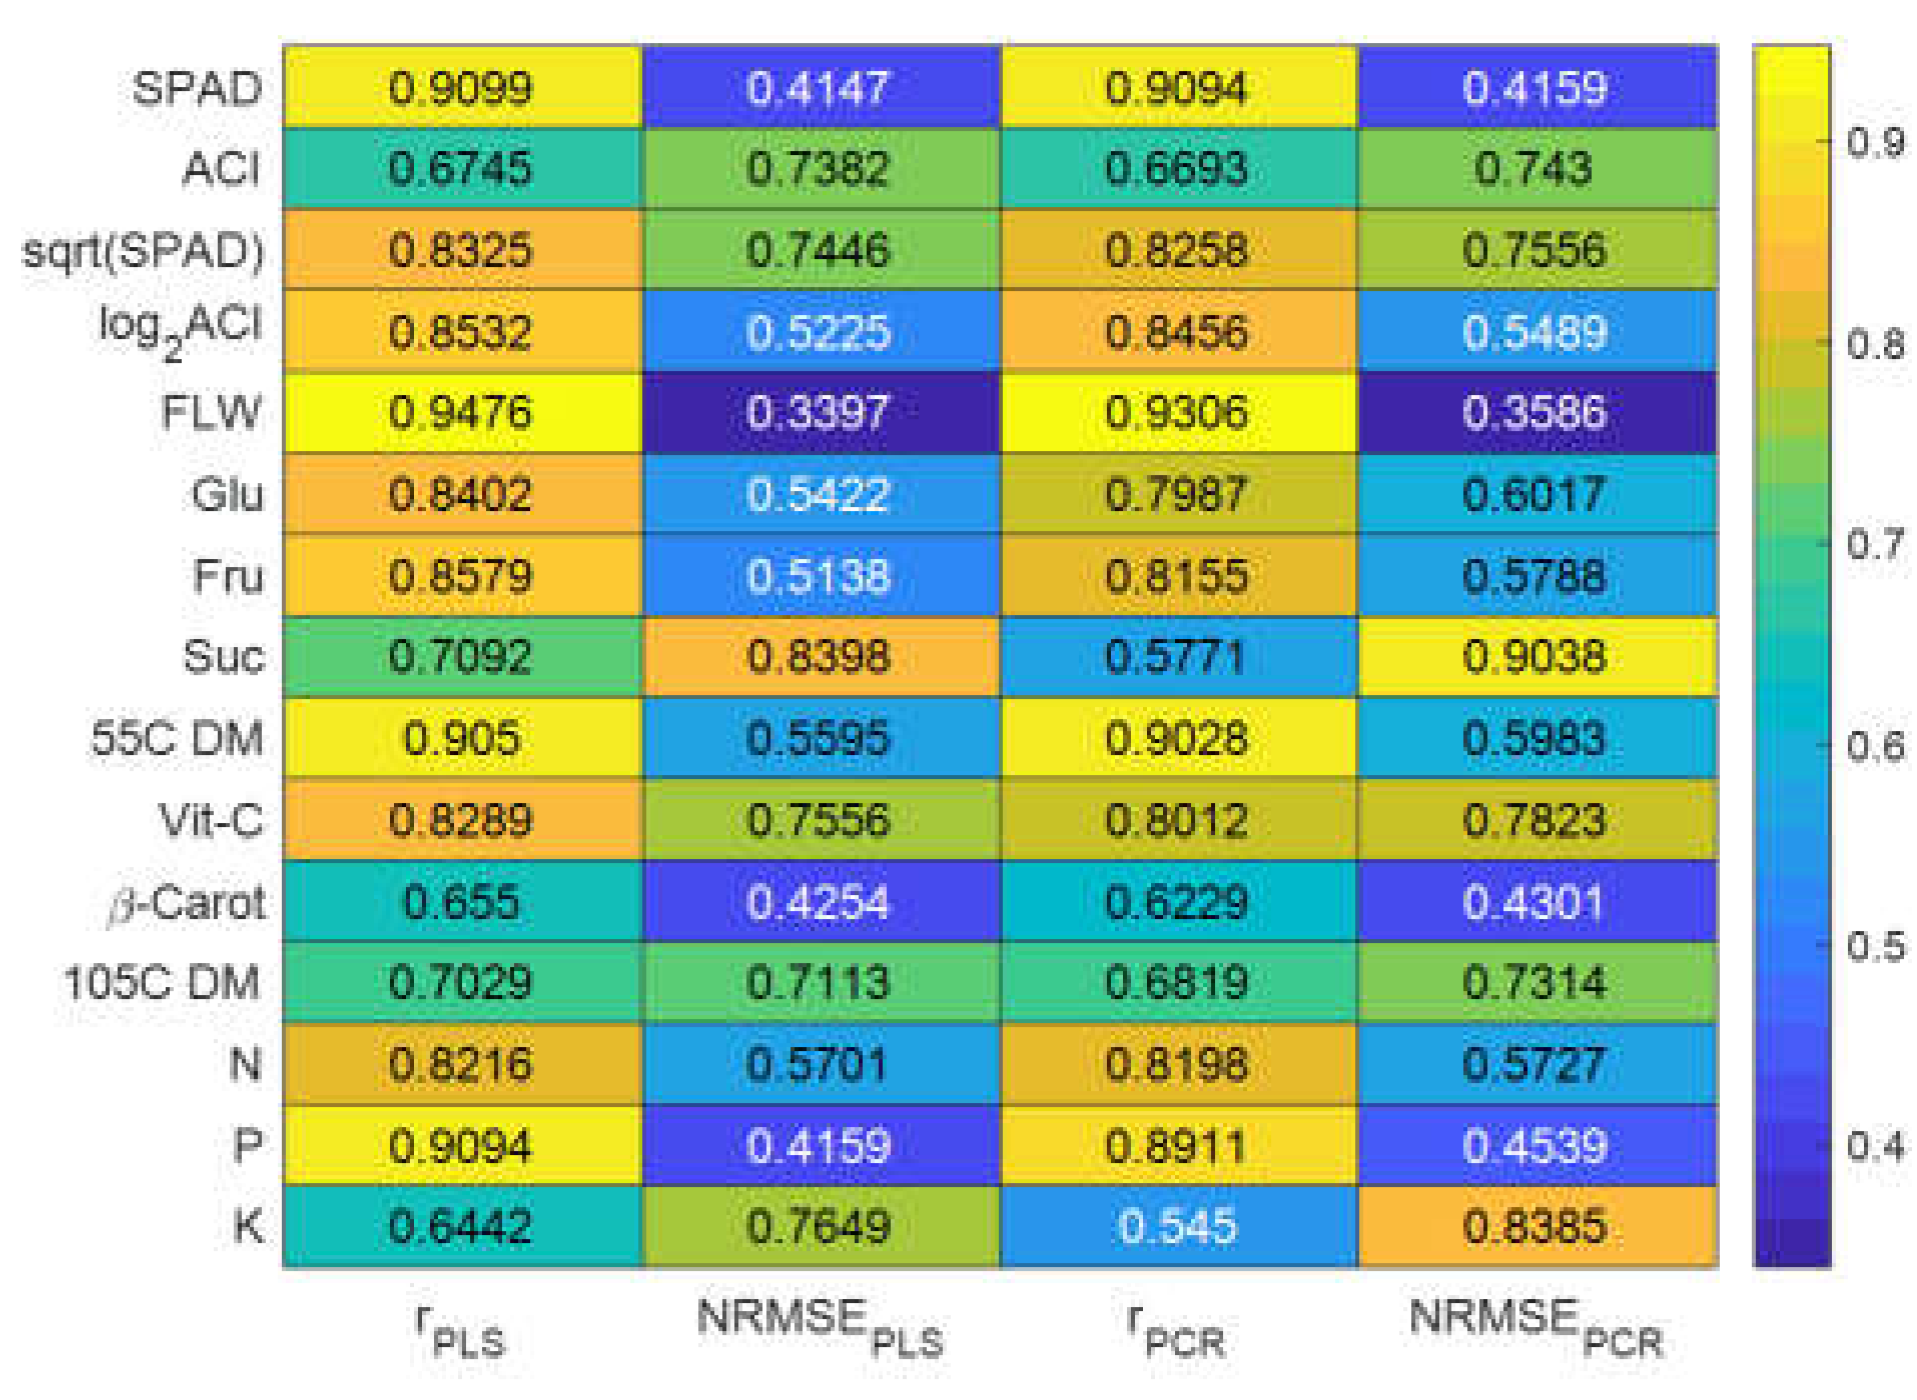
Figure 4). These bandwidth regions are in close agreement with those determined previously on lettuce (Falcioni et al., 2022). Correlations between the predicted values and laboratory measurements (ground truth) for multivariate linear PLSR and PCR models ranged from 0.5450 to 0.9476 (
Figure 5), while NRMSE values ranged between 0.3397 to 0.9038. The highest correlation (0.9476 and 0.9306) between the predicted values found using PLS and PCR multivariate models and laboratory-measured values was observed for fresh leaf weight (FLW). The lowest correlation (0.6442 and 0.5445) between modeled and measured data was observed for the content of potassium (K). Correlation values of PLSR and PCR models to estimated SPAD, N, P, and K nutrients were lower than those found in our previous studies (Eshkabilov, et. al., 2021, Eshkabilov, et. al., 2022). This difference may be related to the scanning approach used on analyzed plants. In the current study, the whole lettuce plants were scanned using the hyperspectral camera, whereas in our previous study, hyperspectral images were collected from individual lettuce leaves placed in a fully isolated chamber. Correlations for N, P, and K content determined in the current study using PLSR and PCR models are, however, in close agreement with the results from other laboratories (Pandey, et. al., 2023). The accuracy of the PLSR and PCR models were higher for N and P, but lower for K in our study than previously reported accuracies for the PLSR models (Taha, et. al., 2022).
3.3. Classification of Lettuces by the Applied Fertilizers Treatments Using Machine Learning Algorithms
To classify the applied six fertilizer treatments (PK, NK, NP, NPK, nPK, and Osmocote) for all studied lettuces and the collected hyperspectral image data, four different machine learning classification algorithms (SVM, ensemble, linear and quadratic discriminant) were implemented and tested. The filtered HSI data was taken as an input variable and the applied six treatments, converted to categorical arrays, were used as an output variable. To reduce the dimension of the input (predictor) variable data, i.e., HSI data, 13 wavebands of HSI, 13 principal component values found using FDR reflectance values (
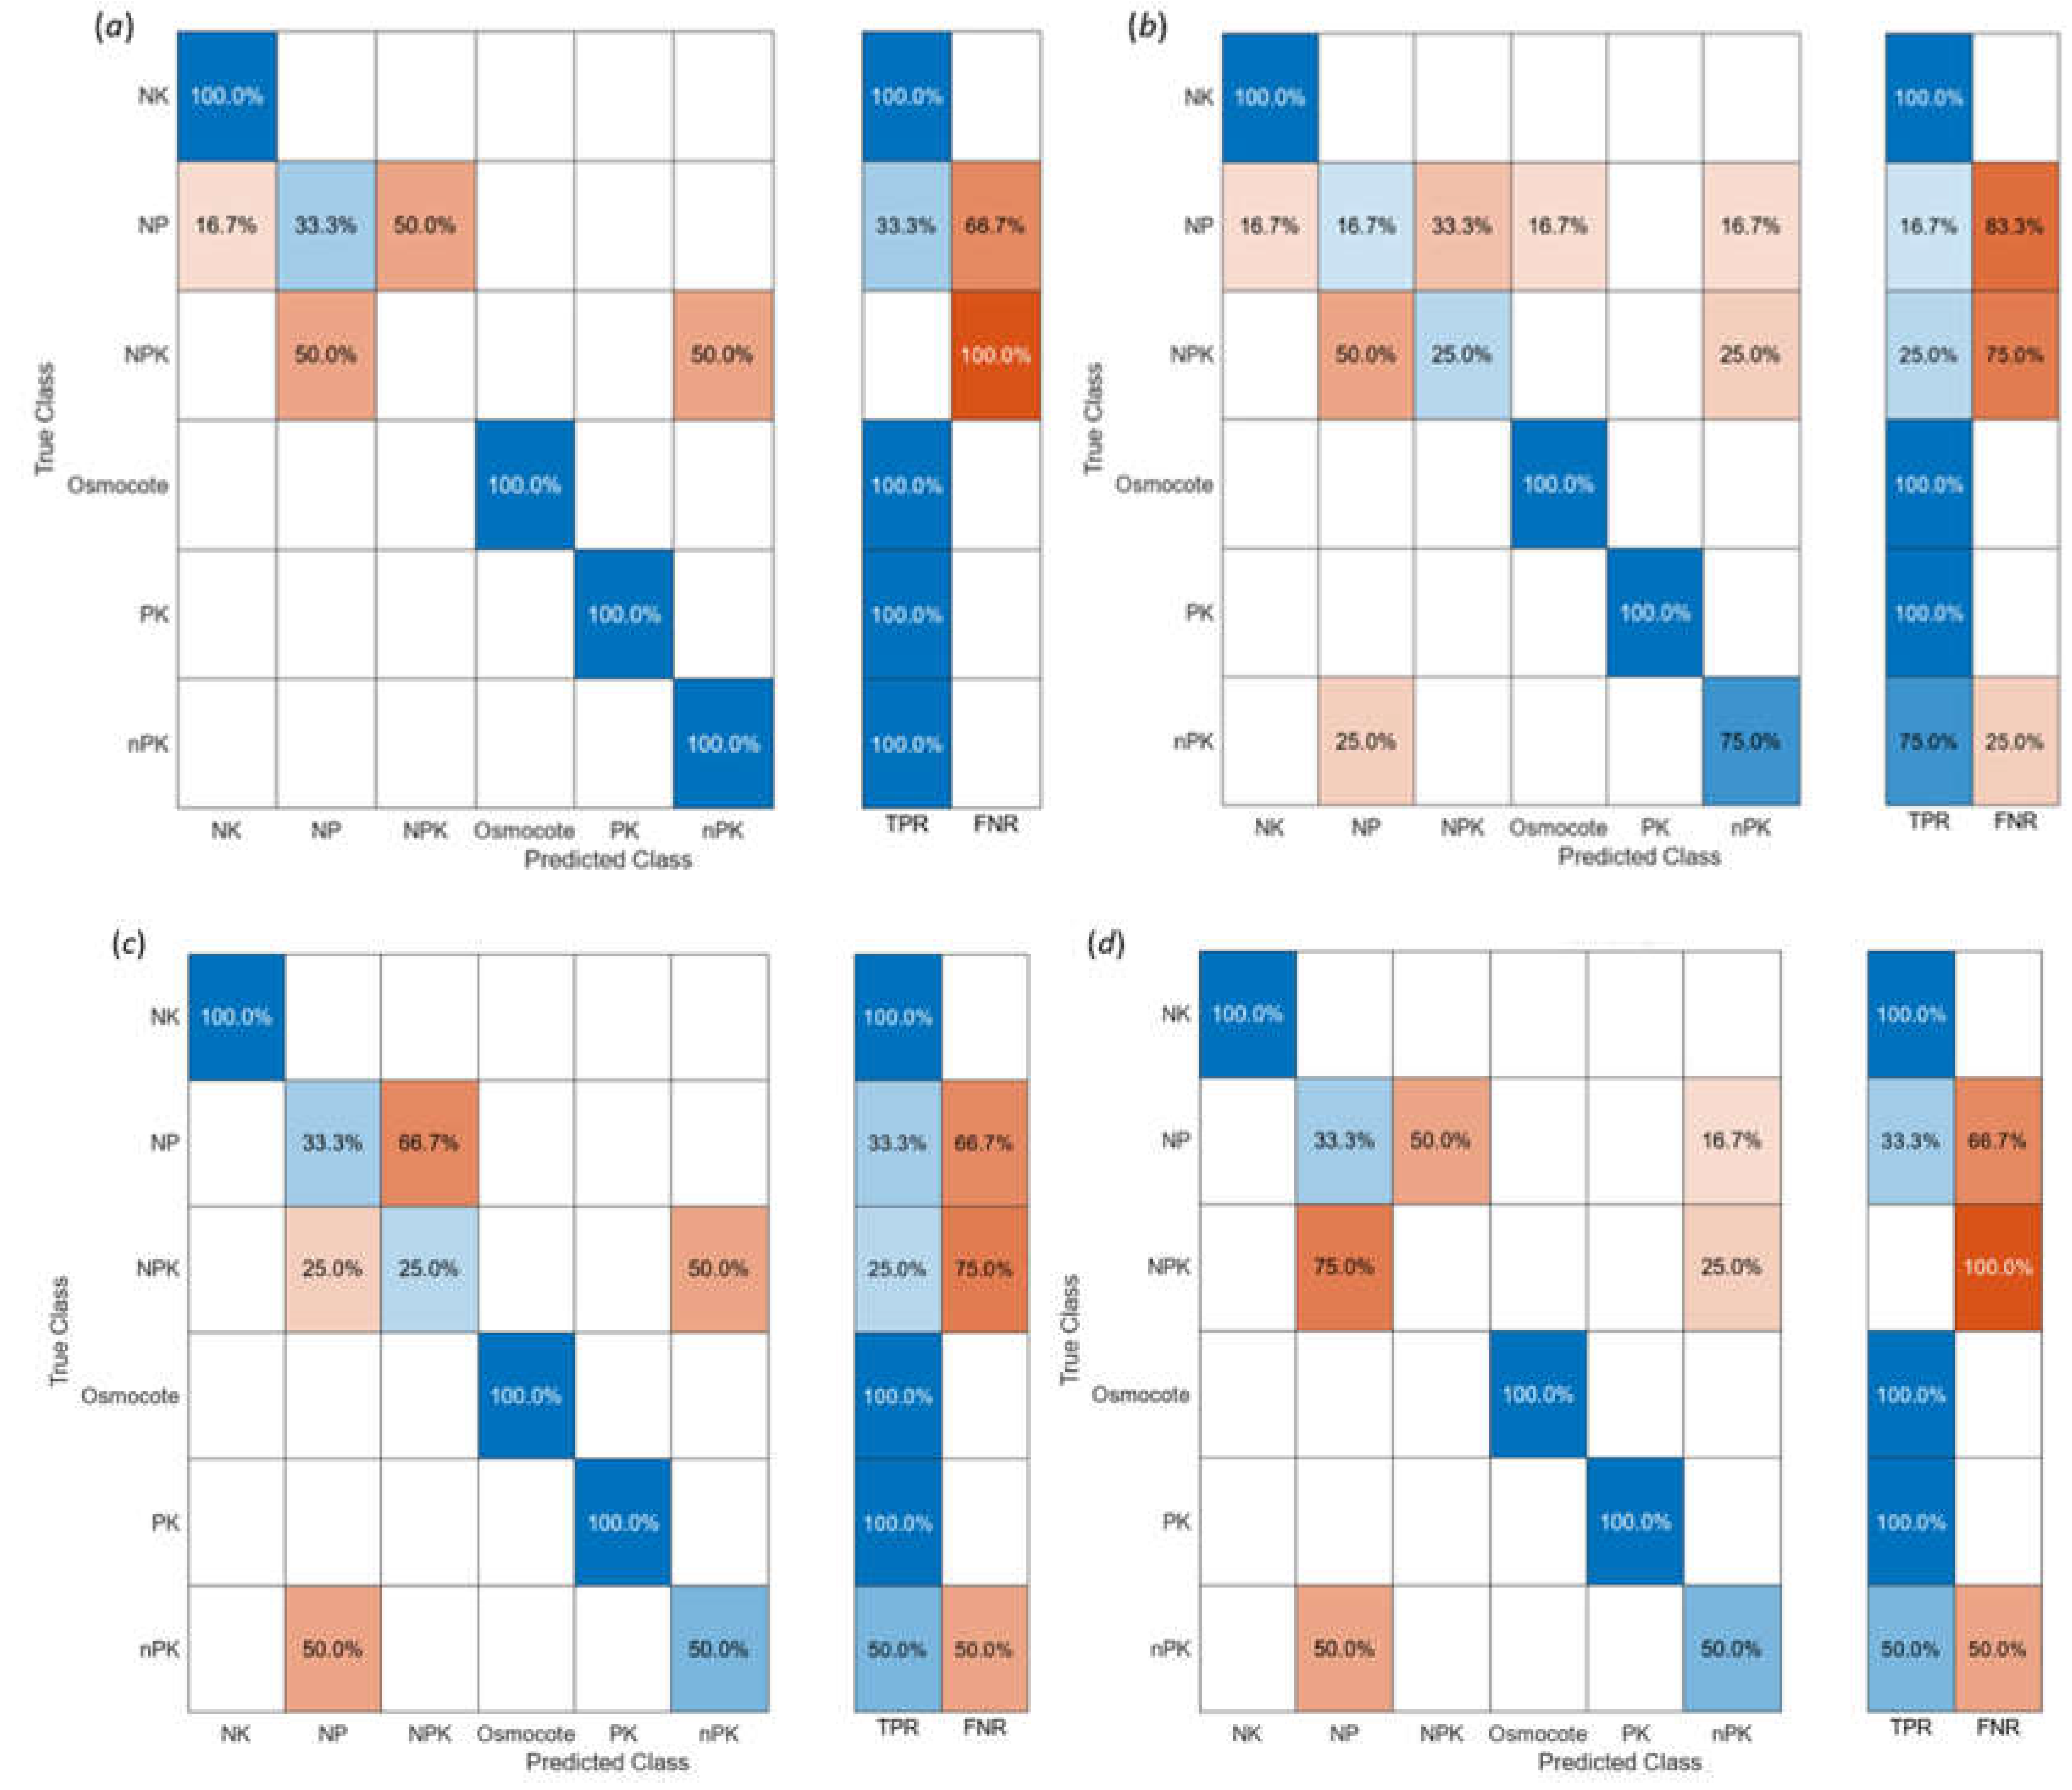
Figure 4) were used. HSI data were classified based on the six applied fertilizer treatments. 90% of 300 data sets were used for model training and 10% for model testing/validation. The employed classification scales were individual classes - TP, FP, TF, FN, and the combined classes - TPR (true positive rates) and FNR (false negative rates). The plotted confusion matrices of the employed algorithms (
Figure 6) show that the highest accuracy (77.8% for model training and 73.3% for model testing/validation) in classifying the applied treatments was achieved with the ensemble algorithm (
Figure 6, a). The second highest accuracy (75.9% for model training and 70.0% for model testing/validation) of classification was reached using the SVM algorithm (
Figure 6, b). The other two algorithms, quadratic discriminant (
Figure 6, c) and linear discriminant (
Figure 6, d), resulted in 74.7% and 80% for model training, and 70.0% and 66.7% accuracy for model testing/validation, respectively. 100% accuracy was achieved in classifying lettuces using SVM, ensemble, linear, and quadratic discriminant algorithms when NK, Osmocote, and PK treatments were applied (
Figure 6, a, b, c, d). This demonstrates that NK, Osmocote, and PK fertilizers have significant effects on the leaf pigment content. Similar conclusions (
Figure 6, a, b) can be drawn with adequate confidence about the nPK treatment effect. On the other hand, NP and NPK treatments (
Figure 6, a, b, c, d) had a very small or no effect on lettuce leaf pigments and therefore, the hyperspectral imaging technique could not detect the impact of NP and NPK treatments.
3.4. Performances of Machine Learning Algorithms to Estimate Nutrients of Lettuces
To estimate and predict nutrient concentration levels in lettuces based on hyperspectral image data using artificial neural network algorithms of machine learning, the HSI data were treated as a predictor variable, and laboratory-measured values were treated as a response variable. The acquired HSI data of lettuces were filtered using a Gaussian seven-point moving average filter. Two additional transformed values, the square root of SPAD and the logarithm of ACI, were included in ANN models. Thus, a total of 15 response variables were simulated.
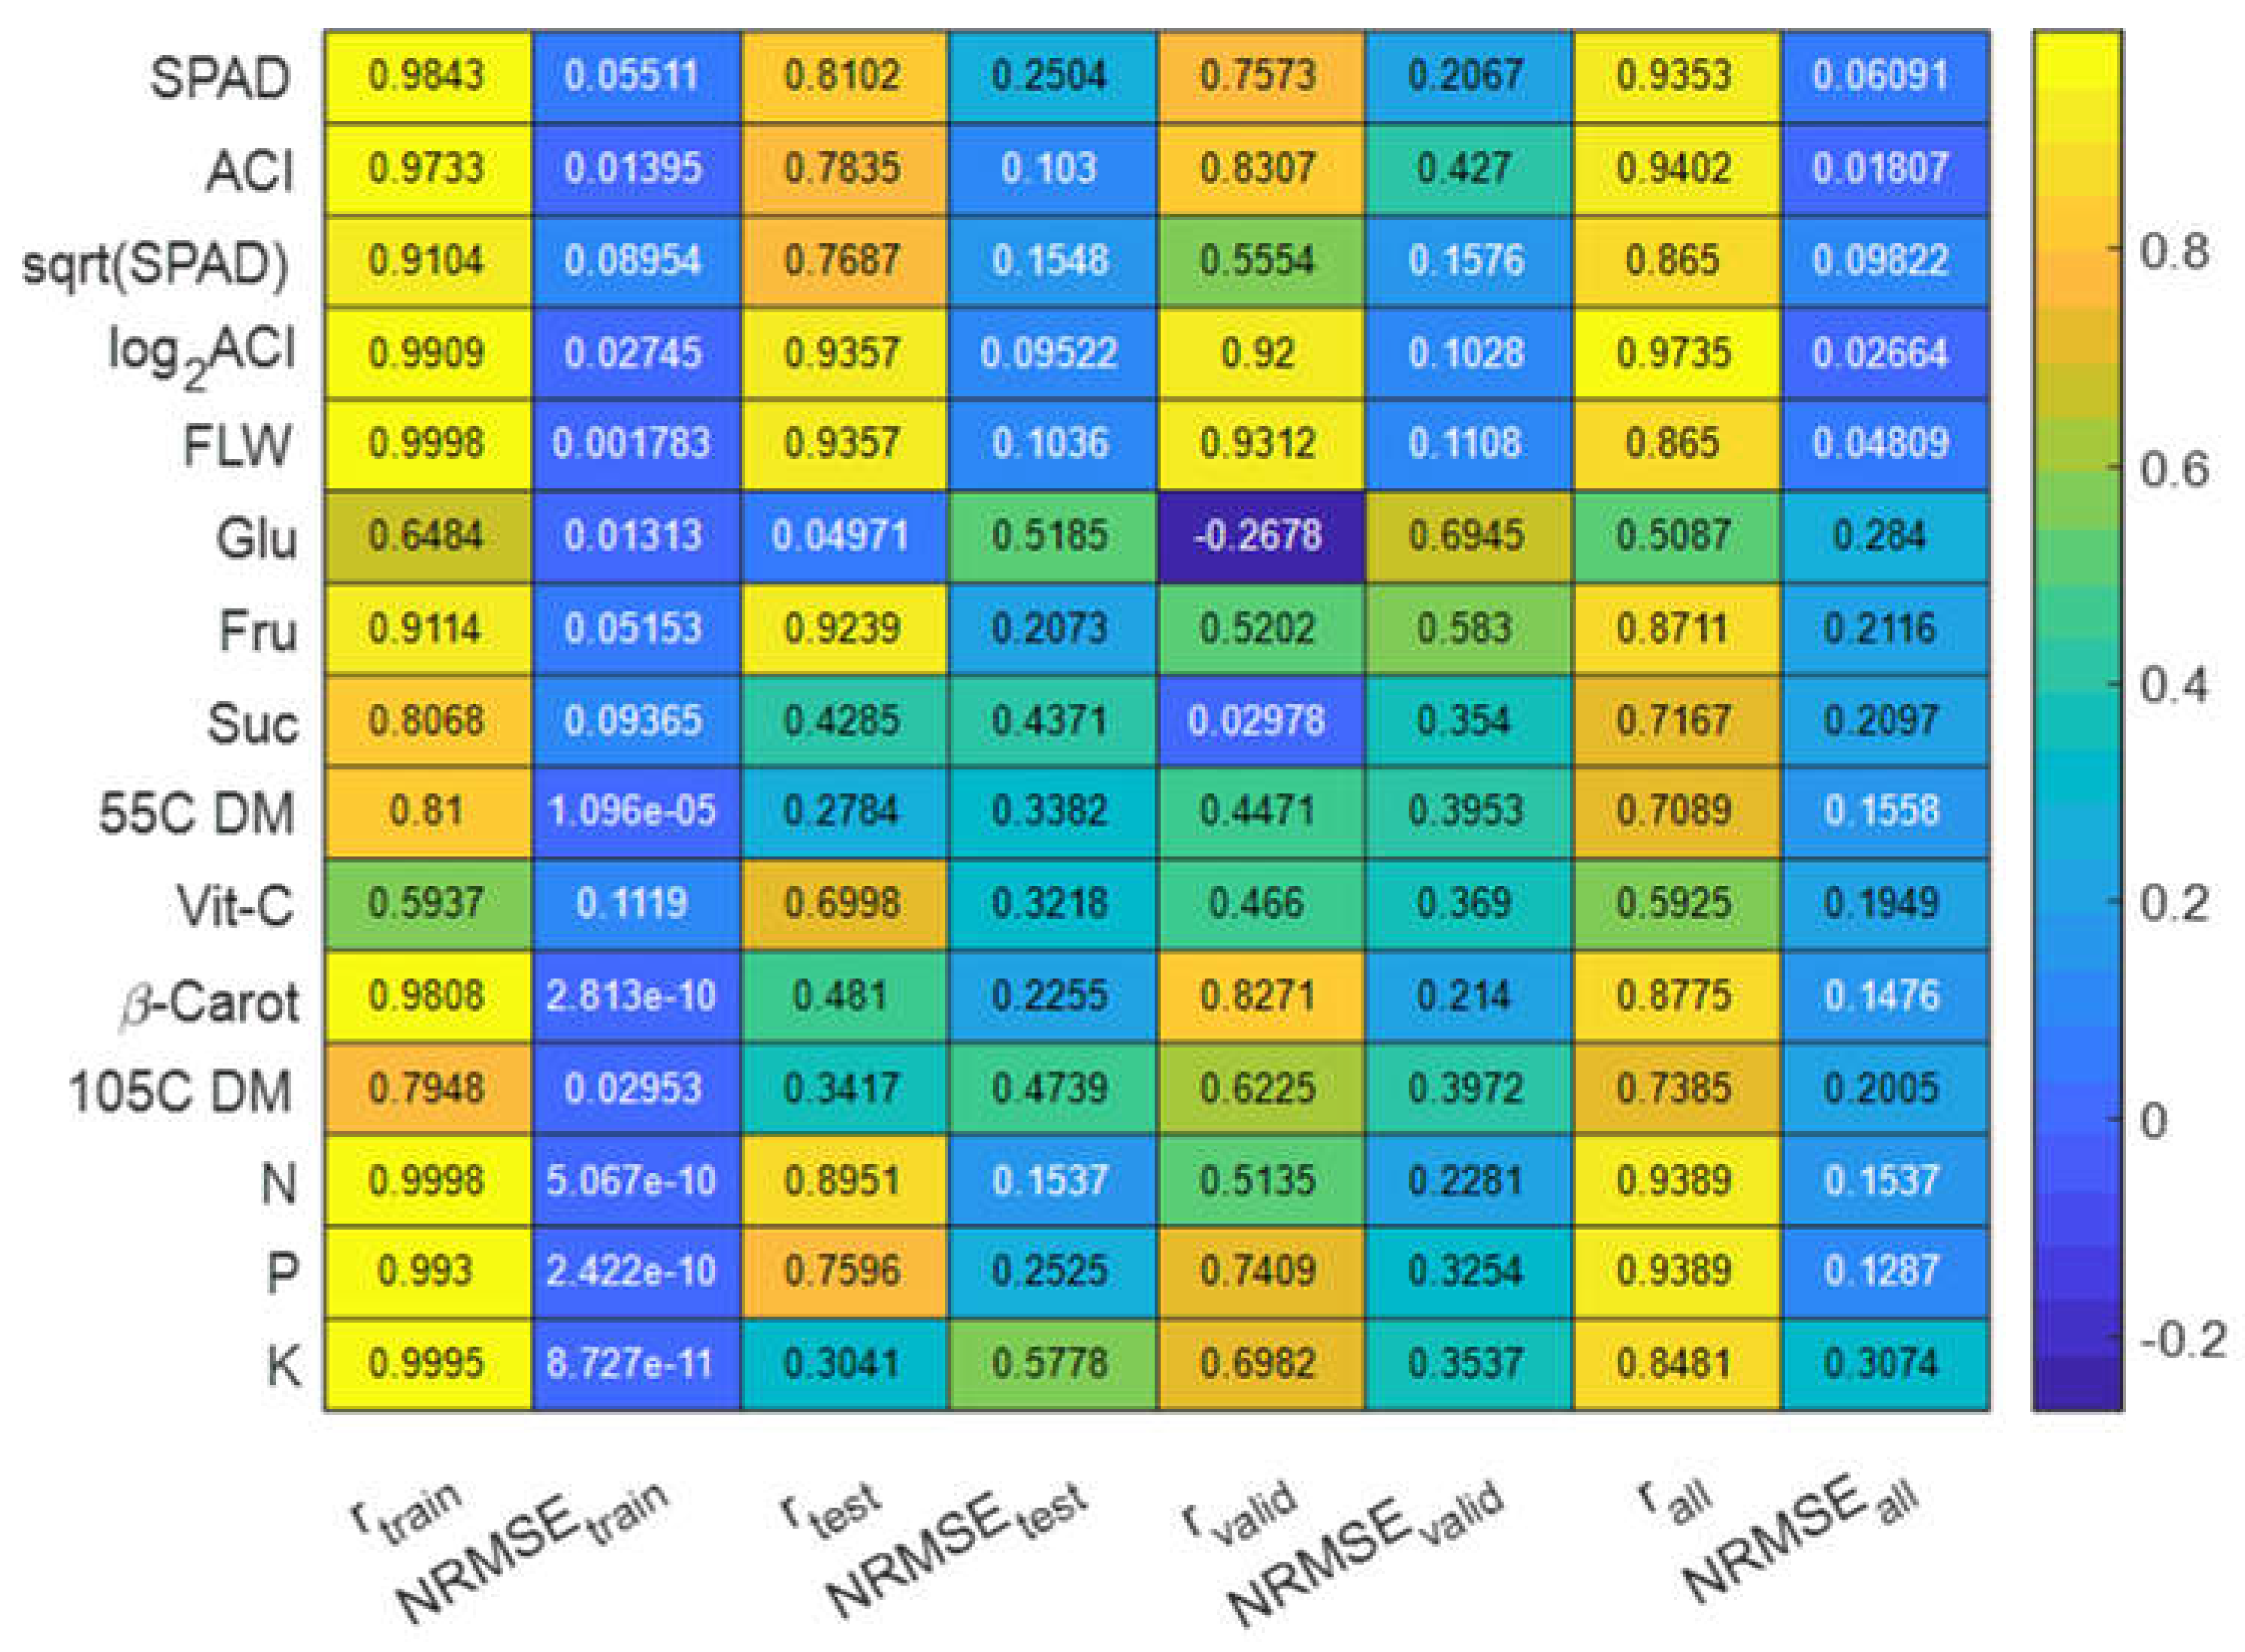
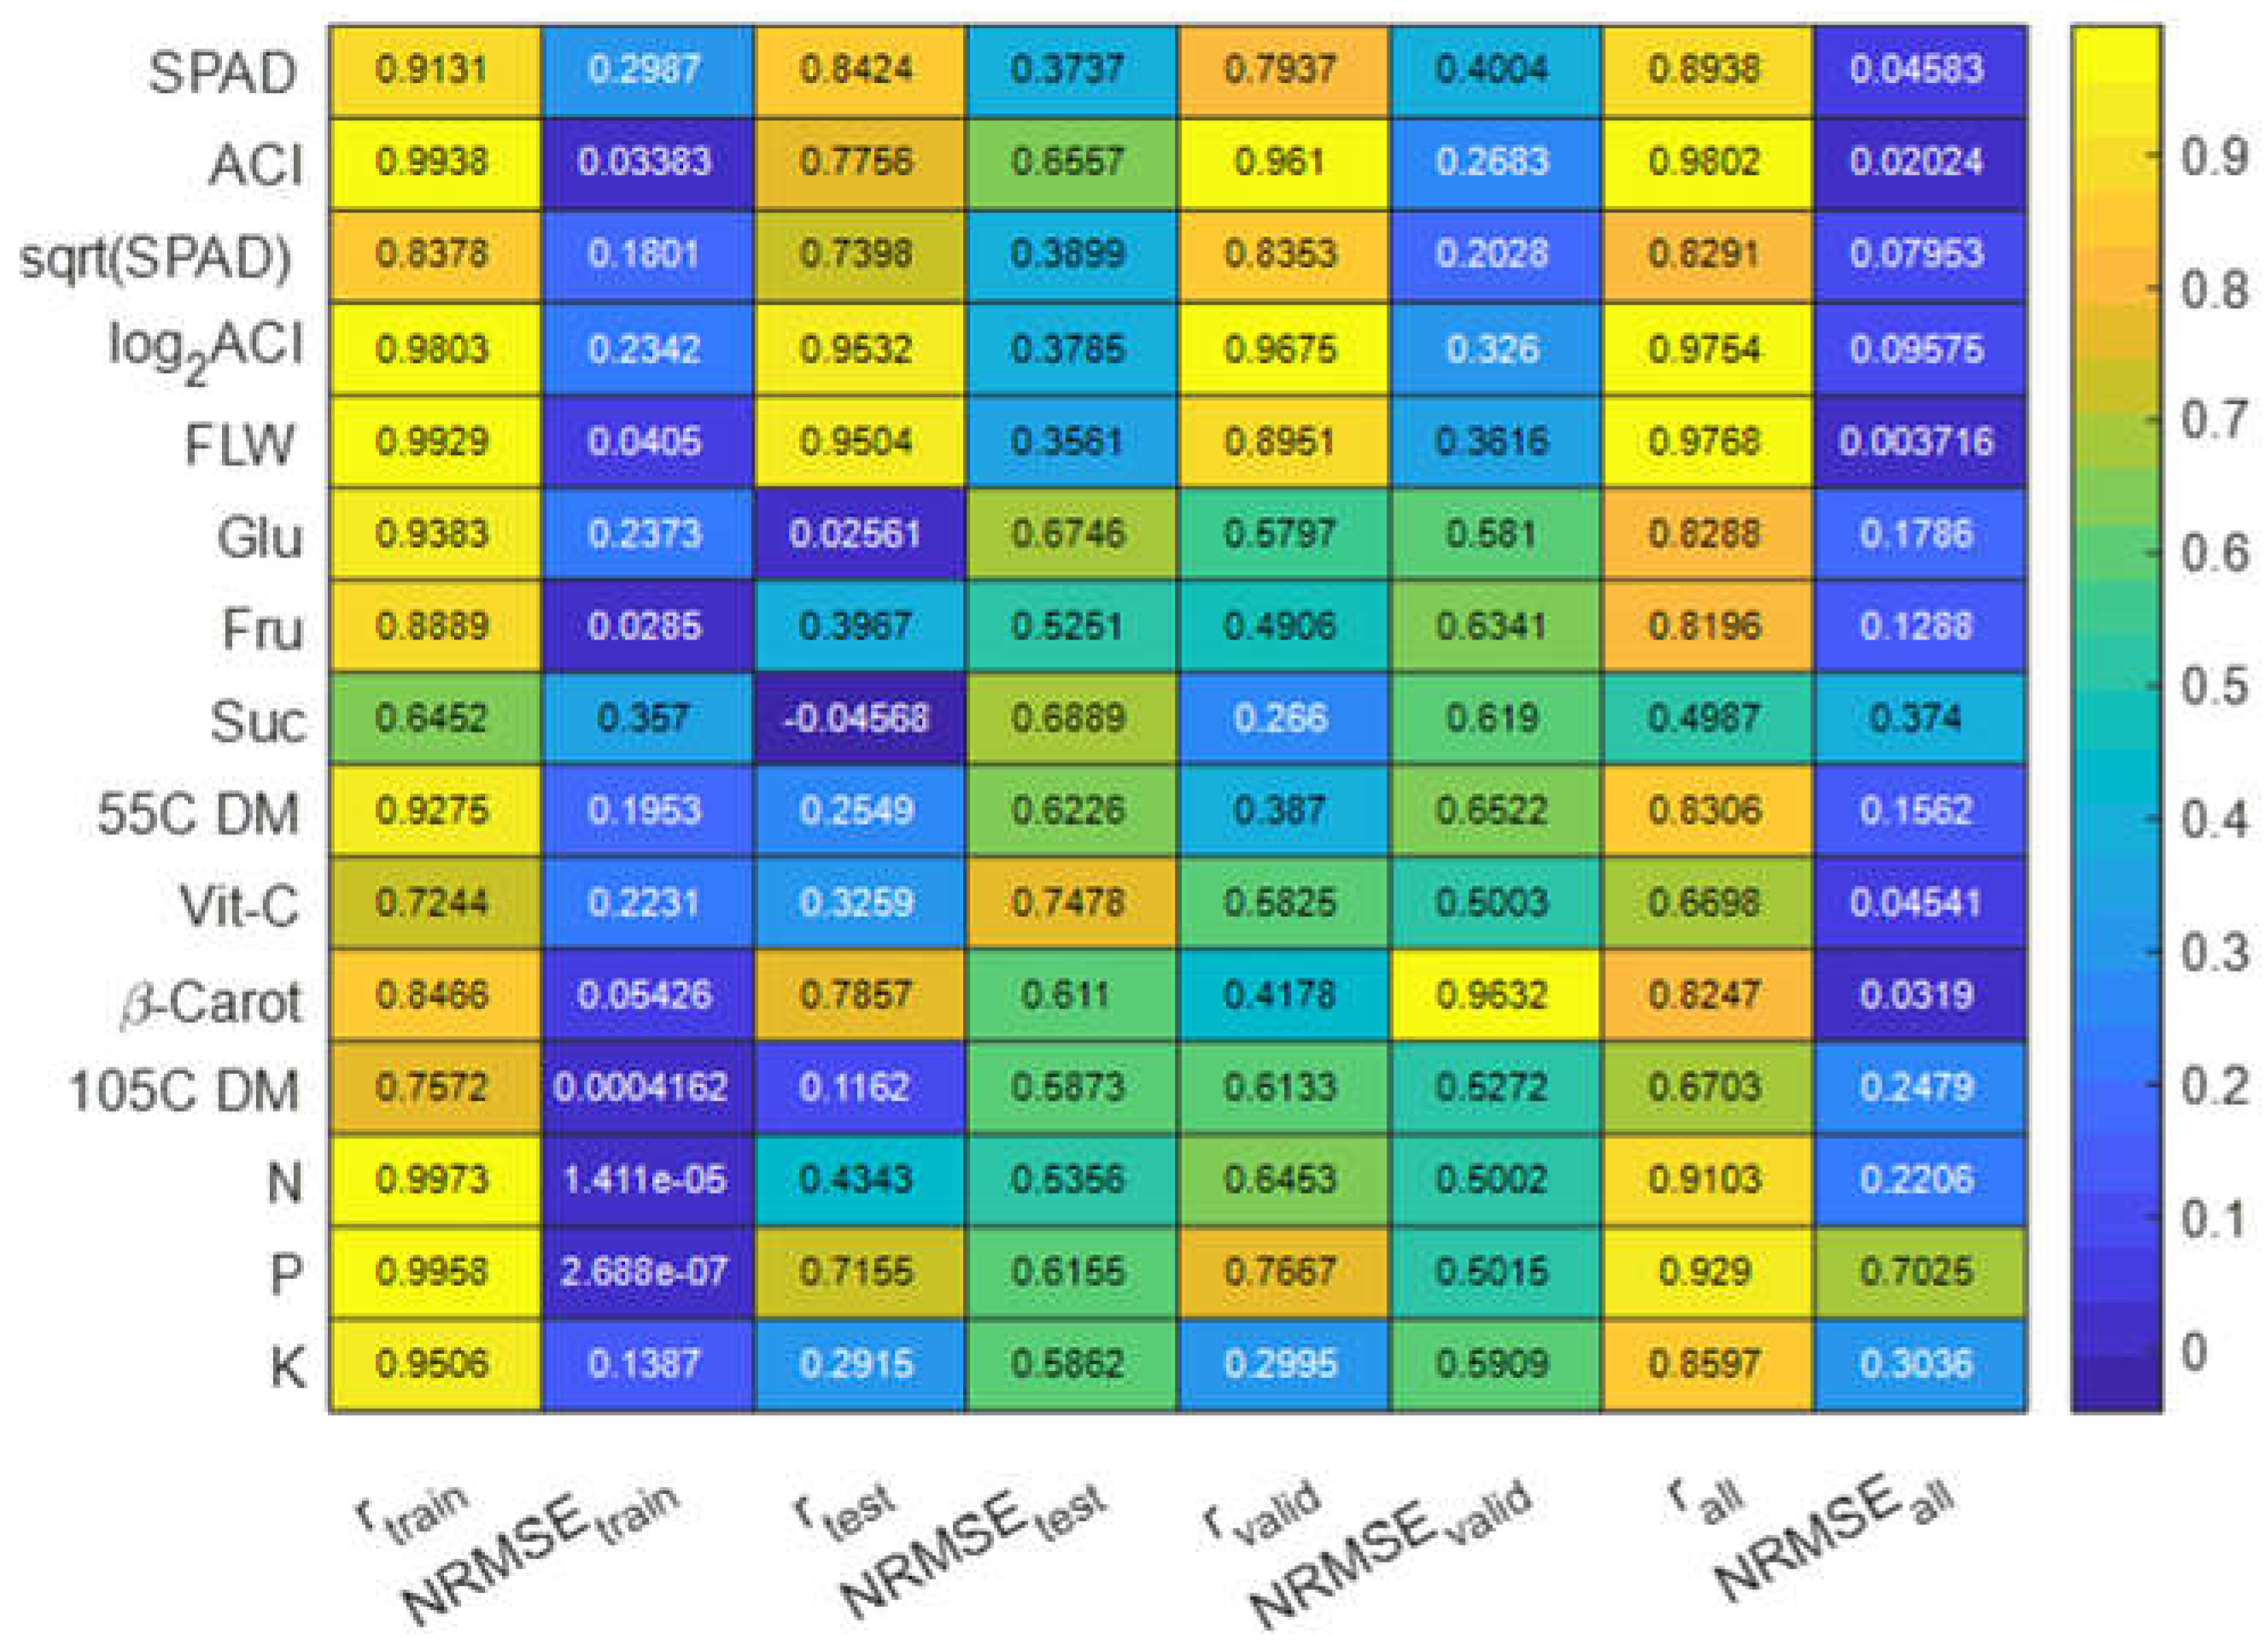
The predictor variable (filtered HSI data) and response variable values were randomly split into 80%, 10%, and 10% for training, testing, and validation sets. 1000 epochs simulations with 10 hidden layers and 1 output layer for ANN models were applied to find the best fitting multivariate predictive linear model based on three performance metrics: mean squared error, error gradient, and correlation coefficient (r) between the predicted values and laboratory-measured (ground truth) values. For the ANN model simulations, two different sets of response variable values were tested, original data (laboratory-measured) (
Figure 7), and a normalized version of the laboratory-measured data (
Figure 8).
When the original data and the ANN model were applied, the highest correlations between the estimated nutrient values and laboratory-measured values were detected for fresh leaf weight (FLW), log2(ACI), N, P, K, SPAD, and β-carotene in the model training phase (r = 0.9808 … 0.9998), testing (r = 0.7500…0.9357), and validation (r = 0.8480…0.9400) (
Figure 7). The accuracy of the estimation models for N, P, K contents are in good agreement with the accuracy of the models developed using back propagation neural network and random forest algorithms (Taha, et. al., 2022). The lowest correlation between the estimated and ground truth values was found for Vit-C, Glu, Fru, 55C DM, 105C DM, and the square root of SPAD, which also showed much higher NRMSE values (
Figure 7).
The ANN model's performance in estimating nutrient levels and other traits, when using normalized values of response variables, showed a slight decline in overall accuracy in terms of the correlation between predicted and measured values for all nutrients except Glu and 55C DM in the training set (
Figure 8). Conversely when evaluating the validation data sets, the models demonstrated improved accuracy for most traits, and the use of normalized response variables resulted in reduced normalized error margins (NRMSE).
4. Conclusions
Based on the data processing approach and the estimated performance of models that were developed from hyperspectral image data, the following can be concluded.
The performed studies demonstrate that the accuracy of the PLSR and PCR models degrades when the hyperspectral data of the whole lettuce plant is collected. Therefore, machine learning algorithms have become a more reliable solution for model development.
Application of machine learning algorithms for classification of the lettuces by the applied treatments based on hyperspectral image data of whole lettuce plant is reliable and provides sufficiently high accuracy, in particular for NK, Osmocote, and PK applied nutrients. This approach can be used to eventually develop a valuable and practical model to identify nutrient deficiency in plants using hyperspectral image data.
The accuracy of models to assess nutrient levels of the studied lettuce cultivars using machine learning algorithms demonstrated that a larger number of predictor (input) and response (output) datasets will likely result in a higher accuracy of the estimation models. For example, SPAD and ACI data collected on 300 samples provided better results than traits with smaller datasets. Additionally, data skewness of response variables may hinder the performances of the machine learning models.
Authorship Contribution: Sulaymon Eshkabilov: Methodology, Software, Validation, Formal analysis, Investigation, Data Analysis, Writing – original draft, Writing – review & editing, Visualization. Ivan Samko: Introduction, Methodology, Investigation, Data collection, Writing – original draft, Writing – review & editing.
Acknowledgments
The authors would like to thank Leah Rosental for growing plants, Prof. Susan Ustin and Leah Rosental for organizing the hyperspectral scanning, and Mr. Prashant Lakhemaru, a graduate student at NDSU, for drawing Figure 1. The mentioned trade names or commercial products in this publication are solely to provide specific information and do not imply recommendation or endorsement by the U.S. Department of Agriculture (USDA).
Conflicts of Interest
The authors declare no conflicts of interest.
Appendix A
Table A1 List of tested accessions, fertilizer treatments, and composition analyses.
Table A1.
List of tested accessions, fertilizer treatments, and composition analyses.
Table A1.
List of tested accessions, fertilizer treatments, and composition analyses.
| Accession |
Description |
Osmocote |
NPK |
nPK |
PK |
NP |
NK |
| Alpi |
cultivar |
P, C, V, W |
|
|
|
|
|
| Annapolis |
cultivar |
P, C, V, W |
P, E, W |
P, E, W |
P, E, W |
P, E, W |
P, E, W |
| Balady Barrage |
cultivar |
P, C, V, W |
P, E, W |
P, E, W |
P, E, W |
P, E, W |
P, E, W |
| Balady Cairo |
cultivar |
P, C, V, W |
|
|
|
|
|
| Bandit |
cultivar |
P, C, V, W |
|
|
|
|
|
| Barcarole |
cultivar |
P |
|
|
|
|
|
| Caesar |
cultivar |
P, C, V, W |
|
|
|
|
|
| Clemente |
cultivar |
P |
|
|
|
|
|
| Conquistador |
cultivar |
P |
|
|
|
|
|
| Dark Green Romaine |
cultivar |
P, C, V, W |
|
|
|
|
|
| Darkland |
cultivar |
P, C, V, W |
P, E, W |
P, E, W |
P, E, W |
P, E, W |
P, E, W |
| Eruption |
cultivar |
P, C, V, W |
P, E, W |
P, E, W |
P, E, W |
P, E, W |
P, E, W |
| FLA24069 |
breeding line |
P, C, V, W |
|
|
|
|
|
| Floricos |
cultivar |
P, C, V, W |
|
|
|
|
|
| Gardenia |
cultivar |
P, C, V, W |
|
|
|
|
|
| Green Forest |
cultivar |
P, C, V, W |
|
|
|
|
|
| Green Towers |
cultivar |
P, C, V, W |
P |
P |
P |
P |
P |
| Heavy Heart |
cultivar |
P, C, V, W |
|
|
|
|
|
| Inverno De Mall |
cultivar |
P, C, V, W |
|
|
|
|
|
| La Brillante |
cultivar |
P, C, V, W |
P, E, W |
P, E, W |
P, E, W |
P, E, W |
P, E, W |
| Lee Tal |
cultivar |
P, C, V, W |
|
|
|
|
|
| Little Gem |
cultivar |
P, C, V, W |
|
|
|
|
|
| Little Lepricon |
cultivar |
P, C, V, W |
|
|
|
|
|
| Merlot |
cultivar |
P, C, V, W |
P, E, W |
P, E, W |
P, E, W |
P, E, W |
P, E, W |
| Parris Island Cos |
cultivar |
P, C, V, W |
|
|
|
|
|
| PI 257288 |
plant introduction |
P, C, V, W |
|
|
|
|
|
| PI 278074 |
plant introduction |
P, C, V, W |
|
|
|
|
|
| PI 278100-COS |
plant introduction |
P, C, V, W |
|
|
|
|
|
| PI 358033-COS |
plant introduction |
P, C, V, W |
|
|
|
|
|
| PI 491038 |
plant introduction |
P |
|
|
|
|
|
| PI 491086 |
plant introduction |
P, C, V, W |
|
|
|
|
|
| PI 665200 |
plant introduction |
P, C, V, W |
|
|
|
|
|
| Queen of Hearts |
cultivar |
P, C, V, W |
|
|
|
|
|
| Romanor |
cultivar |
P |
|
|
|
|
|
| Romaserra |
cultivar |
P, C, V, W |
|
|
|
|
|
| Rubicon |
cultivar |
P, C, V, W |
|
|
|
|
|
| Salinas |
cultivar |
P, C, V, W |
P, E, W |
P, E, W |
P, E, W |
P, E, W |
P, E, W |
| Salinas 88 |
cultivar |
P |
|
|
|
|
|
| SalVal-321 |
breeding line |
P, C, V, W |
|
|
|
|
|
| Siskiyou |
cultivar |
P, C, V, W |
|
|
|
|
|
| SM09A |
breeding line |
P |
|
|
|
|
|
| SM09B |
breeding line |
P, C, V, W |
|
|
|
|
|
| SM13-R2 |
breeding line |
P, C, V, W |
|
|
|
|
|
| SM13-R3 |
breeding line |
P, C, V, W |
|
|
|
|
|
| Solar |
cultivar |
P, C, V, W |
|
|
|
|
|
| Taiwan |
cultivar |
P, C, V, W |
P |
P |
P |
P |
P |
| Triple Threat |
cultivar |
P |
|
|
|
|
|
| UC96US23 |
wild species |
P, C, V, W |
P, E, W |
P, E, W |
P, E, W |
P, E, W |
P, E, W |
| Ultegra |
cultivar |
P, C, V, W |
|
|
|
|
|
| Valmaine |
cultivar |
P, C, V, W |
|
|
|
|
|
References
- Abebe, A.M.; Kim, Y.; Kim, J.; Kim, S.L.; Baek, J. Image-Based High-Throughput Phenotyping in Horticultural Crops. Plants 2023, 12, 2061. [Google Scholar] [CrossRef] [PubMed]
- Ahsan, M.; Eshkabilov, S.; Cemek, B.; Küçüktopcu, E.; Lee, C.W.; Simsek, H. Deep Learning Models to Determine Nutrient Concentration in Hydroponically Grown Lettuce Cultivars (Lactuca sativa L.). Sustainability 2021, 14, 416. [Google Scholar] [CrossRef]
- Bouzari, A.; Holstege, D.; Barrett, D.M. Vitamin Retention in Eight Fruits and Vegetables: A Comparison of Refrigerated and Frozen Storage. J. Agric. Food Chem. 2015, 63, 957–962. [Google Scholar] [CrossRef] [PubMed]
- Chollet, F. (2021). Deep learning with Python (2nd ed.). Shelter Island, NY: Simon & Schuster.
- Dillard CJ, German JB. 2000. Phytochemicals: nutraceuticals and human health. Journal of the Science of Food and Agriculture. 80:1744-1756.
- Eshkabilov, S.; Lee, A.; Sun, X.; Lee, C.W.; Simsek, H. Hyperspectral imaging techniques for rapid detection of nutrient content of hydroponically grown lettuce cultivars. Comput. Electron. Agric. 2021, 181, 105968. [Google Scholar] [CrossRef]
- Eshkabilov, S.; Stenger, J.; Knutson, E.N.; Küçüktopcu, E.; Simsek, H.; Lee, C.W. Hyperspectral Image Data and Waveband Indexing Methods to Estimate Nutrient Concentration on Lettuce (Lactuca sativa L.) Cultivars. Sensors 2022, 22, 8158. [Google Scholar] [CrossRef] [PubMed]
- Falcioni, R.; Gonçalves, J.V.F.; de Oliveira, K.M.; Antunes, W.C.; Nanni, M.R. VIS-NIR-SWIR Hyperspectroscopy Combined with Data Mining and Machine Learning for Classification of Predicted Chemometrics of Green Lettuce. Remote. Sens. 2022, 14, 6330. [Google Scholar] [CrossRef]
- Hueni A, Bialek A. 2017. Cause, effect, and correction of field spectroradiometer interchannel radiometric steps. IEEE Journal of Selected Topics in Applied Earth Observations and Remote Sensing. 10:1542-1551.
- Johansen, H.N.; Glitsø, V.; Knudsen, K.E.B. Influence of Extraction Solvent and Temperature on the Quantitative Determination of Oligosaccharides from Plant Materials by High-Performance Liquid Chromatography. J. Agric. Food Chem. 1996, 44, 1470–1474. [Google Scholar] [CrossRef]
- Jones BJJ. 2001. Extraction of Chloride (Cl), Nitrate (NO3), Orthophosphate (PO4), Potassium (K), and Sulfate (SO4) from Plant Tissue Using 2% Acetic Acid, p. 228-229Laboratory Guide for Conducting Soil tests and Plant Analysis. CRC Press, Boca Raton, FL.
- Kim C, van Iersel MW. 2023. Image-based phenotyping to estimate anthocyanin concentrations in lettuce. Frontiers in Plant Science. 14:1155722.
- Kim, M.J.; Moon, Y.; Tou, J.C.; Mou, B.; Waterland, N.L. Nutritional value, bioactive compounds and health benefits of lettuce (Lactuca sativa L.). J. Food Compos. Anal. 2016, 49, 19–34. [Google Scholar] [CrossRef]
- Kumar, P.; Eriksen, R.L.; Simko, I.; Mou, B. Molecular Mapping of Water-Stress Responsive Genomic Loci in Lettuce (Lactuca spp.) Using Kinetics Chlorophyll Fluorescence, Hyperspectral Imaging and Machine Learning. Front. Genet. 2021, 12. [Google Scholar] [CrossRef]
- Martins GD, Silva OFd, Carmo GJdS, Castoldi R, Santos L, Charlo HCdO. 2021. Estimation of biometric, physiological, and nutritional variables in lettuce seedlings using multispectral images. Revista Brasileira de Engenharia Agrícola e Ambiental. 25:689-695.
- MathWorks 2023. MATLAB 9.14 and Statistics and Machine Learning Toolbox - Ver 12.5, Release 2023a, The MathWorks, Inc., Natick, MA, USA.
- Miller, RO. 1998. Extractable Chloride, Nitrate, Orthophosphate, Potassium, and Sulfate-Sulfur in Plant Tissue: 2% Acetic Acid Extraction, p. 115-118. In: Kalra YP (ed.). Handbook of Reference Methods for Plant Analysis. CRC Press, Boca Raton, FL.
- Moré, J.J. The Levenberg-Marquardt algorithm: Implementation and theory. In Numerical Analysis; Springer: Berlin, Germany, 1978; pp. 105–116. [Google Scholar]
- Mou, B. Genetic Variation of Beta-carotene and Lutein Contents in Lettuce. J. Am. Soc. Hortic. Sci. 2005, 130, 870–876. [Google Scholar] [CrossRef]
- Mou, B. Nutrient Content of Lettuce and its Improvement. Curr. Nutr. Food Sci. 2009, 5, 242–248. [Google Scholar] [CrossRef]
- Pandey, P.; Veazie, P.; Whipker, B.; Young, S. Predicting foliar nutrient concentrations and nutrient deficiencies of hydroponic lettuce using hyperspectral imaging. Biosyst. Eng. 2023, 230, 458–469. [Google Scholar] [CrossRef]
- Peng, H.; Simko, I. Extending lettuce shelf life through integrated technologies. Curr. Opin. Biotechnol. 2023, 81, 102951. [Google Scholar] [CrossRef] [PubMed]
- Prokopy, WR. 1995. Phosphorus in acetic acid extracts. Lachat Instruments, Milwaukee, WI.
- Rangkuti, M.Y.; Saputro, A.H.; Imawan, C. Prediction of soluble solid contents mapping on Averrhoa carambola using hyperspectral imaging. 2017 International Conference on Sustainable Information Engineering and Technology (SIET). LOCATION OF CONFERENCE, IndonesiaDATE OF CONFERENCE; pp. 414–419.
- Simko, I. Predictive Modeling of a Leaf Conceptual Midpoint Quasi-Color (CMQ) Using an Artificial Neural Network. Sensors 2020, 20, 3938. [Google Scholar] [CrossRef]
- Simko I, Hayes RJ, Mou B, McCreight JD. 2014. Lettuce and Spinach, p. 53-86. In: Smith S, Diers B, Specht J, Carver B (eds.). Yield Gains in Major U.S. Field Crops. American Society of Agronomy, Inc., Crop Science Society of America, Inc., and Soil Science Society of America, Inc. [CrossRef]
- Simko, I.; Jimenez-Berni, J.A.; Furbank, R.T. Detection of decay in fresh-cut lettuce using hyperspectral imaging and chlorophyll fluorescence imaging. Postharvest Biol. Technol. 2015, 106, 44–52. [Google Scholar] [CrossRef]
- Simko, I.; Hayes, R.J.; Furbank, R.T. Non-destructive Phenotyping of Lettuce Plants in Early Stages of Development with Optical Sensors. Front. Plant Sci. 2016, 7, 1985. [Google Scholar] [CrossRef] [PubMed]
- Simko, I. Genetic variation and relationship among content of vitamins, pigments, and sugars in baby leaf lettuce. Food Sci. Nutr. 2019, 7, 3317–3326. [Google Scholar] [CrossRef]
- Simko, I. Genetic Variation in Response to N, P, or K Deprivation in Baby Leaf Lettuce. Horticulturae 2020, 6, 15. [Google Scholar] [CrossRef]
- Taha, M.F.; ElManawy, A.I.; Alshallash, K.S.; ElMasry, G.; Alharbi, K.; Zhou, L.; Liang, N.; Qiu, Z. Using Machine Learning for Nutrient Content Detection of Aquaponics-Grown Plants Based on Spectral Data. Sustainability 2022, 14, 12318. [Google Scholar] [CrossRef]
- Yu, S.; Fan, J.; Lu, X.; Wen, W.; Shao, S.; Guo, X.; Zhao, C. Hyperspectral Technique Combined With Deep Learning Algorithm for Prediction of Phenotyping Traits in Lettuce. Front. Plant Sci. 2022, 13, 927832. [Google Scholar] [CrossRef]
- Yu, S.; Fan, J.; Lu, X.; Wen, W.; Shao, S.; Liang, D.; Yang, X.; Guo, X.; Zhao, C. Deep learning models based on hyperspectral data and time-series phenotypes for predicting quality attributes in lettuces under water stress. Comput. Electron. Agric. 2023, 211. [Google Scholar] [CrossRef]
- Zhao, J.; Li, H.; Chen, C.; Pang, Y.; Zhu, X. Detection of Water Content in Lettuce Canopies Based on Hyperspectral Imaging Technology under Outdoor Conditions. Agriculture 2022, 12, 1796. [Google Scholar] [CrossRef]
|
Disclaimer/Publisher’s Note: The statements, opinions and data contained in all publications are solely those of the individual author(s) and contributor(s) and not of MDPI and/or the editor(s). MDPI and/or the editor(s) disclaim responsibility for any injury to people or property resulting from any ideas, methods, instructions or products referred to in the content. |
© 2024 by the authors. Licensee MDPI, Basel, Switzerland. This article is an open access article distributed under the terms and conditions of the Creative Commons Attribution (CC BY) license (https://creativecommons.org/licenses/by/4.0/).
