Introduction
TB stands as a persistent global health threat driven by Mycobacterium tuberculosis (Mtb) infection, affecting millions annually.1 Addressing this challenge necessitates a robust and dynamic TB drug discovery pipeline, integrating innovative methodologies grounded in current TB biology insights. Recent years have witnessed a resurgence in TB drug discovery efforts, yielding a promising array of compounds with diverse potential for drug candidate development. While treatment success rates for drug-sensitive TB reach 85%, managing multi-drug-resistant (MDR) strains presents formidable obstacles due to the limitations of existing therapies, marked by reduced efficacy, prolonged treatment duration, and severe side effects such as hepatotoxicity, ototoxicity, and neuropsychiatric manifestations.2,3 Although TB primarily affects the lungs, its impact extends to various bodily organs, including the brain, kidneys, and spine.4 Antibiotics serve as the cornerstone of TB treatment, yet the emergence of resistant strains underscores the pressing need for innovative therapeutic strategies to combat this global health menace.
The cell envelope of Mtb is characterised by a robust structure comprising various lipid components crucial for its survival and pathogenicity. Among these constituents, mycolic acids stand out as key players in forming the mycobacterial membrane (mycomembrane), thereby influencing the permeability and integrity of the cell wall. Mycolic acid biosynthesis entails the coordinated action of the FadD32-Pks13-AccD4 cluster, where Pks13, serving as a type I polyketide synthase, facilitates a pivotal Claisen condensation step.5,6 Within the Pks13 assembly line, multiple domains such as acyl carrier protein (ACP), ketoacyl synthase (KS), acyl transferase (AT), and thioesterase (TE) synergistically contribute to the synthesis of mycolic acids. This intricate enzymatic machinery ensures the production of these large 3-hydroxy, 2-alkyl fatty acids, essential for Mtb's structural integrity and virulence.6
The Thioesterase (TE) domain within Pks13 is crucial for mycolic acid synthesis in Mtb, as it facilitates the release and transfer of mycolates onto trehalose, forming trehalose monomycolate.5 This process is vital for the biosynthesis of the mycomembrane and essential for the viability of mycobacteria. Recent studies have underscored the significance of Pks13 as a promising target for anti-TB drug development. The crystal structure of the Thioesterase domain of Mtb Pks13 (Mtb Pks13-TE) in complex with an inhibitor has provided valuable insights into its binding characteristics, elucidating specific molecular interactions crucial for inhibitory activity.6–8 This structural elucidation and the subsequent identification of potential inhibitors mark significant progress in the quest for effective therapies against TB. Recently we have applied various approaches to identify potential inhibitors of various MTB drug targets, along with Pks13-TE domain using AI-based and physic-based methods.9,10 In this work we are applying the QSAR method in combination with other techniques for targeting the Thioesterase domain of the Pks13 receptor.
QSAR methods represent one of several strategies to expedite the discovery of novel drugs, including those targeting TB. This approach facilitates the proactive prediction of crucial biological characteristics for potential TB drug candidates through validated multivariate machine learning-based models. Additionally, QSAR methods help unravel the intricate relationships between various factors involved in TB drug development. This study assessed a collection of compounds taken from literature for their potential as inhibitors of the Pks13. QSAR models were developed using a stepwise Multiple Linear Regression (S-MLR) technique.11 Subsequently, novel compounds were designed, and their effectiveness as Pks13 inhibitors was forecasted using the established QSAR model. Following this, molecular docking simulations were conducted to analyse the binding interactions of the designed compounds with the protein target.
Materials & Methods
Dataset Construction
In this study, we assembled a dataset comprising molecules identified from various research papers related to TB drug discovery efforts.
7,8,12 The compounds from the literature provided a well-rounded starting point for exploring potential Pks13 inhibitors in the context of our research objectives. The chemical structures of these molecules were drawn using ChemDraw software and saved in the Structure Data File (SDF) format. We aimed to create a comprehensive dataset for further analysis, explicitly focusing on calculating molecular descriptors for QSAR studies. Furthermore, we diligently retrieved the minimum inhibitory concentration (MIC) values of these molecules from the respective research papers, initially expressed in micromolar (μM), and then converted them into their logarithmic representations using equation (1). These MIC values were crucial indicators of the molecules' potency against Mtb and were essential for assessing their potential as anti-TB agents. By integrating chemical structure data with MIC values, we performed QSAR analyses to gain insights into the structure-activity relationships of these molecules and facilitate the identification of promising candidates for TB drug development.
Molecular Descriptors Calculation
The molecular descriptors were calculated using the PaDEL-Descriptor tool (
http://www.yapcwsoft.com/dd/padeldescriptor/).
13 Molecular descriptors are quantitative representations of various physicochemical properties and structural characteristics of molecules. These descriptors play a vital role in QSAR modelling as they provide valuable insights into the structure-activity relationships of compounds.. The descriptors encompassed various properties, including geometric, topological, electronic, and thermodynamic features. The calculated descriptors served as input variables for our QSAR analyses. They allowed us to build predictive models that correlate the chemical structure of molecules with their biological activities against Mtb. Approximately 1875 descriptors were calculated in this study, encompassing 1D, 2D, and 3D molecular descriptors. Following the calculation of descriptors, the datasets underwent additional optimisation through feature selection techniques.
Data Pretreatment
The refinement of the descriptor set and the choice of suitable statistical or machine learning methodologies were pivotal in the development of reliable QSAR predictive models. The software version 1.2 for data pretreatment, designed by the Drug Theoretics and Cheminformatics (DTC) laboratory, was employed to preprocess the computed molecular descriptors, removing uninformative, redundant, and constant ones. Then, data normalisation was done to ensure consistency and comparability across different compounds, using the software NormalizeData 1.0 developed by the DTC laboratory.14 The molecular descriptors were divided into training and validation sets for model building using the data division software version 1.2, also developed by the DTC laboratory. This division allocated 80% of the compounds for training the model, with the remaining 20% reserved for testing its performance. Notably, the model was constructed using 80% of the entire dataset, and the remaining 20% served as an external validation set to assess the robustness of the established model.
QSAR Model Development and Validation
A QSAR model learns from the characteristics of compounds within the training set. Subsequently, the model is utilised to predict the properties of compounds within the test set. The test set compounds must exhibit structural similarity to those in the training set. This ensures that the model performs effectively, adhering to the principles of similarity-based prediction. The MLR techniques have proven valuable in model development. In this study, the QSAR model was developed and validated using MLRplusValidation software version 1.3 from the DTC laboratory.
15,16 Specifically, MLR efficiently selects several descriptors in regression models, thereby constructing MLR equations in linear and higher polynomial forms. The general expression for MLR is depicted in equation (2), where Y represents the pMIC value, and X1, X2, …, Xn denote the descriptors incorporated in the model along with their respective coefficients M1, M2, …, Mn. The constant term (M0) signifies the intercept in the regression equation. The significance and algebraic signs of the discrete descriptors X1, X2, …, their magnitude determines Xn. It's commonly observed that the number of compounds and descriptors maintains a ratio of 5:1 for a robust model.
In QSAR validation, the effectiveness and credibility of the constructed model were evaluated using various techniques to ascertain its predictive precision and adaptability. This entails dividing the dataset into training and testing sets, where the model was trained on one subset and assessed on another. Internal and external validations evaluated model performance across different data subsets. Moreover, independent datasets were employed for external validation, confirming the model's predictive performance. Various validation metrics, such as the determination coefficient (R^2), root mean square error (RMSE), and mean absolute error (MAE), were computed to gauge the model's predictive precision. Ultimately, thorough QSAR validation was essential to ensure the trustworthiness and utility of the model in predicting the properties of new compounds.
Protein Preparation of the Pks13-TE Domain
To get the three-dimensional (3D) X-ray crystallographic structure of the Pks13 protein, the RCSB-Protein Data Bank (PDB) was explored. Before selecting the final Pks13 protein, several parameters were considered, including resolution, year of deposition, mutation profile, source of organism, availability of co-crystal ligand, gene names, etc. Inspecting all the above parameters, the Pks13 protein structure was selected with a PDB ID of 7VJT.17 The selected protein consists of 291 amino acids, recognised as Pks13 protein. The co-crystal ligand was found to be 7IJ. The resolution and R-value were found to be 1.94Å and 0.18, respectively. Missing hydrogens were added to the protein structure and the structure was relaxed to optimise the sidechain orientations.
Preparation of Active Compound Library and Selection of Chemical Library Database
The parent compound library targeting the Pks13 protein was taken from that dataset prepared for QSAR modelling. Initially, a set of 150 compounds was obtained from the literature. Following a precise screening process, 77 compounds were taken for further consideration due to their MIC value. This approach ensured a comprehensive and diverse set of compounds for subsequent experimental investigations. The resulting compound library, comprising 77 active compounds, formed the foundation for further studies on Pks13 protein inhibition. Antibacterial libraries, comprising approximately 67 thousand compounds, were sourced from diverse online platforms, including Asinex (Asinex.com), ChEMBL (ChEMBL Database), Enamine (REAL Database - Enamine), ChemDiv (ChemDiv), and Selleckchem (Selleck Chemicals).18–22 These libraries were acquired through download processes for subsequent utilisation in the study.
Fingerprint-Based Similarity Search Against Parent Antibacterial Chemical Library Database
A fingerprint-based similarity search was conducted using the Python RDKit23 package in drug discovery research. The objective was to identify potential Pks13 inhibitors within a comprehensive chemical library database comprising 67 thousand compounds. The search was initiated by employing 77 standard known inhibitors/modulators as query compounds. The RDKit package facilitated the generation and comparison of molecular fingerprints, allowing for a systematic exploration of structural similarities between the query compounds and the chemical entities in the Antibacterial library.
This study involved the extraction of molecular fingerprints for the query compounds and the chemical library database. Subsequently, a similarity metric was applied to assess the likeness between the molecular fingerprints quantitatively, enabling the identification of compounds with structural resemblances to the known Pks13 inhibitors. The utilisation of Python and RDKit not only ensured the efficiency and accuracy of the similarity search but also provided a versatile platform for handling the substantial dataset of around 66 thousand compounds. This approach is robust enough to expedite the identification of potential Pks13 inhibitors within large chemical libraries, offering valuable insights for further experimental validation and drug discovery efforts.
Compounds Library Curation
The molecules obtained were carefully examined, and duplicates were removed. After successful curation, the resulting data was arranged using a similarity search algorithm as described earlier, to understand the structural similarities between generated molecules and the reference compounds. The similarity score was used to gauge how similar the two chemicals were. More than 2400 compounds with a similarity score of 0.6 and higher were selected for further study.
Molecular Docking Studies
MPI Vina stands out as a widely embraced software tool, leveraging the Message Passing Interface (MPI) paradigm for efficient parallelisation. Stemming from Autodock Vina, it optimally distributes computational tasks while harnessing multithreading capabilities for enhanced performance.24,25 Specifically tailored for molecular docking studies, MPI Vina finds its stronghold on the Linux operating system.
This study employed molecular docking to sift through a pool of compounds comprising newly designed molecules and a curated set of 150 reference compounds to discern those exhibiting promising binding affinity towards the Pks13 receptor (PDB: 7VJT). Before starting with large databases, it is imperative to validate the protocol to ensure its fidelity in reproducing experimentally observed ligand conformations. For this, a self-docking approach was adopted which involves redocking a co-crystallized ligand (in this case, 7IJ) back into its original binding site, with subsequent assessment of the root-mean-square deviation (RMSD) between the docked pose and the experimentally determined conformation. Iterative adjustments to docking parameters, such as grid dimensions and positioning, were performed to fine-tune the protocol and achieve optimal agreement between the docked and experimental conformations.
Validation protocols were performed to ascertain the reliability of docking studies. A threshold RMSD value of 2 Å, indicative of satisfactory agreement between the docked and experimental poses, was used as a protocol validation benchmark. Once the docking protocol was deemed validated, the molecular dataset was prepared for docking experiments. OpenBabel26, a versatile tool for molecular file format conversion and preparation, was employed to ensure uniformity and compatibility of molecular structures. Additionally, molecular Gasteiger charges were assigned, atom types were designated according to AutoDock 4 (AD4) specifications, and protonation states were adjusted to mimic physiological conditions (pH 7.4).
Subsequently, the prepared molecules were converted into the required file format (pdbqt), which is suitable for docking with MPI Vina. The determination of grid coordinates and size for the active site is pivotal for accurate docking predictions, these were adopted from the validation process. These coordinates (-2.249, -22.607, 166.686) and a grid size of 40 × 40 × 40 provided a tailored framework for efficiently exploring ligand-receptor interactions. With the groundwork laid and the validation completed, the molecular docking phase ensued, culminating in evaluating binding energies for each docked molecule. A stringent criterion, leveraging the highest negative binding energy observed for 7IJ as a threshold, was employed to identify molecules exhibiting superior binding affinity towards the Pks13 receptor. These select compounds, surpassing the predetermined threshold, emerged as prime candidates warranting further scrutiny in subsequent stages of the drug discovery pipeline.
Biological Activity Prediction Using Validated QSAR Model
The biological activity of filtered compounds was predicted using a validated QSAR model. The process began with creating molecular descriptors for filtered compounds using PaDEL-Descriptor, which represents the compounds' various physicochemical and structural properties quantitatively. Subsequently, from this pool of descriptors, those found to be the most relevant descriptors were selected to predict the biological activity of the filtered compounds. The descriptor data was normalised to ensure consistency and comparability across different compounds. This normalisation step is crucial for removing any biases that may arise due to variations in the scales of other descriptors. Using Python scripting, we employed standardized descriptors to predict the biological activity of compounds as anti-TB agents. Promising candidates were identified for further experimental validation and drug development. Molecules with favourable biological activity were advanced to the subsequent stage.
Absolute Binding Free Energy Calculations Employing KDeep
Using a neural network approach, the KDeep tool27 predicted the relative binding affinity of the screened compounds obtained from the ADV docking output. Specifically, the investigation employed the cutting-edge online protein-ligand binding affinity prediction tool KDeep, based on 3D convolutional neural networks (3DCNN), to determine each chemical's binding affinity with the Pks13 protein.
The KDeep tool is built upon a highly advanced deep convolutional neural networks (DCNNs) architecture, which has undergone rigorous pre-training, testing, and validation using the PDBbind v.2016 database
28. When activated, KDeep initially divides the binding site into eight distinct pharmacophore-like features or descriptors, encompassing aromaticity, hydrophobicity, metallicity, ionizability (positive or negative), and total excluded volume. Using these descriptors, KDeep generates predictive models to estimate binding affinities for ligand-receptor interactions. This freely accessible tool can be accessed via
https://playmolecule.com/Kdeep/ . In this study, KDeep was utilized with compounds screened from ADV as input, with all features set to their default settings.
Molecular Dynamics (MD) Simulation Study
MD simulations were conducted to understand the dynamic behaviour of the Pks13 protein and its critical residues and changes. The simulations were conducted for selected complexes, including the co-crystal ligand, using GROMACS 2022.5.29 Analysis of the 100ns MD trajectory was performed, and PCA and DCCM analysis were conducted to elucidate the complex dynamic motions observed in the simulated protein-ligand complexes. The simulations provided valuable insights into the structural dynamics and interactions within the proposed complexes, providing a deeper understanding of the potential binding stability of the ligands.
Exploring conformations close to the native state structure and obtaining a protein's free-energy landscape (FEL) involves conformational sampling techniques, notably MD simulations. Free energy landscapes elucidate all conformational states of a molecule and their interactions with other molecules in terms of spatial position, playing a pivotal role in understanding their respective free energy levels. Three-dimensional representations of the free energy landscapes (FELs) were generated for the selected compounds along with 7IJ (co-crystal). Stable energetic conformations were depicted in blue regions, while less stable conformations were highlighted in red.
Molecular Mechanics with Generalised Born and Surface Area Solvation (MM-GBSA)
Binding Free Energy Calculation through MM-GBSA Approach
The stability of the ligand-protein complex system resulting from MD simulations was confirmed by assessing the free binding energy using the MM/GBSA
30 approach. It was emphasised that the binding free energy obtained from MD simulation trajectories is considered more dependable and consistent when compared to binding energies derived from molecular docking. The calculation of free binding energy adheres to the following formulas:
The binding energy (ΔGbind) quantifies the energetic interaction between a ligand and its receptor. The free energy of the complex system (ΔGcomplex) accounts for the overall thermodynamic stability of the ligand-receptor complex. ΔGprotein and ΔGligand denote the individual contributions of the protein and ligand, respectively, to the free energy within the complex system. Additionally, ΔGGB and ΔGSA signify the influence of solvent polarity and nonpolarity on the free energy in a solvent environment. ΔS represents the entropy change of the ligand structure during sampling. Lastly, ΔEMM denotes the gas phase free energy component.
Results and Discussion
The quest for discovering and identifying novel molecules started with data curation as mentioned in the methods section.
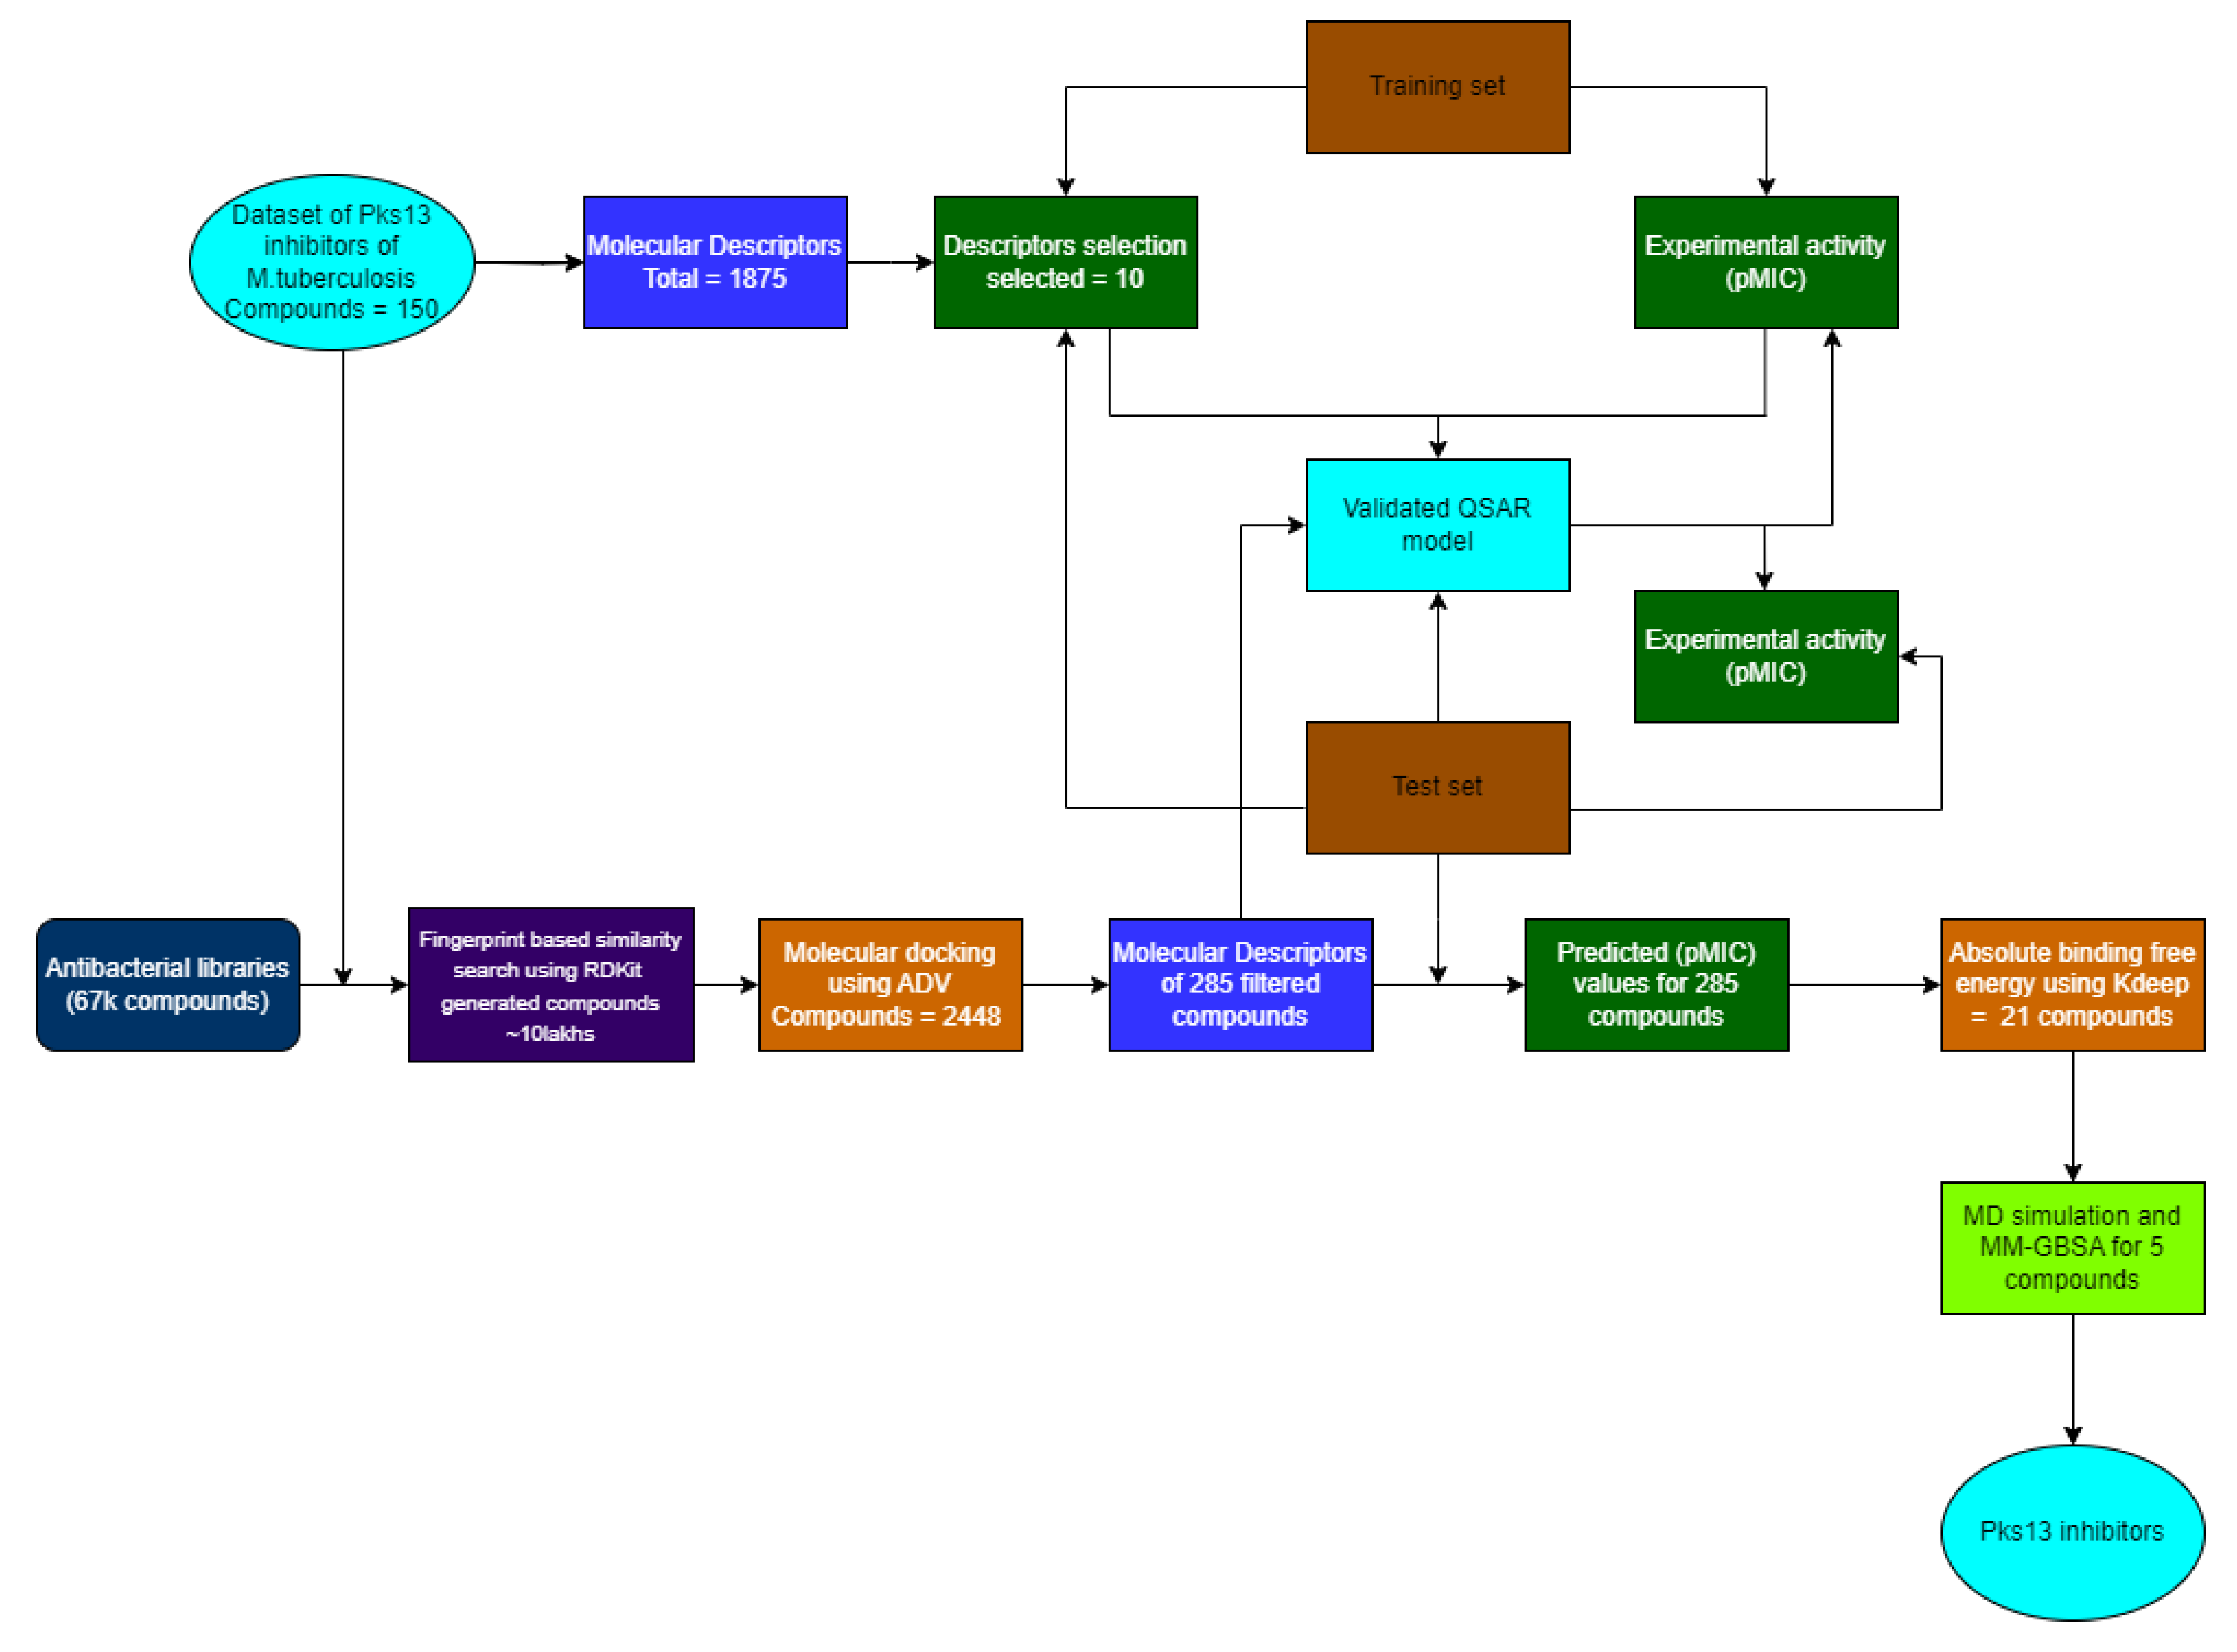
Figure 1 gives a summary of the workflow that was followed during this study.
QSAR Modelling
In this study, we constructed a comprehensive dataset comprising molecules sourced from various TB drug discovery literature to explore potential inhibitors targeting Pks13. The chemical structures of these compounds were drawn and saved in SDF format using ChemDraw software (These are provided in the SI). Additionally, MIC values were meticulously extracted from the literature, serving as crucial indicators of the molecules' potency against Mtb. Subsequently, molecular descriptors were calculated using the PaDEL-Descriptor software, generating around 1875 descriptors encompassing geometric, topological, electronic, and thermodynamic features. Data pretreatment involved refining the descriptor set, normalisation, and division into training and validation sets (
Table 1). QSAR model development utilised MLR technique, with MLR equations constructed to predict pMIC values based on ten selected descriptors (
Table 2). Model validation involved internal and external validation, assessing predictive precision using metrics such as R
2, RMSE, and MAE. Thorough QSAR validation was pivotal to ensuring the reliability and utility of the predictive model in identifying potential anti-TB agents.
The equation (Eq 3.1) demonstrates the linear relationship between ten descriptors, detailed in
Table 1, and the pMIC. Evaluating the performance of the QSAR model derived from the MLR technique involves analyzing various parameters outlined in
Table 3. A higher coefficient of determination (R
2) and lower mean absolute error (MAE) indicate the statistical adequacy of the QSAR model as per Eq 3.1. Additionally, the cross-validation correlation coefficient (R
2pred = 0.75) exceeding 0.5 validates the accuracy of the QSAR model obtained via MLR. It's worth noting that a lower R
2pred compared to R
2 suggests potential model fragility and vulnerability upon exclusion of any training set element (
Table 3). The comparison between observed and predicted activity for test set compounds, along with absolute residual values, is provided in
Table 2. In
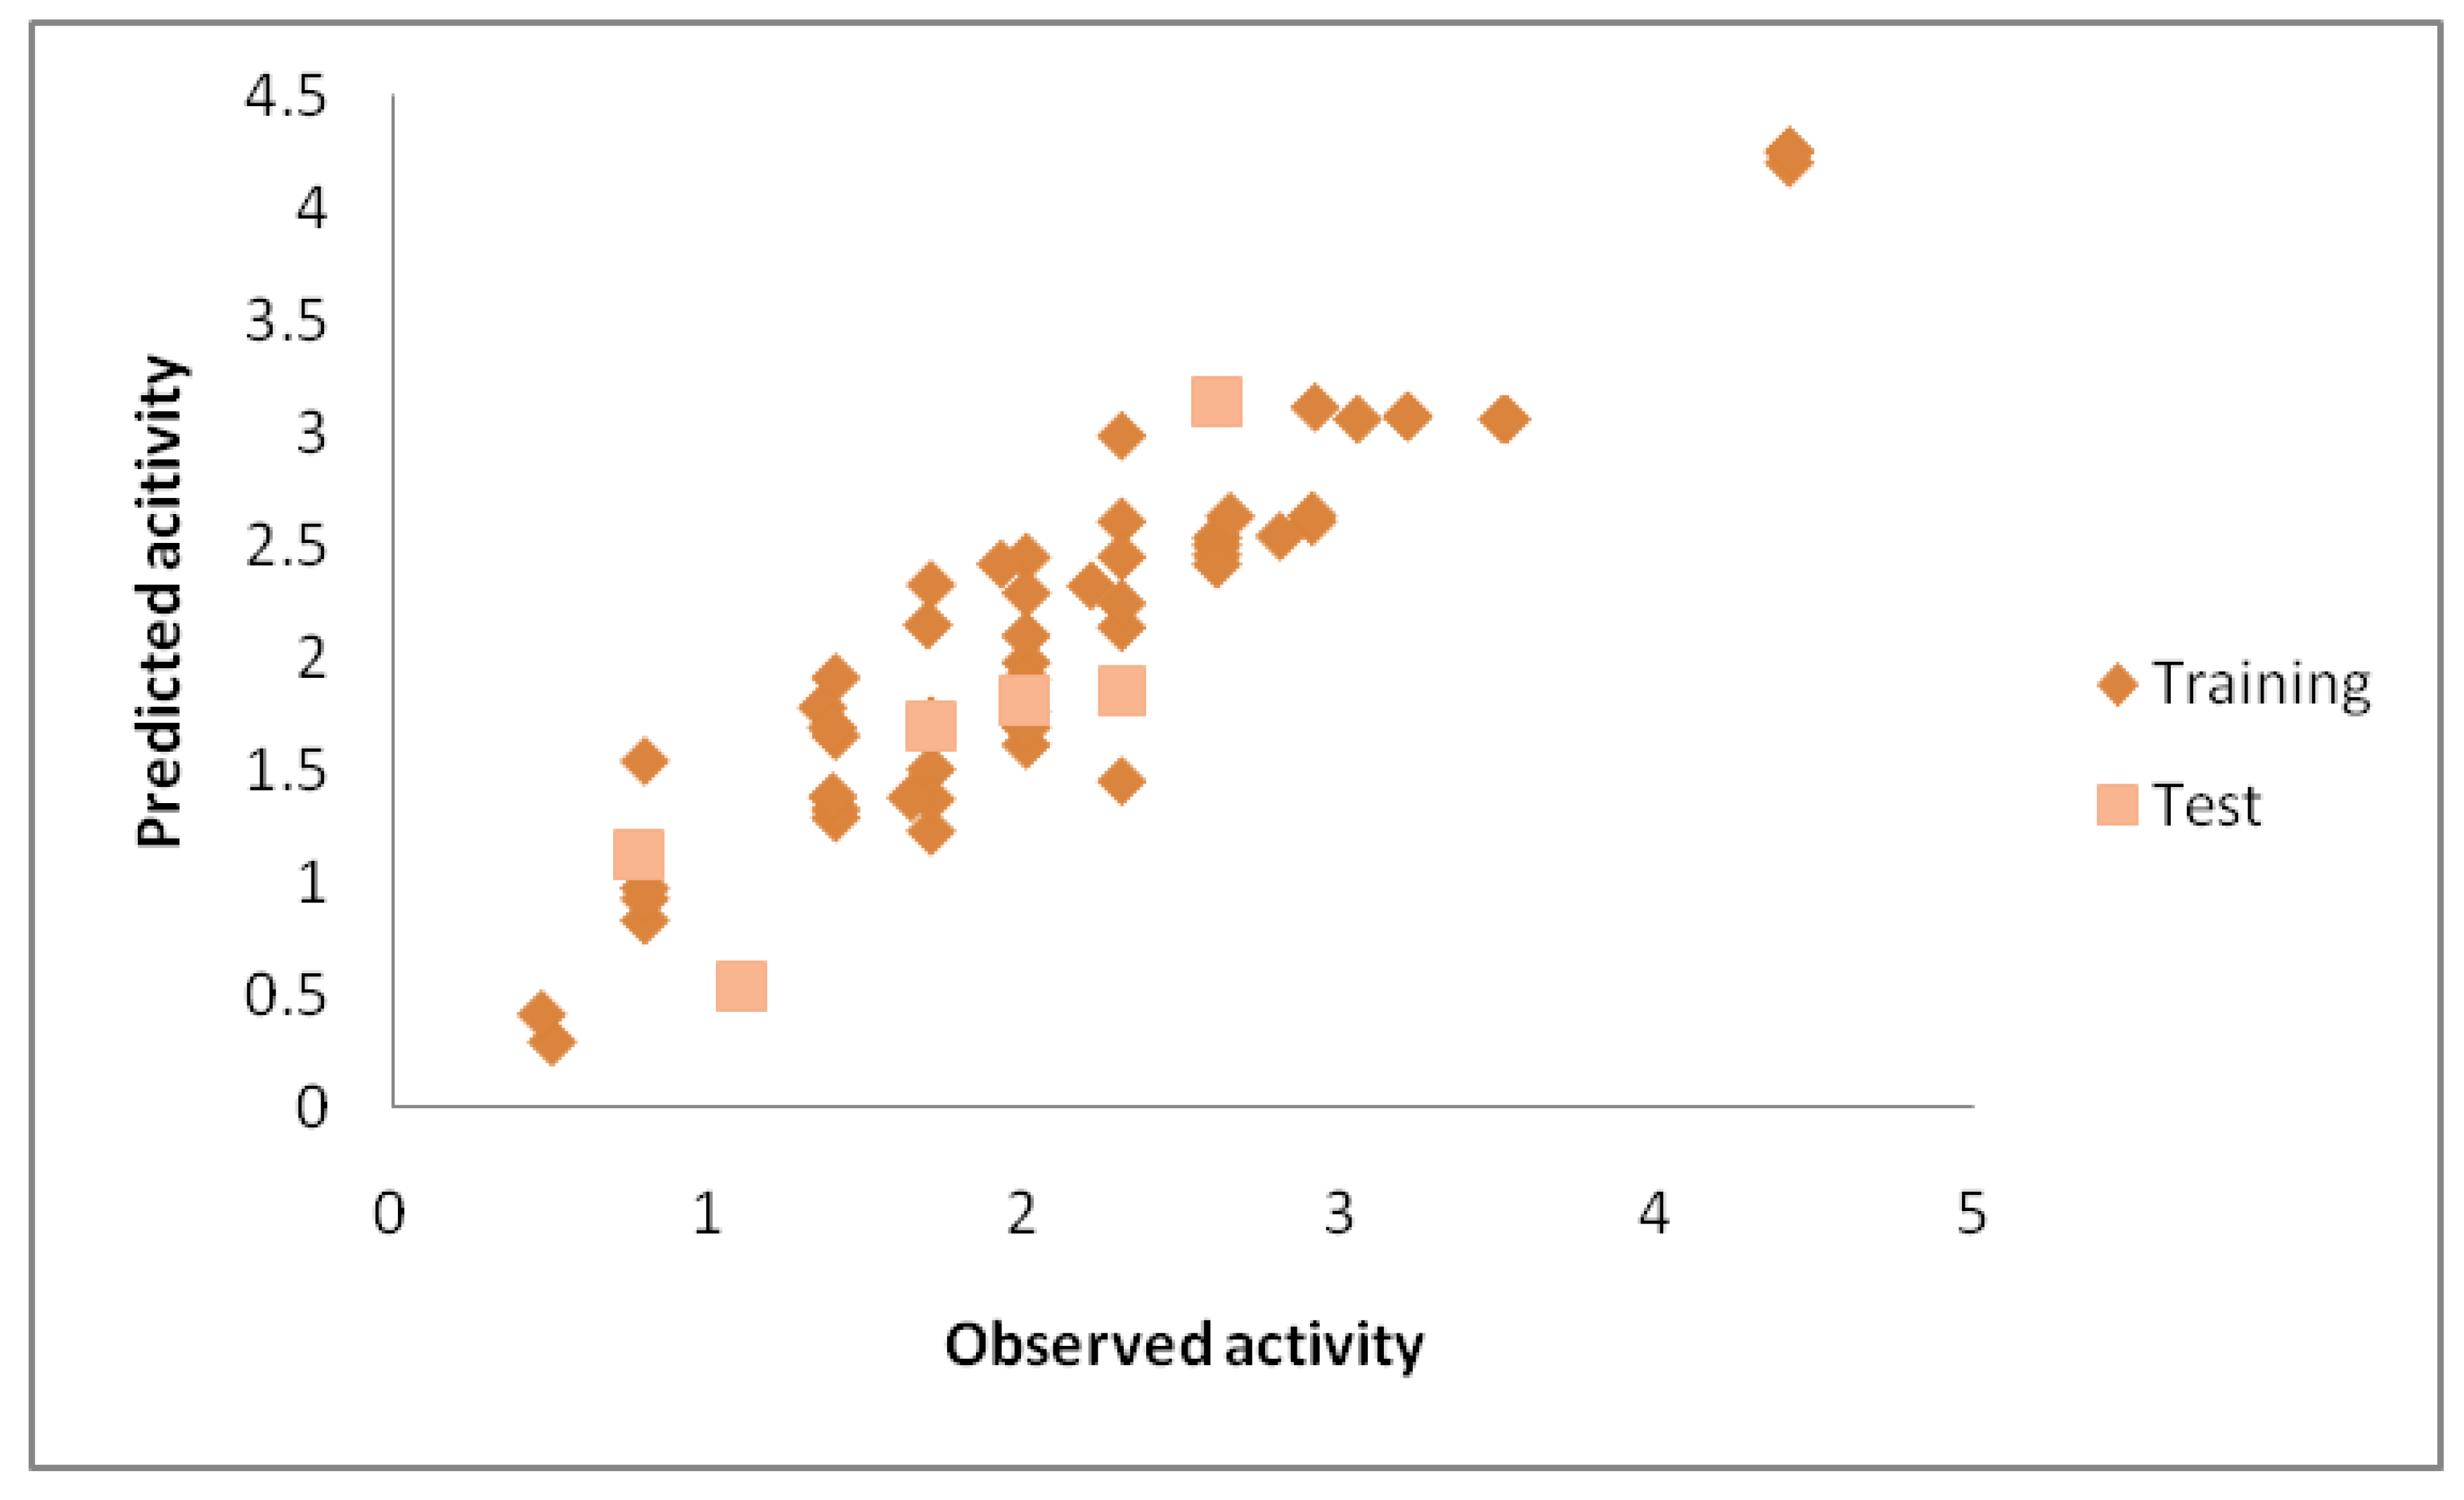
Figure 2, the relationship between observed and predicted pMIC values is depicted, with the latter generated by the QSAR model employing the MLR technique for both training and test set molecules. The correlation between observed and predicted activity (pMIC) values, as demonstrated in
Figure 2, underscores the connection between experimentally obtained values and those predicted by the QSAR model, supported by the low MAE value.
Figure 2.
Scatter plot depicting the observed activity versus the predicted activity for both the Training and Test sets, utilising the MLR model.
Figure 2.
Scatter plot depicting the observed activity versus the predicted activity for both the Training and Test sets, utilising the MLR model.
Table 1.
List of Descriptors obtained from the QSAR model.
Table 1.
List of Descriptors obtained from the QSAR model.
| S.No. |
Descriptor |
Type |
Information |
| 1. |
AATSC6c |
2D |
Average centred Broto-Moreau autocorrelation - lag six / weighted by Sanderson electronegativities. |
| 2. |
IC2 |
2D |
Information content index (neighbourhood symmetry of 2-order) |
| 3. |
ATSC1e |
2D |
Centred Broto-Moreau autocorrelation - lag one / weighted by Sanderson electronegativities |
| 4. |
ALogp2 |
2D |
Square ofAlogP |
| 5. |
ATSC4c |
2D |
Centred Broto-Moreau autocorrelation - lag four / weighted by charges |
| 6. |
SpMax5_Bhm |
2D |
The largest absolute eigenvalue of Burden-modified matrix - n 5 / weighted by relative mass |
| 7. |
VR3_Dzp |
2D |
Logarithmic Randic-like eigenvector-based index from Barysz matrix / weighted by polarizabilities |
| 8. |
MATS7s |
2D |
Moran autocorrelation - lag seven / weighted by I-state |
| 9. |
SpMax7_Bhm |
2D |
The largest absolute eigenvalue of Burden-modified matrix - n 7 / weighted by relative mass |
| 10. |
AATSC8p |
2D |
Averaged-centred Broto-Moreau autocorrelation - lag eight / weighted by polarizability |
Table 2.
Predicted (pMIC) values for Compounds in the Test set.
Table 2.
Predicted (pMIC) values for Compounds in the Test set.
| Compounds |
pMIC (observed) |
pMIC (predicted) |
Absolute Residual |
| 2 |
1.699 |
1.697 |
0.002 |
| 17 |
1.097 |
0.546 |
0.551 |
| 81 |
2.301 |
1.854 |
0.447 |
| 87 |
2.602 |
3.138 |
0.536 |
| 101 |
1.991 |
1.809 |
0.182 |
| 113 |
0.772 |
1.136 |
0.364 |
Table 3.
Statistical parameters used to assess a model's performance and the threshold values considered acceptable for validating QSAR models.
Table 3.
Statistical parameters used to assess a model's performance and the threshold values considered acceptable for validating QSAR models.
| Parameter |
Observed |
Threshold value |
| R2 (internal) |
0.879 |
≥0.6 |
| R2 pred
|
0.752 |
≥0.5 |
| Q2 (LOO) |
0.820 |
≥0.5 |
| Scaled Average rm2 (LOO) |
0.753 |
≥0.5 |
| Scaled Average rm2 (test) |
0.600 |
≥0.5 |
| Scaled Delta rm2(LOO) |
0.081 |
≤0.2 |
| Scaled Delta rm2(test) |
0.185 |
≤0.2 |
| Mean Absolute Error (MAE) |
0.306 |
≤0.1×training set range |
Compounds Library Generation Using RDKit
We utilised a multi-step approach to pinpoint potential inhibitors that target the Pks13 protein, a vital enzyme in TB drug discovery. Our first step involved sourcing the three-dimensional X-ray crystallographic structure of the Pks13 protein from the RCSB-Protein Data Bank (PDB). We carefully selected a specific structure (PDB ID: 7VJT) based on various parameters such as resolution, mutation profile, and availability of a co-crystal ligand (7IJ). Next, we created an active compound library by choosing 77 compounds with outstanding MIC values from an initial dataset of 150 compounds sourced from the literature. Furthermore, we expanded our search for potential inhibitors by acquiring antibacterial compound libraries comprising approximately 67 thousand compounds from various online platforms. To identify compounds with structural similarities to known Pks13 inhibitors, we employed a fingerprint-based similarity search utilizing the Python RDKit package to compare the query compounds with the vast antibacterial library. After diligent curation and removing duplicates, we selected over 2400 compounds with a similarity score of 0.6 and higher from the pool of over 1 million generated compounds for further investigation. This comprehensive and thorough approach facilitated the identification of potential Pks13 inhibitors within large chemical library.
Molecular Docking – AutoDock Vina Based Analysis
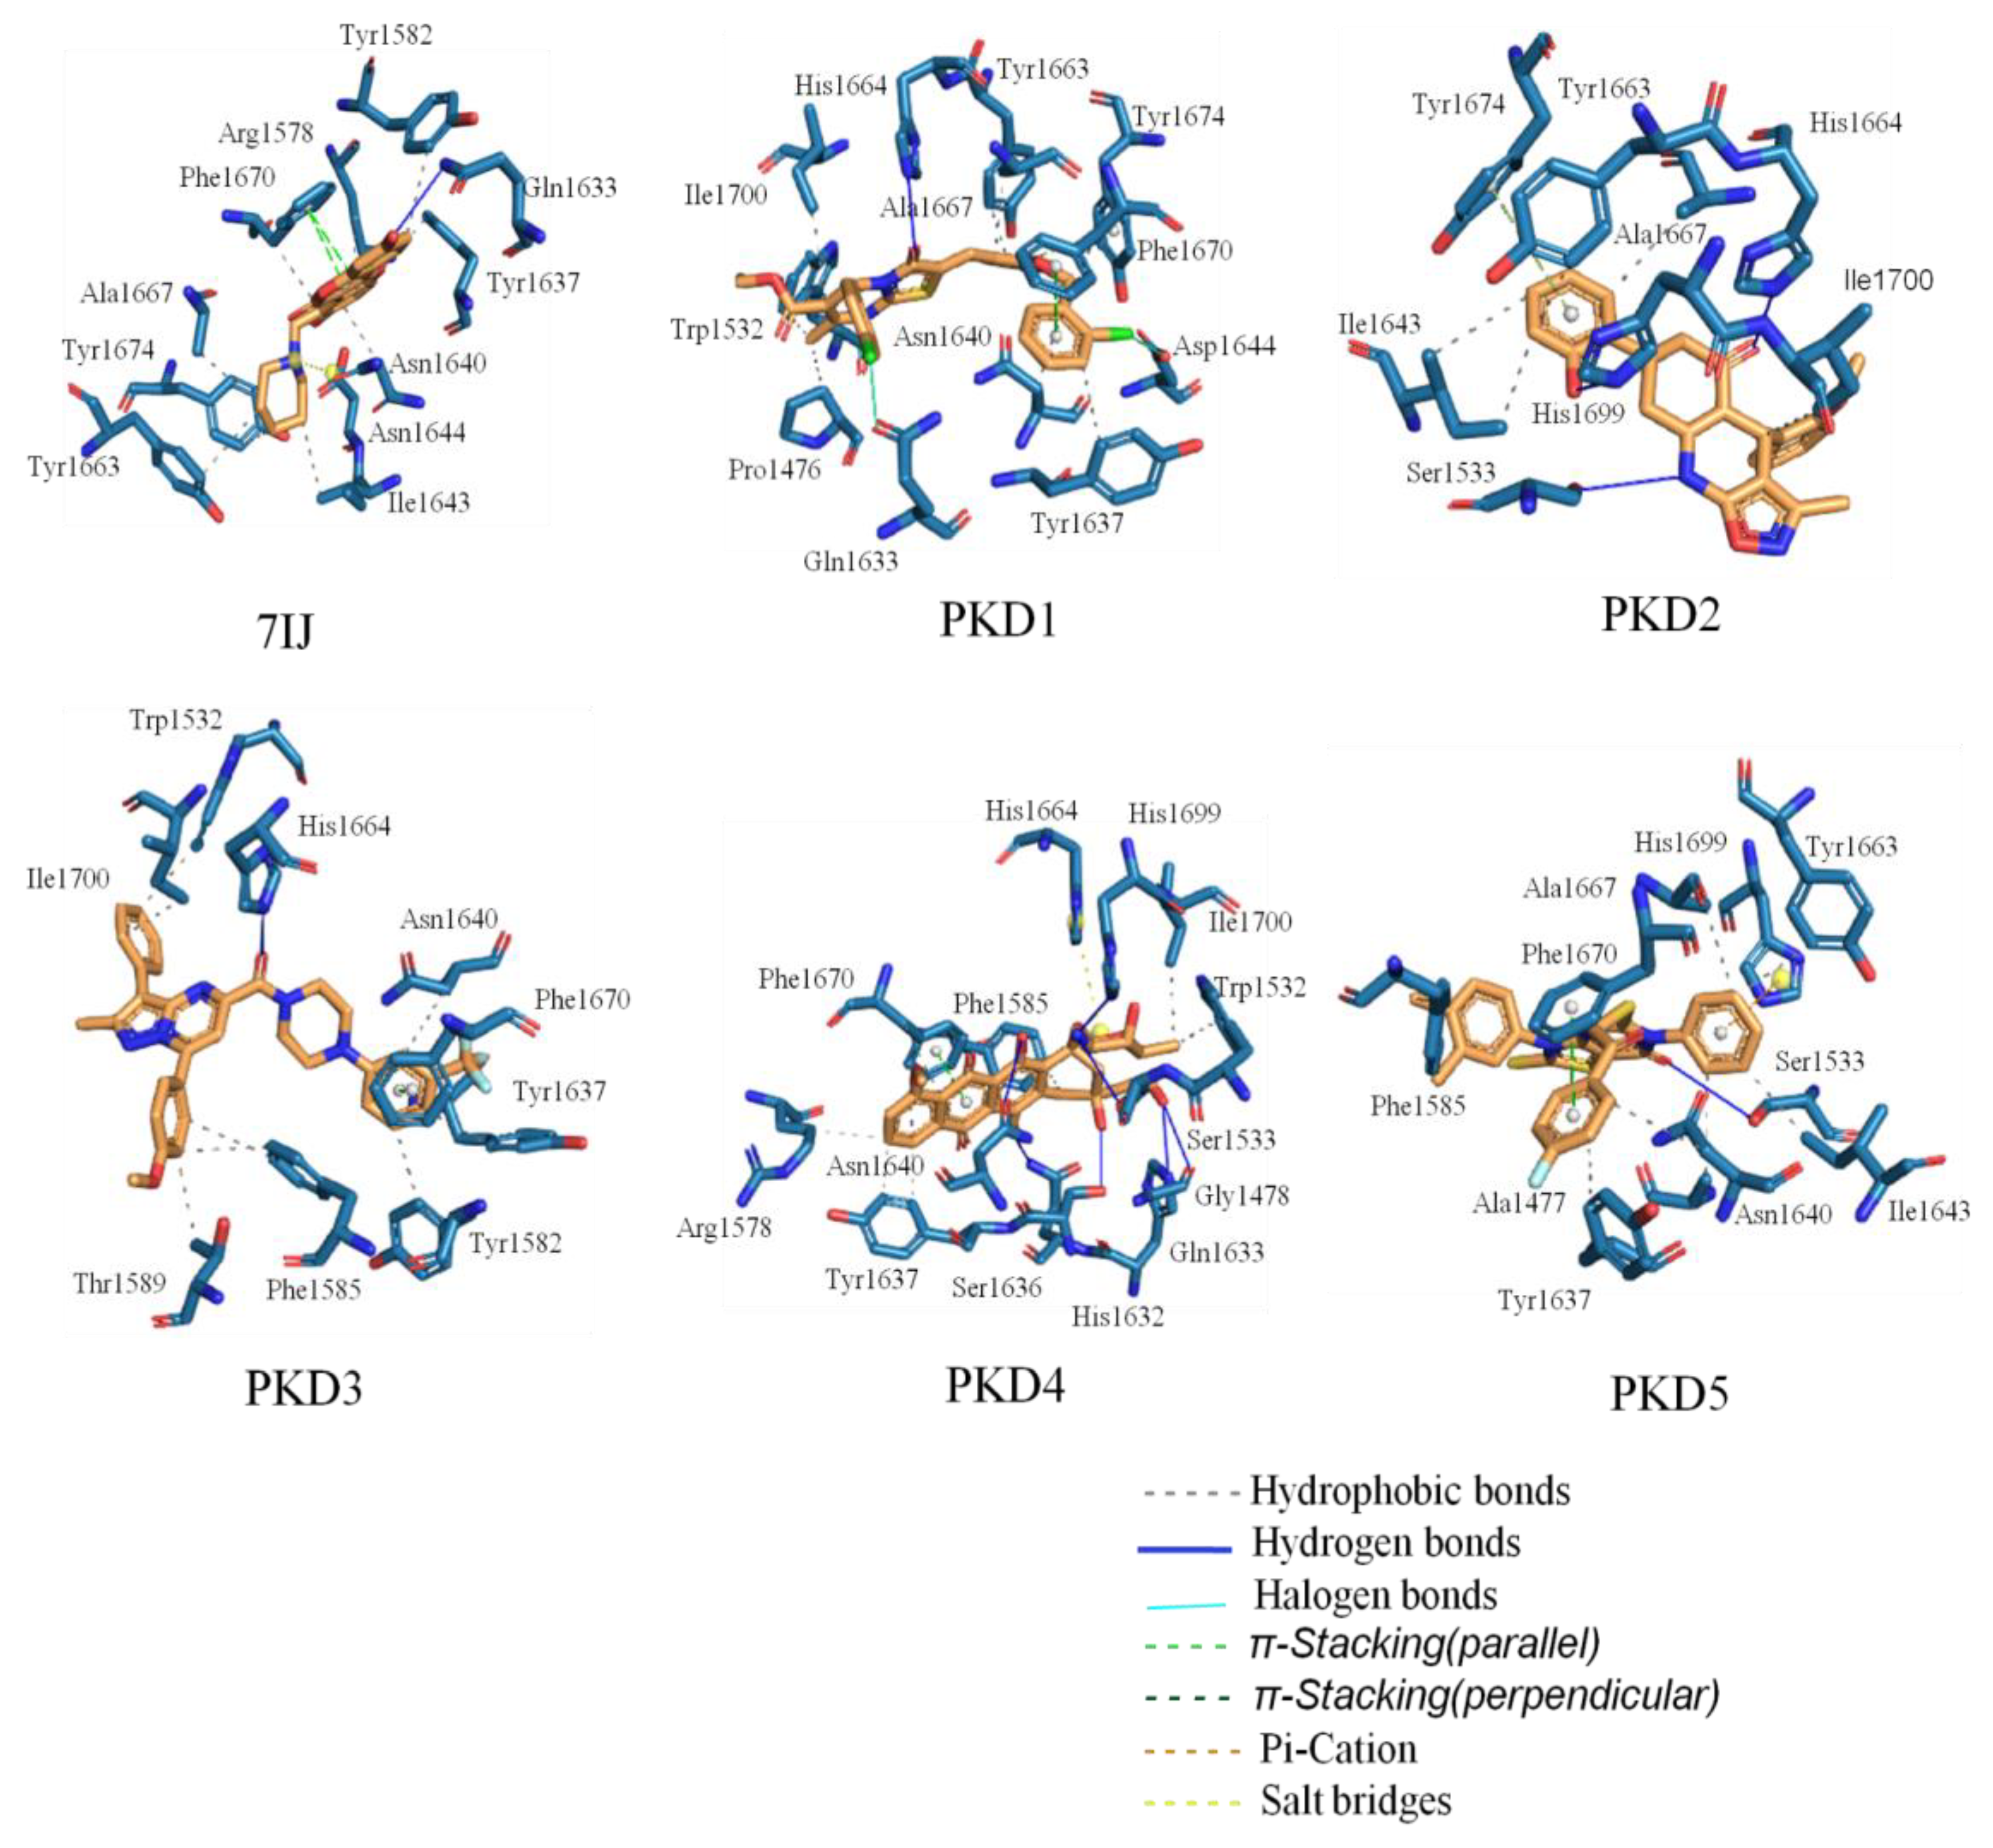
All the chosen molecules underwent docking using MPI Vina, and their respective binding energies were documented. Leveraging the presence of a co-crystallized ligand within the protein structure aided in determining the optimal binding position within the Pks13 protein. This information facilitated the prediction of absolute binding energy by utilising KDeep. The Pks13 protein file was meticulously prepared for molecular docking, with a grid box strategically positioned at the protein's active sites. Subsequently, a configuration file in the config.txt format was generated for molecular docking purposes. Employing the AutoDock Vina method, the 2448 molecules mentioned above were employed as ligands for docking, alongside the co-crystallized ligand, 7IJ, for comparison. The resulting output files were employed to validate amino acid interactions between proteins and ligands using Pymol Visualization Software. Notably, the following amino acids from the Pks13 binding site were found to interact with 7IJ: Gln1633, Arg1578, Tyr1582, Tyr1637, Asn1640, Ile1643, Tyr1663, Ala1667, Phe1670, Tyr1674, Phe1670, and Asp1644 (
Figure 3,
Table 5). Furthermore, the co-crystal exhibited a binding affinity of -12.1 kcal/mol towards the Pks13 protein, establishing a threshold for screening out molecules for further steps.
Biological Activity Prediction
Using a validated QSAR model, we predicted the biological activity of filtered 285 compounds. The process commenced by generating molecular descriptors for these compounds using PaDEL-Descriptor. Subsequently, we selected the most relevant descriptors for predicting the compounds' biological activity (
Table 3). Normalisation of the descriptor data ensured the elimination of biases arising from varying descriptor scales. Finally, Python scripting was employed to predict the biological activity of the filtered compounds using the MLR model. This computational approach aimed to offer insights into the potential efficacy of the compounds as anti-TB agents, facilitating the identification of promising candidates for further experimental validation and drug development endeavours. 21 Compounds demonstrating favourable biological activity (pMIC > 3) progressed to the subsequent stage of the investigation.
Re-Evaluation of Screened Compounds by Calculating Absolute Binding Free Energy Estimation Using KDeep
The KDeep platform was employed to determine the absolute binding energy of 21 compounds obtained from the previous step by using the output of ADV docking. The KDeep server, accessible online, required the protein to be in pdb format with an index sheet containing the path of the protein and ligands in sdf format to compute the absolute binding energy. The KDeep server provided absolute binding energy calculations for the selected ligands. The results from ADV docking and the binding free energy estimates from KDeep were compiled and recorded in
Table 4. The results show molecules PKD1 and PKD4 with binding free energies of -11.53 kcal/mol and -10.25 kcal/mol respectively, which are similar to the results obtained from the Autodock Vina. This suggest irrespective of the methods used to calculate the binding energy, we find a similar trend in the binding properties of these molecules.
Table 4.
Binding energy profile of selected compounds and Co-crystal (7IJ).
Table 4.
Binding energy profile of selected compounds and Co-crystal (7IJ).
| Compounds |
Structure |
IUPAC |
Binding energy (kcal/mol)
AutoDock Vina |
Absolute binding free energy
(kcal/mol) |
| PKD1 |
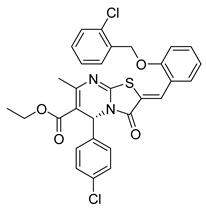 |
Ethyl (R,Z)-2-(2-((2-chlorobenzyl)oxy)benzylidene)-5-(4-chlorophenyl)-7-methyl-3-oxo-2,3-dihydro-5H-thiazolo[3,2-a]pyrimidine-6-carboxylate |
-10.100 |
-11.530 |
| PKD2 |
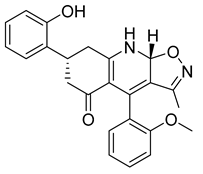 |
(7R,9aR)-7-(2-hydroxyphenyl)-4-(2-methoxyphenyl)-3-methyl-7,8,9,9a-tetrahydroisoxazolo[5,4-b]quinolin-5(6H)-one |
-10.500 |
-8.350 |
| PKD3 |
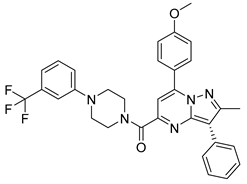 |
(7-(4-methoxyphenyl)-2-methyl-3-phenylpyrazolo[1,5-a]pyrimidin-5-yl)(4-(3-(trifluoromethyl)phenyl)piperazin-1-yl)methanone |
-10.500 |
-8.750 |
| PKD4 |
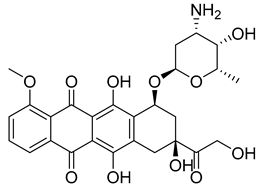 |
(8S,10S)-10-(((2R,4S,5S,6S)-4-amino-5-hydroxy-6-methyltetrahydro-2H-pyran-2-yl)oxy)-6,8,11-trihydroxy-8-(2-hydroxyacetyl)-1-methoxy-7,8,9,10-tetrahydrotetracene-5,12-dione |
-10.200 |
-10.250 |
| PKD5 |
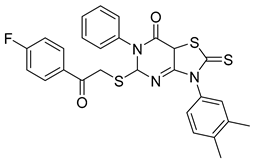 |
3-(3,4-dimethylphenyl)-5-((2-(4-fluorophenyl)-2-oxoethyl)thio)-6-phenyl-2-thioxo-2,3,5,7a-tetrahydrothiazolo[4,5-d]pyrimidin-7(6H)-one |
-10.100 |
-9.150 |
7IJ
(Co-crystal)
|
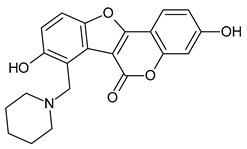 |
3,8-bis(oxidanyl)-7-(piperidin-1-ylmethyl)-[1]benzofuro[3,2-c]chromen-6-one |
-12.100 |
-9.900 |
Table 5.
Binding interactions profile of selected compounds and Co-crystal (7IJ).
Table 5.
Binding interactions profile of selected compounds and Co-crystal (7IJ).
| Compounds |
Interactions |
| Hydrogen bonds |
Hydrophobic interactions |
Pi-stacking |
Halogen bonds |
Salt bridges |
Pi-cation |
| PKD1 |
His1664 |
Pro1476, Trp1532, Tyr1637, Asn1640, Tyr1663, Ala1667, Phe1670, Ile1700 |
Phe1670, Tyr1674 |
Gln1633, Asp1644 |
- |
- |
| PKD2 |
Ser1533, His1664, His1699 |
Ile1643, Tyr1663, Ala1667, Ile1700 |
Tyr1674 |
- |
- |
- |
| PKD3 |
His1664 |
Trp1532, Tyr1582, Phe1585, Thr1589, Tyr1637, Asn1640, Ile1700 |
Phe1670 |
Tyr1637 |
- |
- |
| PKD4 |
Gly1478, Ser1533, His1632, Gln1633, Ser1636, Asn1640, His1699 |
Trp1532, Arg1578, Phe1585, Tyr1637, Asn1640, Phe1670, Ile1700 |
Phe1670 |
- |
His1664 |
- |
| PKD5 |
Ser1533 |
Ala1477, Phe1585, Tyr1637, Asn1640, Ile1643, Tyr1663, Ala1667 |
Phe1670 |
- |
- |
His1699 |
| 7IJ (Co-crystal) |
Gln1633 |
Arg1578, Tyr1582, Tyr1637, Asn1640, Ile1643, Tyr1663, Ala1667, Phe1670, Tyr1674 |
Phe1670 |
- |
Asp1644 |
- |
The PLIP web server, accessible at
https://plip-tool.biotec.tu-dresden.de/plip-web/plip/index (
Figure 3), was employed to investigate the binding interactions of all compounds with the Pks13 protein. The binding mode analysis revealed that all molecules effectively occupied the protein's active site. Molecular docking analysis of the co-crystal ligand 7IJ with the Pks13 protein unveiled multiple binding interactions, including hydrophobic interactions with Arg1578, Tyr1582, Tyr1637, Asn1640, Ile1643, Tyr1663, Ala1667, Phe1670, and Tyr1674 amino acid residues, pi-stacking, and salt bridge formation with Phe1670 and Asp1644 residues, respectively (
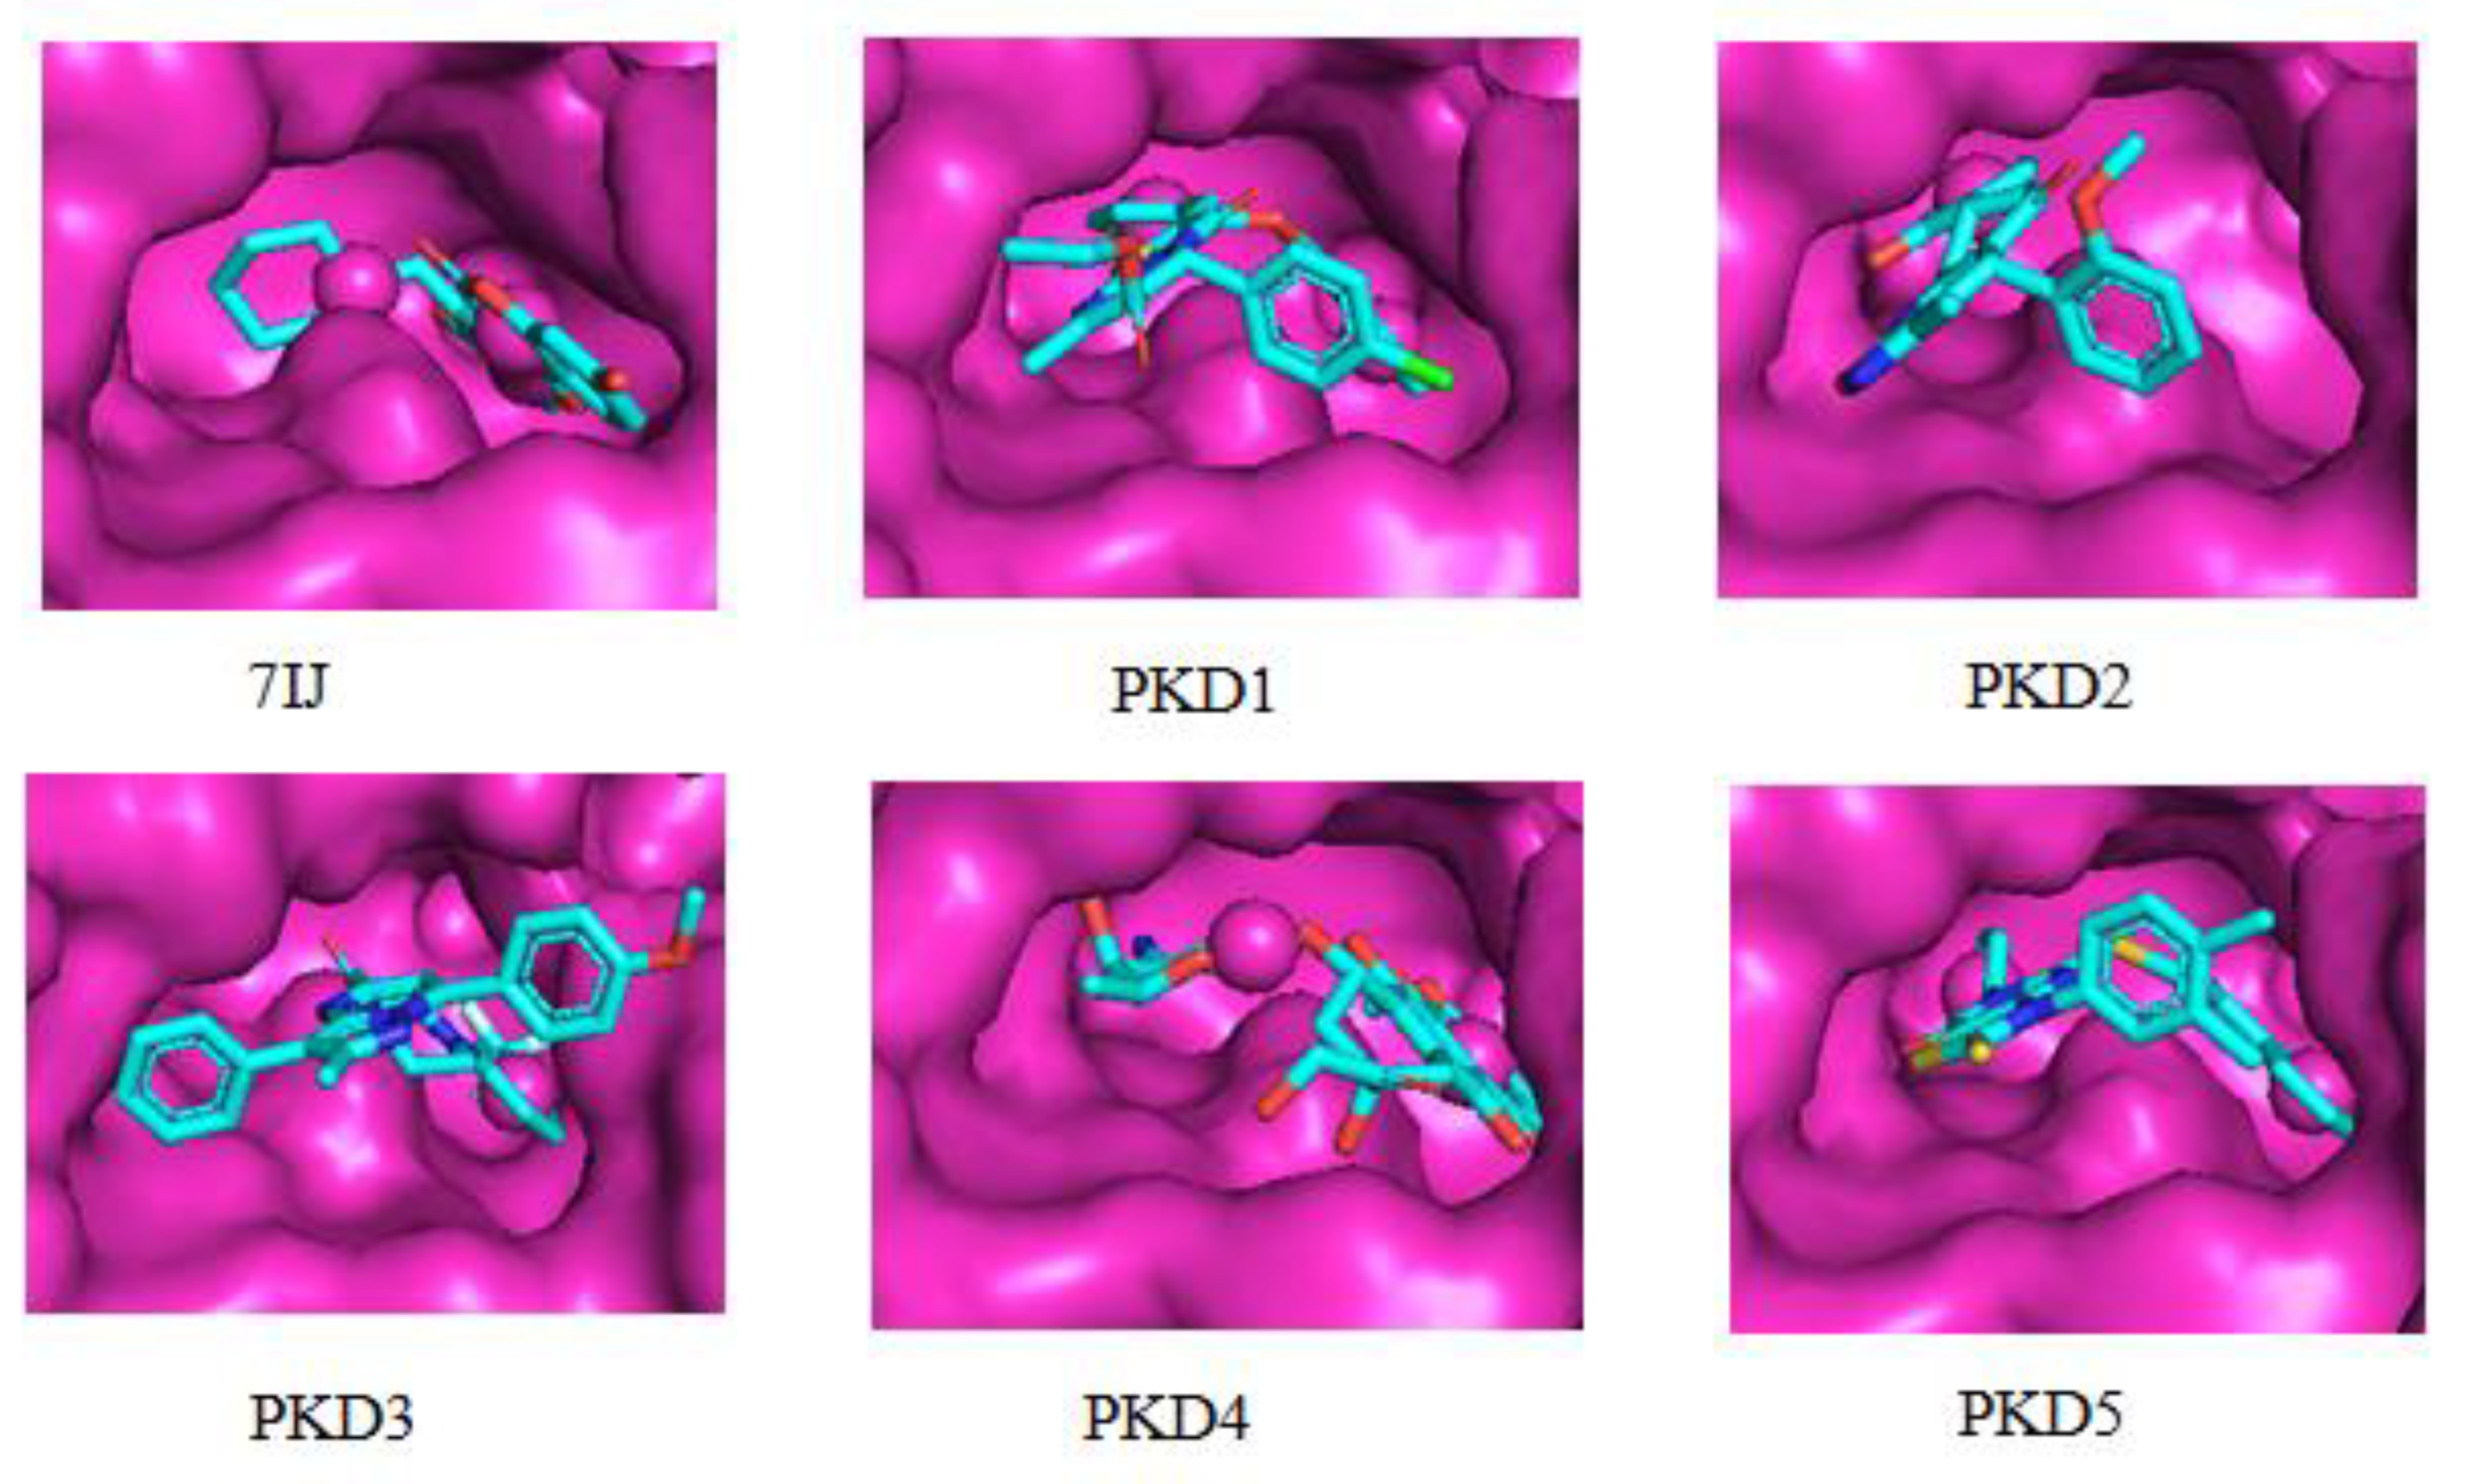
Table 5). Additionally, one hydrogen bond interaction was observed with residues Gln1633. Furthermore, amino acid residues Pro1476, Trp1532, Tyr1637, Asn1640, Tyr1663, Ala1667, Phe1670, and Ile1700 formed hydrophobic bond interactions with PKD1, which also engaged in pi-stacking with Phe1670 and Tyr1674 residues, and halogen bond with Gln1633 and Asp1644 residues. The second selected molecule, PKD2, exhibited several hydrophobic interactions with Ile1643, Tyr1663, Ala1667, and Ile1700 amino acid residues. PKD3 displayed hydrophobic interactions with Trp1532, Tyr1582, Phe1585, Thr1589, Tyr1637, Asn1640, and Ile1700 residues of the Pks13 protein. PKD4 formed hydrophobic interactions with Trp1532, Arg1578, Phe1585, Tyr1637, Asn1640, Phe1670, and Ile1700 residues. Similarly, PKD5 showed hydrophobic interactions with Ala1477, Phe1585, Tyr1637, Asn1640, Ile1643, Tyr1663, and Ala1667 residues of protein. The molecules were examined for their presence within the specified binding pocket of Pks13 using a surface-based approach. It was observed that all the ligands aligned with the binding site of the reference ligand 7IJ (see
Figure 4).
Figure 3.
Interaction diagrams for Protein-ligand complexes of PKD1, PKD2, PKD3, PKD4, PKD5 and 7IJ after molecular docking studies with Pks13.
Figure 3.
Interaction diagrams for Protein-ligand complexes of PKD1, PKD2, PKD3, PKD4, PKD5 and 7IJ after molecular docking studies with Pks13.
Figure 4.
Surface interactions for Protein-ligand complexes of PKD1, PKD2, PKD3, PKD4, PKD5 and 7IJ after molecular docking studies with Pks13.
Figure 4.
Surface interactions for Protein-ligand complexes of PKD1, PKD2, PKD3, PKD4, PKD5 and 7IJ after molecular docking studies with Pks13.
Molecular Dynamic Analysis
MD simulation is a highly effective computational technique for comprehensively studying the dynamics and behaviour of protein-ligand complexes. In this study, we systematically investigated the stability of the interaction between the Pks13 protein and five compounds through a 100ns MD simulation. The data of co-crystal 7IJ associated with Pks13 was also considered for the MD simulation study to assess the overall dynamic behaviour of proposed compounds during the MD simulation. We aim to utilise MD simulation to examine whether the five compounds exhibit interactions with vital amino acids throughout the simulation and whether these interactions persist similarly to those observed with 7IJ. Post-MD analysis involved assessing parameters such as radius of gyration (Rg), intermolecular hydrogen bonds, root mean square deviation (RMSD), root mean square fluctuation (RMSF), and ligand RMSD. Additionally, dynamic cross-correlation matrix (DCCM) analysis was conducted on the backbone atoms of the Pks13 protein bound with selected five compounds. The averages, maximums, and minimums of MD simulation trajectories for backbone RMSD, ligand-RMSD, RMSF, Rg, and SASA metrics were listed in table 6.
Table 6.
The MD simulation trajectories yielded averages, maximums, and minimums for several key metrics, including Pks13 backbone RMSD, ligand-RMSD, RMSF, Rg, and SASA.
Table 6.
The MD simulation trajectories yielded averages, maximums, and minimums for several key metrics, including Pks13 backbone RMSD, ligand-RMSD, RMSF, Rg, and SASA.
| Parameters |
|
7IJ(Co-crystal) |
PKD1 |
PKD2 |
PKD3 |
PKD4 |
PKD5 |
Backbone
RMSD
(Å)
|
Average |
1.634 |
1.741 |
1.697 |
1.770 |
2.235 |
1.589 |
| Maximum |
2.588 |
3.300 |
2.815 |
2.691 |
3.697 |
2.436 |
| Minimum |
0.005 |
0.004 |
0.005 |
0.005 |
0.005 |
0.004 |
Ligand
RMSD
(Å)
|
Average |
0.269 |
1.685 |
0.518 |
1.445 |
1.693 |
1.156 |
| Maximum |
0.759 |
2.810 |
0.972 |
2.546 |
2.366 |
2.040 |
| Minimum |
0.004 |
0.004 |
0.004 |
0.004 |
0.004 |
0.004 |
| RMSF (Å) |
Average |
1.183 |
1.264 |
1.228 |
1.306 |
1.403 |
1.313 |
| Maximum |
9.020 |
7.703 |
6.931 |
4.734 |
10.365 |
7.740 |
| Minimum |
0.419 |
0.459 |
0.444 |
0.442 |
0.467 |
0.477 |
| Rg (Å) |
Average |
19.887 |
19.807 |
19.976 |
20.018 |
19.970 |
19.819 |
| Maximum |
20.268 |
20.162 |
20.358 |
20.430 |
20.592 |
20.304 |
| Minimum |
19.446 |
19.439 |
19.482 |
19.458 |
19.438 |
19.455 |
| SASA (Å2) |
Average |
15273.110 |
14162.140 |
14175.620 |
14555.830 |
14389.040 |
14228.800 |
| Maximum |
15718.000 |
15081.400 |
15204.400 |
15755.600 |
15404.000 |
15254.600 |
| Minimum |
14799.100 |
13177.900 |
13279.800 |
13180.800 |
13261.500 |
13236.100 |
Root Mean Square Deviation (RMSD) Profile Analysis
According to the data presented in
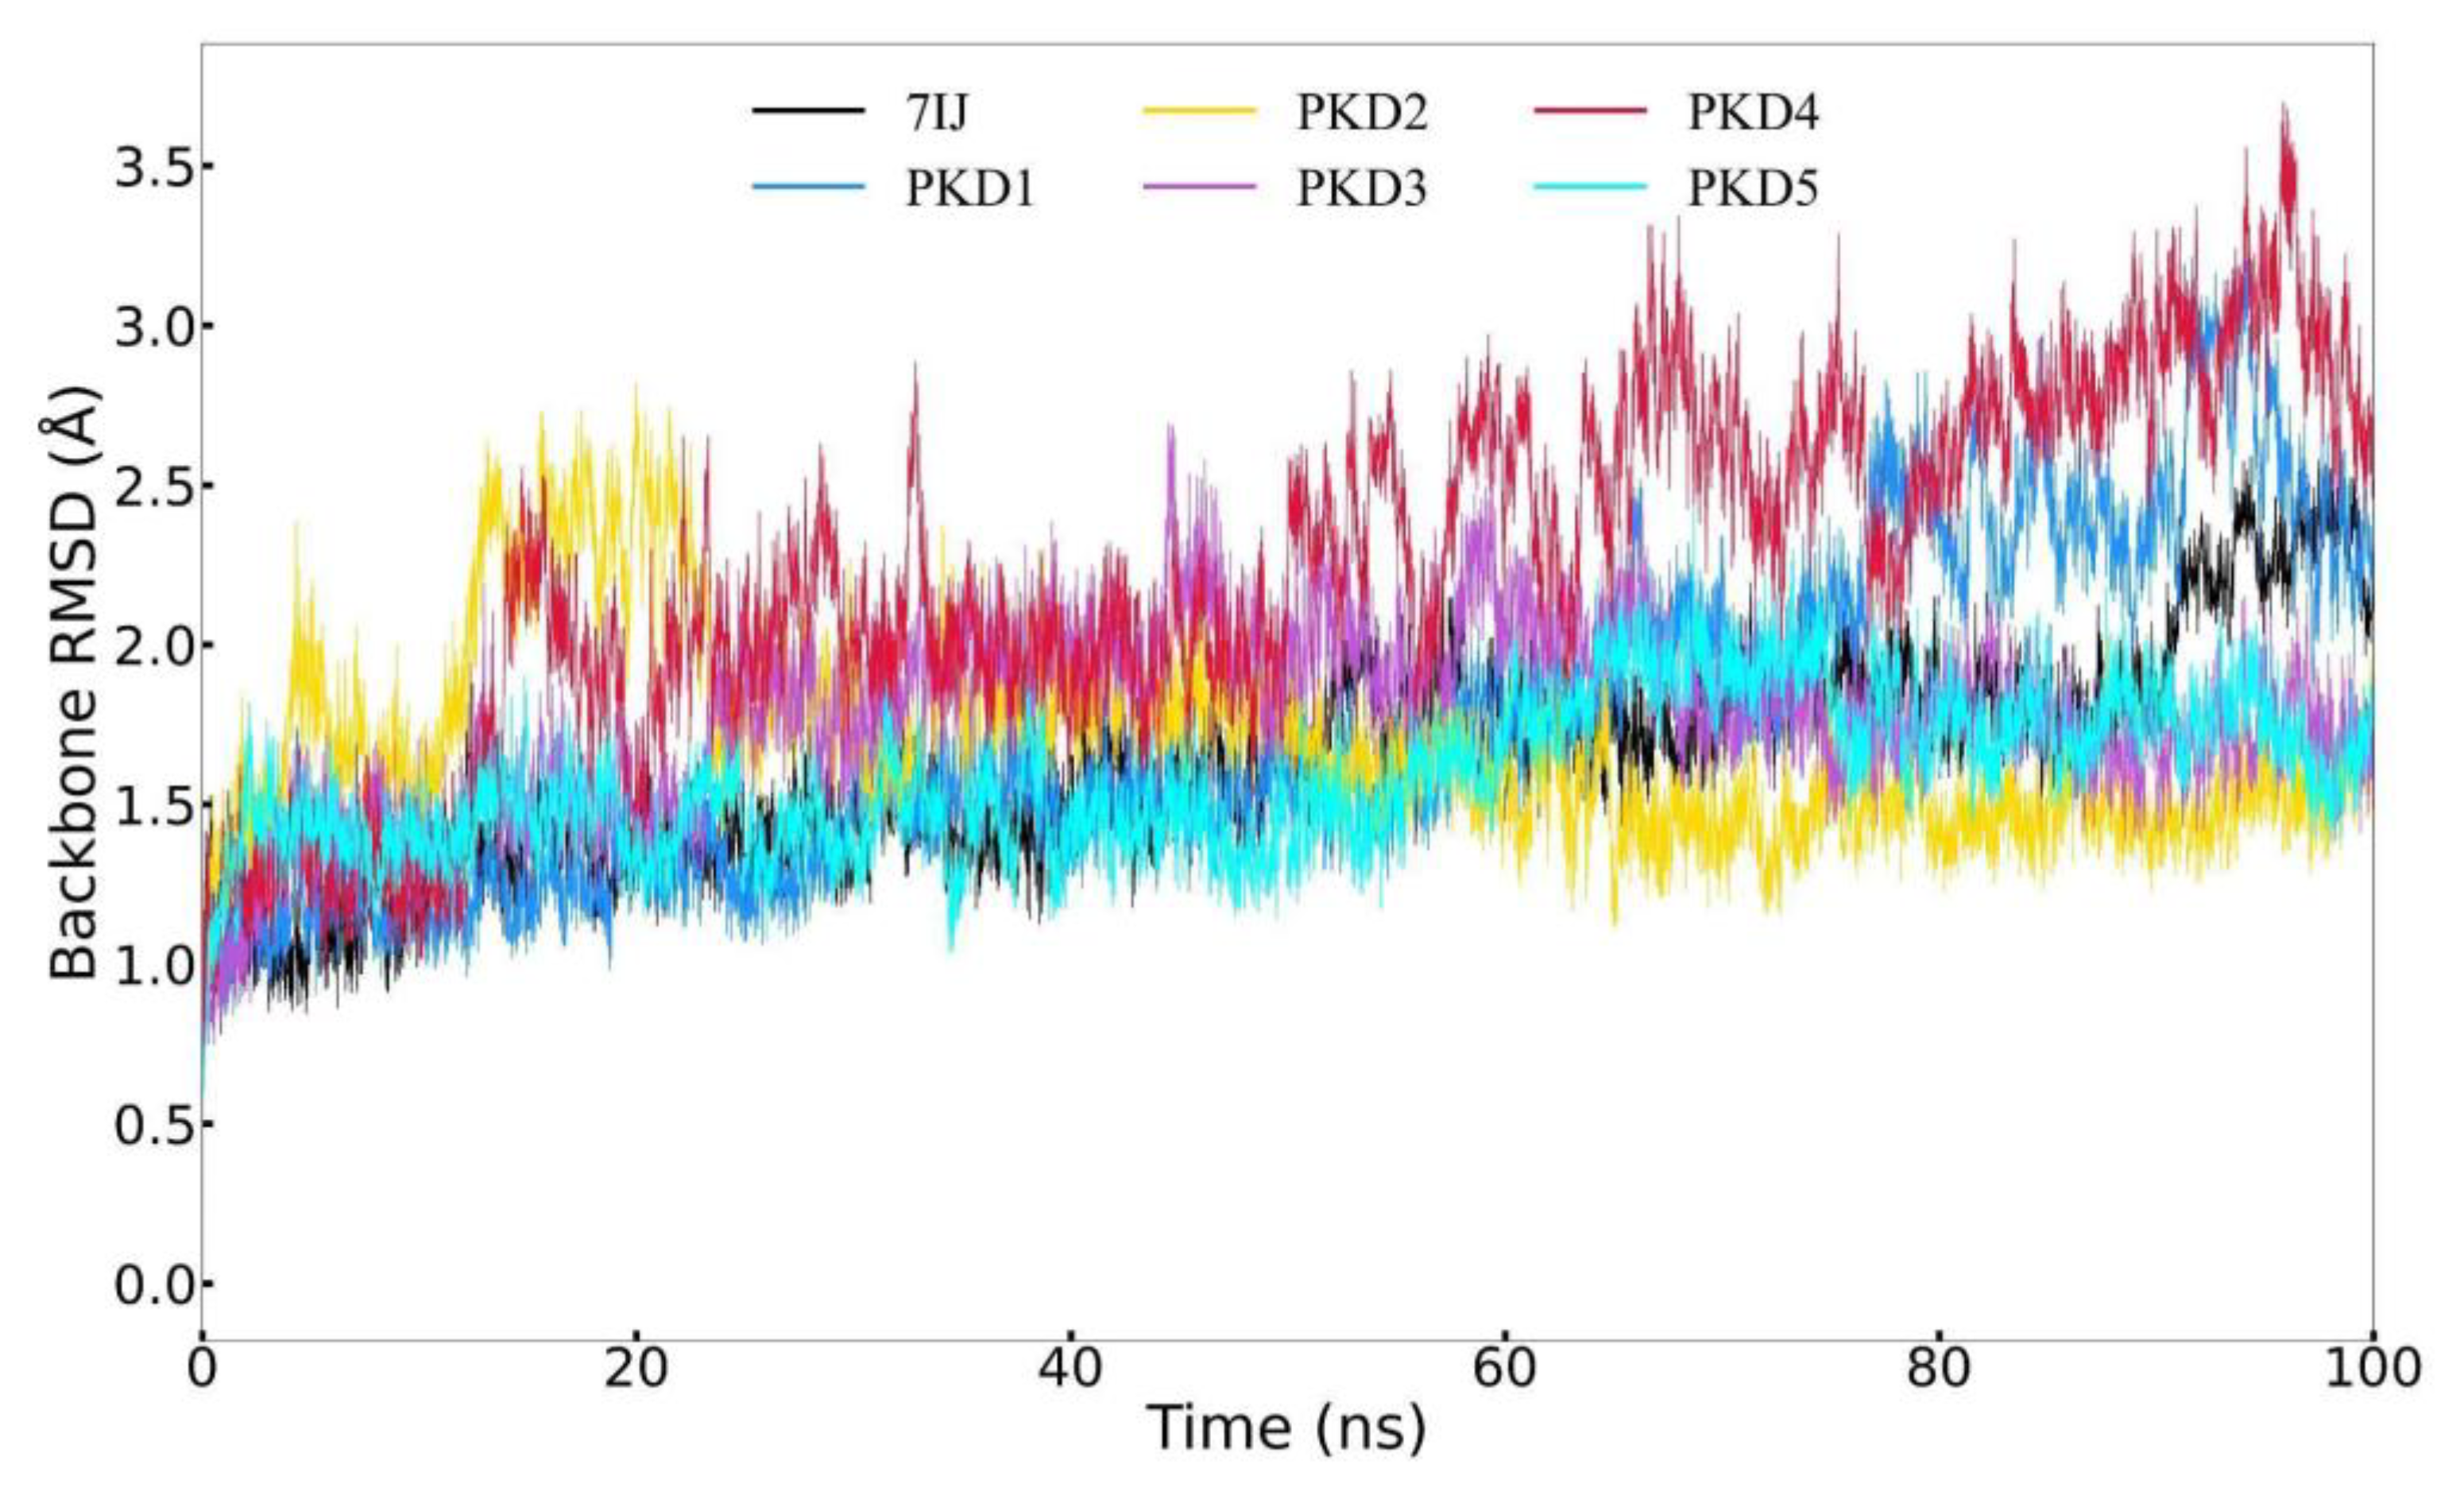
Figure 5, the MD simulations carried out on five different complexes and the 7IJ co-crystal revealed a stable trend in the Pks13 structure beyond the 90 ns time frame. PKD5 demonstrated lower fluctuations in RMSD compared to the other four compound groups. Moreover, the complex systems containing the five compounds and the protein were compared to the 7IJ complex. The protein's structure deviation from its initial state at the 50 ns mark of the MD simulation remained relatively consistent, with RMSD values ranging from 1.0 to 2.5 Å. This consistent fluctuation range suggests that all six complexes' proteins remained stable throughout the simulation duration.
The data presented in
Figure 6 indicates that the RMSD curve is stable, suggesting that the five compounds are capable of maintaining stability within the binding pocket. It is worth noting that, with the exception of PKD4, the positions of the compounds within the binding pocket do not exhibit significant deviation from their initial docking positions towards the end of the simulation. During the first 10 nanoseconds, PKD4 exhibits a slightly greater deviation compared to the other compounds. Nevertheless, akin to 7IJ, all five compounds demonstrate only minor deviations from their initial docking positions within the binding pocket following the simulation. To summarize, by the end of the MD simulation, the five compounds maintained a state of relative stability within the pocket. However, there was a noticeable position deviation compared to the docking pose, indicating potential alterations in the interaction of PKD1, PKD2, PKD3, PKD4 and PKD5 within the binding pocket.
Root Mean Square Fluctuation (RMSF) Profile Analysis
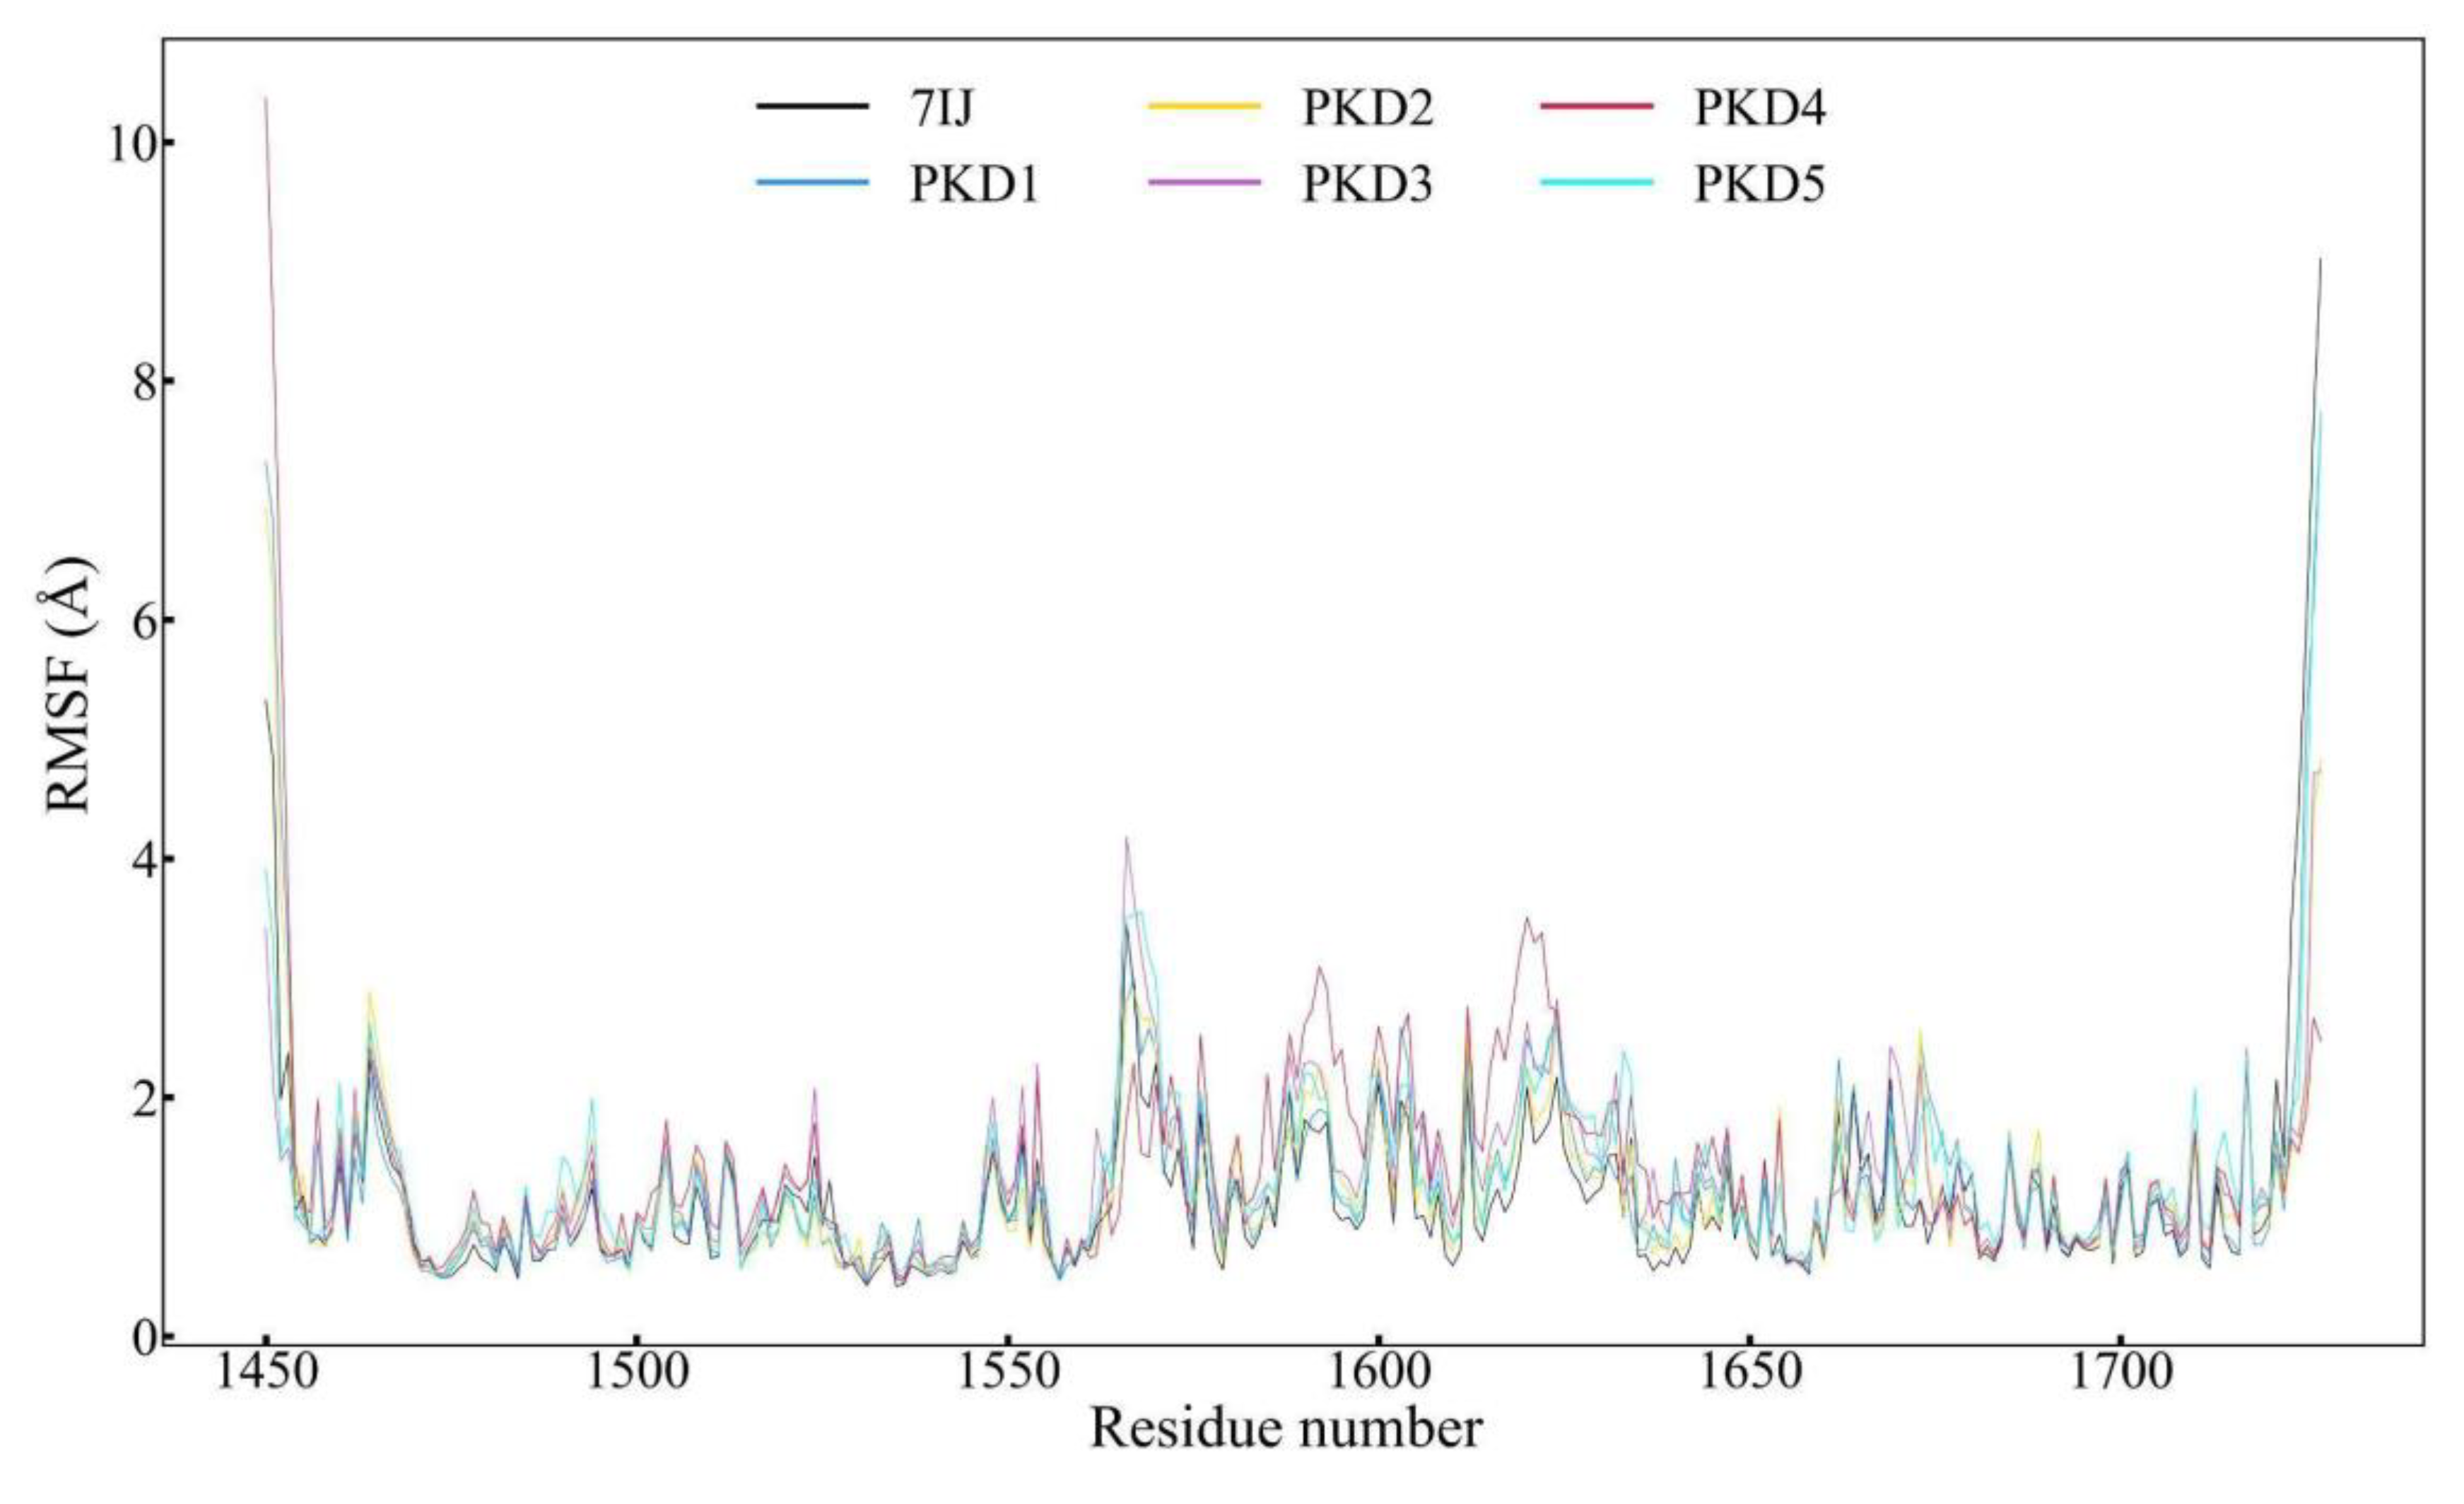
RMSF plots are useful for understanding the dynamic regions of molecular structures that are simulated via MD. These plots evaluate the degree of movement of Cα atoms relative to their average positions. Higher RMSF values indicate greater flexibility in specific regions while lower values suggest constrained areas. In this study, we used GROMACS to calculate the RMSF of Pks13 complexes with PKD1 to PKD5 compounds. All complexes exhibited flexibility within the range of 2 Å, as shown in
Figure 7. By comparing the RMSF plots of different complexes, we found that PKD4 exhibited higher fluctuations than the other compounds. However, the overall analysis suggests that the selected ligands stabilises the TE domain of the Pks13 protein.
Radius of Gyration (Rg) and Solvent Accessible Surface Area (SASA) Profile Analysis
The relationship between a ligand's radius of gyration (Rg) and solvent-accessible surface area (SASA) can reveal valuable information about the ligand's behavior within a protein's binding site over time. Rg represents the distribution of atoms surrounding a protein's structure axis, indicating the distance between the rotation point and the location with the most significant energy exchange. This concept is particularly useful in identifying various polymer types, including proteins, and predicting macromolecule structural activity. Rg calculation and distance measurement are crucial indicators for forecasting macromolecular behavior. When a ligand or lead molecule binds to a protein, inducing a conformational shift can change Rg. Advanced computational methods for Rg calculation can track a protein's compactness, which is directly related to its folding rate.
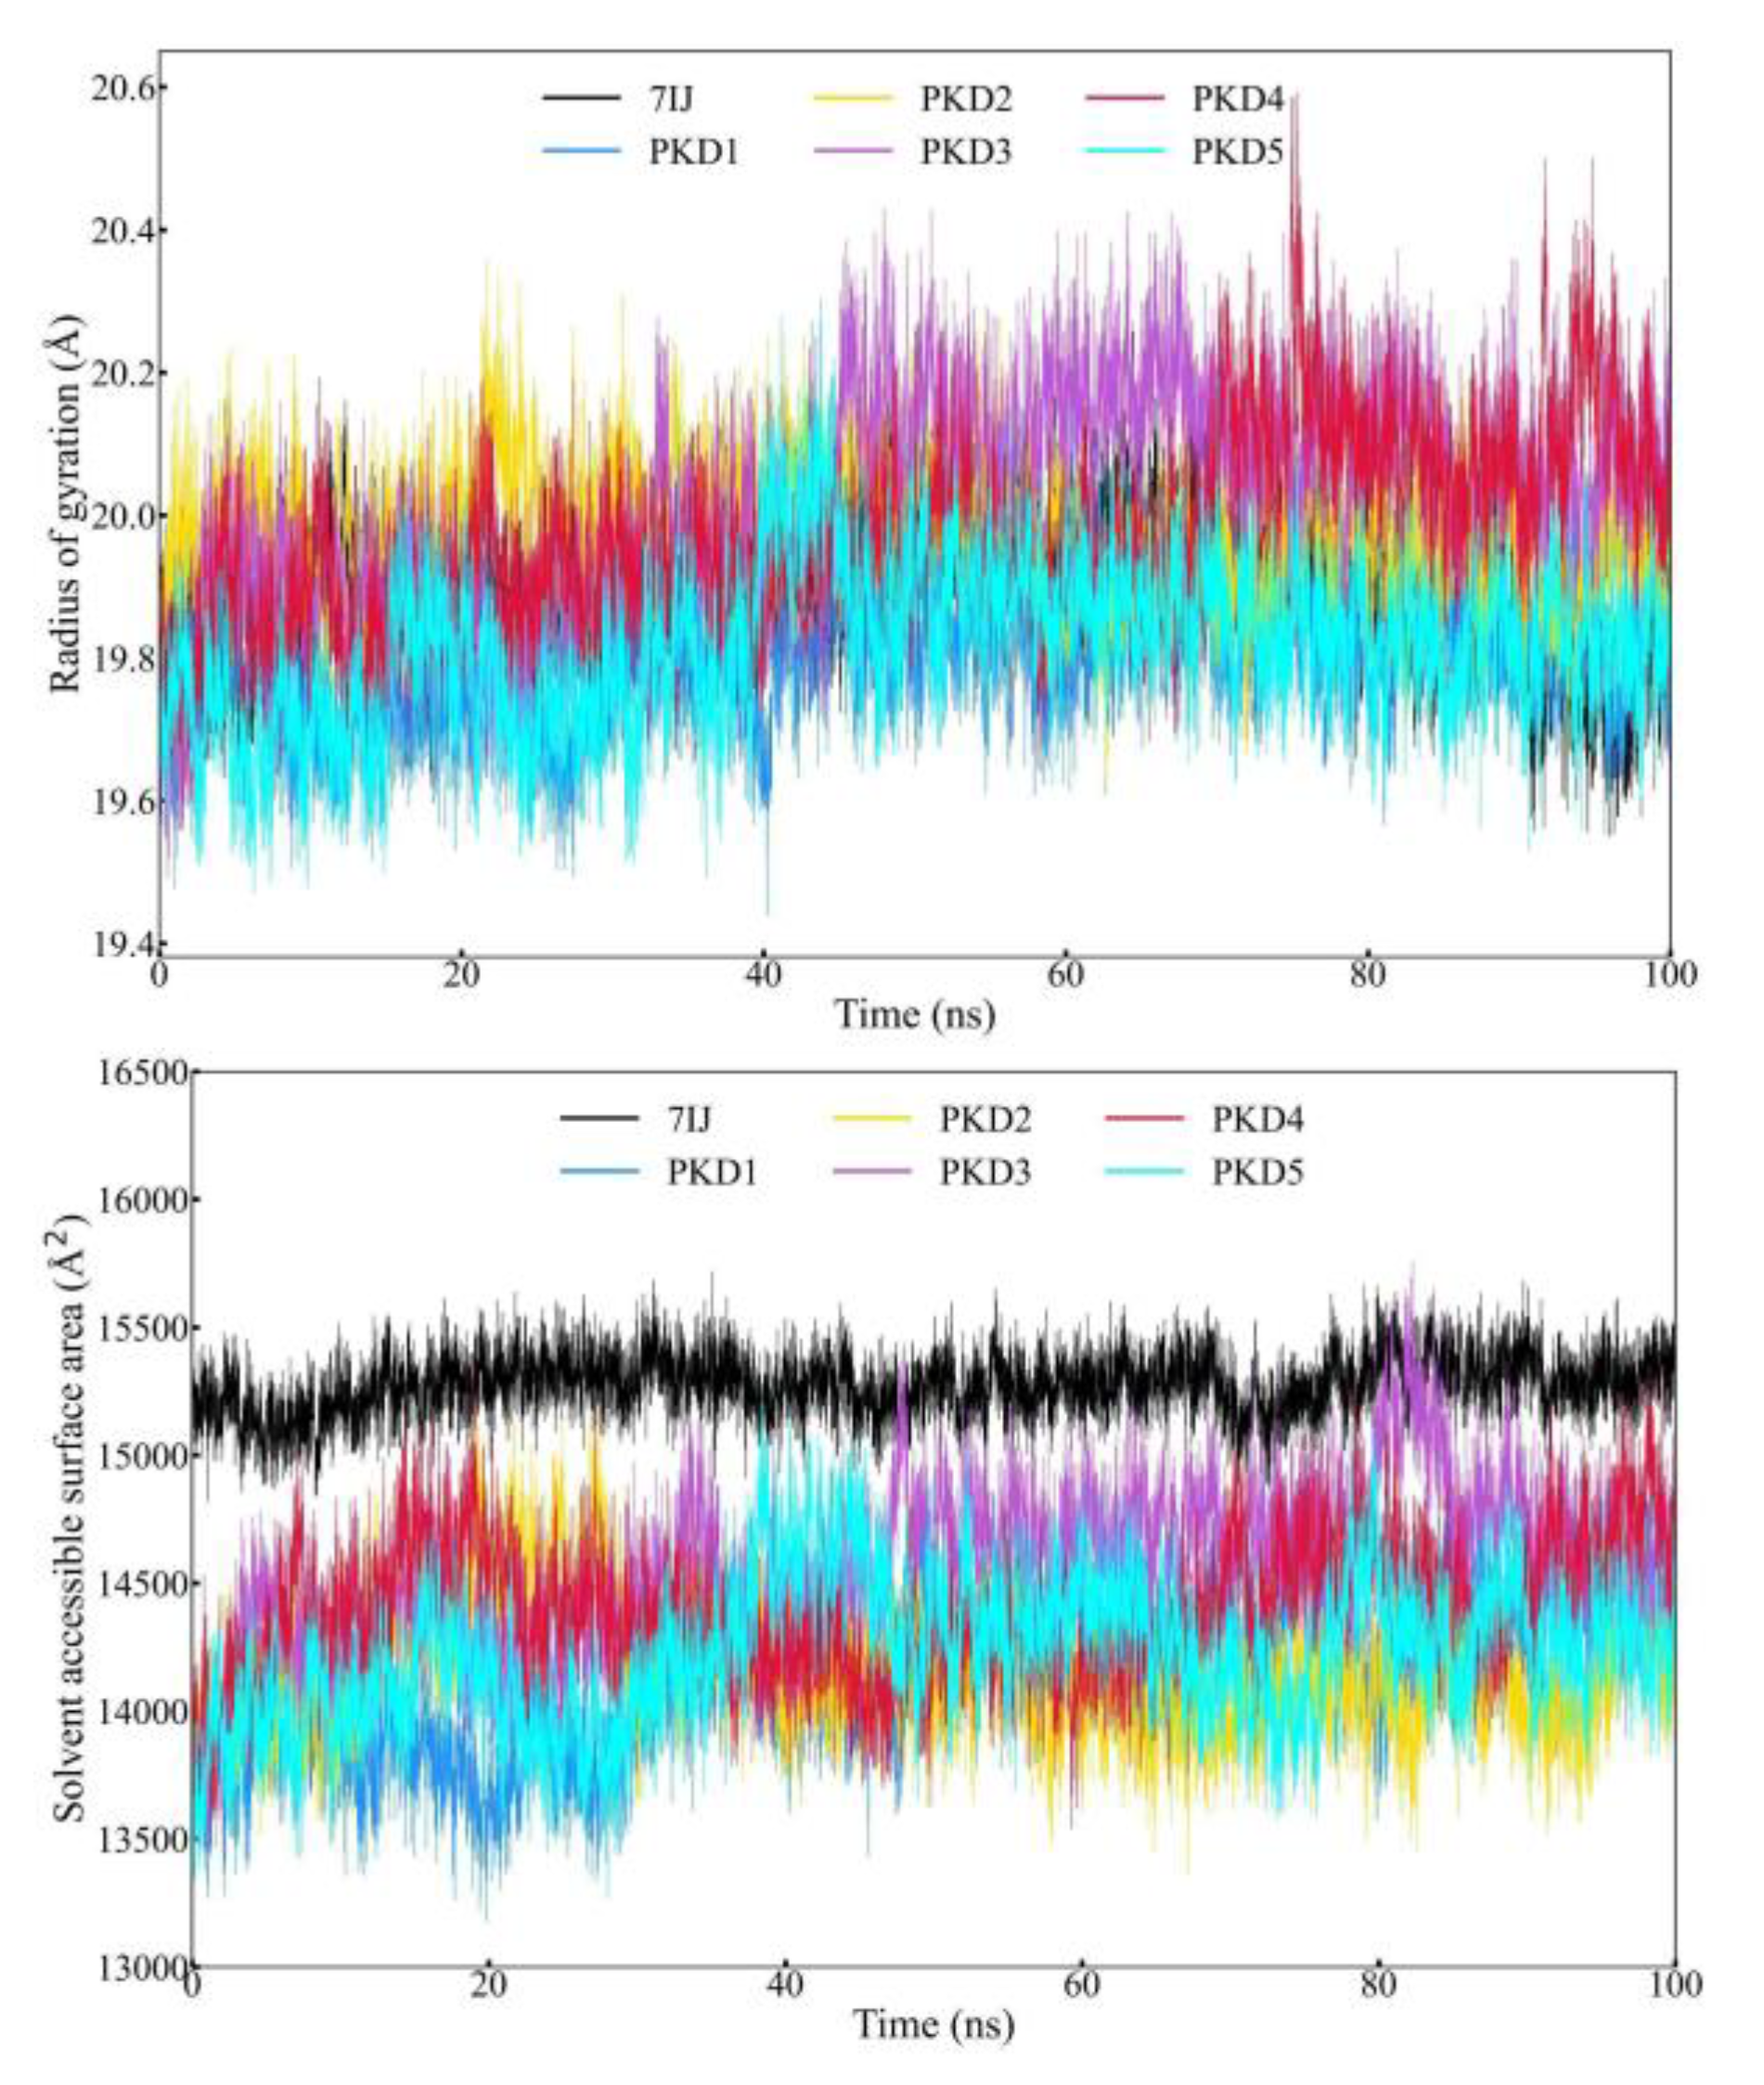
Figure 8 displays Rg fluctuations for five complexes with 7IJ (Co-crystal) during the simulation, indicating that Rg values for several protein-ligand complexes fluctuated within range (20.592Å - 19.438Å) during the simulation. PKD3 and PKD4 showed more and higher fluctuations than other remaining compounds. Solvent-accessible surface area (SASA), which measures a protein's exposure to solvent, can indicate if the protein is in its native form when a ligand binds to it.
Figure 8 illustrates the SASA evaluation of the Pks13 protein bound to PKD1, PKD2, PKD3, PKD4, PKD5, and 7IJ, demonstrating slight variations within acceptable limits across complexes. These results suggest that all candidate compounds maintained stable conformations within the binding cavity of the Pks13 protein.
Hydrogen Bond (Hbond) Profile Analysis
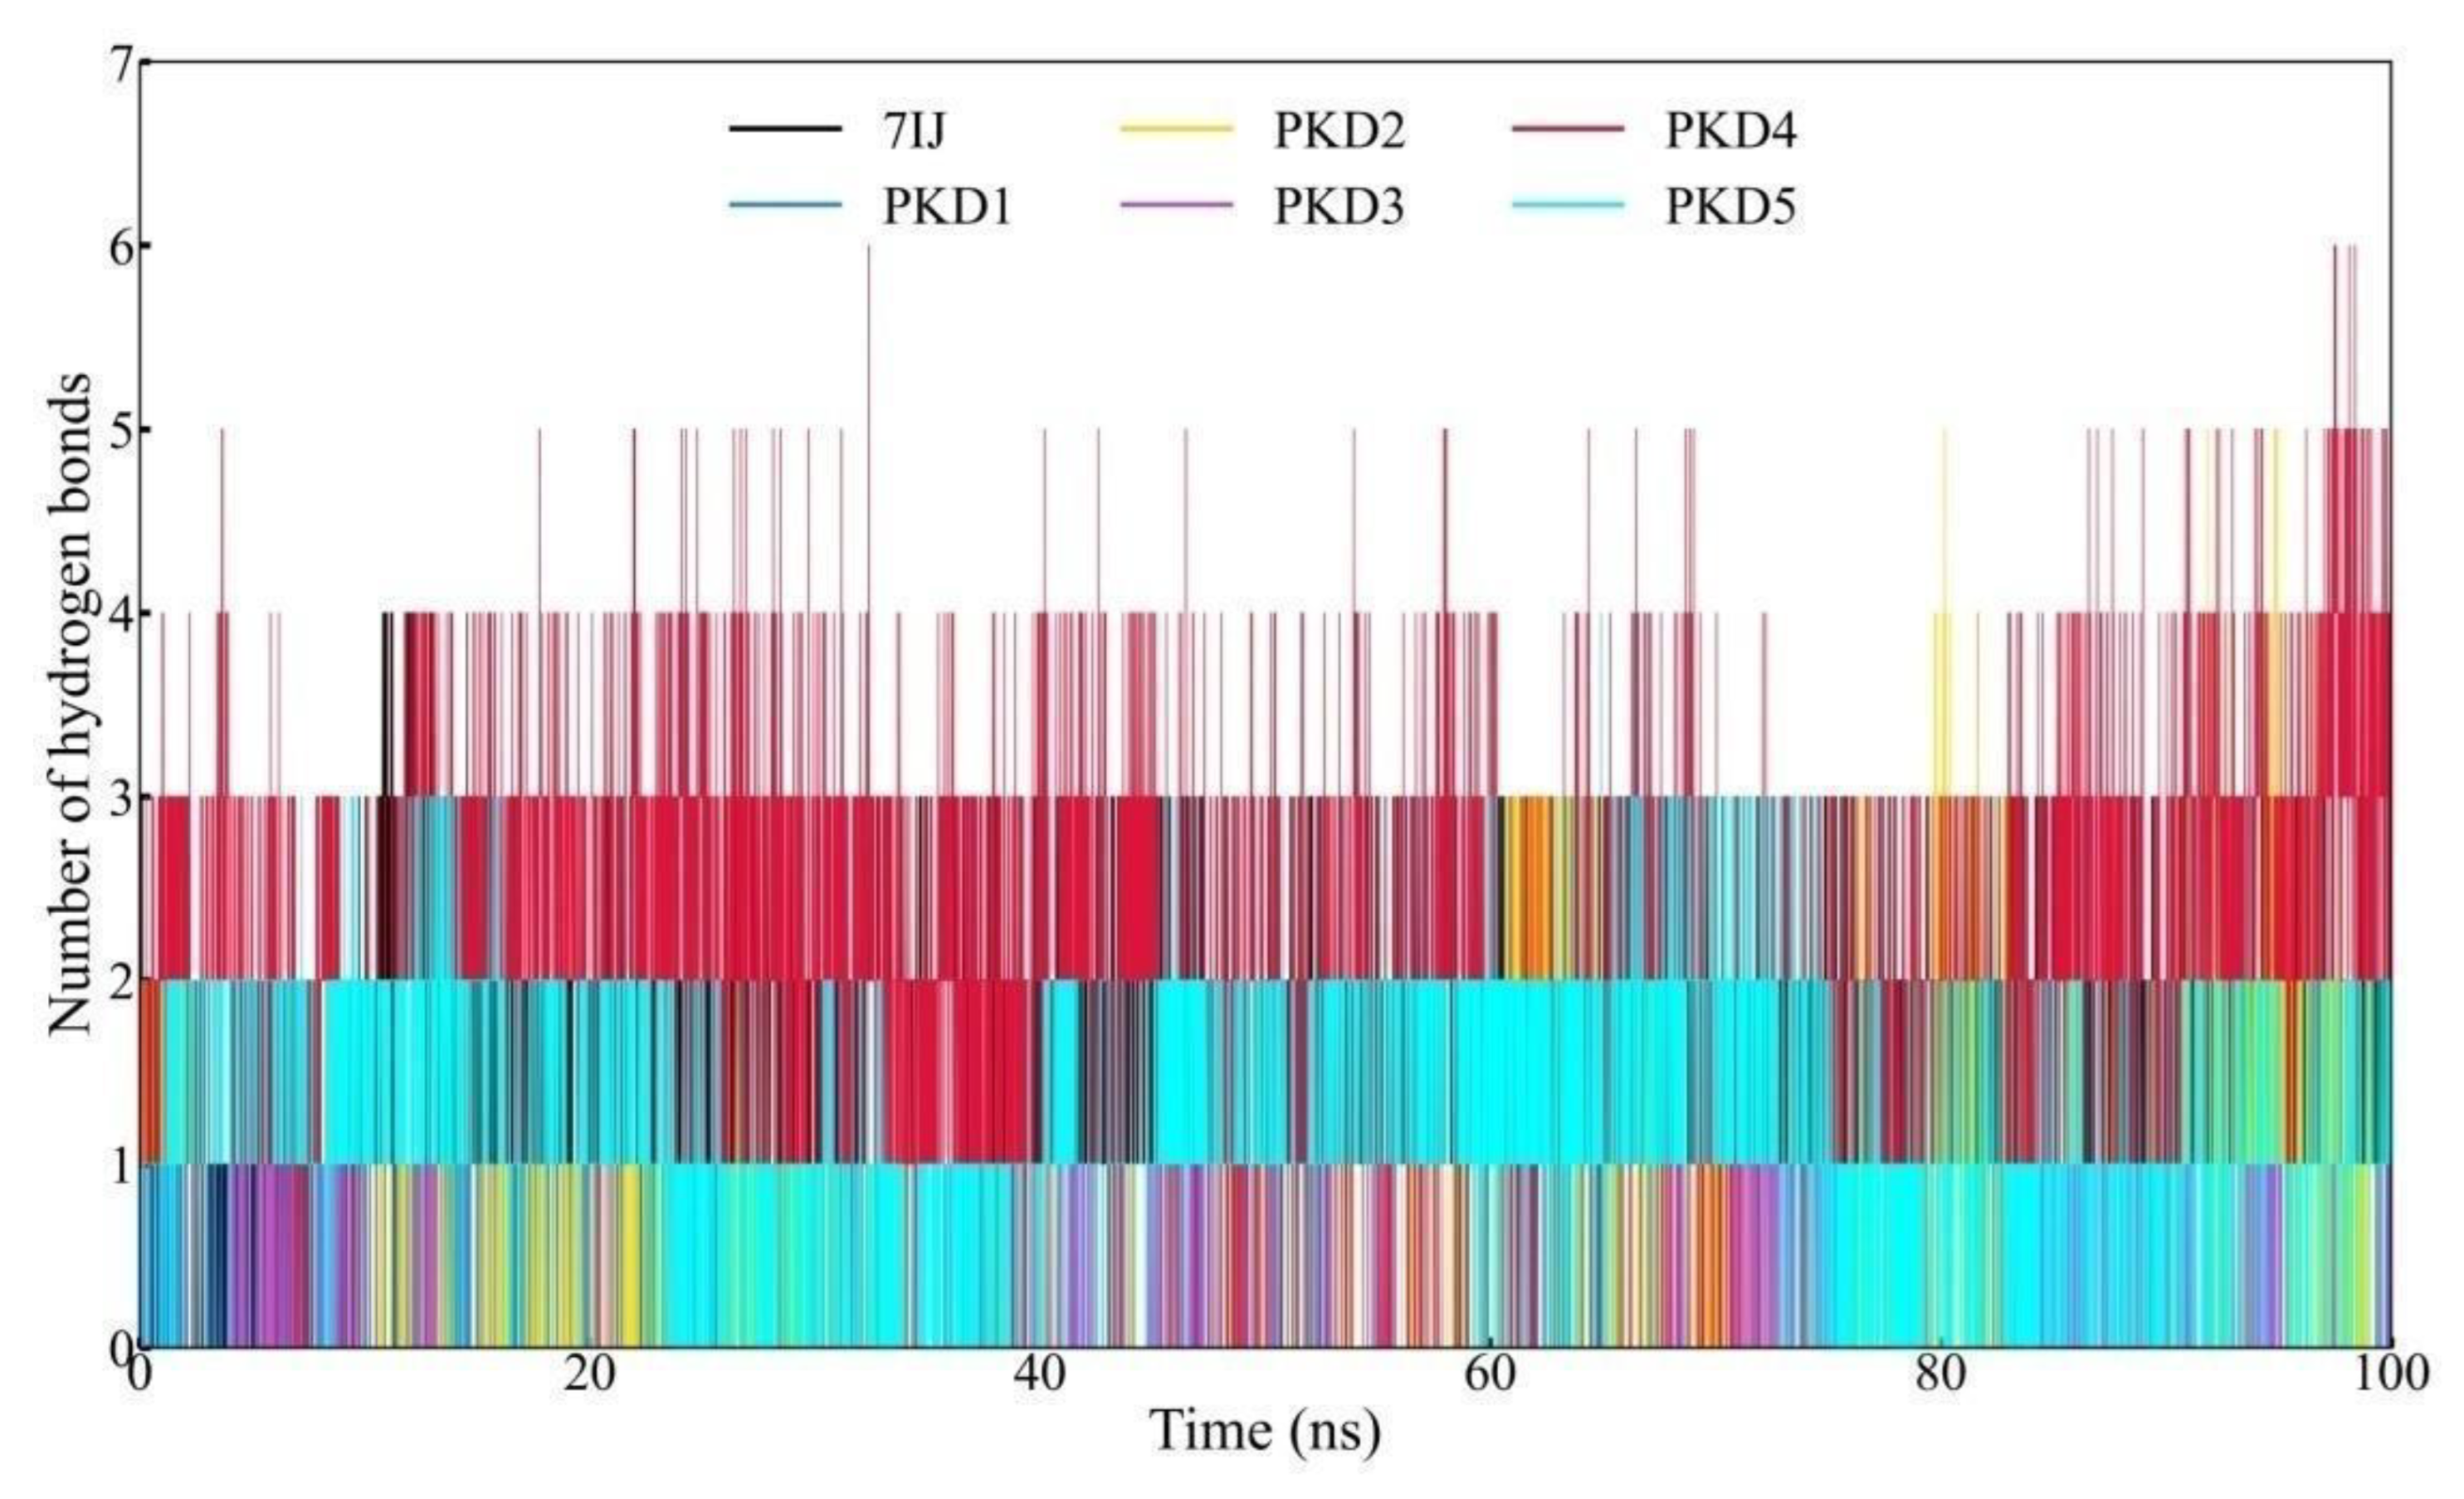
The binding affinity between the protein and ligand is notably influenced by polar interactions, with conventional hydrogen bond formations stabilising the complex. In addition to RMSD, RMSF, SASA, and Rg analyses, the intermolecular hydrogen bond formations between the ligand and protein were assessed throughout the 100 ns trajectory. These intermolecular hydrogen bonds are visually represented in
Figure 9. Notably, PKD4 exhibited a more significant disruption of the intramolecular hydrogen bond network within Pks13 than other compounds. Regarding intermolecular hydrogen bonds, PKD4 formed a maximum of six bonds with the protein, whereas 7IJ formed four. It was discovered that other compounds PKD1, PKD2, PKD3, and PKD5 could form 2, 5, 3, and 4 hydrogen bonds respectively with Pks13. Throughout the 100 ns simulation, hydrogen bond formations between the protein and ligand persisted across all complexes, highlighting their significant contribution to the binding energy within each complex. The findings revealed that the stability of the protein-ligand complex was significantly influenced by the formation of hydrogen bonds. Specifically, highlighted that PKD4 exhibited a pronounced disruption of the intramolecular hydrogen bond network within Pks13 compared to the other compounds.
Free energy Landscape (FEL) Analysis
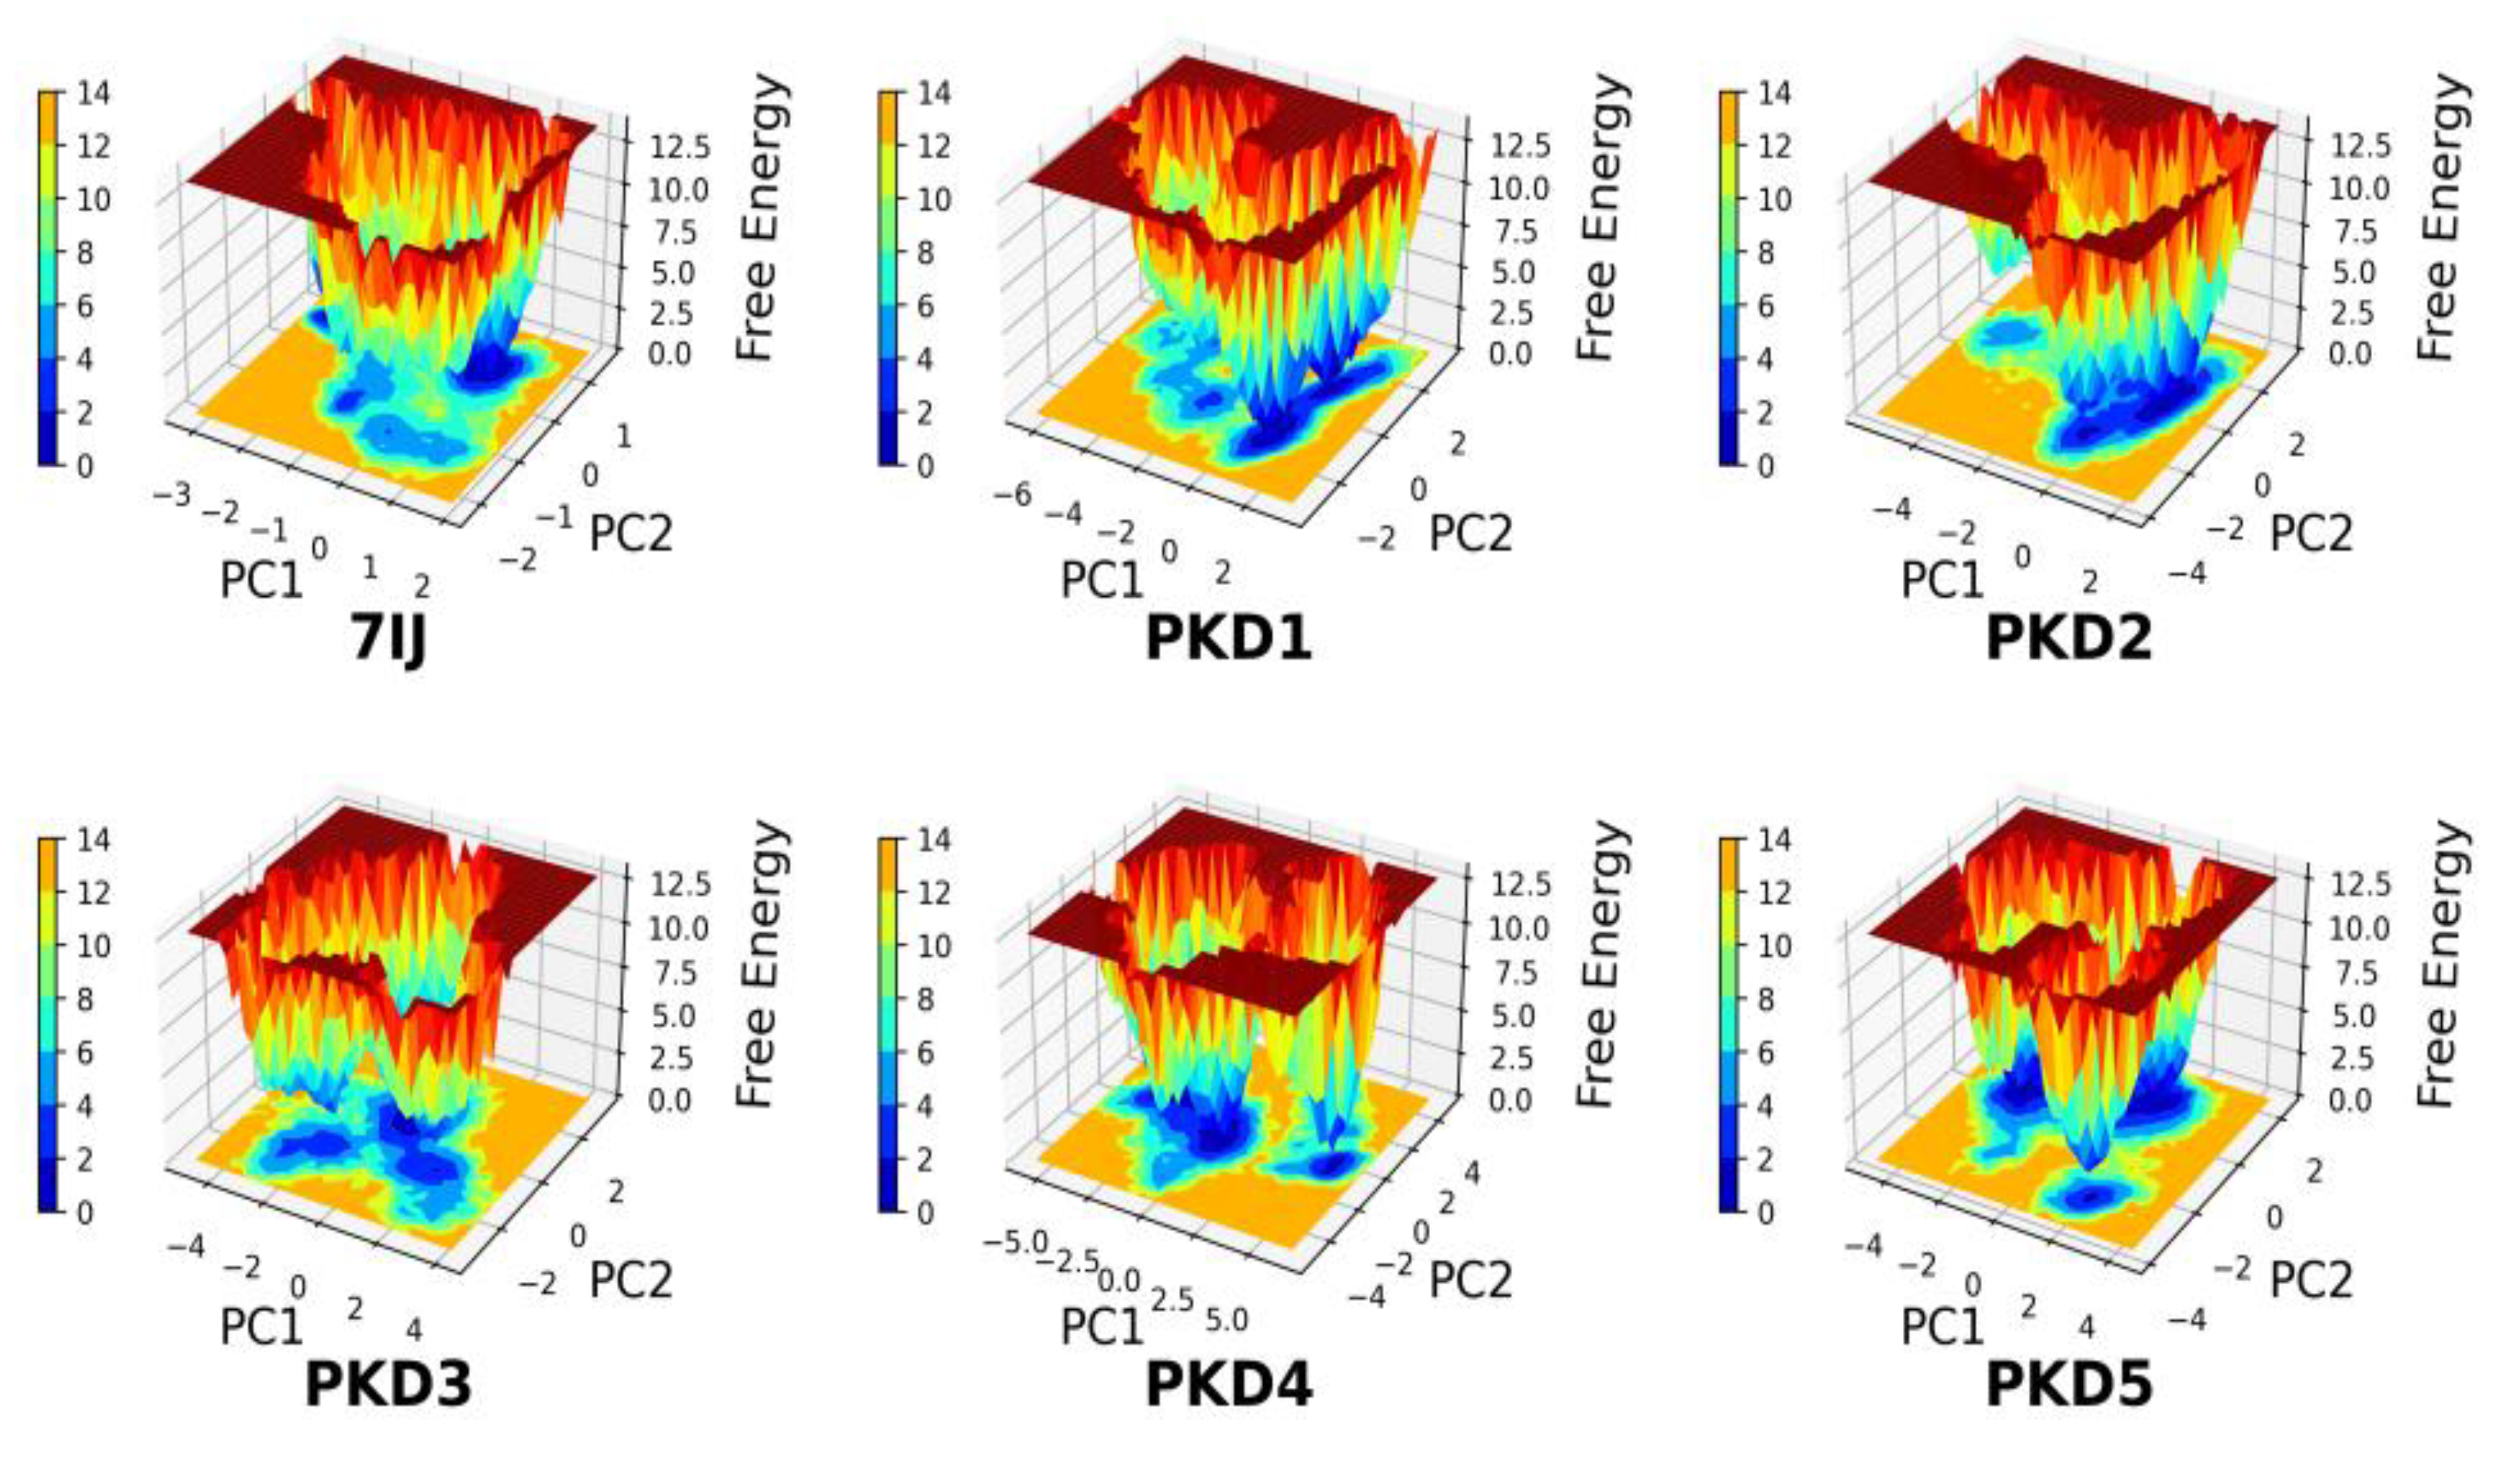
The process of generating the free energy landscape (FEL) involved plotting RMSD and Rg values obtained from the MD trajectory. The FEL profiles of the five candidate compounds (PKD1 to PKD5), along with 7IJ, showed similar characteristics when interacting with the Pks13 protein. These profiles displayed multiple local and global minima, indicating variations in Gibbs free energy across all complexes. Notably, the FELs for the PKD1 and PKD3 compounds had a more funnel-shaped bottom towards the Pks13 protein compared to other complexes (
Figure 10). These findings suggest that PKD1 and PKD3 exhibited greater conformational substates, intricate dynamic behavior, and a richer conformational diversity. PKD2 and PKD5 compounds showed flat minima underscores the stability of Pks13 during MD simulations. In comparing FELs of all generated compounds, it is showed that PKD4 showed more resemblance with co-crystal 7IJ. Moreover, FELs are valuable tools for comparing the kinetic and thermodynamic behaviour of different compounds within the same protein context.
Dynamic Cross-Correlation Map (DCCM) Analyses
During MD simulations, the DCCM analysis provides a deeper understanding of the complex movements displayed by molecules.
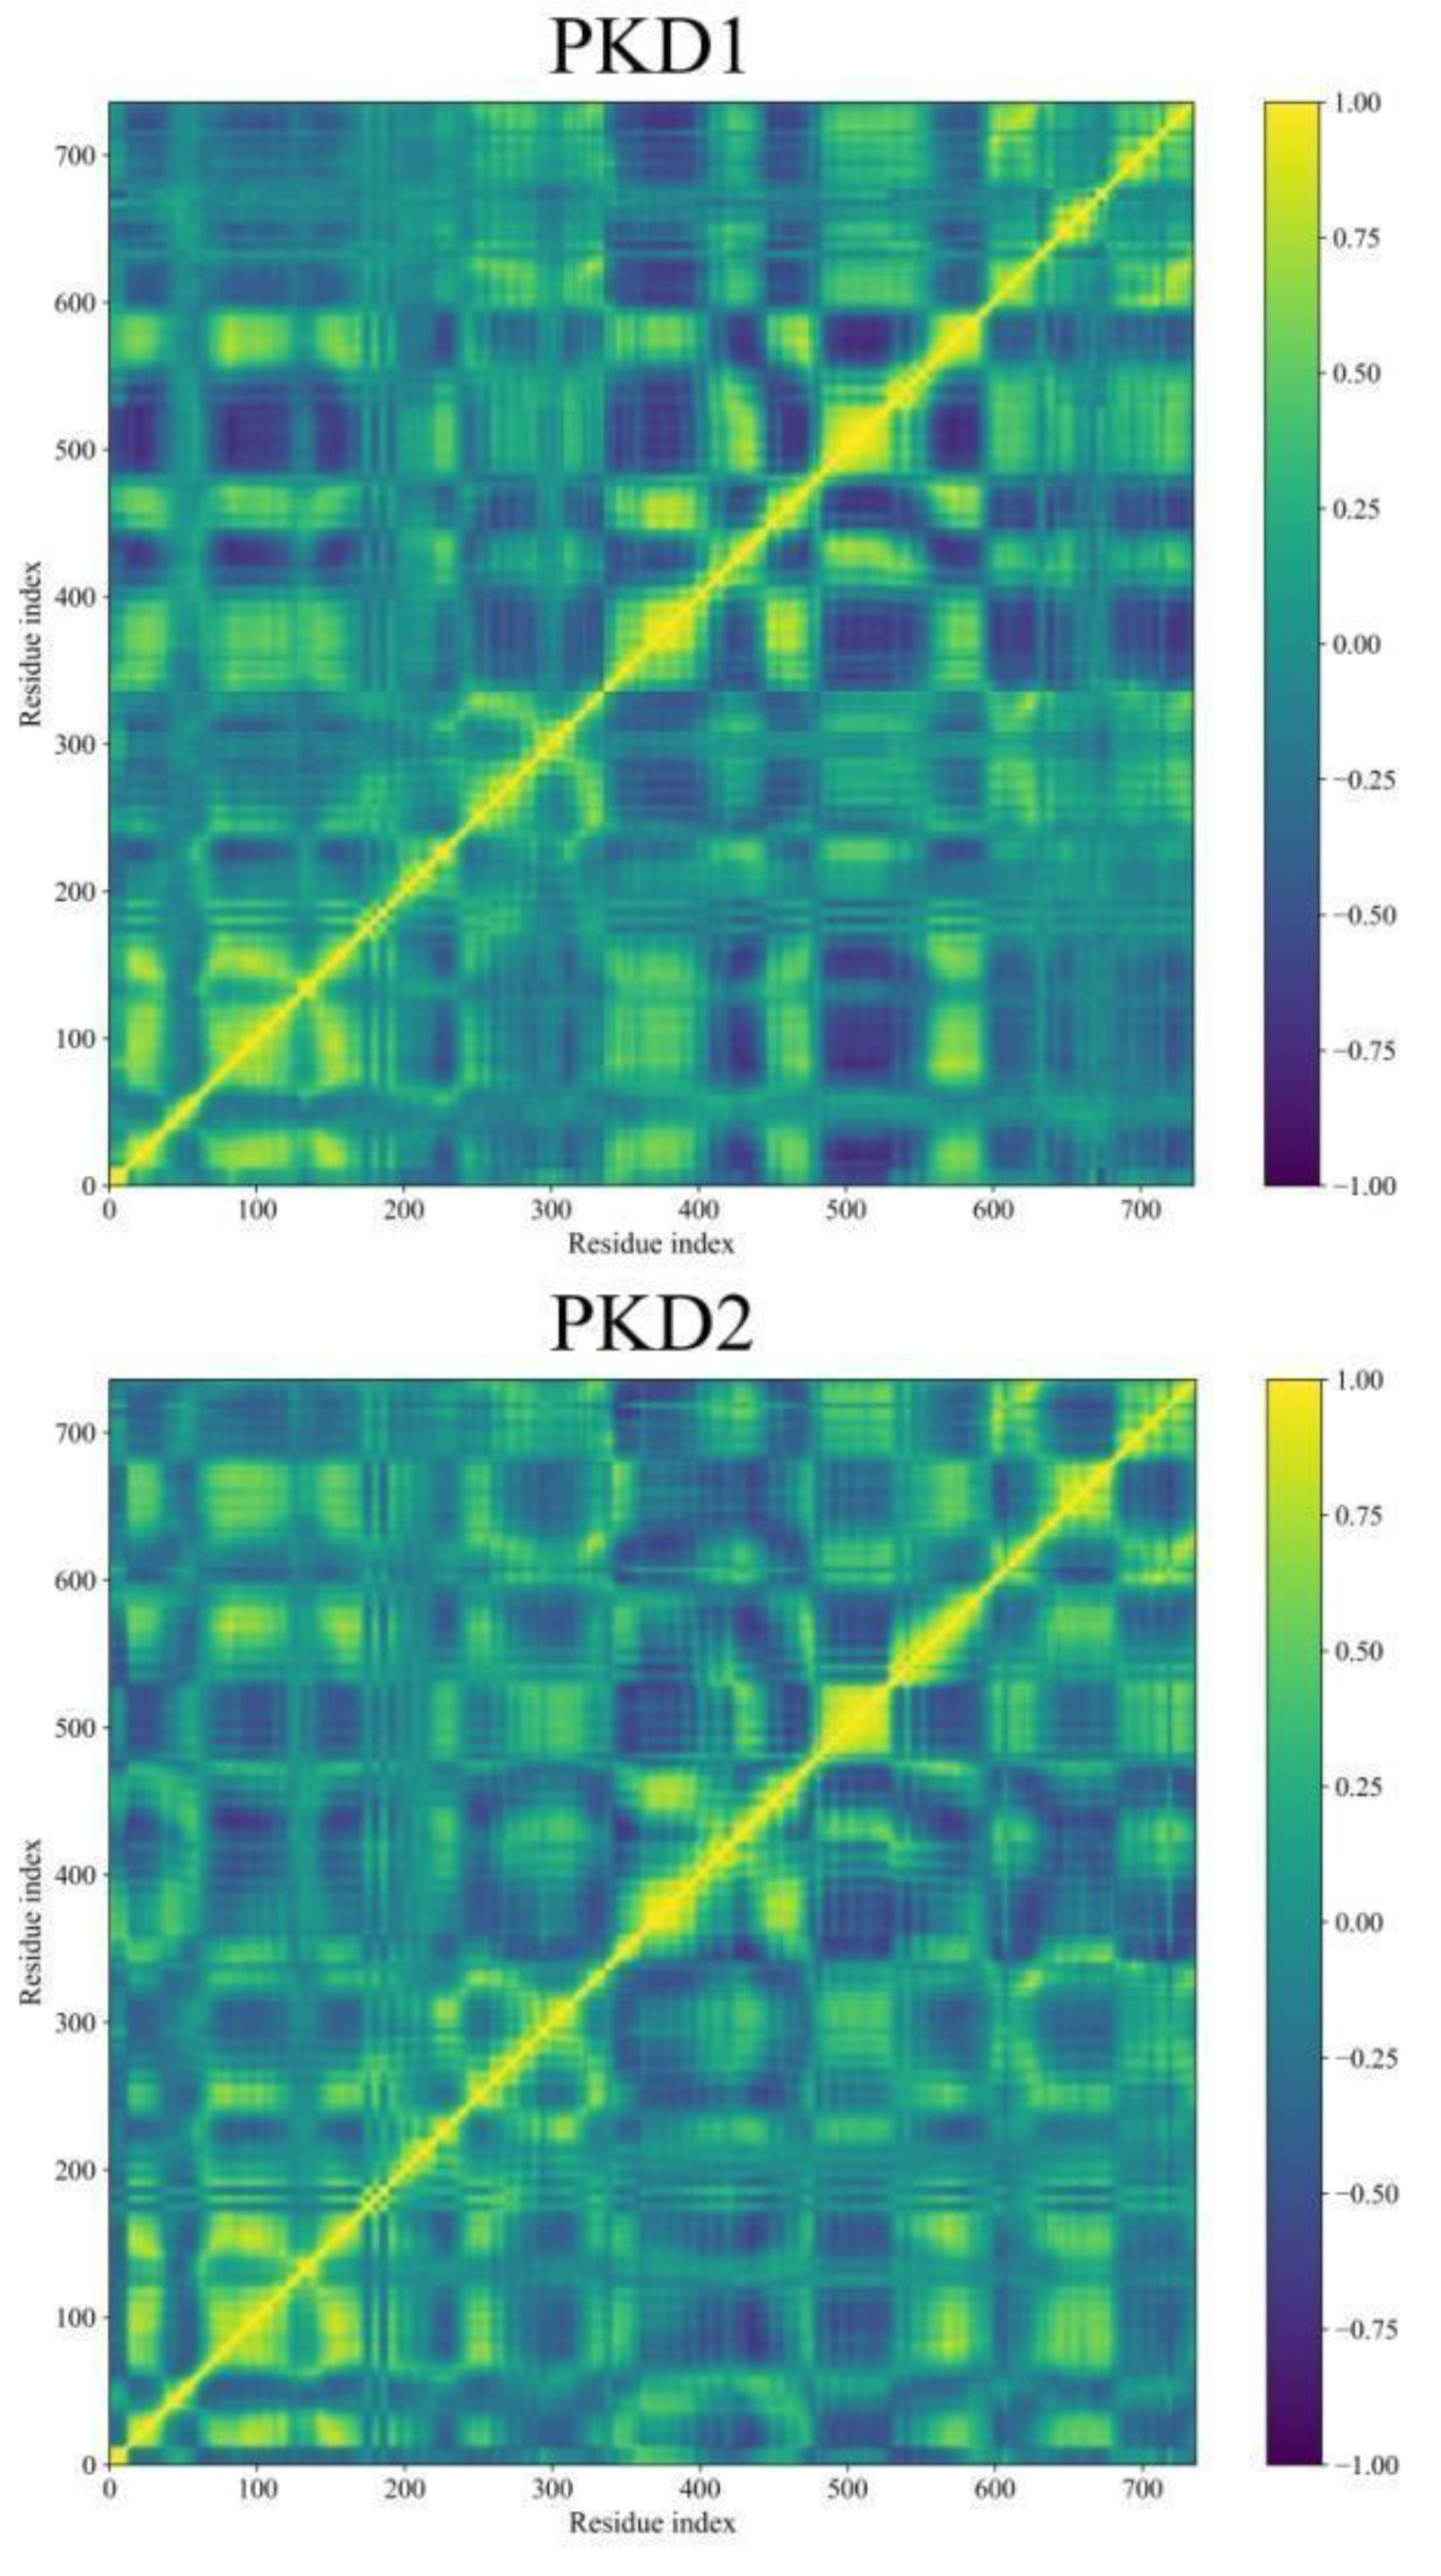
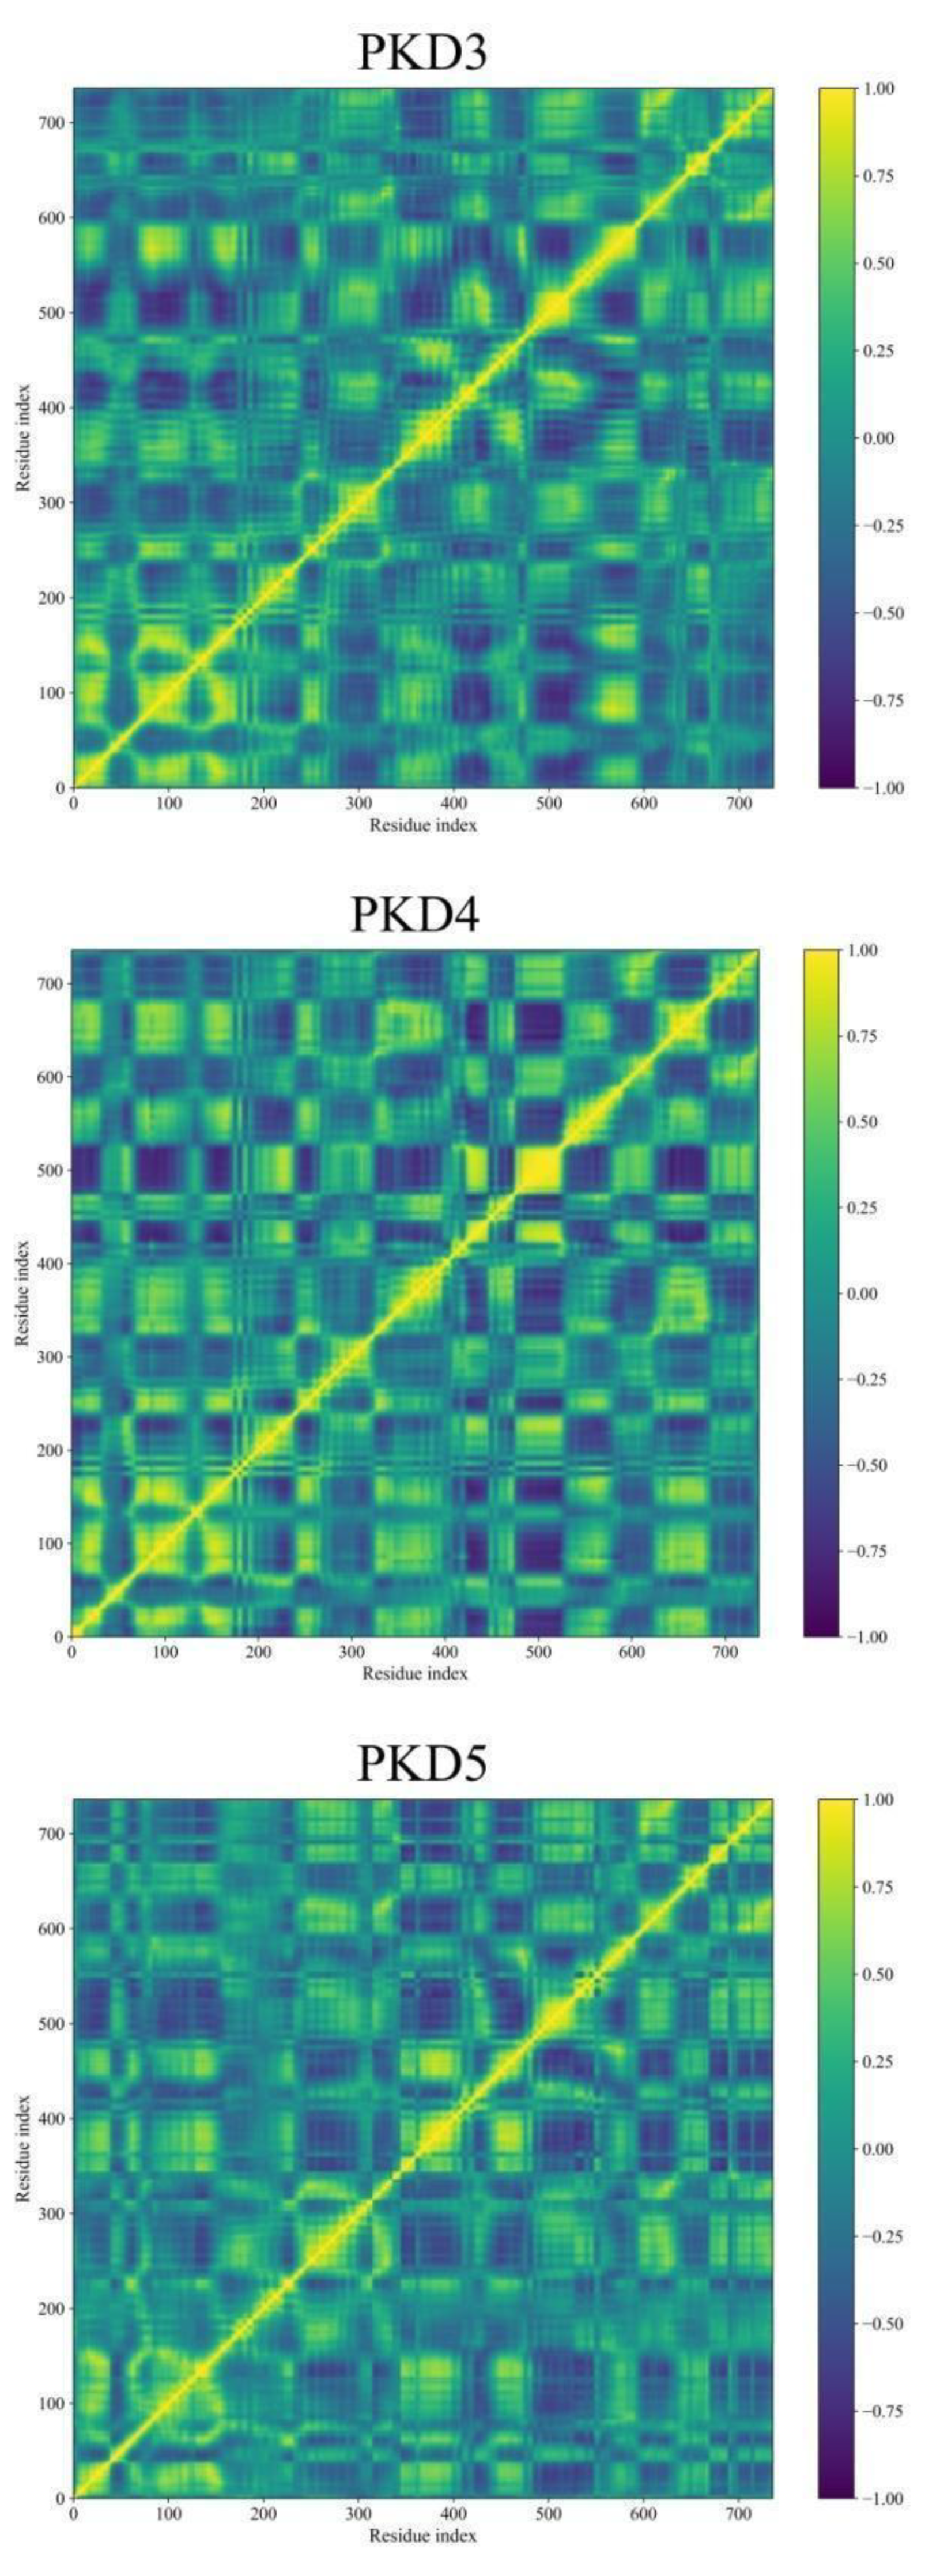
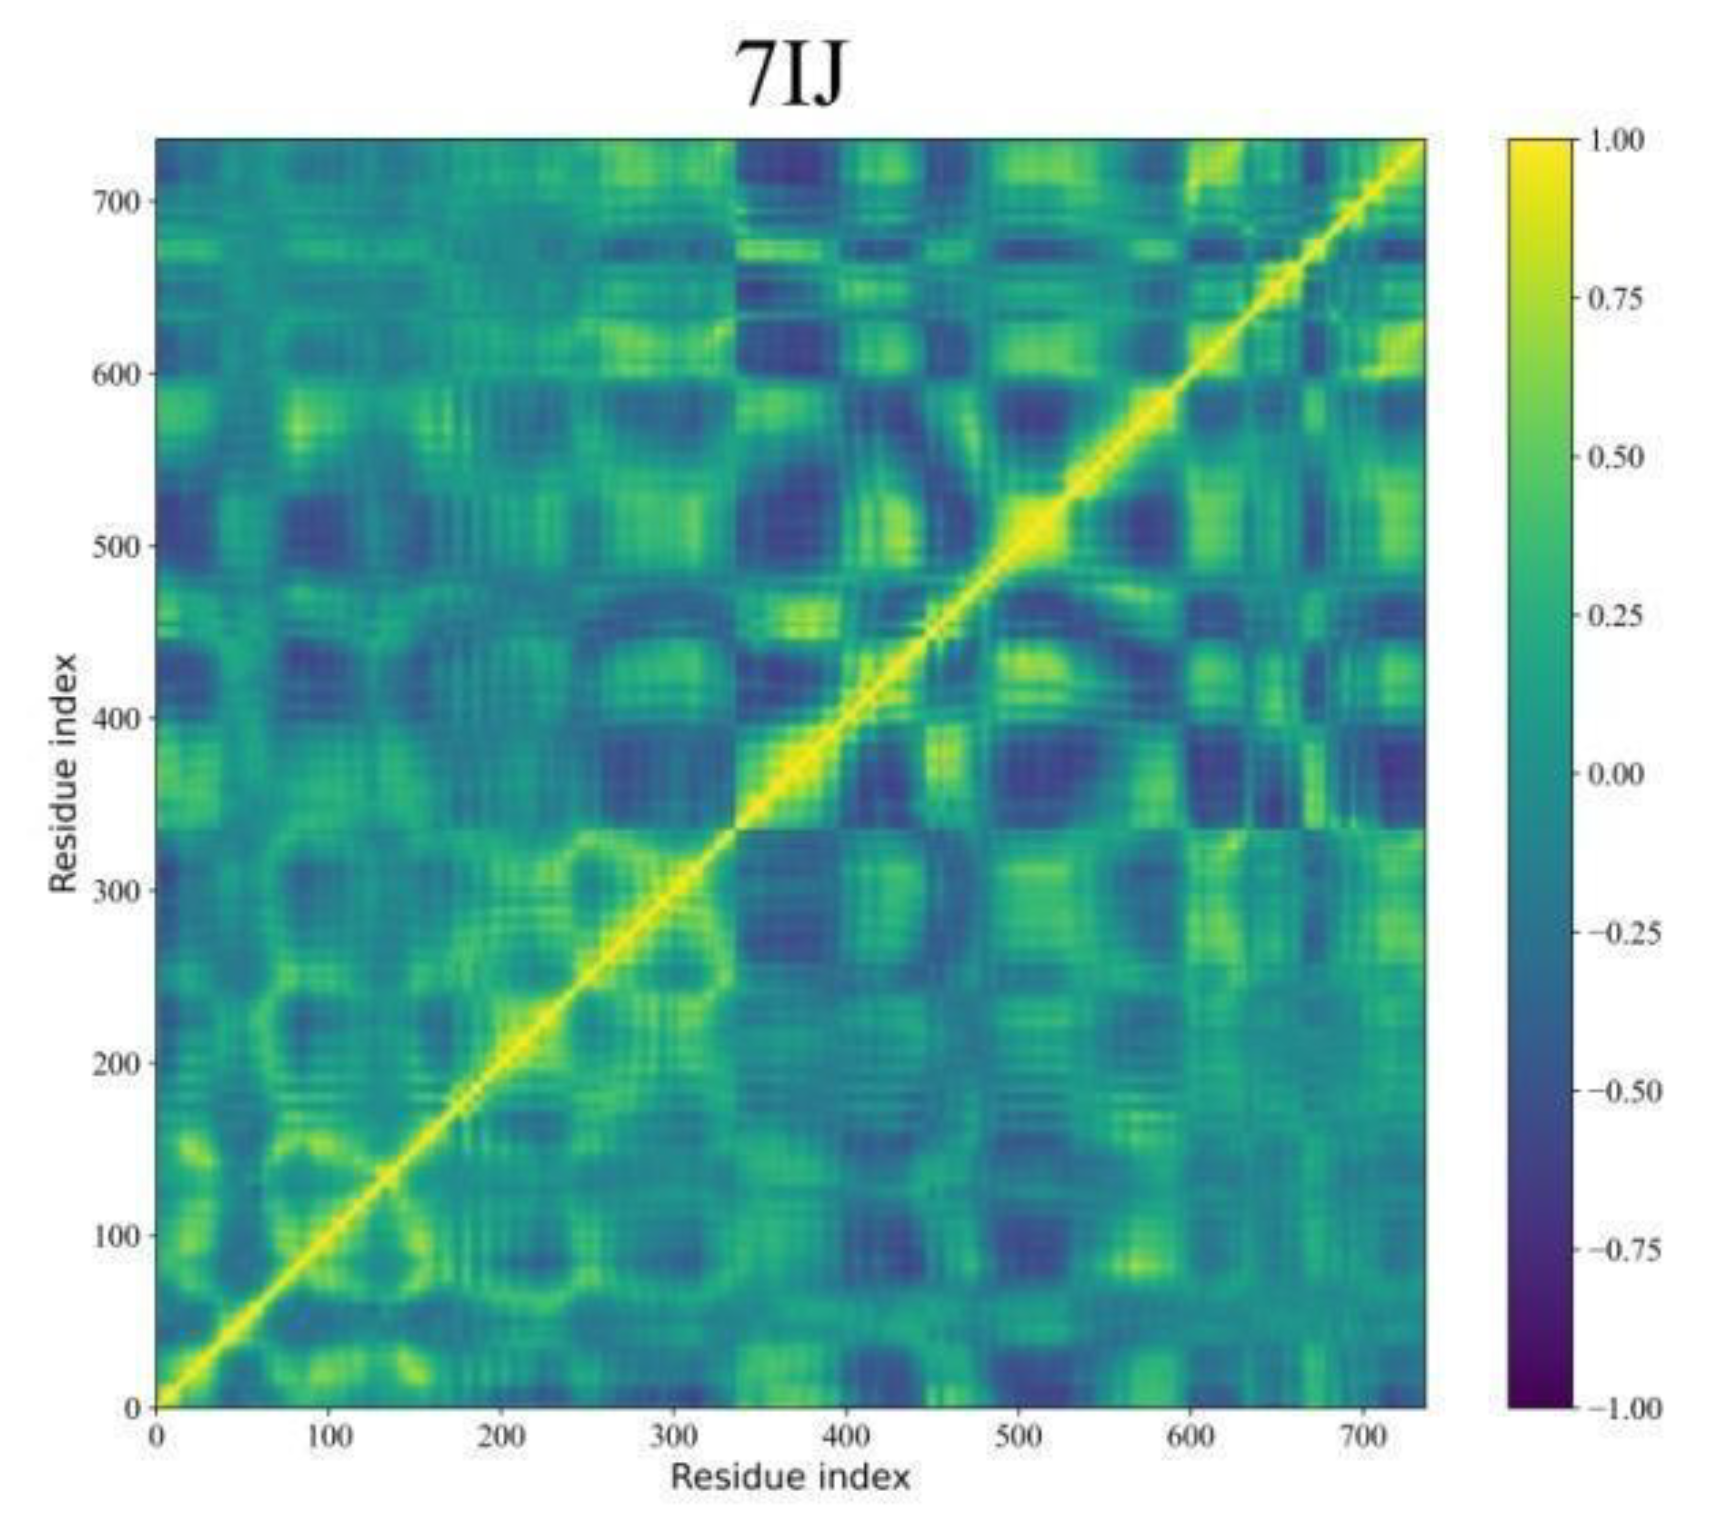
Figure 11 demonstrates the correlated fluctuations of Pks13 while bound to five selected compounds and 7IJ. DCCM helps in identifying pairs of atoms or residues that move together over time, revealing transient correlations that may not be discernible through simple Root Mean Square Deviation (RMSD) analysis. Derived from the covariance matrix, DCCM focuses on normalised correlations between atomic fluctuations, which represent scaled covariance values ranging from -1 (perfectly anti-correlated) to 1 (perfectly correlated).
Interestingly, the DCCM matrices for the five hits (PKD1-PKD5) and 7IJ bound with Pks13 exhibit similar interpretable patterns, with values ranging from -1 to 1. In
Figure 11, yellow shades indicate strong positive correlations (atoms move together), blue shades indicate negative correlations (atoms move oppositely), and deep green represents little correlation (independent motion). Regions displaying strong correlations suggest residues or domains that move in a coordinated fashion, potentially indicating specific functional relationships within Pks13.
Figure 11.
DCCM analysis was conducted for Pks13 in relation to five compounds (PKD1-PKD5) and a co-crystal (7IJ). The colour scale on the right transitions from yellow, indicating highly positive correlations, to blue, indicating highly negative correlations.
Figure 11.
DCCM analysis was conducted for Pks13 in relation to five compounds (PKD1-PKD5) and a co-crystal (7IJ). The colour scale on the right transitions from yellow, indicating highly positive correlations, to blue, indicating highly negative correlations.
Binding Free Energy Analysis through MM-GBSA Approach
The protein-ligand complexes were analyzed using MD simulation, and the resulting trajectories were utilized to compute the binding free energies. The findings are summarized in
Table 7, detailing the energy contributions and binding energies. Among the examined ligands, 7IJ exhibited the ΔGbind of -36.74 (SD = 3.50) kcal/mol (
Table 7). PKD5 demonstrated highest binding energy with ΔGbind= -43.38 (4.63) kcal/mol, facilitated by multiple hydrogen bonds, hydrophobic interactions, and π-π interactions that enhance its stability. In contrast, ligands PKD2 and PKD3 displayed comparatively lower binding energies in this ligand set, with ΔGbind values of -16.24 (2.67) kcal/mol and -6.52 (4.44) kcal/mol, respectively.
Conclusion
Our study aimed to identify and evaluate potential inhibitors targeting the Pks13 protein, a validated target in TB drug discovery. We used a multi-faceted computational approach that involved QSAR modelling, compound library generation, molecular docking, biological activity prediction, re-evaluation of screened compounds through binding free energy estimation, MD analysis, and binding free energy analysis using the MM-GBSA approach. To develop a predictive model for the minimum inhibitory concentration (MIC) values of potential anti-TB agents, we used multiple linear regression (MLR) techniques in QSAR modelling. The model we developed showed high internal and external validation metrics, ensuring its reliability and utility in drug discovery.
After generating a diverse compound library, we used molecular docking to identify potential inhibitors. We prioritized the compounds for further investigation using the binding energies obtained. We predicted the biological activity of filtered compounds using a validated QSAR model. This guided the selection of promising candidates for experimental validation. We refined the selected compounds through re-evaluation using absolute binding free energy estimation. This provided valuable insights into their interaction with the Pks13 protein. We reinforced the stability of the protein-ligand complexes over time using MD simulations. This highlighted the potential of the identified compounds as stable binders within the Pks13 binding pocket. Lastly, we used the MM-GBSA approach to perform binding free energy analysis. This reaffirmed the strong affinity of the proposed compounds towards the Pks13 protein. In conclusion, our integrated computational approach has facilitated the identification and characterization of potential Pks13-TE doamin inhibitors with strong binding affinity. This lays a solid foundation for further experimental validation and drug development efforts in the fight against TB.
Conflict of Interest
None to declare
Acknowledgment
The authors extend their appreciation to the Researchers Supporting Project number (RSP2024R374) King Saud University, Riyadh, Saud Arabia.
Bibliography
-
Global tuberculosis report 2023. https://www.who.int/publications/i/item/9789240083851 (accessed 2024-04-22).
- Dartois, V. A.; Rubin, E. J. Anti-Tuberculosis Treatment Strategies and Drug Development: Challenges and Priorities. Nature Reviews Microbiology 2022 20:11 2022, 20 (11), 685–701. [CrossRef]
- Farhat, M.; Cox, H.; Ghanem, M.; Denkinger, C. M.; Rodrigues, C.; Abd El Aziz, M. S.; Enkh-Amgalan, H.; Vambe, D.; Ugarte-Gil, C.; Furin, J.; Pai, M. Drug-Resistant Tuberculosis: A Persistent Global Health Concern. Nature Reviews Microbiology 2024 2024, 1–19. [CrossRef]
- Lee, J. Y. Diagnosis and Treatment of Extrapulmonary Tuberculosis. Tuberc Respir Dis (Seoul) 2015, 78 (2), 47–55. [CrossRef]
- Gavalda, S.; Bardou, F.; Laval, F.; Bon, C.; Malaga, W.; Chalut, C.; Guilhot, C.; Mourey, L.; Daffé, M.; Quémard, A. The Polyketide Synthase Pks13 Catalyzes a Novel Mechanism of Lipid Transfer in Mycobacteria. Chem Biol 2014, 21 (12), 1660–1669. [CrossRef]
- Wilson, R.; Kumar, P.; Parashar, V.; Vilchèze, C.; Veyron-Churlet, R.; Freundlich, J. S.; Barnes, S. W.; Walker, J. R.; Szymonifka, M. J.; Marchiano, E.; Shenai, S.; Colangeli, R.; Jacobs, W. R.; Neiditch, M. B.; Kremer, L.; Alland, D. Antituberculosis Thiophenes Define a Requirement for Pks13 in Mycolic Acid Biosynthesis. Nature Chemical Biology 2013 9:8 2013, 9 (8), 499–506. [CrossRef]
- Zhang, W.; Liu, L. ling; Lun, S.; Wang, S. S.; Xiao, S.; Gunosewoyo, H.; Yang, F.; Tang, J.; Bishai, W. R.; Yu, L. F. Design and Synthesis of Mycobacterial Pks13 Inhibitors: Conformationally Rigid Tetracyclic Molecules. Eur J Med Chem 2021, 213, 113202. [CrossRef]
- Kim, S. K.; Dickinson, M. S.; Finer-Moore, J.; Guan, Z.; Kaake, R. M.; Echeverria, I.; Chen, J.; Pulido, E. H.; Sali, A.; Krogan, N. J.; Rosenberg, O. S.; Stroud, R. M. Structure and Dynamics of the Essential Endogenous Mycobacterial Polyketide Synthase Pks13. Nature Structural & Molecular Biology 2023 30:3 2023, 30 (3), 296–308. [CrossRef]
- Chikhale, R. V; Eldesoky, E.; Kolpe, M. S.; Suryawanshi, V. S.; Patil, P. C.; Bhowmick, S. Identification of Mycobacterium Tuberculosis Transcriptional Repressor EthR Inhibitors: Shape-Based Search and Machine Learning Studies. 2024. [CrossRef]
- Chikhale, R. V.; Abdelghani, H. T. M.; Deka, H.; Pawar, A. D.; Patil, P. C.; Bhowmick, S. Machine Learning Assisted Methods for the Identification of Low Toxicity Inhibitors of Enoyl-Acyl Carrier Protein Reductase (InhA). Comput Biol Chem 2024, 110, 108034. [CrossRef]
- Liu, P.; Long, W. Current Mathematical Methods Used in QSAR/QSPR Studies. Int J Mol Sci 2009, 10 (5), 1978. [CrossRef]
- Lun, S.; Xiao, S.; Zhang, W.; Wang, S.; Gunosewoyo, H.; Yu, L. F.; Bishai, W. R. Therapeutic Potential of Coumestan Pks13 Inhibitors for Tuberculosis. Antimicrob Agents Chemother 2021, 65 (5). [CrossRef]
- Yap, C. W. PaDEL-Descriptor: An Open Source Software to Calculate Molecular Descriptors and Fingerprints. J Comput Chem 2011, 32 (7), 1466–1474. [CrossRef]
- Ambure, P.; Aher, R. B.; Gajewicz, A.; Puzyn, T.; Roy, K. “NanoBRIDGES” Software: Open Access Tools to Perform QSAR and Nano-QSAR Modeling. Chemometrics and Intelligent Laboratory Systems 2015, 147, 1–13. [CrossRef]
- Roy, K.; Mitra, I. On Various Metrics Used for Validation of Predictive QSAR Models with Applications in Virtual Screening and Focused Library Design. Comb Chem High Throughput Screen 2011, 14 (6), 450–474. [CrossRef]
- Roy, K.; Chakraborty, P.; Mitra, I.; Ojha, P. K.; Kar, S.; Das, R. N. Some Case Studies on Application of “Rm2” Metrics for Judging Quality of Quantitative Structure–Activity Relationship Predictions: Emphasis on Scaling of Response Data. J Comput Chem 2013, 34 (12), 1071–1082. [CrossRef]
- Zhang, W.; Lun, S.; Wang, S. S.; Cai, Y. P.; Yang, F.; Tang, J.; Bishai, W. R.; Yu, L. F. Structure-Based Optimization of Coumestan Derivatives as Polyketide Synthase 13-Thioesterase(Pks13-TE) Inhibitors with Improved HERG Profiles for Mycobacterium Tuberculosis Treatment. J Med Chem 2022, 65 (19), 13240–13252. [CrossRef]
-
Compound Libraries/Screening Libraries for High Throughput/Content Screening|96-Well. https://www.selleckchem.com/screening-libraries.html (accessed 2024-04-22).
-
Screening Libraries. https://www.chemdiv.com/catalog/screening-libraries/ (accessed 2024-04-22).
- Gaulton, A.; Bellis, L. J.; Bento, A. P.; Chambers, J.; Davies, M.; Hersey, A.; Light, Y.; McGlinchey, S.; Michalovich, D.; Al-Lazikani, B.; Overington, J. P. ChEMBL: A Large-Scale Bioactivity Database for Drug Discovery. Nucleic Acids Res 2012, 40 (D1), D1100–D1107. [CrossRef]
-
Diversity Libraries - Enamine. https://enamine.net/compound-libraries/diversity-libraries (accessed 2024-04-22).
-
Asinex.com - Antibacterial - Research Areas - Screening Libraries. https://www.asinex.com/antibacterial (accessed 2024-04-22).
-
The RDKit Documentation — The RDKit 2024.03.1 documentation. https://rdkit.org/docs/index.html (accessed 2024-04-22).
- Ellingson, S. R.; Smith, J. C.; Baudry, J. VinaMPI: Facilitating Multiple Receptor High-Throughput Virtual Docking on High-Performance Computers. J Comput Chem 2013, 34 (25), 2212–2221. [CrossRef]
- Morris, G. M.; Ruth, H.; Lindstrom, W.; Sanner, M. F.; Belew, R. K.; Goodsell, D. S.; Olson, A. J. AutoDock4 and AutoDockTools4: Automated Docking with Selective Receptor Flexibility. J Comput Chem 2009, 30 (16), 2785. [CrossRef]
- O’Boyle, N. M.; Banck, M.; James, C. A.; Morley, C.; Vandermeersch, T.; Hutchison, G. R. Open Babel: An Open Chemical Toolbox. J Cheminform 2011, 3 (10), 1–14. [CrossRef]
- Jiménez, J.; Škalič, M.; Martínez-Rosell, G.; De Fabritiis, G. KDEEP: Protein-Ligand Absolute Binding Affinity Prediction via 3D-Convolutional Neural Networks. J Chem Inf Model 2018, 58 (2), 287–296. [CrossRef]
- Wang, R.; Fang, X.; Lu, Y.; Yang, C. Y.; Wang, S. The PDBbind Database: Methodologies and Updates. J Med Chem 2005, 48 (12), 4111–4119. [CrossRef]
- van Gunsteren, W. F.; Berendsen, H. J. C. Computer Simulation of Molecular Dynamics: Methodology, Applications, and Perspectives in Chemistry. Angewandte Chemie International Edition in English 1990, 29 (9), 992–1023. [CrossRef]
- Valdés-Tresanco, M. S.; Valdés-Tresanco, M. E.; Valiente, P. A.; Moreno, E. Gmx_MMPBSA: A New Tool to Perform End-State Free Energy Calculations with GROMACS. J Chem Theory Comput 2021, 17 (10), 6281–6291. [CrossRef]
|
Disclaimer/Publisher’s Note: The statements, opinions and data contained in all publications are solely those of the individual author(s) and contributor(s) and not of MDPI and/or the editor(s). MDPI and/or the editor(s) disclaim responsibility for any injury to people or property resulting from any ideas, methods, instructions or products referred to in the content. |
© 2024 by the authors. Licensee MDPI, Basel, Switzerland. This article is an open access article distributed under the terms and conditions of the Creative Commons Attribution (CC BY) license (http://creativecommons.org/licenses/by/4.0/).
