Submitted:
01 May 2024
Posted:
01 May 2024
You are already at the latest version
Abstract
Keywords:
1. Introduction
2. Non-Extensive Statistical Mechanics
2.1. Non-Additive Tsallis Entropy and Probability Distribution
2.2. Cumulative Distribution of Earthquakes
3. Tectonic Setting
4. Earthquake Data and Analysis Procedure
| Region | Number of earthquakes | |||
|---|---|---|---|---|
| Baja California | 1.4 | 6.8 | 9579 | 3.70 |
| Nayarit-Jalisco | 2.3 | 5.9 | 3774 | 3.30 |
| Colima-Michoacán | 1.9 | 7.7 | 20229 | 3.45 |
| Guerrero | 1.9 | 7.4 | 33080 | 3.65 |
| Oaxaca | 1.2 | 7.5 | 59803 | 3.46 |
| Chiapas | 1.6 | 8.2 | 67008 | 3.76 |
5. Results
5.1. The Gutenberg-Richter (GR) Law
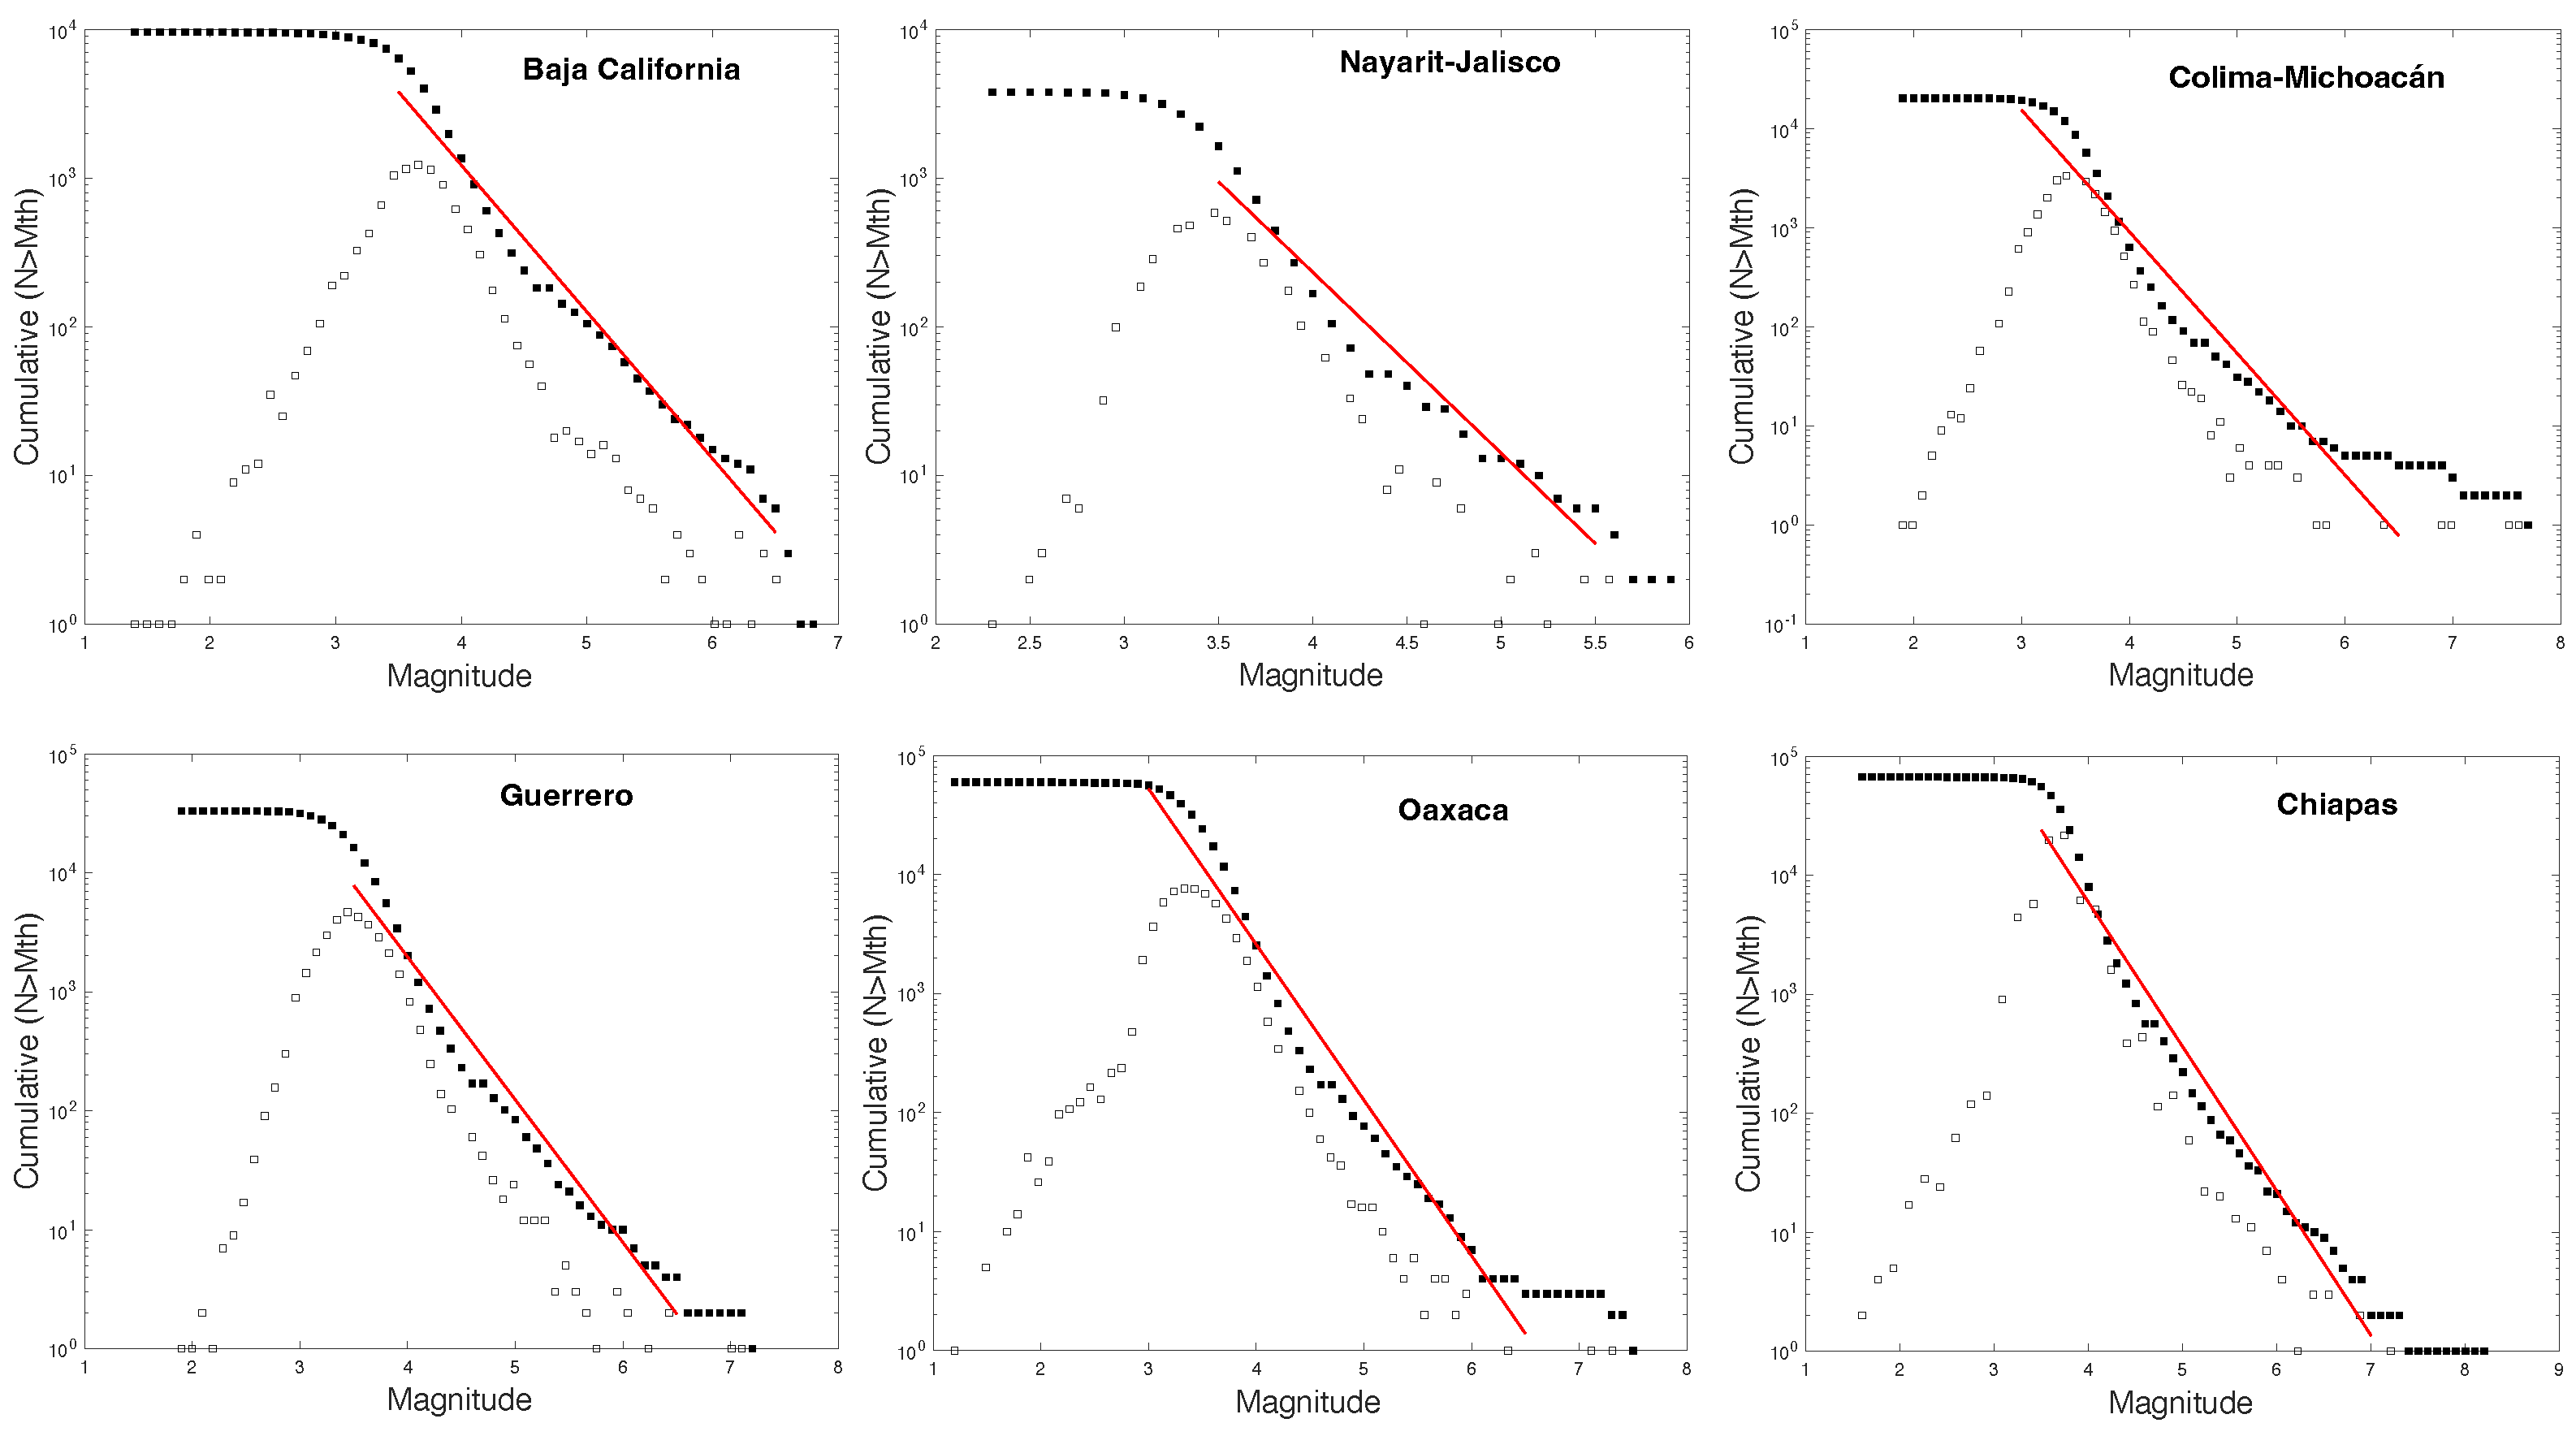
| Region | a for (non-normalized) | b for (non-normalized) | a for (normalized) | b for (normalized) |
|---|---|---|---|---|
| Baja California | 7.010 | −0.991 | 3.236 | −1.031 |
| Nayarit-Jalisco | 6.814 | −1.135 | 4.435 | −1.416 |
| Colima-Michoacán | 7.518 | −1.148 | 5.480 | −1.743 |
| Guerrero | 8.280 | −1.243 | 4.132 | −1.345 |
| Oaxaca | 8.634 | −1.327 | 4.925 | −1.574 |
| Chiapas | 9.266 | −1.359 | 4.006 | −1.273 |
5.2. Non-Extensive Analysis
| Region | (DGE) | (DGE) | q (DGE) | (DGE) | q (BFGS) | (BFGS) |
|---|---|---|---|---|---|---|
| Baja California | 1.50 | 6.87(10) | 1.60 | 6.878(10) | 1.55 | 6.878(10) |
| Nayarit-Jalisco | 1.56 | 1.97(10) | 1.56 | 1.978(10) | 1.57 | 1.978(10) |
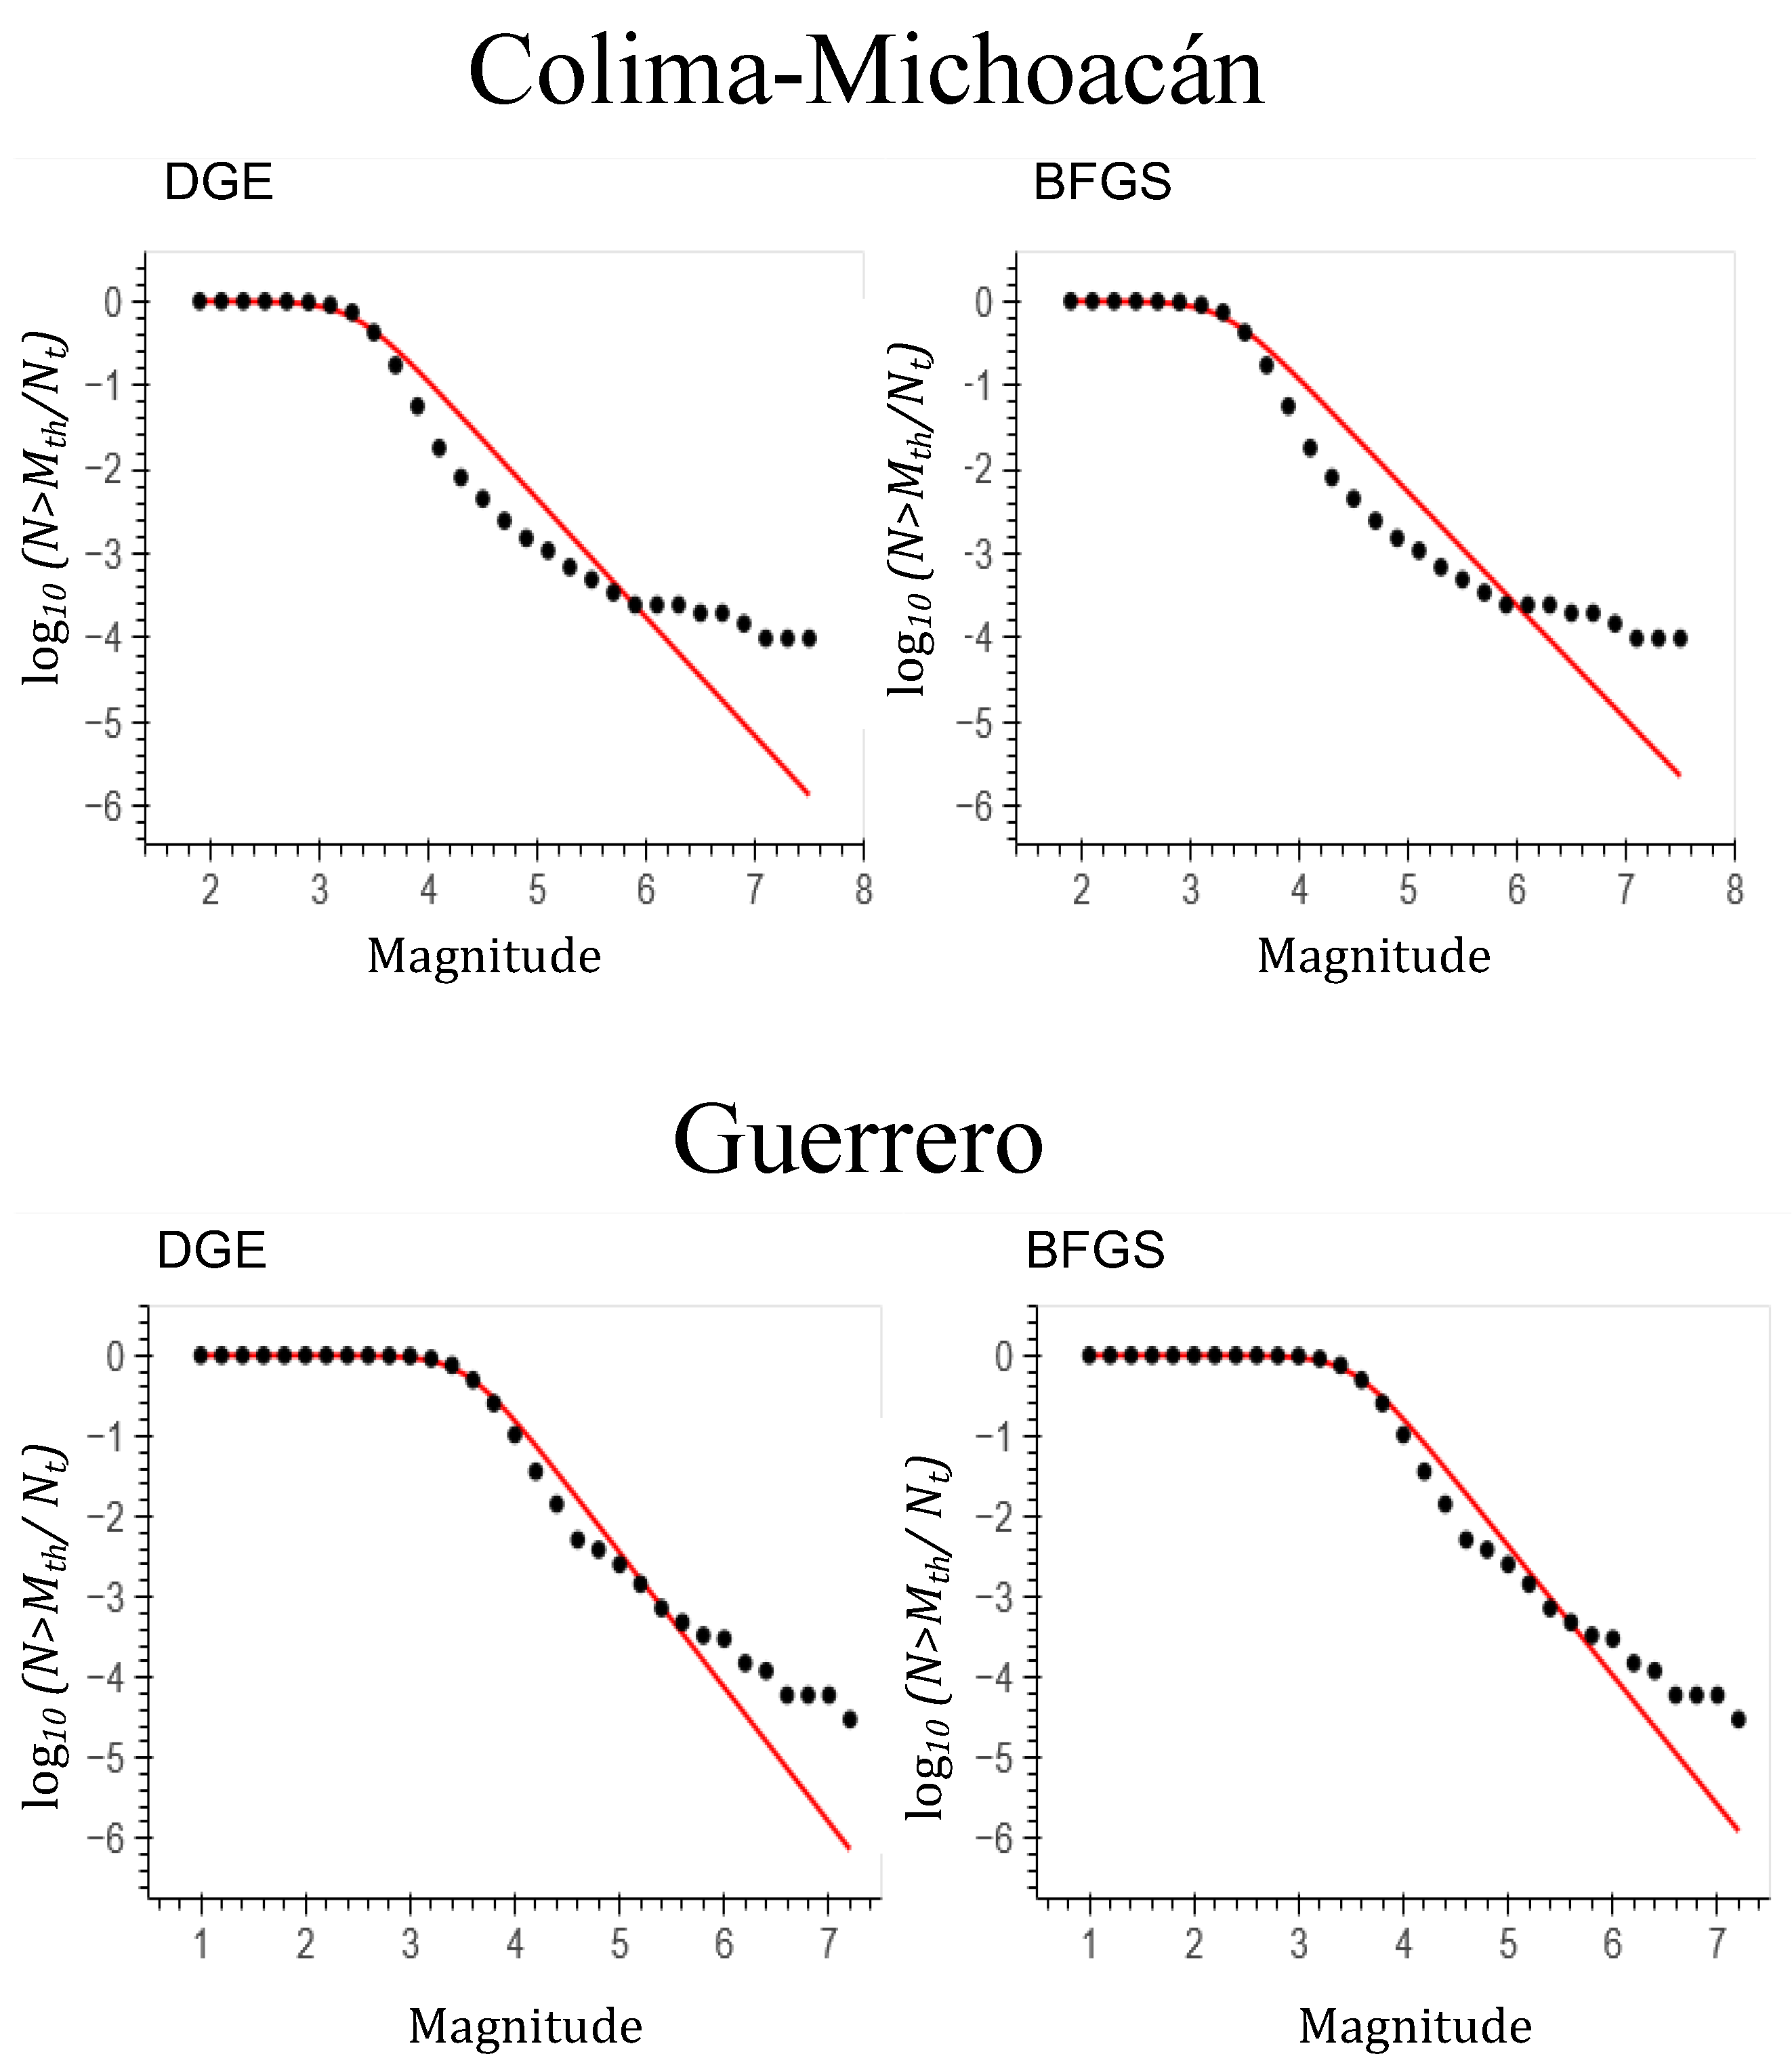
| Colima-Michoacán | 1.58 | 1.50(10) | 1.59 | 1.559(10) | 1.60 | 1.559(10) |
| Guerrero | 1.50 | 8.40(10) | 1.54 | 5.432(10) | 1.55 | 5.432(10) |
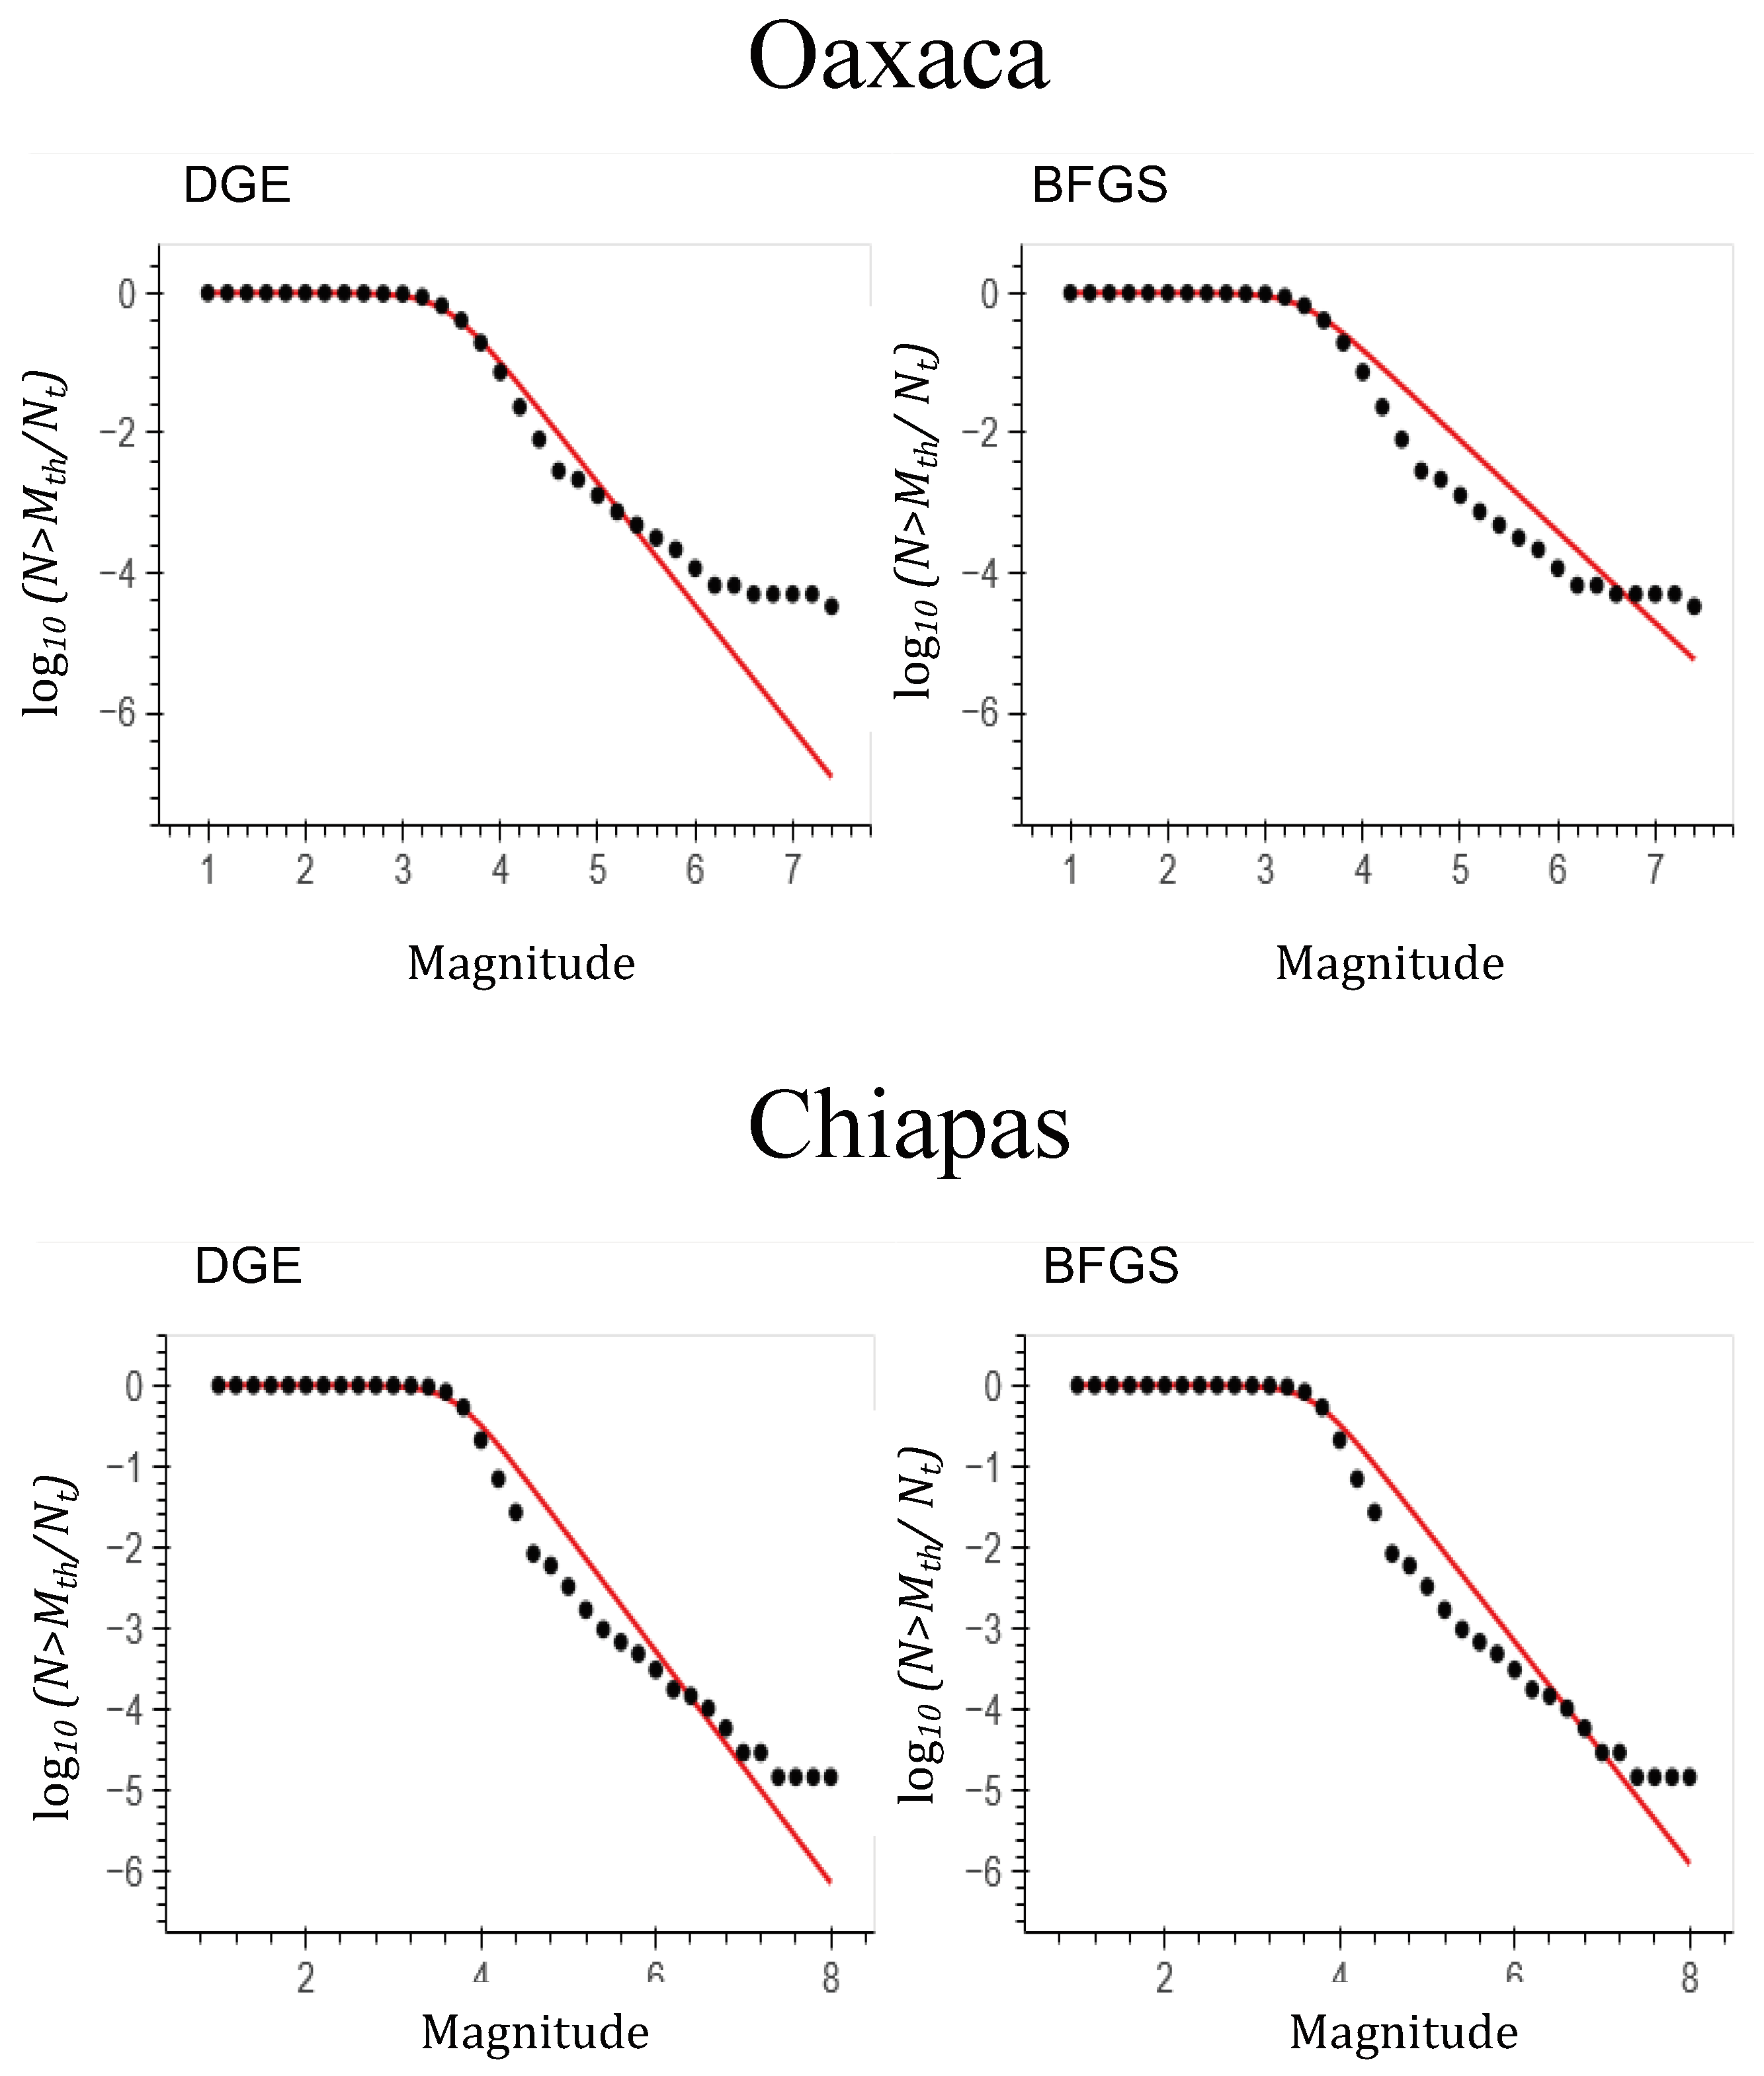
| Oaxaca | 1.59 | 2.70(10) | 1.53 | 2.746(10) | 1.61 | 2.746(10) |
| Chiapas | 1.60 | 2.13(11) | 1.58 | 2.134(11) | 1.59 | 2.134(11) |
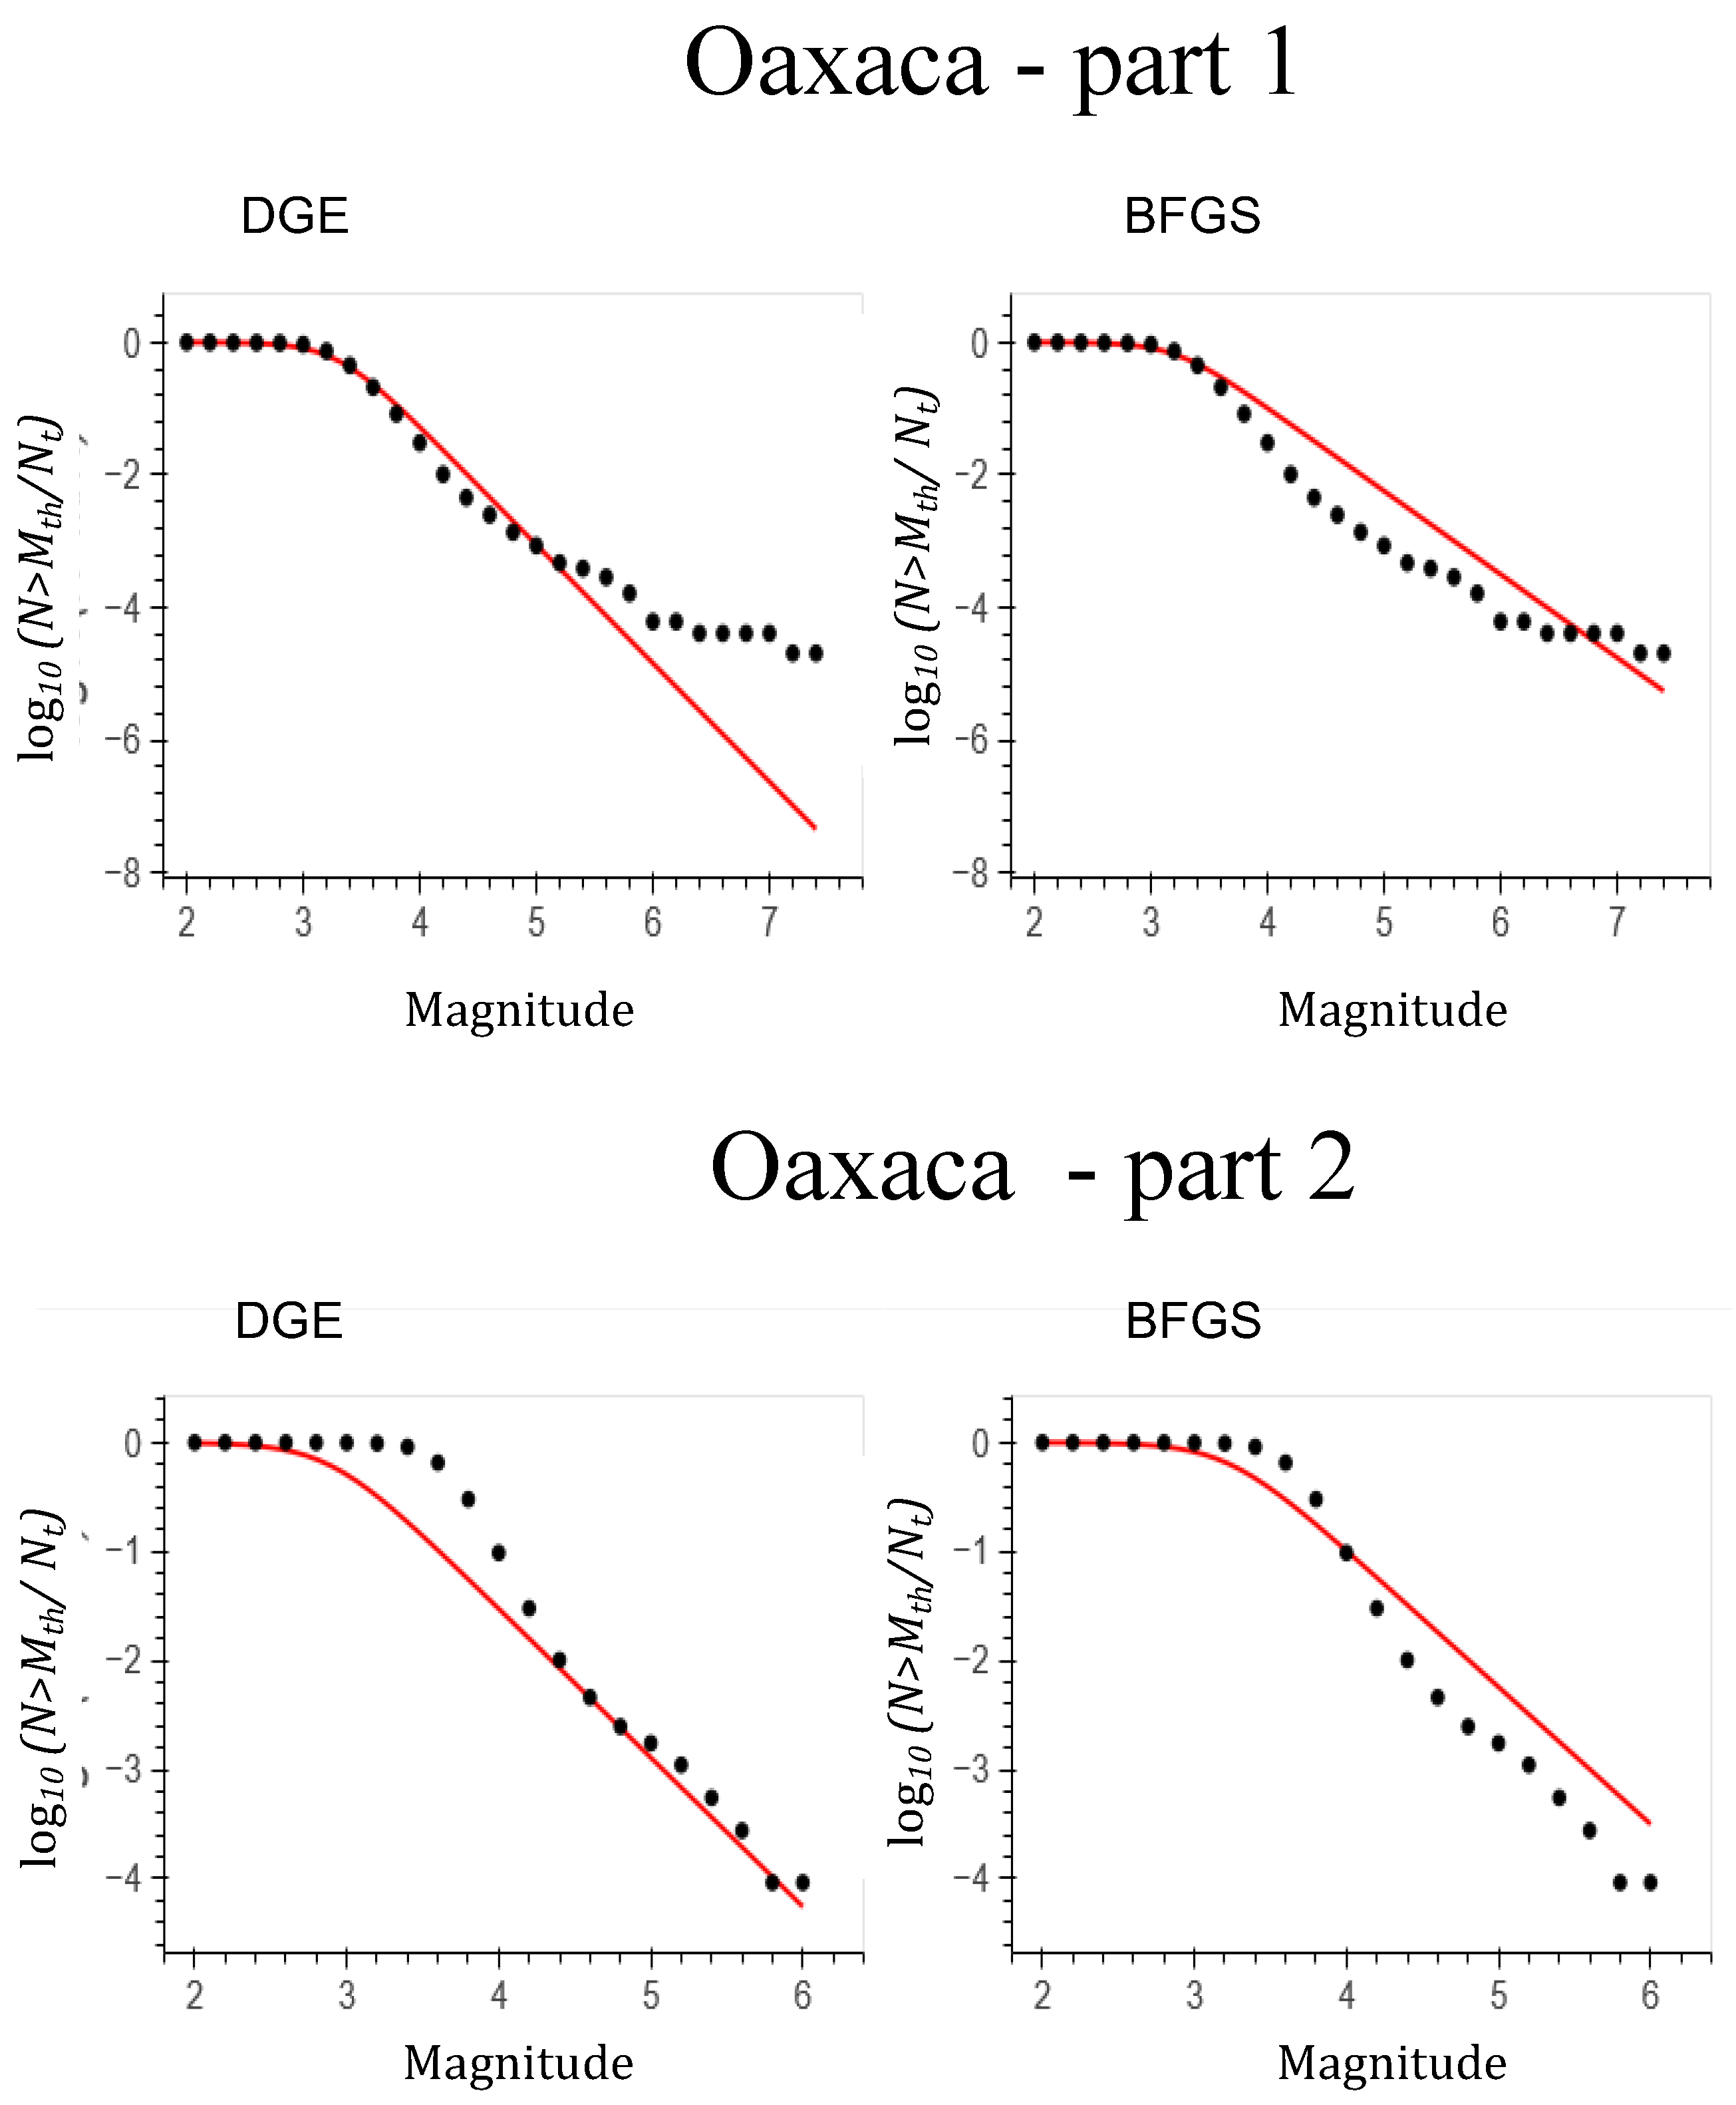
| Oaxaca (part 1) | 1.60 | 8.90(9) | 1.50 | 8.913(9) | 1.61 | 8.913(9) |
| Oaxaca (part 2) | 1.60 | 8.00(9) | 1.59 | 8.000(8) | 1.61 | 8.913(9) |
6. Conclusions
- According to the Gutenberg-Richter (GR) law all six regions have magnitudes of completeness in the range between 3.30 and 3.76, implying that along the Pacific coast of Mexico earthquakes with magnitudes in this range are more frequent.
- The Oaxaca and Chiapas regions share the largest number of earthquakes, while the regions of Jalisco and Baja California have the lowest activity.
- The GR-law parameters a and b are sensitive to whether or not the cumulative distribution is normalized to the number of earthquakes. In particular, the normalized b-parameter is close to unity for all six regions, meaning that they are all seismically active.
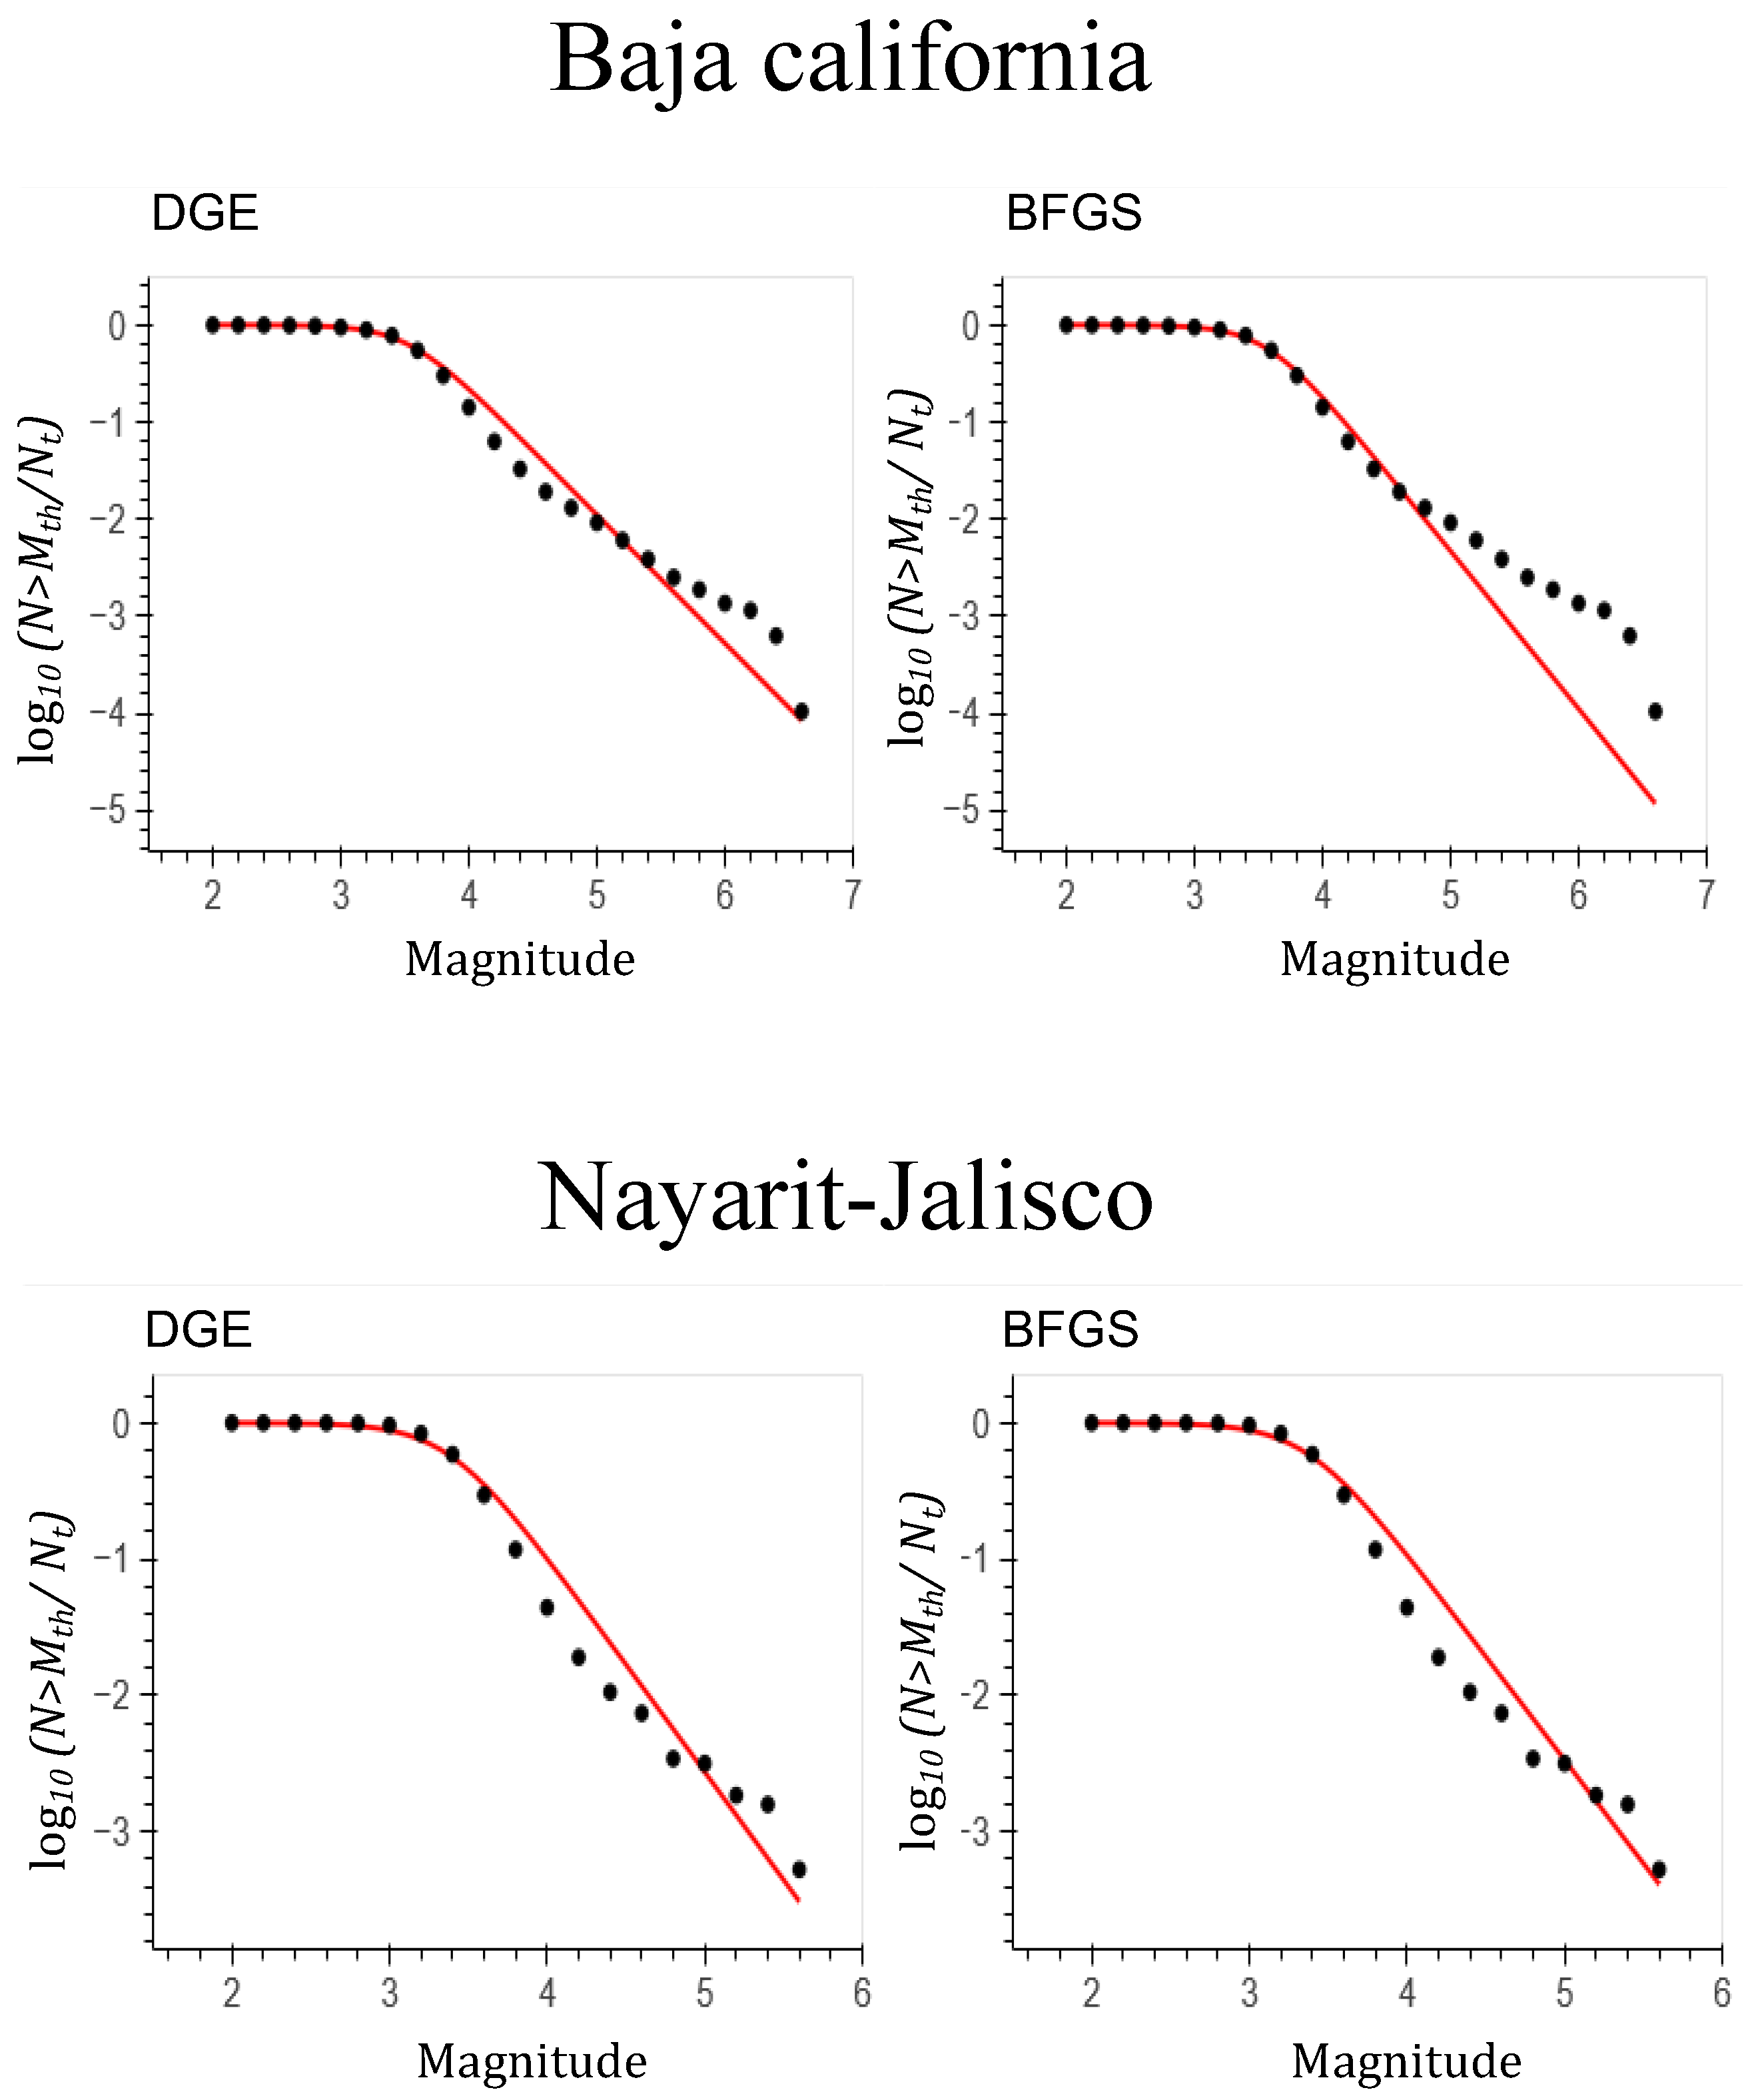
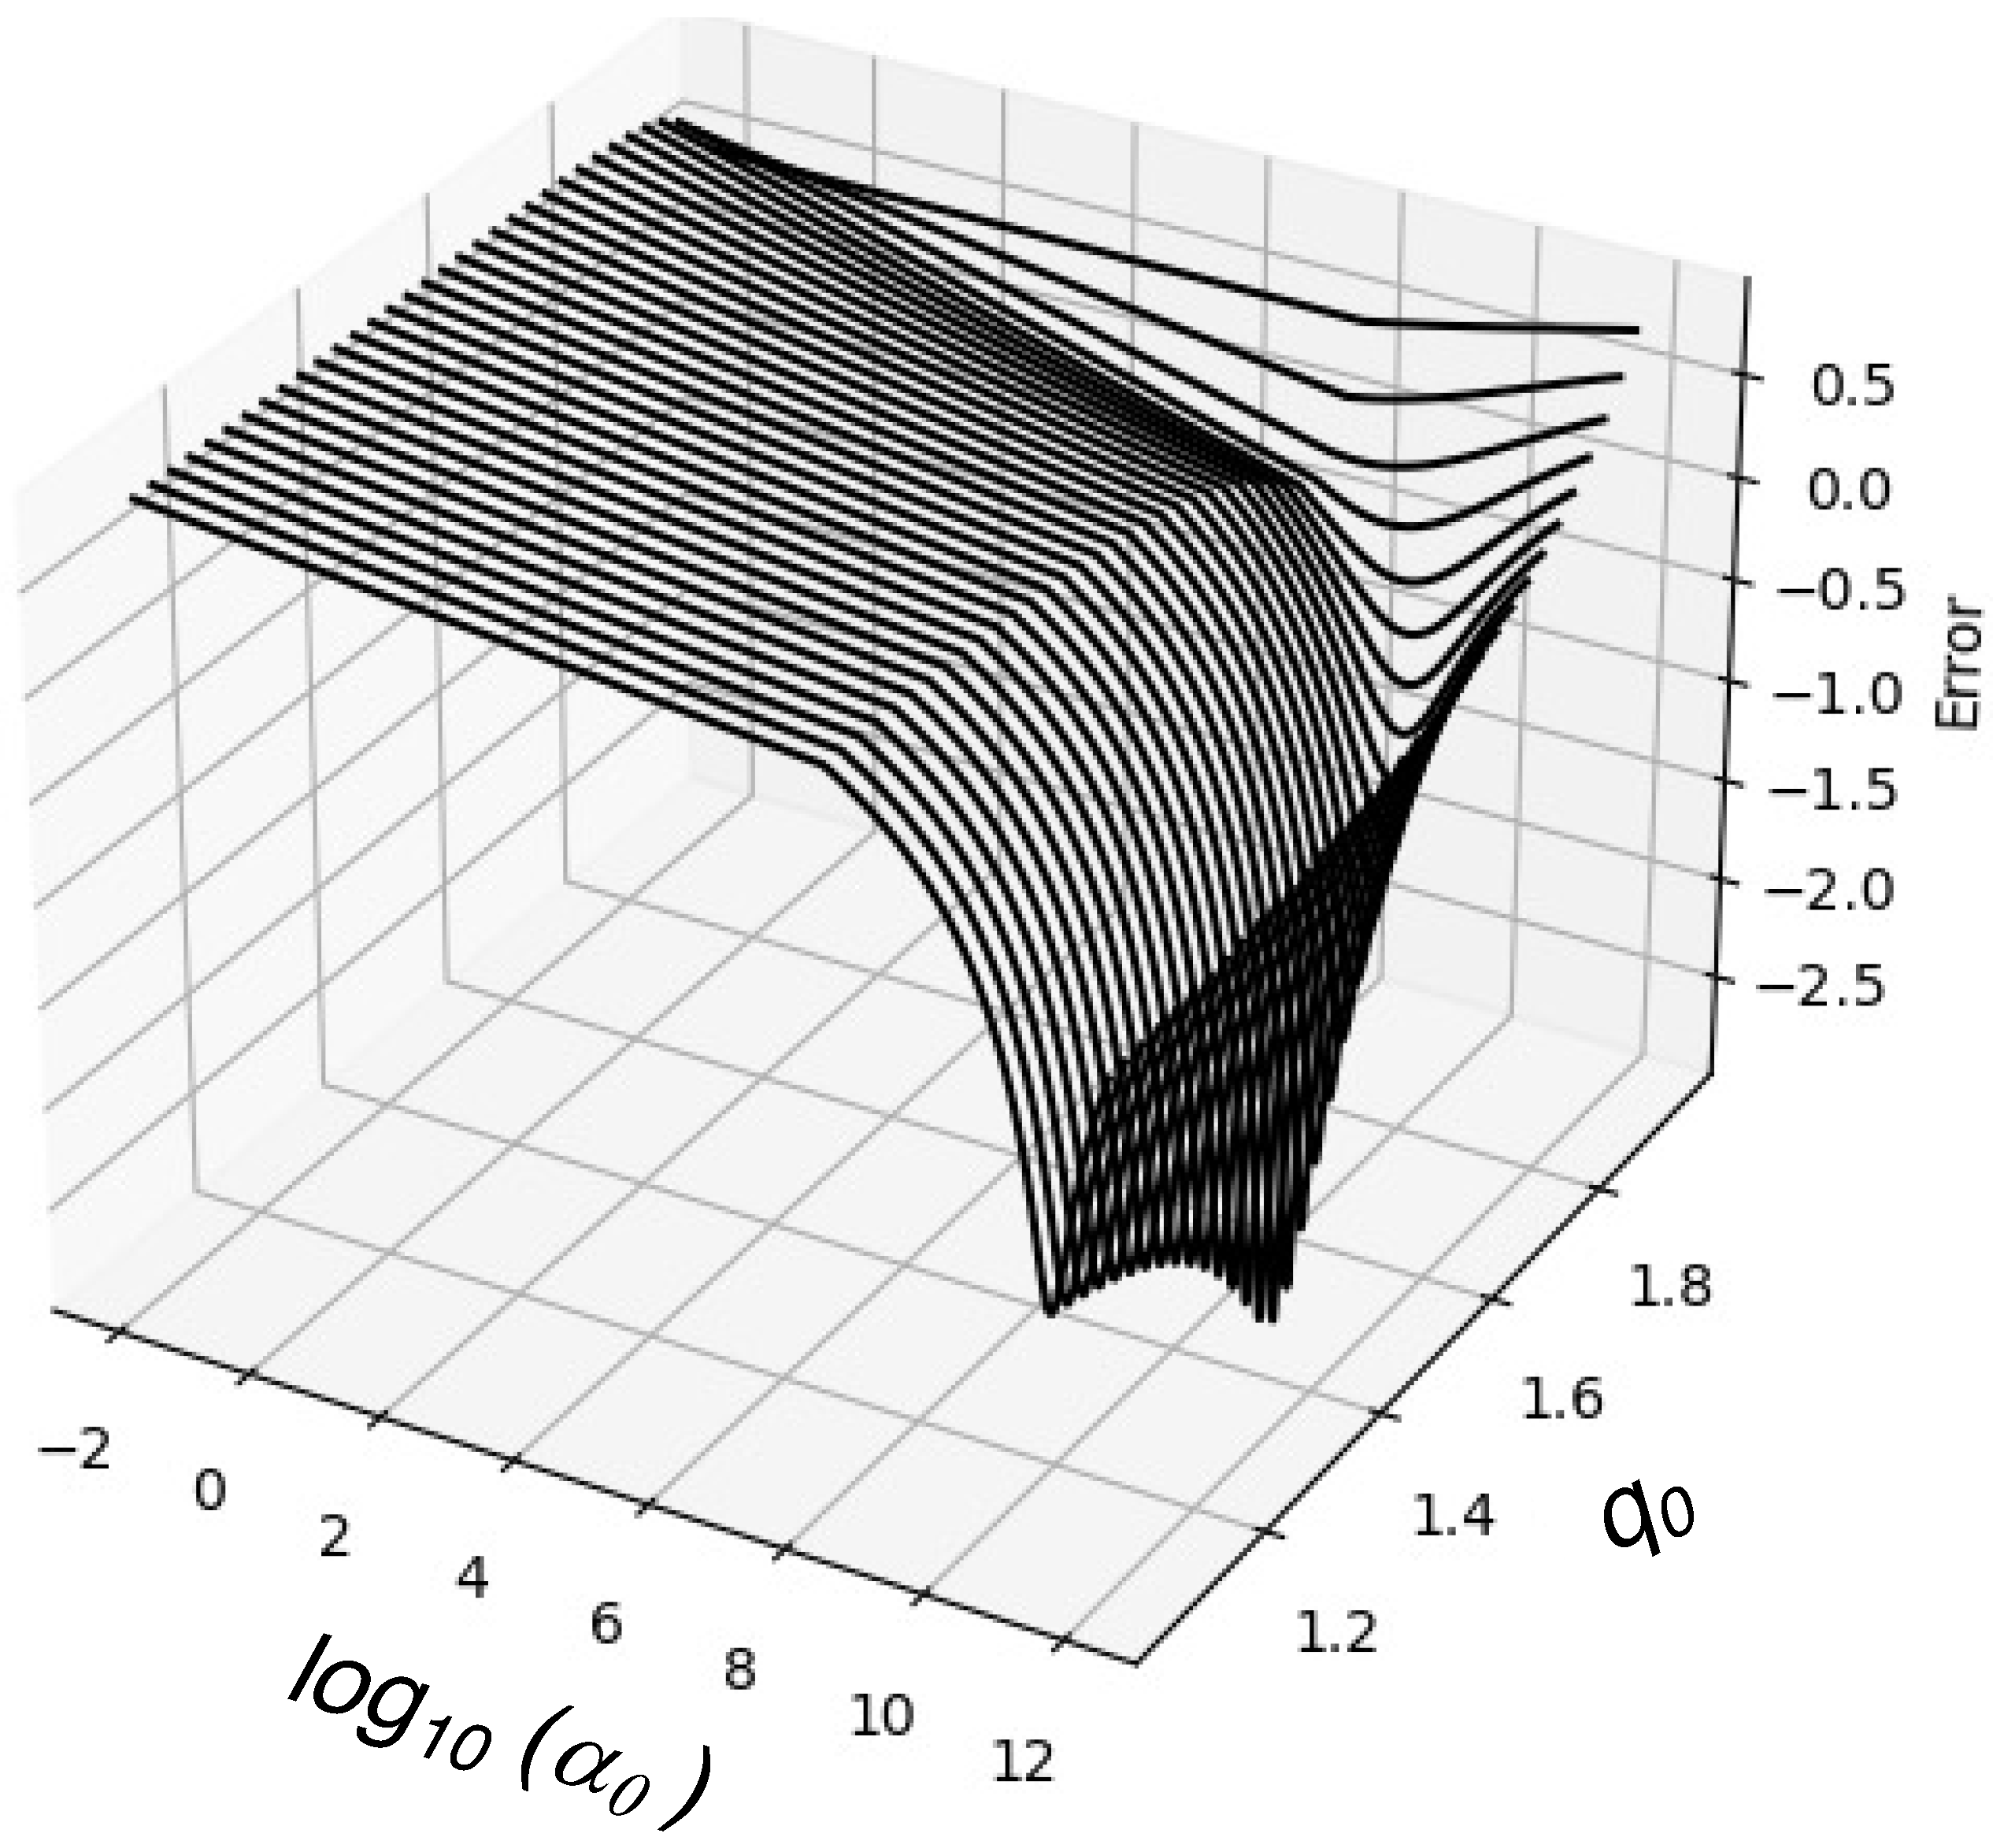
- A non-extensive model fitting with the observed distributions of earthquakes was obtained using two different optimization methods, namely the differential genetic evolution (DGE) and the Broyden-Fletcher-Goldfarb-Shanno (BFGS) algorithm. The entropic index, q, and the parameter, , as derived from both methods show little differences, which for q are less than about 0.05 for all cases studied.
- The -values ranged between (for the Colima-Michoacán region) and a maximum value of (for the Chiapas region).
- The whole range of magnitudes recorded for the Oaxaca region cannot be fitted by a unique curve since for magnitudes close to 5 the slope of the normalized cumulative magnitude distribution changes, implying a clear crossover for this region. When both sub-regions are analyzed separately both optimization methods predict lower values of .
- A value of q close to unity is indicative of short-range correlations, while higher values are indicative of long-term interactions and, therefore of more instability. In terms of the fragment-asperity interaction model, values of are indicative of fault planes in relative motion, implying that more seismic events are expected. All six regions display values of q greater than 1.52, suggesting instability and long-term correlations. In particular, the regions of Baja California, Colima-Michoacán and Chiapas had the largest values of q between 1.58 and 1.60.
- In comparison with a previous similar analysis spanning the period from 1988 to 2010, updated estimates of q were obtained to be from 1.70 to 1.56-1.57 for Jalisco, from 1.68 to 1.59-1.60 for Michoacán, from 1.64 to 1.54-1.55 for Guerrero and from 1.66 to 1.53-1.61 for Oaxaca. The predicted lower values of q are a consequence of the use of new instrumentation, which is more sensitive to the detection of low-magnitude earthquakes.
Author Contributions
Funding
Data Availability Statement
Acknowledgments
Conflicts of Interest
References
- Tsallis, C. What should a statistical mechanics satisfy to reflect nature? Phys. D 2004, 193, 3–34. [Google Scholar] [CrossRef]
- Tsallis, C. Nonadditive entropy and nonextensive statistical mechanics – An overview after 20 years. Braz. J. Phys. 2009, 39, 337–356. [Google Scholar] [CrossRef]
- Tsallis, C.; Tirnakli, U. Nonadditive entropy and nonextensive statistical mechanics – Some central concepts and recent applications. J. Phys. Conf. Ser. 2010, 201, 012001. [Google Scholar] [CrossRef]
- Tsallis, C. Possible generalization of Boltzmann-Gibbs statistics. J. Stat. Phys. 1988, 52, 479–487. [Google Scholar] [CrossRef]
- Abe, S.; Okamoto, Y. Nonextensive Statistical Mechanics and Its Applications; Springer-Verlag: Heidelberg, Germany, 2001. [Google Scholar]
- Tsallis, C. Introduction to Nonextensive Statistical Mechanics: Approaching a Complex World, Springer: Berlin, Germany, 2009.
- Tsallis, C. The nonadditive entropy Sq and its applications in physics and elsewhere: Some remarks. Entropy 2011, 13, 1765–1804. [Google Scholar] [CrossRef]
- Abe, S.; Suzuki, N. Law for the distance between successive earthquakes. J. Geophys. Res. 2003, 108, 2113. [Google Scholar] [CrossRef]
- Papadakis, G.; Vallianatos, F.; Sammonds, P. Evidence of nonextensive statistical physics behavior of the Hellenic subduction zone sismicity. Tectonophys. 2013, 608, 1037–1048. [Google Scholar] [CrossRef]
- Vallianatos, F.; Sammonds, P. Evidence of nonextensive statistical physics of the lithospheric instability approaching the 2004 Sumatran-Andaman and 2011 Honshu mega-earthquakes. Tectonophys. 2004, 590, 52–58. [Google Scholar] [CrossRef]
- Sotolongo-Costa, O.; Posadas, A. Fragment-asperity interaction model for earthquakes. Phys. Rev. Lett. 2004, 13, 1267–1280. [Google Scholar] [CrossRef]
- Silva, R.; França, G. S.; Vilar, C. S.; Alcaniz, J. S. Nonextensive models for earthquakes. Phys. Rev. E 2006, 73, 026102. [Google Scholar] [CrossRef]
- Lay, T.; Wallace, T. C. Modern Global Seismology; Academic Press: New York, USA, 1995. [Google Scholar]
- Telesca, L. Maximum likelihood estimation of the nonextensive parameters of the earthquake cumulative magnitude deistribution. Bull. Seismol. Soc. Am. 2012, 102, 886–891. [Google Scholar] [CrossRef]
- Darooneh, A. M.; Mehri, A. A nonextensive modification of the Gutenberg-Richter law: q-stretched exponential form. Phys. A 2010, 389, 509–514. [Google Scholar] [CrossRef]
- Telesca, L. Analysis of Italian seismicity by using a nonextensive approach. Tectonophys. 2010, 494, 155–162. [Google Scholar] [CrossRef]
- Telesca, L. Nonextensive analysis of seismic sequences. Phys. A 2010, 389, 1911–1914. [Google Scholar] [CrossRef]
- Matcharashvili, T.; Chelidze, T.; Javakhishvili, Z.; Jorjiashvili, N.; Fra Paleo, U. Non-extensive statistical analysis of seismicity in the area of Javakheti, Georgia. Comput. Geosci. 2011, 37, 1627–1632. [Google Scholar] [CrossRef]
- Valverde-Esparza, S. M.; Ramírez-Rojas, A.; Flores-Márquez, E. L.; Telesca, L. Non-extensivity analysis of seismicity within four subduction regions in Mexico. Acta Geophys. 2012, 60, 833–845. [Google Scholar] [CrossRef]
- Antonopoulos, C. G.; Michas, G.; Vallianatos, F. Evidence of q-exponential statistics in Greek seismicity. Phys. A 2014, 409, 71–77. [Google Scholar] [CrossRef]
- Papadakis, G.; Vallianatos, F.; Sammonds, P. A nonextensive statistical physics analysis of the 1995 Kobe, Japan earthquake. Pure Appl. Geophys. 2015, 172, 1923–1931. [Google Scholar] [CrossRef]
- Papadakis, G.; Vallianatos, F.; Sammonds, P. Non-extensive statistical physics applied to heat flow and the earthquake frequency-magnitude distribution in Greece. Phys. A 2016, 456, 135–144. [Google Scholar] [CrossRef]
- Papadakis, G.; Vallianatos, F. Non-extensive statistical physics analysis of earthquake magnitude in North Aegean Trough, Greece. Acta Geophys. 2017, 65, 555–563. [Google Scholar] [CrossRef]
- Ohtake, M.; Matumoto, T.; Latham, G. V. Evaluation of the forecast of the 1978 Oaxaca, Southern Mexico earthquake based on a precursory seismic quiescence. In Earthquake Prediction: An International Review; Simpson, D. W., Richards, P. G., Eds.; Publications: Washington, USA, 1981; pp. 53–61. [Google Scholar]
- Singh, S. K.; Rodriguez, M.; Esteva, L. Statistics of small earthquakes and frequency of occurrence of large earthquakes along the Mexican subduction zone. Bull. Seismol. Soc. Am. 1983, 73, 1779–1796. [Google Scholar]
- Singh, S. K.; Ponce, L.; Nishenko, S. P. The great Jalisco, Mexico, earthquakes of 1932: Subduction of the Rivera plate. Bull. Seismol. Soc. Am. 1985, 75, 1301–1313. [Google Scholar] [CrossRef]
- Kostoglodov, V.; Ponce, L. Relationship between subduction and seismicity in the Mexican part of the Middle America Trench. J. Geophys. Res. 1994, 99, 729–742. [Google Scholar] [CrossRef]
- Pardo, M.; Suarez, G. Shape of the subducted Rivera and Cocos plates in southern Mexico: Seismic and tectonic implications. J. Geophys. Res. 1995, 100, 12357–12373. [Google Scholar] [CrossRef]
- Zúñiga, F. R.; Wiemer, S. Seismic patterns: are they always related to natural causes? Pure Appl. Geophys. 1999, 155, 713–726. [Google Scholar] [CrossRef]
- Iglesias, A.; Singh, S. K.; Lowry, A. R.; Santoyo, M.; Kostoglodov, V.; Larson, K. M.; Franco-Sánchez, S. I. The silent earthquake of 2002 in the Guerrero seismic gap, Mexico (Mw=7.6): Inversion of slip on the plate interface and some implications. Geof. Int. 2004, 43, 309–317. [Google Scholar] [CrossRef]
- Song, T.-R. A.; Helmberger, D. V.; Brudzinski, M. R.; Clayton, R. W.; Davis, P.; Pérez-Campos, X.; Singh, S. K. Subducting slab ultra-slow velocity layer coincident with silent earthquakes in southern Mexico. Science 2009, 324, 502–506. [Google Scholar] [CrossRef] [PubMed]
- Ramírez-Herrera, M. T.; Kostoglodov, V.; Urrutia-Fucugauchi, J. Overview of recent coastal tectonic deformation in the Mexican subduction zone. Pure Appl. Geophys. 2011, 168, 1415–1433. [Google Scholar] [CrossRef]
- Ramírez-Rojas, A.; Flores-Márquez, E. Order parameter analysis of seismicity of the Mexican Pacific coast. Phys. A 2013, 392, 2507–2512. [Google Scholar] [CrossRef]
- Ramírez-Rojas, A.; Flores-Márquez, E. L.; Sarlis, N. V.; Varotsos, P. A. The complexity measures associated with the fluctuations of the entropy in natural time before the deadly Mexico M8.2 earthquake on 7 September 2017. Entropy 2018, 20, 477. [Google Scholar] [CrossRef]
- Sarlis, N. V.; Skordas, E. S.; Varotsos, P. A.; Ramírez-Rojas, A.; Flores-Márquez, E. L. Natural time analysis: On the deadly Mexico M8.2 earthquake on 7 September 2017. Phys. A 2018, 506, 625–634. [Google Scholar] [CrossRef]
- Abe, S. Geometry of escort distributions. Phys. Rev. E 2003, 68, 031101. [Google Scholar] [CrossRef]
- Kanamori, H.; Stewart, G. S. Seismological aspects of the Guatemala earthquake of February 4, 1976. J. Geophys. Res. 1978, 83, 3427–3434. [Google Scholar] [CrossRef]
- Lewis, J. L.; Day, S. M.; Magistrale, H.; Castro, R. R.; Astiz, L.; Rebollar, C.; Eakins, J.; Vernon, F. L.; Brune, J, N. Crustal thickness of the peninsular ranges and gulf extensional province in the Californias. J. Geophys. Res. 2001, 106, 13599–13611. [Google Scholar] [CrossRef]
- Hearn, T.M.; Clayton, R. W. Lateral velocity variations in southern California. I. Results for the upper crust from Pg waves. Bull. Seismol. Soc. Am. 1986, 76, 495–509. [Google Scholar] [CrossRef]
- Humphreys, E. D.; Clayton, R. W. Tomographic image of the southern California mantle. J. Geophys. Res. 1990, 95, 19725–19746. [Google Scholar] [CrossRef]
- Márquez-Azúa, B.; DeMets, C. Crustal velocity field of Mexico from continuous GPS measurements, 1993 to June 2001: Implications for the neotectonics of Mexico. J. Geophys. Res. 2003, 100, 2450. [Google Scholar] [CrossRef]
- Clayton, R. W.; Heaton, T. H.; Chandy, M.; Krause, R. A.; Kohler, M.; Bunn, J.; Guy, R.; Olson, M.; Faulkner, M.; Cheng, M.; Strand, L.; Chandy, R.; Obenshain, D.; Liu, A.; Aivazis, M. Community seismic network. Annals Geophys. 2011, 54, 738–747. [Google Scholar]
- Kazachkina, E.; Kostoglodov, V.; Cotte, N.; Walpersdorf, A.; Ramírez-Herrera, M. T.; Gaidzik, K.; Husker, A.; Santiago, J. A. Active 650-km long fault system and Xolapa sliver in Southern Mexico. Front. Earth Sci. 2020, 8, 155. [Google Scholar] [CrossRef]
- Schellart, W. P. Control of subduction zone age and size on flat slab subduction. Front. Earth Sci. 2020, 8, 26. [Google Scholar] [CrossRef]
- Clayton, R. W.; Trampert, J.; Rebollar, C.; Ritsema, J.; Persaud, P.; Paulssen, H.; Pérez-Campos, X.; van Wettum, A.; Pérez-Vertti, A.; DiLuccio, F. The NARS-Baja seismic array in the Gulf of California rift zone. MARGINS Newslett. 2004, 13, 1–8. [Google Scholar]
- Suhardja, S. K.; Grand, S. P.; Wilson, D.; Guzman-Speziale, M.; Gomez-Gonzalez, J. M.; Dominguez-Reyes, T.; Ni, J. Crust and subduction zone structure of Southwestern Mexico. J. Geophys. Res. 2003, 120, 1020–1035. [Google Scholar] [CrossRef]
- Manea, V. C.; Manea, M.; Chen, M. , van Hunen, J.; Konrad-Schmolke, M. Editorial: Unusual subsduction processes Font. Earth Sci. 2020, 8, 607697. [Google Scholar]
- Carciumaru, D.; Ortega, R.; Castellanos, J. C.; Huesca-Pérez, E. Crustal characteristics in the subduction zone of Mexico: Implication of the tectonostratigraphic terranes on slab tearing. Seism. Res. Lett. 2020, 91, 1781–1793. [Google Scholar] [CrossRef]
- Calò, M. Tears, windows, and signature of transform margins on slabs. Images of the Cocos plate fragmentation beneath the Tehuantepec isthmus (Mexioc) using Enhanced Seismic Models. Earth Planet. Sci. Lett. 2021, 560, 116788. [Google Scholar] [CrossRef]
- de Ignacio, C.; Casteiñeiras, P.; Márquez, A.; Oyarzun, R.; Lillo, J.; López, I. El Chichn Volcano (Chiapas Volcanic Belt, Mexico) transitional Calc-Alkaline to Adakitic-like magmatism: Petrologic and tectonic implications. Int. Geol. Rev. 2003, 45, 1020–1028. [Google Scholar] [CrossRef]
- Manea, M.; Manea V., C. On the origin of the El Chichón volcano and subduction of Tehuantepec Ridge: A geodynamical perspective. J.Volcanol. Geotherm. Res. 2008, 175, 459–471. [Google Scholar] [CrossRef]
- Manea, M.; Manea, V. C.; Ferrari, L.; Kostoglodov, V. Tectonic evolution of the Tehuantepec Ridge. Earth and Planetary Science Letters 2005, 238, 64–77. [Google Scholar] [CrossRef]
- Di Luccio, F.; Persaud, P.; Clayton, R. W. Seismic structure beneath the Gulf of California: a contribution from group velocity measurements. Geophysical Journal International 2014, 199, 1861–1877. [Google Scholar] [CrossRef]
- Goldberg, D. E. Genetic Algorithms in Search, Optimization and Machine Learning. Kluwer Academic Publishers: Boston, 1989. [Google Scholar]
- Fletcher, R. Practical Methods of Optimization, John Wiley & Sons: New York, 1987. [Google Scholar]
Disclaimer/Publisher’s Note: The statements, opinions and data contained in all publications are solely those of the individual author(s) and contributor(s) and not of MDPI and/or the editor(s). MDPI and/or the editor(s) disclaim responsibility for any injury to people or property resulting from any ideas, methods, instructions or products referred to in the content. |
© 2024 by the authors. Licensee MDPI, Basel, Switzerland. This article is an open access article distributed under the terms and conditions of the Creative Commons Attribution (CC BY) license (http://creativecommons.org/licenses/by/4.0/).


