Submitted:
01 May 2024
Posted:
02 May 2024
You are already at the latest version
Abstract
Keywords:
1. Introduction
2. Materials and Methods
2.1. Participants
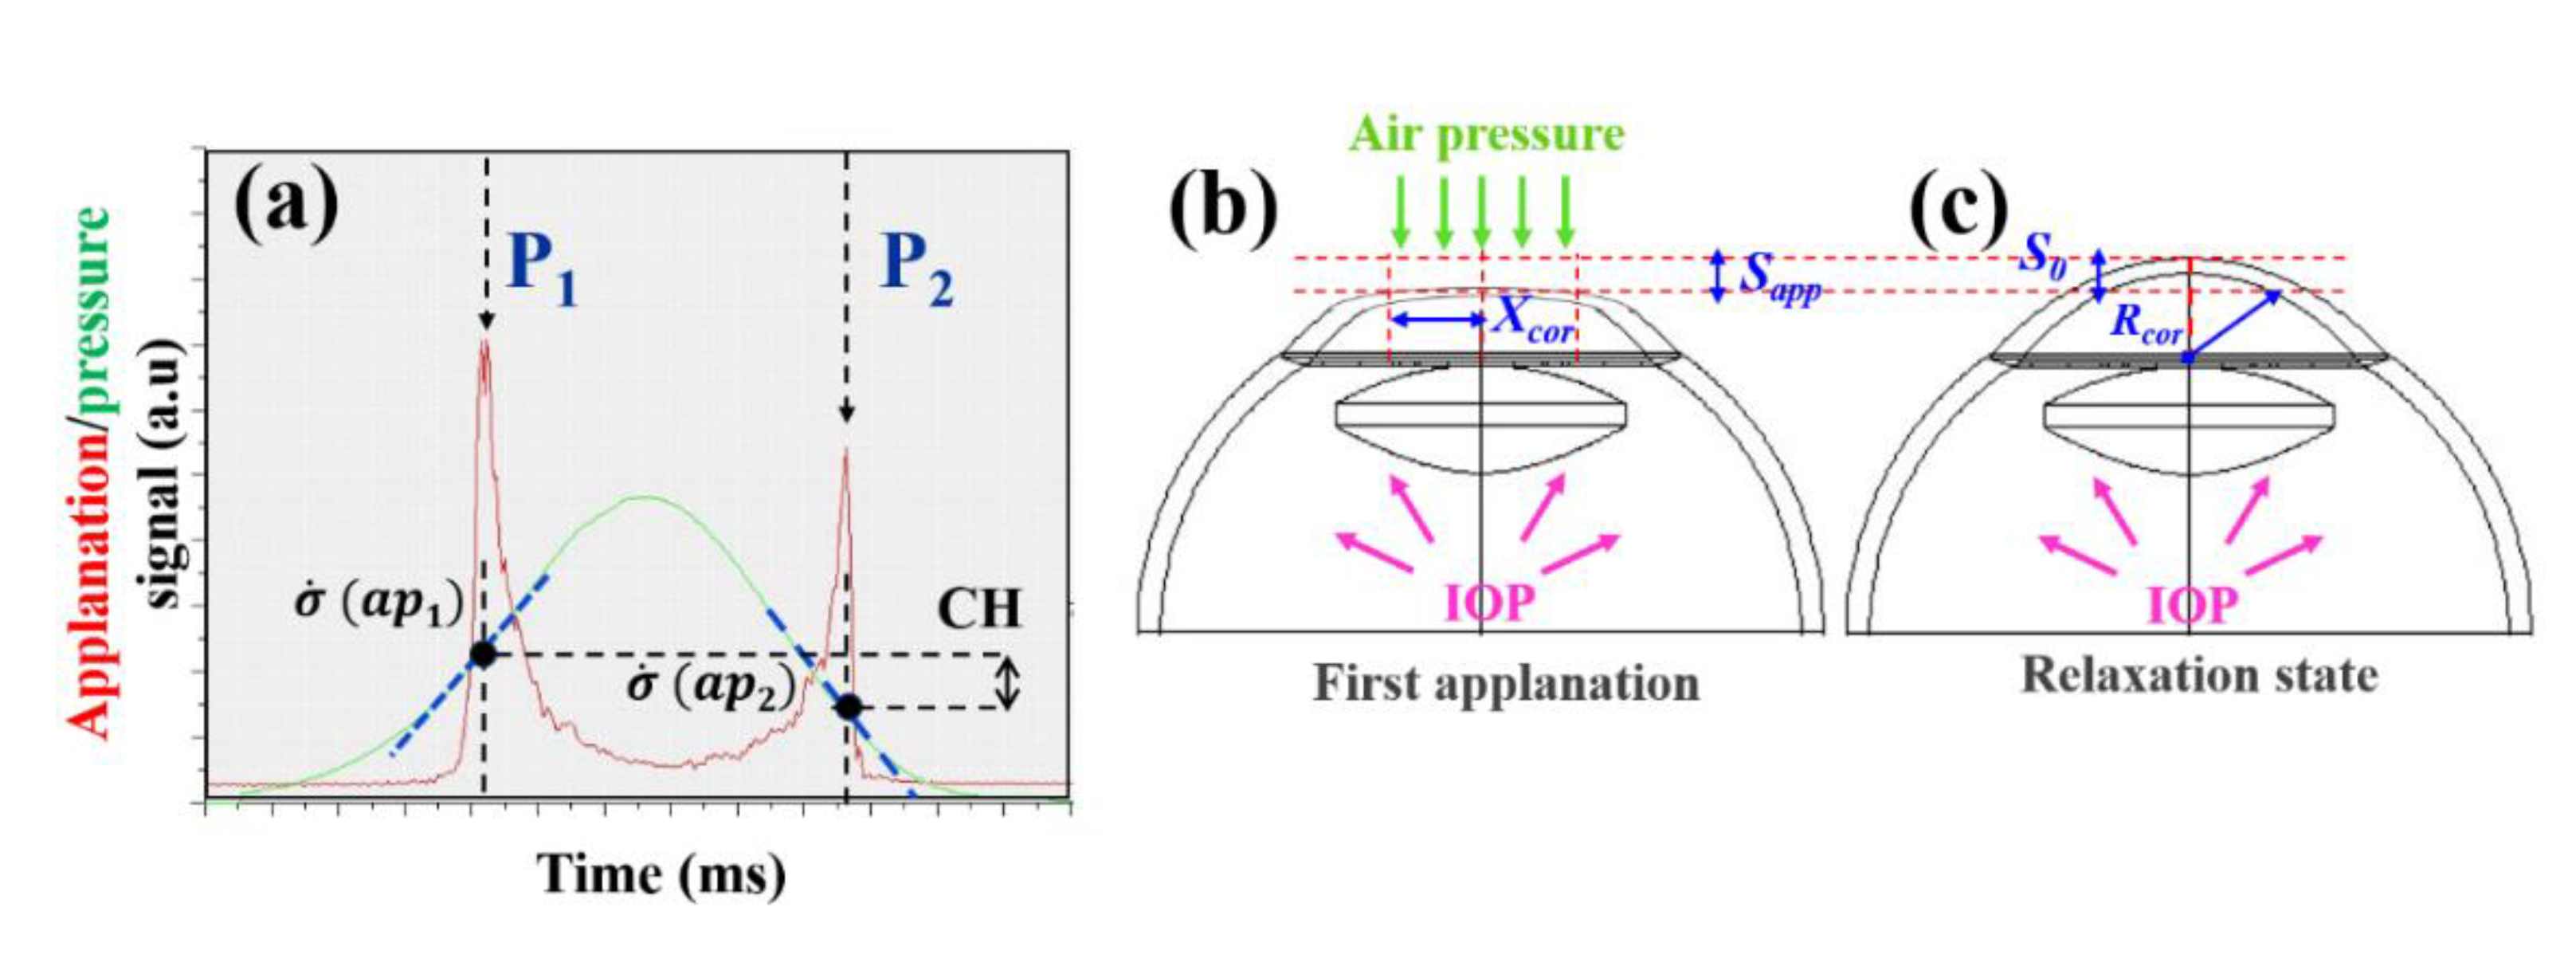
2.2. In Vivo Corneal Assessment: Geometrical, Optical and Biomechanical Corneal Parameters
2.3. The Three-Elements Standard Linear Solid Model
2.3. Experimental Calculation of Elastic and Time-Dependent Biomechanical Properties
3. Results
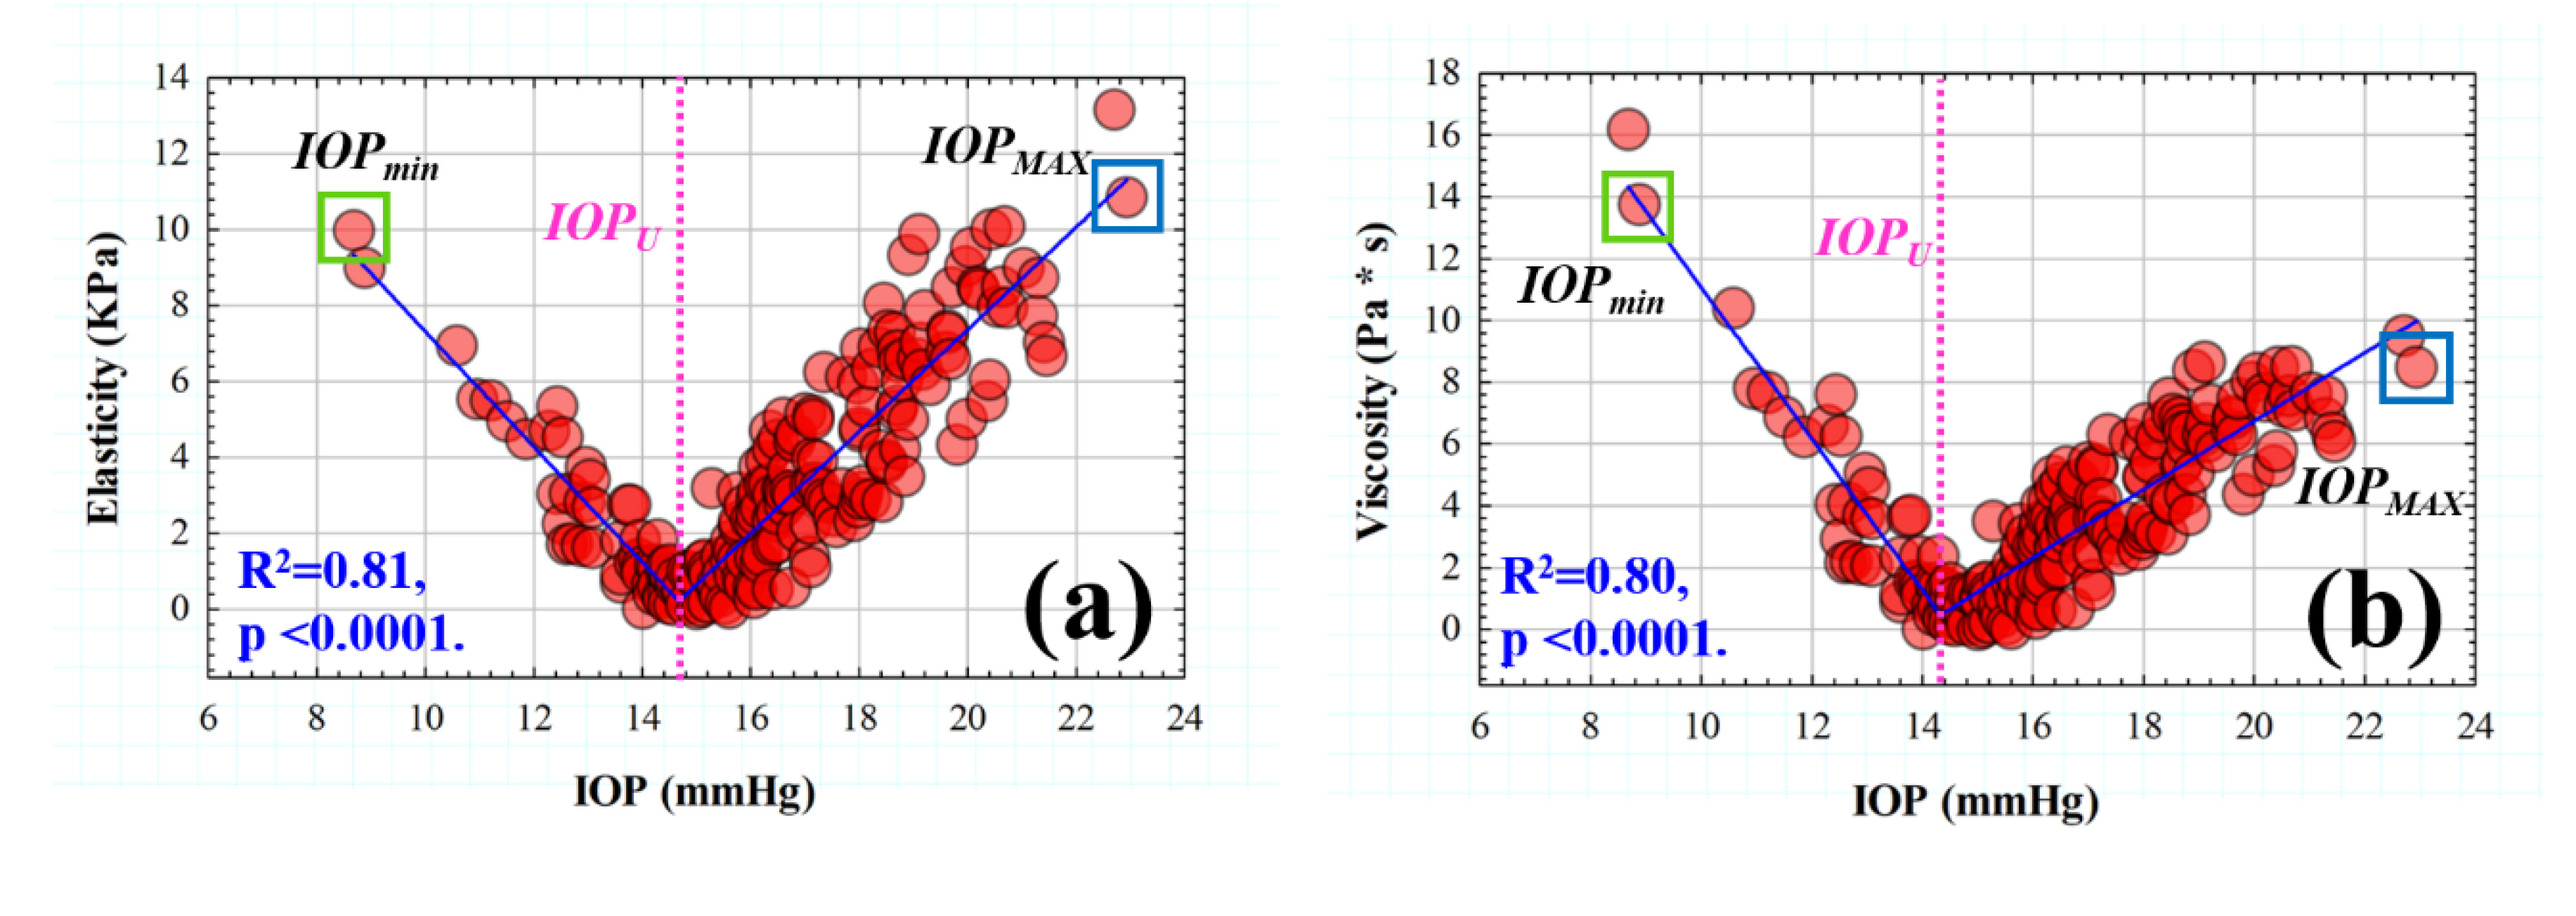
3.1. Efect of IOP on Elastic, Viscoelastic and Viscous Properties of the Cornea
| IOPcc (mmHg) | CCT (μm) |
Rcor (mm) |
CH (mmHg) |
E (KPa) |
Ƞ (Pa *s) |
Τ (ms) |
|---|---|---|---|---|---|---|
| 16.51 ±2.32 | 555.75±29.49 | 7.89±0.30 | 9.78±1.16 | 3.44±2.67 | 3.57±2.39 | 1.12±0.13 |
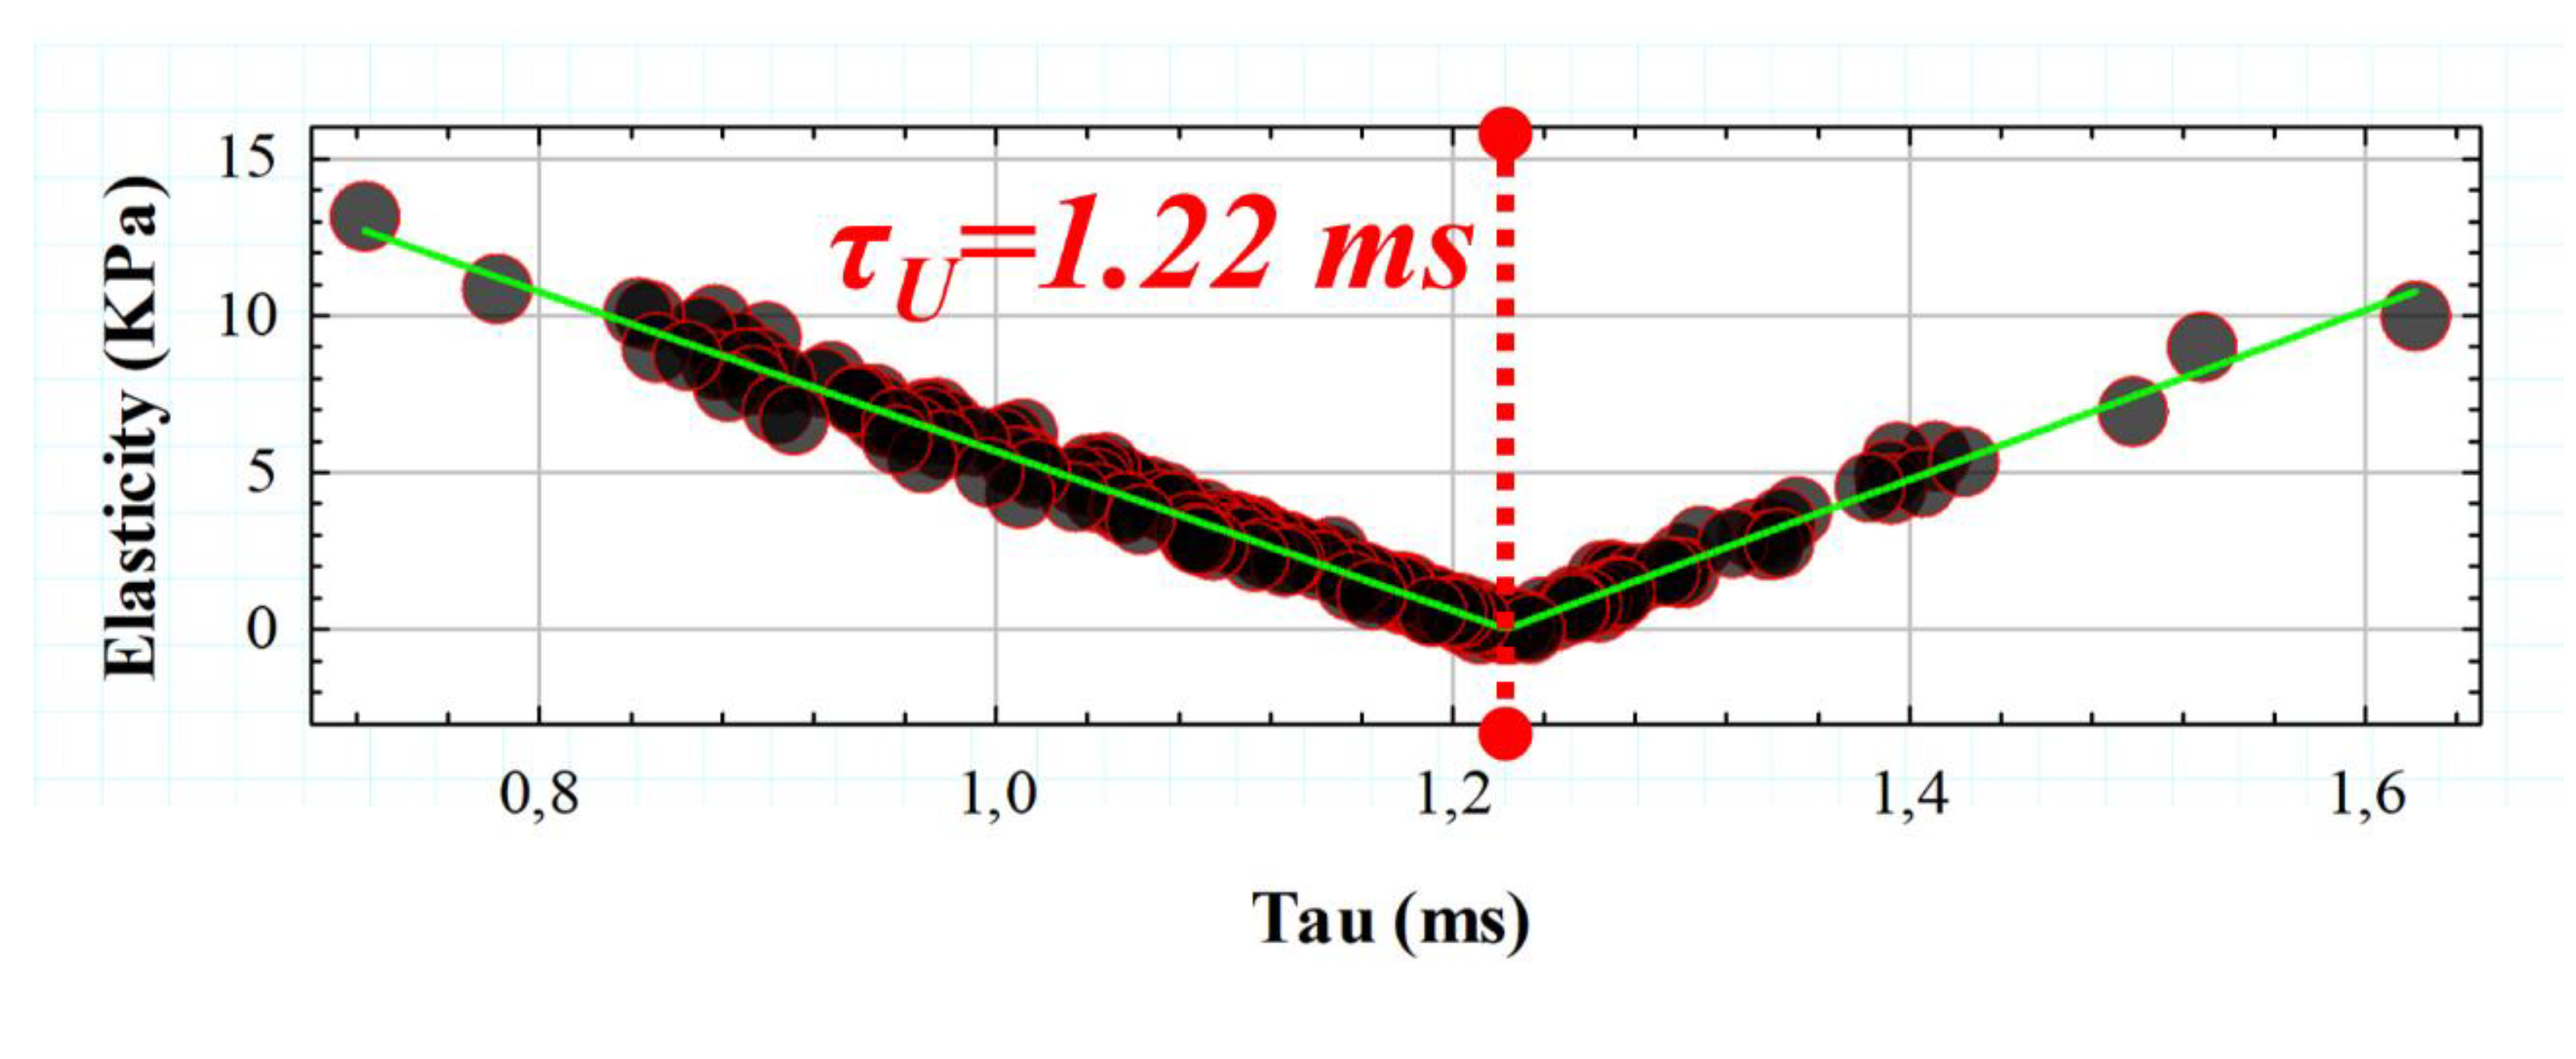
3.2. Retardation Time as a Biomechanical Behavior Threshold: Role of Elasticity and Viscosity on Corneal Viscoelasticity
3.3. Influence of Elasticity and Time-Dependent Parameters on Corneal Optical Properties
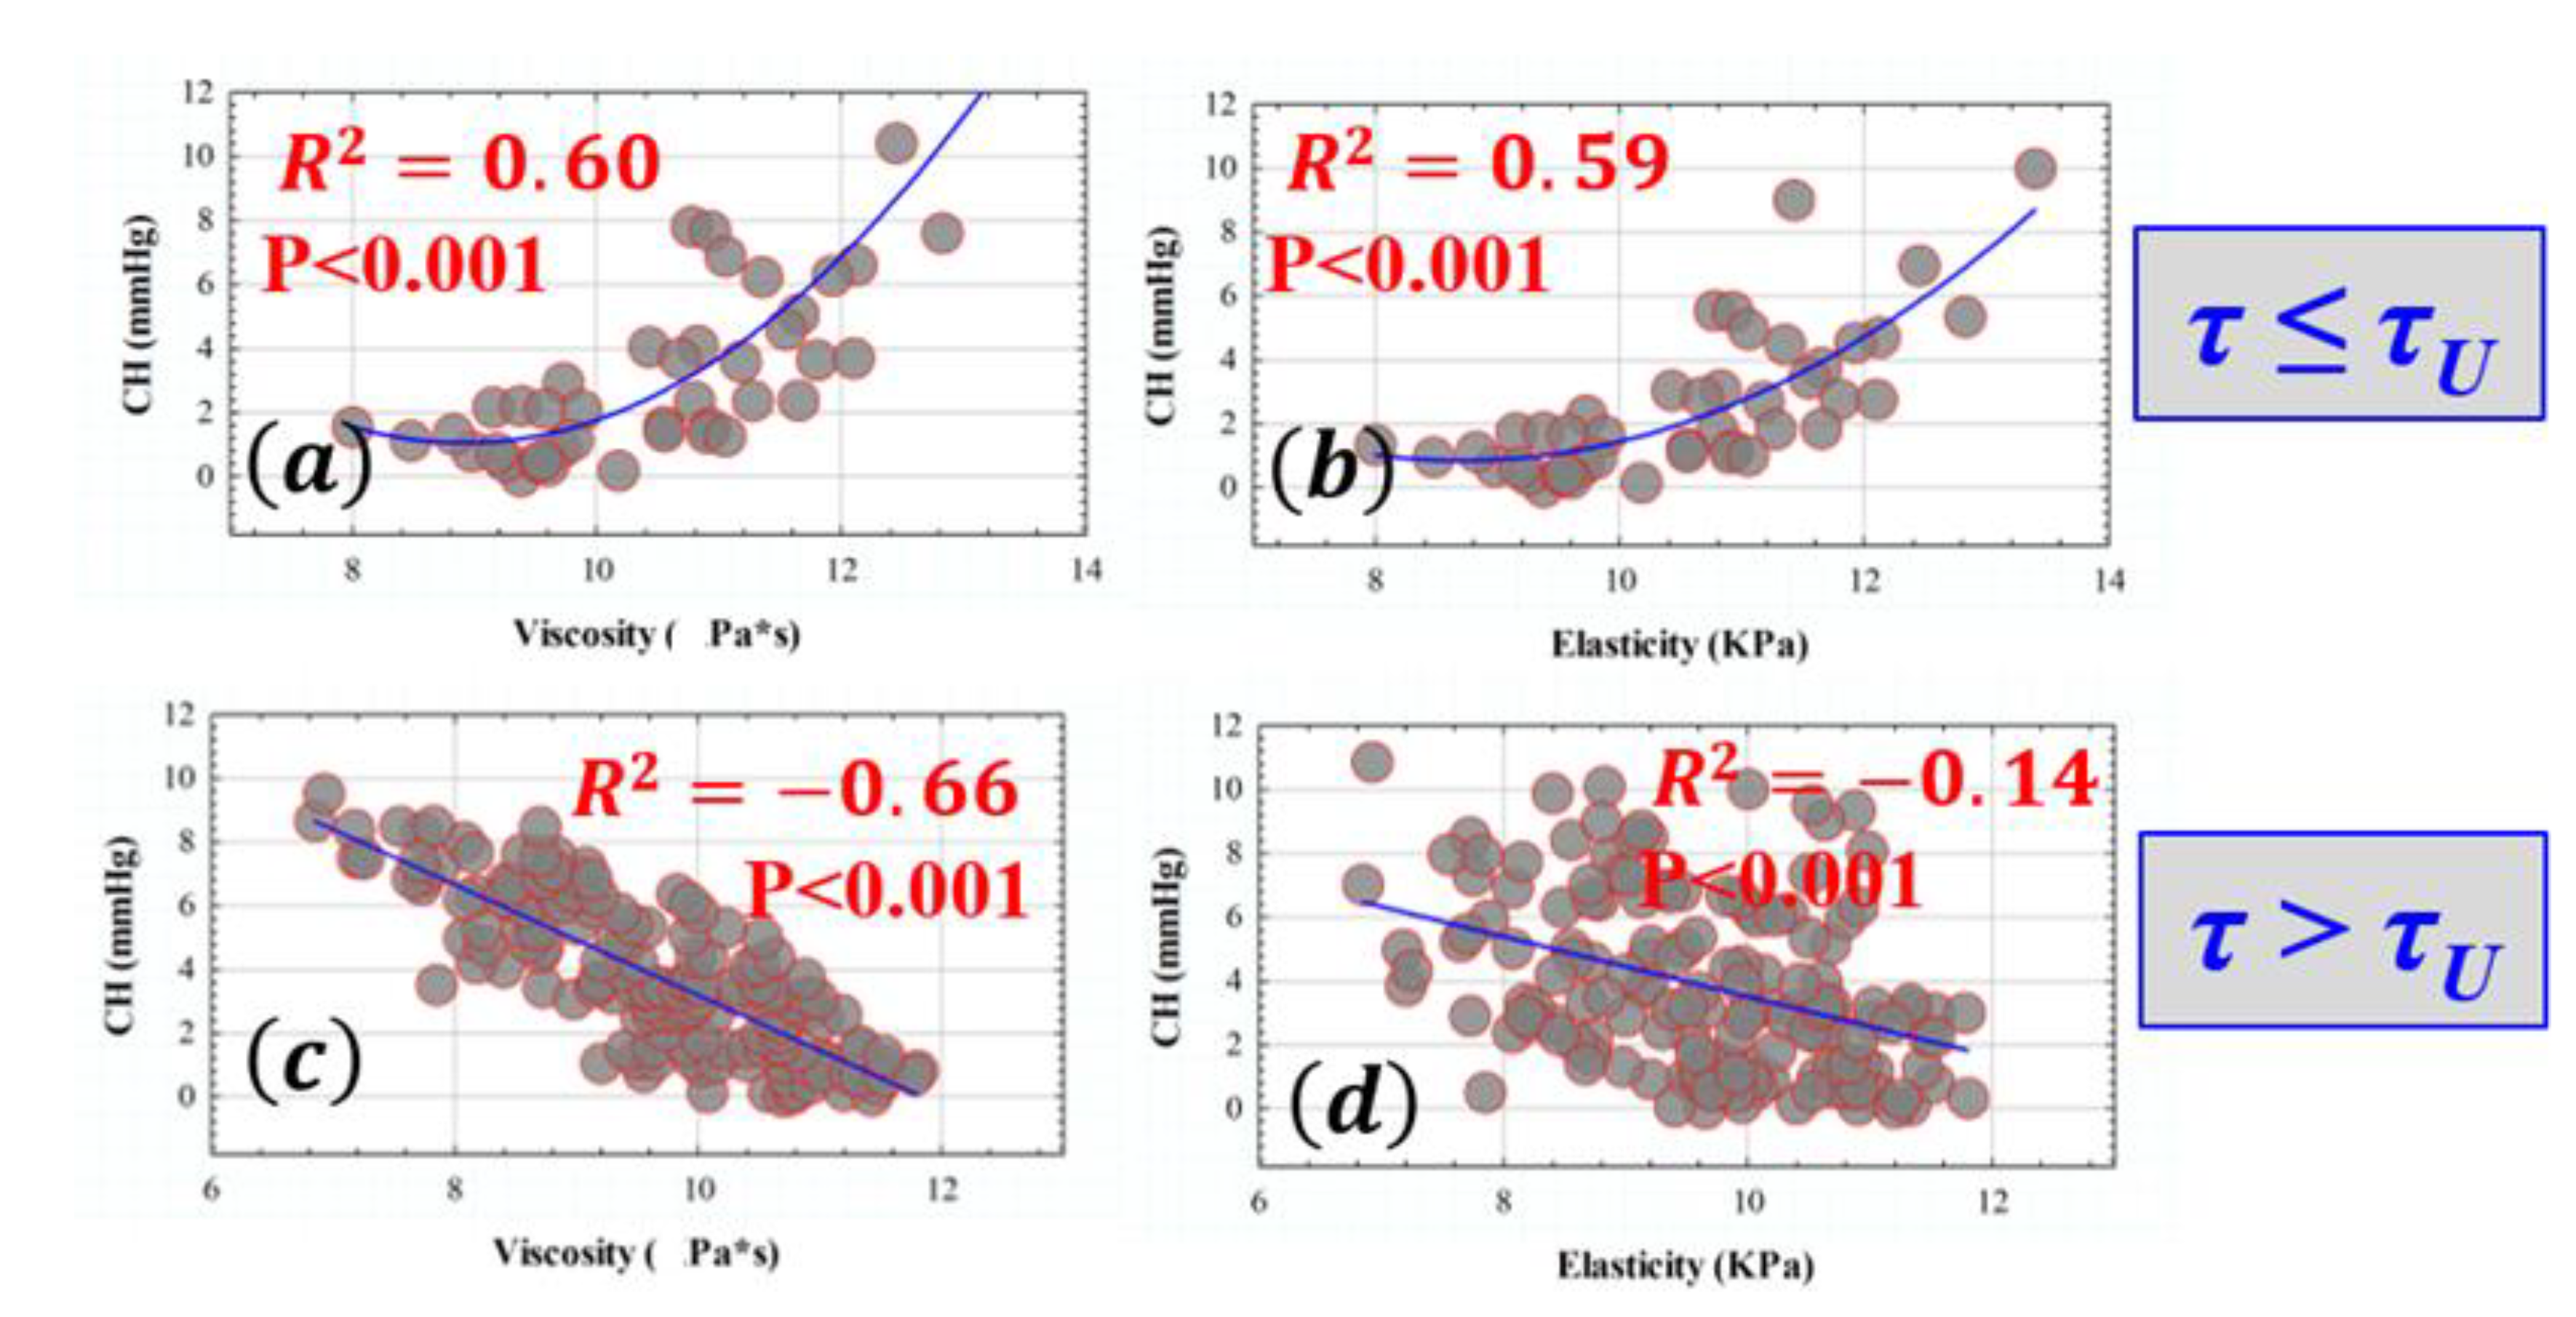
3.4. Creep-Relaxation Response of the Human Cornea as a Function of Elasticity and Viscosity
4. Discussion and Conclusions
Author Contributions
Funding
Institutional Review Board Statement
Informed Consent Statement
Data Availability Statement
Conflicts of Interest
References
- Meek, K.M. Corneal collagen – its role in maintaining corneal shape and transparency. Biophys Rev 2009, 1, 83–93. [Google Scholar] [CrossRef] [PubMed]
- Espana, E.M.; Birk, D.E. Composition, structure and function of the corneal stroma. Exp Eye Res 2020, 198, 108137. [Google Scholar] [CrossRef]
- Meek, K.M.; Knupp, C. Corneal structure and transparency. Prog Retin Eye Res 2015, 49, 1–16. [Google Scholar] [CrossRef] [PubMed]
- Bell, J.S.; Hayes, S.; Whitford, C,; Sanchez-Weatherby, J. ; Shebanova, O.; Terrill, N.J.; Sørensen, T.L.M.; Elsheikh, A.; Meek, K.M. Tropocollagen springs allow collagen fibrils to stretch elastically. Acta Biomater 2022, 142, 185–193. [Google Scholar] [CrossRef] [PubMed]
- Chong, J.; Dupps, W.J. Jr. Corneal biomechanics: Measurement and structural correlations. Exp Eye Res 2021, 205, 108508. [Google Scholar] [CrossRef] [PubMed]
- Wilson, A.; Marshall, J. A. review of corneal biomechanics: Mechanisms for measurement and the implications for refractive surgery. Indian J Ophthalmol 2020, 12, 2679–2690. [Google Scholar]
- Marinescu, M.; Dascalescu, D.; Constantin, M.; Coviltir, V.; Burcel, M.; Darabus, D.; Ciuluvica, R.; Stanila, D.; Potop, V.; Alexandrescu, C. Corneal Biomechanics - an Emerging Ocular Property with a Significant Impact. Maedica (Bucur) 2022, 4, 925–930. [Google Scholar]
- Kaushik, S. , Pandav, S.S. Ocular Response Analyzer. J Curr Glaucoma Pract 2012, 1, 17–19. [Google Scholar] [CrossRef]
- Lan, G.; Twa, M.D.; Song, C.; Feng, J.; Huang, Y.; Xu, J.; Qin, J.; An, L.; Wei, X. In vivo corneal elastography: A topical review of challenges and opportunities. Comput Struct Biotechnol J 2023, 21, 2664–2687. [Google Scholar] [CrossRef]
- Eltony, A.M.; Shao, P.; Yun, S.H. Measuring mechanical anisotropy of the cornea with Brillouin microscopy. Nat Commun 2022, 15, 13–1354. [Google Scholar] [CrossRef]
- Terai, N.; Raiskup, F.; Haustein, M. , Pillunat, L.E.; Spoerl, E. Identification of biomechanical properties of the cornea: the ocular response analyzer. Curr Eye Res 2012, 37, 553–562. [Google Scholar] [CrossRef] [PubMed]
- Salouti, R.; Bagheri, M.; Shamsi, A.; Zamani, M. Corneal Parameters in Healthy Subjects Assessed by Corvis ST. J Ophthalmic Vis Res 2020, 15, 24–31. [Google Scholar] [CrossRef] [PubMed]
- Yun, S.H.; Chernyak, D. Brillouin microscopy: assessing ocular tissue biomechanics. Current Opinion in Ophthalmology 2018, 4, 299–305. [Google Scholar] [CrossRef] [PubMed]
- Zhang, H. , Asroui, L.; Tarib, I.; Dupps, W.J. Jr.; Scarcelli, G.; Randleman, J.B. Motion-Tracking Brillouin Microscopy Evaluation of Normal, Keratoconic, and Post-Laser Vision Correction Corneas. Am J Ophthalmol 2023, 254, 128–140. [Google Scholar] [CrossRef] [PubMed]
- Ávila, F.J.; Marcellán, M.C.; Remón, L. In Vivo Biomechanical Response of the Human Cornea to Acoustic Waves. Optics 2023, 4, 584–594. [Google Scholar] [CrossRef]
- Kobayashi, A.S.; Staberg, L.G.; Schlegel, W.A. Viscoelastic properties of human cornea. Exp Mech 1973, 13, 497–503. [Google Scholar] [CrossRef]
- Lakes, R.S. Viscoelastic Solids. 1999;15–61.CRC Press Boca Raton, FL.
- Zimprich, L.; Diedrich, J.; Bleeker, A.; Schweitzer, J.A. Corneal Hysteresis as a Biomarker of Glaucoma: Current Insights. Clin Ophthalmol 2020, 14, 2255–2264. [Google Scholar] [CrossRef]
- Glass, D.H.; Roberts, C.J.; Litsky, A.S.; Weber, P.A. A Viscoelastic Biomechanical Model of the Cornea Describing the Effect of Viscosity and Elasticity on Hysteresis. Invest Ophthalmol Vis Sci 2008, 49, 3919–3926. [Google Scholar] [CrossRef] [PubMed]
- Su, P.; Yang, Y.; Xiao, J.; Song, Y. Corneal hyper-viscoelastic model: derivations, experiments, and simulations. Acta BioengBiomech 2015, 17, 73–84. [Google Scholar]
- Whitford, C. , Movchan, N.V.; Studer, H.; Elsheikh, A. A viscoelastic anisotropic hyperelastic constitutive model of the human cornea. Biomech Model Mechanobiol 2018, 17, 19–29. [Google Scholar] [CrossRef]
- Ahmed, H.M.; Salem, N.M.; Al-Atabany, W. Human cornea thermo-viscoelastic behavior modelling using standard linear solid model. BMC Ophthalmol 2023, 23, 250. [Google Scholar] [CrossRef] [PubMed]
- Kelly, P. Solid mechanics part I: an introduction to solid mechanics Solid Mechanics Lecture Notes University of Auckland. 2013, (https://pkel015.connect.amazon.auckland.ac.nz/SolidMechanicsBooks/Part_I/index.html).
- Liu, J.; Roberts, C.J. Influence of corneal biomechanical properties on intraocular pressure measurement: quantitative analysis. J Cataract Refract Surg 2005, 31, 146–155. [Google Scholar] [CrossRef] [PubMed]
- Brinson, H.F.; Brinson, L.C. Polymer Engineering Science and Viscoelasticity (Springer) 2008.
- Jannesari, M.; Mosaddegh, P.; Kadkhodaei. ; Kasprzak, H.; Jabbarvand Behrouz M. Numerical and clinical investigation on the material model of the cornea in Corvis tonometry tests: differentiation between hyperelasticity and viscoelasticity. Mech Time Depend Mater 2018, 23, 373–384. [Google Scholar] [CrossRef]
- Barco, O. , Ávila FJ, Marcellán C, Remón L, Corneal retardation time as an ocular hypertension disease indicator. Biomed Phys. Eng Express 2024, 10, 015014. [Google Scholar]
- Deol, M.; Taylor, D.A.; Radcliffe, N.M. Corneal hysteresis and its relevance to glaucoma. Curr OpinOphthalmol 2015, 26, 96–102. [Google Scholar] [CrossRef] [PubMed]
- Mikula, E.R.; Jester, J.V.; Juhasz, T. Measurement of an Elasticity Map in the Human Cornea. Invest Ophthalmol Vis Sci 2016, 57, 3282–3286. [Google Scholar] [CrossRef] [PubMed]
- Francis. M.; Matalia, H.; Nuijts, R.M.M.A.; Haex, B.; Shetty. R.; Sinha Roy, A. Corneal Viscous Properties Cannot Be Determined From Air-Puff Applanation. J Refract Surg 2019, 35, 730–736. [Google Scholar] [CrossRef]
- Dana, D.; Mihaela, C.; Raluca, I.; Miruna. C.; Catalina, I.; Miruna, C.; Schmitzer, S.; Catalina C. Corneal hysteresis and primary open angle glaucoma. Rom J Ophthalmol 2015, 59, 252–254. [Google Scholar] [PubMed]
- Nossair, A.A.; Kassem, M.K.; Eltanamly, R.M.; Alahmadawy, Y.A. Corneal Hysteresis, Central Corneal Thickness, and Intraocular Pressure in Rheumatoid Arthritis, and Their Relation to Disease Activity. Middle East Afr J Ophthalmol 2021, 28, 174–179. [Google Scholar] [PubMed]
- Murtagh, P.; O’Brien, C. Corneal Hysteresis, Intraocular Pressure, and Progression of Glaucoma: Time for a “Hyst-Oric” Change in Clinical Practice? J Clin Med 2022, 11, 2895. [Google Scholar] [CrossRef]
- Blanco-Dominguez, I.; Duch, F.; Reyes, J.; Polo, V.; Abad, J.M.; Gomez-Barrera, M.; Olate-Perez, Á. Permanent corneal opacification after refractive surgery with a combined technique: Photorefractive keratectomy (PRK) and accelerated cross-linking (PRK Xtra) in healthy patients. J Fr Ophtalmol 2021, 44, e141–e143. [Google Scholar] [CrossRef] [PubMed]
- Abyaneh, M.H.; Wildman, R.D.; Ashcroft, I.A.; Ruiz, P.D. A hybrid approach to determining cornea mechanical properties in vivo using a combination of nano-indentation and inverse finite element analysis. J Mech Behav Biomed Mater 2013, 27, 239–248. [Google Scholar] [CrossRef] [PubMed]
- Lombardo, G.; Serrao, S.; Rosati, M.; Lombardo, M. Analysis of the viscoelastic properties of the human cornea using Scheimpflug imaging in inflation experiment of eye globes. PLoS One 2014, 9, e112169. [Google Scholar] [CrossRef] [PubMed]


| Parameter [Units] | Technology | Description |
|---|---|---|
| Rcor (mm) | Dual Scheimpflug analyzer | Mean corneal radii |
| CCT (μm) | Dual Scheimpflug analyzer | Central corneal thickness |
| OD (n.u) | Dual Scheimpflug analyzer | Optical density |
| SA(μm) | Dual Scheimpflug analyzer | Spherical aberration |
| Trefoil(μm) | Dual Scheimpflug analyzer | Trefoil term |
| Coma(μm) | Dual Scheimpflug analyzer | Coma term |
| IOPcc (mmHg) | ORA | Corneal-compensated intraocular pressure |
| CH (mmHg) | ORA | Corneal hysteresis |
| OD (pd/μm) | SA (μm) | Trefoil (μm) | Coma (μm) |
|---|---|---|---|
| 0.034±0.004 | -0.15±0.08 | 0.19±0.13 | 0.27±0.14 |
| Normal cornea |
Ocular hypertensive | Ortho-K user | |
|---|---|---|---|
| E (Kpa) | 3.44 | 13.23 | 3.13 |
| Ƞ (Pa * s) | 3.57 | 8.62 | 3.47 |
Disclaimer/Publisher’s Note: The statements, opinions and data contained in all publications are solely those of the individual author(s) and contributor(s) and not of MDPI and/or the editor(s). MDPI and/or the editor(s) disclaim responsibility for any injury to people or property resulting from any ideas, methods, instructions or products referred to in the content. |
© 2024 by the authors. Licensee MDPI, Basel, Switzerland. This article is an open access article distributed under the terms and conditions of the Creative Commons Attribution (CC BY) license (http://creativecommons.org/licenses/by/4.0/).


