1. Introduction
Scale model investigations can be adopted as a flexible and economically viable experimental alternative to city wide experimental campaigns and field studies. The constraints of numerical modeling and the need for high performance computing may also make scale models a viable substitute for software simulations [
1,
2]. While scale-model experiments are often carried out in wind tunnels for airflow [
3] and dispersion studies, the test setups are unable to replicate interactions between solar radiation and heat storage of building materials, which is a crucial aspect in the urban microclimate studies. Performing a scale-model experiment involves scaling down physical variables to mimic the actual scenario. For instance, the measurement height for human comfort is scaled down to correspond to actual human height, which incase of 1:5 scaled model experiment was considered at the height of 30 cm above ground surface [
4].
Historically, scale models can be found to be used as early as the sixties when they used 3D roughness like model to investigate the effect of urban climate [
5]. Scale models have evolved in complexities, sophistication, realism due to the advancement of methodology and technology. For instance, the modern scale model can incorporate realising built environment material and other features such as vegetation and even water features with possibility of studying the dynamic variation of the scale model [
6]. Scale models have been used to investigate various aspects of urban microclimate and urban heat island (UHI) mitigation strategies, such as using wind tunnel experiments for European cities [
7] and applying remote sensing data and geographically-weighted regression models to study the relationships between different factors of UHI [
8]. However, during the scale model investigations, one of the primary challenges is to ensure the reliability and accuracy of the measurement equipment [
9]. Additionally, scale of the equipment is also important so that it does not interfere in the airflow and measurement of other thermal properties during the investigations [
10].
In thermal comfort studies, Globe temperature (GT) is a key parameter and it covers exchange of both the short (solar and visible) and long wave (infrared and terrestrial) radiation fluxes between human body and the environment [
11]. The globe thermometer is the most used and reliable instrument for measuring thermal comfort [
12,
13]. In the context of scale model studies for outdoor thermal comfort, adapting scaling of measurement equipment such as globe thermometer, during measurement is rarely conducted.
The primary approach for Globe temperature determination is based on measurements made simultaneously with a thermometer for the globe, a thermometer for a dry bulb, and an anemometer [
14]. The work of Kuehn et al. has reported the theory of the globe thermometer: The temperature of the globe is governed by the combined effect of heat exchange processes through convection and radiation [
15]. A temperature sensor is placed in the center of a hollow sphere to form a globe thermometer, which was invented by Vernon in 1932 and designed for indoor use [
12]. Additionally, globe thermometers have recently been used in outdoor settings as they can be a straightforward and less expensive alternative to net radiometers[
16]. Globe temperature is therefore influenced by the values of air temperature, wind speed, and short and long-wave radiant fluxes. Guo et al. found that air speed has a substantial influence on the Mean Radiant Temperature (MRT)s derived from globe thermometers [
17]. Convection adjustments are essential for digital sensor-based globes because the temporal fluctuations in these data must be considered, as well as the actual influence on the globe throughout its settling period. As the differential between the air and surface temperatures in a space rises, convection correction becomes more significant [
18].
In scale model studies, though it is not difficult to meet the geometrical similarity requirement, it is challenging to meet all the dynamic requirements related to radiation and airflow, which are critical parameters in microclimate studies. In such cases, the experimental results can be complemented with numerical models or evaluated using stochastic methods [
2,
5]. Thus far, there are very limited scale model studies related to microclimate test setups. These studies have focused on heat island effect and thermal comfort aspects using scale-models in the outdoors conditions [
19,
20,
21]. Additionally, studies also covered the effect of reflective coatings and green roofs on the immediate microclimate using indoor scale models [
22,
23]. Therefore, this study aims to develop and discuss a test setup for studying the contribution of cool coatings (i.e., high solar reflective) on the thermal comfort parameter such as globe temperature in the street canyon setup using scale model experimental techniques.
2. Methodology
This study involves primarily experimental study using a scale model, results of which are complemented using ENVI-met simulations.
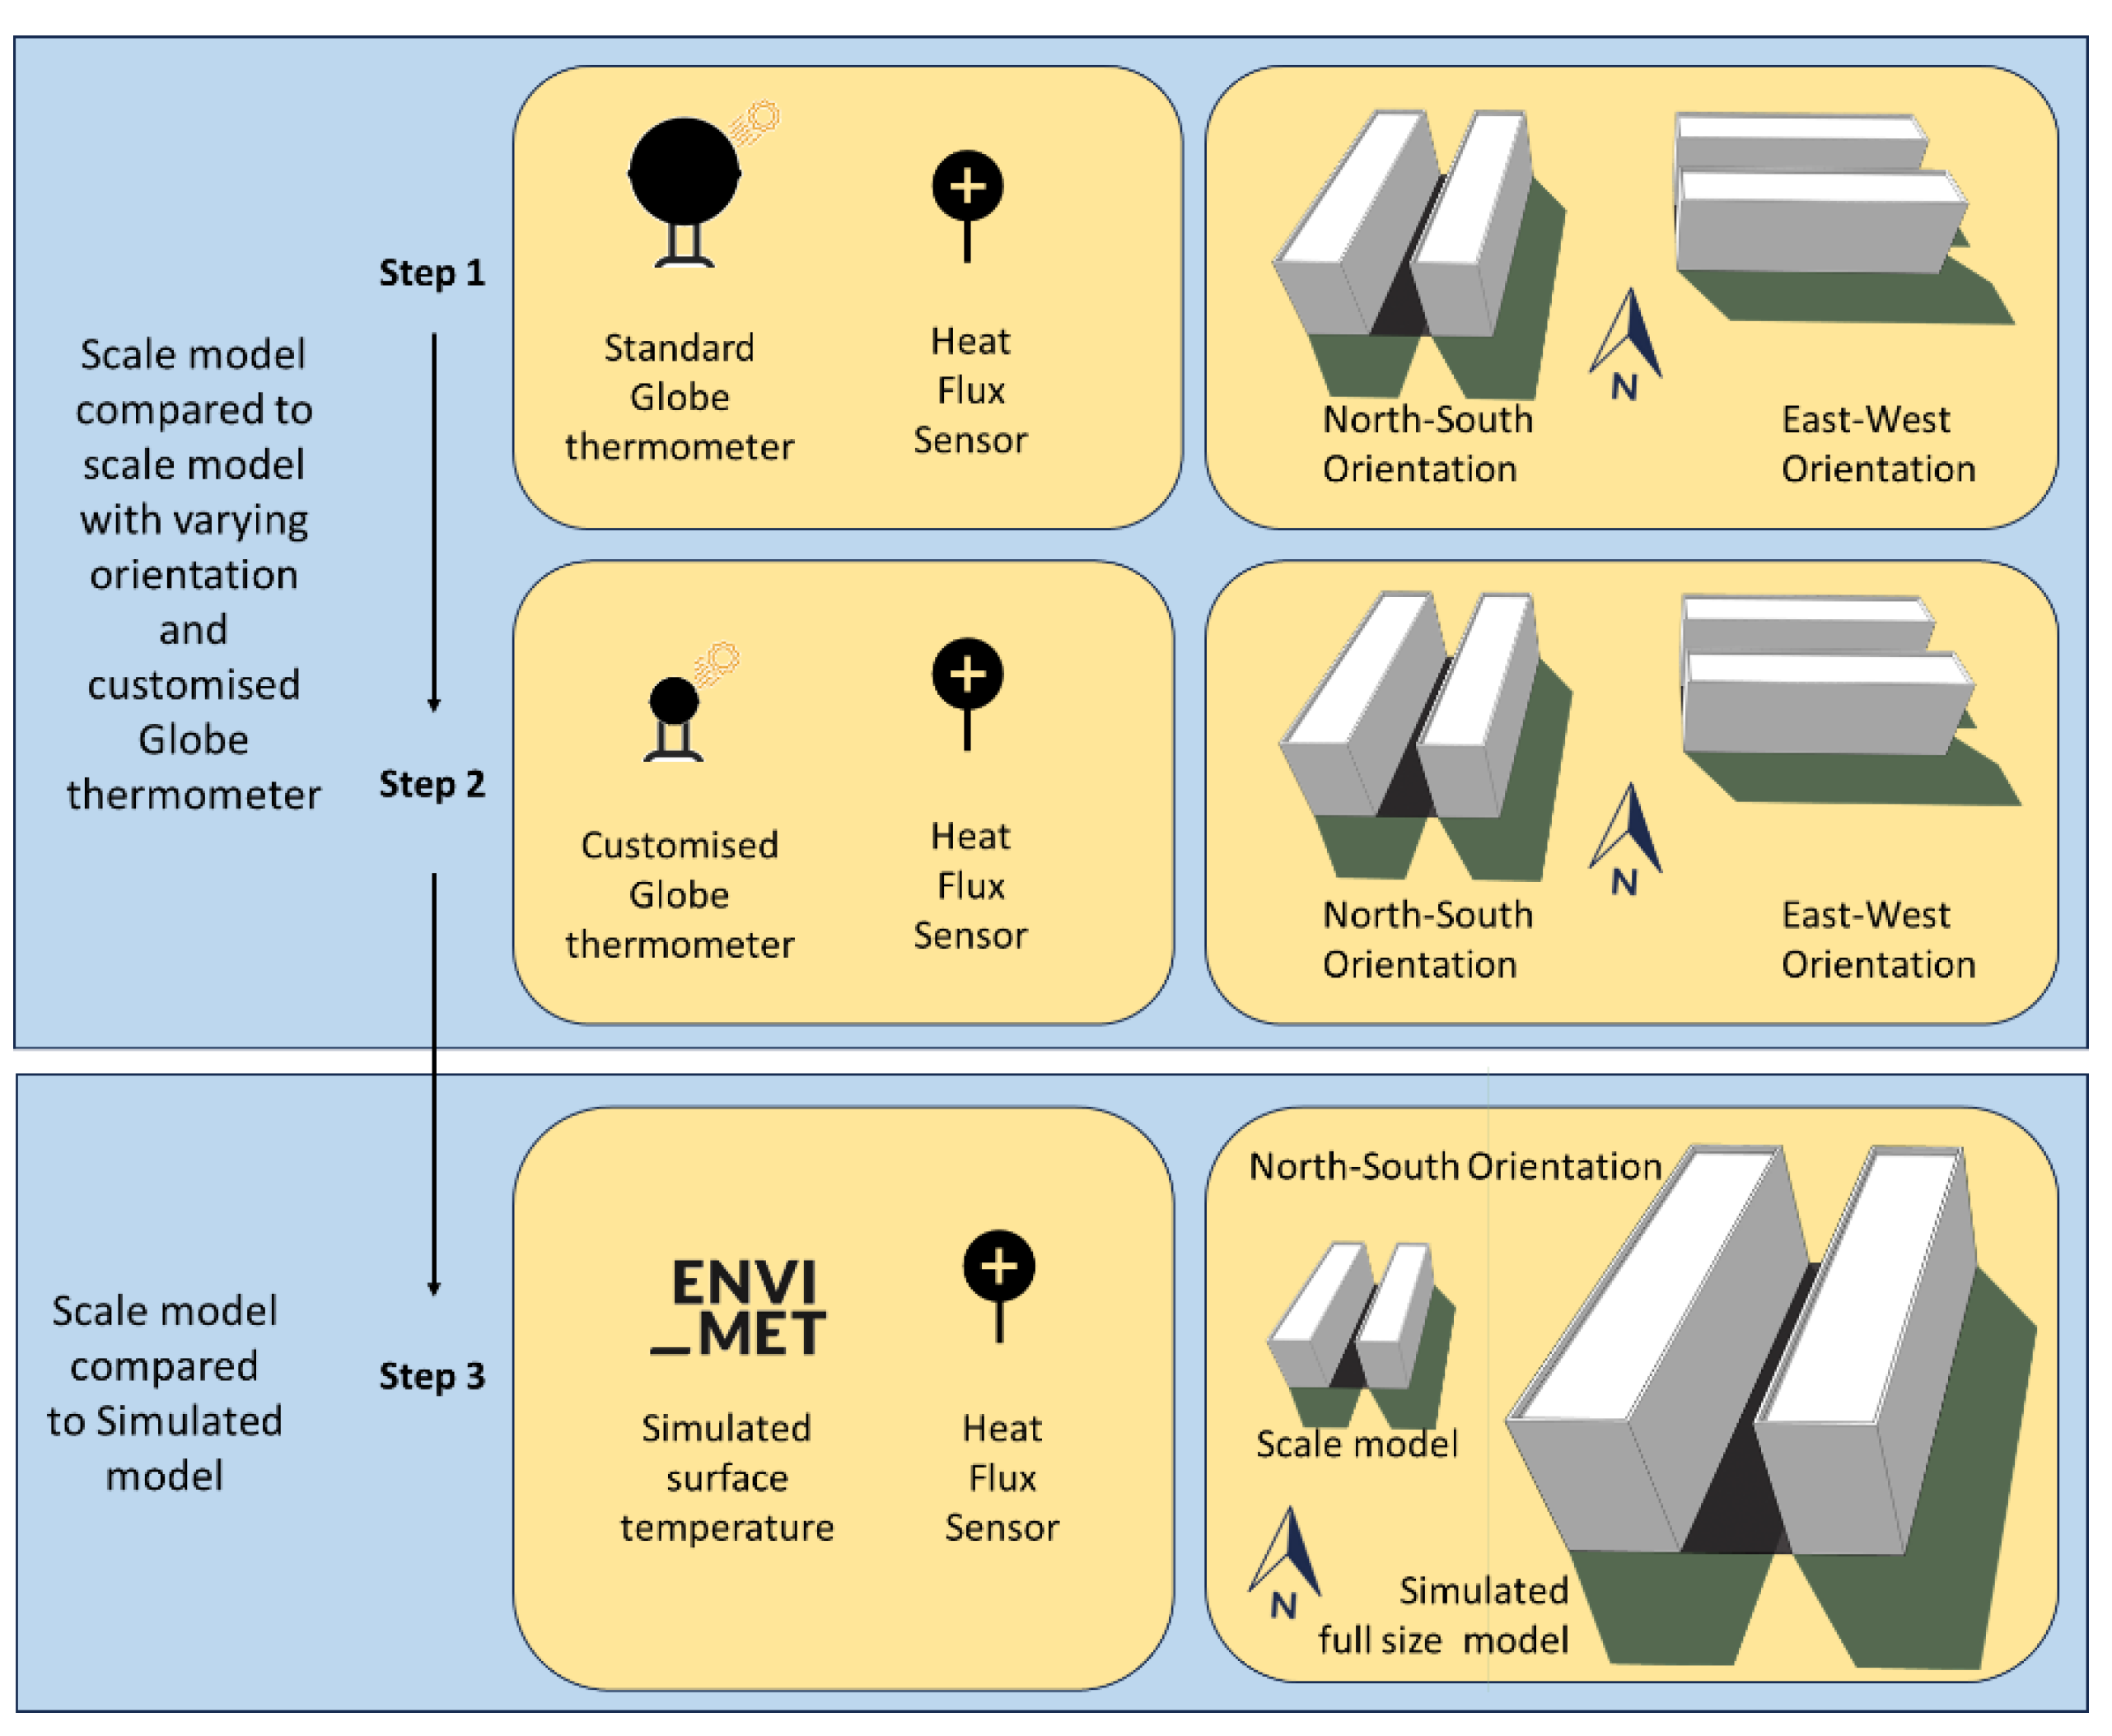
Figure 1 shows a schematic of workflow adopted for this research. Two side by side urban street canyon models are set up on the rooftop of a building located in the tropical climate of Singapore. Singapore (Latitude: 1° 17’ N, Longitude: 103° 50’ E) experiences high yearly solar insolation (1680 kWh/m2) and moderate diurnal temperature variance (26-33°C) throughout the year due to its proximity to the equator [
24].
2.1. Experimental Design of Scale Model
The experiments are conducted outdoors using 1:100 scale-models made of cement concrete (for building blocks) and asphalt concrete (for roads in between building blocks representing four parallel residential apartment blocks of 90 m (L) 15 m (B) × 40 m (H) forming two side-by-side street canyons (as shown in
Figure 2). The street width to building height (aspect ratio) of street canyon models is 1.3. The orientation of the street canyon is East-West, longer sides of the buildings facing the North and South. The materials used for making these scale models are selected carefully to replicate the processes of heat absorption, storage and release of from built up surfaces which is the key phenomenon in urban energy balance.
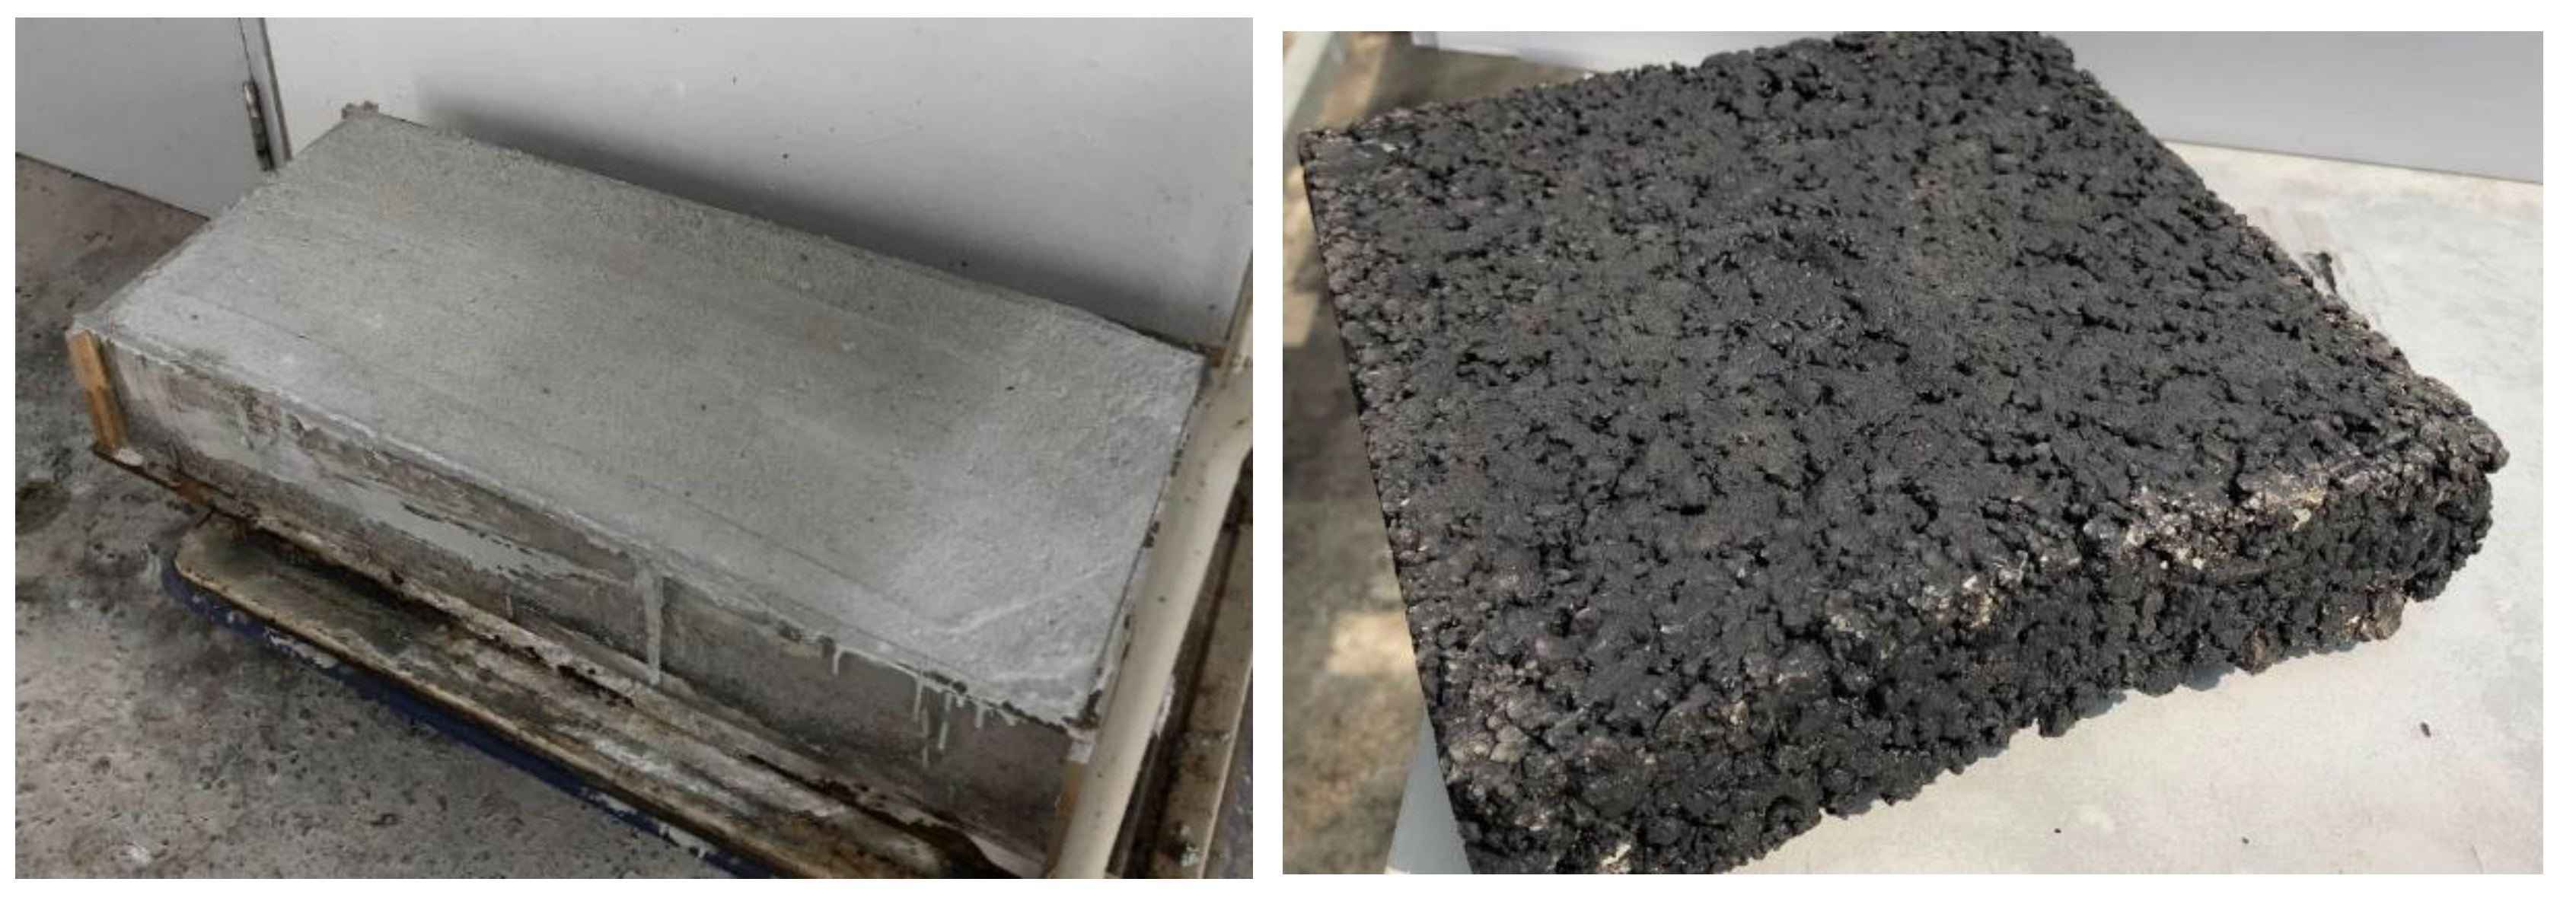
Cement concrete blocks of size 900mm (L) 150mm (B) × 400mm (H) were casted in the lab using with concrete mix proportion similar to that of a pre-cast concrete (cement, sand and coarse aggregate by weight 1:1.5:2), as shown in
Figure 2. The density of concrete block is assumed to be 2240 kg/m
3 having thermal conductivity of 1.44 W/mK and a specific heat capacity of 0.75 kJ/kgK [
25]. The road material between the blocks comprised of small cubes of size 300mm × 300mm × 50mm asphalt concrete with a density 2429 kg/m3 and a specific heat capacity of 0.93 kJ/kgK.
Figure 3 shows the images of the cement concrete and asphalt slabs prepared for the scale model setup.
A number of sensors are installed in this study to measure surface temperature, heat flux, air velocity and globe temperature. Two wire PT100 Sensor (Class A) of size 10mm and thermoelectric type heat flux sensors (gSKIN XO) of size 30mm are used for surface and temperature and heat flux measurements, respectively, as shown in
Figure 2. For air velocity, it is measured using an air velocity transducer (TSI 8455). The air velocity measurement on a typical day cycle shows mostly still air conditions during the experiments (over 60% time ≤0.1m/s; average velocity: 0.2m/s and maximum velocity: 1.6 m/s) due to parapet wall and other obstructions surrounding the model.
Globe sensor is customized using a 10mm diameter ball (made of thin glass and coated with black matt paint) to suit the model scale and is hung inside the canyon 20mm away from the road surface to represent pedestrian height (
Figure 3).
Table 1 summarizes the instruments used for the measurements along with the model and their accuracies.
In the past studies concerning scaled models, surface temperature has been studied as a major contributing factor [
2,
5] while investigating the influence of canyon characteristics on the local climate. Globe temperature (GT) is chosen as a primary indicator for studying thermal interactions as it could represent combined effect of both radiation and convective heat transfer phenomenon within the scaled street canyon. The GT has been investigated by changing the surface reflectance in various test cases as described below. One canyon is coated with low albedo (wall 0.4, road 0.2) and the other one with high albedo (wall 0.6, road 0.5) coatings. Hereafter the low albedo canyon is referred to as low reflective canyon and the high albedo canyon as high reflective canyon. Solar spectral (300-2500nm) reflectance properties of these coatings were measured in the lab in accordance to ASTM E903-12 using a spectrophotometer (Perkin Elmer L950). Multiple rounds of experiments were conducted, each for a weeklong period during April 2019; parameters mentioned above were logged at 30 second intervals. Test results for a selected typical non-rainy day were analyzed and presented in detail in the following sections.
2.1. Development of Computational Model
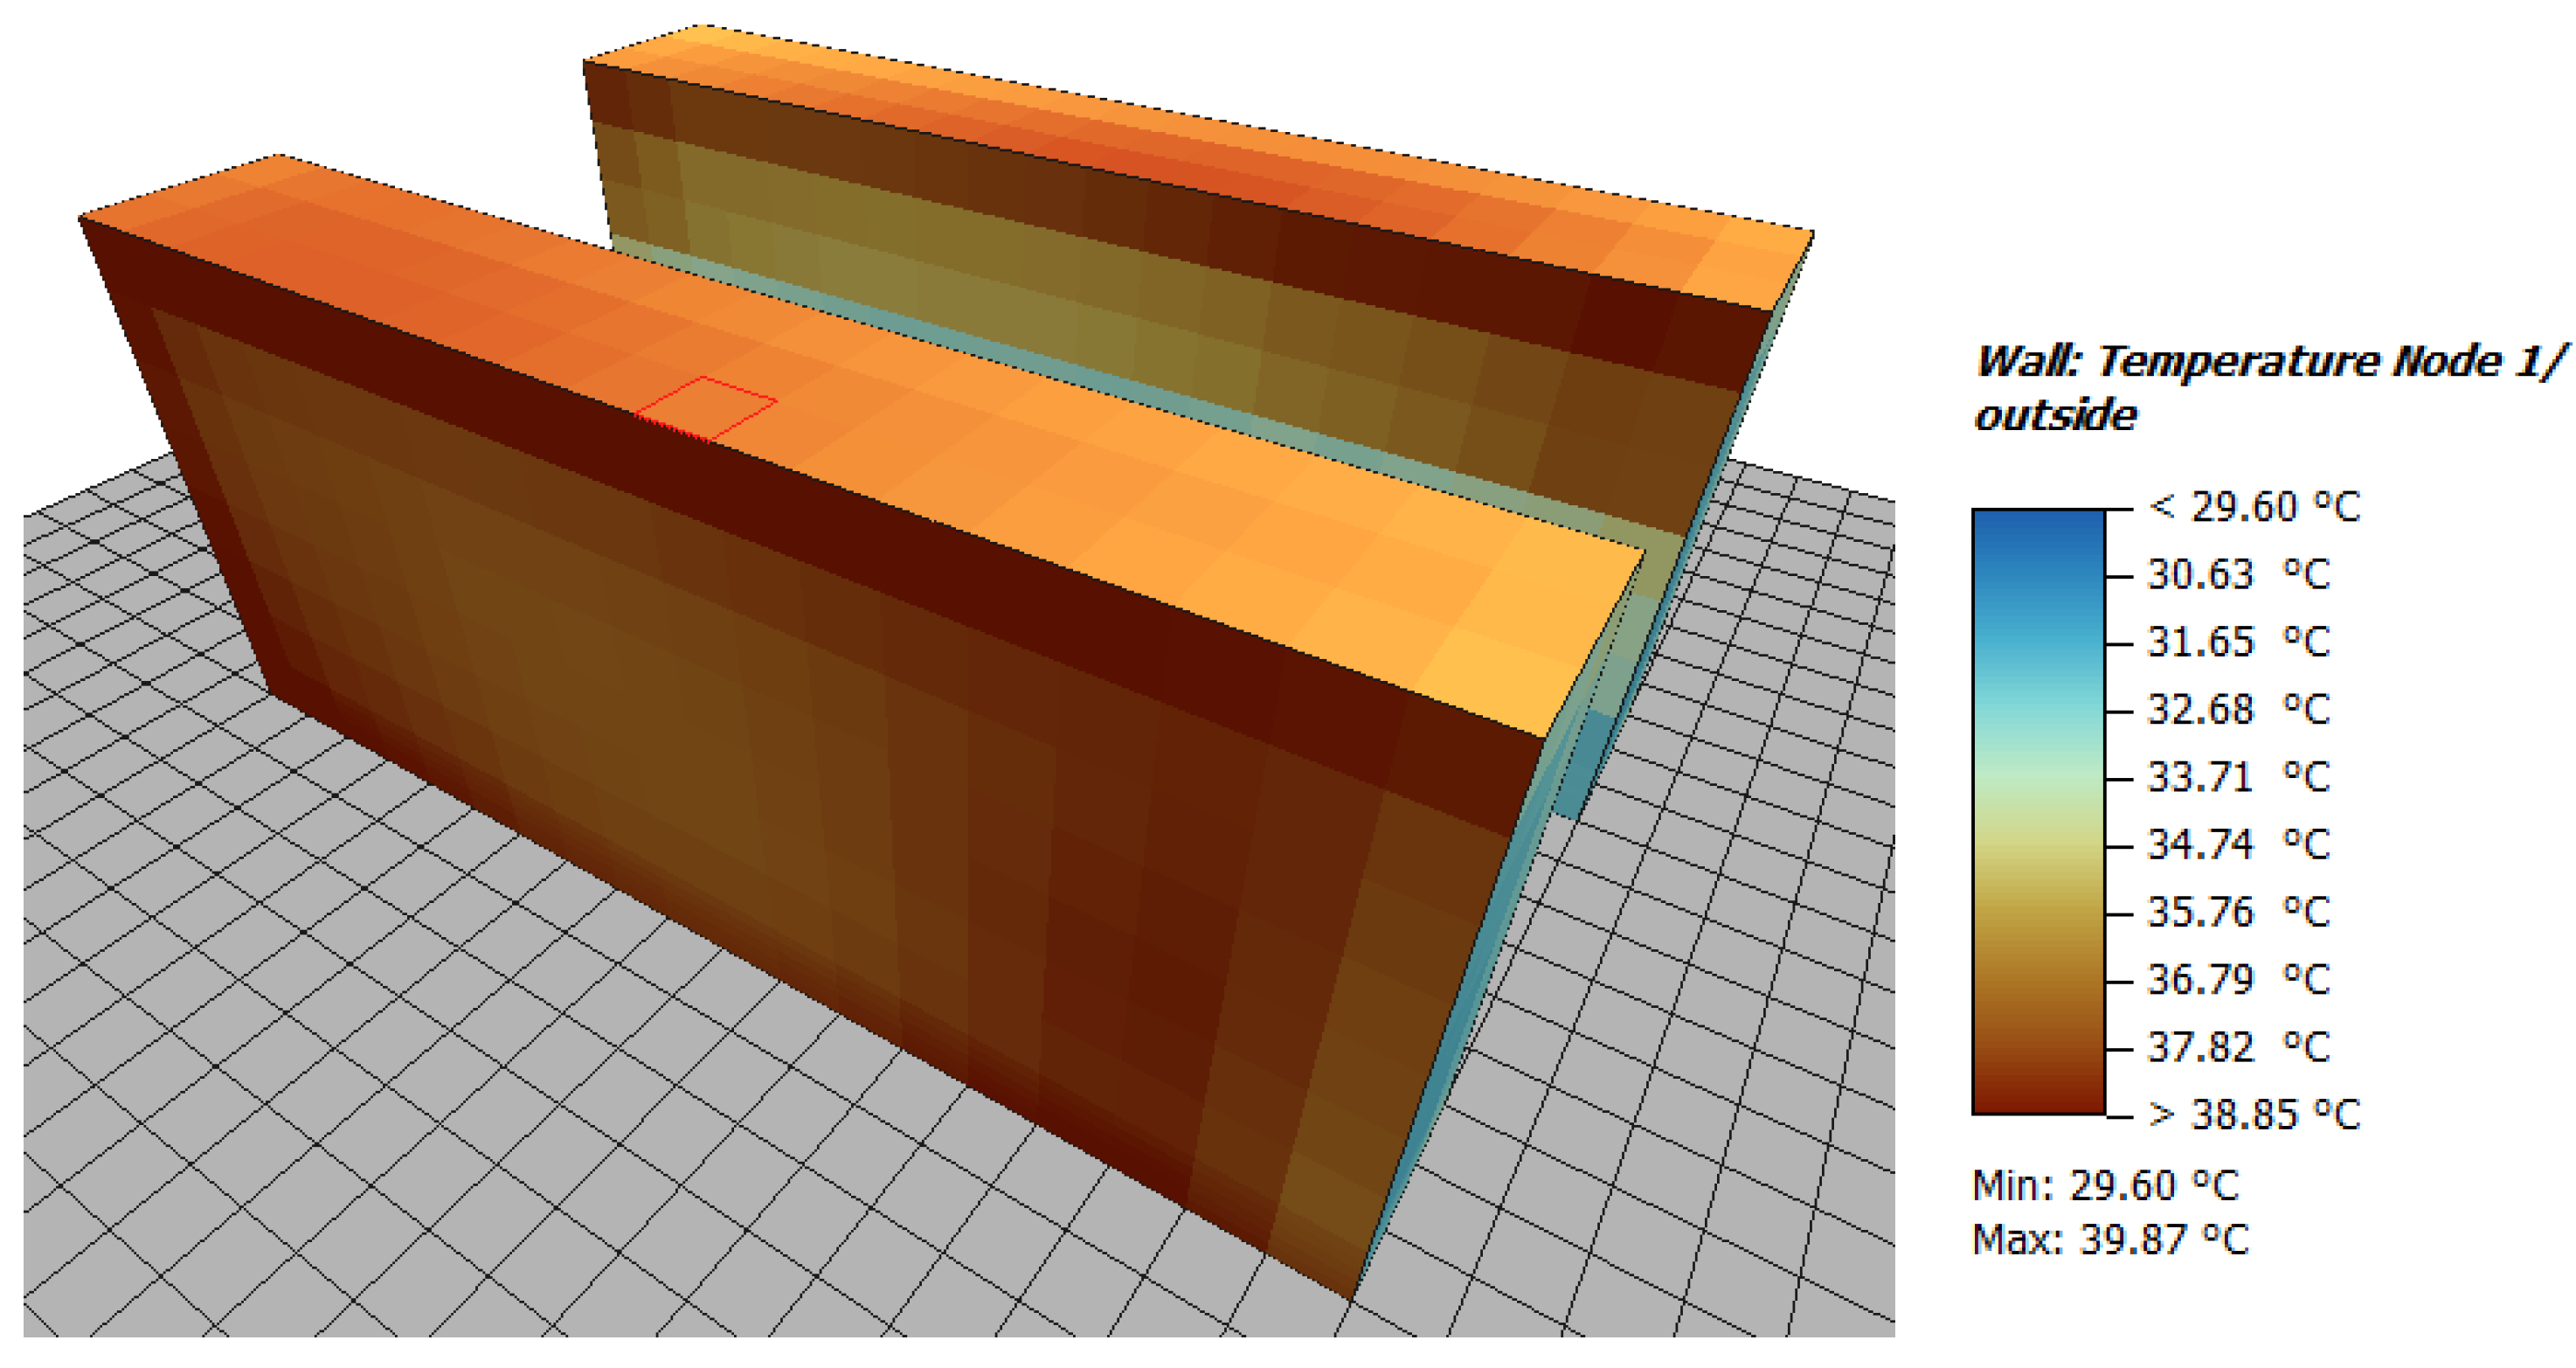
Computational modelling and simulation were conducted to evaluate the surface temperature of full-size simulated model in the same proportion as followed in the scale model (
Figure 4). The purpose of this comparison was to analyse the measured values against the proven simulation tools output. However, it is important to highlight that the simulation model was modeled of full size and not scale model size. Computational tool ENVI-met has been widely used to conduct urban canyon microclimate simulations [
25]. ENVI-met is a three-dimensional grid-based numerical modelling software to simulate microclimate and urban spaces which has been extensively validated [
26]. Following the proportion of the scale model, the computational model was developed using ENVI-met SPACES module.
The model domain created is of 32 × 38 × 20 three-dimensional grid cells where in each grid cell dimension is 5 × 5 × 5m
3. The simulation was run for a typical summer day using the meteorological data from the nearest weather station data in Singapore. The data was fully forced into the ENVI-met model which includes data points such as dry bulb temperature, relative humidity. Windspeed and solar radiation were also considered. The average windspeed was observed to be 1.5m/s in the direction parallel to the street canyon orientation (E-W). The input parameters such as surface reflectance, specific heat capacity, density and albedo were consistent to the scale model properties.
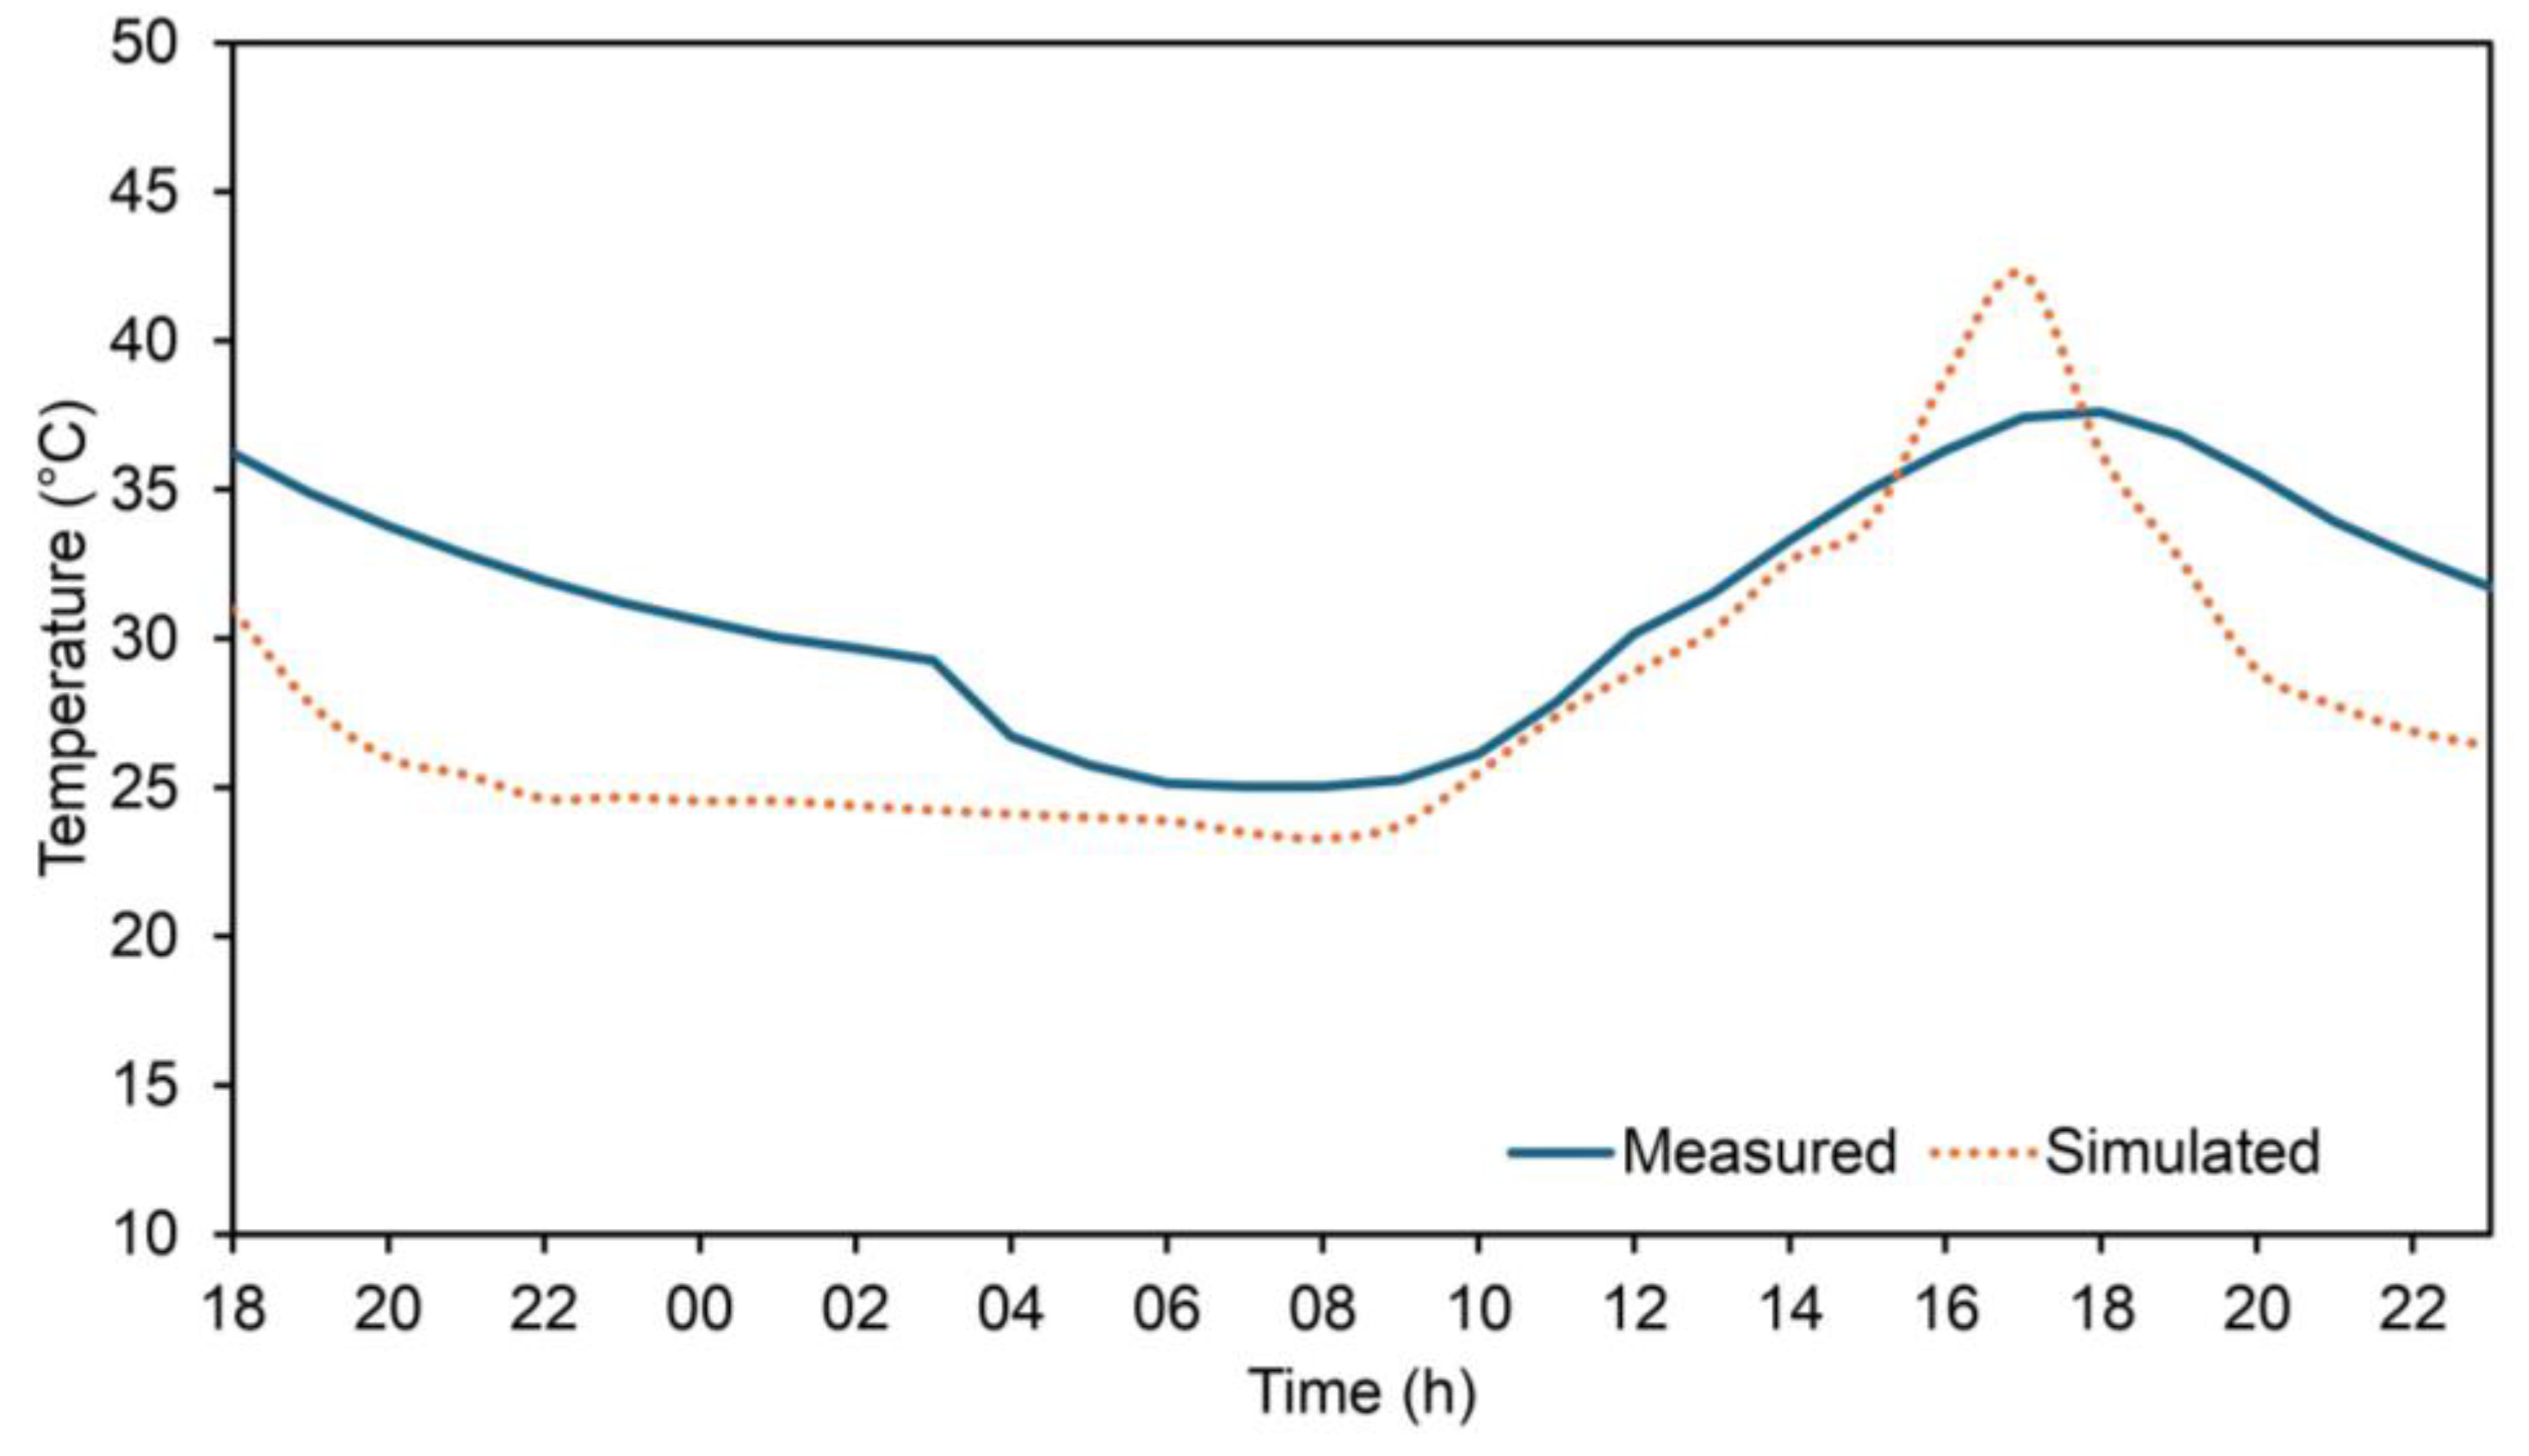
Figure 4 shows the surface temperature distribution in the simulated model at an instantaneous moment for representation purposes. However, Figure 9 in the section ‘3.3 Validation of the scale model results’ presents the complete comparison for the surface temperature for scale model and full-size simulation model.
3. Results
3.1. Customization of Globe Temperature Sensor
The issues of scaling with respect to size of the globe and effect of solar orientation are investigated in these experiments.
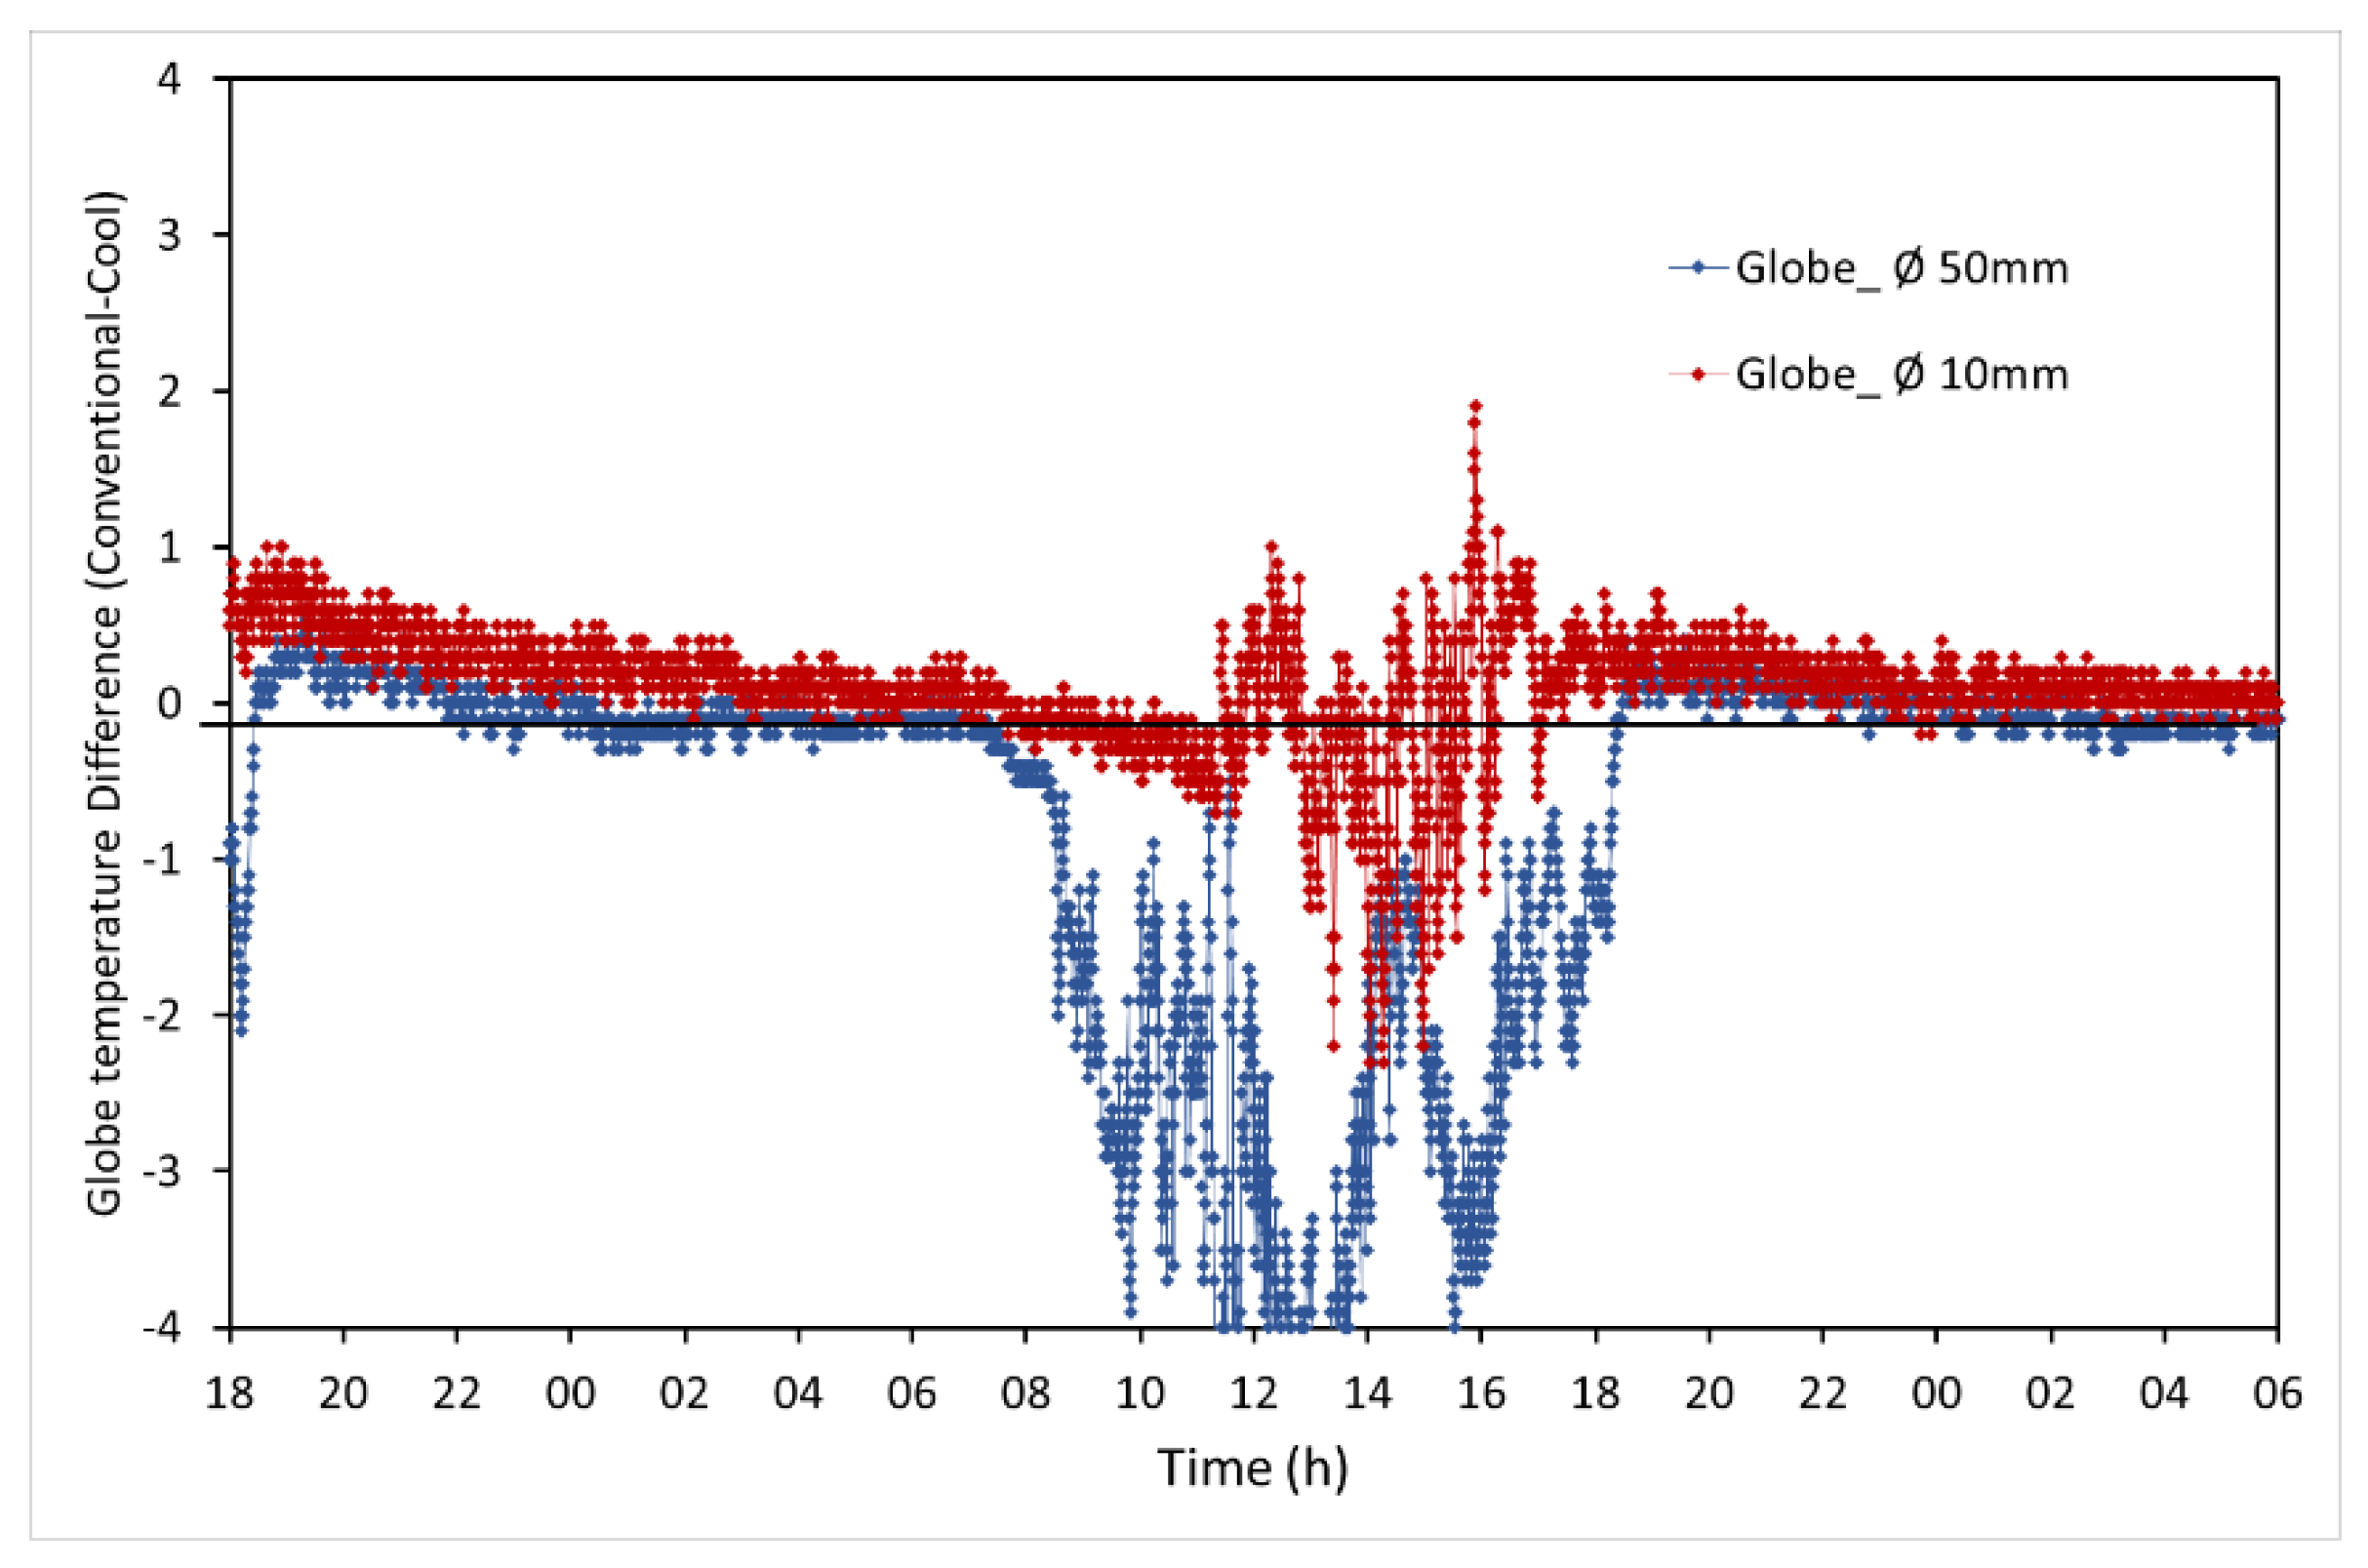
Figure 5 shows the difference in temperature monitored between the low reflective and high reflective canyon of the scale-model. Positive difference indicates that the low reflective canyon resulted in higher GT compared to high reflective canyon due to higher absorption of solar radiation that led to greater heat storage during nighttime. The parameter investigated in this context was the diameter of globe; the two lines in
Figure 6 indicate the hourly variation in the GT difference, one using standard globe of diameter-50mm and the other one using 10mm customized for the experiment. It was observed that in the case of 50mm globe (for the 30cm wide street canyon model), the differences are overestimated due to the larger surface area of the globe. Besides the dominant effect of direct solar radiation during the daytime, convective heat transfer seems to be weakening the difference in GT during the nighttime. Thus, while studying the temperature of canyon (enclosure) in scale-models, scaling of globe is a concern. A non-linear scaling was followed in this case accounting the practical constraints with regards to diameter of the globe having an temperature sensor inserted.
Overall, since the globe sensor is positioned closer to the road than wall, change in its surface temperature seems to be more sensitive to change in GT. It is also possible that there is a higher radiant heat loss from the pavement surface compared to the wall surface due the view factor it makes with sky. The change in wall temperature however seems to have more impact in terms of the magnitude of the GT due to higher wall surface area.
3.2. Effect of Solar Orientation on the Globe Temperature
Orientation of canyon impacts the heat retained within the canyon. In other term, the temperature in the canyon changes with orientation, which has been established previously by scale model experimental investigation conducted in Italy [
27].
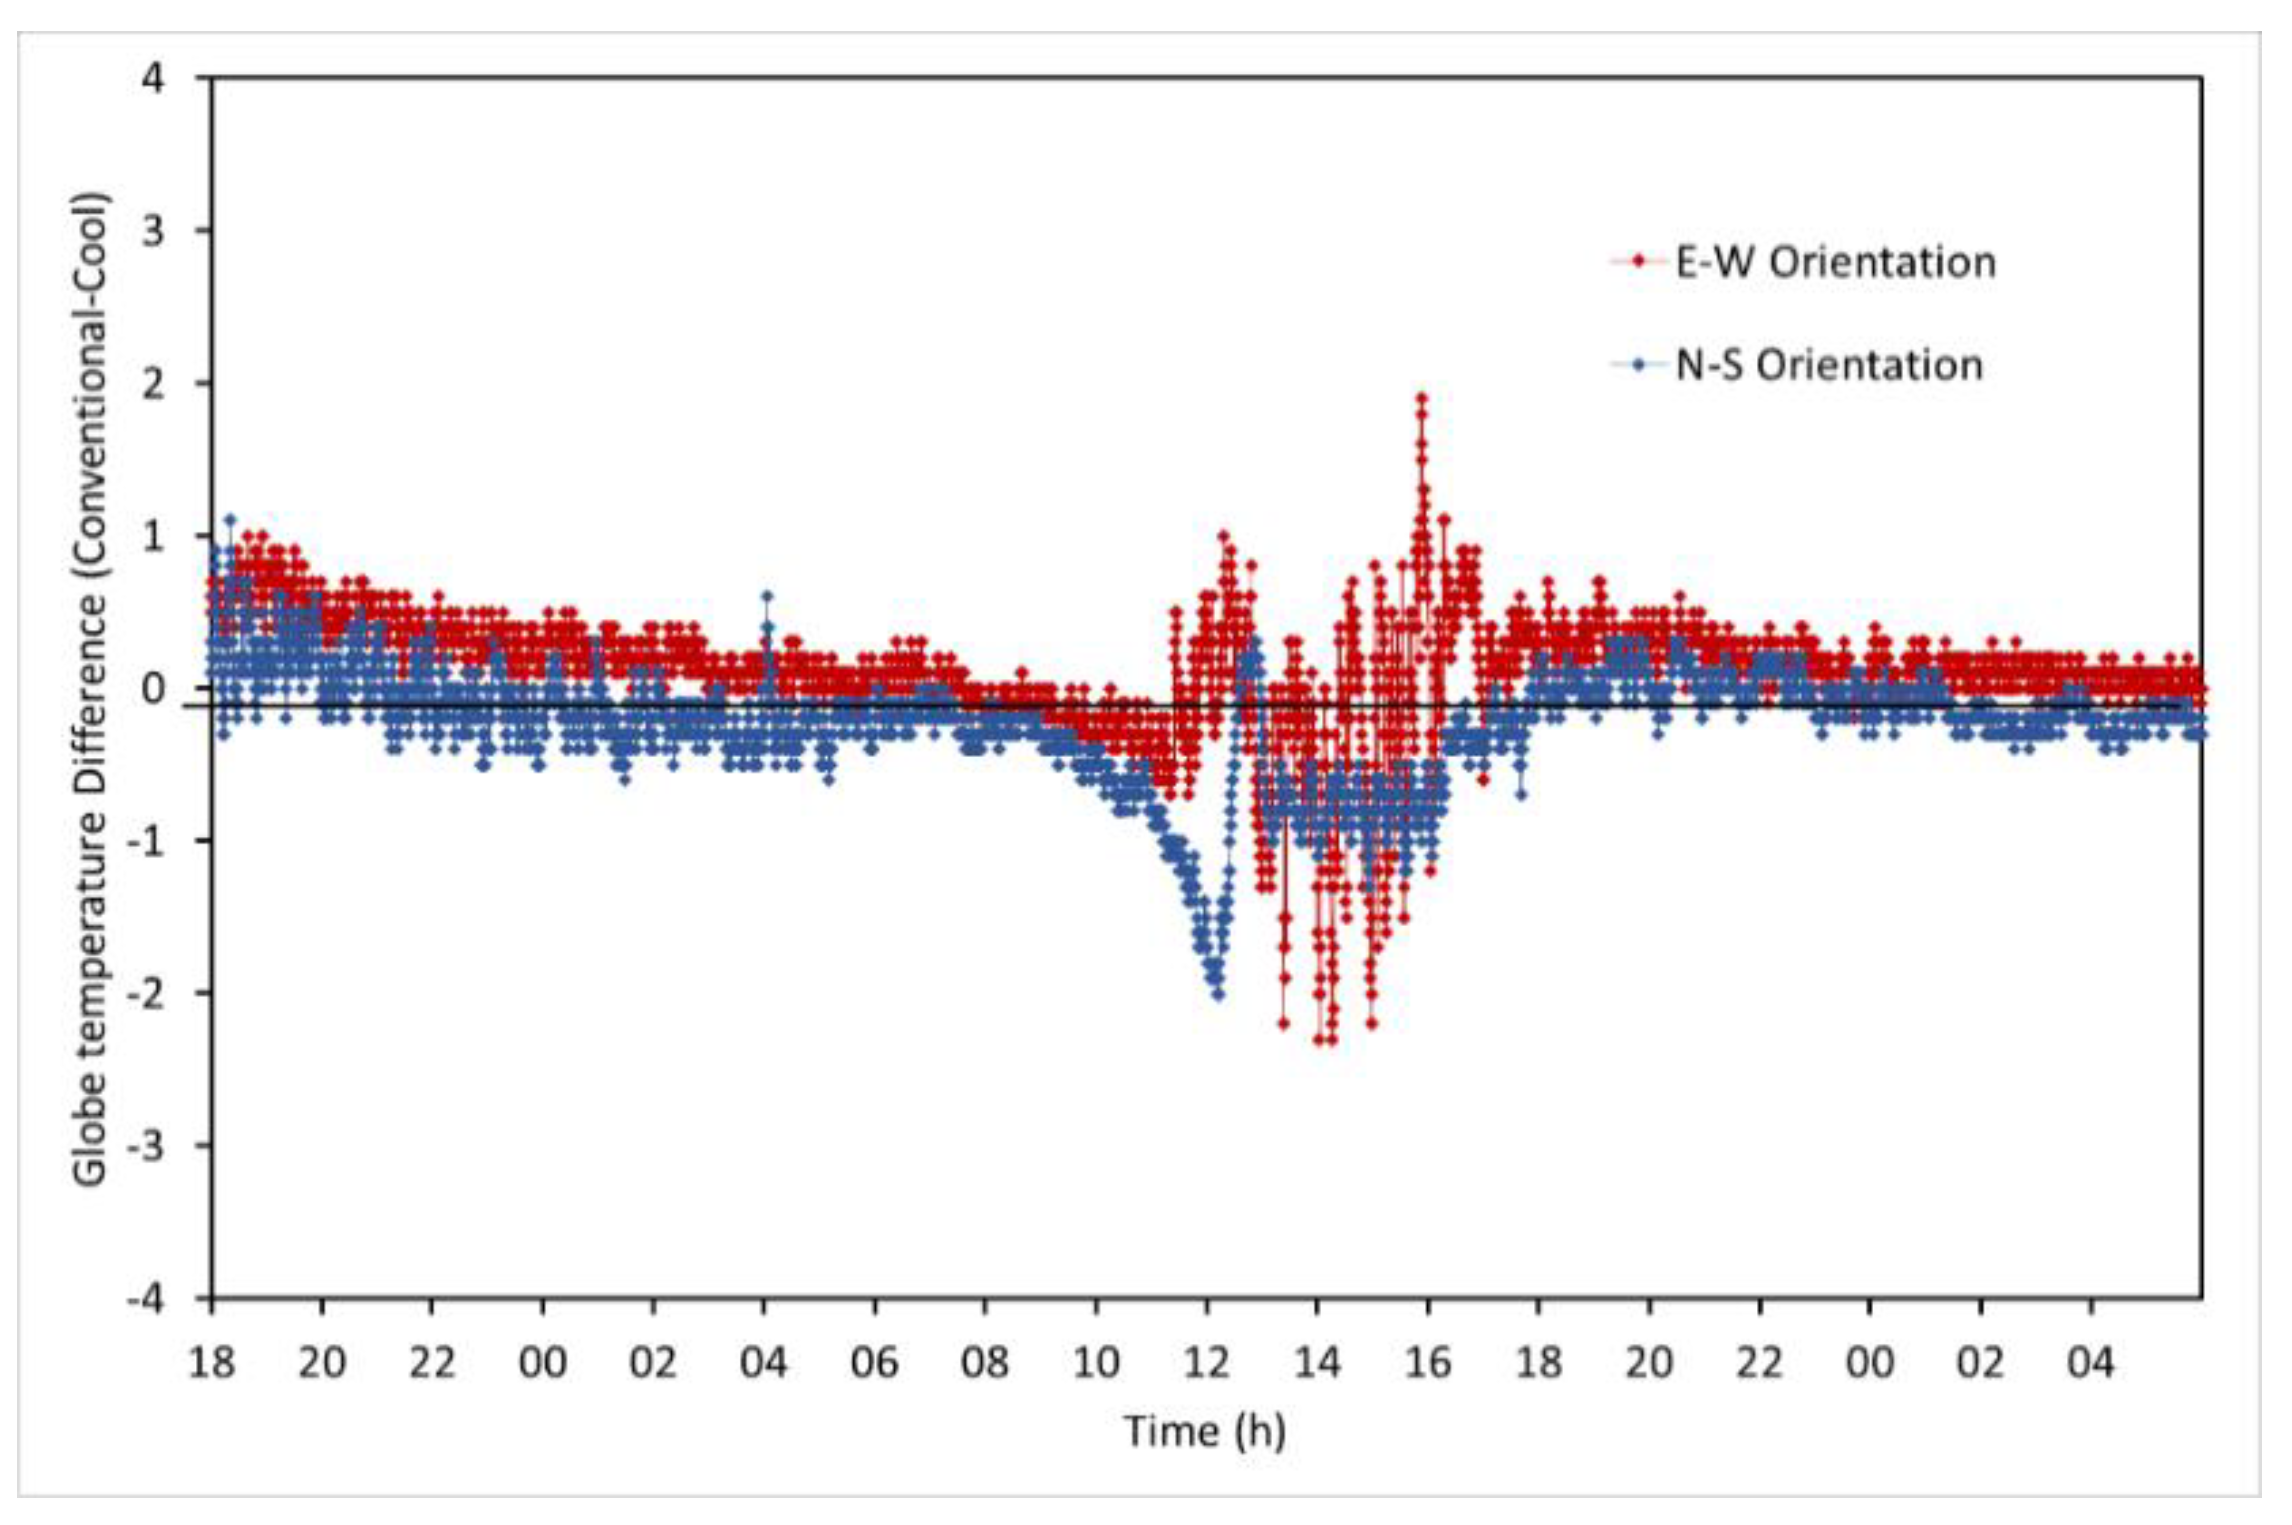
This set of experiments shows a comparison between globe temperature differences for two different street orientations (
Figure 7). A higher positive difference can be noticed in the case of the E-W street orientation compared to the N-S street orientation due to higher solar irradiation received on E-W orientated streets. Furthermore, the heat flux from wall surfaces as well as the air velocity measured inside the canyon were anlaysed. Higher negative heat flux was observed during night in the case of a low reflective canyon, which is due to higher longwave emission from the wall and road surfaces.
3.3. Validation of the Scale Model Results
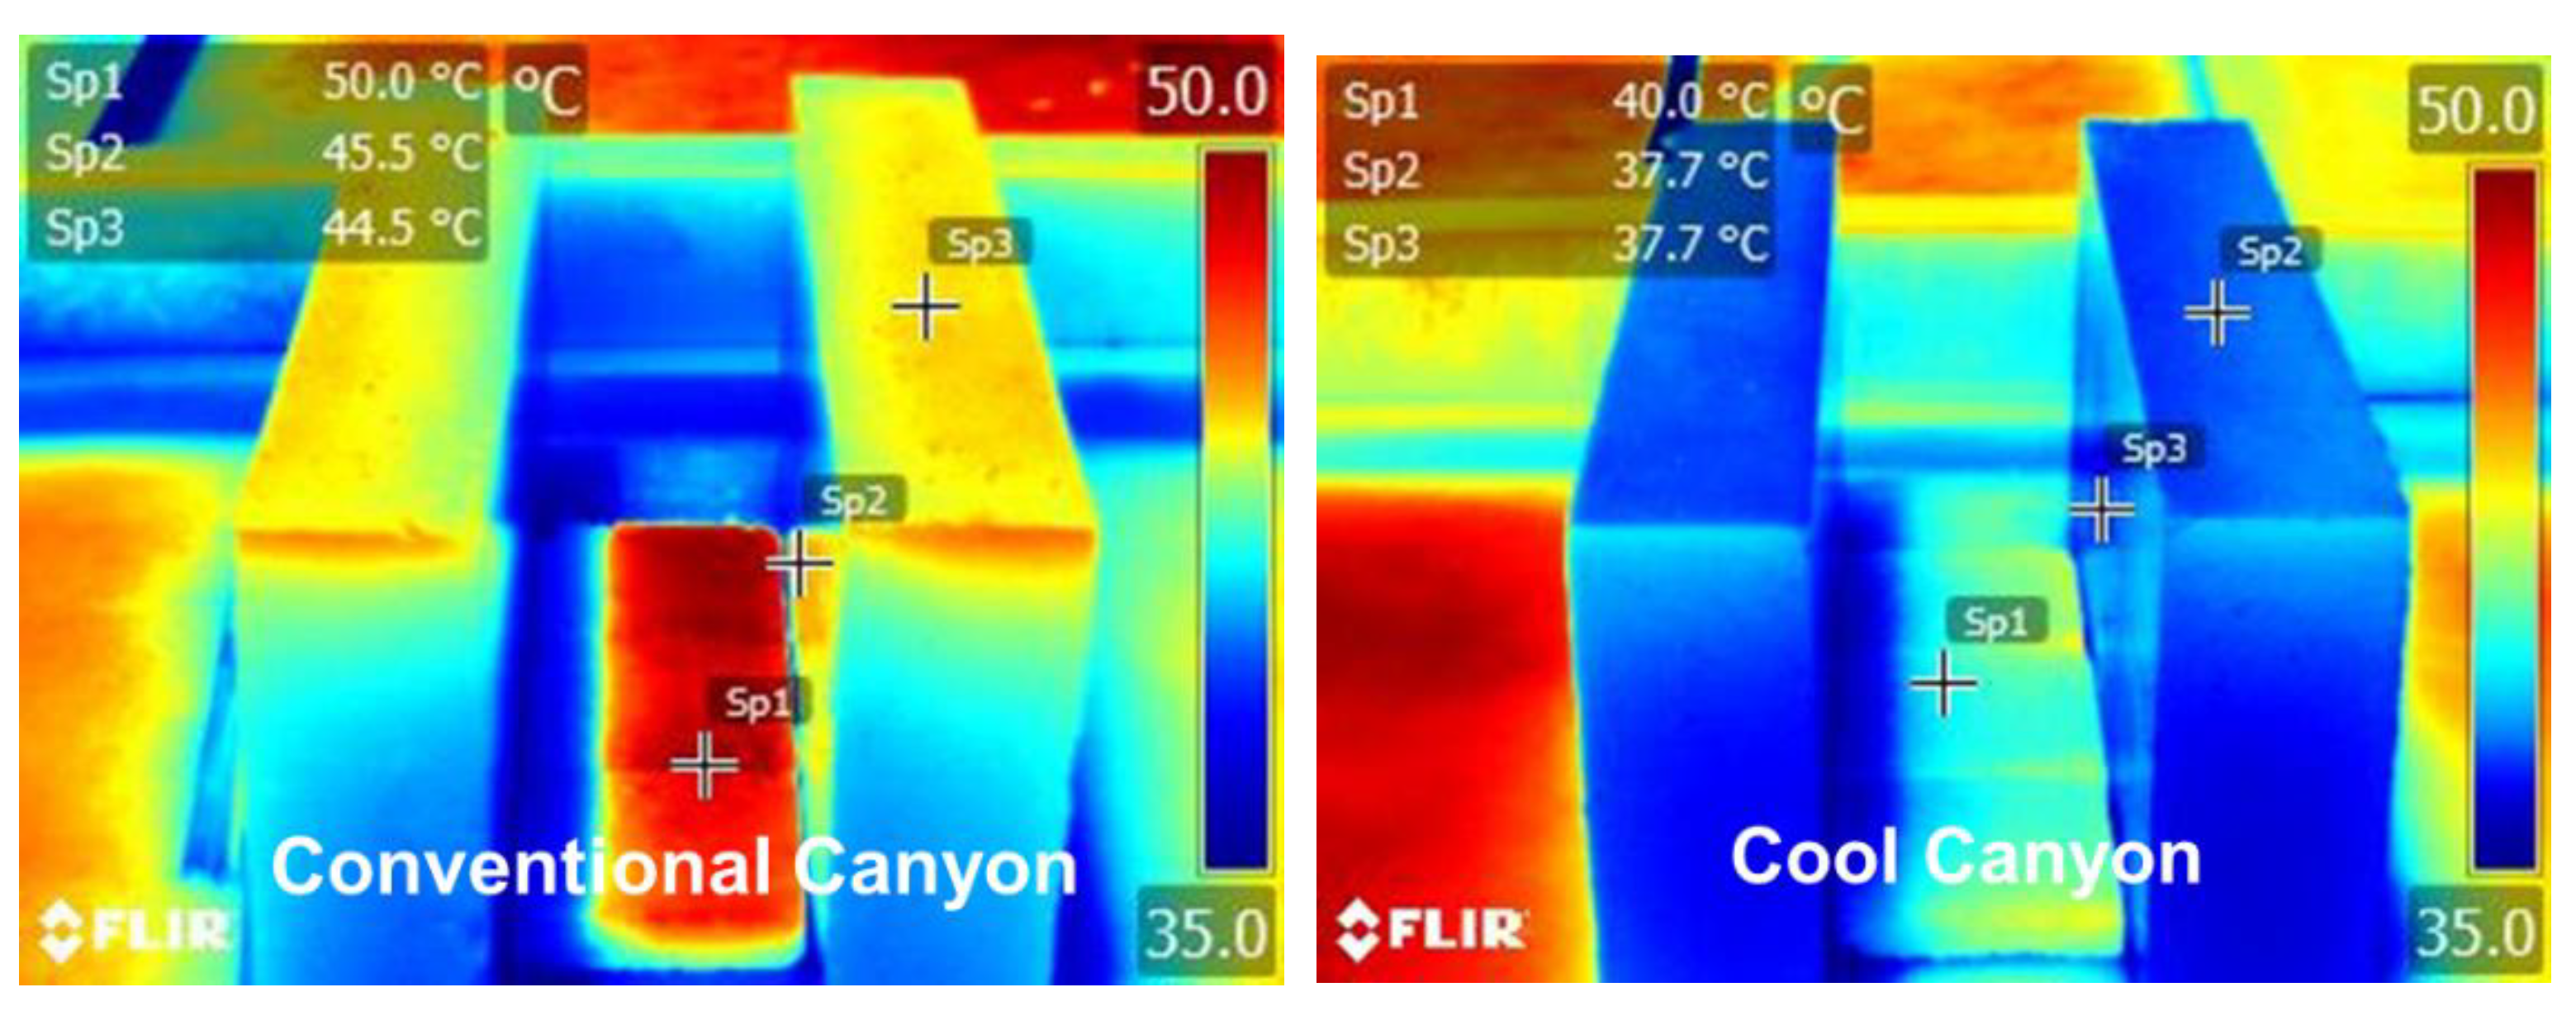
Figure 8 shows thermal images taken for the concrete block model at 14:00h, highlighting temperature difference for roof, wall, and road across low reflective and high reflective canyons. The temperature values observed in the temporal monitoring closely match the values in the thermography. It can be noticed clearly noticed from these infrared thermal images that there is temperature difference up to 10°C for the asphalt concrete surfaces (high reflective vs low reflective) for the area between the two parallel blocks in the scale model. The roof surface temperature difference is observed up to 7.8°C where as the wall temperature difference was up to 6.8°C. It is evident that the higher difference in terms of surface reflectance for asphalt surface (0.3) and horizontal surface orientation compared to the wall surface.
Figure 9 shows the profiles for comparison of wall surface temperature (canyon facing) between the ENVI-met result and measured values from scale-models. It can be observed that although there is a slight deviation, the two temperature profiles show a similar trend; the profile varies, especially during the afternoon period. This variation can be attributed to two different reasonings. The first reasoning may be due to the comparison between the scale model and the full-size simulated model. As stated earlier in ‘
Section 2.1: Development of computation model’ the measured values from the scale model experiment are compared against the established computational modelling output from ENVI-met to compare the difference. This size difference in the virtual full-size and experimental scale models can lead to underestimation of the simulated model. The second reason can be attributed to the difference between the possible modelling limitations in terms of the boundary conditions such as sky conditions. Additionally, a similar profile is also observed for simulated and measured air temperature in previous existing studies [
23]. These aspects need to be investigated further in our future experiments.
Figure 9.
Measured and Simulated façade temperature profiles.
Figure 9.
Measured and Simulated façade temperature profiles.
3.4. Computational Modelling Analysis for Outdoor Comfort
A detailed computational modelling study was conducted to analyse the three different effects. First is the MRT variation across the orientation followed by the impact of cool material. Both the studies were conducted in the vicinity of façade at the centre of the canyon. However, a further study was conducted to see how the MRT is impacted due to the increased distance from the façade. This computation study is necessary to explore the impact on MRT in detail which is not possible with the scale model. It gives an insight on how various façade material impact outdoor comfort.
3.4.1. Daily MRT Variability across Orientation
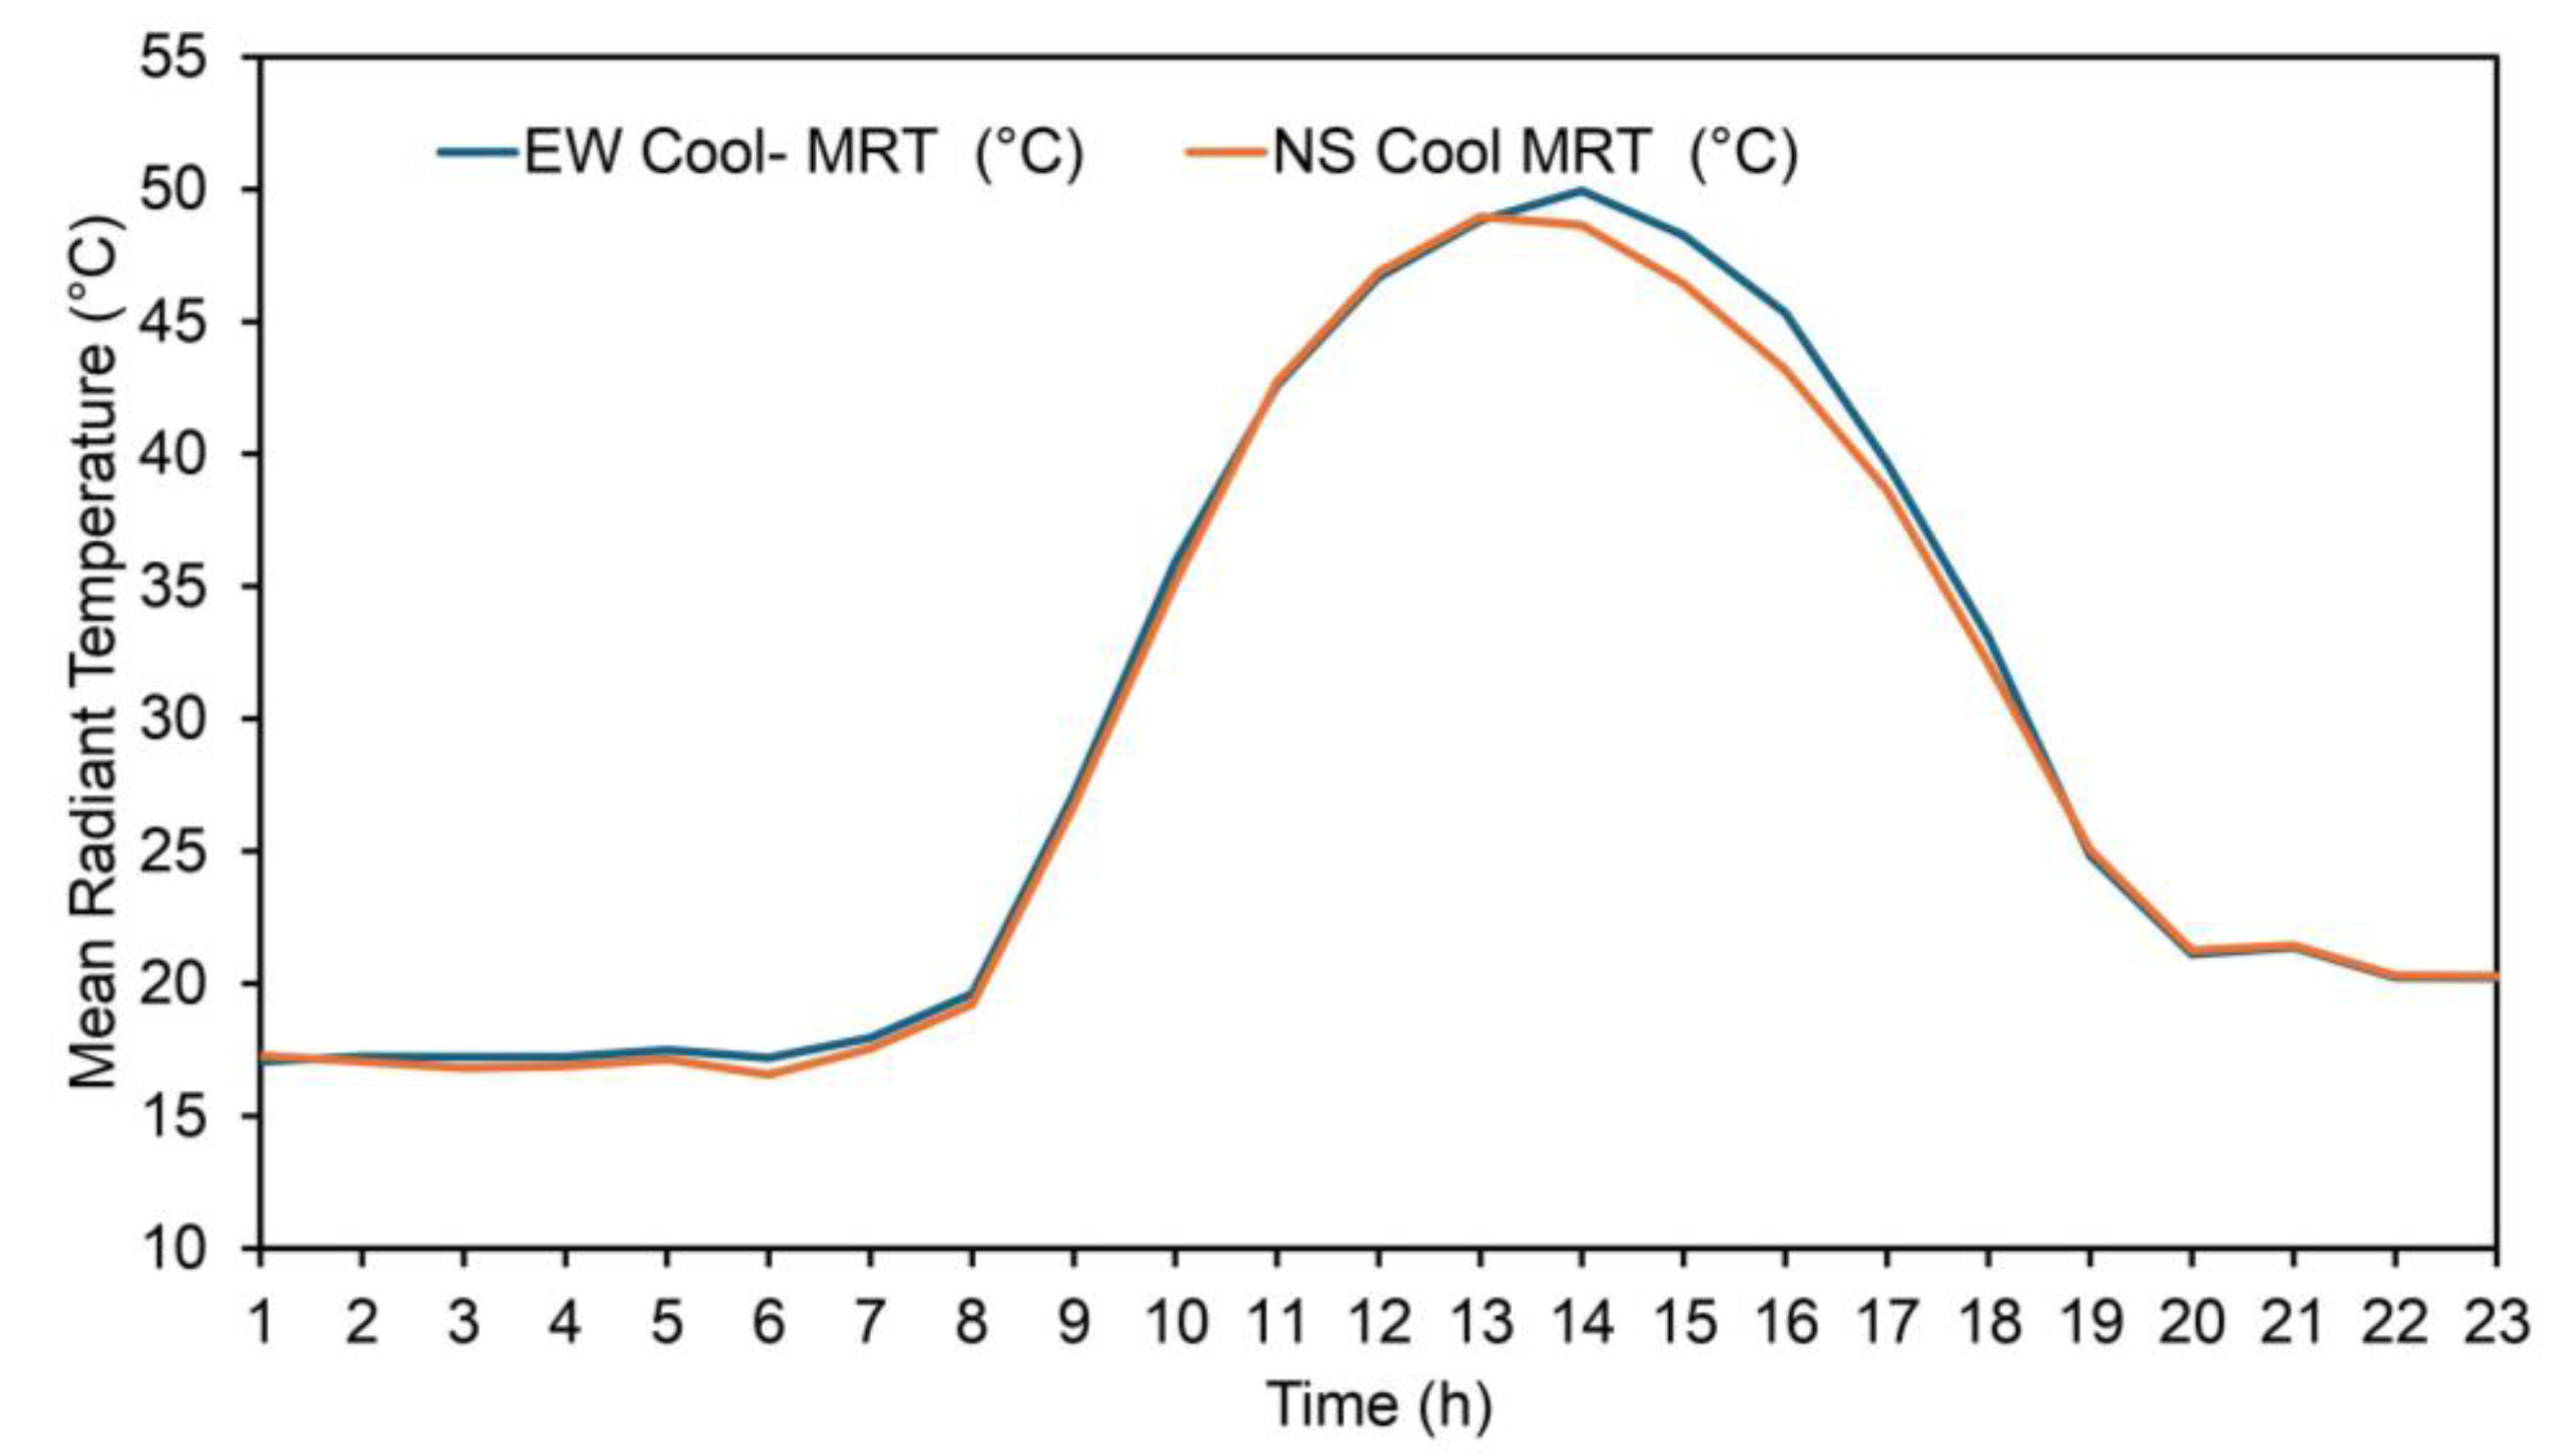
Over the course of a day, MRT varies significantly peaking around midday and declining towards the evening as seen in
Figure 10. The MRT reading for the east-west oriented canyon is marginally higher than those of north-south orientation especially during afternoon when the solar angles were aligned directly into the canyon as solar path for Singapore is almost overhead due to it close proximity to equator, it is expected that there will not be significant difference.
3.4.2. Impact of Cool Materials
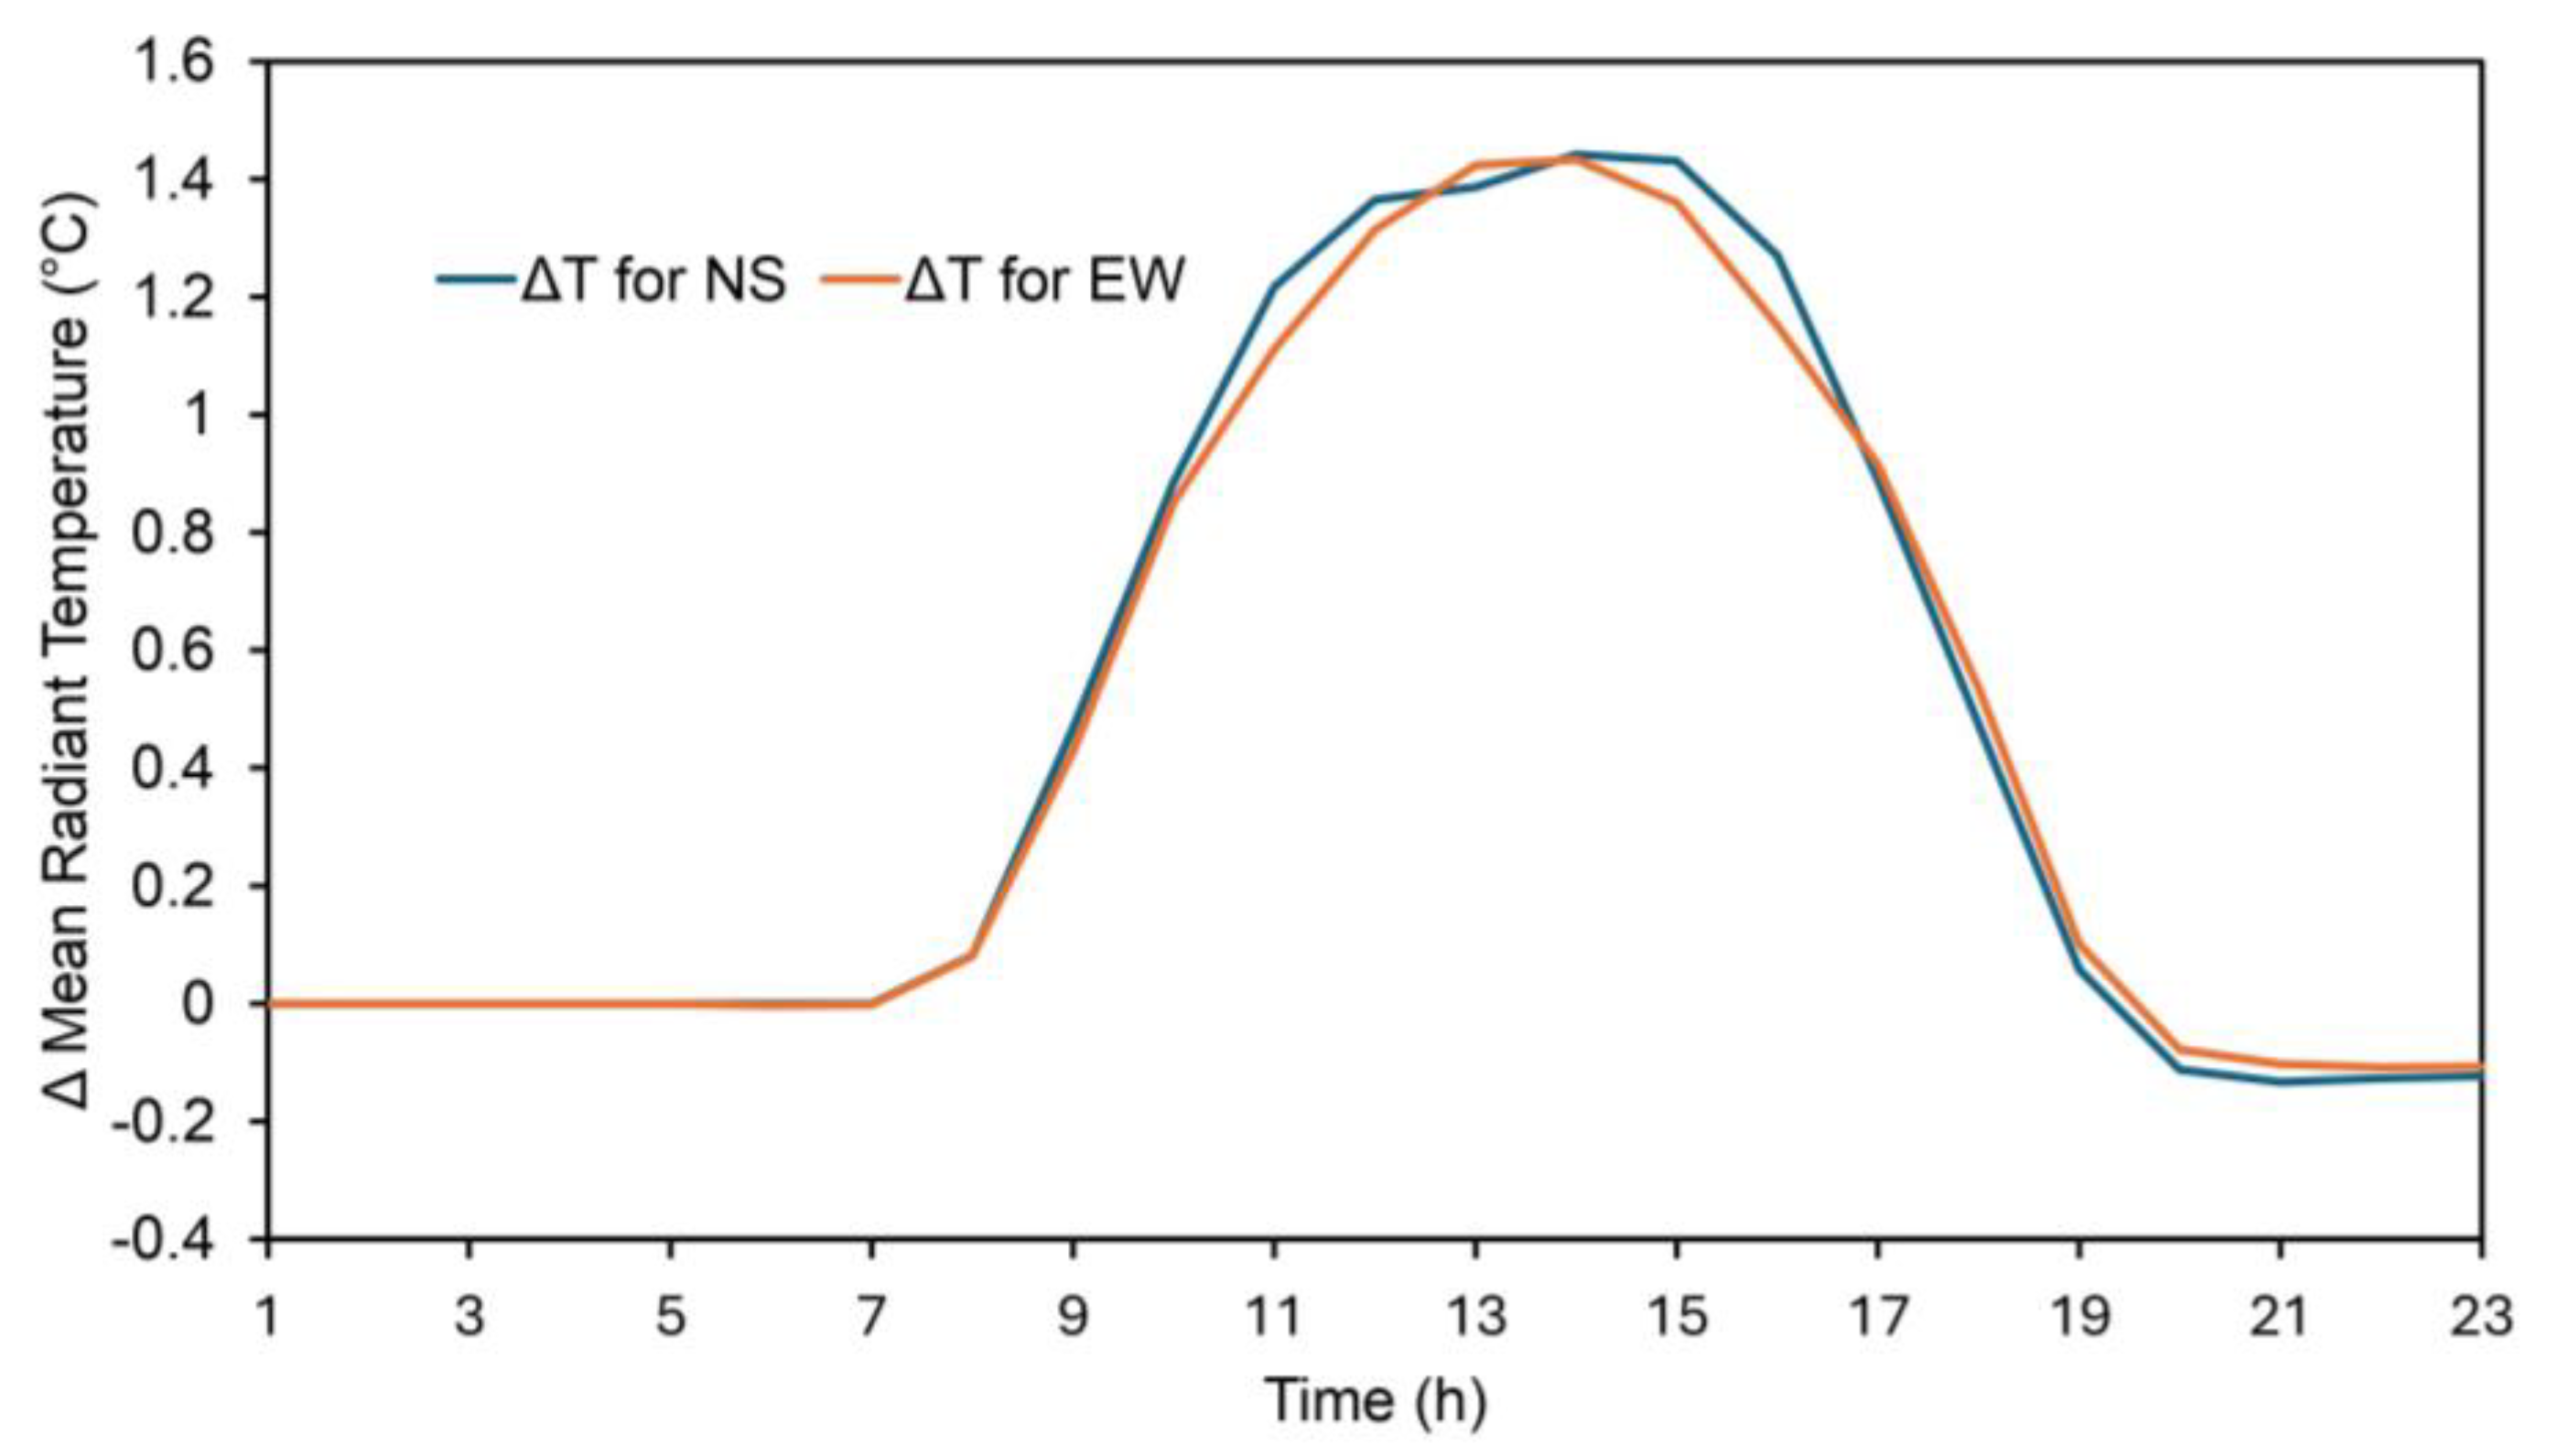
Upon comparing the impact of cool coating over baseline in the context of the two stated orientations, the ΔT shows almost similar trend with slight variation as shown in the
Figure 11. The application of cool materials established a notable decrease in MRT across all measurements for both orientations. The ΔT indicated that cool materials could reduce MRT by over 1.4°C during the hottest part of the day compared to baseline materials. However, the difference is marginal in both orientations for Singapore location which may show different for other regions.
3.4.2. Comparative Analysis of Different Urban Canyon Grid Points
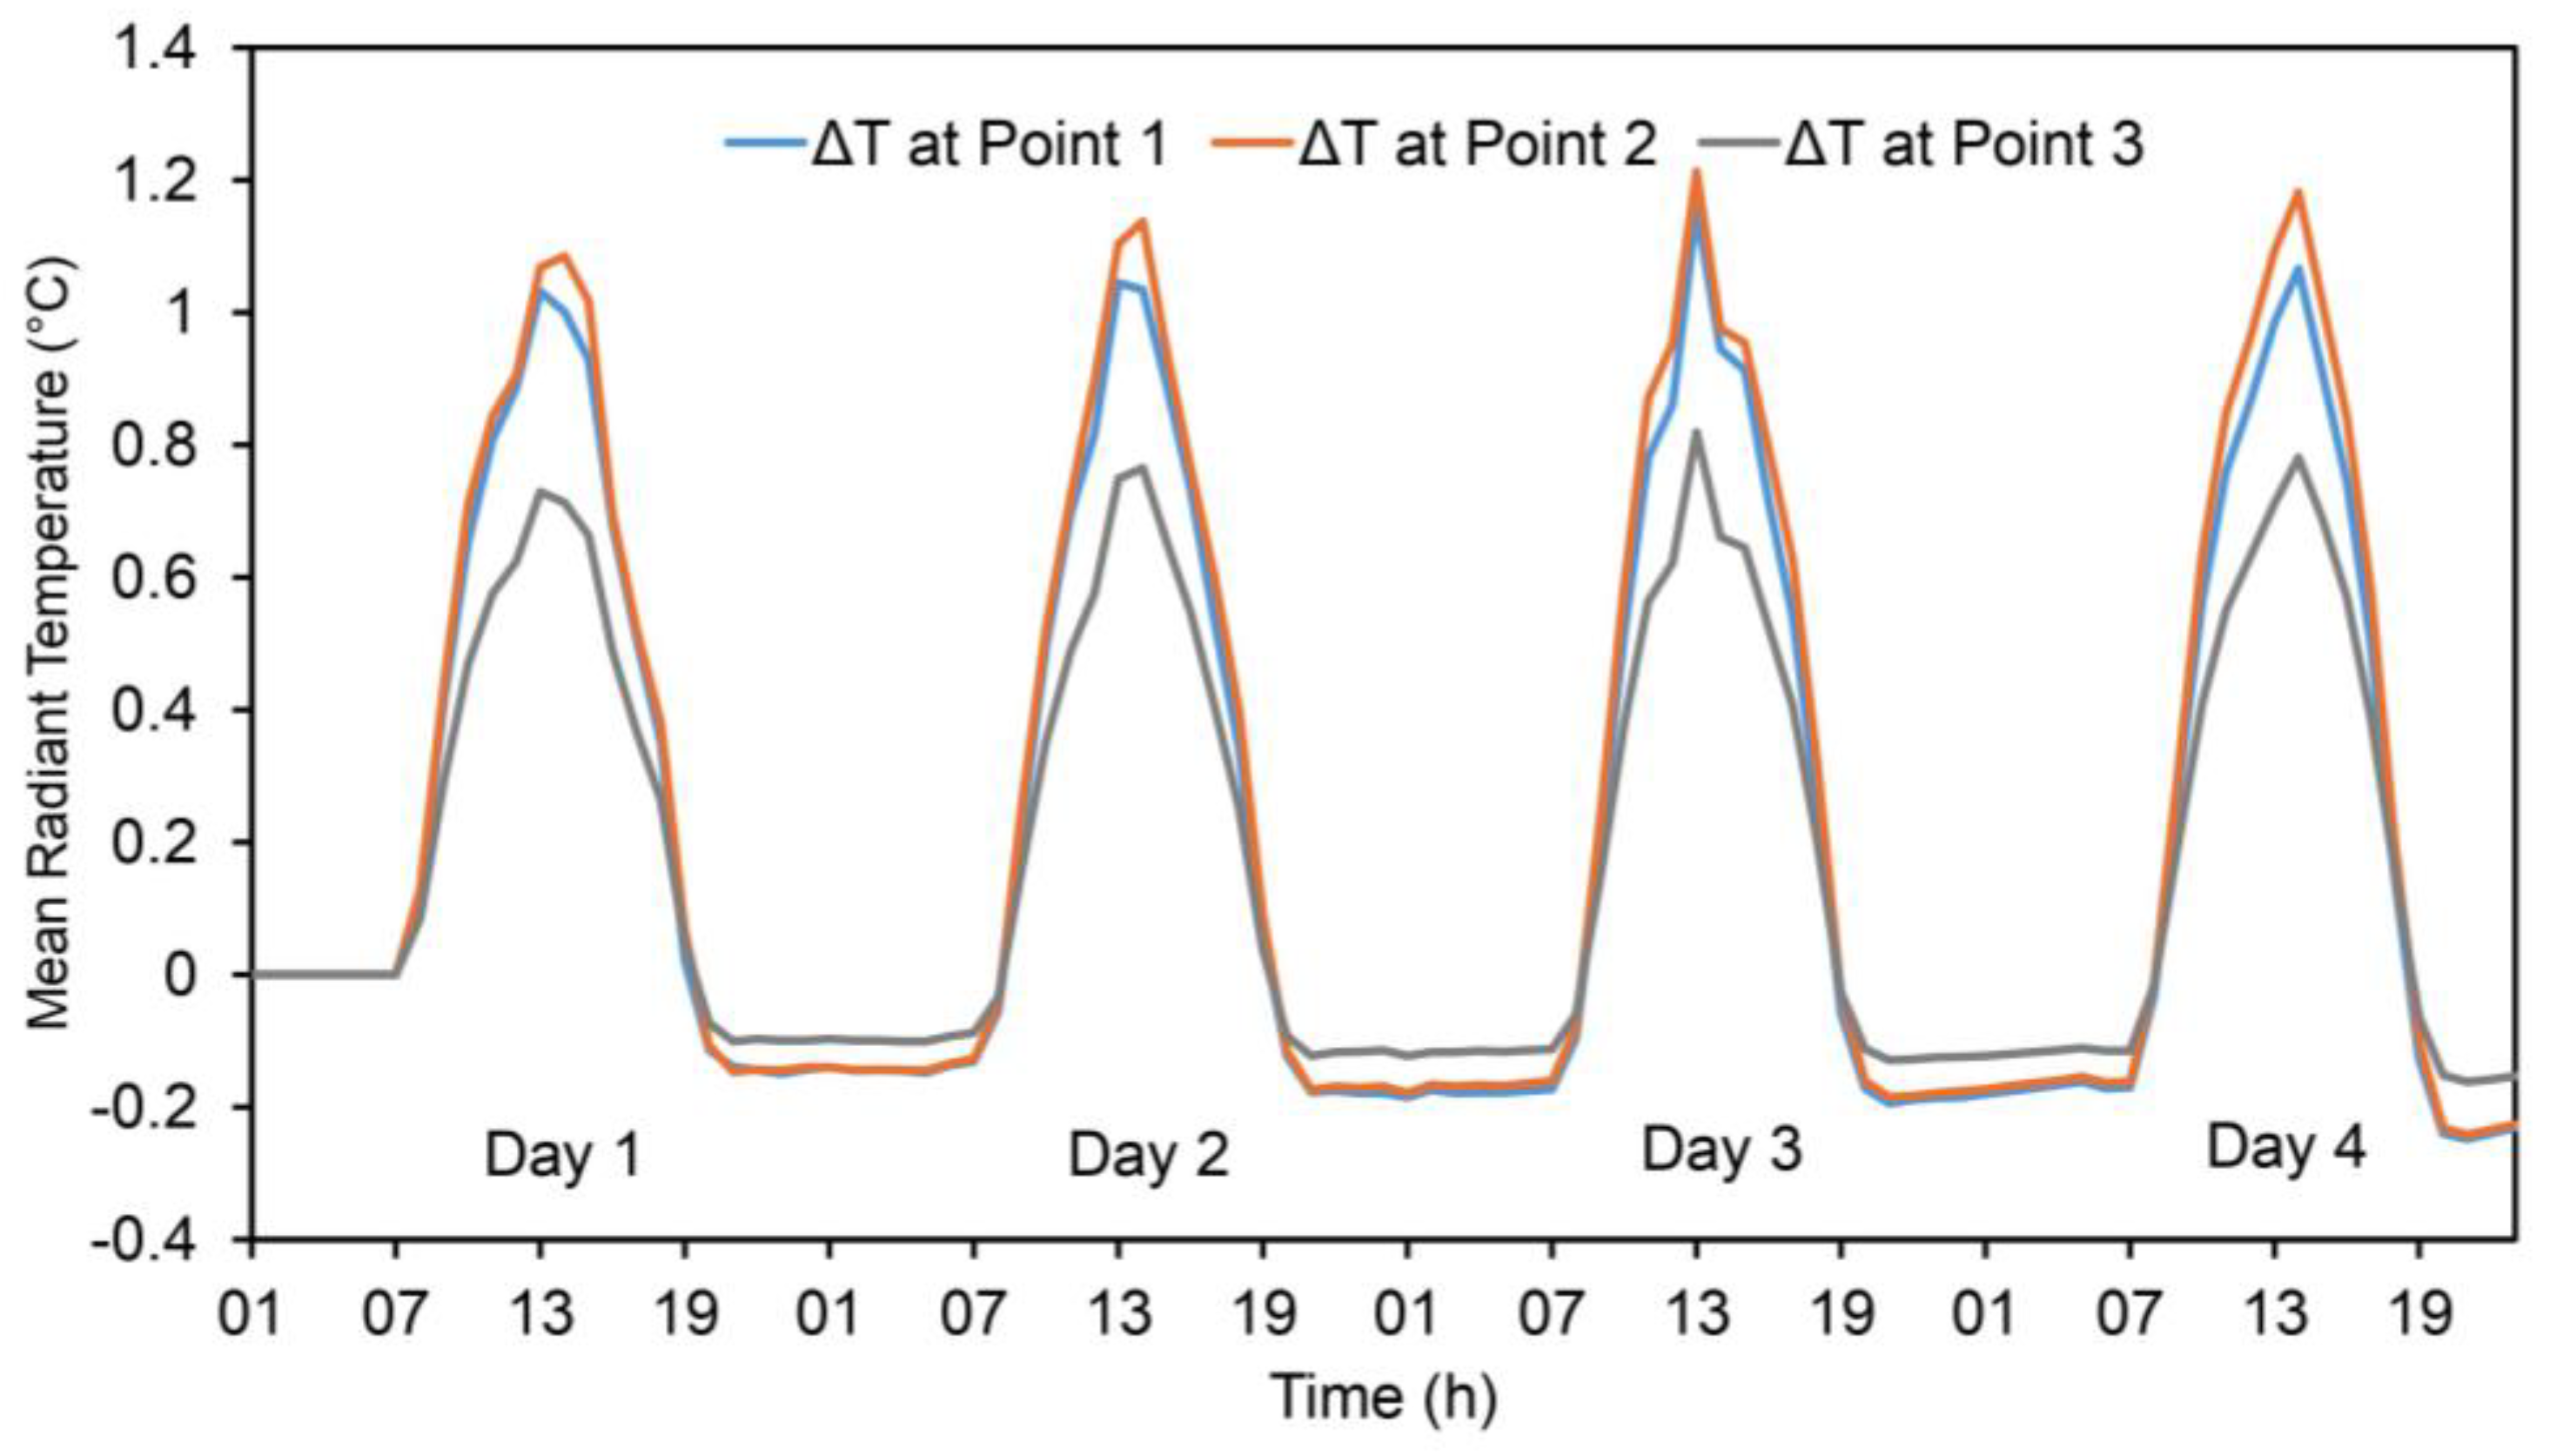
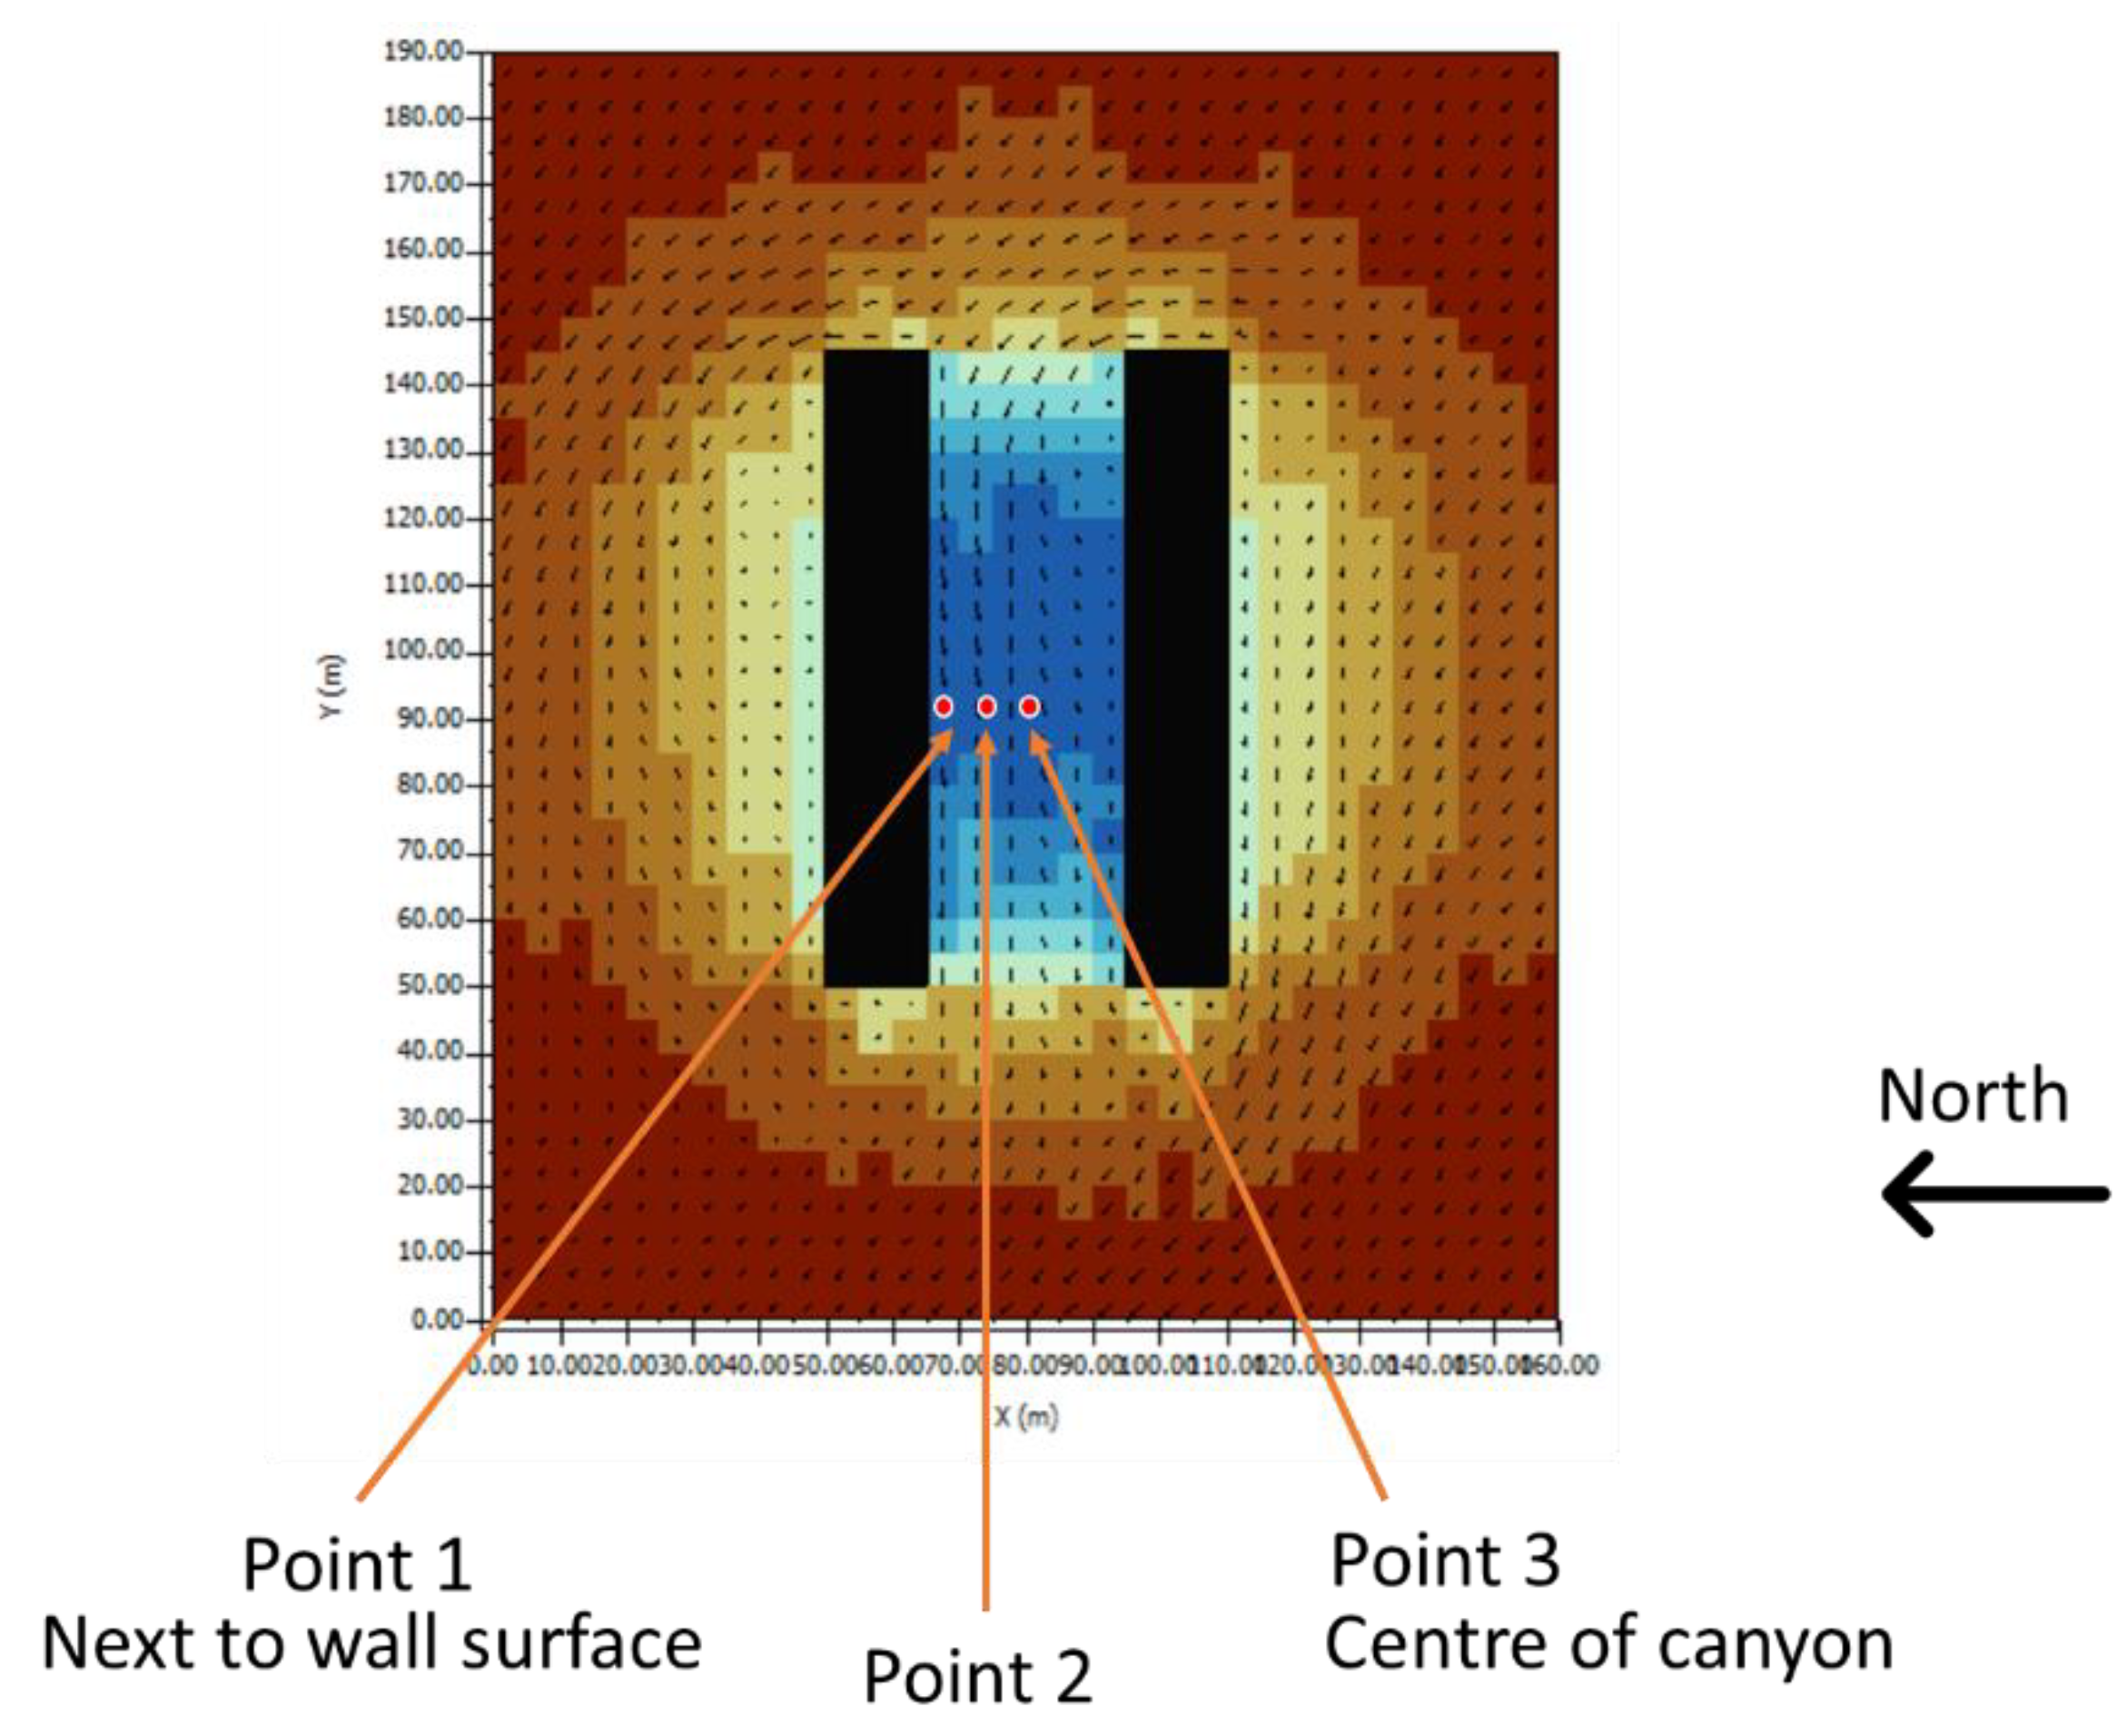
A four-day analysis for E-W canyon orientations was also conducted to determine the awareness of the diurnal and day-to-day variability of MRT under cool coating case and baseline case. Simulated result is extracted at three different grid points within the canyons – next to the wall point (point 1), between next to the wall point and the center point (point 2), and at the center point (point 3) – highlighted how material properties in urban geometry affects solar exposure and resultant MRT.
Figure 12.
ΔT (MRT) for cool and baseline case at three grid point(1.5 m above ground level) from the façade.
Figure 12.
ΔT (MRT) for cool and baseline case at three grid point(1.5 m above ground level) from the façade.
At the center of the canyon, the difference in MRT between the two materials decreases as compared to the grid (Point 1) next to façade. So, reflectance of the wall affects the MRT in the adjacent area which decreases as the point of considerations moves away from the façade. Interestingly, during the nighttime the impact is just the opposite. However, the difference is marginal to consider.
3.5. Future Directions
Besides several advantages and flexibility of reduced scale models for conducting various parametric experiments (such as, changing the surface reflectance and canyon orientations), our study couldn’t investigate into any possible air temperature difference between the two canyons. The focus on the set of experiments presented in this paper has been on the globe temperature as well as the surface temperature comparison between the low and high reflective surfaces. However, it is proposed in our future studies that a few mathematical thermal models are combined with these scaled model results to investigate further into the convective heat transfer, and consequent canyon air temperature along with surface temperature, based on the scale similarity theory. It is also hypothesised that the variation in canyon air temperature in the scaled model would be affected mainly due to the change in thermal flow field and the rate of surface heat transfer from the canyon facing surfaces.
5. Conclusions
This study discusses design and development of the laboratory test setup for studying microclimate using scale models. Solar radiation, ambient temperature, wind conditions and building material properties are identified as prime in the development of scale model test setup. Furthermore, outdoor experiments using 1:100 reduced physical scale models were conducted to investigate the effect of building surface reflectance properties on microclimate temperatures. Globe temperature (GT) was chosen as a primary indicator for studying radiation interactions in the street canyon. The temporal difference in globe temperature monitored inside the low solar reflective and high solar reflective canyon of the scale model were presented for three parameters, namely globe diameter, surface reflectance of wall and street surfaces and the solar orientation. It is observed that although the surface temperatures are lower with high albedo compared to that with low albedo, GT in the canyon is higher with high albedo during daytime, which could be due to dominance in the shortwave reflection. However, for hours after sun set, GT becomes higher (up to 1°C) in the case of low solar reflective albedo compared to high solar reflective canyon. It is also noted from this study that the area of the surrounding surfaces and the view factor made with the globe thermometer has significance in the GT values observed.
Author Contributions
Conceptualization, E.V.S.K.K.D; methodology, E.V.S.K.K.D, S.S, K.T.Z. and M.P.W; validation, E.V.S.K.K.D, S.S, K.T.Z. and M.P.W.; formal analysis, E.V.S.K.K.D, S.S, and K.T.Z.; investigation, E.V.S.K.K.D, S.S, K.T.Z. and M.P.W.; resources, E.V.S.K.K.D, S.S, K.T.Z. and M.P.W; data curation, E.V.S.K.K.D, S.S; writing—original draft preparation, E.V.S.K.K.D, S.S; writing—review and editing, K.T.Z.; supervision, K.T.Z. and M.P.W; project administration, M.P.W.; funding acquisition, M.P.W. All authors have read and agreed to the published version of the manuscript.
Funding
This research was funded by Ministry of National Development and the National Research Foundation, Prime Minister’s Office, Singapore, under the Land and Liveability National Innovation Challenge (L2 NIC) Research Programme (L2 NIC Award No L2NICCFP2-2015-4). Any opinions, findings and conclusions or recommendations expressed in this material are those of the author (s) and do not reflect the views of the Singapore Ministry of National Development and National Research Foundation, Prime Minister’s Office, Singapore. Additionally, this research is also financially supported by the Faculty Fund and Research Development Fund from Northumbria University, Newcastle upon Tyne, UK.
Conflicts of Interest
The authors declare no conflict of interest.
Abbreviations
MRT- Mean radiant temperature
GT-Globe temperature
UHI-Urban heat island
References
- Imbabi, M.S.-E. Scale modelling of the built environment. Energy and buildings 1991, 17, 7–12. [Google Scholar] [CrossRef]
- Lirola, J.M.; Castañeda, E.; Lauret, B.; Khayet, M. A review on experimental research using scale models for buildings: Application and methodologies. Energy and Buildings 2017, 142, 72–110. [Google Scholar] [CrossRef]
- Lam, K.M.; Tam, P.W. State-of-the-art Wind Tunnel Modelling for Building Aerodynamics. HKIE Transactions 1996, 3, 17–26. [Google Scholar] [CrossRef]
- Syafii, N.I.; Ichinose, M.; Kumakura, E.; Jusuf, S.K.; Chigusa, K.; Wong, N.H. Thermal environment assessment around bodies of water in urban canyons: A scale model study. Sustainable cities and society 2017, 34, 79–89. [Google Scholar] [CrossRef]
- Kanda, M. Progress in the scale modeling of urban climate. Theoretical and Applied Climatology 2006, 84, 23–33. [Google Scholar] [CrossRef]
- Sharma, A.; Wuebbles, D.J.; Kotamarthi, R. The need for urban-resolving climate modeling across scales. AGU Advances 2021, 2, e2020AV000271. [Google Scholar] [CrossRef]
- Karlický, J.; Huszár, P.; Halenka, T.; Belda, M.; Žák, M.; Pišoft, P.; Mikšovský, J. Multi-model comparison of urban heat island modelling approaches. Atmospheric Chemistry and Physics 2018, 18, 10655–10674. [Google Scholar] [CrossRef]
- Luo, X.; Peng, Y. Scale effects of the relationships between urban heat islands and impact factors based on a geographically-weighted regression model. Remote Sensing 2016, 8, 760. [Google Scholar] [CrossRef]
- Trane, M.; Giovanardi, M.; Pejovic, A.; Pollo, R. Overview on urban climate and microclimate modeling tools and their role to achieve the Sustainable Development Goals. In Architecture and Design for Industry 4.0: Theory and Practice; Springer: 2023; pp. 247-267.
- Tan, C.L.; Wong, N.H.; Jusuf, S.K. Outdoor mean radiant temperature estimation in the tropical urban environment. Building and Environment 2013, 64, 118–129. [Google Scholar] [CrossRef]
- Guo, H.; Aviv, D.; Loyola, M.; Teitelbaum, E.; Houchois, N.; Meggers, F. On the understanding of the mean radiant temperature within both the indoor and outdoor environment, a critical review. Renewable and Sustainable Energy Reviews 2020, 117, 109207. [Google Scholar] [CrossRef]
- Bedford, T.; Warner, C. The globe thermometer in studies of heating and ventilation. Epidemiology & Infection 1934, 34, 458–473. [Google Scholar] [CrossRef] [PubMed]
- Aparicio, P.; Salmerón, J.M.; Ruiz, Á.; Sánchez, F.J.; Brotas, L. The globe thermometer in comfort and environmental studies in buildings. Revista de la Construcción. Journal of Construction 2016, 15, 57–66. [Google Scholar] [CrossRef]
- Oliveira, A.V.M.; Raimundo, A.M.; Gaspar, A.R.; Quintela, D.A. Globe temperature and its measurement: Requirements and limitations. Annals of Work Exposures and Health 2019, 63, 743–758. [Google Scholar] [CrossRef] [PubMed]
- Kuehn, L.; Stubbs, R.; Weaver, R. Theory of the globe thermometer. Journal of applied physiology 1970, 29, 750–757. [Google Scholar] [CrossRef] [PubMed]
- Banfi, A.; Tatti, A.; Ferrando, M.; Fustinoni, D.; Zanghirella, F.; Causone, F. An experimental technique based on globe thermometers for the measurement of mean radiant temperature in urban settings. Building and Environment 2022, 222, 109373. [Google Scholar] [CrossRef]
- Guo, H.; Teitelbaum, E.; Houchois, N.; Bozlar, M.; Meggers, F. Revisiting the use of globe thermometers to estimate radiant temperature in studies of heating and ventilation. Energy and Buildings 2018, 180, 83–94. [Google Scholar] [CrossRef]
- Teitelbaum, E.; Chen, K.W.; Meggers, F.; Guo, H.; Houchois, N.; Pantelic, J.; Rysanek, A. Globe thermometer free convection error potentials. Scientific reports 2020, 10, 2652. [Google Scholar] [CrossRef]
- Pearlmutter, D.; Berliner, P.; Shaviv, E. Integrated modeling of pedestrian energy exchange and thermal comfort in urban street canyons. Building and Environment 2007, 42, 2396–2409. [Google Scholar] [CrossRef]
- Kawai, T.; Kanda, M. Urban energy balance obtained from the comprehensive outdoor scale model experiment. Part I: Basic features of the surface energy balance. Journal of Applied Meteorology and Climatology 2010, 49, 1341–1359. [Google Scholar] [CrossRef]
- Bonamente, E.; Rossi, F.; Coccia, V.; Pisello, A.L.; Nicolini, A.; Castellani, B.; Cotana, F.; Filipponi, M.; Morini, E.; Santamouris, M. An energy-balanced analytic model for urban heat canyons: comparison with experimental data. Advances in building energy research 2013, 7, 222–234. [Google Scholar] [CrossRef]
- Pisello, A.L.; Piselli, C.; Cotana, F. Thermal-physics and energy performance of an innovative green roof system: The Cool-Green Roof. Solar Energy 2015, 116, 337–356. [Google Scholar] [CrossRef]
- Elnabawi, M.H.; Hamza, N.; Raveendran, R. ‘Super cool roofs’: Mitigating the UHI effect and enhancing urban thermal comfort with high albedo-coated roofs. Results in Engineering 2023, 19, 101269. [Google Scholar] [CrossRef]
- DEVS, K.K.; Wan, M.P.; Zhou, M.; Long, Y.; Ng, B.F. Impact of solar reflectance of wall and road on outdoor thermal comfort-experimental study in a street canyon setup. In Proceedings of the MATEC Web of Conferences, 2019; p. 02010. [CrossRef]
- Donthu, E.K.K.; Shashwat, S.; Zingre, K.T.; Wan, M.P. Development of a simplified cool coating thermal model for predicting street canyon air temperature. Building and Environment 2024, 251, 111207. [Google Scholar] [CrossRef]
- Forouzandeh, A. Prediction of surface temperature of building surrounding envelopes using holistic microclimate ENVI-met model. Sustainable cities and society 2021, 70, 102878. [Google Scholar] [CrossRef]
- Morini, E.; Castellani, B.; Presciutti, A.; Anderini, E.; Filipponi, M.; Nicolini, A.; Rossi, F. Experimental analysis of the effect of geometry and façade materials on urban district’s equivalent albedo. Sustainability 2017, 9, 1245. [Google Scholar] [CrossRef]
|
Disclaimer/Publisher’s Note: The statements, opinions and data contained in all publications are solely those of the individual author(s) and contributor(s) and not of MDPI and/or the editor(s). MDPI and/or the editor(s) disclaim responsibility for any injury to people or property resulting from any ideas, methods, instructions or products referred to in the content. |
© 2024 by the authors. Licensee MDPI, Basel, Switzerland. This article is an open access article distributed under the terms and conditions of the Creative Commons Attribution (CC BY) license (http://creativecommons.org/licenses/by/4.0/).
