1. INTRODUCTION
Concrete use has increased in the last decade, causing an increase in fine aggregate and cement usage and impacting the environment. Reusable waste materials, such as coal bottom ash (CBA), can reduce the environmental impact and CO
2 emissions caused by using considerable amounts of cement and fine aggregates [
1].
Natural aggregate usage has increased in many countries; therefore, finding a replacement for aggregate materials is essential. Researchers have recently focused on industrial residues or solid waste for concrete application [
2].
Coal-bottom ash is the primary waste from thermal power plants [
3]. India produces 30 million tons of CBA per year (4), the USA and Europe produce 14 million and 4 million tons of CBA, respectively [
3], and Malaysia produces 8.5 million tons [
5]. CBA disposal in ponds threatens the environment and human health since the harmful constituents contaminate groundwater; therefore, using CBA as a replacement in concrete mixes reduces its effect on the environment and human health [
6]. Using bottom ash as an aggregate replacement can aid the economy [
7].
The world economy is growing, along with the construction industries, leading to high construction and virgin material consumption. Concrete is the construction industry’s primary production, and it needs raw materials to supply the continuous need for cement and aggregates; therefore, replacing natural materials with CBA will aid in maintaining the growing world economy (7, 8).
CBA can be used as a fine aggregate in concrete production due to its high shear strength and low compressibility, making it an ideal material for infrastructure design and construction [
9]. Design engineers use bottom ash to improve materials due to its high permeability and grain size distribution, making it an economical and robust engineering material [
10]. Bottom ash helps reduce natural resource consumption and maintain the future construction industry’s economy.
The primary CBA constituents are silica, alumina, and iron, including a small amount of calcium and magnesium sulfate. CBA’s particle size and appearance resemble river sand, making it preferable for use as a fine aggregate
(11-16). Recent studies indicate that CBA has angular, irregular, porous, and rough surface texture, and its particle size distribution ranges from fine gravel to fine sand
(Figure 1). CBA is brittle and lighter than natural sand, and its specific gravity varies from 1.39 to 2.33 [
2].
Determining a concrete mix’s fresh properties includes measuring slump, air content, and unit weight. Substituting natural aggregates with 100% CBA decreases the slump value by up to 100 mm due to its complex shape and rougher surface [
3]. Friction is greater on a rough surface such as CBA, delaying the flow characteristics of its fresh properties [
14]. CBA’s slump value decreases with increasing CBA substitution, from 10% up to 40%; however, replacing 100% of the aggregates with CBA significantly reduces the mix’s slump value compared to the control mix. A replacement of 10%-40% allows for better workability [
12].
A CBA concrete mix’s unit weight decreases when CBA replaces fine aggregate because of the ash’s lower unit weight and porous structure. The other reason for the decrease in CBA concrete mix density is the higher water demand, which creates several large pores; therefore, the unit weight decreases when the CBA replacement percentage increases [
17].
Maliki et al. [
12] substituted fine aggregates with CBA, from 0% as the control to as much as 100% using regular increments of 10%. The results revealed that the optimum CBA content was 60%, with 7—and 28-day curing periods.
This study’s primary goal was to test the hypothesis that there is an optimal CBA fine aggregate replacement content, which can be determined by comparing it to pure Portland cement-based concrete, used as a control based on compressive strength.
2. METHODOLOGY
Experimental Plan
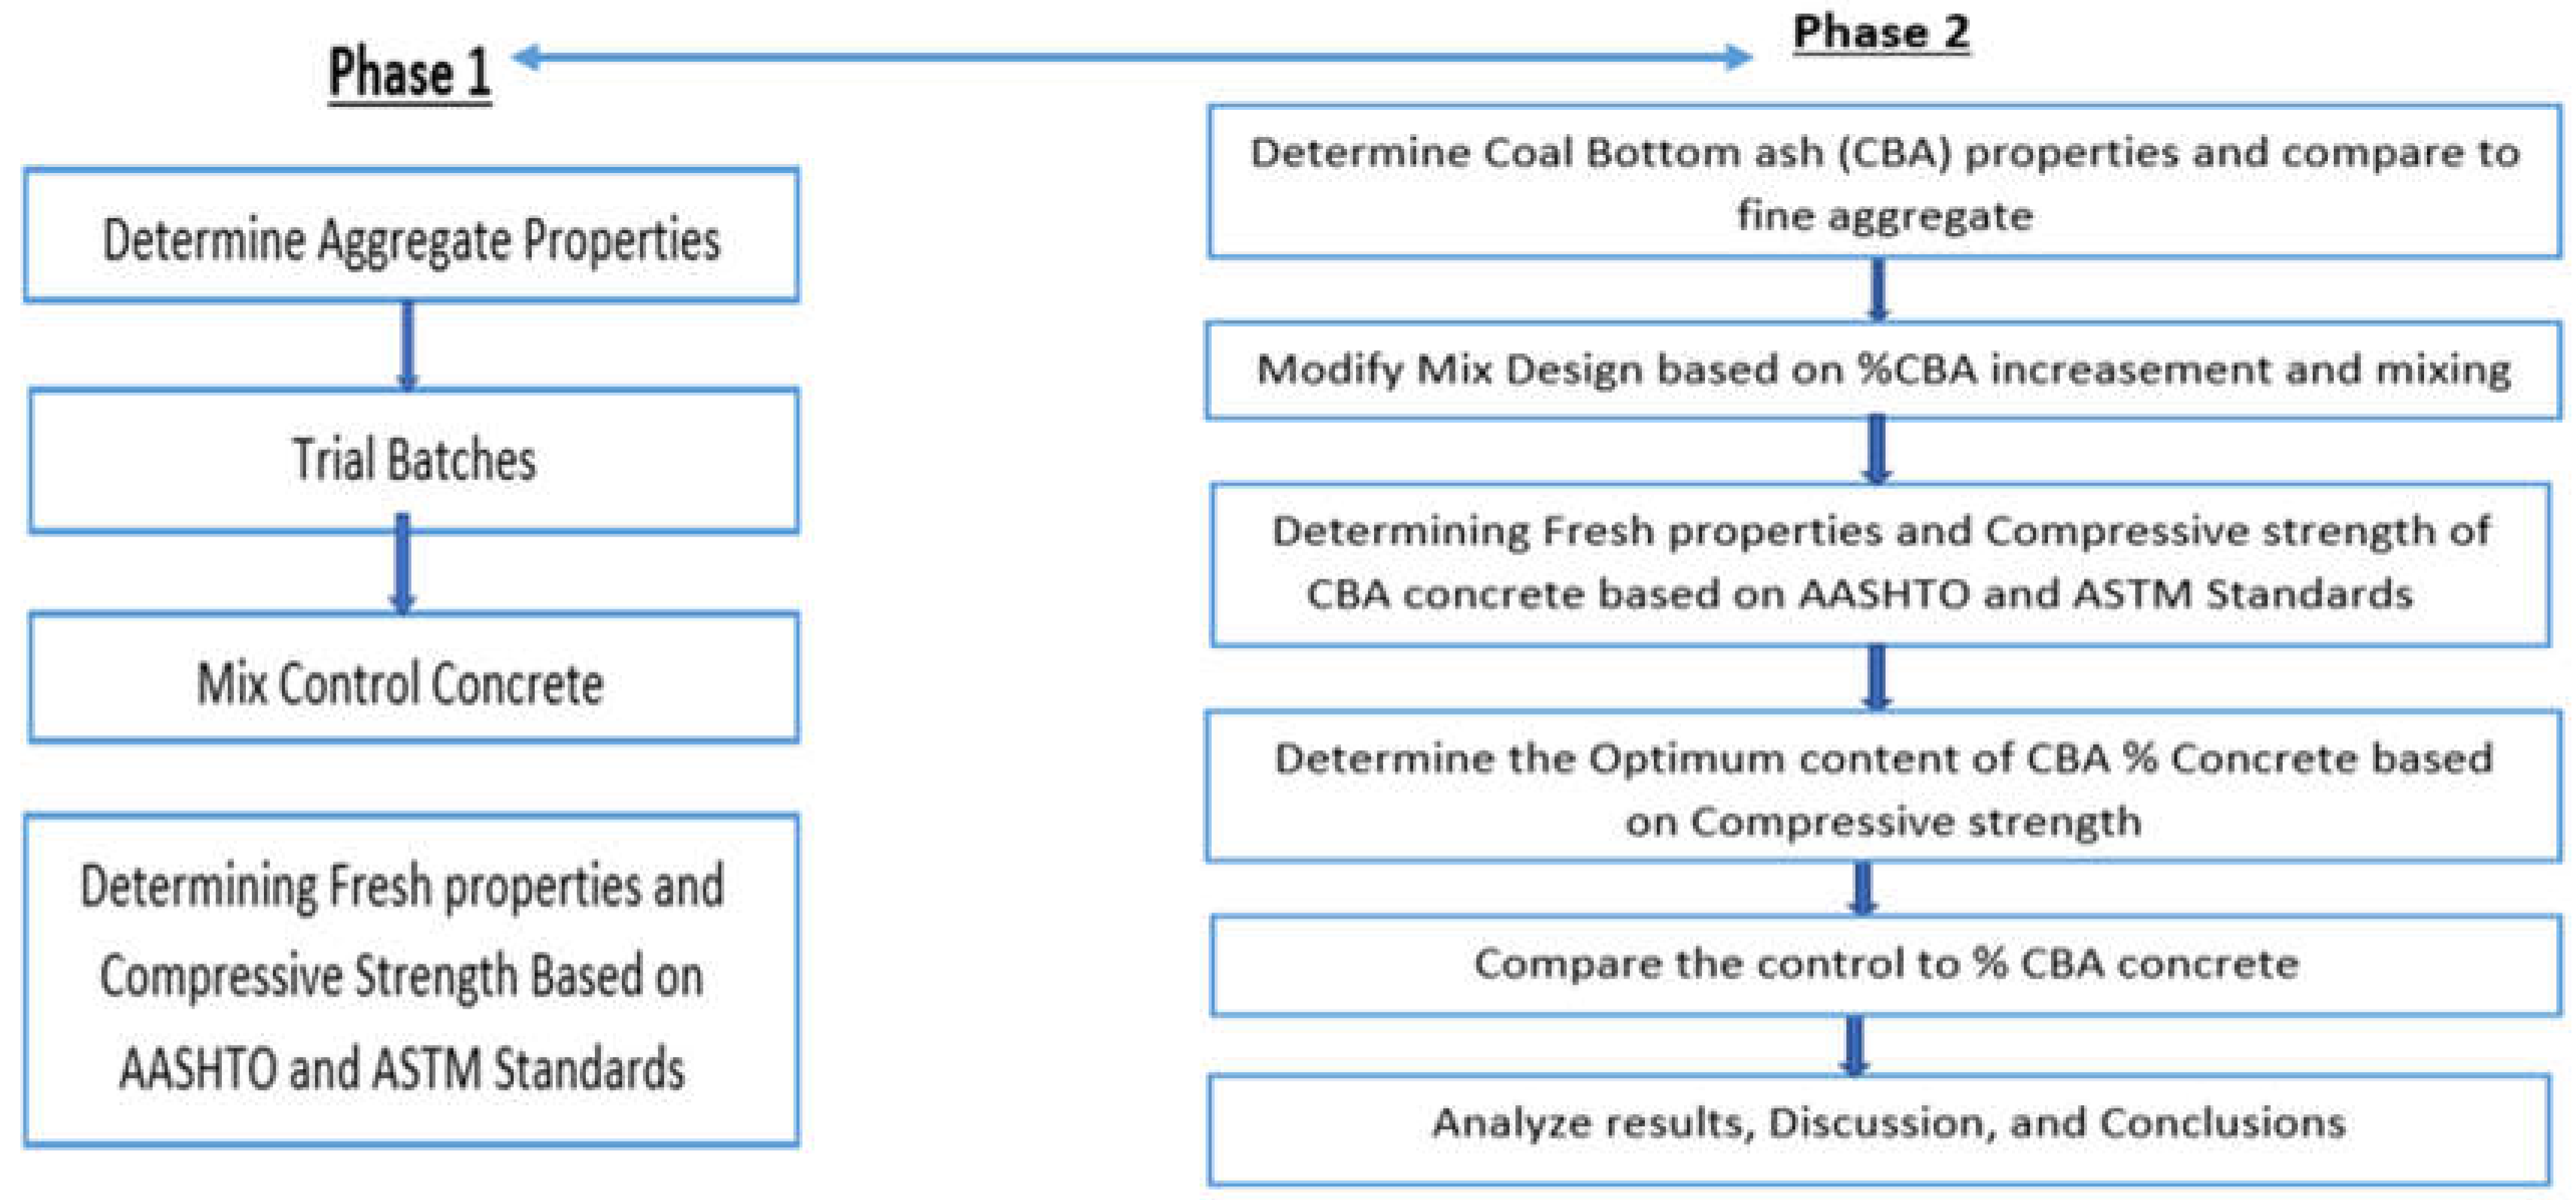
The experimental plan includes preparing and testing ordinary Portland cement-based concrete, then using it as the control to compare to CBA-based concrete. The optimum amount of CBA replacement was determined by comparing the compressive strength of the different combinations to the control. Fine aggregates were replaced with CBA, using 10% increments to reach the optimum threshold.
Figure 2 illustrates the experimental steps used to conduct the research.
Material Source and Properties
The effect of CBA from the Coal Creek Station power plant was studied using two projects (Strata and Aggregate Industries). The suppliers determined the aggregate properties. The research team also determined the ingredient properties based on AASHTO and ASTM standards before the experiments began. They were compared to the supplier’s ingredient properties for fine and coarse aggregates.
Table 1 shows the CBA and aggregate properties used for concrete mix design. The CBA’s fineness modulus value was lower than the fine aggregate; however, the CBA’s absorption capacity was higher than the fine aggregate.
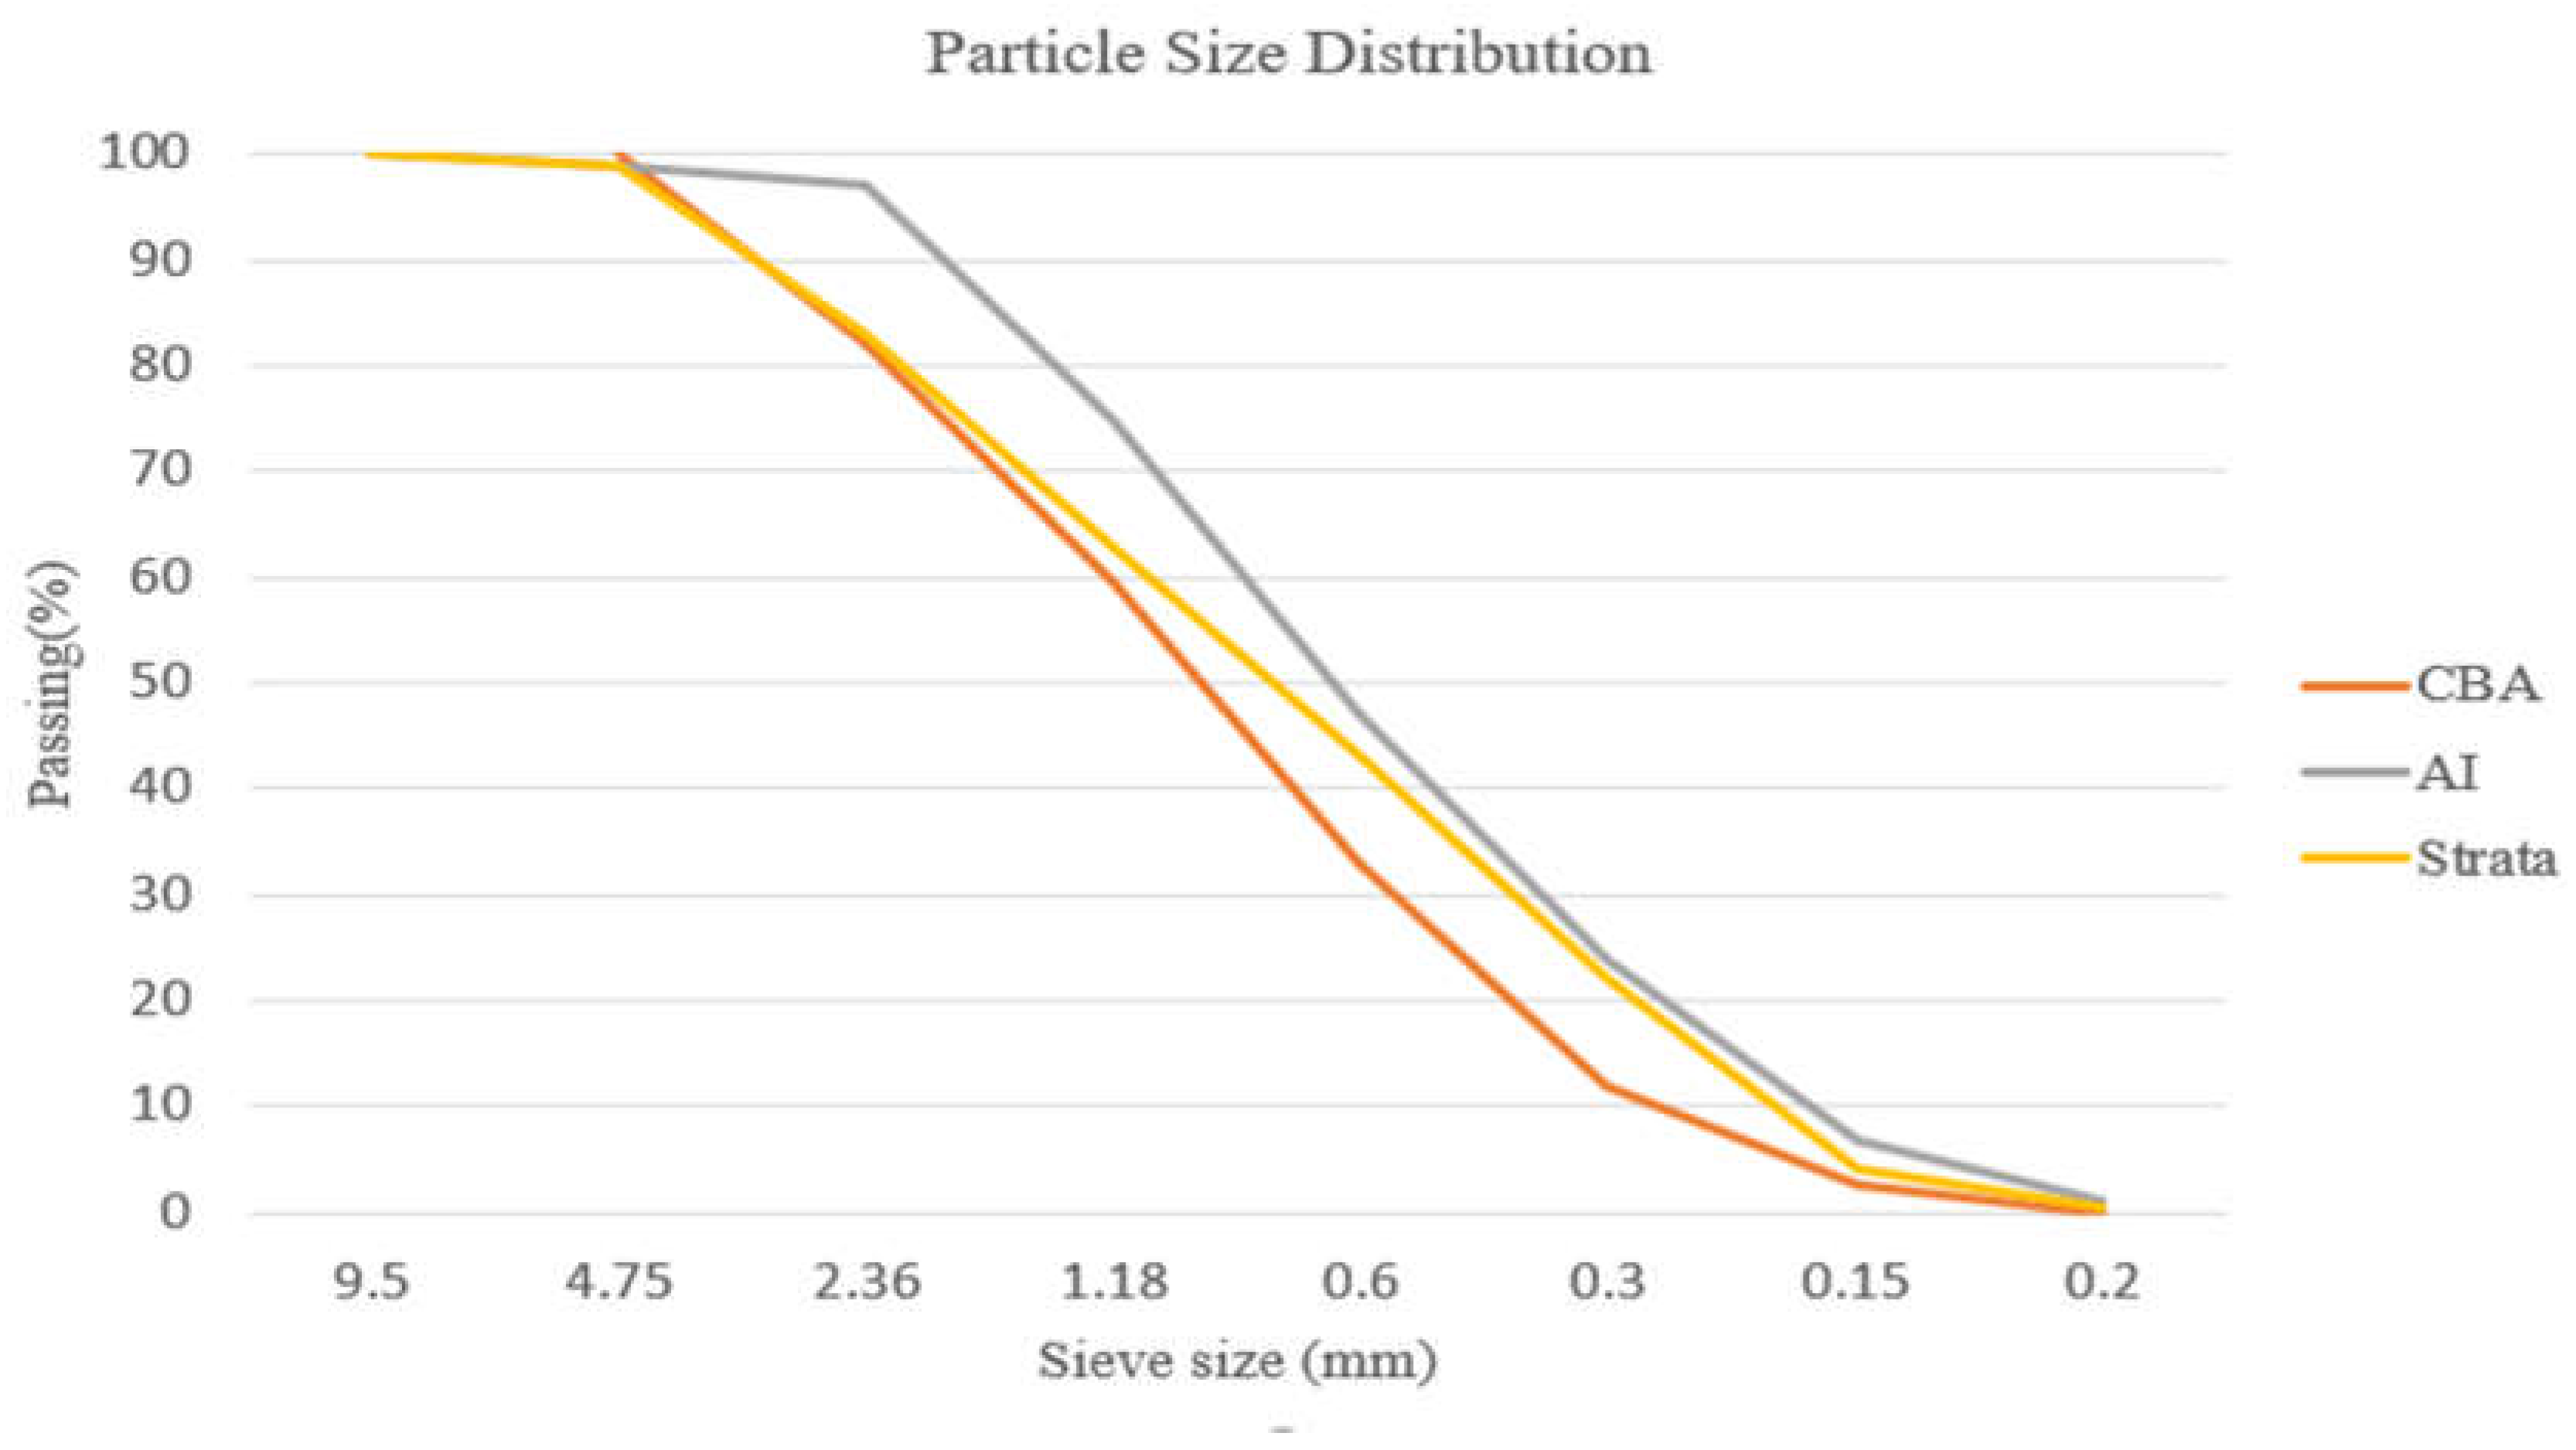
The CBA was sieved using the number 4 sieve size (4.75mm) to avoid its larger size in the mix.
Figure 3 shows CBA’s particle size distribution compared to fine aggregate.
Mix Design and Proportions
The mix design for this project was obtained from Strata and Aggregate Industries. The control mix proportion is listed in
Table 2. The proportion was modified based on various mix types. The designed mix had a compressive strength of 4,000 psi and a water-to-cement ratio (W/C) of 0.45. Based on the mix design, the expected slump values ranged from 3” to 4”. All aggregate and CBA used in the experiment were oven-dried or had the least moisture content based on the mix design provided by Strata and Aggregate Industries. A moisture correction method was used in the mix design to consider the amount of water loss of the aggregate, including the equivalent volume method for the CBA weight-obtaining method.
The mix design’s air-entrained value was 6% or 7.4 ml (about 0.25 oz)/ft3; however, after many trial batches, the content of the air-entrained value was extremely high, up to 12 %. The project team consequently decided to reduce the amount of air entrained to 3.25 ml (about 0.11 oz)/ft3 to obtain a desirable air-entrained value of 5%-7%. This discrepancy made it challenging to maintain an air content and slump value. The same procedure was followed for the Aggregate Industries control mix.
The other control mix was from Aggregate Industries. The mix design and ingredient contents are listed in
Table 3. The Strata project was used to determine the optimum CBA content; therefore, it was not necessary to start mixing from 10% CBA. The test began with 50% CBA replacement and proceeded with 60%, 70%, and 80% CBA replacement to determine the optimum amount.
3. RESULTS AND DISCUSSIONS
Strata/ Project 1
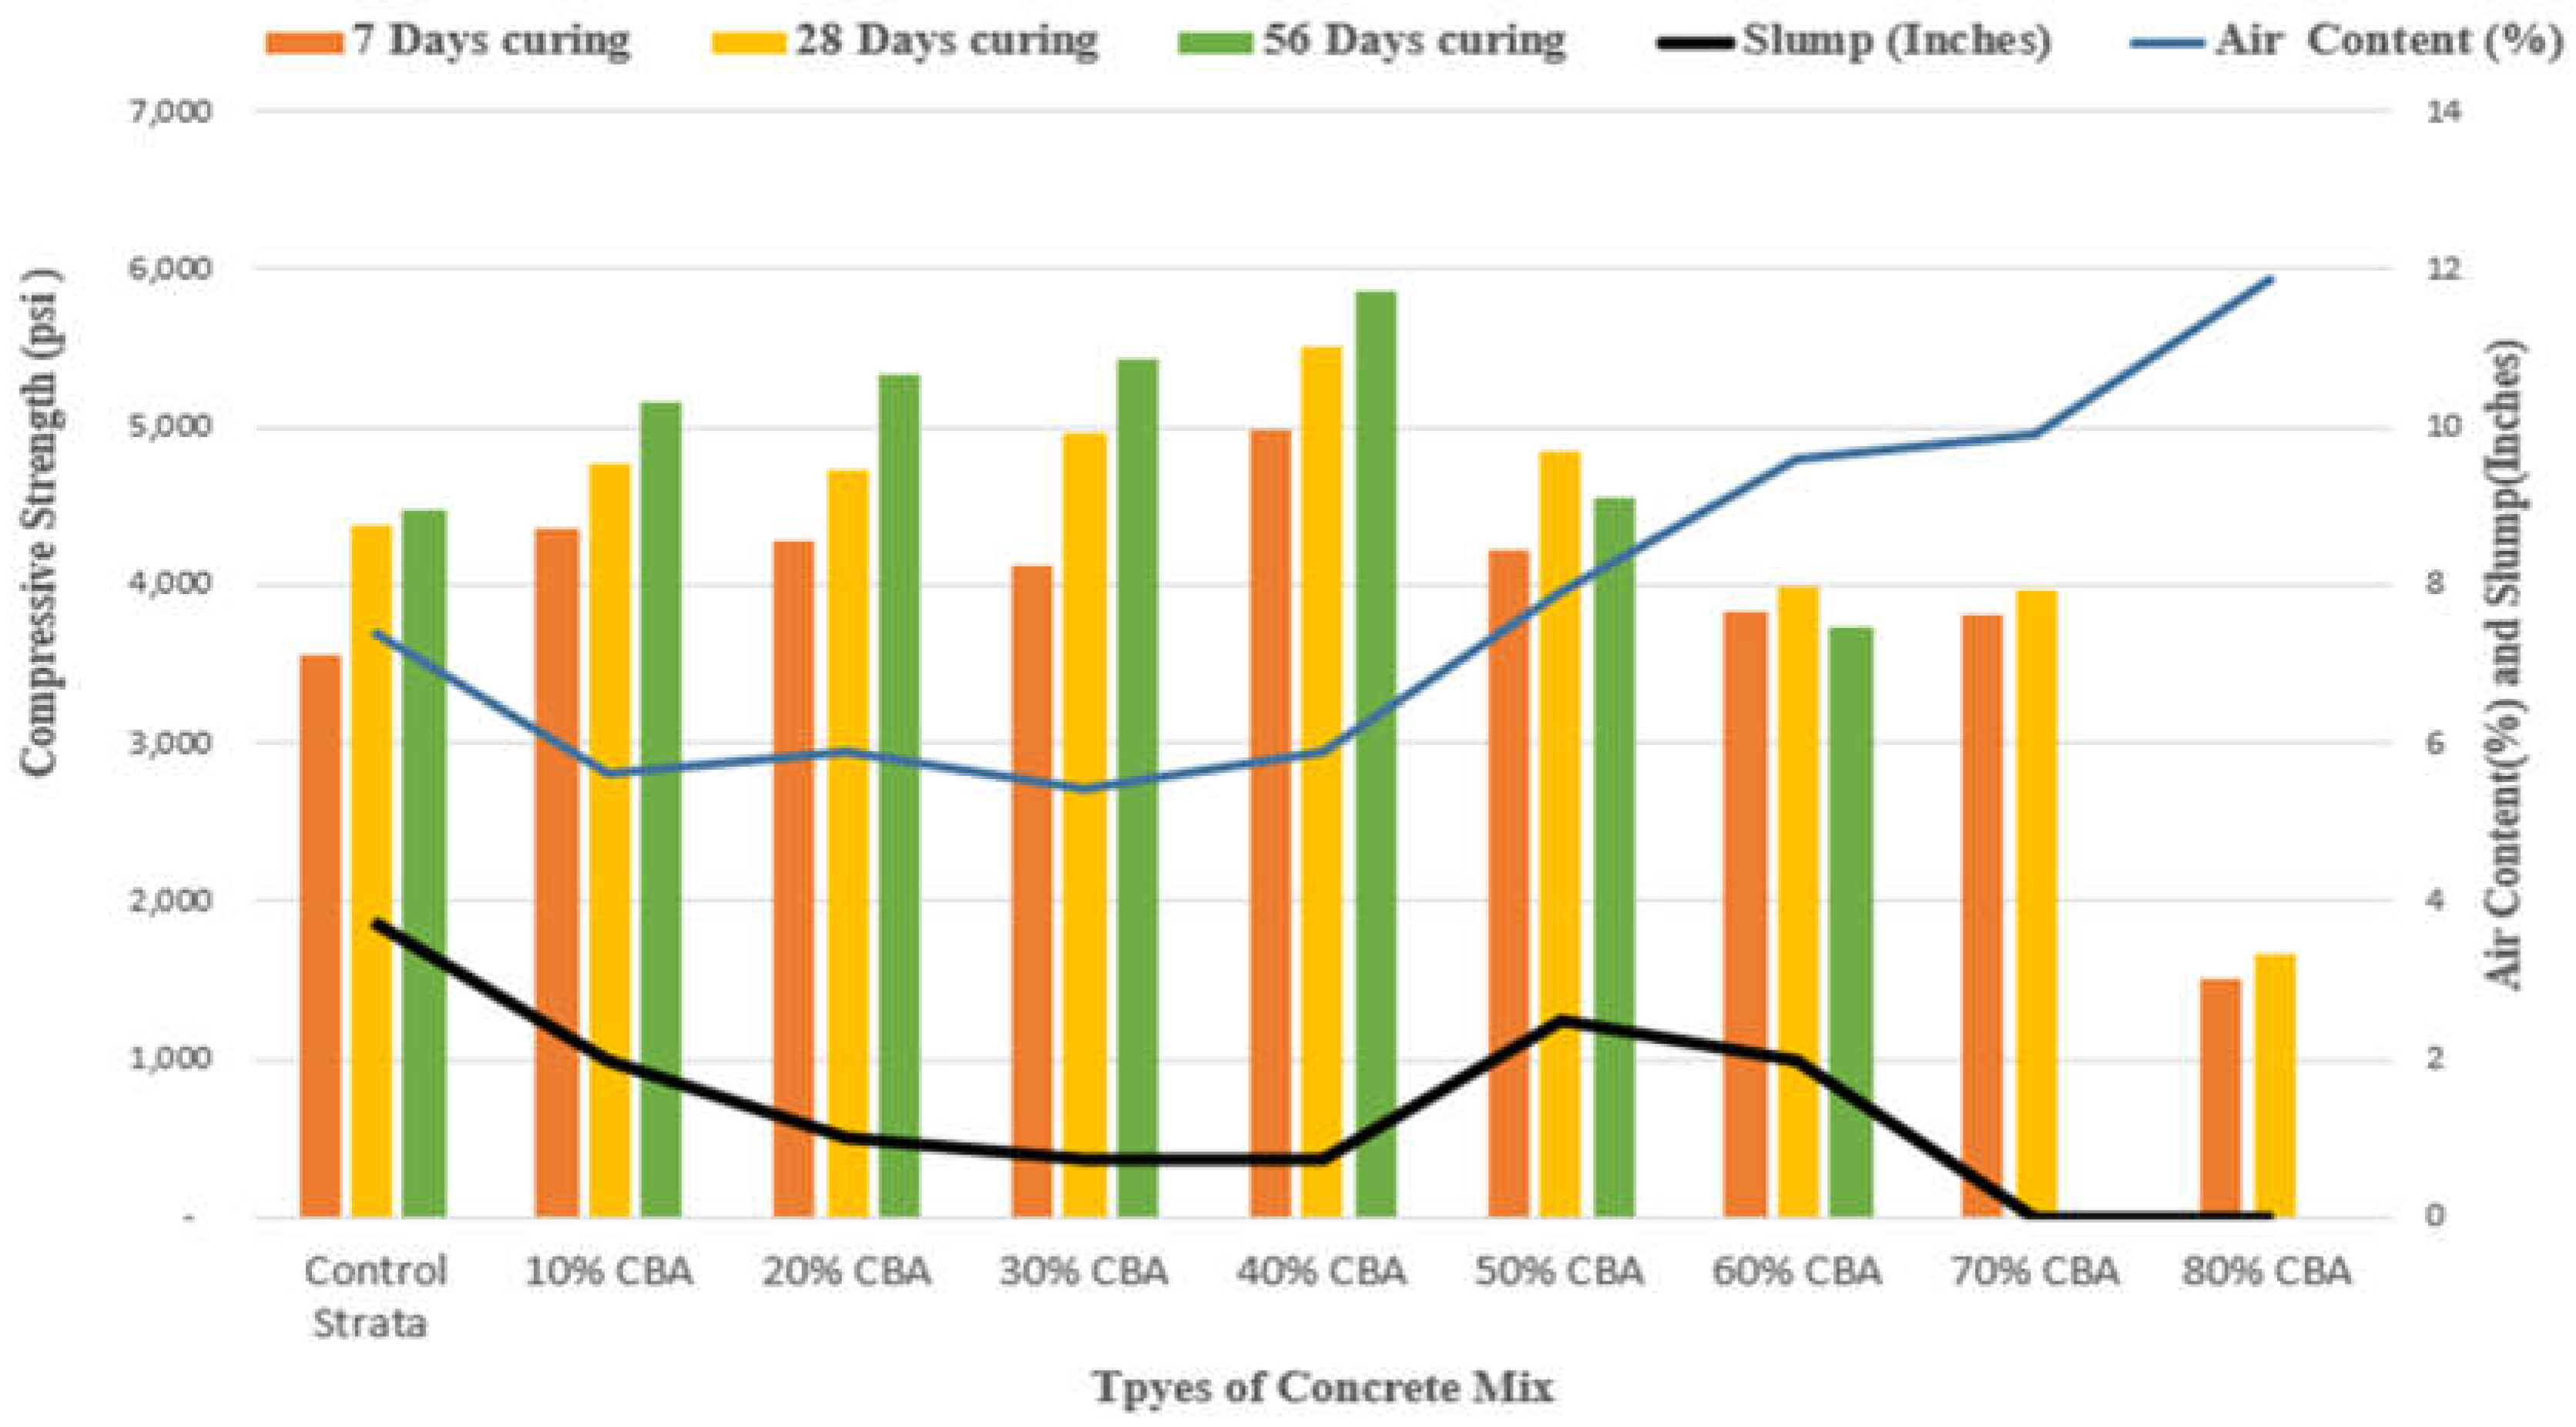
Fresh Properties: CBA is porous and has a high absorption capacity. The workability of the fine aggregate mix with CBA replacement decreased as the CBA content increased. For example, the slump value of the concrete mix decreased with an increased CBA content, from 10% to 50%. A slump value of 0.75” for the 30% CBA concrete mix significantly decreased the mix’s workability, and a further increase in CBA content yielded a 0-inch slump value; therefore, the research team decided to use a water reducer to increase the mix’s workability as the CBA content increased. About 20 ml (~ 0.68 oz)/ft
3, 35 ml (~ 1.18 oz)/ft
3, and 60 ml (~ 2.03 oz)/ ft
3 of the water reducer was used to obtain 0.7-inch, 2.5-inch, and 2-inch slump values for the 40%, 50%, and 60% CBA replacement values, respectively
(Figure 4); however, a further increase of up to 70% with 75ml (~ 2.54 oz)/ft
3 and 80% with 90ml/ ft
3 led to a zero-slump value, which is unacceptable. The research team recommends using more water reducers to obtain the desired workability and air content.
The slump value decreased with increased %CBA until it reached the optimum content of 50%CBA, possibly due to CBA’s high-water demand, and the compressive strength increased with increased CBA and decreased slump value until the Optimum content of 50% CBA (
Figure 4). The air content decreased with increased CBA content compared to the control and increased compressive strength until the optimum content of 50% CBA; further increased air content led to a decrease in compressive strength after 50%CBA (
Figure 4).
The SAM (Super Air Meter) number for the % CBA mix compared to the control was higher, possibly due to CBA’s porous behavior as the amount was increased. The air content of the % CBA concrete mix decreased with an increase in CBA content up to 40% CBA, then increased, which may have been caused by the spacing factor of the voids in the mix and CBA’s porous behavior
(Table 4).
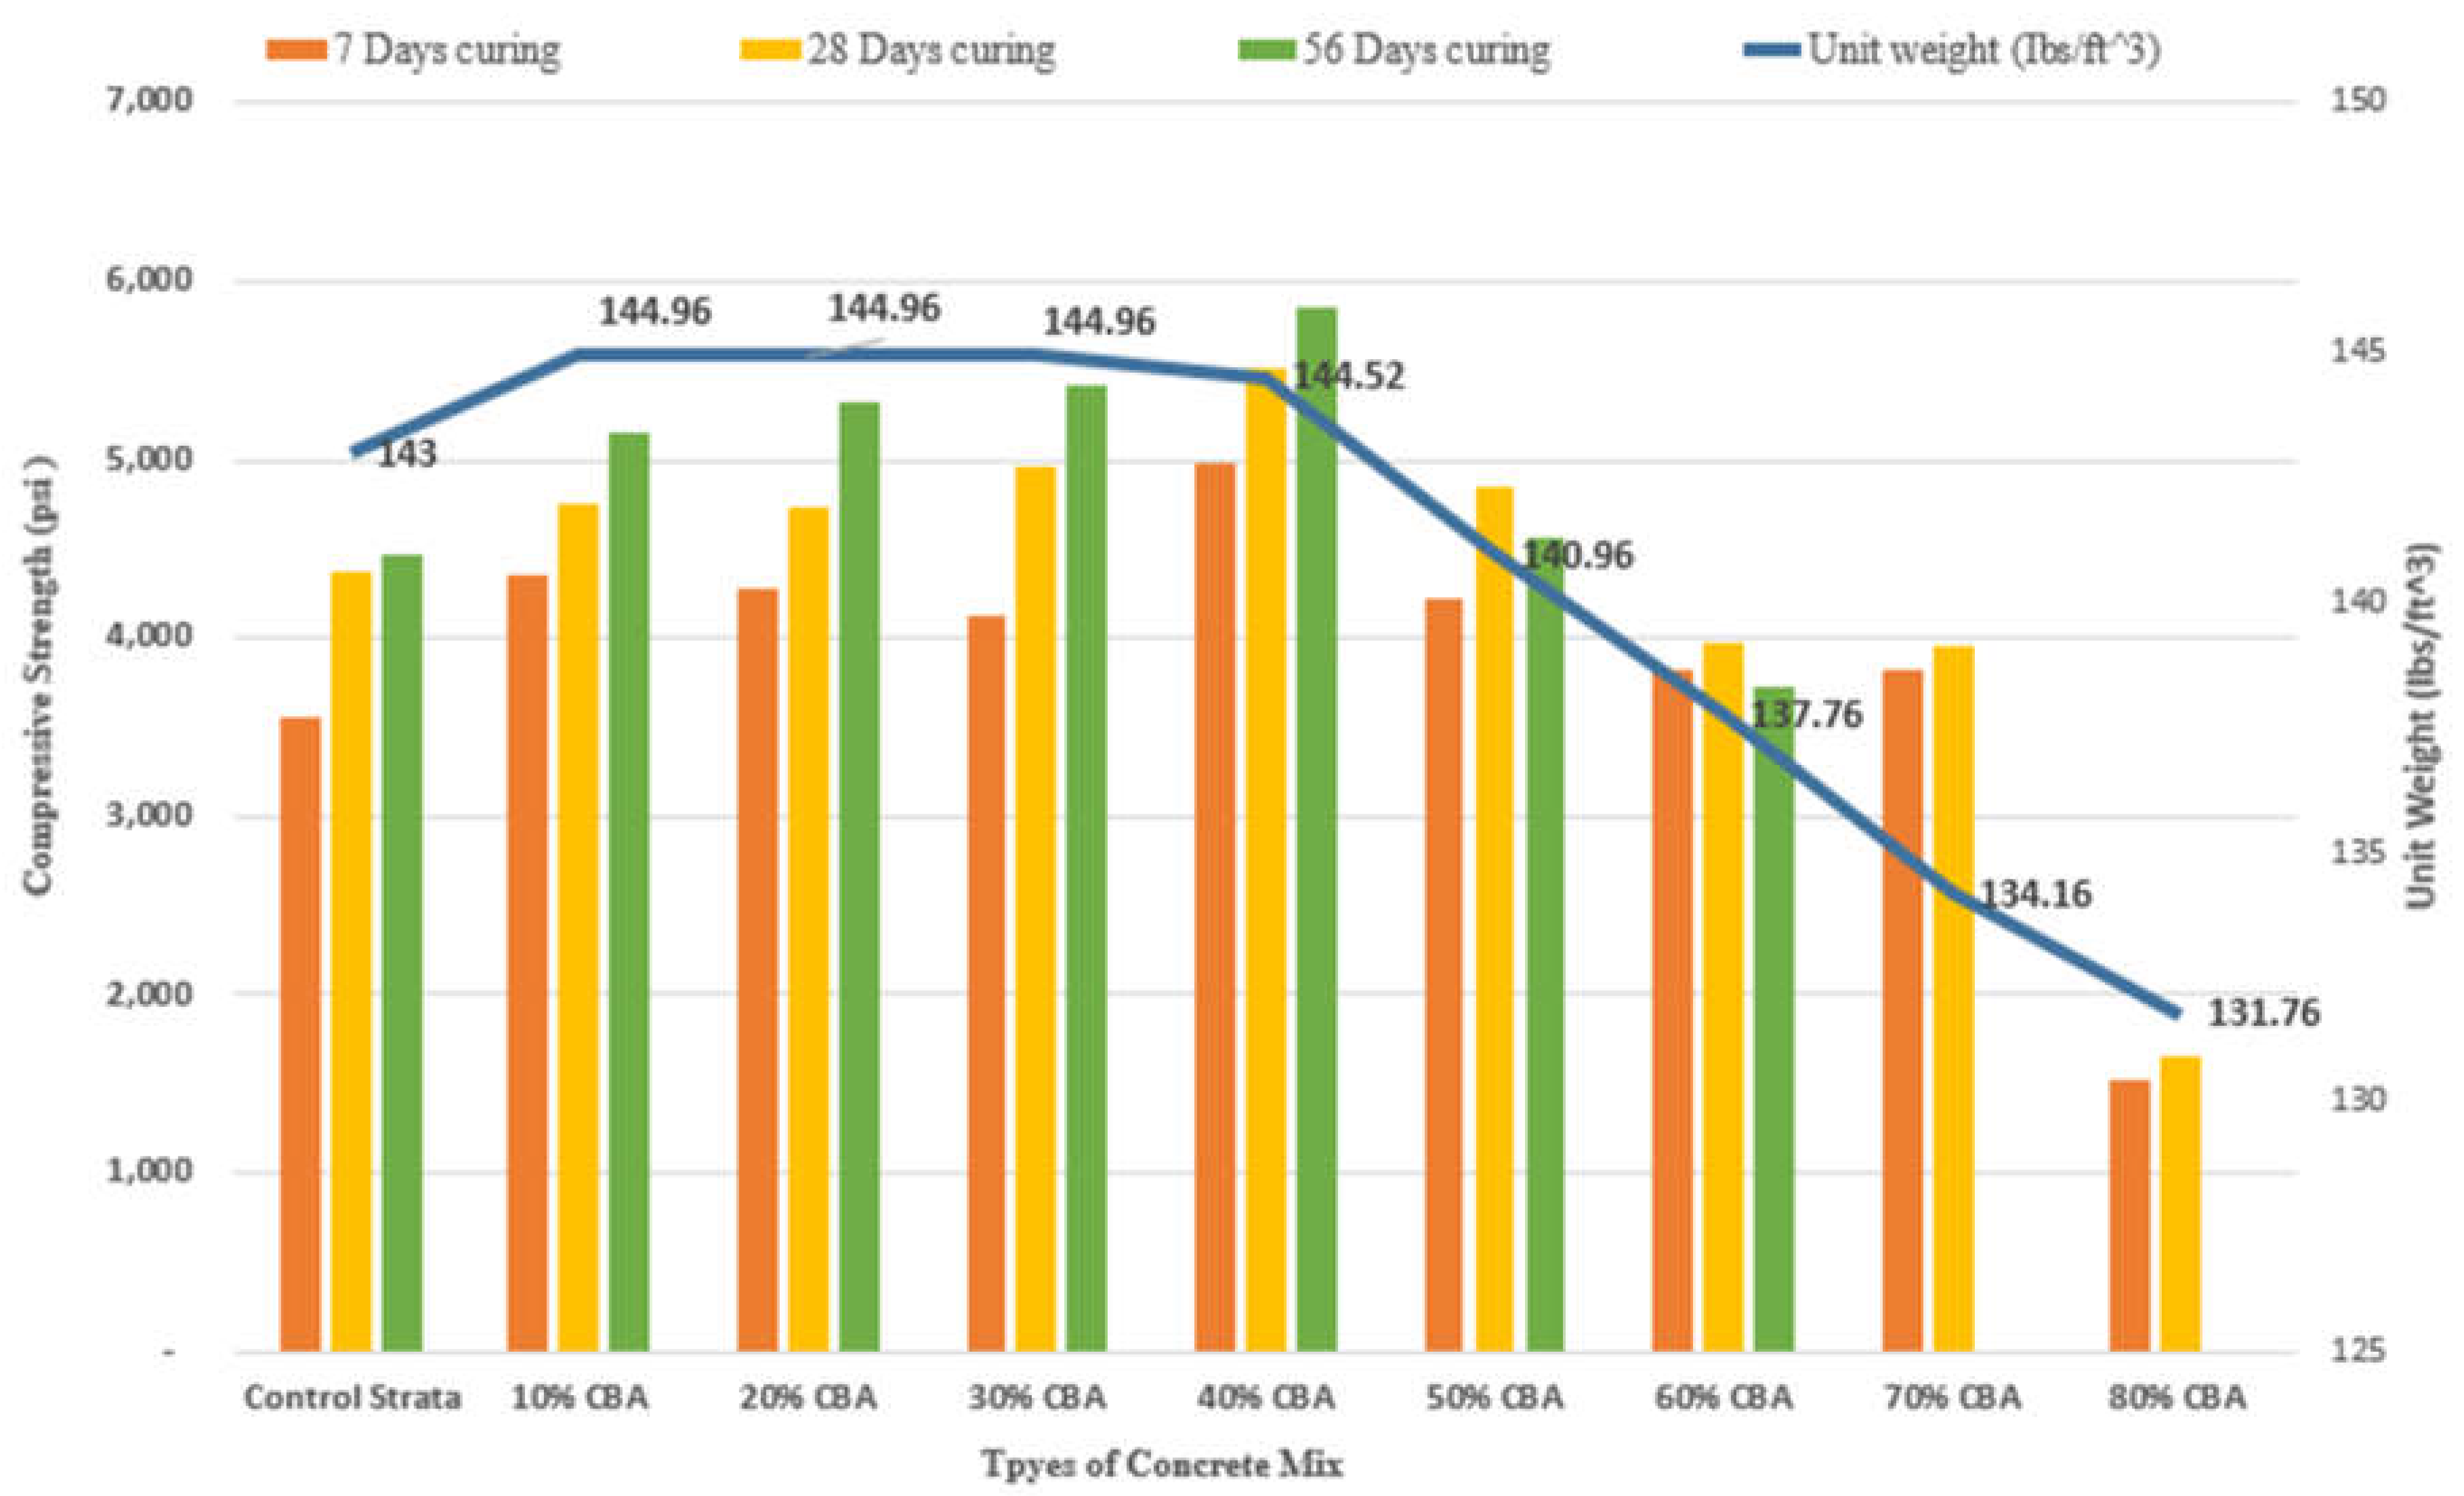
The unit weight of the Strata control mix and 50% CBA replacement were comparable; however, the rest of the CBA-containing concrete had a higher unit weight than the control, up to 40%, possibly due to CBA’s fineness properties. Increasing the % CBA decreased the unit weight of the concrete, possibly due to CBA’s higher water demand, which leads to pore formation and larger pore sizes. The optimum content, 50% CBA, had a lower unit weight than the control, which is lightweight concrete compared to concrete without CBA
(Figure 5).
Compressive Strength of %CBA and Strata Control
The compressive strength of the Strata control mix was 3,600 and 4,374 psi after 7 and 28 days of curing, respectively, and the values for the 10% CBA replacement after seven days of curing were similar to the control’s strength after 28 days of curing. The compressive strength decreased when the CBA replacement was increased from 10% to 30%; however, it still had higher compressive strength than the control after seven days of curing. The research team decided to use a water reducer after 30% CBA replacement to achieve the desired workability, which led to an increase in compressive strength with 40%, 50%, and 60% CBA replacement, reaching an optimum content of 60% at seven days of curing. The compressive strength of the control vs. the CBA concrete at seven days reveals that increased CBA replacement increases the concrete strength when the replacement is up to 40% and starts to decline after 50% replacement (Figure 5). The compressive strength increased from 30% to 40% and 50%, possibly due to adding a water reducer to increase workability. The research team created another mix of 30% CBA concrete with a water reducer to determine the effect on the compressive strength. The results indicated that a mix containing 30% replacement with an added water reducer had a compressive strength of 4,521 psi compared to 30% CBA without a water reducer, at 4,119 psi. These results must be researched further to conclude if CBA with a water reducer yields a higher compressive strength.
Comparisons of the control’s compressive strength to the CBA concrete after 28 days revealed that increasing the CBA percentage in the mix yielded an increase in concrete strength up to 40%. The values began to decline after 50% (
Figure 5). The 40% CBA mix yielded a 26 % increase in compressive strength, and the 50% CBA mix yielded a 10.7% increase after 28 days of curing. The CBA concrete’s compressive strength was higher than the Strata control’s at 7 and 28 days of curing, indicating that this replacement technique yielded acceptable results and the mix exhibited better performance.
The compressive strength of the CBA mix continued to increase after 28 days of curing, with replacement amounts of up to 40% CBA
. The 30% CBA mix’s performance surpassed the control concrete by 949 psi after 56 days, or an increase of 21.2%, indicating that the CBA concrete mix’s strength does not decrease with time. An increase of 30.9% was observed in the 40% CBA mix after 56 days of curing. The mix with the optimum CBA content, 50%, had compressive strength values of 4,216, 4,842, and 4,560 psi after 7, 28, and 56 days of curing, higher performance than the Strata control. Therefore, the results indicate that CBA increases the concrete’s compressive strength after 7, 28, and 56 days of curing until 50% CBA optimum content
(Figure 5).
Aggregate Industries /project 2
Fresh properties: The workability of the CBA mixes decreased as the % CBA increased, similar to the observations for the Strata mix, possibly due to CBA’s higher water demand. The SAM number increased with an increased % CBA, which may have been caused by the spacing factor of the voids in the mix and CBA’s porous behavior. The unit weight of the 50% CBA was comparable to the control, which was the same as the Strata project as the unit weight decreased with increases in %CBA
(Table 5), possibly due to CBA’s higher water demand, which leads to pore formation and larger pore sizes. The two projects had similar fresh and compressive strength properties, which confirms the results.
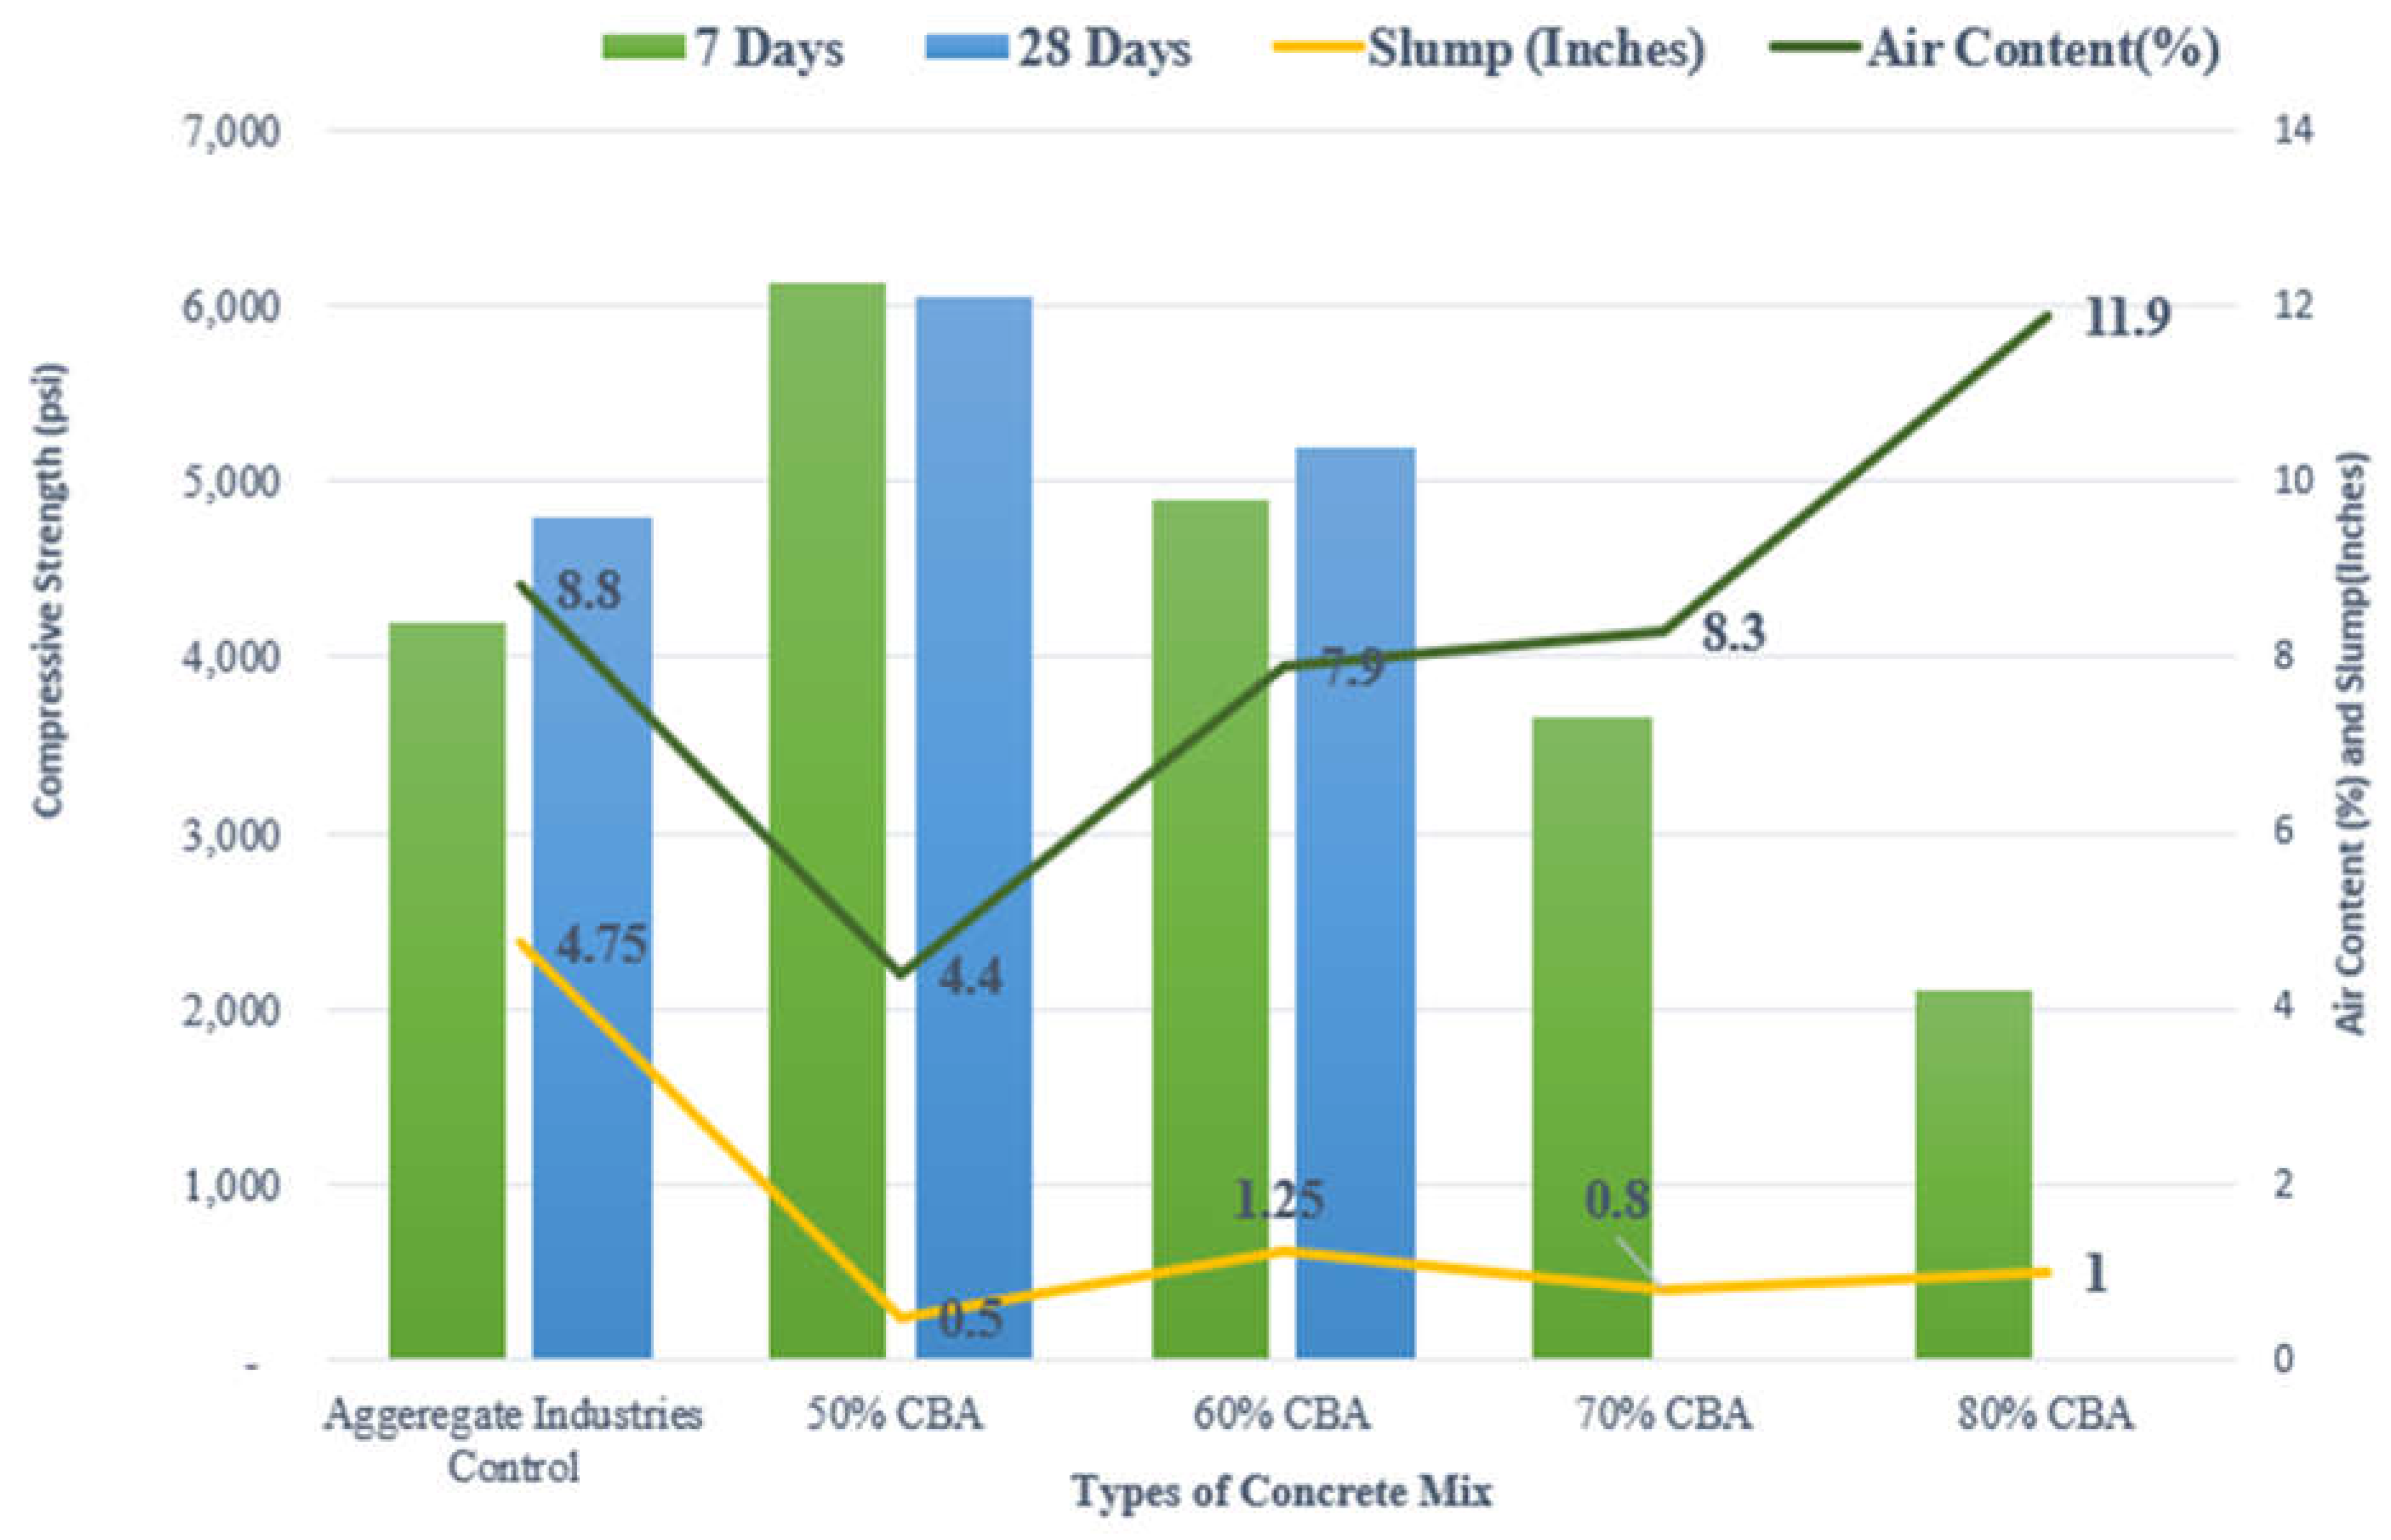
Air content and slump value decreased with an increase in CBA from Control to 50% CBA and an increase from 50% CBA to 60% CBA, and 60% CBA is the optimum content. This result confirms the strata’s findings (
Figure 6). The slump value has increased from 0.5 inches to 1.25 inches as CBA increased from 50% to 60%, and the compressive strength decreased from 6132 psi to 4898 psi, respectively
(Figure 6). The two projects showed similar trend results: when the slump value increases, the compressive strength decreases and vice versa [
18].
Compressive Strength of the % CBA and Aggregate Industries control
Compressive strength increased with decreased slump and increased CBA content up to 50% CBA, then decreased with increased air content and slump value, leading to the optimum content of 60% CBA after 28 days of curing, possibly due to CBA’s fineness and porous property
(Figure 6).
The compressive strength of the Aggregate Industries mixes with % CBA replacement compared to the control is illustrated in
Figure 7, and the optimum CBA content was 60% at 28 days of curing. The 50% CBA has 25.8% higher compressive strength than the control after 28 days of curing, and the optimum content of 60% has 8.3% higher compressive strength than the control concrete without CBA (
Figure 7). Therefore, CBA enhances the compressive strength of concrete, as the two projects confirm the same results.
The results for the mix with 70% and 80% replacement after seven days of curing were not comparable to the control; therefore, we only considered the 50% and 60% mixes at 28 days of curing [
18]
(Figure 7).
4. CONCLUSIONS
The following conclusions can be made based on this study:
CBA can sustainably replace fine aggregates, reduce material depletion, and decrease carbon dioxide emissions. For the Strata control, the optimum amount of CBA in a concrete mix was 50% at 7 days, 28 days, and 56 days of curing, and the CBA concrete's compressive strength was higher than the control's at 56 days, which is a very promising result in terms of sustainability and durability.
The compressive strength of % CBA increased with decreased slump value for both Strata and Aggregate Industries projects, and workability decreased with increased CBA content.
The CBA concrete's air content remained lower than that of the control mix until it reached the optimum content; at this point, it became comparable to or higher than the control. The air content of the % CBA concrete mix decreased with an increase in CBA content and SAM number, which may have been caused by the spacing factor of the voids in the mix and CBA’s porous behavior.
CBA’s unit weight decreased with an increase in CBA replacement. It became comparable to the control when close to the optimum value, possibly due to CBA’s higher water demand, which leads to pore formation, larger pore sizes, and lightweight concrete.
The critical issue with replacing fine aggregate with CBA is workability, which can be resolved using a high-range water reducer to increase the mix’s workability. The water reducer had an earlier age-strength effect on the concrete. The mix containing 30% CBA with a 25 ml/ft3 water reducer and without water reduction resulted in an increase in compressive strength from 4,119 psi to 4,521 psi in seven days due to the water reducer; however, further research is needed in this domain.
5. RECOMMENDATIONS
Based on this study, the following recommendations can be made:
Further study is needed to see how water reducer affects the compressive strength and air content of CBA concrete.
Assess the mechanical and durability properties of CBA concrete from various sources and compare it to the same control.
6. FUTURE WORK
Determine the effect of optimum CBA on concrete mechanical properties, including tensile strength, flexural strength, and modulus of elasticity.
Determine the effect of optimum CBA on concrete durability properties, including freeze-thaw and rapid chloride penetration tests.
Author ContributionS
The authors confirm contribution to the paper as follows: study conception and design: Daba Gedafa and Bruce Dockter; data collection: Samrawit Menda, Sandip Poudel, Joe Useldinger-Hoefs, Bruce Dockter, and Daba S. Gedafa; analysis and interpretation of results: Samrawit Menda, Sandip Poudel, Bruce Dockter, and Daba S. Gedafa; draft manuscript preparation: Samrawit Menda and Sandip Poudel. All authors reviewed the results and approved the final version of the manuscript.
Acknowledgments
The authors thank the North Dakota Industrial Commission for funding this project and Great River Energy, Strata, and Aggregate Industries for providing the materials. Most of this work was part of Menda's (2022) M.S. Thesis at the University of North Dakota under the supervision of Professor Daba Gedafa and advisory committee members.
REFERENCES
- Mangi, S. A., M. H. W. Ibrahim, N. Jamaluddin, M. Arshad, and R. Putra Jaya. Effects of Ground Coal Bottom Ash on the Properties of Concrete. Journal of Engineering Science and Technology, 2019. 14: 338–350.
- Gedafa, D. S. and S. Tolliver. Investigating the use of Fly Ash and Nanomaterials for Sustainable Concrete Infrastructure. International Journal of Engineering Research, 2016. 5: 173-177.
- Kim, H. K., and H. K. Lee. Use of Power Plant Bottom Ash as Fine and Coarse Aggregates in High-Strength Concrete. Construction and Building Materials, 2011. 25: 1115–1122. [CrossRef]
- Singh, M., and R. Siddique. Strength Properties and Micro-Structural Properties of Concrete Containing Coal Bottom Ash as Partial Replacement of Fine Aggregate. Construction and Building Materials, 2014. 50: 246–256. [CrossRef]
- Rafieizonooz, M., J. Mirza, M. R. Salim, M. W. Hussin, E. Khankhaje. Investigation of Coal Bottom Ash and Fly Ash in Concrete as Replacement for Sand and Cement. Construction and Building Materials, 2016. 116: 15-24. [CrossRef]
- Baig, A. M., and V. Varghese. Coal Bottom Ash as a Concrete Ingredient: Review. Proceedings of Sustainable Development & Management, 2019.
- Kim, Y. -H., H. -Y. Kim, K. -H. Yang, and J. -S. Ha. Effect of Concrete Unit Weight on the Mechanical Properties of Bottom Ash Aggregate Concrete. Construction and Building Materials, 2021. 273.
- Ismail, S., K. W. Hoe, and M. Ramli. Sustainable aggregates: The Potential and Challenge for Natural Resources Conservation. Procedia-Social and Behavioral Science, 2013. 101: 100–109. [CrossRef]
- Amaya, P., P. J. Amaya, and A. Amaya. The Use of Bottom Ash in the Design of Dam. World of Coal Ash (WOCA), 2007.
- Lynn, C. J., R. K. D OBE, and G. S. Ghataora. Municipal Incinerated Bottom Ash Characteristics and Potential for Use as Aggregate in Concrete. Construction and Building Materials, 2016. 127: 504–517. [CrossRef]
- Ramzi, N. I. R., S. Shahidan, M. Z. Maarof, and N. Ali. Physical and Chemical Properties of Coal Bottom Ash (CBA) from Tanjung Bin Power Plant. IOP Conference Series: Materials Science and Engineering, 2016. 160. [CrossRef]
- Maliki, A. A., S. Shahidan, N. Ali, N. R. Hannan, S. S. M. Zuki, M. Ibrahim,M. A. M. Azmi, and M. A. Rahim. Compressive and Tensile Strength for Concrete Containing Coal Bottom Ash. IOP Conference Series: Materials Science and Engineering, 2017. 271. [CrossRef]
- Kurama, H., and M. Kaya. Usage of Coal Combustion Bottom Ash in Concrete Mixture. Construction and Building Materials, 2008. 22: 1922–1928. [CrossRef]
- Lee, H. K., H. K. Kim, and E. A. Hwang. Utilization of Power Plant Bottom Ash as Aggregates in Fiber-Reinforced Cellular Concrete. Waste Management, 2010. 30: 274–284. [CrossRef]
- Ghafoori, N., and Y. Cai. Laboratory-Made Roller Compacted Concretes Containing Dry Bottom Ash: Part II—Long-Term Durability. Materials Journal, 1998. 95: 244–251.
- Kou, S. -C., and C. -S. Poon. Properties of Concrete Prepared with Crushed Fine Stone, Furnace Bottom Ash and Fine Recycled Aggregate as Fine Aggregates. Construction and Building Materials, 2009. 23: 2877–2886.
- Singh, M., and R. Siddique. Effect of Coal Bottom Ash as Partial Replacement of Sand on Properties of Concrete. Resources, Conservation and Recycling, 2013. 72: 20–32. [CrossRef]
- Menda, S. Determining Optimum Coal Bottom Ash Content for Sustainable Concrete Infrastructure, MS Thesis, University of North Dakota, 2022.
|
Disclaimer/Publisher’s Note: The statements, opinions and data contained in all publications are solely those of the individual author(s) and contributor(s) and not of MDPI and/or the editor(s). MDPI and/or the editor(s) disclaim responsibility for any injury to people or property resulting from any ideas, methods, instructions or products referred to in the content. |
© 2024 by the authors. Licensee MDPI, Basel, Switzerland. This article is an open access article distributed under the terms and conditions of the Creative Commons Attribution (CC BY) license (http://creativecommons.org/licenses/by/4.0/).

