1. Introduction
The hippocampus stands as a cornerstone within the intricate architecture of mammalian brains, wielding profound influence over cognitive processes by encoding and safeguarding new information [
1,
2,
3]. Its multifaceted roles extend beyond mere data storage, encompassing pivotal functions in memory consolidation, spatial orientation, and emotional formation [
4]. Comprising distinct neural regions such as the Dentate gyrus (DG), CA3, CA1, and subiculum, the hippocampal formation orchestrates a symphony of interconnected pathways [
5]. Primarily, these pathways are intricately woven with inputs from the Entorhinal Cortex (EC) [
6], which utilizes a trio of pathways including a trisynaptic pathway and two monosynaptic pathways [
7,
8].
The trisynaptic pathway consists of the perforant pathway between the second layer of EC to DG [
9], the mossy fibers between DG and CA3 [
10], and Schaffer collaterals between CA3 to CA1 [
11]. The monosynaptic pathways are formed between the second layer of EC to CA3 [
12] and the third layer of EC to CA1 via perforant pathways [
9]. CA3 has more recurrent connections compared to the other hippocampal regions [
13], a feature that prompted researchers to attribute to it a crucial role in pattern completion and memory storage. The fifth layer of EC receives the afferent projections from CA1 directly and indirectly via the subiculum [
14,
15] and sends back projections to widespread cortical targets that provided the actual sensory inputs [
16]. Finally, DG can be viewed as an input from the EC in the perforant pathway. The output pathway in the hippocampus passes through the CA1 area and subiculum, returning to the EC.
Violation of the functional state of the hippocampus (including violation of perforant pathway) in pathological human conditions leads to a memory deficit that disrupts normal functioning or may be a sign of aging and deterioration of the brain in patients with Alzheimer’s disease [
17,
18]. In addition, many other pathologies and injuries lead to damage in the hippocampus, e.g., short-term hypoxia [
19], blunt trauma to the head, and epileptiform activity [
20]. Consequently, restoring cognitive function in afflicted individuals has emerged as a paramount global healthcare imperative [
21,
22,
23]. Central to this endeavor is the reinstatement of sequential activation within hippocampal cell groups, particularly in CA3 and CA1 layers, which are synaptically connected and interact with each other during memory encoding [
24]. Thus, preserving cognitive function in the face of neurodegeneration hinges upon the meticulous orchestration of hippocampal circuitry.
In the dynamic landscape of neuroscience, a vibrant realm of modern neuroprostheses and cutting-edge neurotechnologies has emerged, offering tantalizing prospects for the restoration and augmentation of memory functions [
25,
26,
27,
28]. Within this realm lie a plethora of innovative systems designed to revive memory functions, notably the hippocampal neuroprosthesis. First of all, Berger, Hampson, Deadwyler and co-authors [
28,
29,
30,
31,
32,
33] developed a multi-channel MIMO (multi-input-multi-output) device, which transforms the recorded activity of hippocampal neurons into patterns of electrical stimulation to expand memory and cognitive functions in rodents and non-human primates in the CA3–CA1 set of the hippocampus
in vitro and
in vivo. They also tested this approach to improve memory in humans before hippocampal resection for epilepsy [
34,
35].
Meanwhile, Hogri et al. [
36] have ventured into the realm of silicon, unveiling a remarkable very-large-scale integration (VLSI) chip engineered to emulate the fundamental principles of cerebellar synaptic plasticity. With seamless integration into cerebellar input and output nuclei, this chip orchestrates real-time interactions, faithfully replicating cerebellar-dependent learning in anesthetized rats. Adding to this tapestry of innovation, our own contributions have illuminated novel avenues in memory restoration. Through the conceptual fusion of rodent hippocampal activity and memristive devices, we have unveiled a symbiotic relationship between living hippocampal cells and neuron-like oscillatory systems [
37,
38,
39,
40,
41]. This interplay promises not only to redefine our understanding of memory mechanisms but also to inspire transformative interventions in the realm of cognitive enhancement.
In recent years, the integration of artificial intelligence (AI) methodologies has emerged as a cornerstone in neuroscience research, presenting unprecedented opportunities for decoding intricate neural activity and facilitating the precise control of prosthetic devices. Notably, the application of AI technologies to the restoration of hippocampal signals has emerged as a focal point of investigation, drawing substantial attention from the scientific community [
42,
43]. Deep learning algorithms are often applied to various tasks of prediction of biological signals, e.g., sharp-wave ripples [
44,
45], as well as physiological signals, such as electromyogram, electrocardiogram, electroencephalogram, and electrooculogram (see [
46] and references therein). Automatic feature extraction allows us to predict and simulate complex encoding processes in the brain [
47].
Against this backdrop, the aim of this study is to propose and validate an innovative approach for the prediction of hippocampal signals,while ensuring ease of implementation on neural chips tailored for neuroprosthetic tasks. Central to our methodology is the utilization of deep neural networks, revered for their prowess in handling complex data and unraveling intricate patterns. Specifically, we focus on two prominent deep learning architectures renowned for their efficacy in time series prediction: the long short-term memory (LSTM) deep neural network and reservoir computing (RC). Through the fusion of this methodology, we aim to construct a framework that not only achieves high accuracy in prediction but also demonstrates practical feasibility on neural hardware. To train our deep networks, we used signals recorded in CA1 and CA3 regions of rodent hippocampus, representative of the intricate neural dynamics inherent in memory processing. Through rigorous experimentation and analysis, we compare the predictive capabilities of our proposed model, utilizing a suite of evaluation metrics meticulously crafted to capture the nuanced properties of hippocampal biological signals.
The ultimate goal of this research is not only to make a significant contribution to improving our understanding of neural processes, but also to lay the foundation for revolutionary advances in the field of neuroprosthetics to improve the quality of life of people living with neurological disorders by developing innovative and effective solutions.
The structure of this paper unfolds as follows. In
Section 2 we outline our approach and describe the associated pipeline. Within this section, we introduce an innovative method for predicting hippocampal signals based on received biological input based on deep neural networks. Subsequently, in
Section 3, we expound upon the dataset encompassing signals extracted from the CA1 and CA3 regions of the rodent hippocampus, elucidating the techniques employed for data preprocessing. Moving forward,
Section 4 delves into the architecture of RC an LSTM networks utilized for signal prediction, alongside a comprehensive discussion of the chosen evaluation metrics aimed at gauging result quality. The comparative analysis of diverse deep neural network architectures is presented in
Section 5. Finally, in
Section 6 we discuss our findings and draw our conclusions in
Section 7.
2. Description of the Implemented Approach
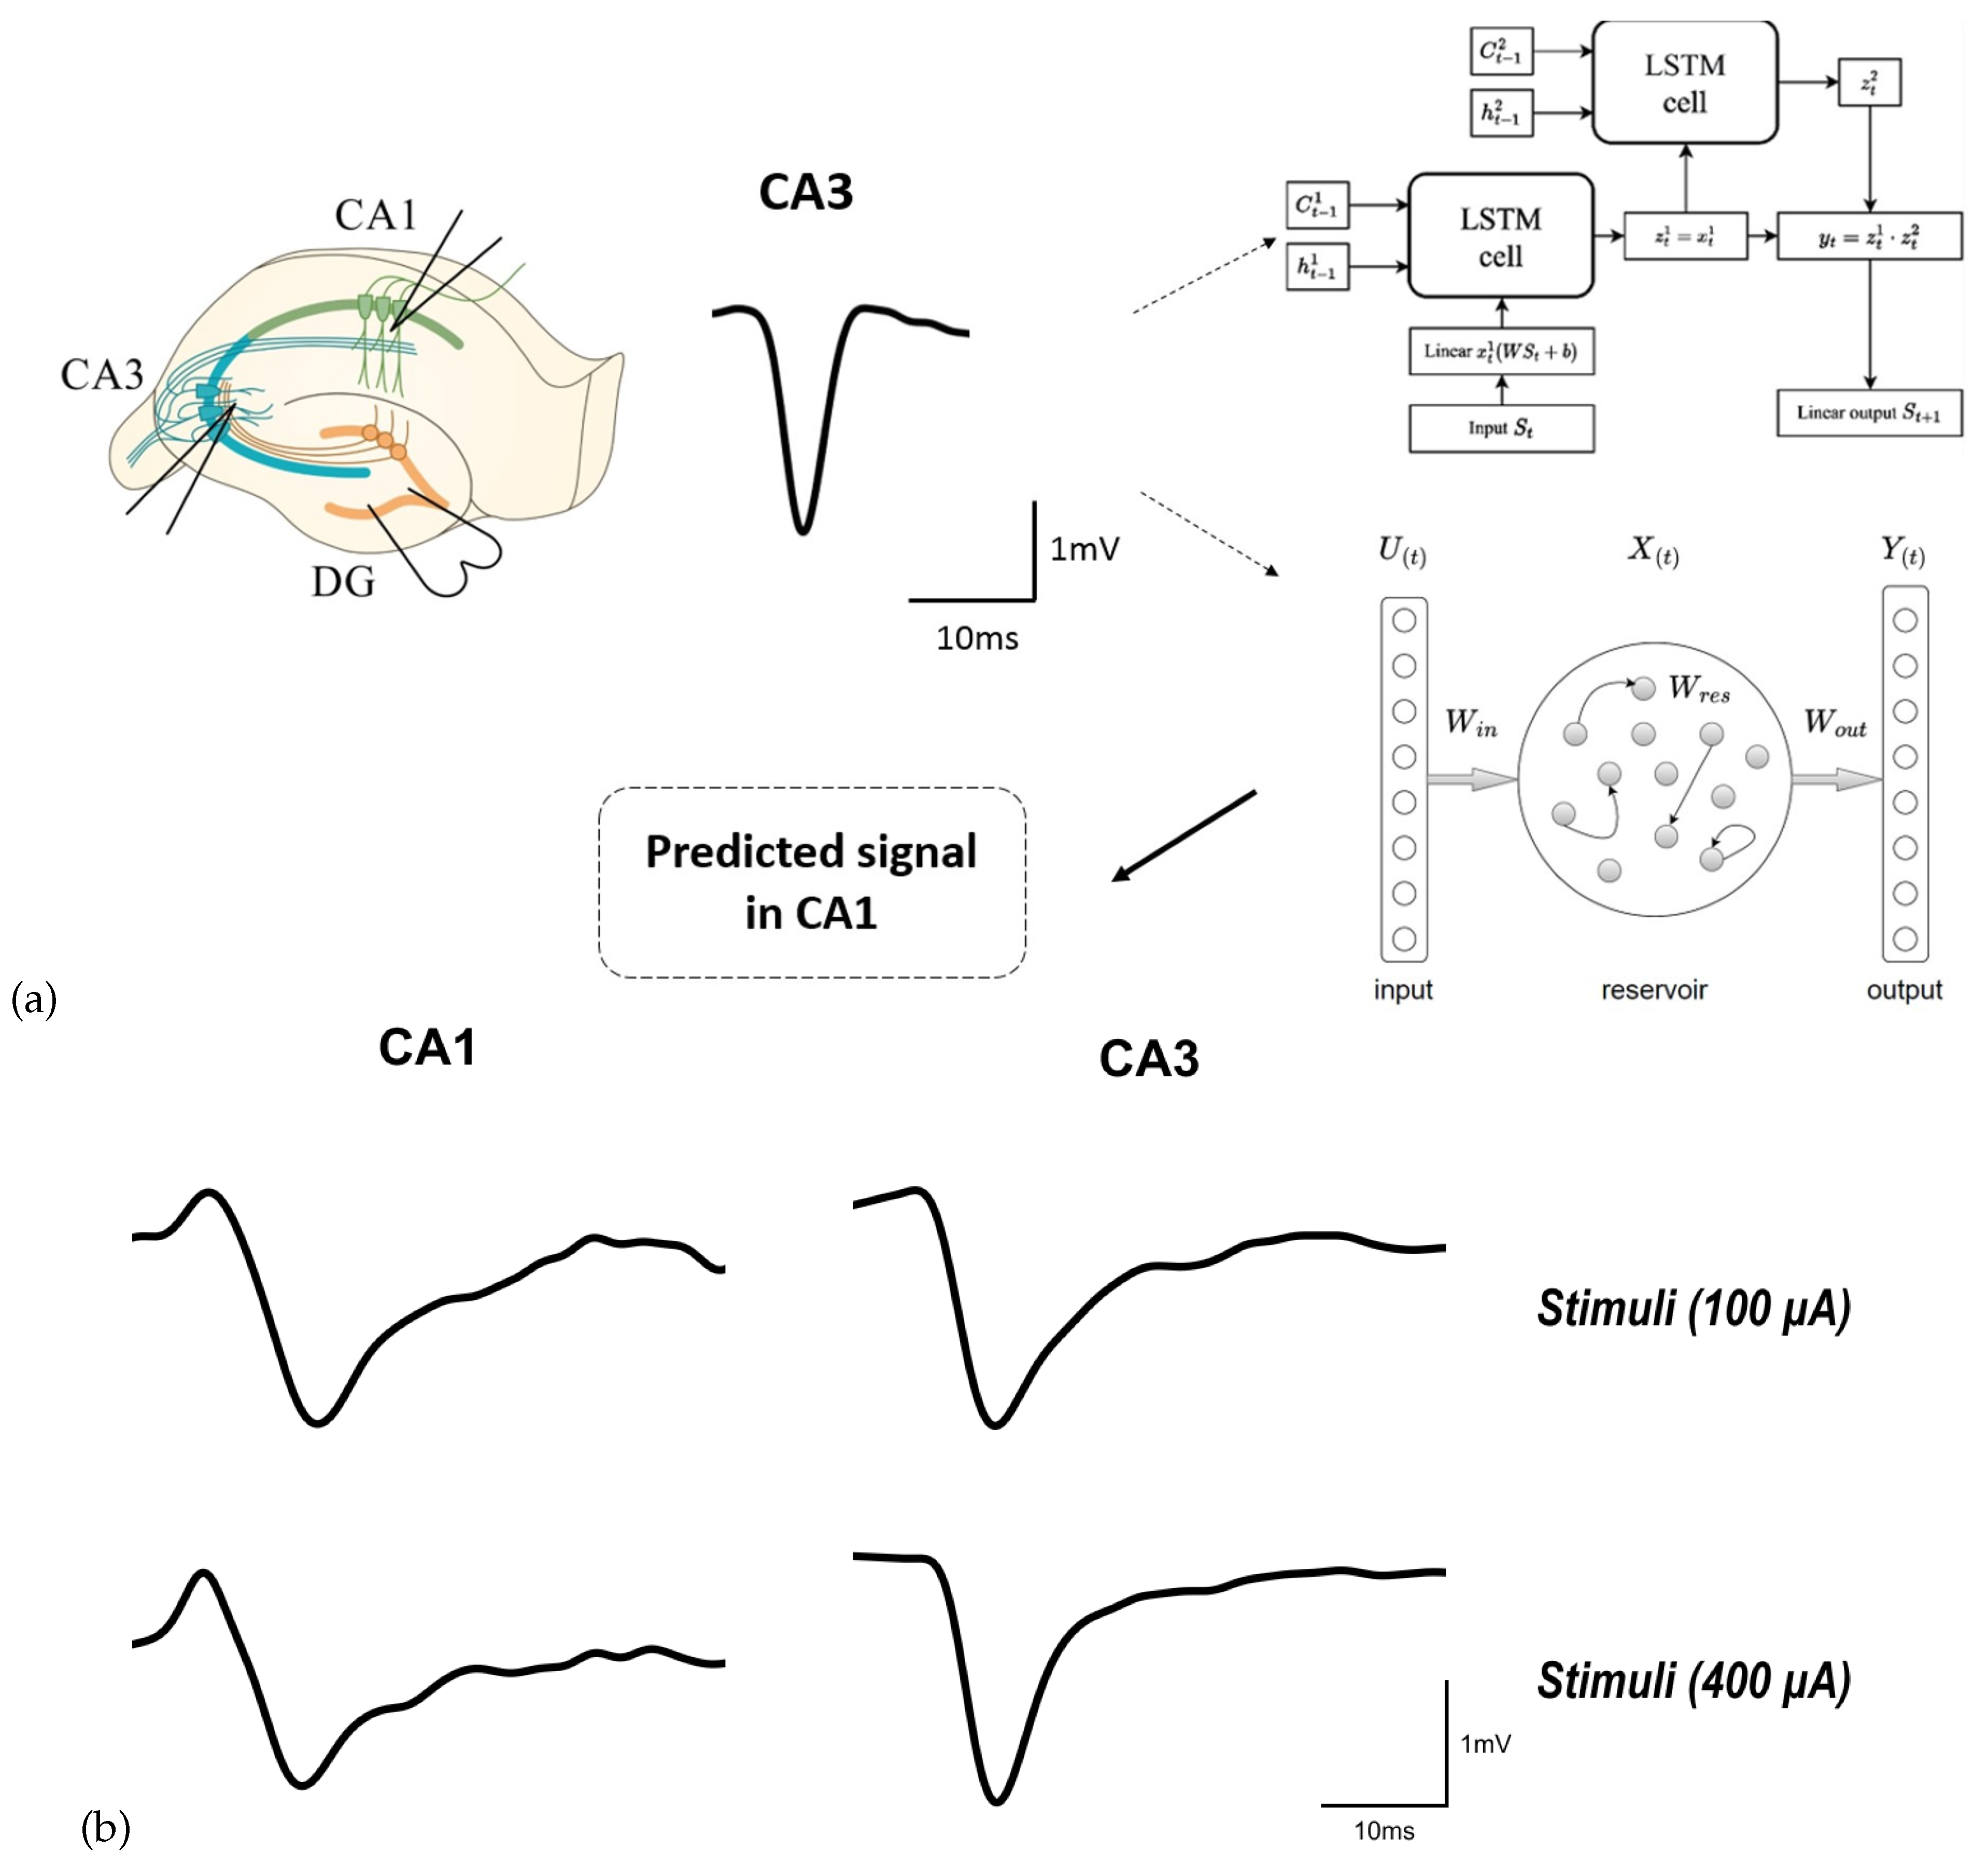
We propose an intelligent approach to restoring electrophysiological activity in mouse hippocampus slices using deep neural networks. The main idea of our approach can be described as follows. We stimulate Dentate gyrus (DG) in healthy slices and obtain a subsequent "healthy" response in the form of field excitatory postsynaptic potentials (fEPSP), first in the CA3 region and then in the CA1 region. In the case of violation of conductivity of neural signals along perforant pathway, e.g., due to a mechanical trauma in the CA3 region, no signal is obtain from the CA3 region and subtle "unhealthy" signal is received from the CA1 region in response to the DG stimulation according to chosen protocol. In order to restore healthy activity in the CA1 region, we use the CA3 fEPSP as an input for our neural network to predict the CA1 fEPSP. This approach is schematically illustrated in
Figure 1. Our method allows using the predicted signal to simulate healthy activity in damaged brain regions in real-time biological experiments [
40].
The pipeline of our study is presented in
Figure 2. First, we carried out a series of biological experiments to record fEPSP in hippocampal slices in two areas (CA1 and CA3) under normal conditions during electrical stimulation of DG. As a result, we obtained a set of paired fEPSPs at different stimulus amplitudes. The detailed fEPSP registration protocol is described in
Section 3. Subsequent procedures with the resulting set of signals involve standard preprocessing for biological signals, which include artifacts removal, noise filtering, and normalization to baseline, as well as averaging over all signals recorded for each stimulus amplitude. Resulting data containing pairs of averaged CA3-CA1 signals were divided into training and testing samples for further training and prediction of the output signal in the hippocampus using two deep learning architectures (see details in
Section 4).
The novelty of the proposed approach is as follows. Unlike previous studies of other research groups, where multi-channel signals were used, in our work we used signals from a single electrode. In addition, this is the first attempt, to the best of our knowledge, of using different deep learning architectures instead of oscillatory systems and electronic circuits.
3. Materials and Data Recording Details
3.1. Ethics Statement
In this study, the protocols of all experiments were reviewed and confirmed by the Bioethics Committee of the Institute of Biology and Biomedicine National Research of the Lobachevsky State University of Nizhny Novgorod.
3.2. Data Collection
We collected a dataset containing fEPSP recorded from hippocampal slices on the mouse line of 2–3-months of age.
Slices of the hippocampus of 400-m thickness were prepared using a vibratome (MicromHM 650 V; Thermo Fischer Scientific). They were permanently placed in artificial cerebrospinal fluid (ACSF) with the following composition (mM): NaCl 127, KCl 1, KH2PO4 1.2, NaHCO3 26, D-Glucose 10, CaCl2 2.4, MgCl2 1.3 (pH 7.4–7.6; Osmolarity mOsm). The solution was constantly saturated with gas mixture containing O2 and 5% CO2. In our experiments, we used only survived slices. For morphological analysis, a Scientifica SliceScope (Scientifica Ltd) microscope with aerial 4X lens was used.
The fEPSP were recorded using glass microelectrodes (Sutter Instruments Model P-97) from the Harvard Apparatus (Capillares 30-0057 GC150F-10,
Lmm, Quantity: 225). Stimulation and registration electrodes were placed in the DG region and CA3 and CA1 regions, respectively. The electrodes were installed in the holder of a HEKA EPC 10 USB PROBE 1 preamplifier head connected to the HEKA EPC 10 USB biosignal amplifier. A stainless-steel bipolar electrode was used for electrical stimulation of the DG area in the hippocampus. The electrodes were filled with the ACSF solution. The pipette tip resistance was 4–8 M
. We applied a 50-
s stimulation signal whose amplitude was increased from 100 to 1000
A with a 100-
A step. A more detailed description of the experimental protocol can be found in our previous publications [
37,
39,
40,
48,
49]. Data visualization and recording were performed using Patchmacter software.
3.3. Data Preprocessing
At the first step of data analysis, all obtained fEPSP signals were preprocessed to remove artifacts [
50]. Since the stimulation signal in all experiments had the same duration and were applied at the same moment, we removed the related artifacts from our data by excluding 20 time points corresponding to the stimulus.
Then, noise was filtered by a Gaussian filter with and radius . After that, we normalized the data by converting them into a dataset with zero mean and unit variance. The data was then separated into inputs and outputs for the models.
In order to obtain signals for training, we divided all signals into 6 groups with different values of the stimulus amplitude. All signals inside each group were then averaged, except one used as a test signal. It allowed us to exclude the signal dependence on the experimental conditions, such as the inclination and exact location of the electrode insertion, the exact insertion depth, etc.
The data used in the model as input and output signals consisted of 1000 time samples recorded respectively from the CA3 and CA1 regions. The optimal number of time samples in the input data was determined experimentally during the optimization process.
4. Methodology
The deep learning architectures were developed for fEPSP signal prediction in the CA1 region of hippocampus in laboratory mice using CA3 signal as an input. In this section, we will first describe the architecture of the proposed LSTM (
Section 4.1) and RC (
Section 4.2) deep neural networks. Then, in
Section 4.3 we will present evaluation metrics used to qualify the prediction. Finally, in
Section 4.4 we will discuss some features of the training process.
4.1. Long Short-Term Memory Network
The LSTM network, a type of recurrent networks, can be viewed as the first choice deep learning architectures for time series prediction due to their ability to learn long term dependencies [
51]. The basic unit in LSTM networks is called a LSTM cell, which remembers values for arbitrary time intervals, while three filters regulate the information flow into and out of the cell [
52]. This feature arises with the help of three logic gates: input gate, output gate, and forget gate. Each of these gates obtains input from a sigmoid activation function (
s). Here and further we use the following definitions:
are weight matrices,
are bias vectors (
), and
is a vector containing input values (the subscript
t indexes the time step).
Forget gates decide what information to discard from a previous state of the cell by assigning a previous state, compared to a current input, a value between 0 and 1. This gate is defined as
where
h is a number of LSTM cell’s units.
Input gates decide which pieces of new information to store in the current state, using the same system as forget gates. The functionality of the input gate can be described with two parts:
and
. Here,
is an information we want to remember, which we compute using a sigmoid function (
s) as follows:
To create a vector of new updated values
, we use a hyperbolic tangent function (
), i.e.
Then, the state of the old cell
is replaced by a new cell state by removing the information generated by the forget gate in Equation (
1):
where
is the updated cell state. Here, the operator ⊙ denotes the Hadamard product (element-wise product).
Finally, output gates control which pieces of information in the current state to output by assigning a value from 0 to 1 to the information, considering the previous and current states. The output is surpassed from a sigmoid layer and then a hyperbolic tangent layer to classify.
where
is an output gate’s activation vector and
is a hidden state vector, also known as an output vector of the LSTM unit, and the superscript
h refers to the number of hidden units. Note that sigmoid activation function (
s) suppresses the values in the interval
, while the hyperbolic tangent activation function (
) suppresses the values in the interval
.
After the above steps, the cell state is updated. Lastly, the output of the current state is computed by taking the values of the updated state of the cell state and also values from the sigmoid layer that determines the components of the cell state that need to be included in the output.
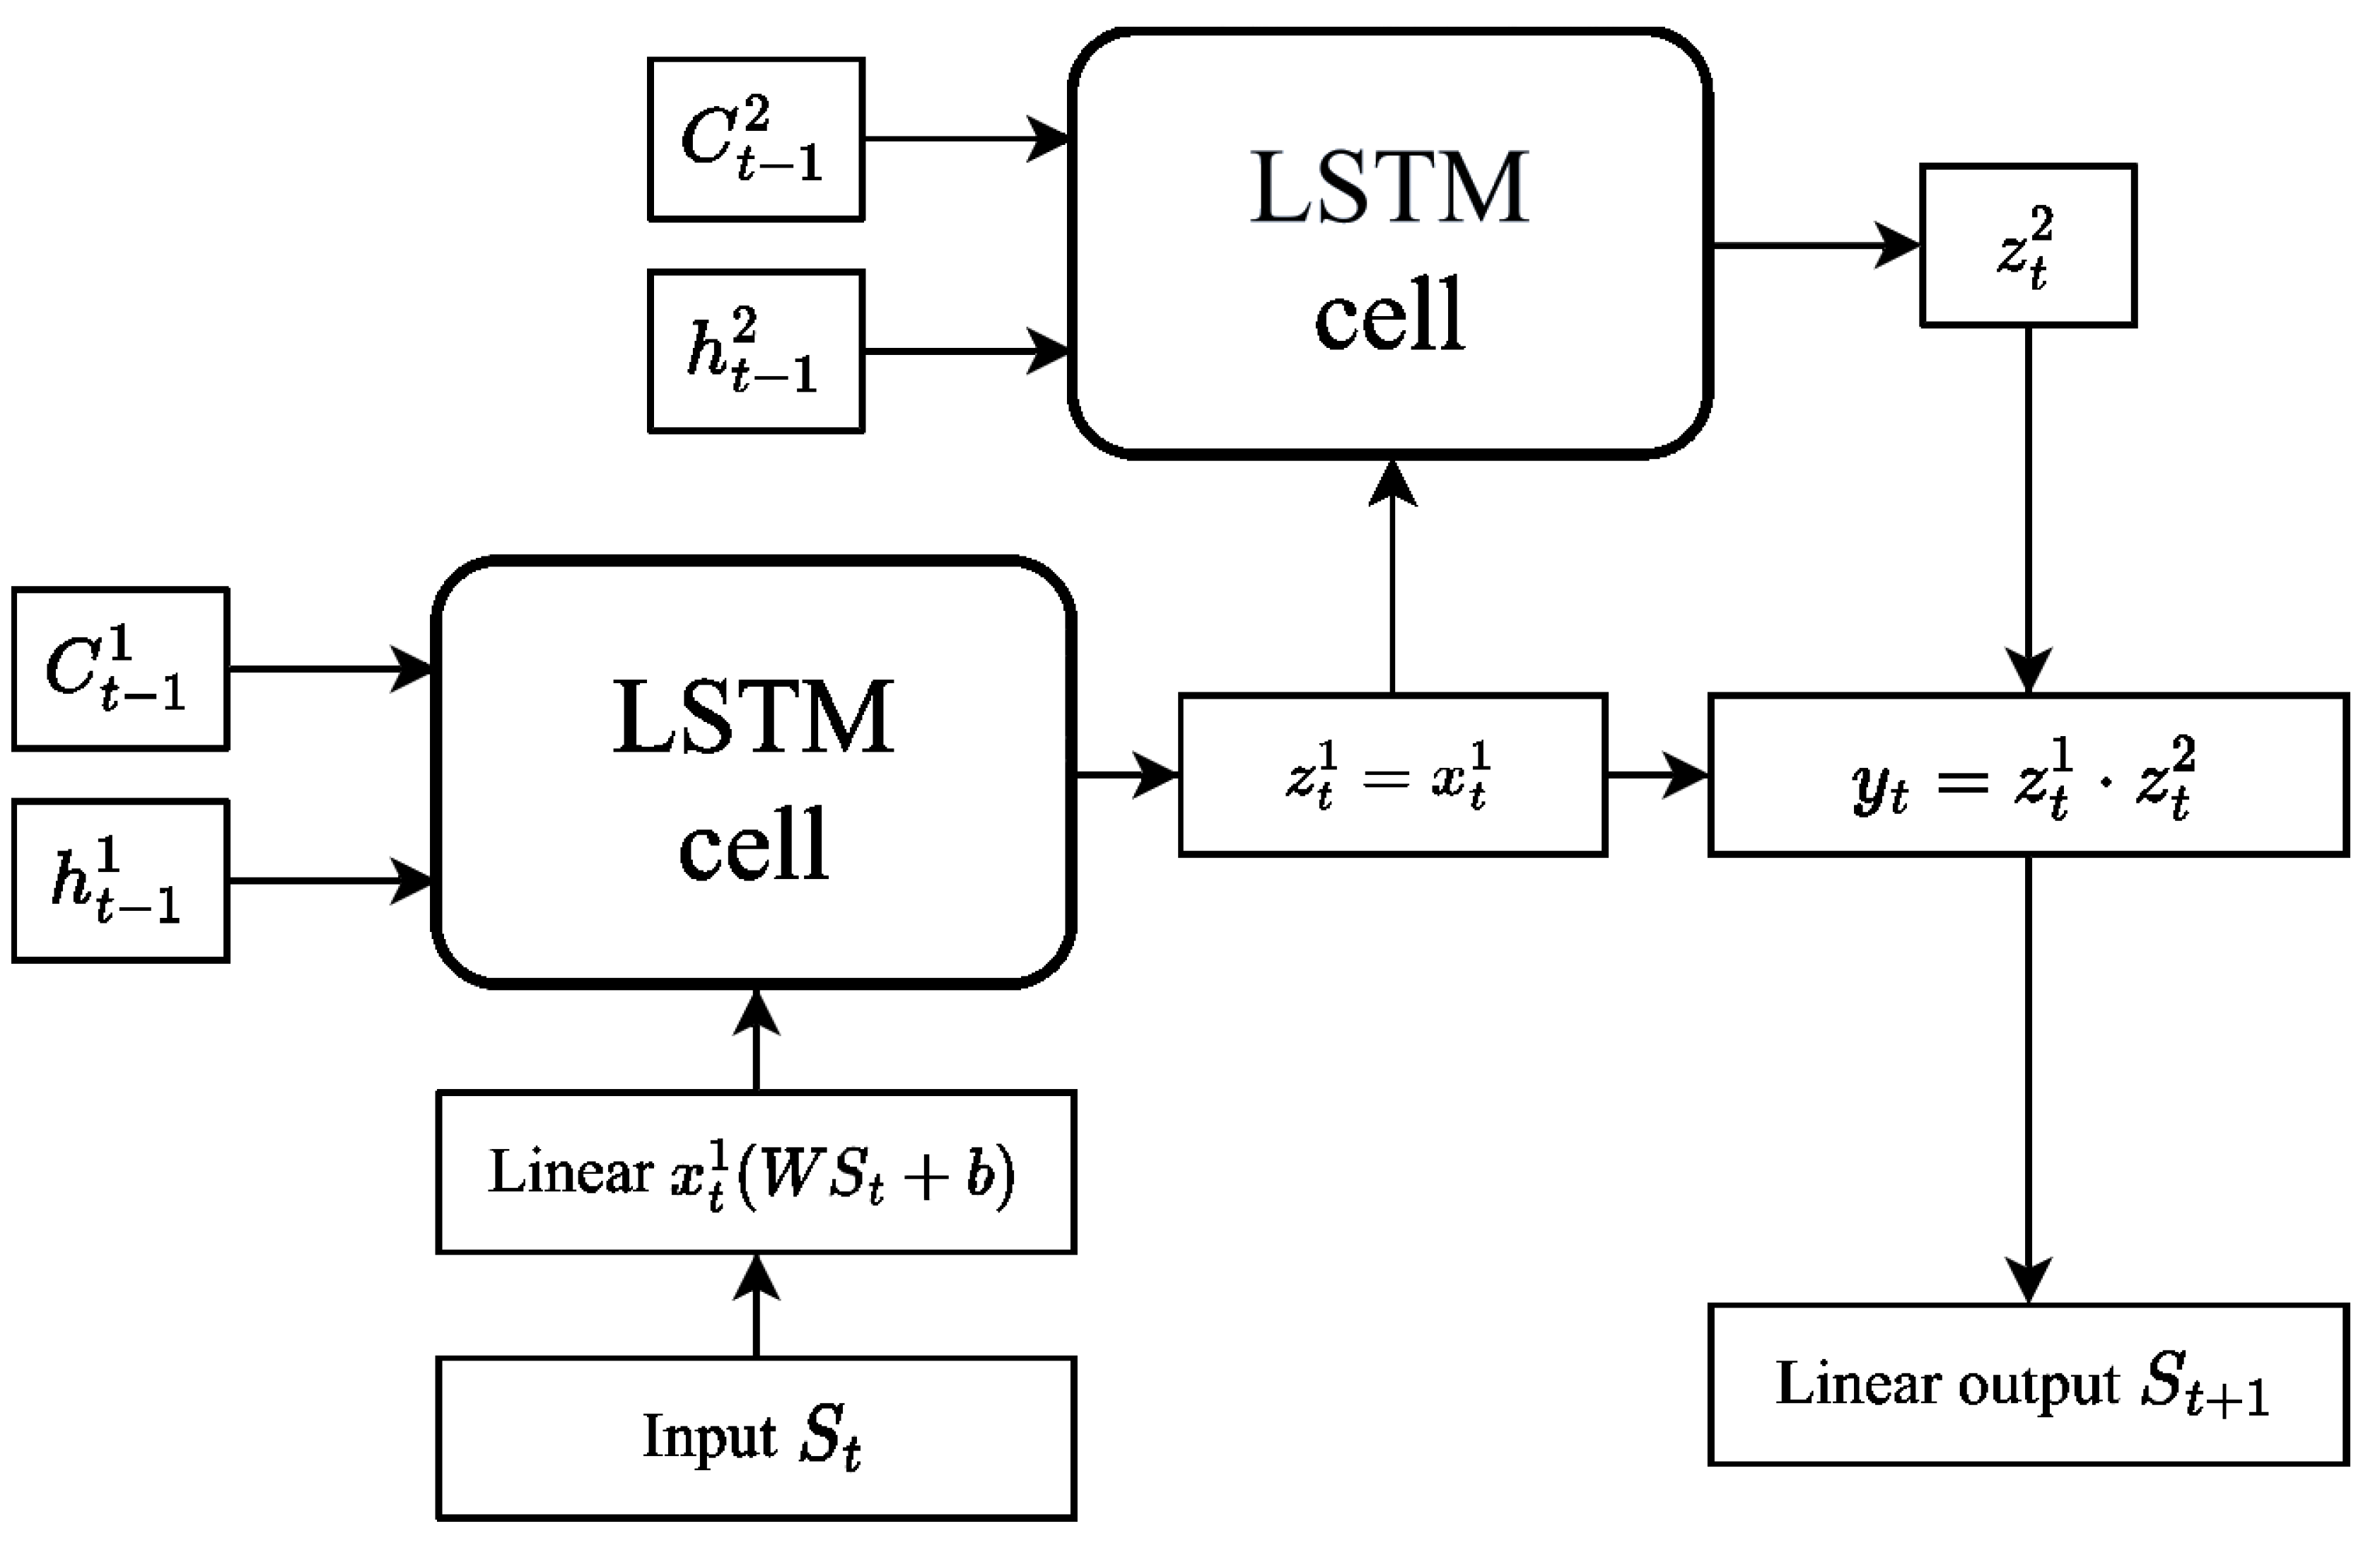
The architecture of the LSTM network used in our study is shown in
Figure 3. The model includes a linear input layer of a
size with the ReLU (rectified linear unit) activation function. There are also two LSTM cells, each containing 100 neurons, and the output signal from these cells enters a linear layer with a weight matrix of a
size. This final output allows us to obtain the predicted value. Due to their complicated structure, state-of-the-art LSTM networks include a huge number of model parameters, typically exceeding the usual on-chip memory capacity. Therefore, network inference and training will require parameters to be passed to the processing unit from a separate chip for computation, and inter-chip data communication severely limits the performance of LSTM-based recurrent networks on conventional hardware.
4.2. Reservoir Computing
Reservoir computing (RC) is a computational framework that also based on recurrent neural networks [
53,
54,
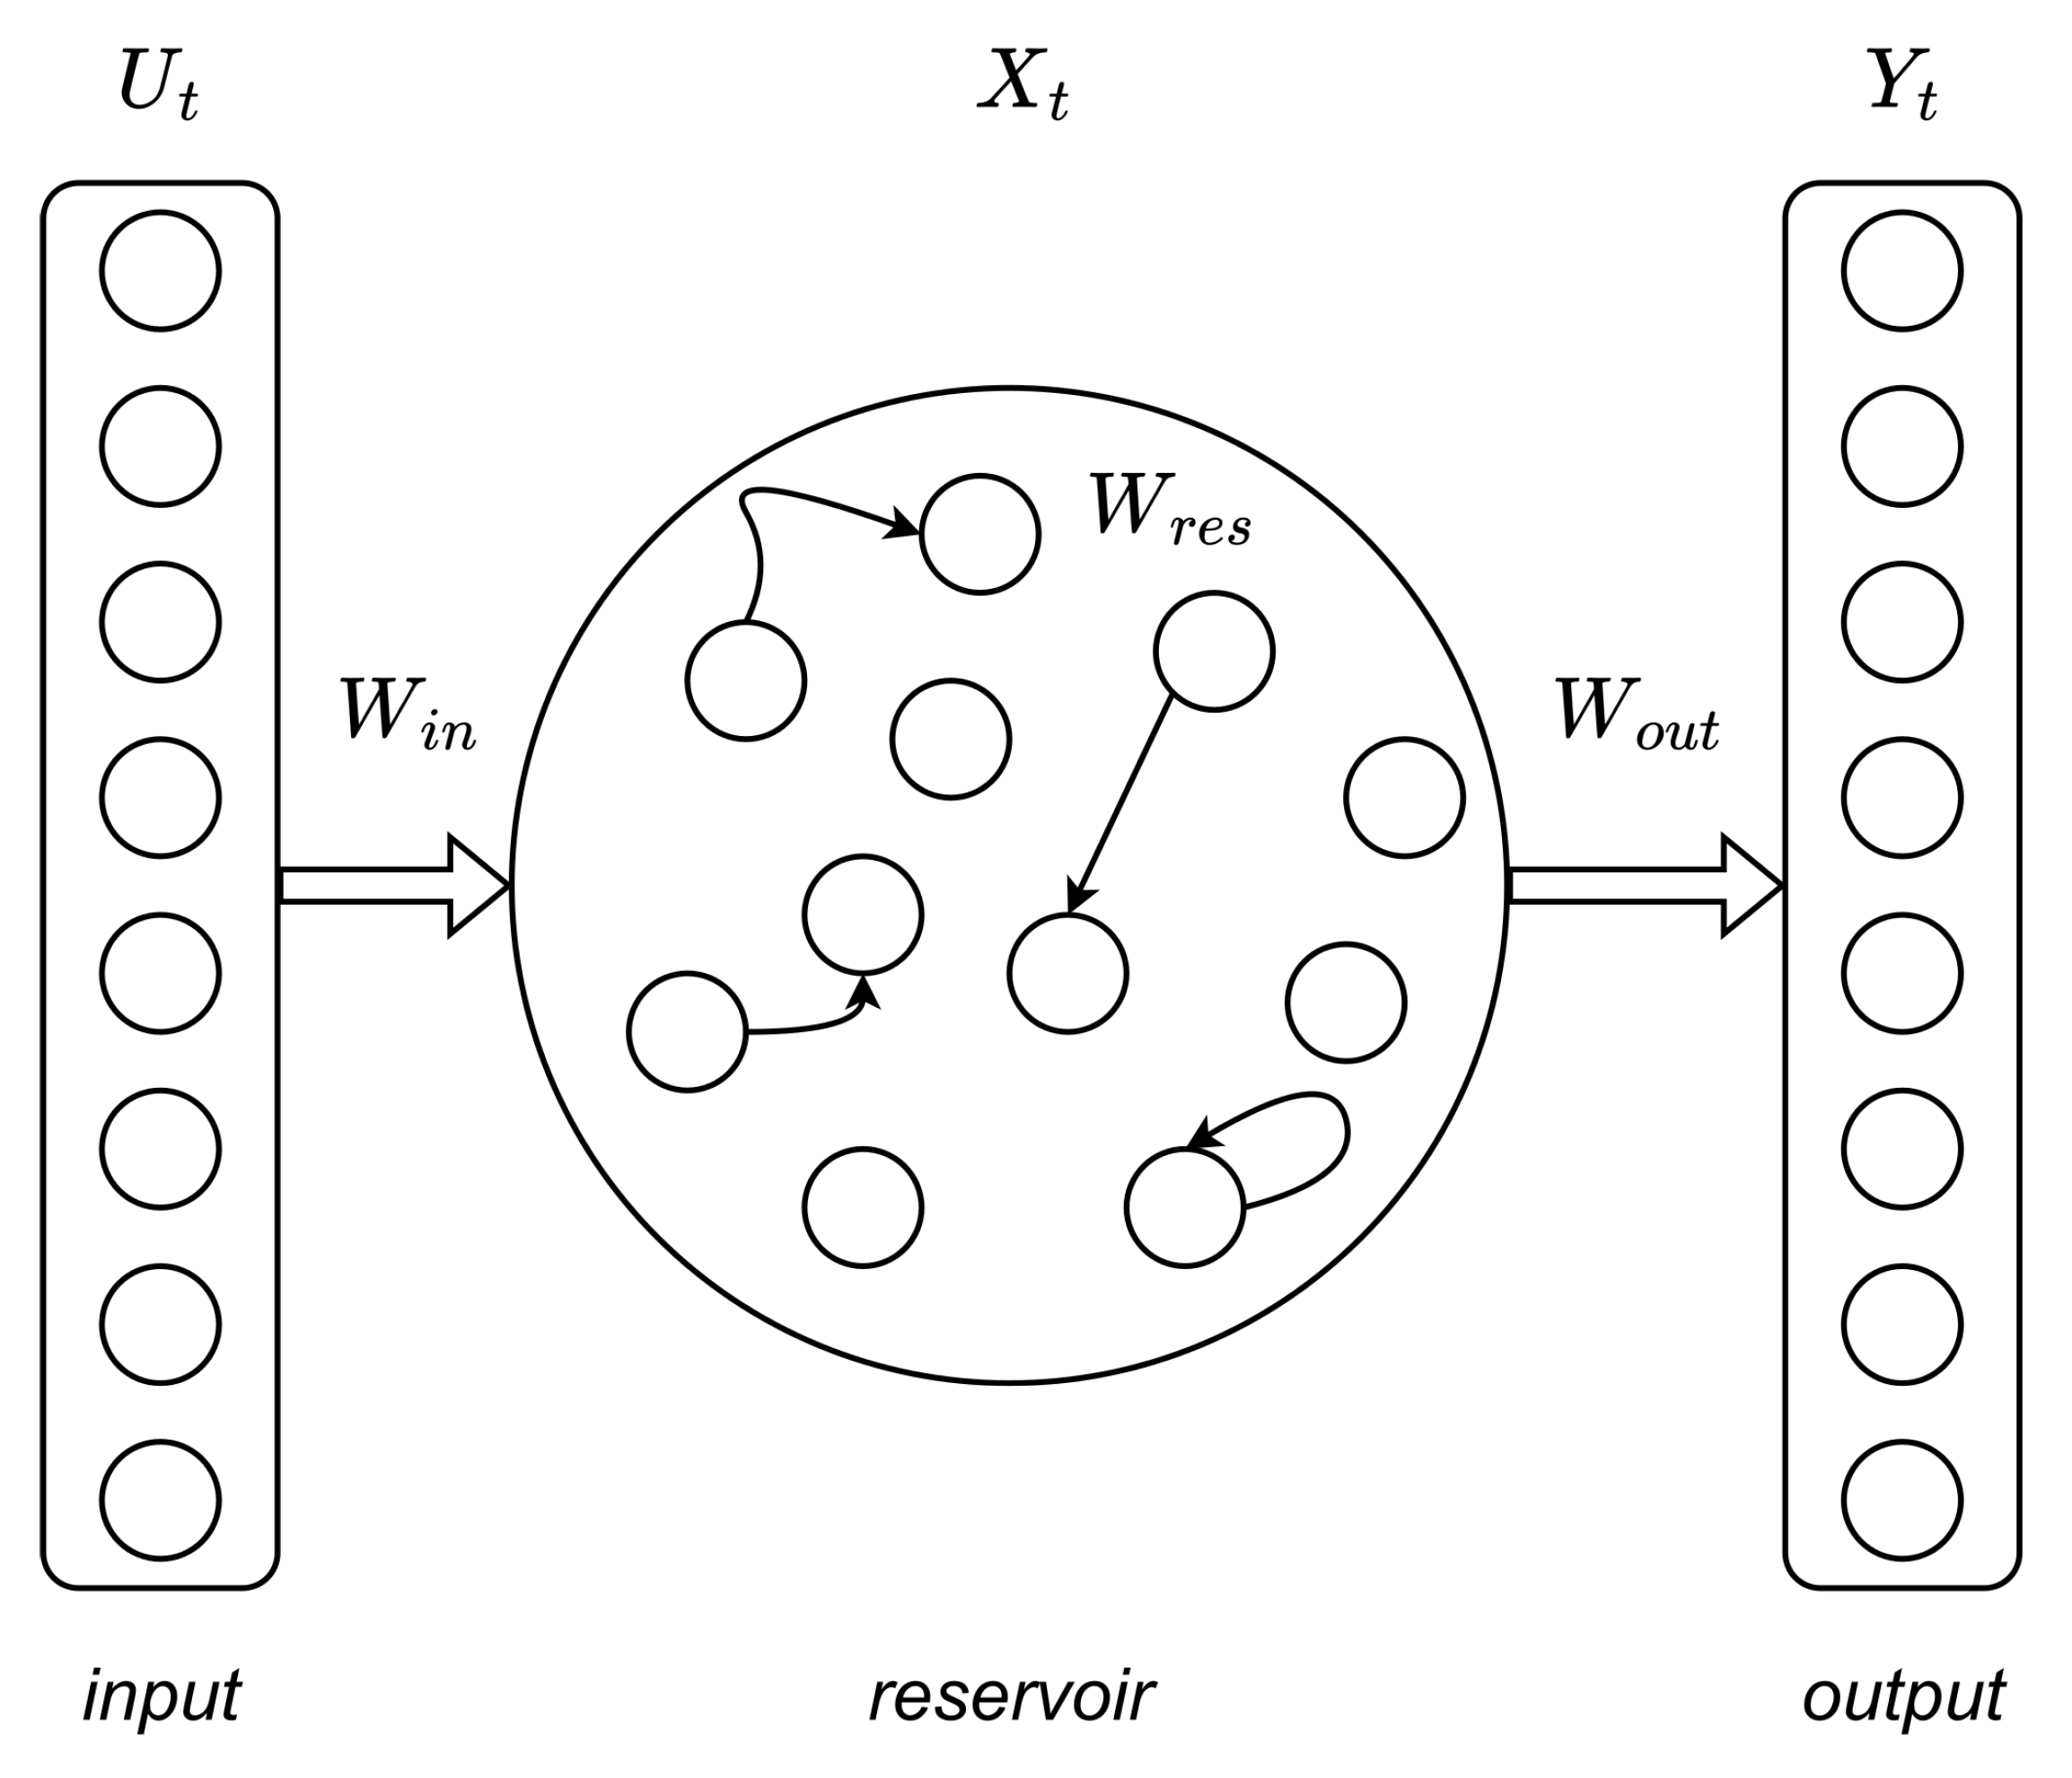
55]. A typical RC network includes reservoir and readout layers, as shown in
Figure 4. Here, the reservoir network consists of randomly connected neurons, which can generate high-dimensional transient responses to a certain input (reservoir’s states). These high-dimensional reservoir’s states are then processed with a simple readout layer, generating the output. During RC training, the weight connections between neurons in the reservoir remain untrained, and only the readout layer is trained (e.g., using linear regression) [
56,
57]. Compared to other DNNs, RC exhibits the same or even better performance and requires substantially smaller data sets and training time [
58,
59].
In our study we employ the RC network as follows. The reservoir layer is a set of leaky integrate-and-fire (LIF) neurons with random connections between them [
57]. The reservoir contains three sequential transformations: matrix
(input transformation – the input vector is multiplied by it), matrix
W (the neurons themselves), matrix
(output transformation
W). All values in the
and
matrices are initialized randomly according to the Bernoulli’s law, the values of the connections in the matrix
W are distributed according to the normal law. We used the following network parameters: size of matrix
W was equal to
, leakage
, spectral radius of matrix
W was
, matrix connectivity for
W was equal to 0.9. As neuron activation function we choose a hyperbolic tangent function. The output from reservoir layer is transferred to readout layer, which is a ridge regression layer in our architecture. The regularization parameter was set to
.
Comparing to other deep learning frameworks, RC has several advantages: a fast training process, simplicity of implementation, reduction of computational cost, and no vanishing or exploding gradient problems [
60]. Moreover, RC networks do have memory and, for this reason, are capable of tackling temporal and sequential problems. These advantages have attracted increasing interest in RC research and many of its applications since its conception. Another valuable feature of RC is its relatively biological plausibility, which implies its potential for scalability through physical implementations [
61].
Additionally, the same reservoir can be used to learn several different mappings from the same input signal. In our case, a single reservoir can be used, e.g., both for prediction of activity in the CA1 region based on fEPSP signals from the CA3 region and simultaneously for classification of the fEPSP signals into two classes: signals from healthy hippocampus and signals from damaged hippocampus. To do this, one simply trains one readout function for the prediction task and another for the classification. In the inference mode, the reservoir is driven by an fEPSP signal, and both readout functions can be used simultaneously to obtain two different output signals from the same reservoir [
59].
4.3. Evaluation Metrics
To assess the quality of the predicted signal, we used two evaluation metrics. The first one is Mean Absolute Percentage Error (MAPE), which is widely used for time series forecasting [
62]:
where
is the true value and
is the predicted value.
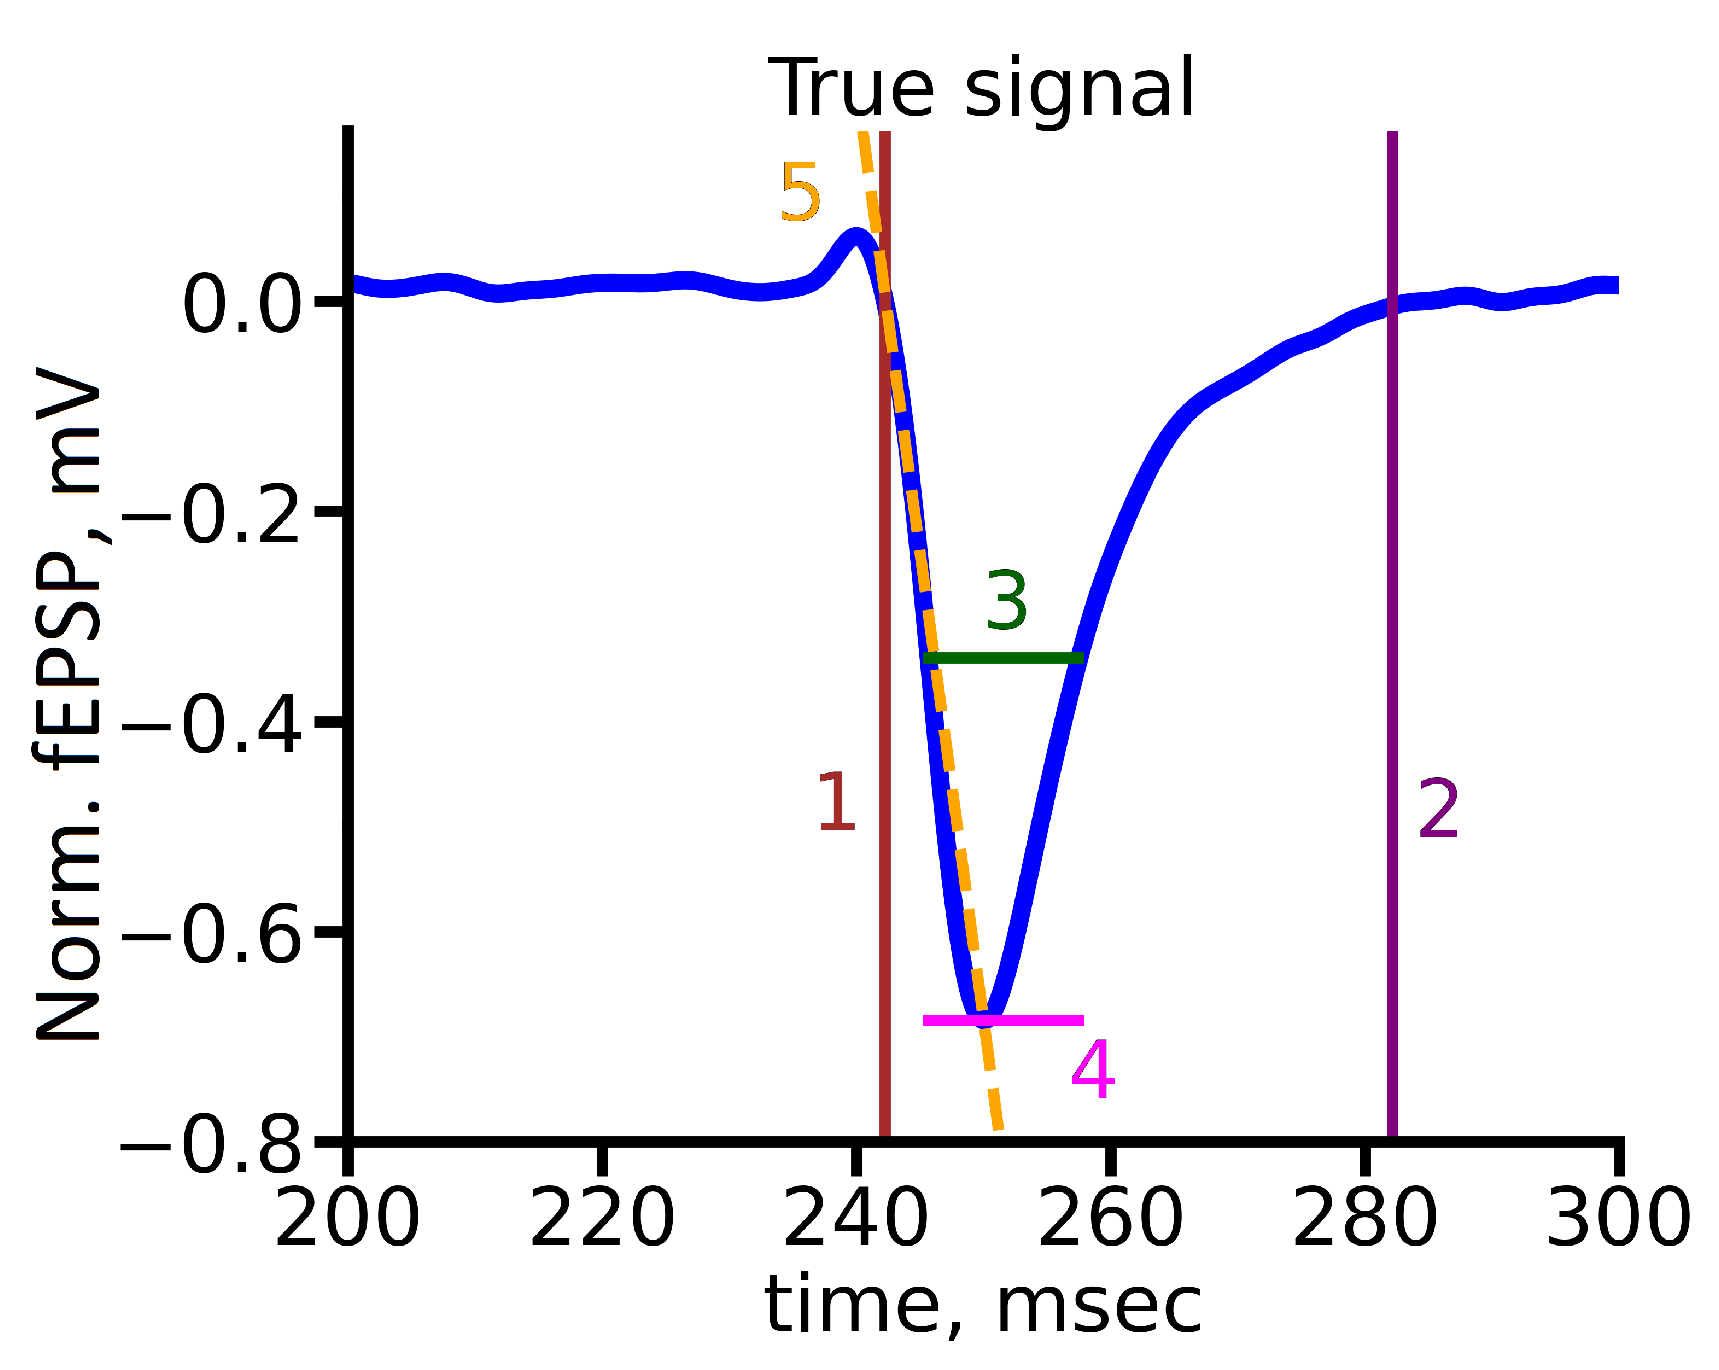
The second one is a custom metric based on several fEPSP parameters that describe the functional properties of the neurons group that directly generate the signal. We include the following signal parameters: rise time, decrease time, response time halfwidth, amplitude, and slope, as shown in
Figure 5. Namely, we define the evaluation metric as the combination of squares of slope, response time halfwidth, rise time, and decay time with corresponding weights: 0.05, 0.4, 0.3, 0.05, and 0.2. Also, we normalized values of each part of metric to be in range from 0 to 1. The choice of the evaluation metric was specified by biological background of the problem.
4.4. Training Process
To train the neural network, the averaged fEPSP from the CA3 hippocampal area (input signal) was presented in response to different electrical stimulus amplitude (from 100 to 1000 A). The predicted output fEPSP for the CA1 hippocampal area was obtained as an output signal for further use in a real-time biological experiment.
During training we optimise Mean Squared Error (MSE) loss function, which is
where
n is the number of training sequences,
is a correct sample, and
is a predicted sample.
The model was trained on ten preprocessed records. We used cross validation approach with the following partition scheme: in each iteration nine records were used for the training set, and one for the test set.
5. Experiments and Comparisons of Deep Learning Architectures
In this section, we present experimental results and compare two different learning architectures: the first architecture is based on a traditional feedforward neural network, while the second architecture utilizes a convolutional neural network (CNN). We analyze the performance of each architecture in terms of accuracy, training time, and computational complexity.
5.1. Exploratory Data Analysis
The signal we utilize contains data from a single electrode, as opposed to previous studies that employed MIMO techniques [
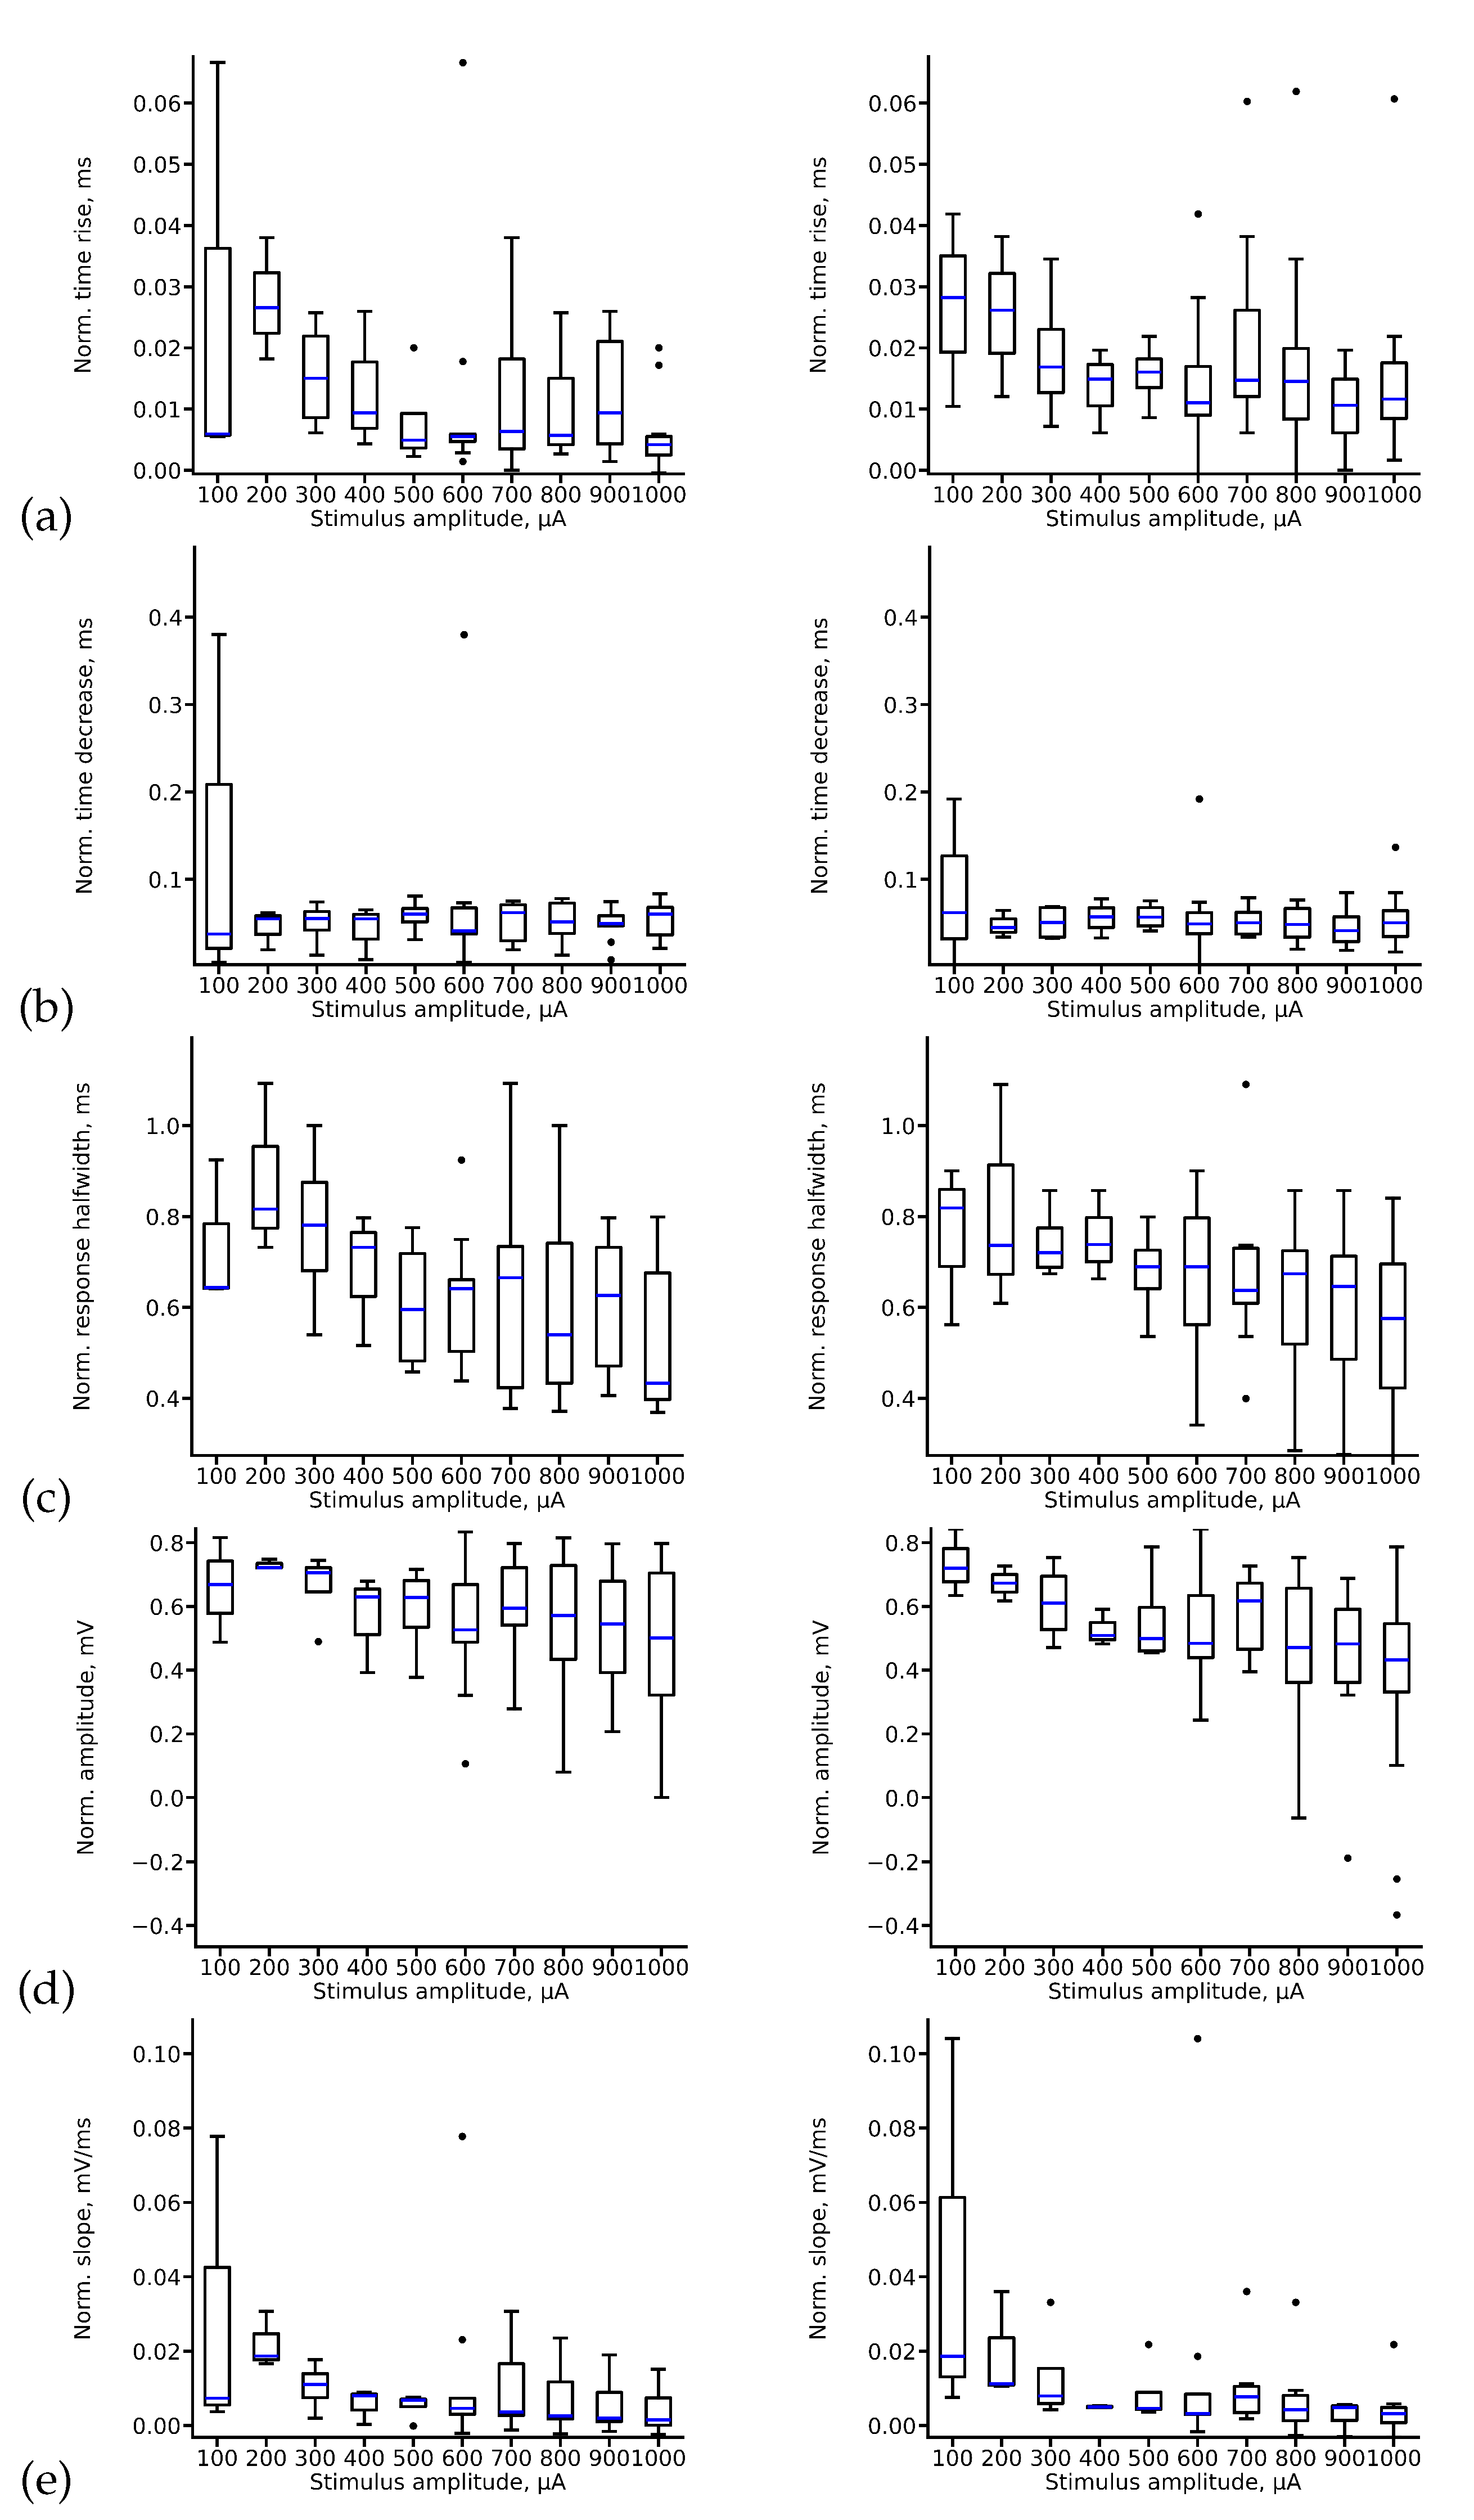
27]. To extract the maximum information from this signal, we conduct exploratory data analysis to study and summarize the main characteristics of the obtained fEPSP signal datasets, as shown in
Figure 6. As observed, most features exhibit a smooth dependence of the mean value on the stimulus amplitude. However, outliers are present in all cases, indicated by the blue dots in the figure.
Note that for some parameters, such as the decrease time (
Figure 6(b)) and slope (
Figure 6(e)), the variance is quite limited, except in the case of 100
A amplitude stimuli. However, for other parameters, like response half-width, the variance is generally sufficient in almost all cases (
Figure 6(c)).
The variance for rise time (
Figure 6(a)) and amplitude (
Figure 6(d)) strongly depends on the amplitude of the stimulus. We can distinguish groups of signals with relatively small dispersion in these parameters and others with a much stronger dispersion. Additionally, it is noteworthy that CA3 and CA1 signals can also be statistically distinguished.
Analyzing the statistical properties of these parameters leads us to consider the possible existence of clusters in the data. Identifying such clusters could help us understand qualitative changes in the slice’s response to the stimulus as the stimulation amplitude changes, which could have implications for deep learning algorithms.
To test this hypothesis, we employ the hierarchical density-based spatial clustering of applications with noise (HDBSCAN) algorithm, which allows us to identify clusters without prior knowledge of their quantity.
As shown, the method identified three clusters (classes) in the data. The first class comprises the noisiest signals. In the second class, the response begins with a short-term and small amplitude increase in the fEPSP level, while the third class exhibits the most characteristic response to a rectangular pulse. Examples of all signal types are depicted in
Figure 7.
Considering the choice of evaluation metrics and the design of the learning process, we anticipate that our deep neural networks will provide less accurate predictions for signals belonging to Classes 1 and 2. Lower prediction quality for highly noisy signals (Class 1) is expected. The difficulty in predicting signals of a specific shape belonging to Class 2 arises from their unique response form and their relatively infrequent occurrence. Improving the accuracy of prediction for such signals requires further investigation.
5.2. Choosing Optimal Deep Learning Architecture for fEPSP Signal Prediction
In order to select optimal architecture for fEPSP signal prediction in the CA1 region based on the CA3 signal, we have compared two deep learning architectures: LSTM and RC.
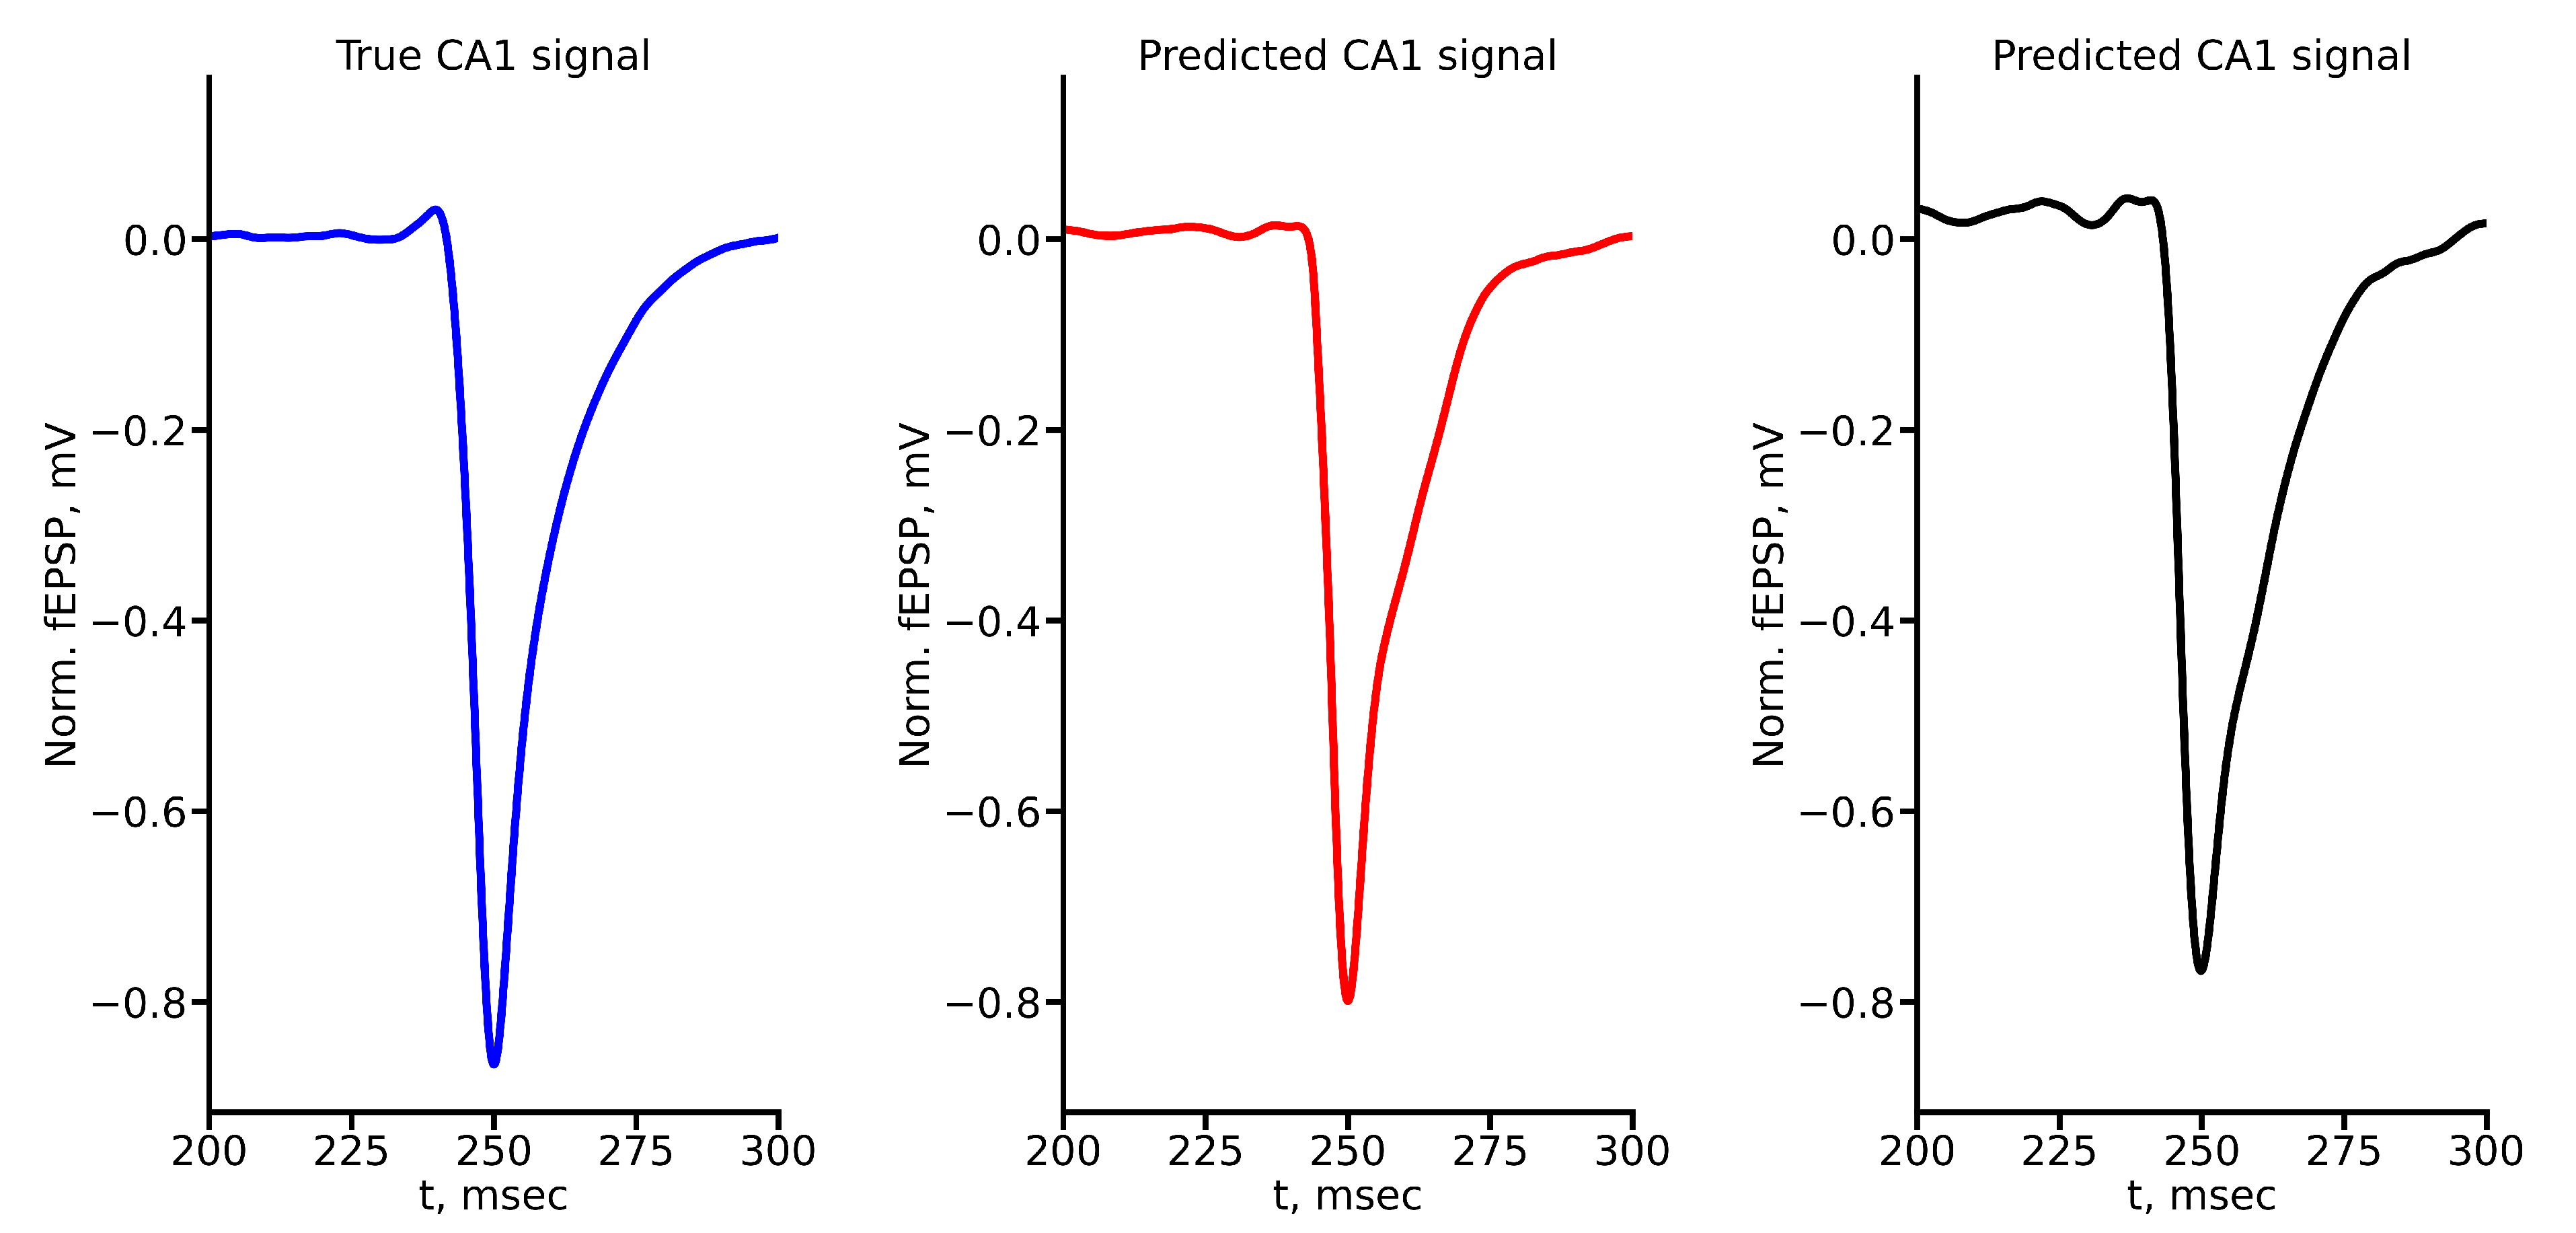
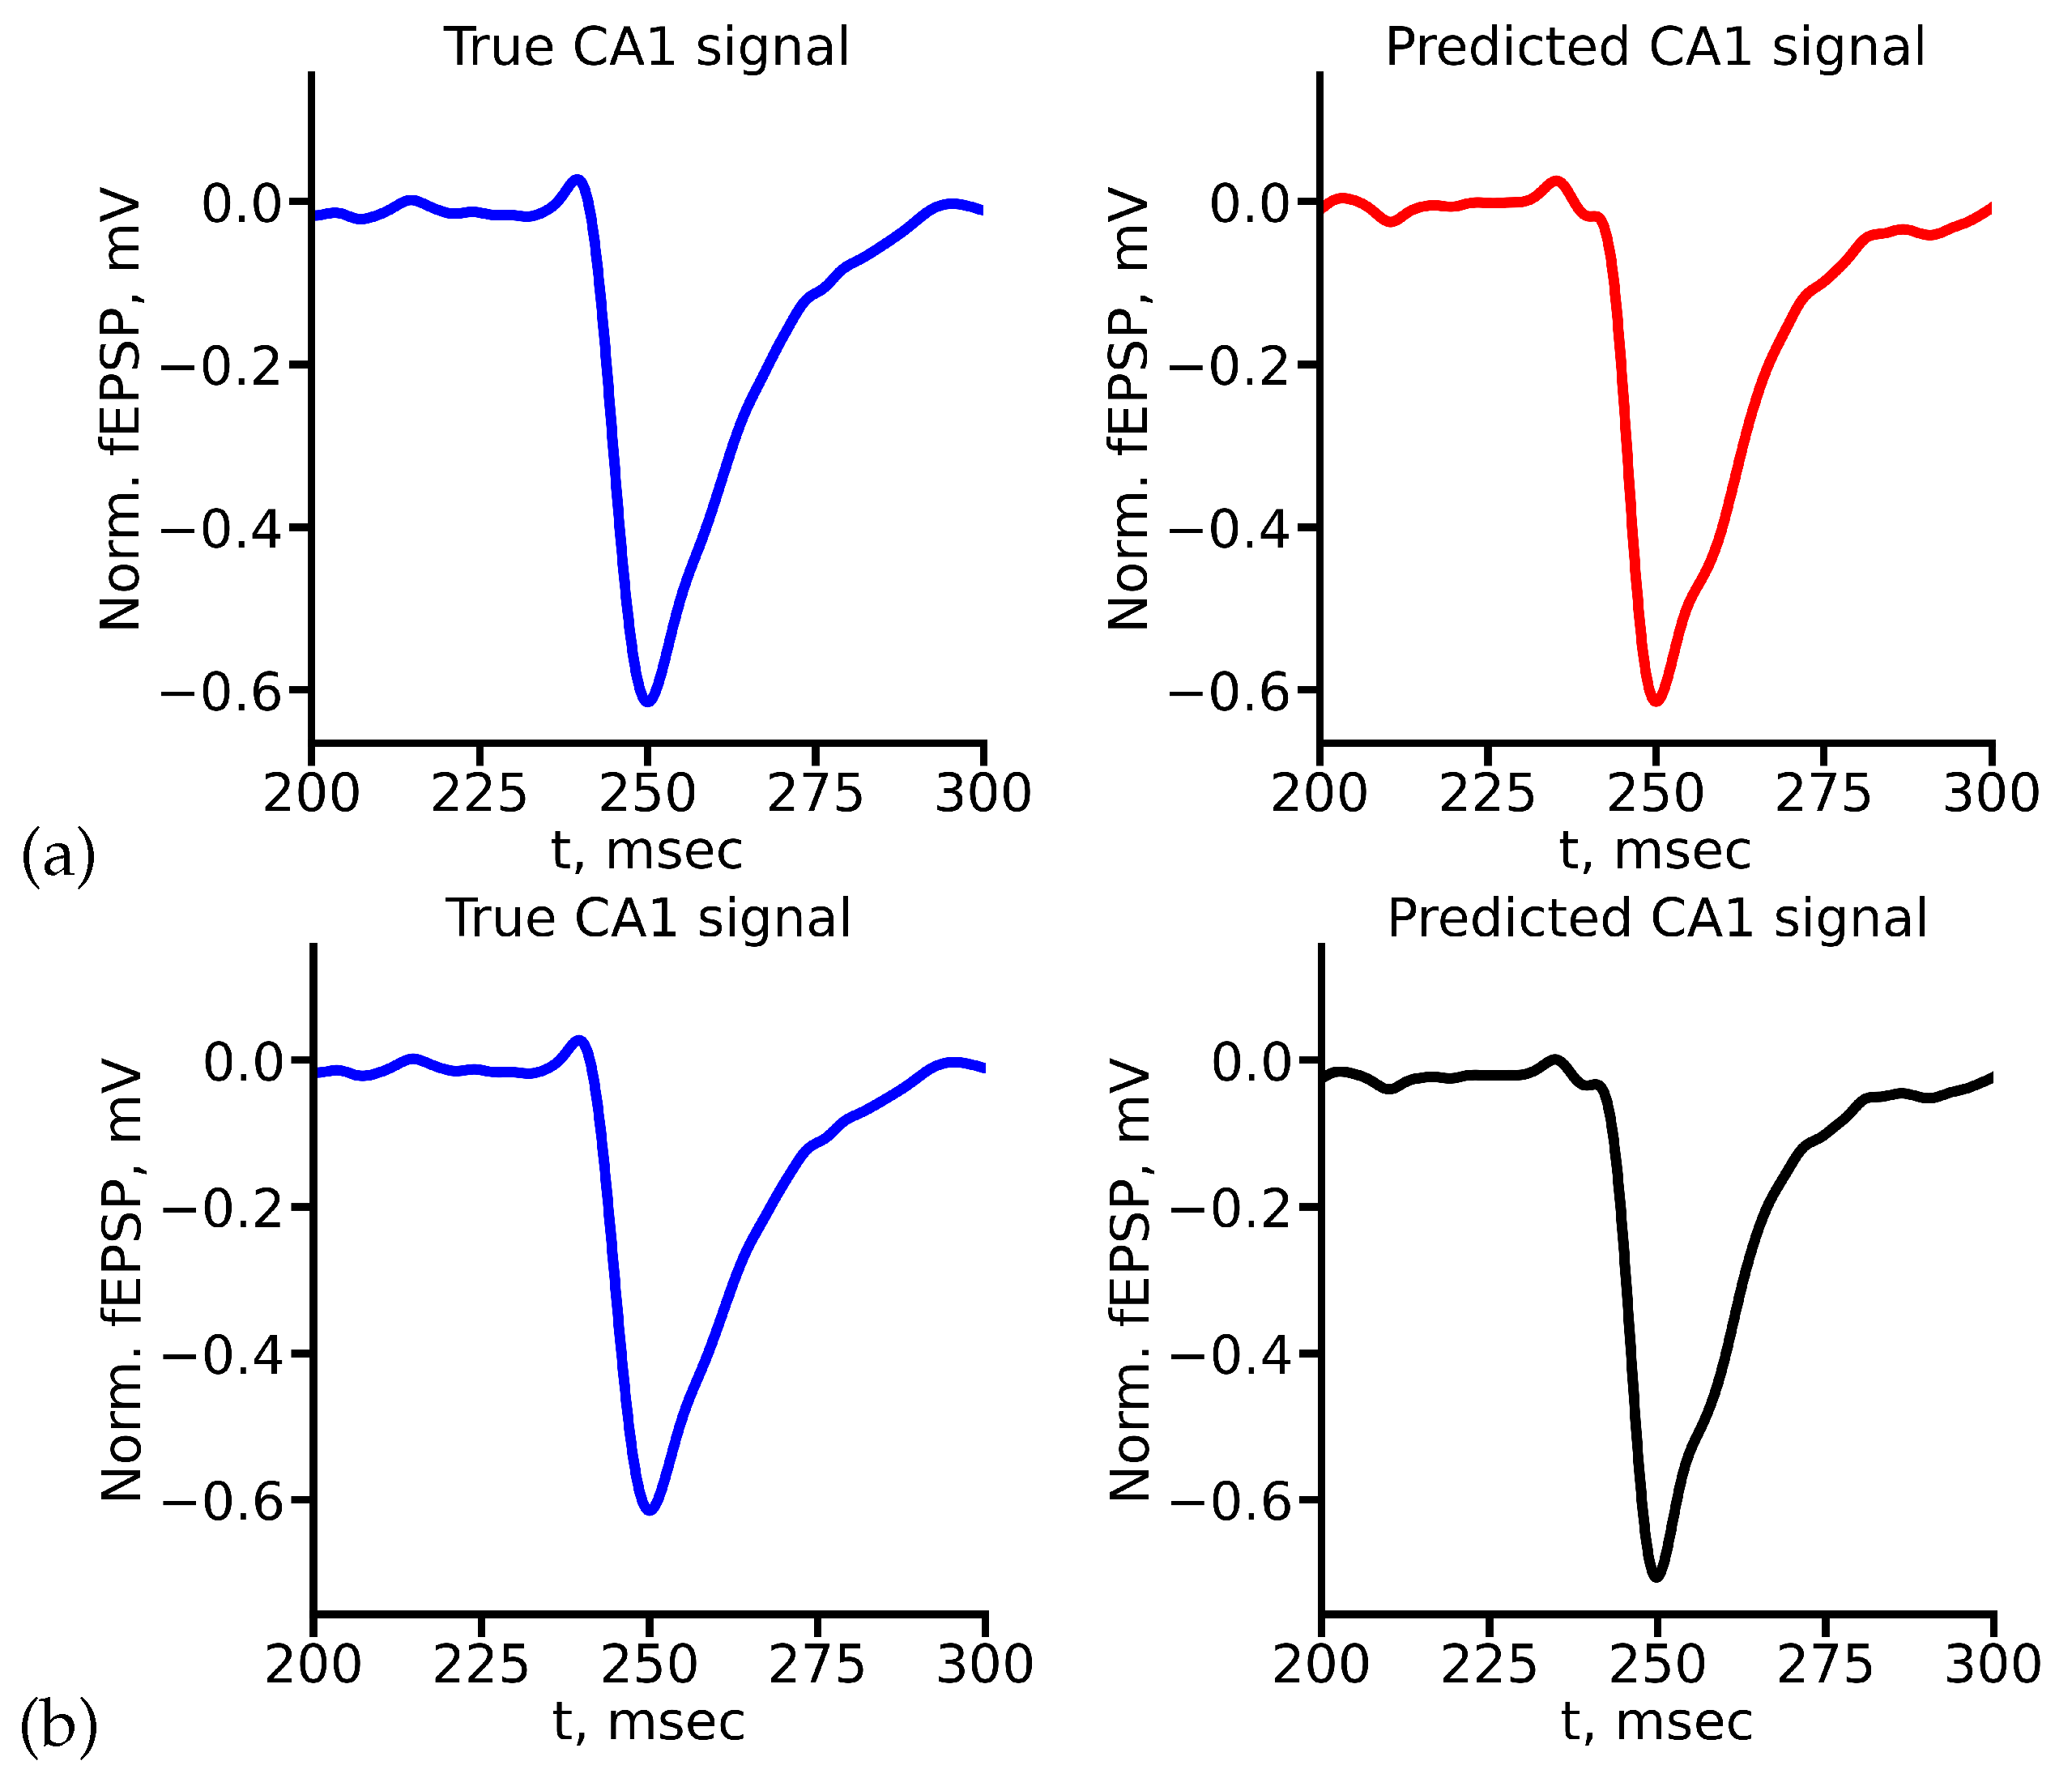
Figure 8 shows the example of true and predicted CA1 signals for LSTM (
Figure 8(a)) and reservoir (
Figure 8(b)) for stimulus amplitude equal to 400
A. All true and predicted signals for all stimulus amplitudes are presented in Appendix A.
Comparison of the values of evaluation metrics for predicted signals highlight the ability of two networks to capture and mimic certain features and characteristics of signals. As one can see from
Figure 9, in general both deep learning architectures allow to obtain quite accurate prediction. According to the MAPE metric, both networks showed approximately the same result (
Figure 9(a)), except the case of 1000
A stimulus. Nevertheless, taking into account our custom weighted metric shows that in this case LSTM is able to predict valuable features of signal quite exactly. RC in this case shows worse but still acceptable results. Custom weighted metric also can distinguish amplitudes, for which each network shows better accuracy (
Figure 9(b)).
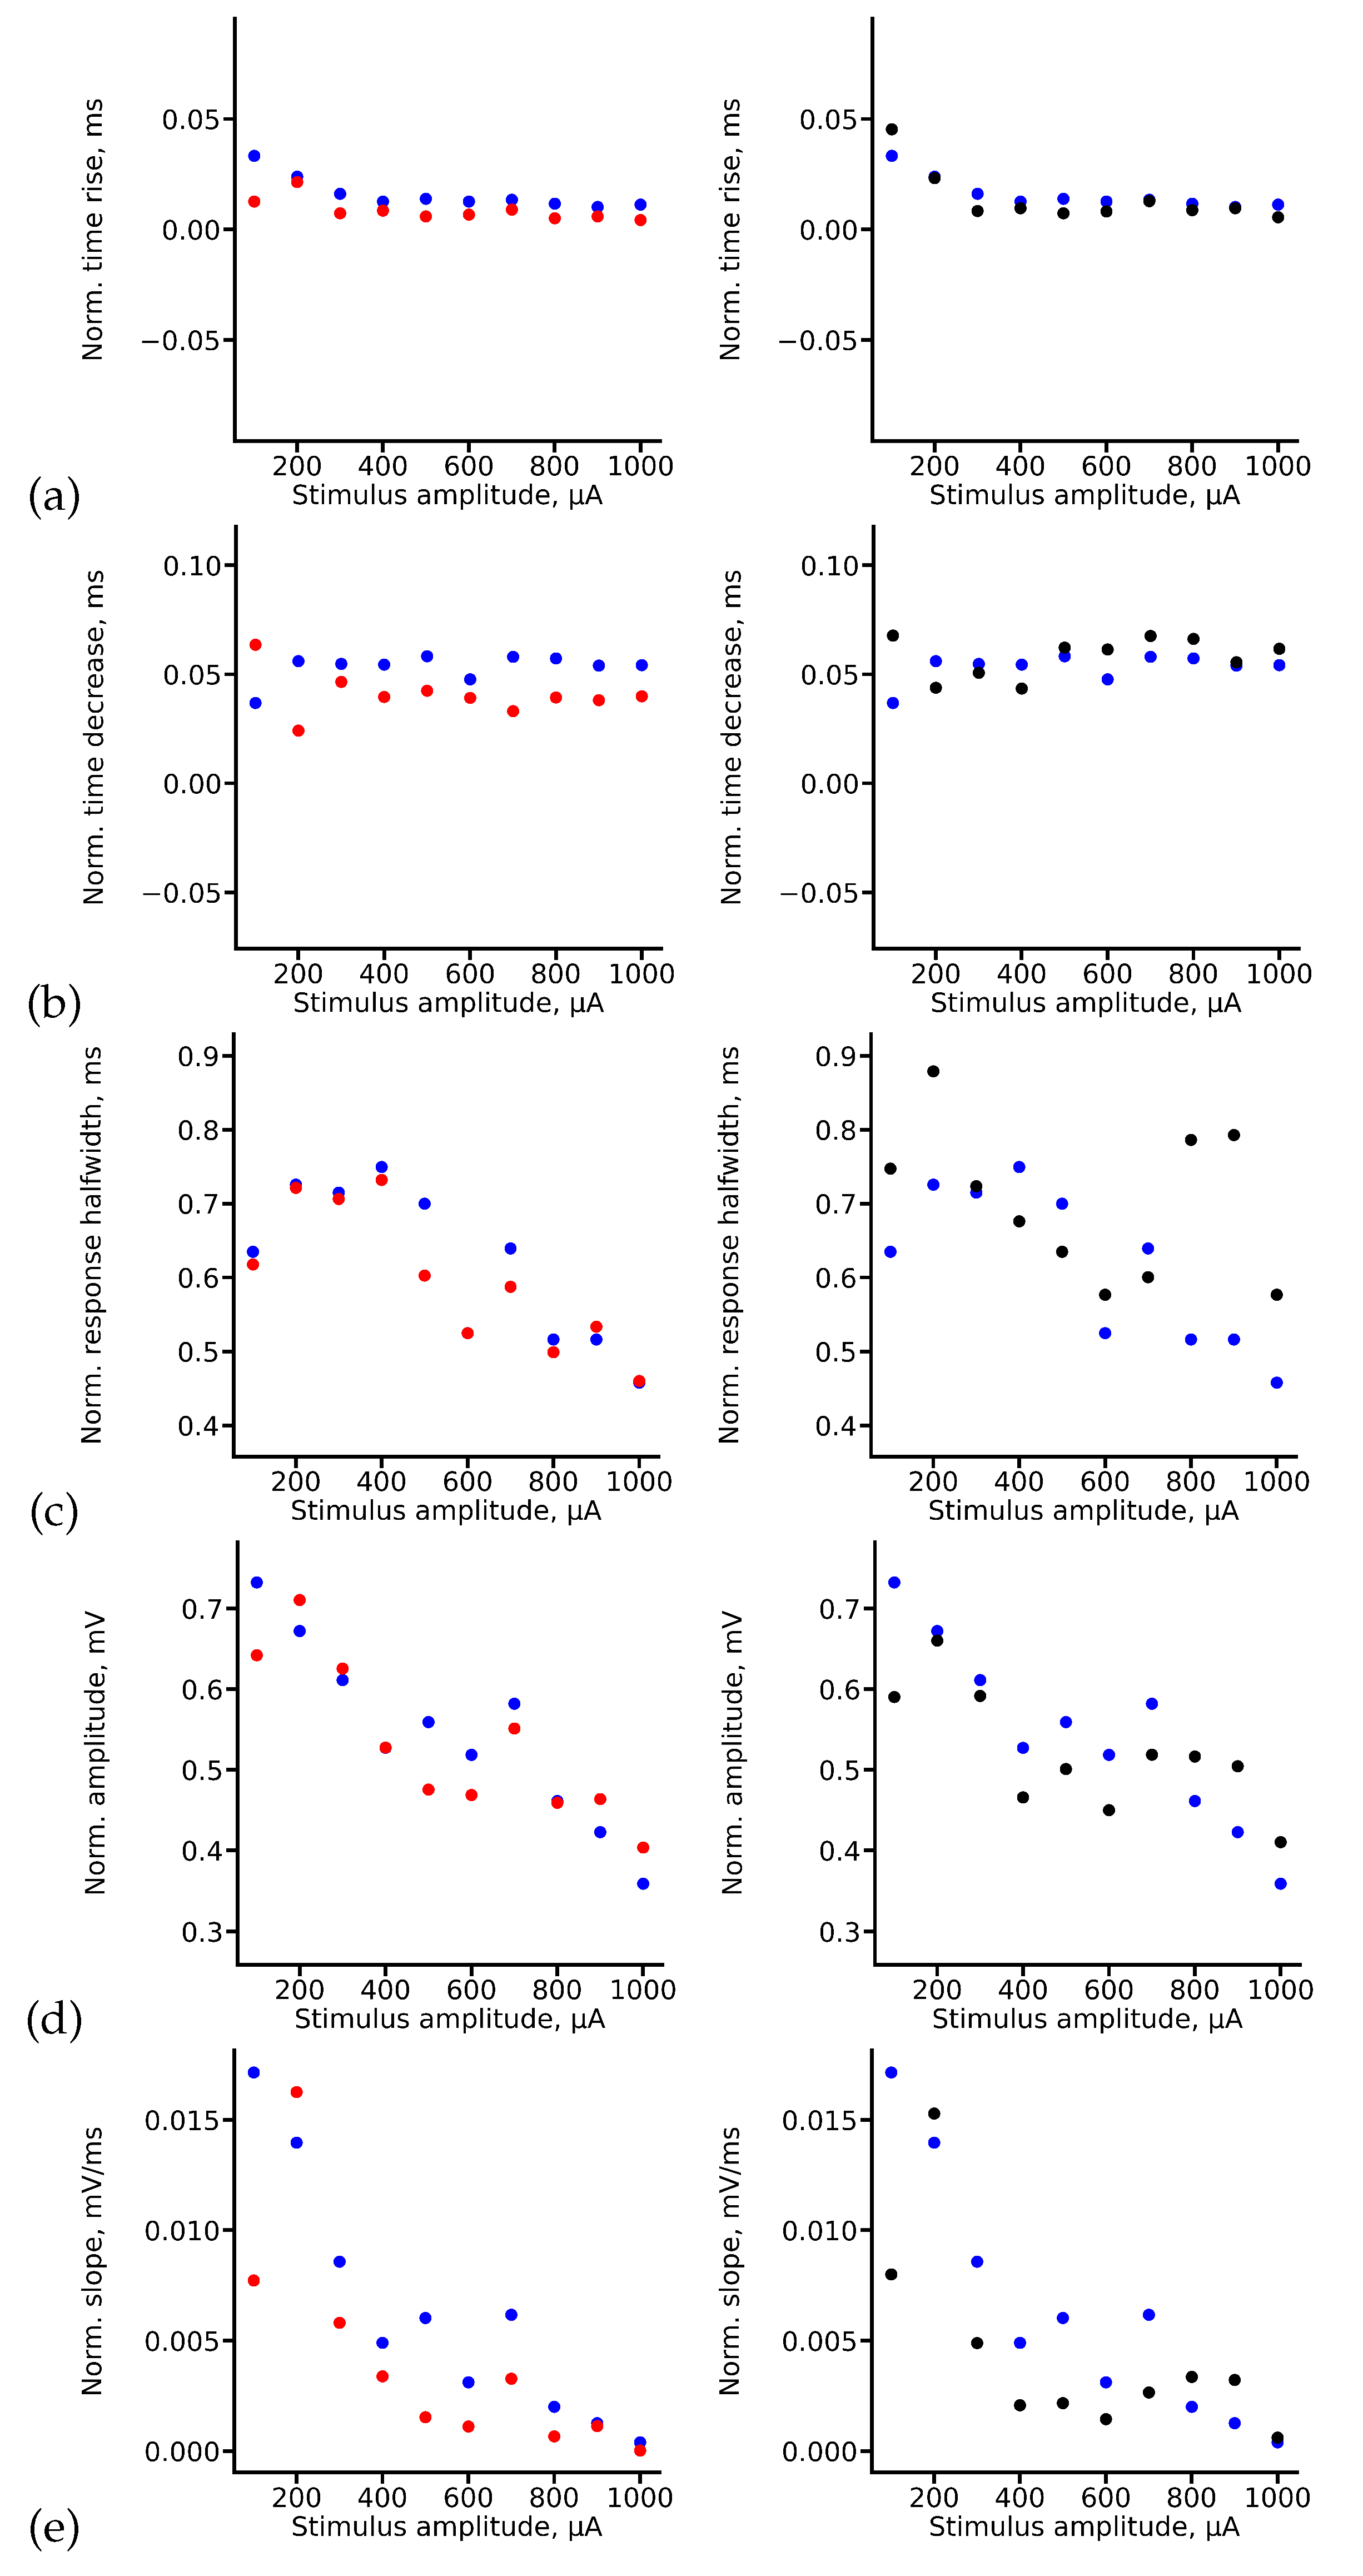
Let us analyze how RC and LSTM deep neural networks predict specific features of signals that we take into account in our custom metric separately. In order to do this we plot true and predicted values of rise time, decrease time, halfwidth, amplitude and slope of CA1 fEPSP signals, see
Figure 10. As one can see from
Figure 10(a)-(b) both deep learning architectures predict rise time and decrease time of fEPSP CA1 quite accurately. Moreover, RC shows better accuracy compared to the LSTM. Nevertheless, LSTM copes better with the prediction of halfwidth of fEPSP CA1 signals in most cases, while RC fails to predicts this parameter for high stimulus amplitudes (800–1000
A), see
Figure 10(c).
Figure 10(d) shows results for true and predicted amplitude of CA1 fEPSP signals. As one can see, for lower amplitudes of stimuli (100–300
A) both deep networks show good accuracy, while for higher amplitudes of stimuli prediction error is growing and LSTM shows slightly better accuracy than RC. As for the slope parameter, both networks shows approximately the same result, see
Figure 10(e).
To summarize, RC is able to predict CA1 fEPSP signals more accurately than LSTM on average taking into account different signal features separately. Also, RC has several other valuable advantages. First of all, it allows studying the inner structure of the reservoir that should statistically reflect features of neurotransmission in slice for optimal parameters of the reservoir, namely, for optimal number of neurons in the reservoir and the probability of couplings between them. In fact, the reservoir can be viewed as a dynamical system consisting of identical LIF neurons with couplings between them which are specified according to a certain statistical distribution. Thus, the reservoir simulates neuronal activity in the slice on a mesoscopic level. Second, the simple RC architecture allows its implementation in a microchip, where each element has more than two states. Since the reservoir is untrainable and only the last (output) layer is trained, this architecture is easy to implement in the form of spiking neural networks. This property makes RC the optimal deep learning architecture in the task of prediction of hippocampal signals in application to neurohybrid implantable chips.
6. Discussion
To simulate brain functions, a large number of biologically relevant neural networks (BNNs) are currently being developed. For instance, artificial neural networks (ANNs) have billions of simulated neurons connected in various topologies to perform complex tasks, such as object recognition and task learning beyond human capabilities [
42,
63,
64]. ANNs have profoundly revolutionized the field of information technology, leading to the development of more optimized and autonomous artificial intelligence systems [
43,
65,
66]. In addition, neuromorphic devices and platforms are currently being actively developed that combine artificial intelligence and the principles of brain cell operation [
67,
68,
69]. The most impressive work is aimed at developing neuromorphic systems, including miniature ones, that can be used for neuroprosthetics and neurorehabilitation [
70,
71,
72]. Of course, it is worth noting the work of Elon Musk on the development of neurochips for the tasks of restorative medicine [
73,
74,
75]. However, the widespread development of such studies and a thorough study of each stage in them are the most important tasks for the subsequent ability to apply the results of these studies in clinical medicine.
In recent years, deep learning (DL) has become the most popular computational approach in the field of machine learning (ML), allowing it to achieve exceptional performance on a variety of complex cognitive tasks that match or even exceed human capabilities [
76,
77,
78]. The ability to learn huge amounts of data is one of the benefits of deep learning. Of course, there is active development and application of DL to create neuromorphic miniature chips that will reproduce brain functions. In addition to the neurohybrid chips indicated in the introduction of our paper [
10,
11,
12,
13,
14,
17], there is neuromorphic chips that have the ANN architecture [
79], as well as hybrid ANNs in combination with spike artificial networks. Tianjic chip has a neuromorphic processor and a computing module based on it, the architecture of which is adapted to the operation of both classical ANNs and pulsed ones, which in their operating principle are closer to BNNs. The chip contains more than 150 cores, each of which consists of artificial analogues of an axon, a synapse, a dendrite, and a perikaryon, which allows simulating real neuronal activity. In this case, the cores can switch between two operating modes, as well as convert signals from a classical neural network with a certain value into binary nerve impulses for a pulsed neural network and vice versa [
80]. Thus, the approach to the development of neurohybrid chips and neuromorphic devices is an extremely urgent task.
Being implemented on a neurohybrid system, described deep architectures can provide the restoration of memory functions in the damaged rodent hippocampus. Note that different promising architectures, such as memristor-based chips, can be used as a hardware platform in this task [
41]. Although proposed investigation is limited to rodent studies, it is highly likely that our approach will be applicable to other types of acquired brain injury. Such studies are extremely important for the treatment of neurodegenerative diseases associated with memory impairment and have high prospects for future use in practical medicine.
7. Conclusions
In the presented study we have proposed and tested the approach based on deep learning for restoring the activity in damaged hippocampus in mice in vitro in hippocampal slices. In order to do this we have compared two deep neural architectures in the task of prediction of fEPSP signals in the CA1 region of hippocampus based on fEPSP signals in the CA3 region as an input.
To assess the performance of the proposed deep learning model, we have used two evaluation metrics: MAPE and custom complex evaluation metrics, which allowed us to take into account valuable features of the signals. The accuracy of training have shown how well the deep learning model fitted the features of the response, such as slope, half-width of the response time, rise time, and decay time, for a given stimulus amplitude. In addition, the prediction accuracy has demonstrated how well the deep learning model predicted the synaptic parameters for the data that were excluded from the training set. We have compared the results of the prediction for averaged and non-averaged signals. While the averaged signals allowed us to deduce the universal form of the response for each stimulus, using the non-averaged signals implied that a similar procedure can be performed by our deep neural model itself.
Thus, using these metrics, we have compared the performance of two deep architectures, LSTM and RC, with our data. Our numerical experiments have shown that RC demonstrated better accuracy both on average and in predicting of several important signal characteristics. The results of our study allowed us to conclude that RC is the optimal deep architecture in the proposed approach, and it is very promising for further implementation on a neural chip.
Author Contributions
Conceptualization, A.V.L., S.A.G., T.A.L., L.A.S. and A.N.P.; methodology, A.V.L., S.A.G., T.A.L. and L.A.S.; software, M.I.S., V.V.R. and N.V.G.; validation, A.V.L., S.A.G., L.A.S., T.A.L. and A.N.P.; investigation, M.I.S., V.V.R., N.V.G., A.V.L., S.A.G., T.A.L. and L.A.S.; data curation, A.V.L.; writing — original draft preparation, A.V.L., T.A.L., L.A.S. and A.N.P.; writing—review and editing, A.V.L, T.A.L. and A.N.P.; visualization, A.V.L., M.I.S., V.V.R. and N.V.G.; supervision, A.V.L., S.A.G., L.A.S. and A.N.P.; project administration, A.V.L. and T.A.L.; funding acquisition, A.V.L. and L.A.S.
Funding
Data collection, preprocessing and choosing the optimal network architecture was supported by the Russian Science Foundation (Project No. 23-75-10099), parameter calculation and signal prediction using neural networks (model training and testing) was supported by the Ministry of Science and Education of Russian Federation (Contract FSWR-2024-0005).
Data Availability Statement
The data sets generated and/or analysed during the current study are available from the corresponding author on reasonable request.
Acknowledgments
We are grateful to V. Kostin for valuable discussions.
Conflicts of Interest
The authors declare no conflict of interest.
Appendix A True and Predicted fEPSP Signals at Different Stimulus Amplitudes
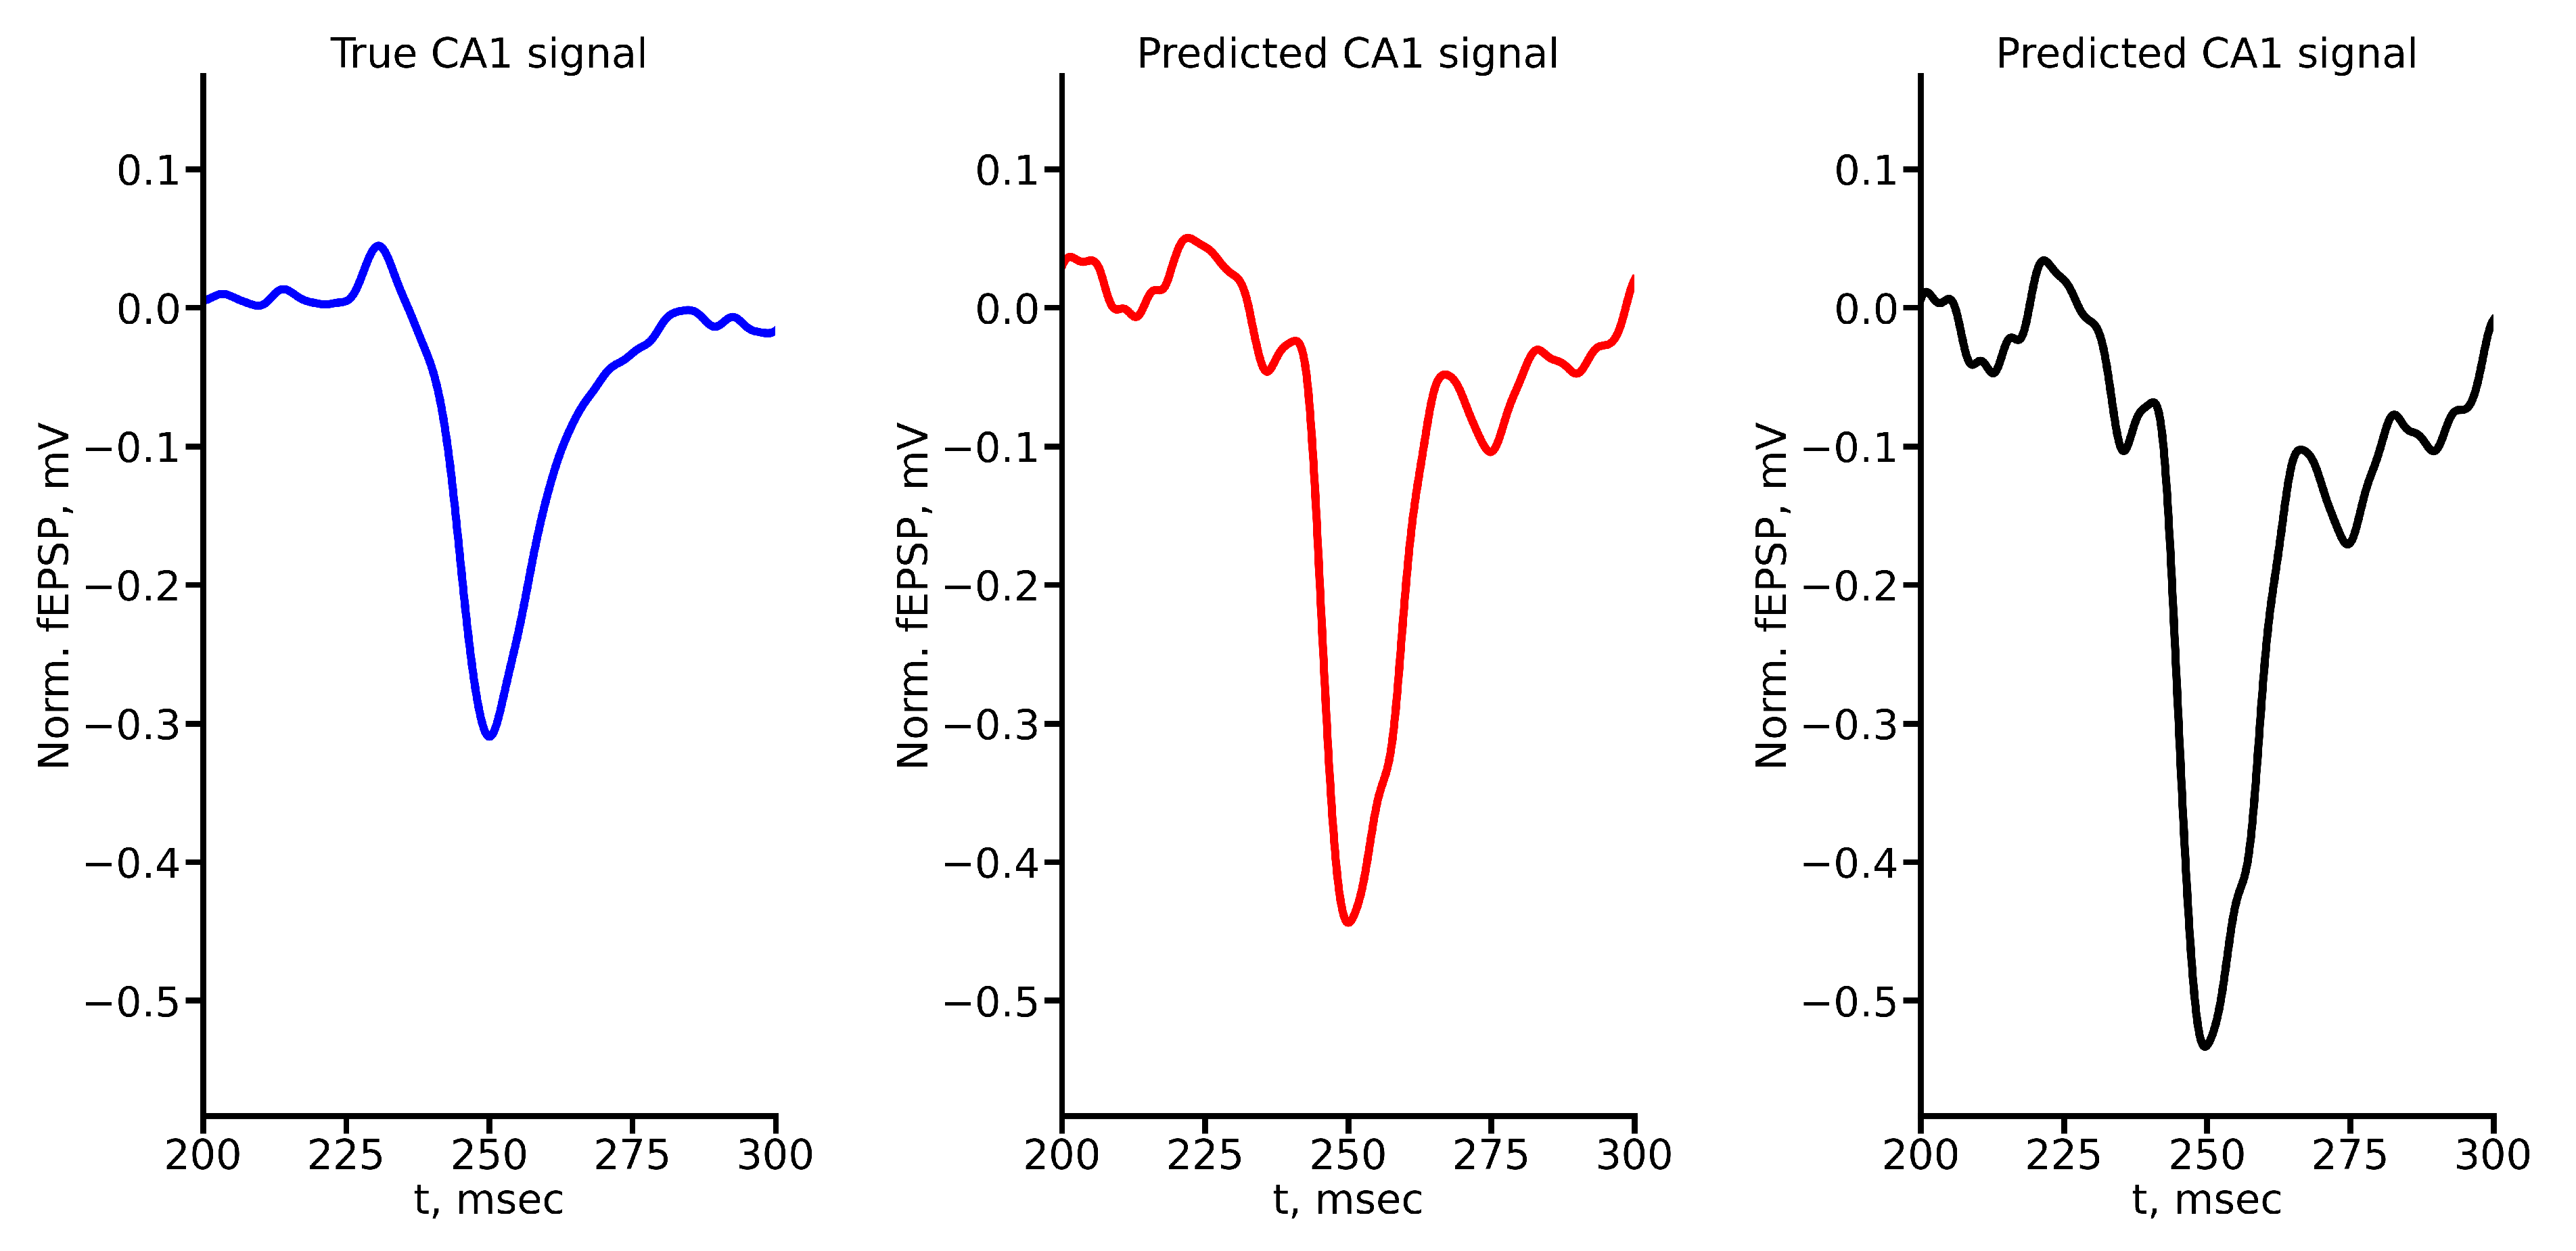
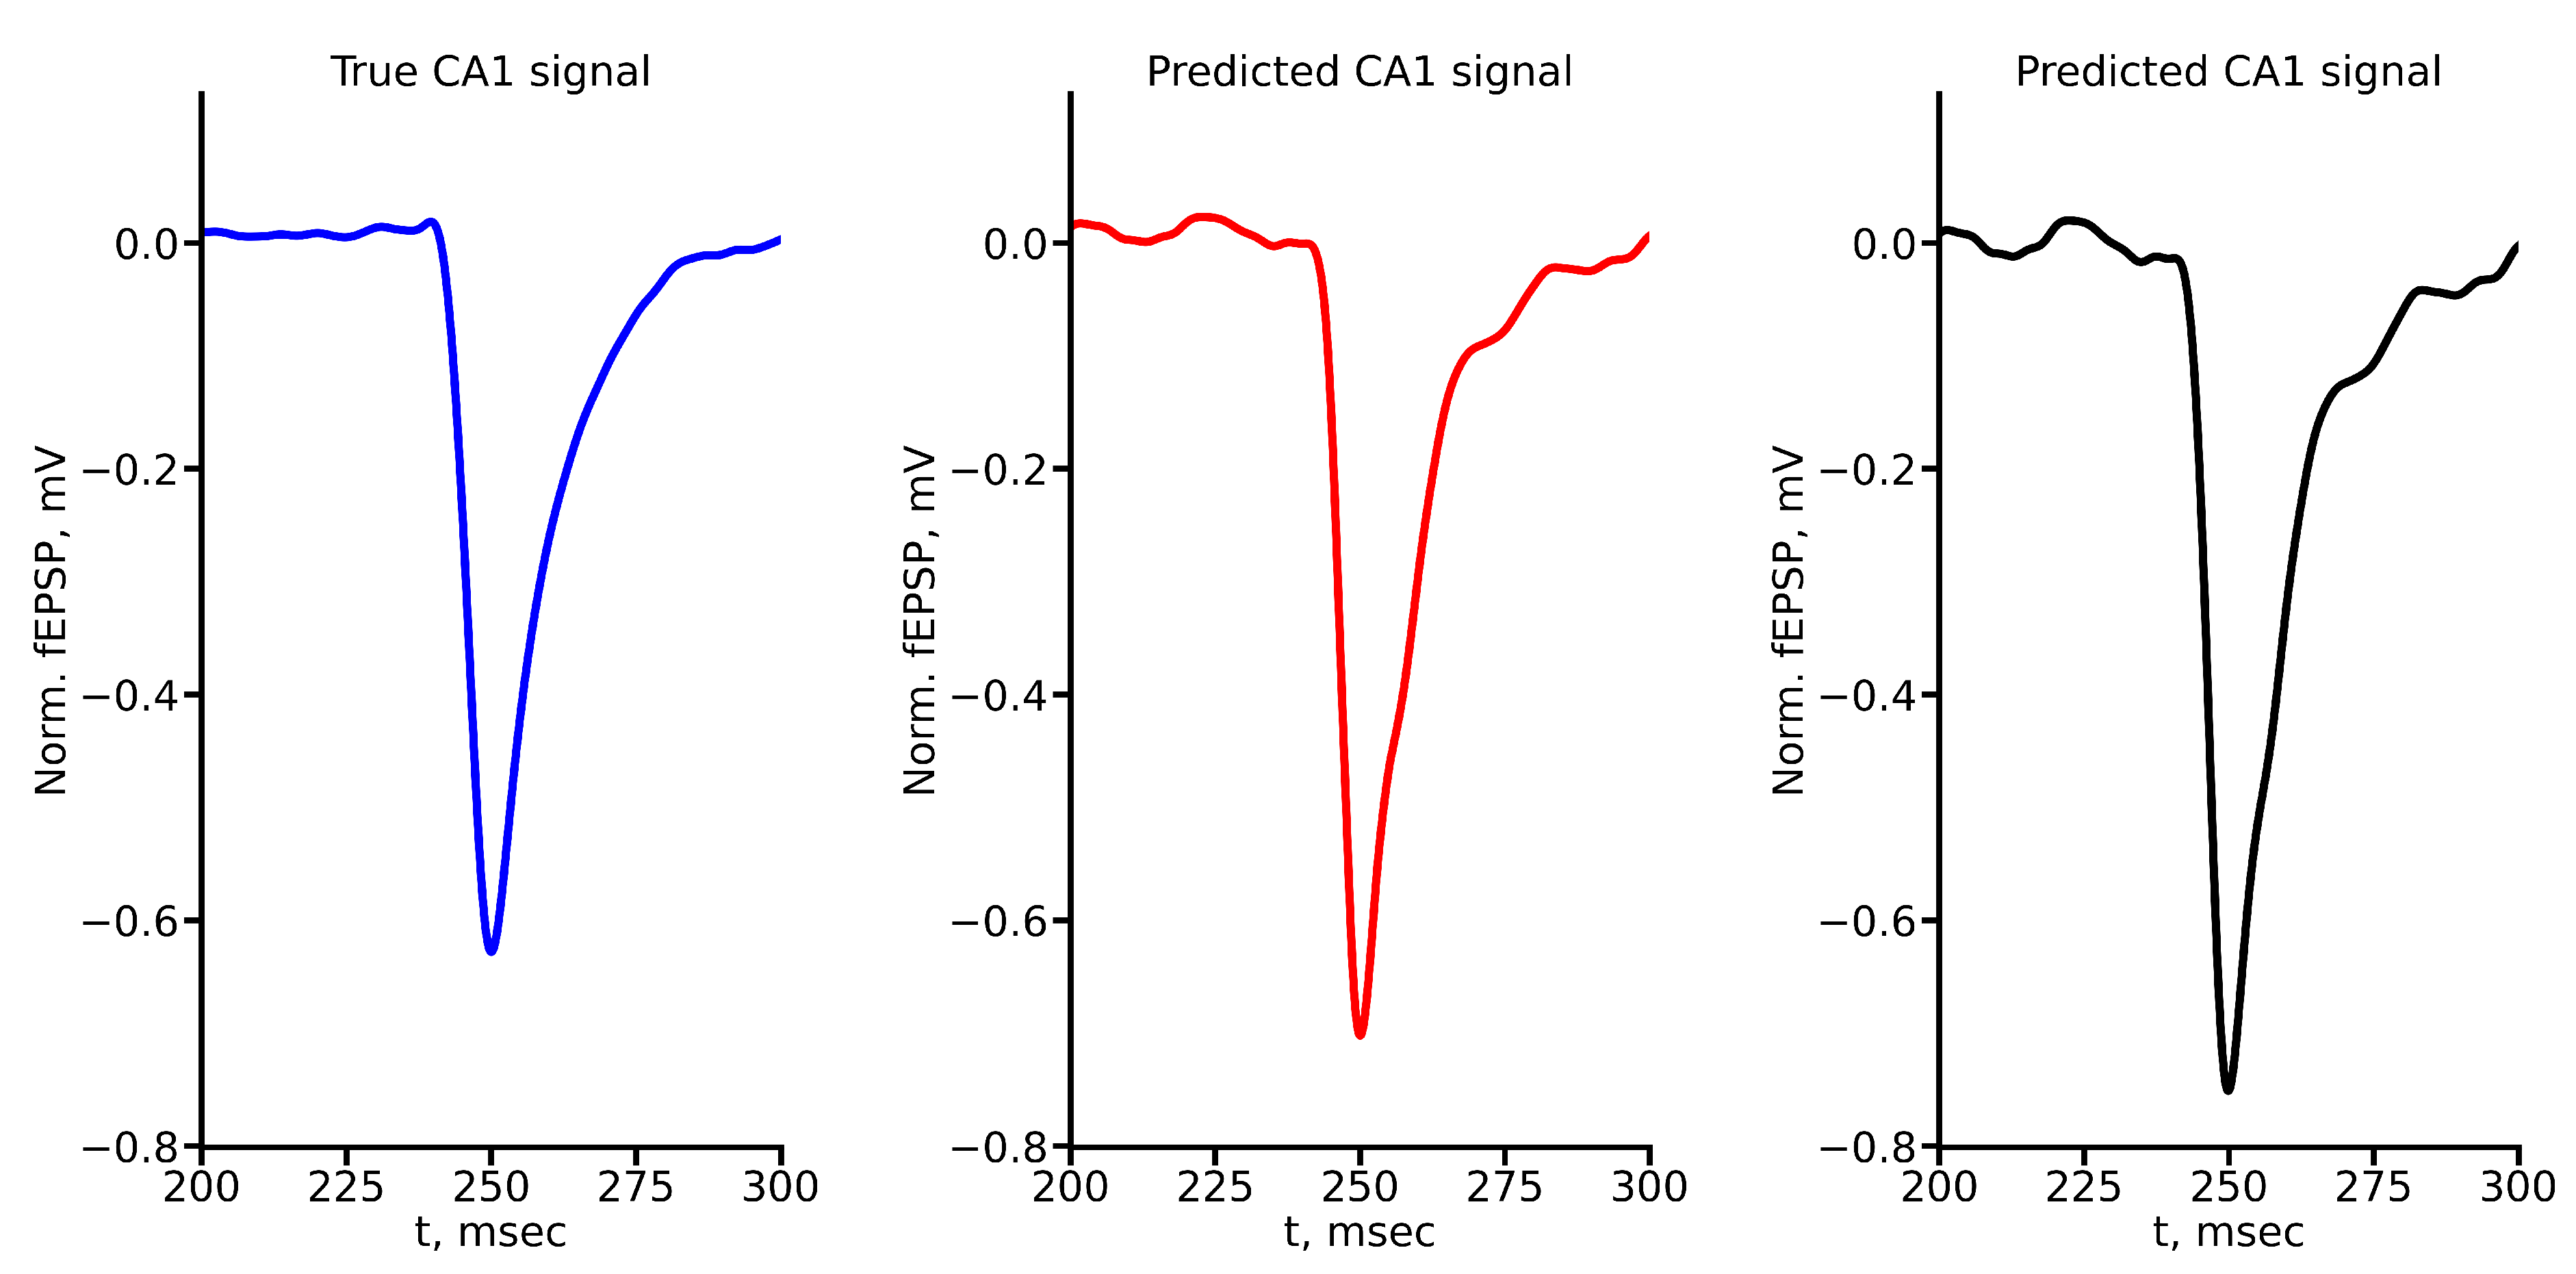
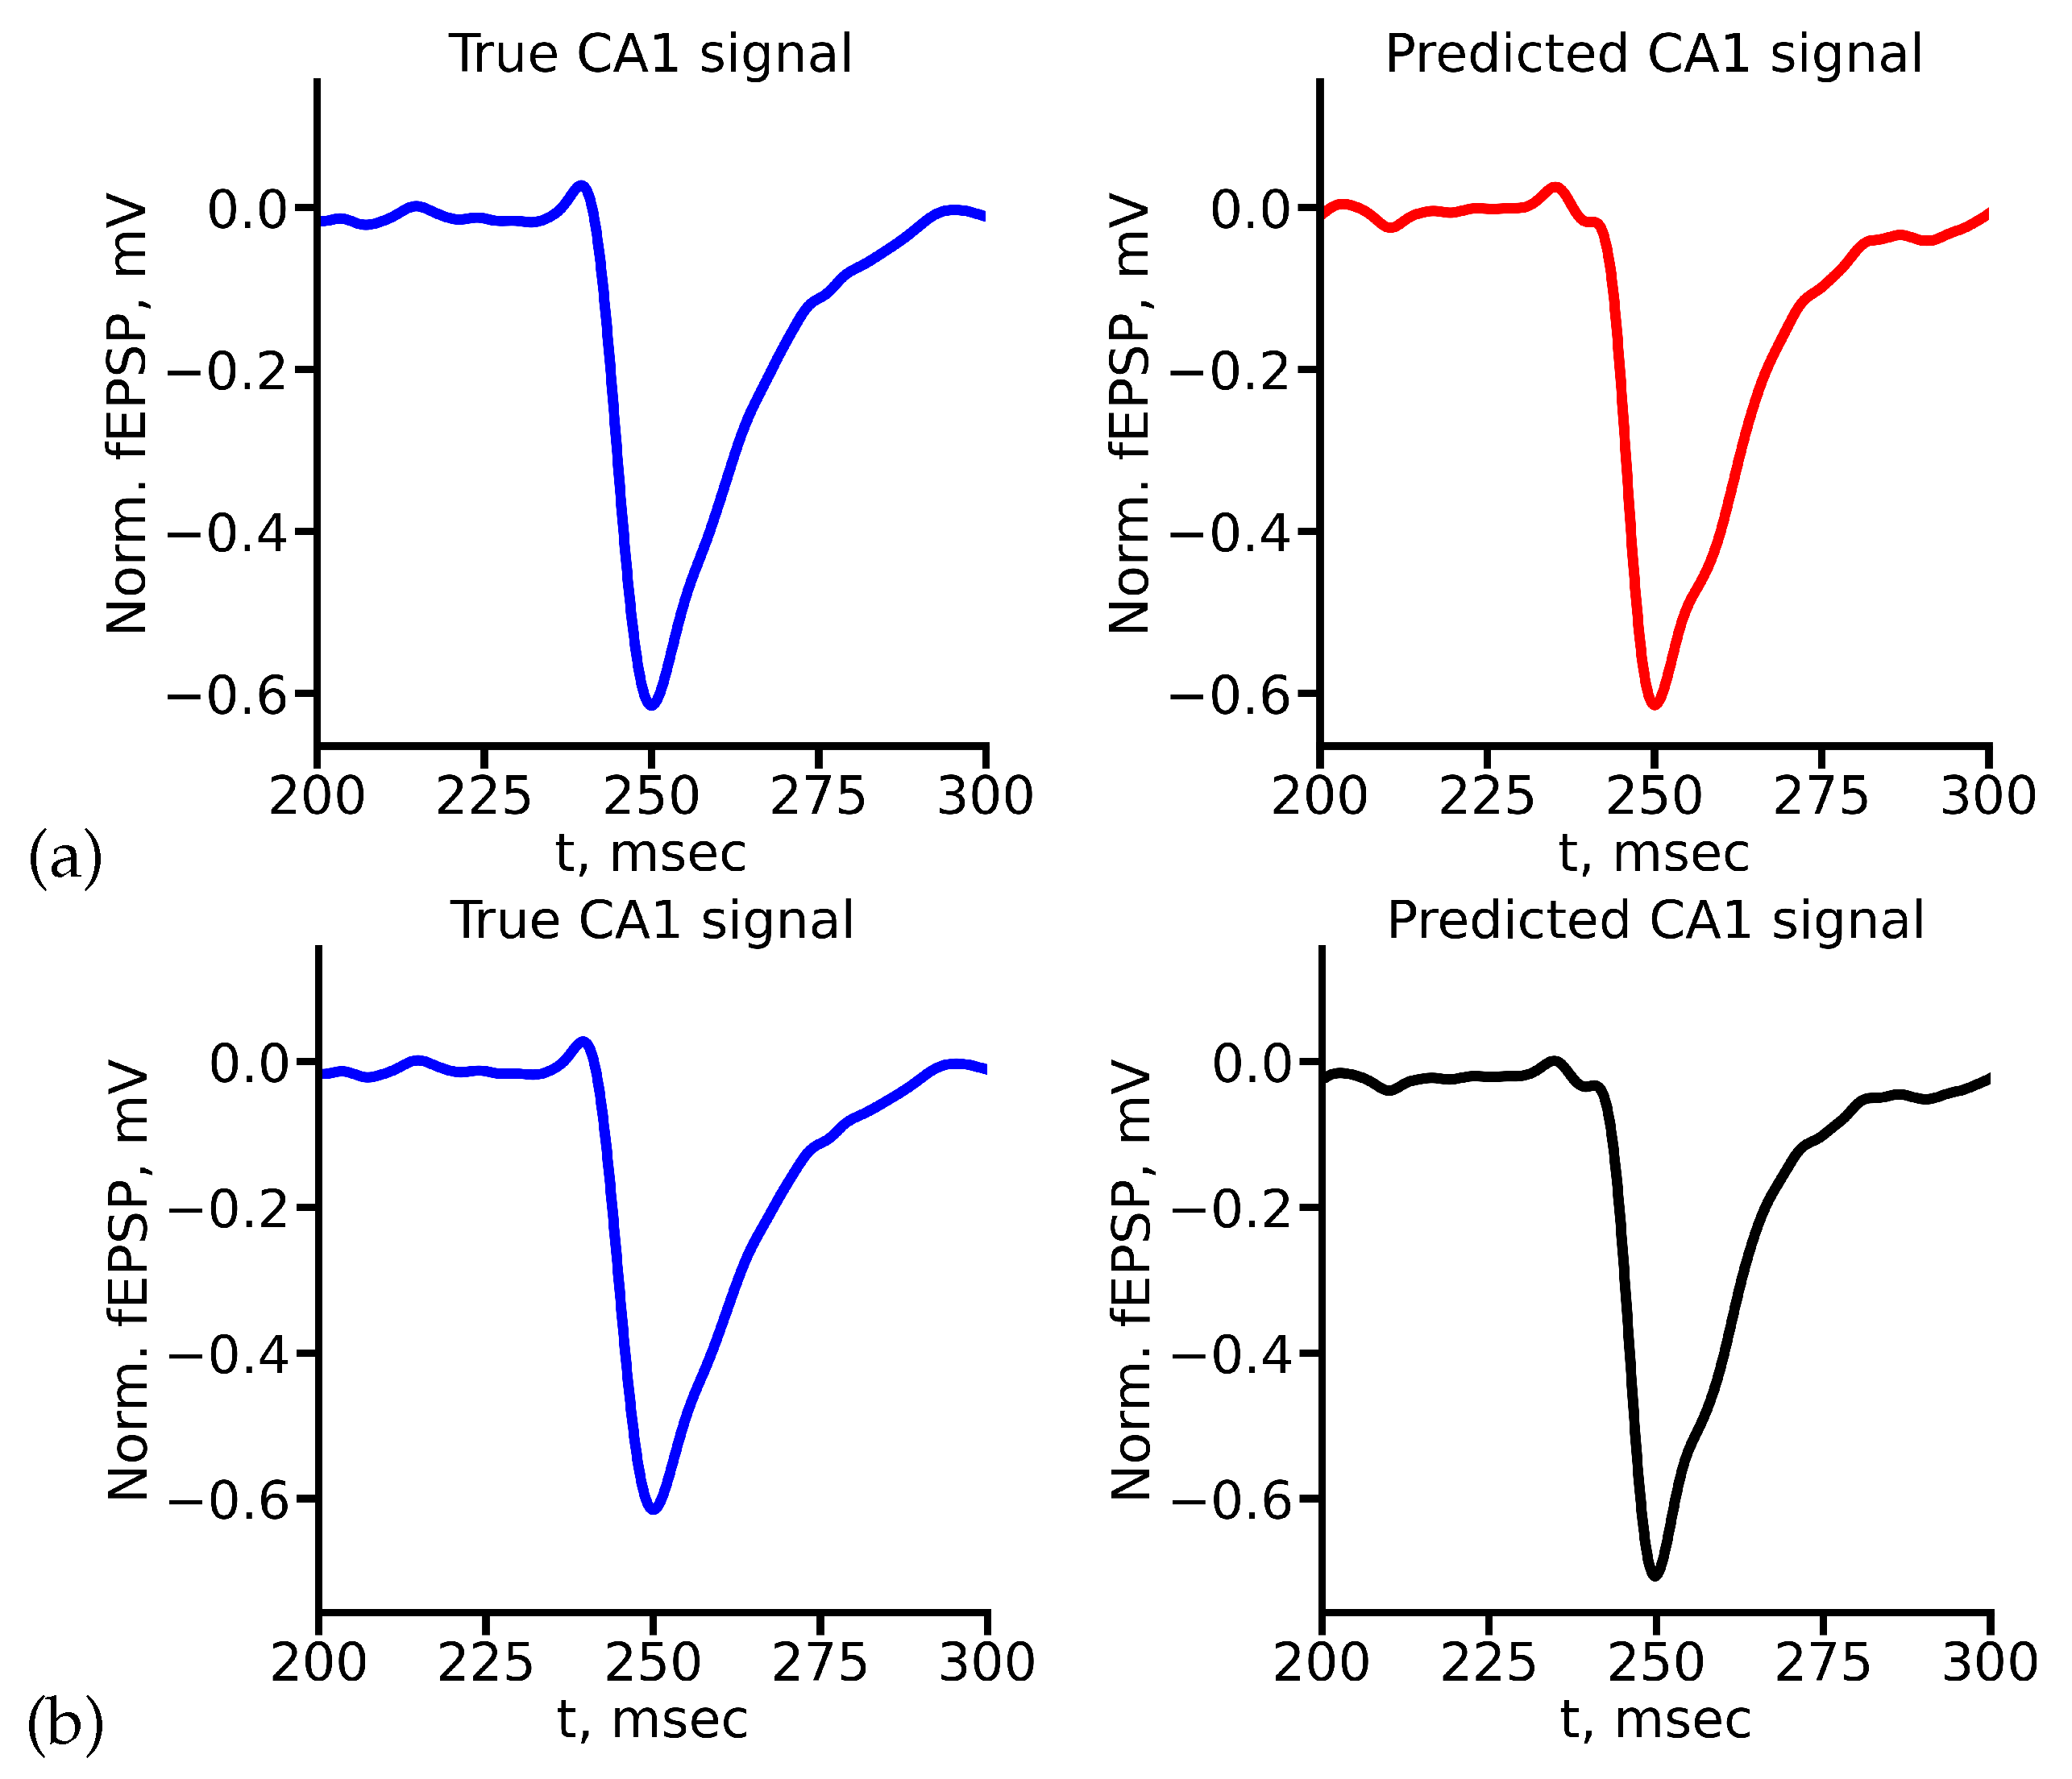
Figure A1.
True and predicted fEPSP signals at 100 A stimulus amplitude. Blue marker corresponds to true CA1 signal, red marker – to LSTM-predicted signal, black marker – to RC-predicted signal.
Figure A1.
True and predicted fEPSP signals at 100 A stimulus amplitude. Blue marker corresponds to true CA1 signal, red marker – to LSTM-predicted signal, black marker – to RC-predicted signal.
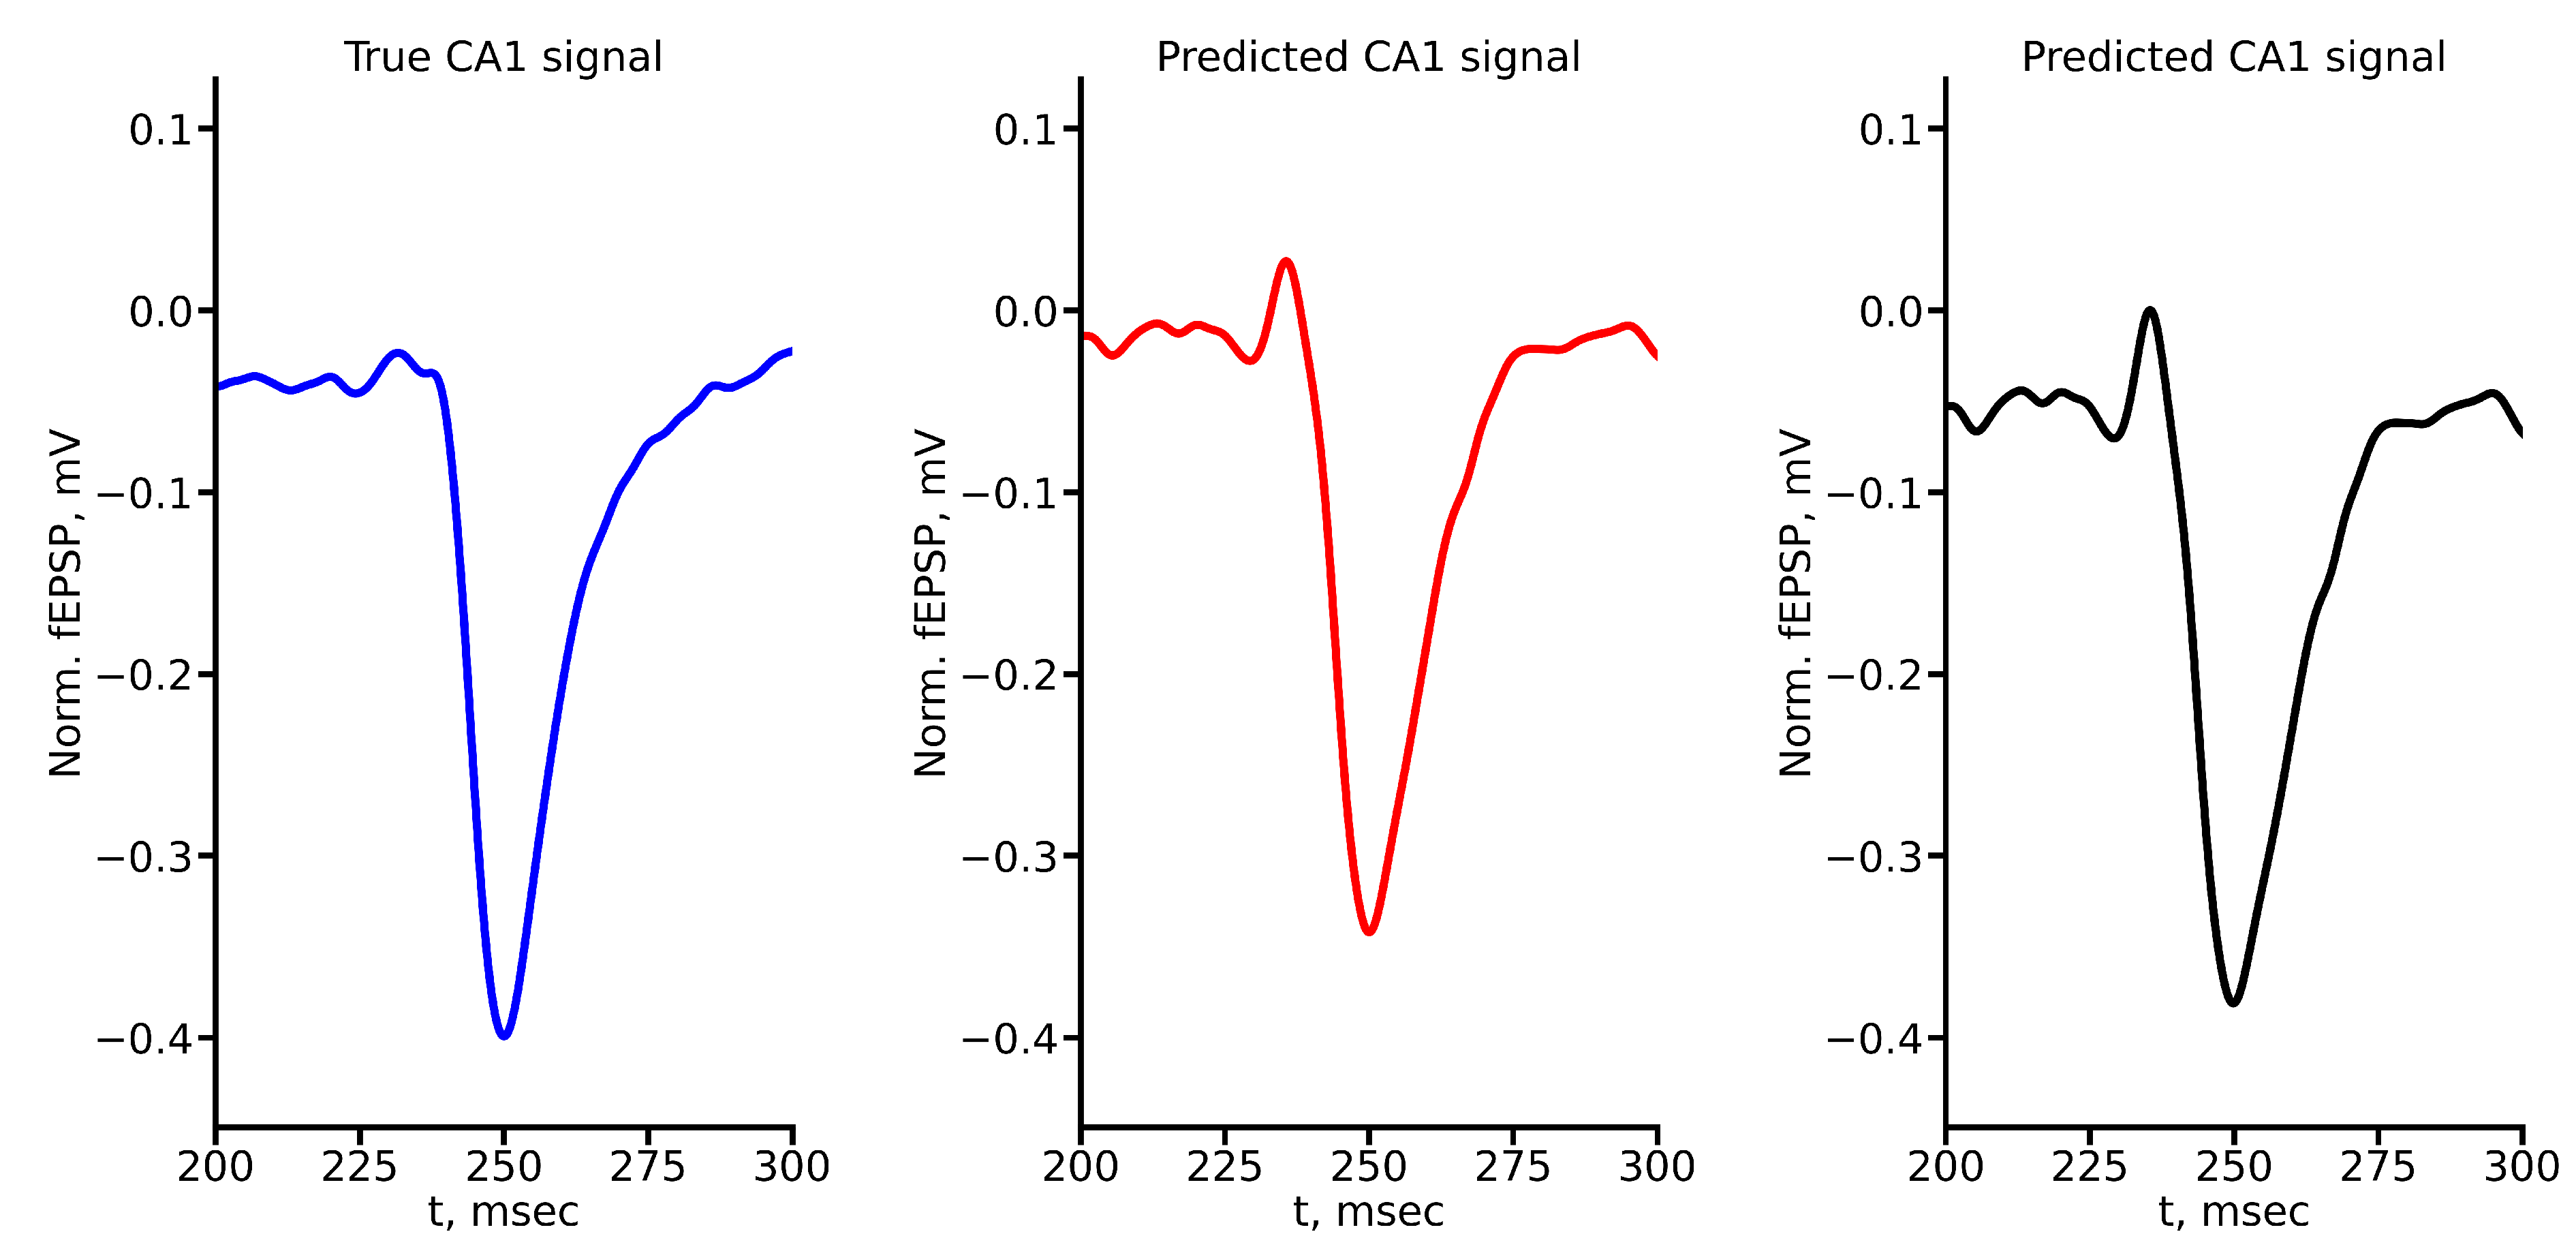
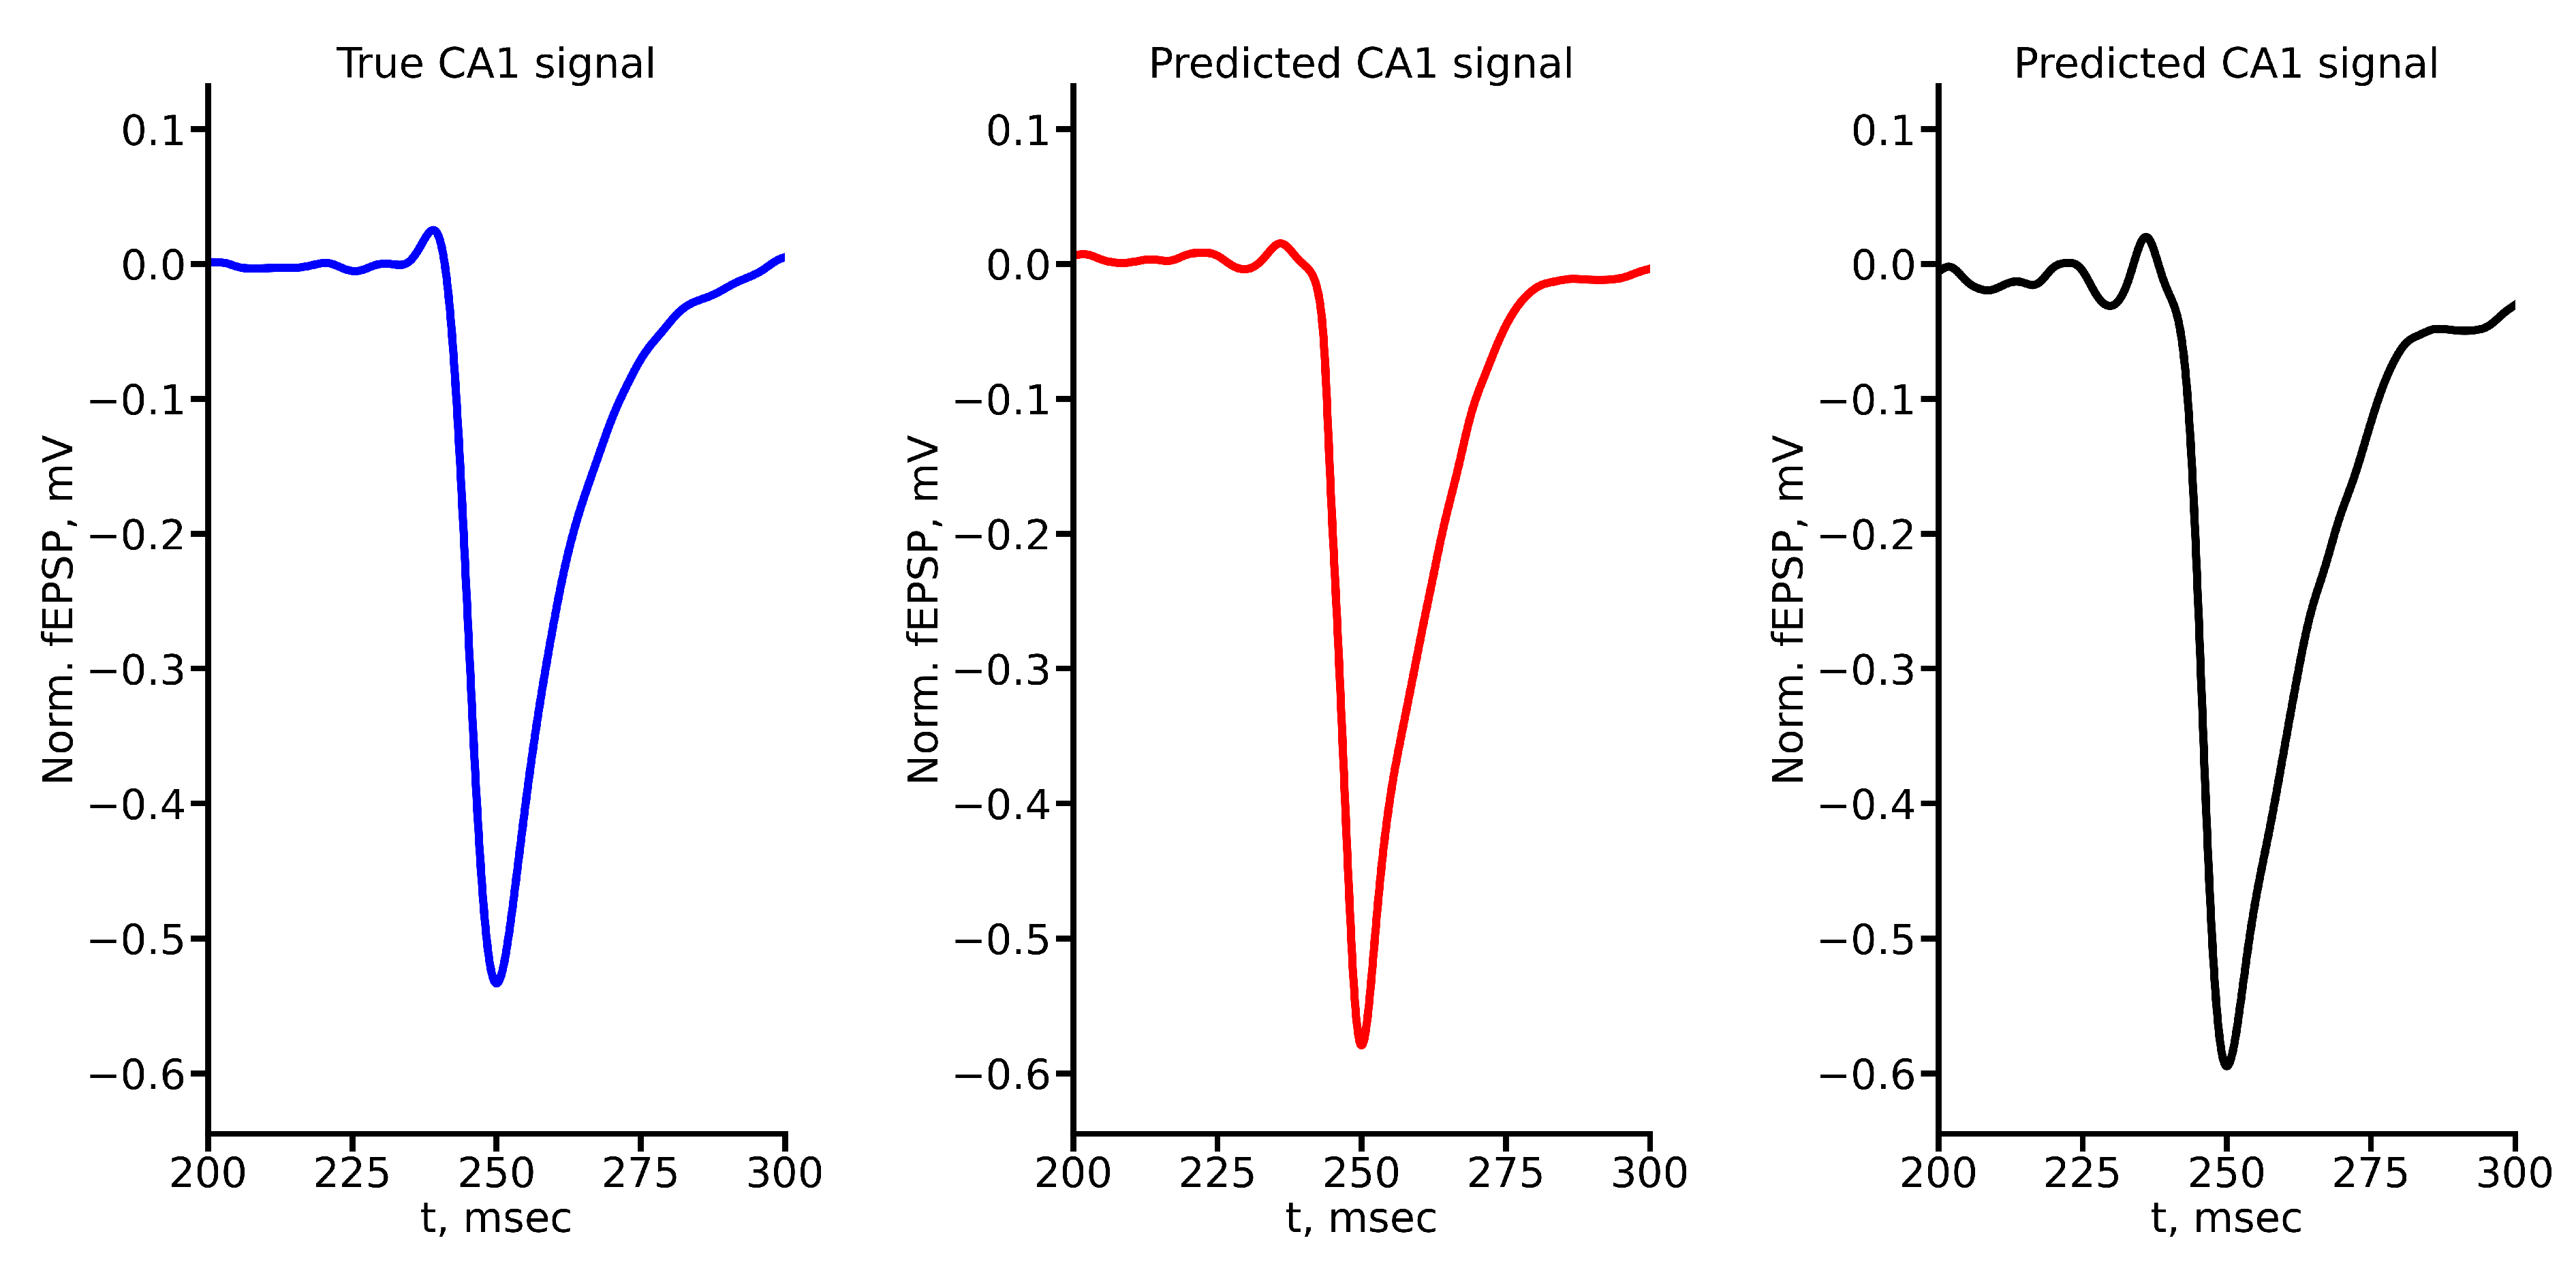
Figure A2.
True and predicted fEPSP signals at 200 A stimulus amplitude. Blue marker corresponds to true CA1 signal, red marker – to LSTM-predicted signal, black marker – to RC-predicted signal.
Figure A2.
True and predicted fEPSP signals at 200 A stimulus amplitude. Blue marker corresponds to true CA1 signal, red marker – to LSTM-predicted signal, black marker – to RC-predicted signal.
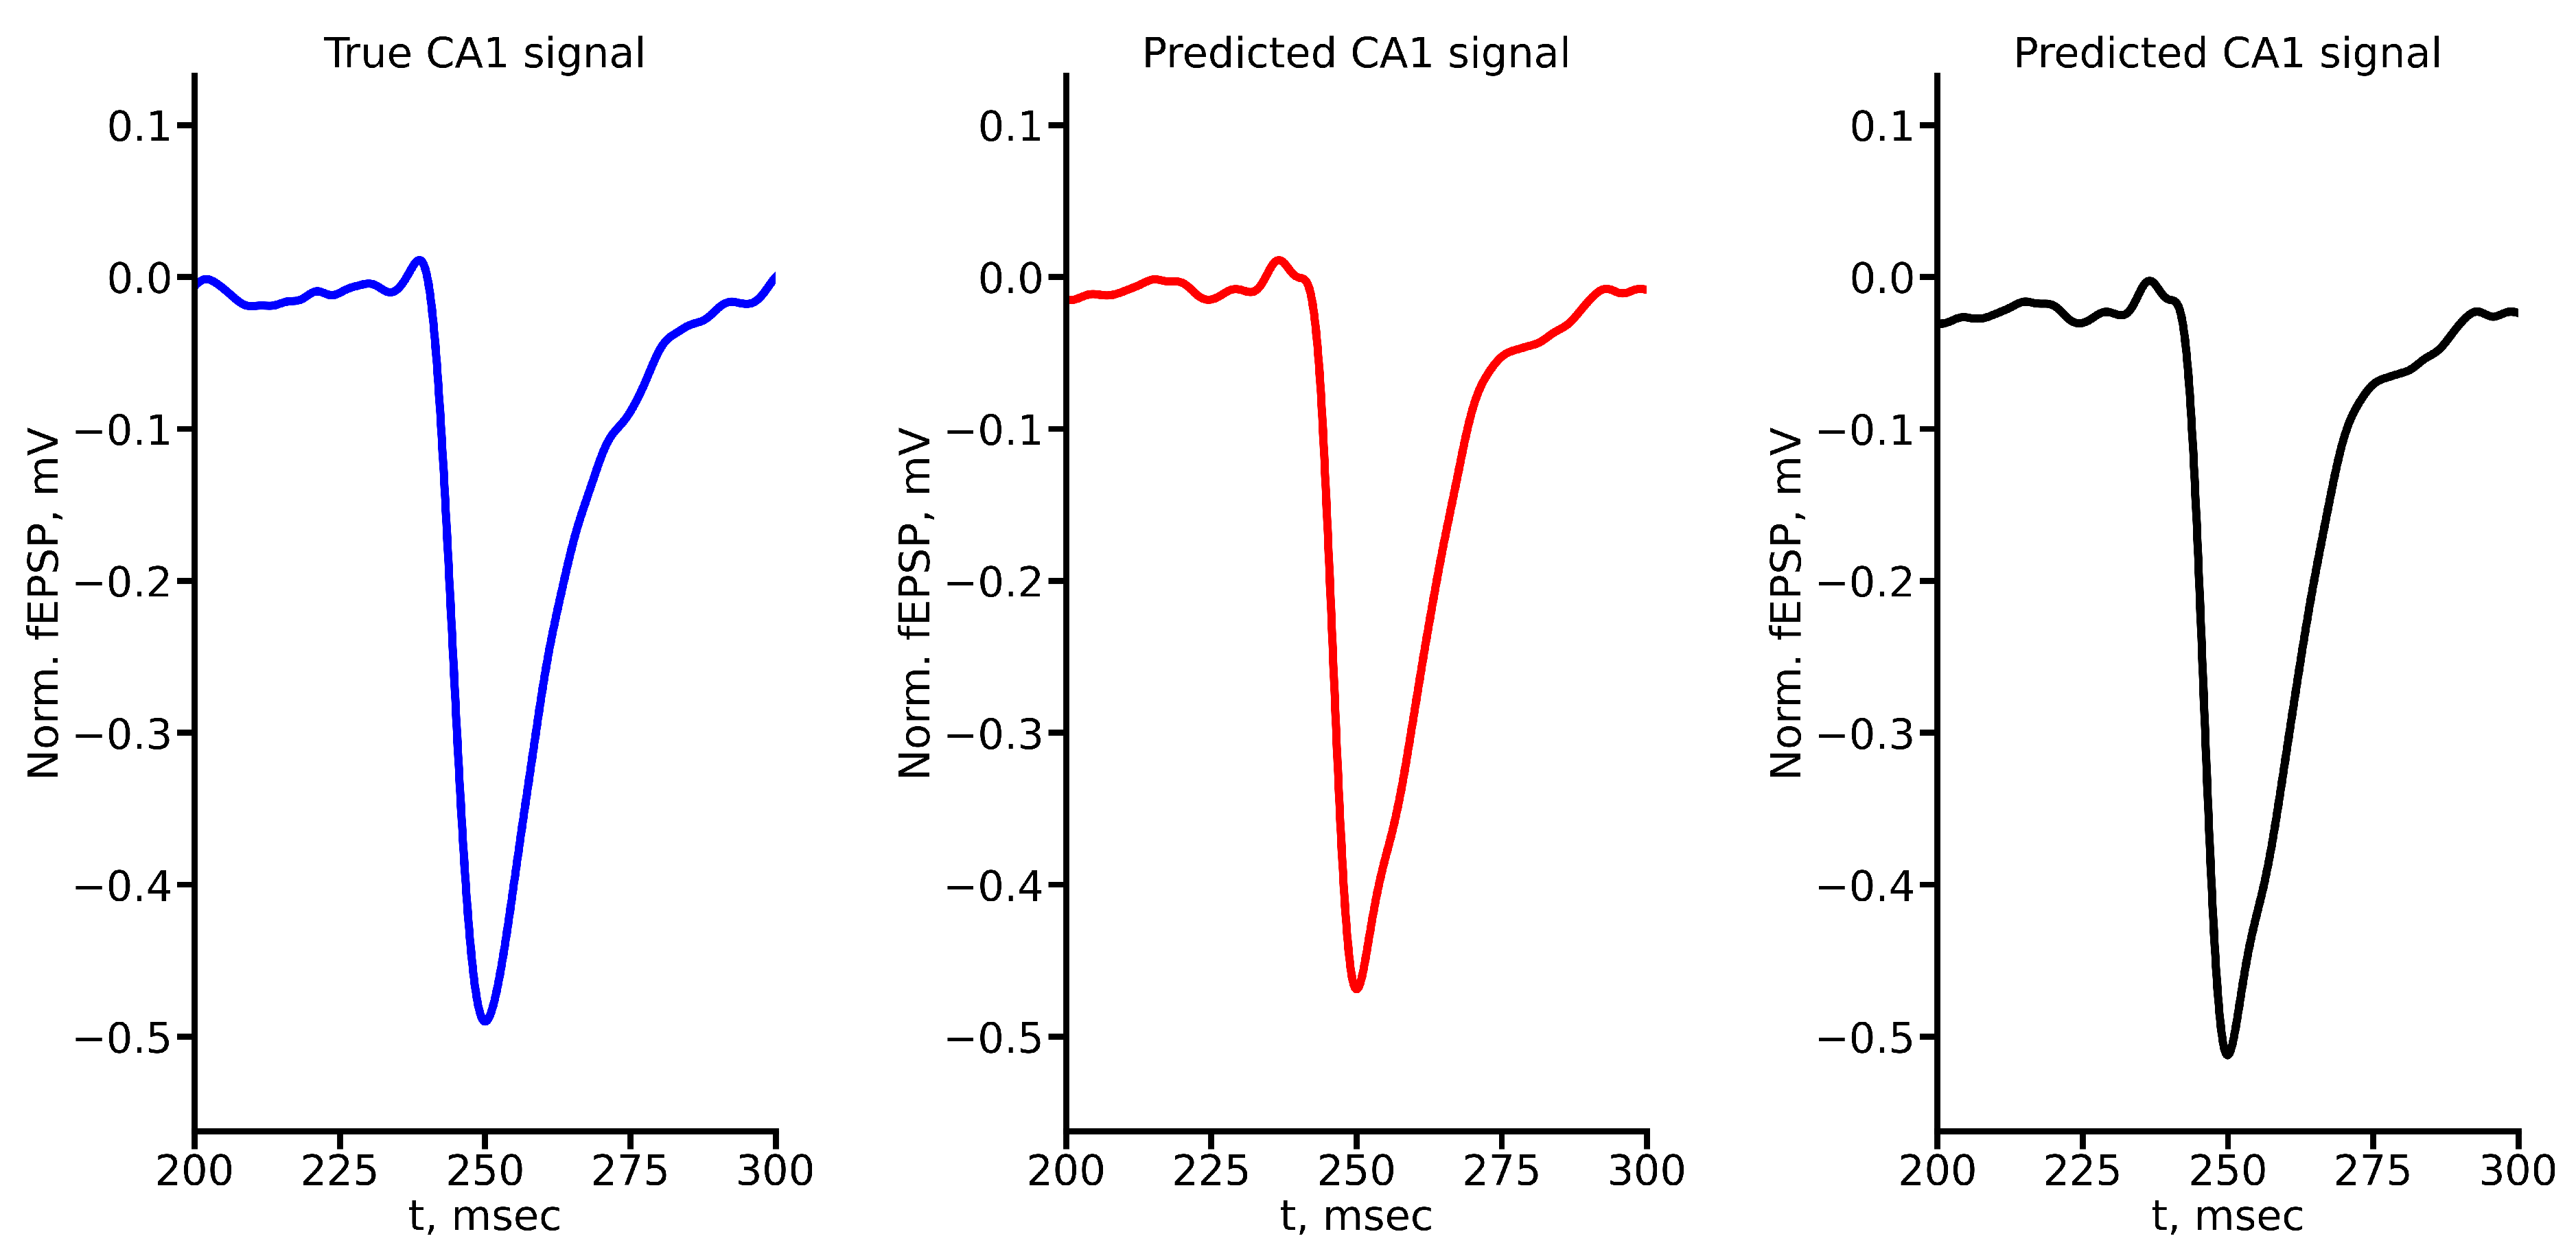
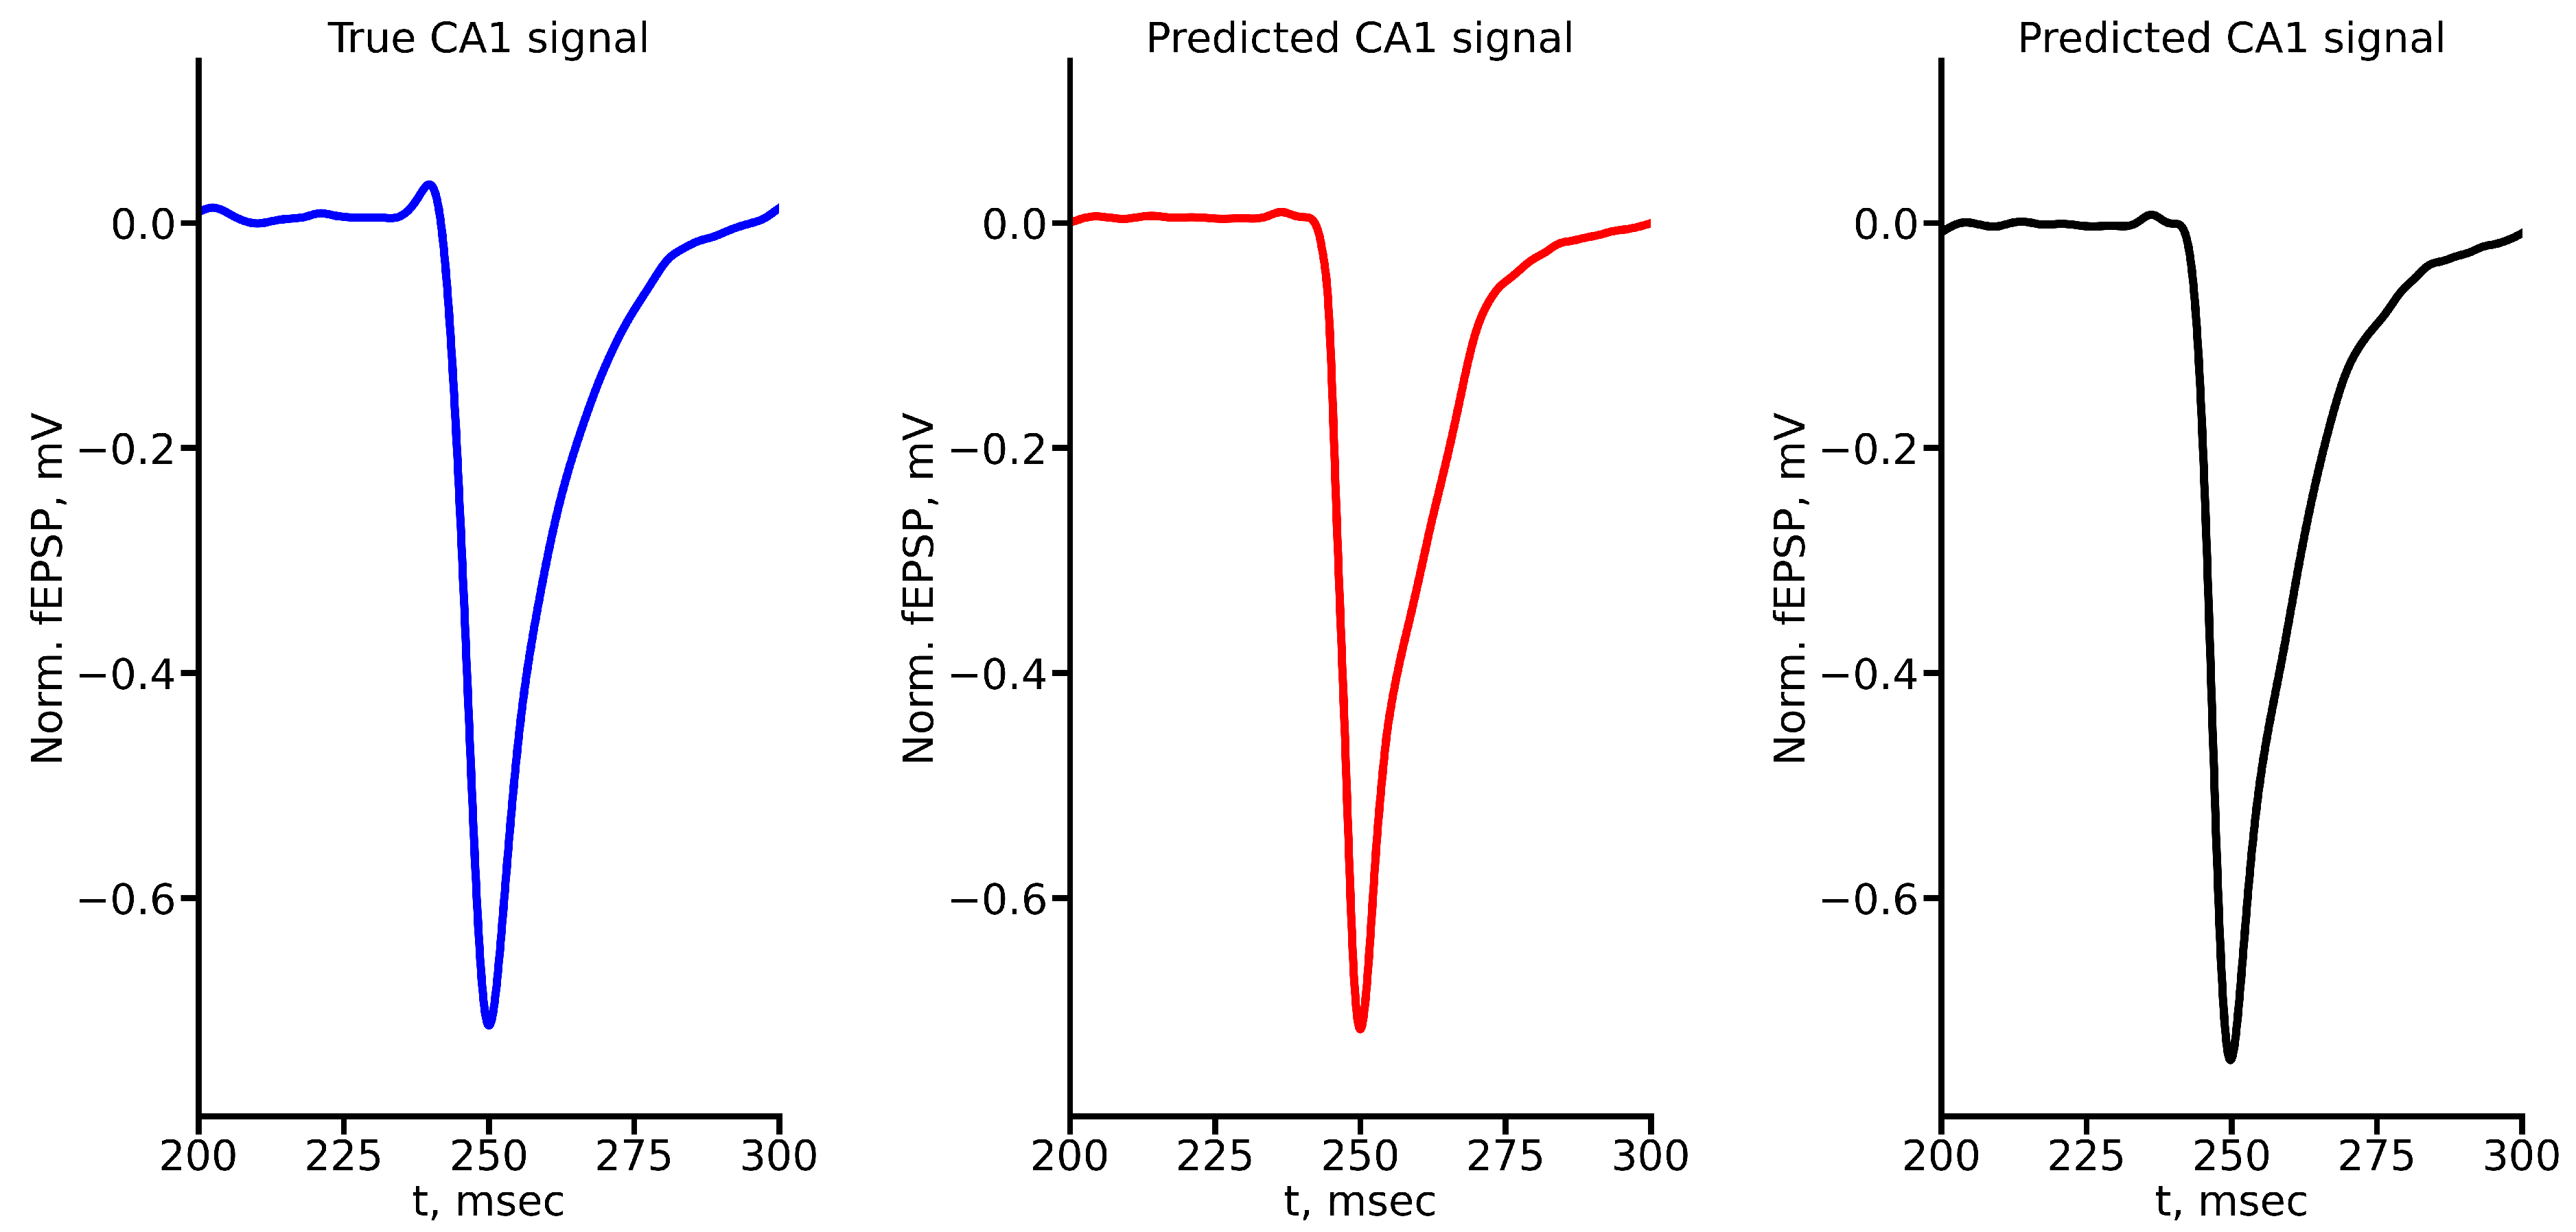
Figure A3.
True and predicted fEPSP signals at 300 A stimulus amplitude. Blue marker corresponds to true CA1 signal, red marker – to LSTM-predicted signal, black marker – to RC-predicted signal.
Figure A3.
True and predicted fEPSP signals at 300 A stimulus amplitude. Blue marker corresponds to true CA1 signal, red marker – to LSTM-predicted signal, black marker – to RC-predicted signal.
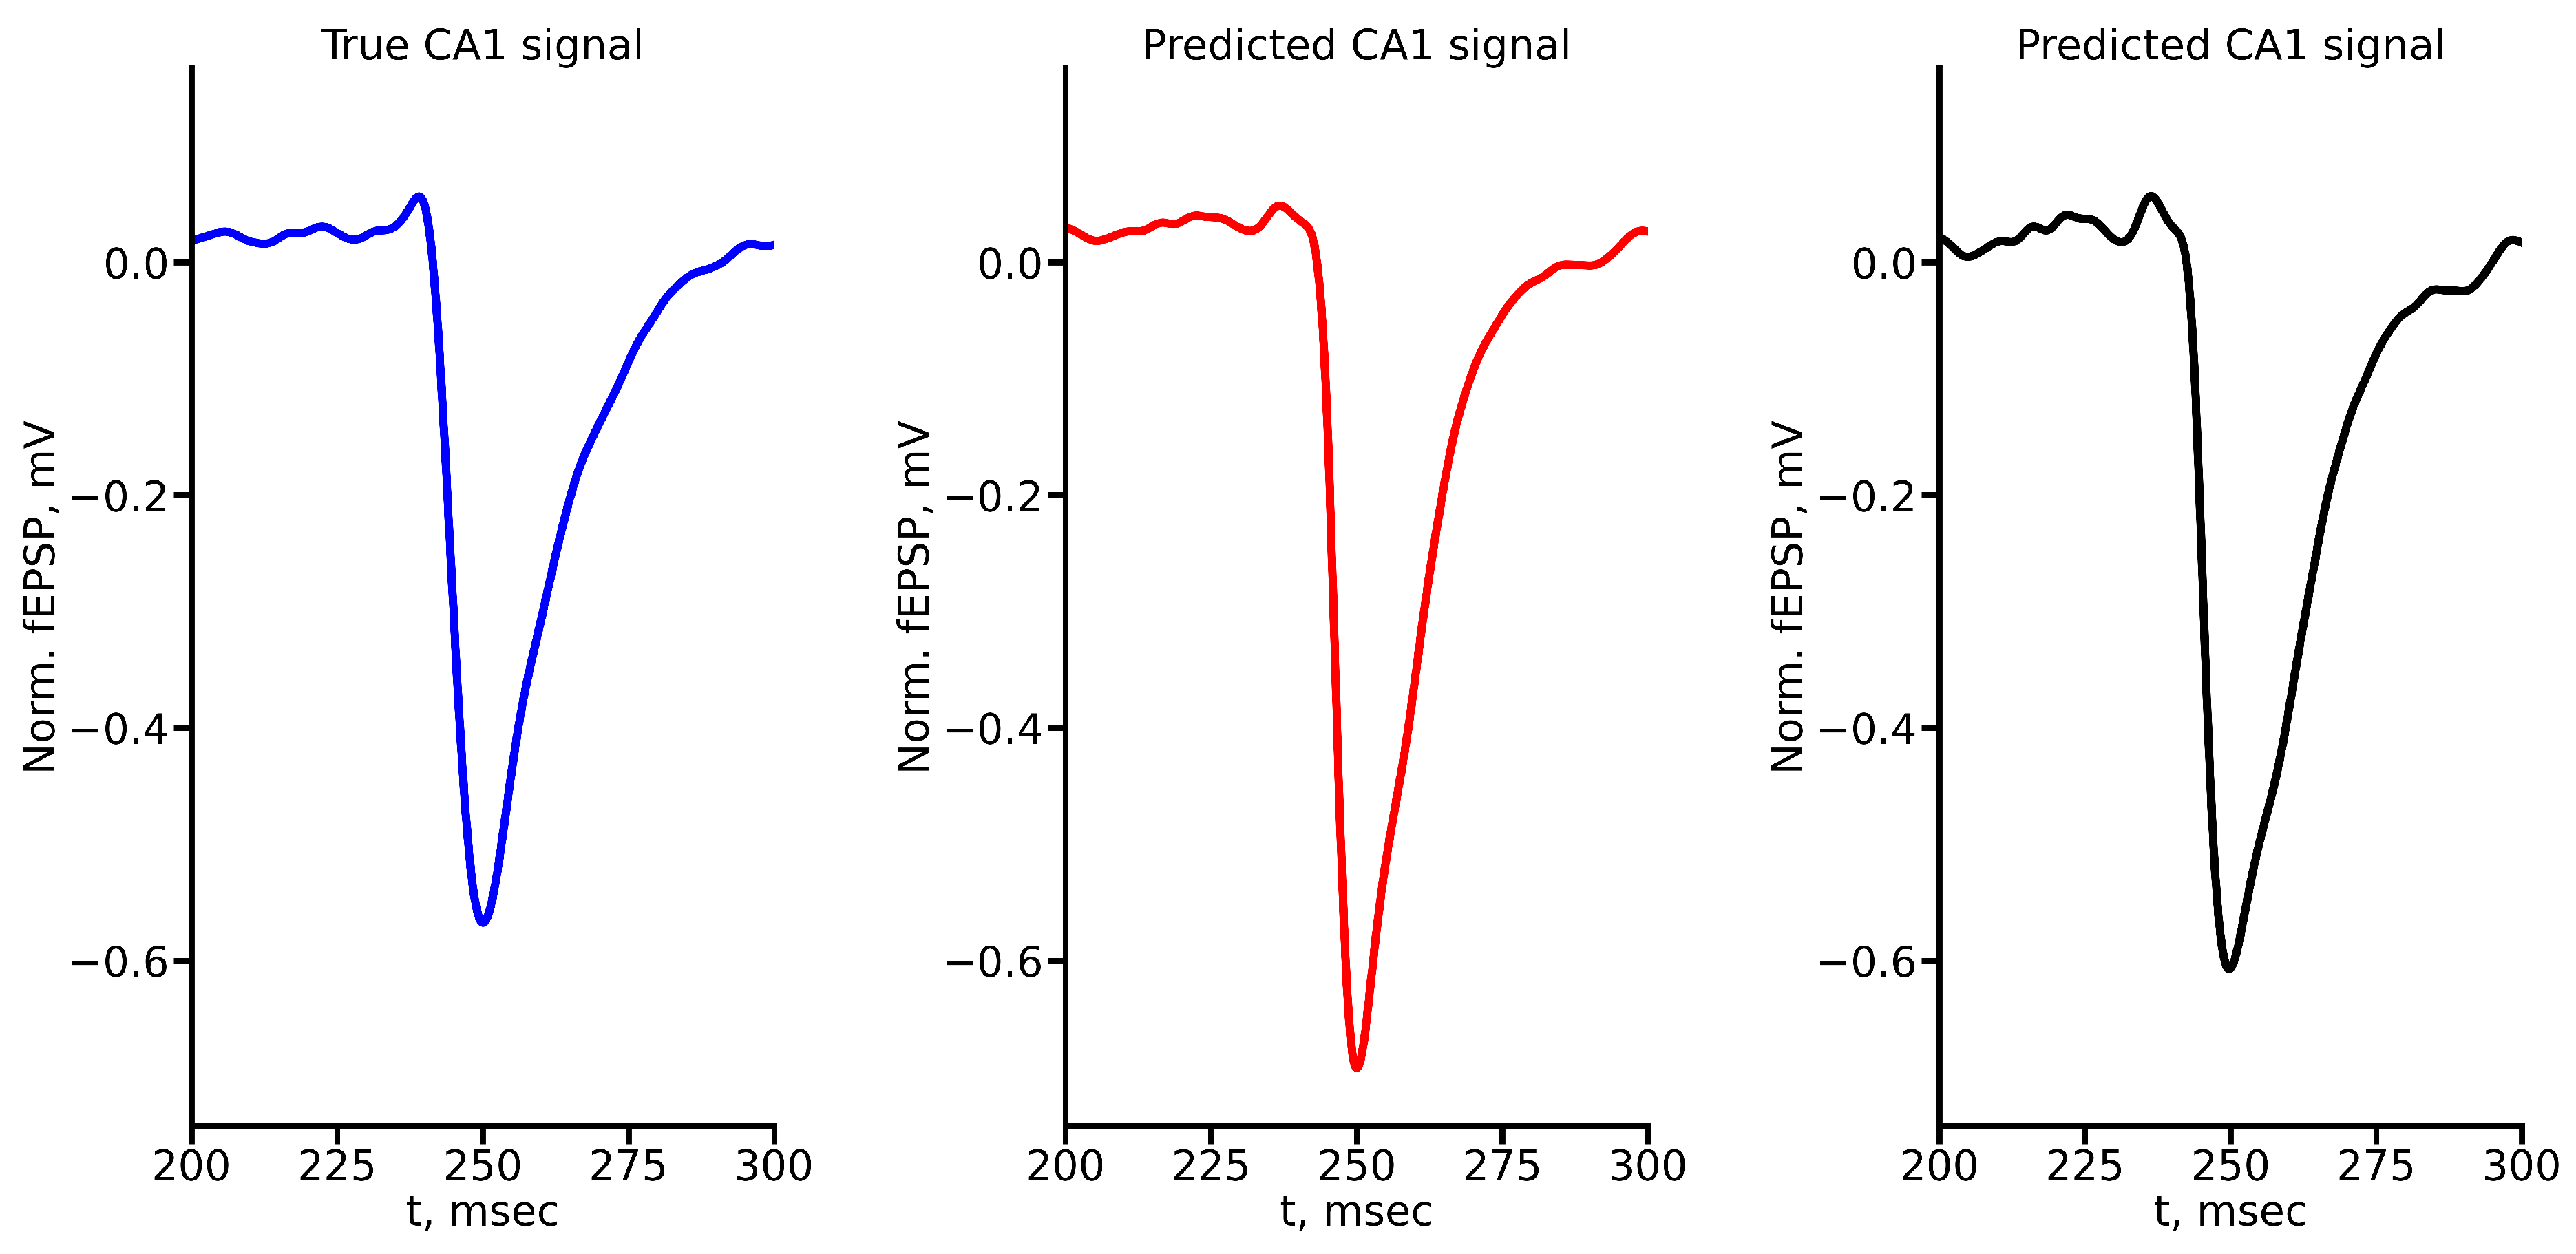
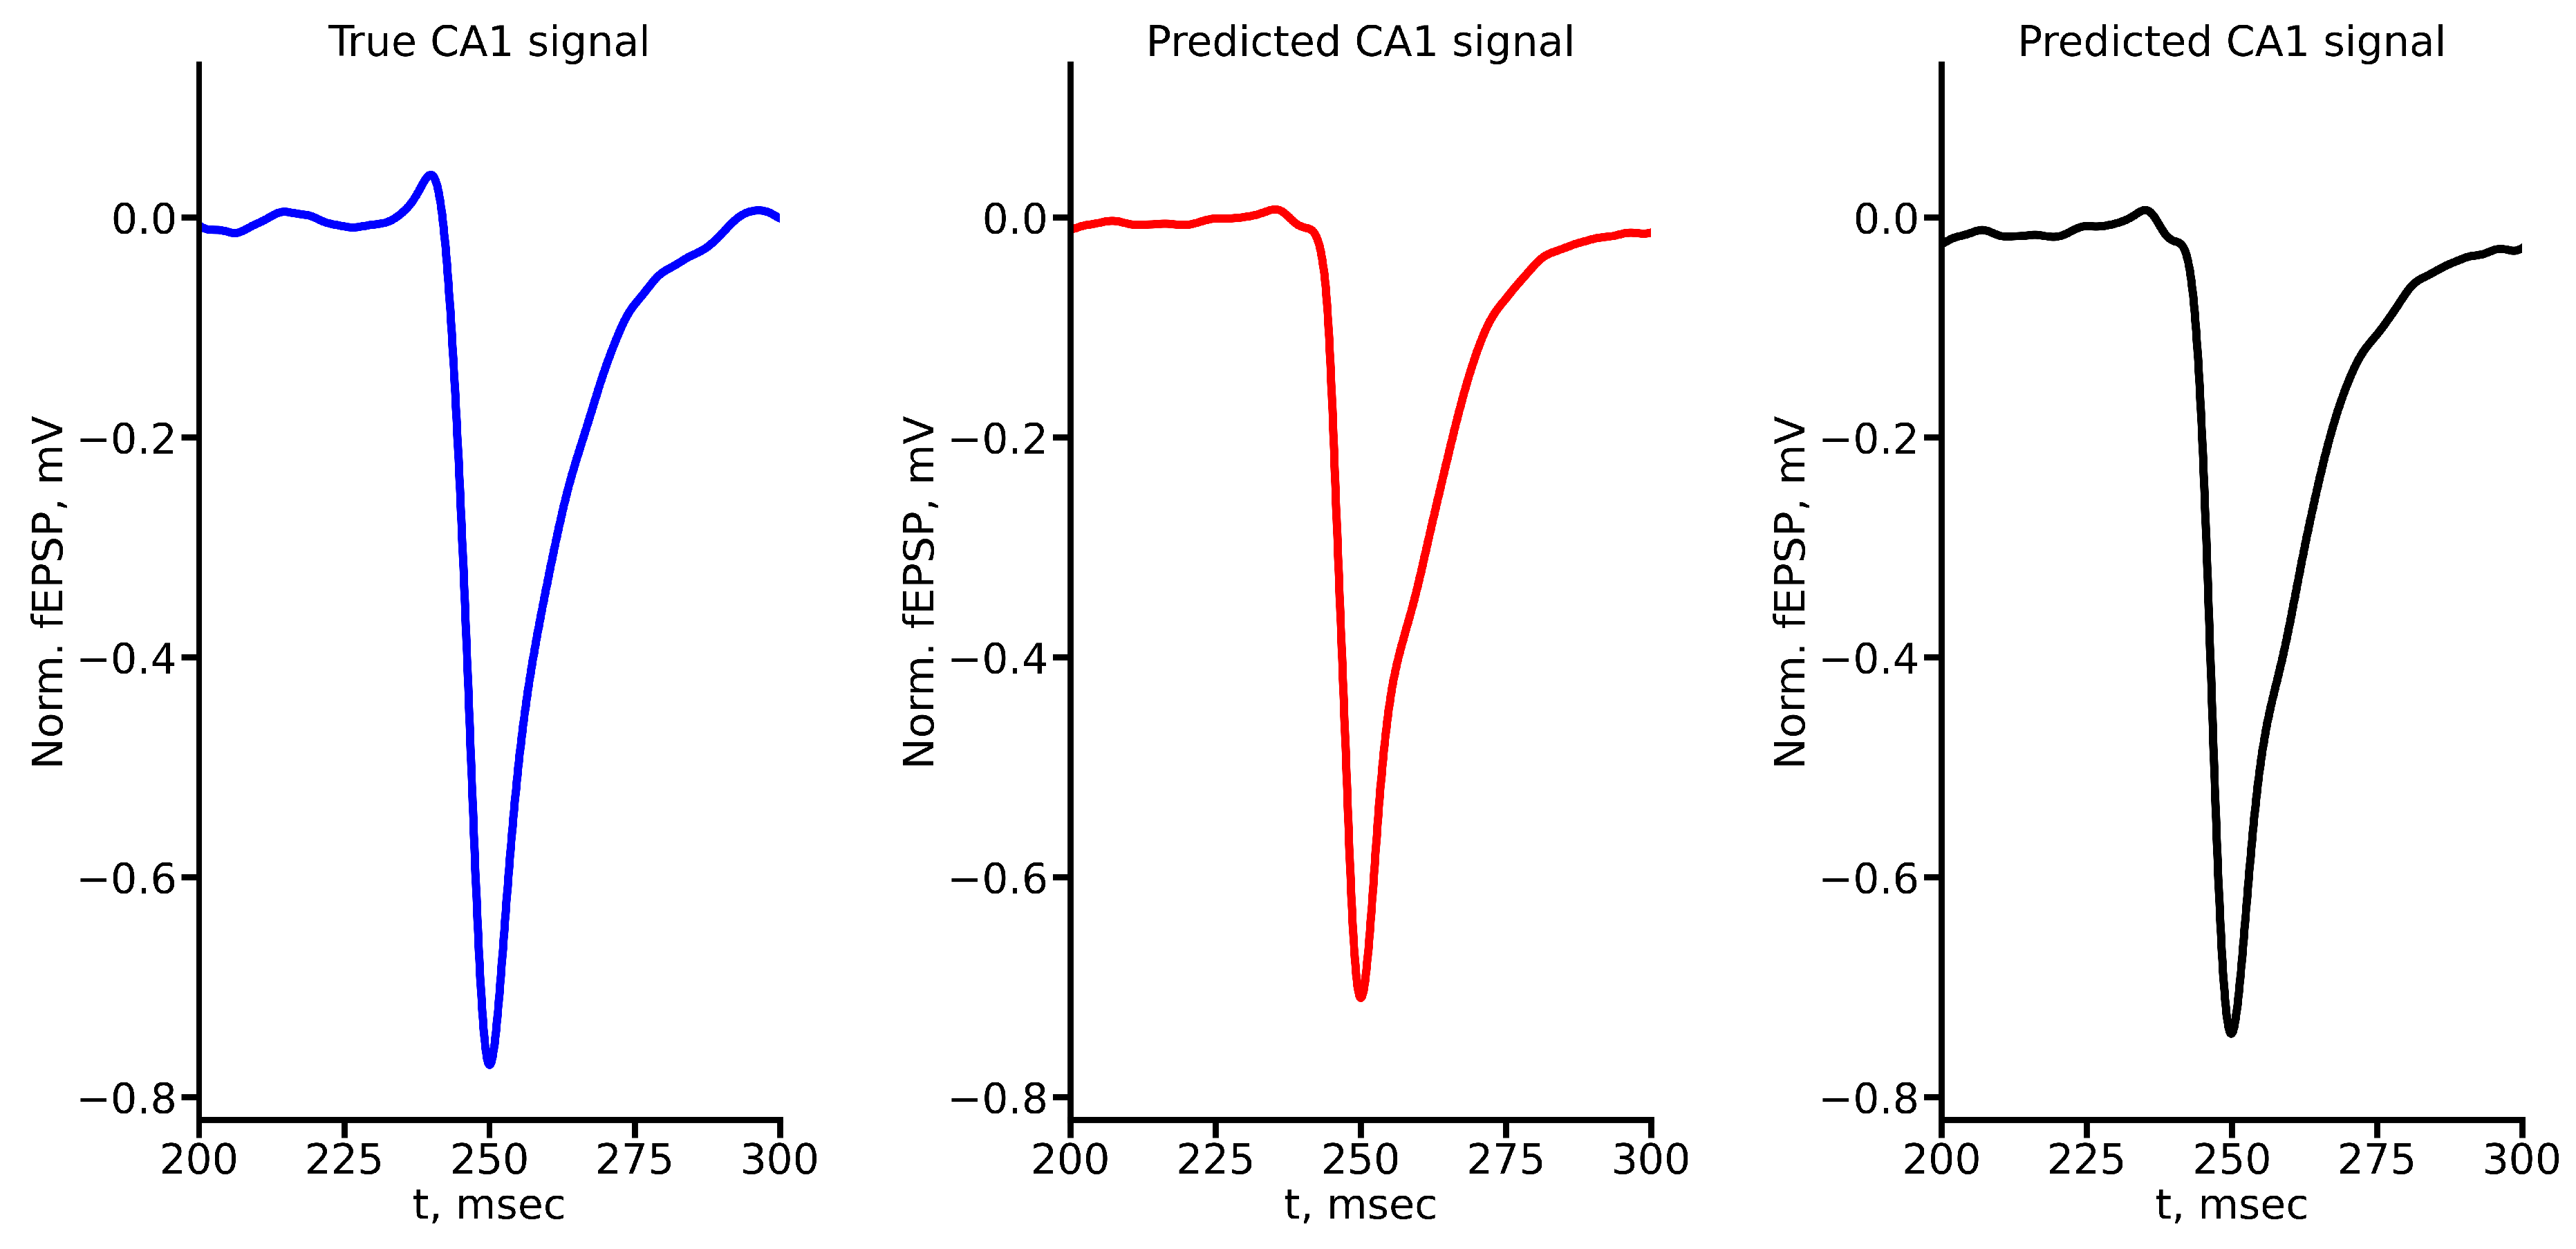
Figure A4.
True and predicted fEPSP signals at 500 A stimulus amplitude. Blue marker corresponds to true CA1 signal, red marker – to LSTM-predicted signal, black marker – to RC-predicted signal.
Figure A4.
True and predicted fEPSP signals at 500 A stimulus amplitude. Blue marker corresponds to true CA1 signal, red marker – to LSTM-predicted signal, black marker – to RC-predicted signal.
Figure A5.
True and predicted fEPSP signals at 600 A stimulus amplitude. Blue marker corresponds to true CA1 signal, red marker – to LSTM-predicted signal, black marker – to RC-predicted signal.
Figure A5.
True and predicted fEPSP signals at 600 A stimulus amplitude. Blue marker corresponds to true CA1 signal, red marker – to LSTM-predicted signal, black marker – to RC-predicted signal.
Figure A6.
True and predicted fEPSP signals at 700 A stimulus amplitude. Blue marker corresponds to true CA1 signal, red marker – to LSTM-predicted signal, black marker – to RC-predicted signal.
Figure A6.
True and predicted fEPSP signals at 700 A stimulus amplitude. Blue marker corresponds to true CA1 signal, red marker – to LSTM-predicted signal, black marker – to RC-predicted signal.
Figure A7.
True and predicted fEPSP signals at 800 A stimulus amplitude. Blue marker corresponds to true CA1 signal, red marker – to LSTM-predicted signal, black marker – to RC-predicted signal.
Figure A7.
True and predicted fEPSP signals at 800 A stimulus amplitude. Blue marker corresponds to true CA1 signal, red marker – to LSTM-predicted signal, black marker – to RC-predicted signal.
Figure A8.
True and predicted fEPSP signals at 900 A stimulus amplitude. Blue marker corresponds to true CA1 signal, red marker – to LSTM-predicted signal, black marker – to RC-predicted signal.
Figure A8.
True and predicted fEPSP signals at 900 A stimulus amplitude. Blue marker corresponds to true CA1 signal, red marker – to LSTM-predicted signal, black marker – to RC-predicted signal.
Figure A9.
True and predicted fEPSP signals at 1000 A stimulus amplitude. Blue marker corresponds to true CA1 signal, red marker – to LSTM-predicted signal, black marker – to RC-predicted signal.
Figure A9.
True and predicted fEPSP signals at 1000 A stimulus amplitude. Blue marker corresponds to true CA1 signal, red marker – to LSTM-predicted signal, black marker – to RC-predicted signal.
References
- Eichenbaum, H.; Fortin, N. Episodic memory and the hippocampus: It’s about time. Curr. Dir. Psychol. Sci. 2003, 12, 53–57. [Google Scholar] [CrossRef]
- Tulving, E. Episodic memory: From mind to brain. Annu. Rev. Psychol. 2002, 53, 1–25. [Google Scholar] [CrossRef] [PubMed]
- Barry, D.N.; Maguire, E.A. Remote memory and the hippocampus: A constructive critique. Trends Cogn. Sci. 2019, 23, 128–142. [Google Scholar] [CrossRef] [PubMed]
- Buzsáki, G.; McKenzie, S.; Davachi, L. Neurophysiology of remembering. Annu. Rev. Psychol. 2022, 73, 187–215. [Google Scholar] [CrossRef] [PubMed]
- Schultz, C.; Engelhardt, M. Anatomy of the hippocampal formation. Front. Neurol. Neurosci. 2014, 34, 6–17. [Google Scholar] [PubMed]
- Gloveli, T.; Schmitz, D.; Heinemann, U. Interaction between superficial layers of the entorhinal cortex and the hippocampus in normal and epileptic temporal lobe. Epilepsy Res. 1998, 32, 183–193. [Google Scholar] [CrossRef] [PubMed]
- Yeckel, M.F.; Berger, T.W. Feedforward excitation of the hippocampus by afferents from the entorhinal cortex: redefinition of the role of the trisynaptic pathway. Proc. Nat. Acad. Sci. 1990, 87, 5832–5836. [Google Scholar] [CrossRef] [PubMed]
- Charpak, S.; Paré, D.; Llinás, R. The entorhinal cortex entrains fast CA1 hippocampal oscillations in the anaesthetized guinea-pig: role of the monosynaptic component of the perforant path. Eur. J. Neurosci. 1995, 7, 1548–1557. [Google Scholar] [CrossRef] [PubMed]
- Witter, M.; Van Hoesen, G.; Amaral, D. Topographical organization of the entorhinal projection to the dentate gyrus of the monkey. J. Neurosci. 1989, 9, 216–228. [Google Scholar] [CrossRef]
- Claiborne, B.J.; Amaral, D.G.; Cowan, W.M. A light and electron microscopic analysis of the mossy fibers of the rat dentate gyrus. J. Comp. Neurol. 1986, 246, 435–458. [Google Scholar] [CrossRef]
- Kajiwara, R.; Wouterlood, F.G.; Sah, A.; Boekel, A.J.; Baks-te Bulte, L.T.; Witter, M.P. Convergence of entorhinal and CA3 inputs onto pyramidal neurons and interneurons in hippocampal area CA1—an anatomical study in the rat. Hippocampus 2008, 18, 266–280. [Google Scholar] [CrossRef] [PubMed]
- Empson, R.M.; Heinemann, U. The perforant path projection to hippocampal area CA1 in the rat hippocampal-entorhinal cortex combined slice. J. Physiol. 1995, 484, 707–720. [Google Scholar] [CrossRef] [PubMed]
- Amaral, D.G.; Witter, M.P. The three-dimensional organization of the hippocampal formation: a review of anatomical data. Neurosci. 1989, 31, 571–591. [Google Scholar] [CrossRef] [PubMed]
- Canto, C.B.; Koganezawa, N.; Beed, P.; Moser, E.I.; Witter, M.P. All layers of medial entorhinal cortex receive presubicular and parasubicular inputs. J. Neurosci. 2012, 32, 17620–17631. [Google Scholar] [CrossRef] [PubMed]
- O’Reilly, R.C.; McClelland, J.L. Hippocampal conjunctive encoding, storage, and recall: Avoiding a trade-off. Hippocampus 1994, 4, 661–682. [Google Scholar] [CrossRef] [PubMed]
- Insausti, R.; Marcos, M.; Mohedano-Moriano, A.; Arroyo-Jiménez, M.; Córcoles-Parada, M.; Artacho-Pérula, E.; Ubero-Martinez, M.; Munoz-Lopez, M. The nonhuman primate hippocampus: neuroanatomy and patterns of cortical connectivity. In The hippocampus from cells to systems: Structure, connectivity, and functional contributions to memory and flexible cognition; Hannula, D., Duff, M., Eds.; Springer: Cham, 2017; pp. 3–36. [Google Scholar]
- Lee, D.Y.; Fletcher, E.; Carmichael, O.T.; Singh, B.; Mungas, D.; Reed, B.; Martinez, O.; Buonocore, M.H.; Persianinova, M.; DeCarli, C. Sub-regional hippocampal injury is associated with fornix degeneration in Alzheimer’s disease. Front. Aging Neurosci. 2012, 4, 1. [Google Scholar] [CrossRef] [PubMed]
- Rao, Y.L.; Ganaraja, B.; Murlimanju, B.; Joy, T.; Krishnamurthy, A.; Agrawal, A. Hippocampus and its involvement in Alzheimer’s disease: a review. 3 Biotech 2022, 12, 55. [Google Scholar] [CrossRef] [PubMed]
- Lana, D.; Ugolini, F.; Giovannini, M.G. An overview on the differential interplay among neurons–astrocytes–microglia in CA1 and CA3 hippocampus in hypoxia/ischemia. Front. Cell. Neurosci. 2020, 14, 585833. [Google Scholar] [CrossRef] [PubMed]
- Zaitsev, A.; Amakhin, D.; Dyomina, A.; Zakharova, M.; Ergina, J.; Postnikova, T.; Diespirov, G.; Magazanik, L. Synaptic dysfunction in epilepsy. J. Evol. Biochem. Physiol. 2021, 57, 542–563. [Google Scholar] [CrossRef]
- WHO. The Top 10 Causes of Death. World Health Organization, 2020.
- Langa, K.M. Cognitive aging, dementia, and the future of an aging population. National Academies of Sciences, Engineering, and Medicine; Division of Behavioral and Social Sciences and Education; Committee on Population. Future directions for the demography of aging: Proceedings of a workshop; Majmundar, M.; MD, H., Eds. National Academies Press, Washington, DC, 2018, pp. 249–268.
- French, B.; Thomas, L.H.; Coupe, J.; McMahon, N.E.; Connell, L.; Harrison, J.; Sutton, C.J.; Tishkovskaya, S.; Watkins, C.L. Repetitive task training for improving functional ability after stroke. Cochrane Database. Syst. Rev. 2016, 11, CD006073. [Google Scholar]
- Hainmueller, T.; Bartos, M. Dentate gyrus circuits for encoding, retrieval and discrimination of episodic memories. Nat. Rev. Neurosci. 2020, 21, 153–168. [Google Scholar] [CrossRef] [PubMed]
- Panuccio, G.; Semprini, M.; Natale, L.; Buccelli, S.; Colombi, I.; Chiappalone, M. Progress in neuroengineering for brain repair: New challenges and open issues. Brain Neurosci. Adv. 2018, 2, 2398212818776475. [Google Scholar] [CrossRef] [PubMed]
- Famm, K. Drug discovery: A jump-start for electroceuticals. Nature 2013, 496, 159. [Google Scholar] [CrossRef] [PubMed]
- Berger, T.W.; Ahuja, A.; Courellis, S.H.; Deadwyler, S.A.; Erinjippurath, G.; Gerhardt, G.A.; Gholmieh, G.; Granacki, J.J.; Hampson, R.; Hsaio, M.C.; others. Restoring lost cognitive function. IEEE Eng. Med. Biol. 2005, 24, 30–44. [Google Scholar] [CrossRef] [PubMed]
- Hampson, R.; Simeral, J.; Deadwyler, S.A. Cognitive processes in replacement brain parts: A code for all reasons. In Toward Replacement Parts for the Brain: Implantable Biomimetic Electronics as Neural Prostheses; Berger, T.; Glanzman, D.L., Eds.; The MIT Press, 2005; p. 111.
- Berger, T.W.; Song, D.; Chan, R.H.; Marmarelis, V.Z.; LaCoss, J.; Wills, J.; Hampson, R.E.; Deadwyler, S.A.; Granacki, J.J. A hippocampal cognitive prosthesis: multi-input, multi-output nonlinear modeling and VLSI implementation. IEEE Trans. Neural Syst. Rehabil. Eng. 2012, 20, 198–211. [Google Scholar] [CrossRef] [PubMed]
- Berger, T.W.; Hampson, R.E.; Song, D.; Goonawardena, A.; Marmarelis, V.Z.; Deadwyler, S.A. A cortical neural prosthesis for restoring and enhancing memory. J. Neural Eng. 2011, 8, 046017. [Google Scholar] [CrossRef] [PubMed]
- Hampson, R.E.; Song, D.; Chan, R.H.; Sweatt, A.J.; Riley, M.R.; Gerhardt, G.A.; Shin, D.C.; Marmarelis, V.Z.; Berger, T.W.; Deadwyler, S.A. A nonlinear model for hippocampal cognitive prosthesis: memory facilitation by hippocampal ensemble stimulation. IEEE Trans. Neural Syst. Rehabil. Eng. 2012, 20, 184–197. [Google Scholar] [CrossRef]
- Deadwyler, S.A.; Berger, T.W.; Sweatt, A.J.; Song, D.; Chan, R.H.; Opris, I.; Gerhardt, G.A.; Marmarelis, V.Z.; Hampson, R.E. Donor/recipient enhancement of memory in rat hippocampus. Front. Syst. Neurosci. 2013, 7, 120. [Google Scholar] [CrossRef]
- Geng, K.; Shin, D.C.; Song, D.; Hampson, R.E.; Deadwyler, S.A.; Berger, T.W.; Marmarelis, V.Z. Mechanism-based and input-output modeling of the key neuronal connections and signal transformations in the CA3-CA1 regions of the hippocampus. Neural Comput. 2017, 30, 149–183. [Google Scholar] [CrossRef]
- Hampson, R.E.; Song, D.; Robinson, B.S.; Fetterhoff, D.; Dakos, A.S.; Roeder, B.M.; She, X.; Wicks, R.T.; Witcher, M.R.; Couture, D.E.; others. Developing a hippocampal neural prosthetic to facilitate human memory encoding and recall. J. Neural Eng. 2018, 15, 036014. [Google Scholar] [CrossRef]
- Kaestner, E.; Stasenko, A.; Schadler, A.; Roth, R.; Hewitt, K.; Reyes, A.; Qiu, D.; Bonilha, L.; Voets, N.; Hu, R.; others. Impact of white matter networks on risk for memory decline following resection versus ablation in temporal lobe epilepsy. J. Neurol. Neurosurg. Psychiatry 2024. [Google Scholar] [CrossRef] [PubMed]
- Hogri, R.; Bamford, S.A.; Taub, A.H.; Magal, A.; Giudice, P.D.; Mintz, M. A neuro-inspired model-based closed-loop neuroprosthesis for the substitution of a cerebellar learning function in anesthetized rats. Sci. Rep. 2015, 5, 8451. [Google Scholar] [CrossRef] [PubMed]
- Mishchenko, M.A.; Gerasimova, S.A.; Lebedeva, A.V.; Lepekhina, L.S.; Pisarchik, A.N.; Kazantsev, V.B. Optoelectronic system for brain neuronal network stimulation. PloS One 2018, 13, e0198396. [Google Scholar] [CrossRef] [PubMed]
- Gerasimova, S.A.; Belov, A.I.; Korolev, D.S.; Guseinov, D.V.; Lebedeva, A.V.; Koryazhkina, M.N.; Mikhaylov, A.N.; Kazantsev, V.B.; Pisarchik, A.N. Stochastic memristive interface for neural signal processing. Sensors 2021, 21, 5587. [Google Scholar] [CrossRef] [PubMed]
- Lebedeva, A.; Gerasimova, S.; Fedulina, A.; Mishchenko, M.; Beltyukova, A.; Matveeva, M.; Mikhaylov, A.; Pisarchik, A.; Kazantsev, V. Neuromorphic system development based on adaptive neuronal network to modulate synaptic transmission in hippocampus. 2021 Third International Conference Neurotechnologies and Neurointerfaces (CNN). IEEE, 2021, pp. 57–60.
- Lebedeva, A.; Beltyukova, A.; Fedulina, A.; Gerasimova, S.; Mishchenko, M.; Matveeva, M.; Maltseva, K.; Belov, A.; Mikhaylov, A.; Pisarchik, A. ; others. Development a cross-loop during adaptive stimulation of hippocampal neural networks by an artificial neural network. 2022 Fourth International Conference Neurotechnologies and Neurointerfaces (CNN). IEEE, 2022, pp. 82–85.
- Gerasimova, S.A.; Beltyukova, A.; Fedulina, A.; Matveeva, M.; Lebedeva, A.V.; Pisarchik, A.N. Living-neuron-based autogenerator. Sensors 2023, 23, 7016. [Google Scholar] [CrossRef] [PubMed]
- Lebedeva, A.; Beltyukova, A.; Gerasimova, S.; Sablin, A.; Gromov, N.; Matveeva, M.; Fedulina, A.; Razin, V.; Mischenko, M.; Levanova, T. ; others. Development an intelligent method for restoring hippocampal activity after damage. 7th Scientific School Dynamics of Complex Networks and their Applications (DCNA). IEEE, 2023, pp. 169–173.
- Beltyukova, A.V.; Razin, V.V.; Gromov, N.V.; Samburova, M.I.; Mishchenko, M.A.; Kipelkin, I.M.; Malkov, A.E.; Smirnov, L.A.; Levanova, T.A.; Gerasimova, S.A. ; others. The concept of hippocampal activity restoration using artificial intelligence technologies. International Conference on Mathematical Modeling and Supercomputer Technologies. Springer, 2023, pp. 240–252.
- Navas-Olive, A.; Amaducci, R.; Jurado-Parras, M.T.; Sebastian, E.R.; de la Prida, L.M. Deep learning-based feature extraction for prediction and interpretation of sharp-wave ripples in the rodent hippocampus. Elife 2022, 11, e77772. [Google Scholar] [CrossRef] [PubMed]
- Hagen, E.; Chambers, A.R.; Einevoll, G.T.; Pettersen, K.H.; Enger, R.; Stasik, A.J. RippleNet: a recurrent neural network for sharp wave ripple (SPW-R) detection. Neuroinformatics 2021, 19, 493–514. [Google Scholar] [CrossRef] [PubMed]
- Rim, B.; Sung, N.J.; Min, S.; Hong, M. Deep learning in physiological signal data: A survey. Sensors 2020, 20, 969. [Google Scholar] [CrossRef] [PubMed]
- Ouchi, A.; Toyoizumi, T.; Ikegaya, Y. Distributed encoding of hippocampal information in mossy cells. bioRxiv 2024, pp. 2024–03. 2024.
- Lebedeva, A.; Mishchenko, M.; Bardina, P.; Fedulina, A.; Mironov, A.; Zhuravleva, Z.; Gerasimova, S.; Mikhaylo, A.; Pisarchik, A.; Kazantsev, V. Integration technology for replacing damaged brain areas with artificial neuronal networks. 4th Scientific School on Dynamics of Complex Networks and their Application in Intellectual Robotics (DCNAIR). IEEE, 2020, pp. 158–161.
- Gerasimova, S.; Lebedeva, A.; Fedulina, A.; Koryazhkina, M.; Belov, A.; Mishchenko, M.; Matveeva, M.; Guseinov, D.; Mikhaylov, A.; Kazantsev, V.; others. A neurohybrid memristive system for adaptive stimulation of hippocampus. Chaos Soliton. Fract. 2021, 146, 110804. [Google Scholar] [CrossRef]
- Unakafova, V.A.; Gail, A. Comparing open-source toolboxes for processing and analysis of spike and local field potentials data. Front. Neuroinform. 2019, 13, 57. [Google Scholar] [CrossRef]
- Hochreiter, S.; Schmidhuber, J. Long short-term memory. Neural Comput. 1997, 9, 1735–1780. [Google Scholar] [CrossRef] [PubMed]
- Van Houdt, G.; Mosquera, C.; Nápoles, G. A review on the long short-term memory model. Artif. Intell. Rev. 2020, 53, 5929–5955. [Google Scholar] [CrossRef]
- Verstraeten, D.; Schrauwen, B.; d’Haene, M.; Stroobandt, D. An experimental unification of reservoir computing methods. Neural Netw. 2007, 20, 391–403. [Google Scholar] [CrossRef]
- Lukoševičius, M.; Jaeger, H. Reservoir computing approaches to recurrent neural network training. Comput. Sci. Rev. 2009, 3, 127–149. [Google Scholar] [CrossRef]
- Schrauwen, B.; Verstraeten, D.; Van Campenhout, J. An overview of reservoir computing: theory, applications and implementations. Proceedings of the 15th european symposium on artificial neural networks, 2007, pp. 471–482.
- Bengio, Y.; Boulanger-Lewandowski, N.; Pascanu, R. Advances in optimizing recurrent networks. IEEE international conference on acoustics, speech and signal processing. IEEE, 2013, pp. 8624–8628.
- Cucchi, M.; Abreu, S.; Ciccone, G.; Brunner, D.; Kleemann, H. Hands-on reservoir computing: a tutorial for practical implementation. Neuromorphic Comput. Eng. 2022, 2, 032002. [Google Scholar] [CrossRef]
- Vlachas, P.R.; Pathak, J.; Hunt, B.R.; Sapsis, T.P.; Girvan, M.; Ott, E.; Koumoutsakos, P. Backpropagation algorithms and reservoir computing in recurrent neural networks for the forecasting of complex spatiotemporal dynamics. Neural Netw. 2020, 126, 191–217. [Google Scholar] [CrossRef]
- Bompas, S.; Georgeot, B.; Guéry-Odelin, D. Accuracy of neural networks for the simulation of chaotic dynamics: Precision of training data vs precision of the algorithm. Chaos 2020, 30. [Google Scholar] [CrossRef]
- Gauthier, D.J.; Bollt, E.; Griffith, A.; Barbosa, W.A. Next generation reservoir computing. Nat. Commun. 2021, 12, 1–8. [Google Scholar] [CrossRef] [PubMed]
- Nakajima, M.; Inoue, K.; Tanaka, K.; Kuniyoshi, Y.; Hashimoto, T.; Nakajima, K. Physical deep learning with biologically inspired training method: gradient-free approach for physical hardware. Nat. Commun. 2022, 13, 7847. [Google Scholar] [CrossRef]
- Gromov, N.; Lebedeva, A.; Kipelkin, I.; Elshina, O.; Yashin, K.; Smirnov, L.; Levanova, T.; Gerasimova, S. The choice of evaluation metrics in the prediction of epileptiform activity. International Conference on Mathematical Modeling and Supercomputer Technologies. Springer, 2023, pp. 280–293.
- Petukhov, A.; Rodionov, D.; Karchkov, D.; Moskalenko, V.; Nikolskiy, A.; Zolotykh, N. Isolation of ECG sections associated with signs of cardiovascular diseases using the transformer architecture. International Conference on Mathematical Modeling and Supercomputer Technologies. Springer, 2023, pp. 209–222.
- Razin, V.; Krasnov, A.; Karchkov, D.; Moskalenko, V.; Rodionov, D.; Zolotykh, N.; Smirnov, L.; Osipov, G. Solving the problem of diagnosing a disease by ECG on the PTB-XL dataset using deep learning. International Conference on Neuroinformatics. Springer, 2023, pp. 13–21.
- Radanliev, P.; De Roure, D. Review of the state of the art in autonomous artificial intelligence. AI and Ethics 2023, 3, 497–504. [Google Scholar] [CrossRef]
- Abramoff, M.D.; Whitestone, N.; Patnaik, J.L.; Rich, E.; Ahmed, M.; Husain, L.; Hassan, M.Y.; Tanjil, M.S.H.; Weitzman, D.; Dai, T.; others. Autonomous artificial intelligence increases real-world specialist clinic productivity in a cluster-randomized trial. NPJ Digit. Med. 2023, 6, 184. [Google Scholar] [CrossRef] [PubMed]
- Mikolajick, T.; Park, M.H.; Begon-Lours, L.; Slesazeck, S. From ferroelectric material optimization to neuromorphic devices. Adv. Mater. 2023, 35, 2206042. [Google Scholar] [CrossRef]
- Zhou, K.; Jia, Z.; Zhou, Y.; Ding, G.; Ma, X.Q.; Niu, W.; Han, S.T.; Zhao, J.; Zhou, Y. Covalent organic frameworks for neuromorphic devices. J. Phys. Chem. Lett. 2023, 14, 7173–7192. [Google Scholar] [CrossRef] [PubMed]
- Kim, I.J.; Lee, J.S. Ferroelectric transistors for memory and neuromorphic device applications. Adv. Mater. 2023, 35, 2206864. [Google Scholar] [CrossRef] [PubMed]
- Lo, Y.T.; Lim, M.J.R.; Kok, C.Y.; Wang, S.; Blok, S.Z.; Ang, T.Y.; Ng, V.Y.P.; Rao, J.P.; Chua, K.S.G. Neural interface-based motor neuroprosthesis in post-stroke upper limb neurorehabilitation: An individual patient data meta-analysis. Arch. Phys. Med. Rehabil. 2024. [Google Scholar] [CrossRef] [PubMed]
- Höhler, C.; Trigili, E.; Astarita, D.; Hermsdörfer, J.; Jahn, K.; Krewer, C. The efficacy of hybrid neuroprostheses in the rehabilitation of upper limb impairment after stroke, a narrative and systematic review with a meta-analysis. Artif. Organs 2024, 48, 232–253. [Google Scholar] [CrossRef] [PubMed]
- Gupta, A.; Vardalakis, N.; Wagner, F.B. Neuroprosthetics: from sensorimotor to cognitive disorders. Commun. Biol. 2023, 6, 14. [Google Scholar] [CrossRef]
- Yaseen, S.G. The impact of AI and the Internet of things on healthcare delivery. Cutting-Edge Business Technologies in the Big Data Era: Proceedings of the 18th SICB “Sustainability and Cutting-Edge Business Technologies”. Springer Nature, 2023, Vol. 2, p. 396.
- Wolf, D.; Turovsky, Y.; Meshcheryakov, R.; Iskhakova, A. Human identification by dynamics of changes in brain frequencies using artificial neural networks. International Conference on Speech and Computer. Springer, 2023, pp. 271–284.
- Araújo, A. From artificial intelligence to semi-creative inorganic intelligence: a blockchain-based bioethical metamorphosis. AI and Ethics 2024, pp. 1–6. AI and Ethics.
- Terven, J.; Cordova-Esparza, D. A comprehensive review of YOLO architectures in computer vision: From YOLOv1 to YOLOv8 and YOLO-NAS. arXiv:2304.00501 2023.
- Khokhani, I.; Nathani, J.; Dhawane, P.; Madhani, S.; Saxena, K. Unveling chess algorithms using reinforcement learning and traditional chess approaches in AI. 3rd Asian Conference on Innovation in Technology (ASIANCON). IEEE, 2023, pp. 1–4.
- Zhou, X.; Wu, L.; Zhang, Y.; Chen, Z.S.; Jiang, S. A robust deep reinforcement learning approach to driverless taxi dispatching under uncertain demand. Inf. Sci. 2023, 646, 119401. [Google Scholar] [CrossRef]
- Alhalabi, B.A. Hybrid chip-set architecture for artificial neural network system, 1998. US Patent 5,781, 702.
- Pei, J.; Deng, L.; Song, S.; Zhao, M.; Zhang, Y.; Wu, S.; Wang, G.; Zou, Z.; Wu, Z.; He, W.; others. Towards artificial general intelligence with hybrid Tianjic chip architecture. Nature 2019, 572, 106–111. [Google Scholar] [CrossRef]
|
Disclaimer/Publisher’s Note: The statements, opinions and data contained in all publications are solely those of the individual author(s) and contributor(s) and not of MDPI and/or the editor(s). MDPI and/or the editor(s) disclaim responsibility for any injury to people or property resulting from any ideas, methods, instructions or products referred to in the content. |
© 2024 by the authors. Licensee MDPI, Basel, Switzerland. This article is an open access article distributed under the terms and conditions of the Creative Commons Attribution (CC BY) license (http://creativecommons.org/licenses/by/4.0/).
