1. Introduction
Doping is the act of using prohibited substances and/or methods in sports to enhance athletic performance and success by improving physical performance [
1]. The World Anti-Doping Agency (WADA), which was established in 1999, is involved in scientific research on doping, anti-doping education, the development of anti-doping strategies, and the monitoring of the World Anti-Doping Code to ensure soundness and fairness in sports worldwide [
2]. However, despite WADA’s substantial efforts, doping has not been eradicated from competitive sports.
In fact, at the Tokyo 2020 Olympics in 2021, a track and field athlete was arrested for blood doping [
3]. Advances in medicine and science are known to make doping more sophisticated. Therefore, we must continue to work toward establishing testing methods for any forms of doping in order to protect the fairness and health of athletes.
In recent years, gene therapy technology has been developing rapidly. In particular, the vaccine against the coronavirus disease 2019 (COVID-19) virus that shook the world is an application of this gene therapy technology. In addition, around the world, gene therapies using various vectors have been approved in patients who have muscular dystrophy, spinal muscular atrophy (SMA), hemophilia, and various other diseases [
4,
5]. These diseases used to be incurable, but technological innovations in gene therapy have saved patients’ lives, and it is no exaggeration to say that this is the most advanced form of medicine this century.
Gene therapy technology is evolving at this very moment, but there remains a possibility that it may be abused in the form of gene doping, and therefore, there is an urgent need to develop a method of testing for its presence. In fact, WADA, which oversees the world’s anti-doping testing, has been also wary of gene doping. The International Standard Prohibited List (2024) [
6] stipulated in the World Anti-Doping Code 2021 [
7], which is published with annual revisions by WADA, describes various formulations and methods used in doping. This list includes “gene doping” as a form of abuse of gene therapy technology. On this basis, our research group has been conducting research for more than seven years to establish a detection method for gene doping [
8,
9,
10,
11,
12].
Erythropoietin (EPO) has a long history of use in doping [
13,
14,
15,
16,
17], and is the substance causing the most alarm. In addition, recombinant adeno-associated viral (rAAV) vectors have been confirmed to be safe in gene therapy [
18], and are frequently used in gene therapy clinical trials [
19]. Therefore, the combination of erythropoietin andrAAV is considered to be at high risk of abuse.
In addition, as a means of indirect proof, we have recommended that the monitoring of fluctuations in RNA expression in whole-blood samples could be included in the parameters of the Athlete Biological Passport (ABP) [
8]. The fundamental principle underlying the ABP involves monitoring selected biological variables that indirectly reveal the effects of doping over time rather than attempting to detect the doping substance or method itself [
20]. Therefore, the regular observation of RNA expression changes in whole blood could be added as a parameter for the ABP in the future. In fact, our previous studies with a gene doping model have shown the advantage of quantifying the variability of RNA expression in whole blood [
8].
Furthermore, WADA explains that the ABP can be used to identify athletes requiring further attention through intelligent, timely interpretation of passport data and can notably be used as a complement to analytical methods to further refine and strengthen overall anti-doping strategies [
20]. Therefore, in this study, total RNA sequencing (RNA-seq) using whole-blood RNA was also performed to identify novel indirect proof based on the concept of the ABP.
In summary, the objectives of this study were to establish a model of gene doping using adeno-associated virus vector-9 including the human erythropoietin gene (rAAV9-hEPO), and to establish a method for detecting direct or indirect evidence of genetic doping using blood. As a result, we were able to successfully create the mouse model and prove that it is possible to accurately detect gene doping.
2. Materials and Methods
2.1. Creation of the rAAV9-hEPO Vector
To establish a robust gene-doping mouse model injected with rAAV9-hEPO, a viral vector was created via the following procedures using an outsourcing company (VectorBuilder Inc., Science City, Guangzhou, China). The pAAV expression vector containing 5’ ITRs (inverted terminal repeats) and 3’ ITRs was created with the VectorBuilder web tool. The plasmid was loaded with elements of CMVp (Human cytomegalovirus immediate early enhancer/promoter), hEPO, and WPRE (Woodchuck hepatitis virus posttranscriptional regulatory element). After that, we requested VectorBuilder to create rAAV9 using the plasmid and to obtain the virus particles by an amplification and purification method using the ultra-centrifugal method. The titers of the virus particles obtained were 2.76x10^13 vg (viral genome)/mL.
2.2. Animal Experiments
All animal experiments in this study were approved by the Animal Care Committee, University of Tsukuba (approval number: 22-125). Six-week-old male ICR mice were purchased from CREA Japan (Meguro, Tokyo, Japan) and then subjected to a 1-week acclimation period. The mice were bred and maintained in an air-conditioned animal house under specific pathogen-free conditions and subjected to a 12/12 h light/dark cycle. The mice were fed standard mice pellets and water ad libitum. At the start of the experiments, the age of the mice was 7 weeks and weights were 35.6 g±1.7 (average±SD). The animal experiments were broadly divided into short- and long-term experiments.
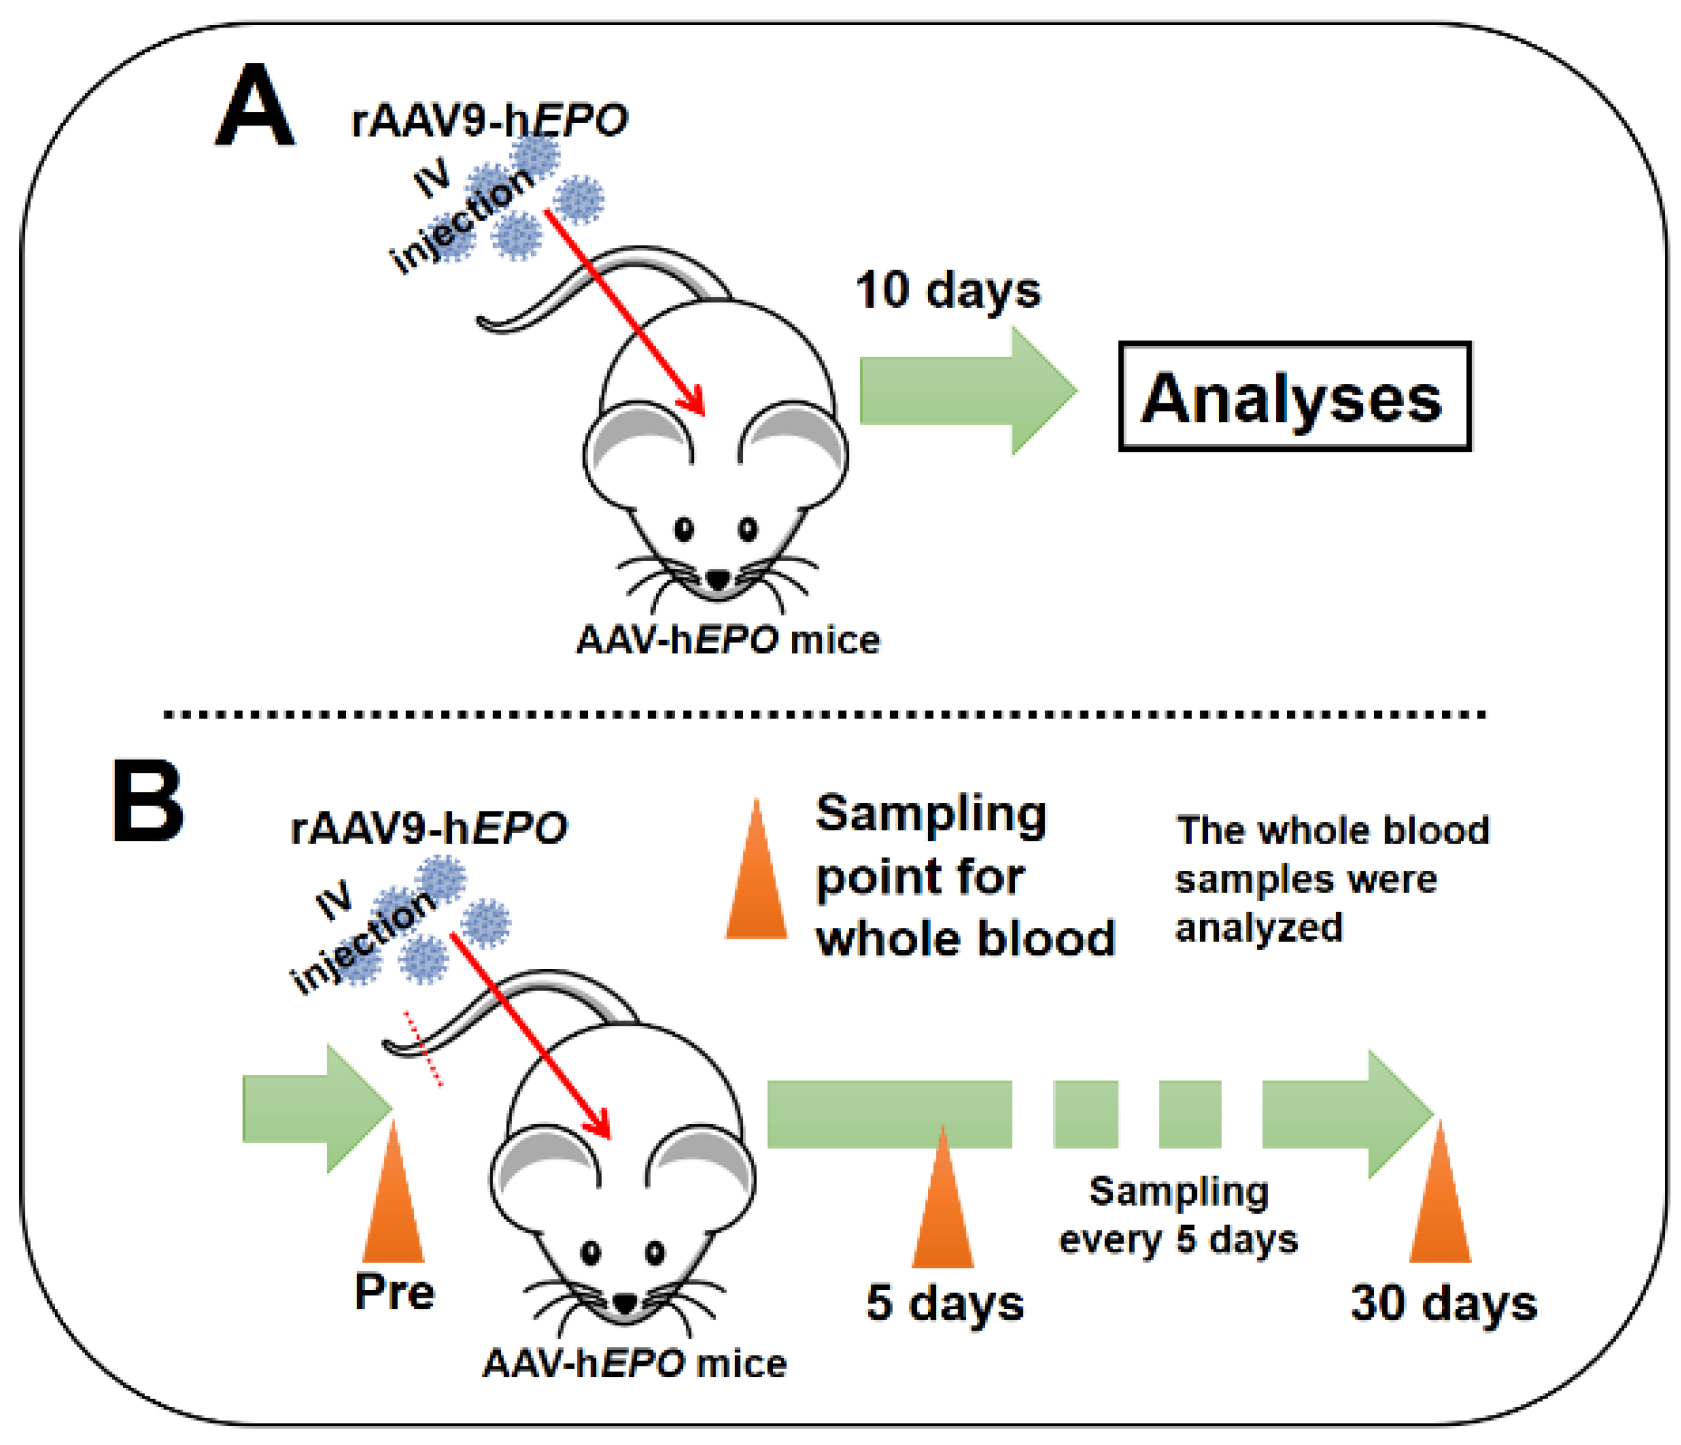
The short-term experiments were conducted to establish a gene-doping mouse model with the rAAV9-h
EPO vectored and to develop methods to detect direct and indirect proof of gene doping. An overview of these experiments is shown in
Figure 1A. After 1 week of acclimatization, mice were randomly assigned to the control (n = 8; named Con.) or rAAV9-h
EPO (n = 8; named AAV-h
EPO) groups. The mice in the AAV-h
EPO group received injections of the rAAV9-h
EPO vector (10^11 vg/100 µL/mouse) into the orbital sinus under systemic isoflurane inhalation anesthesia. The mice of the Con. group (n = 8) received injections of the 10% glycerol/PBS (100 µL/mouse) buffer used to suspend the rAAV9-h
EPO vector. Ten days after the injection, whole blood was obtained with EDTA-2Na as an anticoagulant from the inferior vena cava under systemic isoflurane inhalation anesthesia, after which the mice were euthanized. The collected whole-blood samples were subjected to preprocessing about plasma separation, aliquoting, etc. for further analysis. Samples of liver and spleen were also harvested and flash-frozen in liquid nitrogen until further analysis. Other samples of spleen and liver tissues were immersed into 10% formalin neutral buffer solution overnight to obtain paraffin block specimens.
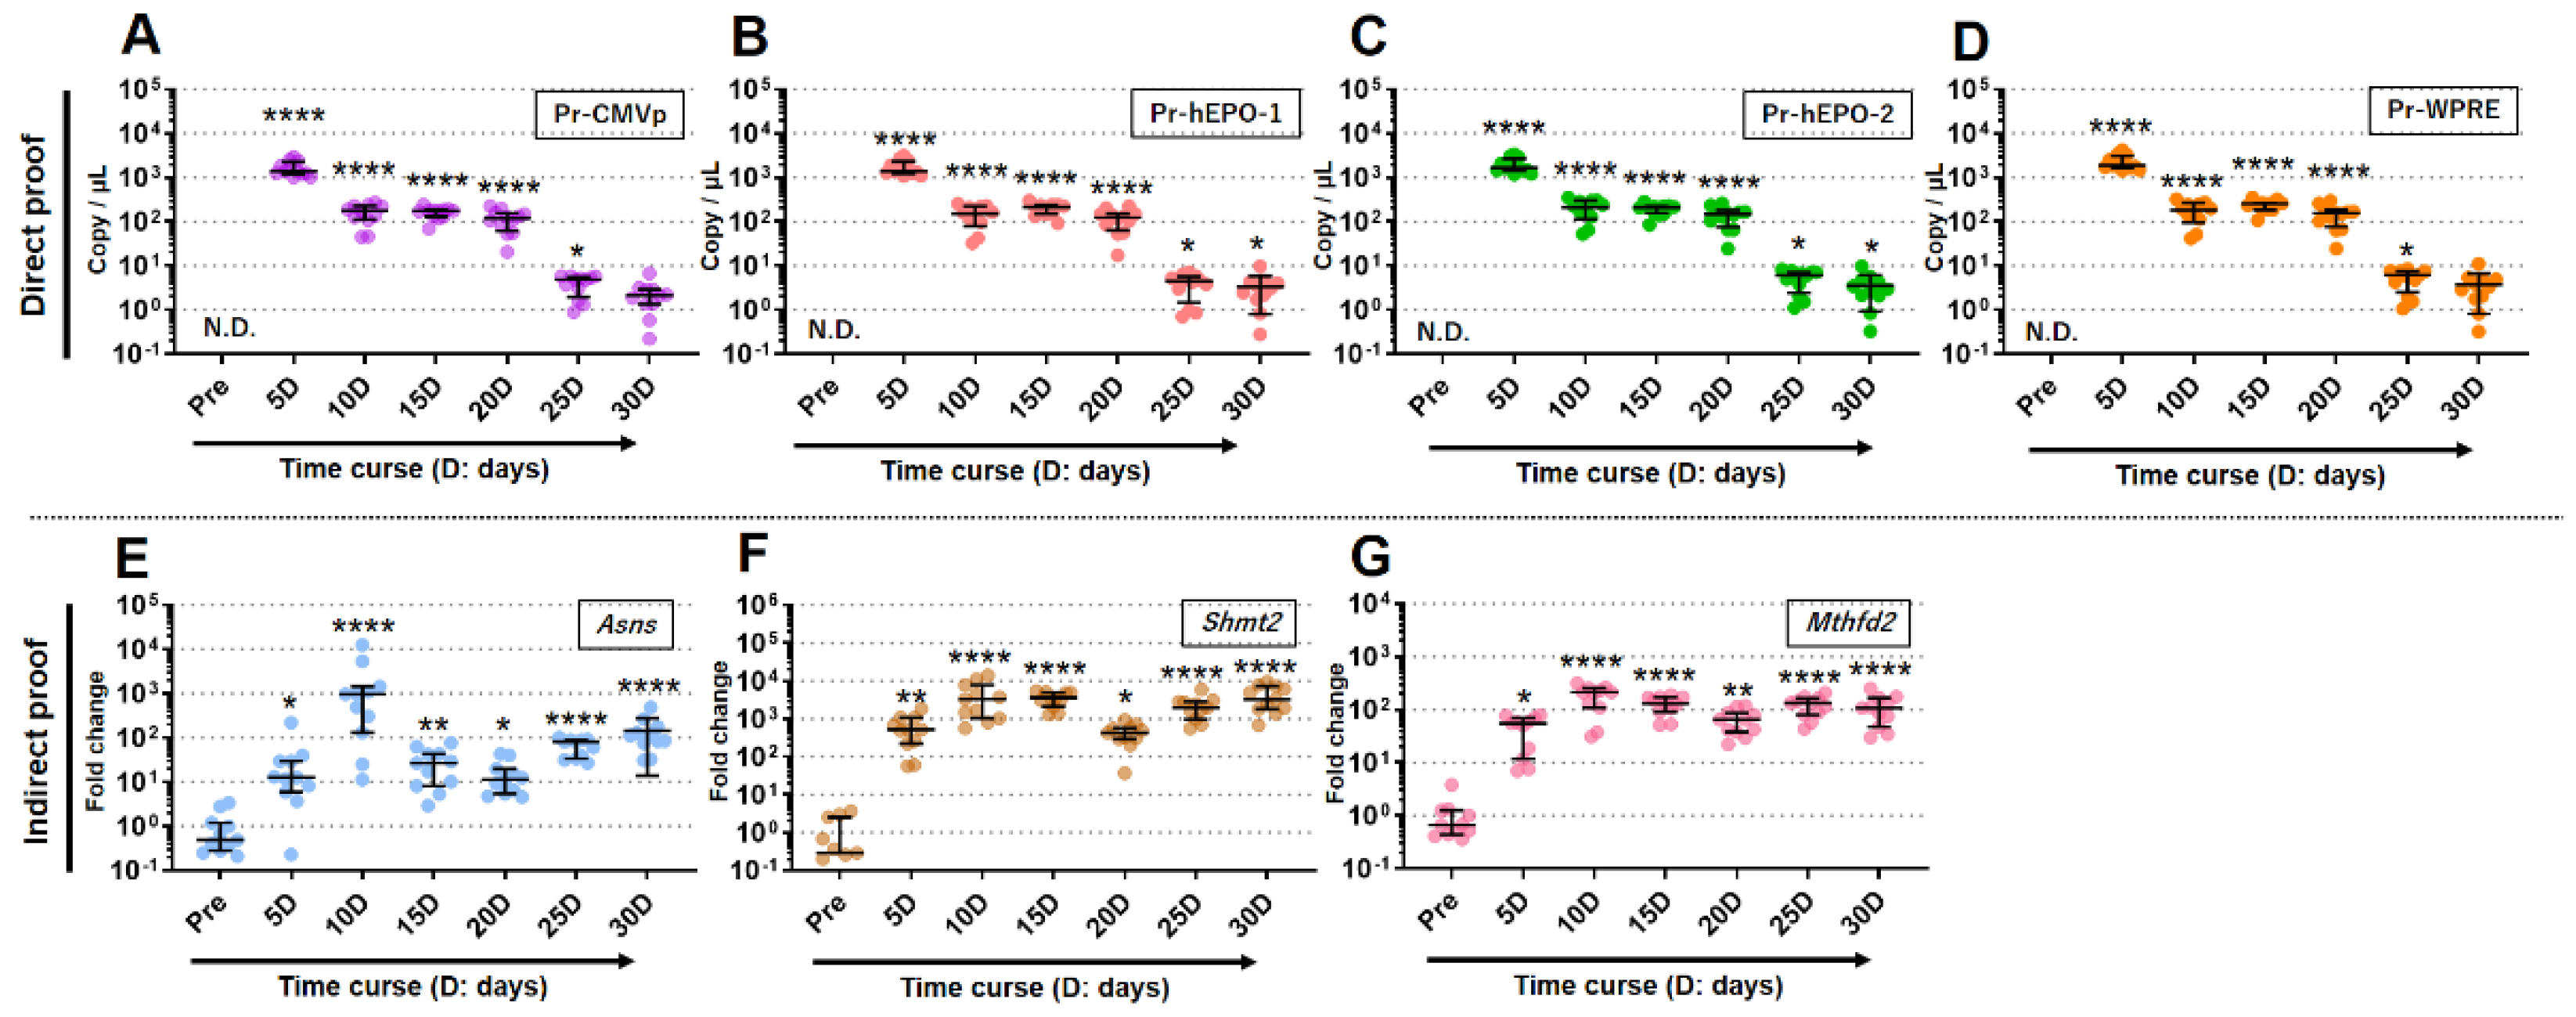
Long-term experiments including repeated sampling were conducted to investigate how long direct and indirect proof of gene doping could be positively detected from approximately one drop of whole blood. An overview of these experiments is shown in
Figure 1B. After 1 week of acclimatization, small whole-blood samples (approximately 100 µL; 2 drops) from mice (n = 11) were collected with EDTA-2Na using cuts made approximately 1 mm from the tail tip (“Pre“ time point). Then, the AAV9-h
EPO vector was injected using the methods described above. Subsequently, using the same method described above, blood samples were continually collected every 5 days for 30 days after the injection, as shown in
Figure 1B. In order to eliminate the adverse effects of continuous blood collection on mice (for example, anemia, hematopoietic stimulation, etc.) as much as possible, we selected a blood-collection method that only obtained small amounts (approximately 100 µL) from the tail tip. The collected blood samples were divided into two samples of approximately 50 µL (equivalent to about one drop) each, and DNA and RNA were extracted from these samples and subjected to further analyses.
The animal experimental methods described so far are identical in many respects to those of our previous study [
8]. In addition, the description of this later experimental method is likewise similar in many respects to the experimental methods of our previous study [
8]. Therefore, the method descriptions that follow may cite reference number 8.
2.3. Measurements of General Hematopoietic Markers
Hematological indicators of red blood cells (RBCs) count, hemoglobin (HGB) level, and hematocrit (HCT) value from obtained the whole blood in the short-term experiments were measured on an automatic blood analyzer (Celltac α MEK6458; NIHON KODEN, Shinjuku, Tokyo, Japan) using 50 µL of whole blood [
8]. Whole-blood volumes were also measured using 5mL syringe, during the whole-blood collection.
2.4. Enzyme-Linked Immunosorbent Assay
An enzyme-linked immunosorbent assay (ELISA) was performed to confirm the secretion of hEPO into the blood from the liver in AAV-h
EPO mice in the short-term experiment. Anti-hEPO (Cat# 500-P318; PeproTech, Cranbury, NJ, USA) was diluted to 0.5 µg/mL in PBS as a capture antibody, and 100 µL of the antibody solution was then applied into ELISA plates to obtain triplicate measurements. The plate was incubated at 4 °C overnight and then washed with PBS containing 0.05% Tween 20 (PBS-T) four times; then, 100 µL of the plasma samples diluted 20-fold with PBS were added to the wells and incubated for 1 h at room temperature. Solutions of hEPO recombinant protein (Cat# 100-64; PeproTech) in PBS including 5% BSA were also added to generate a standard hEPO curve between 100 ng/mL and 195 pg/mL. After incubation, the plate was washed in the same way as described previously, and a 100 µL solution of a detection antibody (biotinylated anti-hEPO; Cat# 500-P318BT; PeproTech) diluted with PBS-T was applied to the wells at a concentration of 0.25 ng/µL, followed by incubation for 1 h at room temperature. After incubation, the plate was washed in the same way, and a 100 µL solution of HRP-conjugated streptavidin (Cat# SA00001-0; Proteintech, Rosemont, IL, USA) was diluted 5000-fold with PBS-T and was applied to the wells. The plate was incubated at room temperature for 30 min and then washed the same way. After washing, a 100 µL mixture of coloring reagent and substrate (ELISA POD Substrate A.B.T.S Kit, Cat# 14351-80; Nacalai Tesque, Nakagyo, Kyoto, Japan) was applied and incubated for 15 min, followed by application of 100 µL of stop reagent for the coloring reaction. Finally, the absorbance at 405 nm with a reference at 600 nm was measured using a microplate reader. Using the absorbance data, a standard curve as a 4-parameter logistic regression of the Rodbard equation was created in ImageJ Fiji (Life-Line version, v1.53q), and the concentration of hEPO in the plasma was calculated in duplicate measurements based on the standard curve (R2 = 0.99) [
8].
2.5. TB Green qPCR Assay for Tissue
To confirm the expression of hematopoietic marker genes in the liver and spleen in the short-term experiment, a TB Green qPCR assay was performed as an intercalation method. RNA extraction from the liver and spleen was performed using RNAiso Plus (Cat# 9180; Takara Bio, Kusatsu, Shiga, Japan) according to the manufacturer’s instructions. The extracted RNA solution in Milli-Q Water (Merck Millipore, Burlington, MA, USA) was diluted and adjusted to a concentration of 100 ng/µL. Then, 500 ng of RNA was used to prepare cDNAs using PrimeScript RT Master Mix (Cat# RR036A; Takara Bio) according to the manufacturer’s instructions. The cDNAs were diluted 10× using Milli-Q Water and subjected to a quantitative real-time PCR (qPCR) assay based on the intercalator-fluorescence dye. The qPCR assay was performed to quantify the gene expression of hematopoietic markers in the liver and spleen by using TB Green Premix Ex Taq II (Cat# RR820; Takara Bio) with primers from QuantStudio 5 Real-Time PCR Systems (Thermo Fisher Scientific, Waltham, MA, USA) as duplicate measurements. The targeted gene list and primer sequences are shown in
Supplementary Table S1 The template volume and primer concentrations were 2 µL and 100 nM, respectively, for a total reaction volume of 10 µL per well. Negative control wells were also established using Milli-Q water instead of the template. The conditions for thermal cycling were 95 °C for 5 min, followed by 40 cycles of 95 °C for 2 s and 60 °C for 20 s and a melt curve stage. Subsequently, the ΔΔCt method was used to calculate the relative gene expression values with reference to 18S rRNA [
8].
2.6. Histology
The paraffin blocks of each tissue obtained were sectioned into 3 μm thick slices, and H&E (hematoxylin and eosin) staining was performed. After the staining, the morphology was observed under a microscope.
2.7. DNA Extraction from Whole-Blood Samples
A Maxwell RSC Blood DNA Kit (Cat# AS1400; Promega, Madison, WI, USA) was used to extract total DNA from 100 µL (short-term experiment) or 50 µL (long-term experiment) of whole blood, using a Maxwell RSC Instrument (Promega), according to the manufacturer’s instructions. The DNAs were dissolved in 50 µL of Milli-Q Water, and the solutions were subjected to the TaqMan-qPCR assays.
2.8. TaqMan qPCR Assay
A TaqMan qPCR assay was performed on the whole-blood DNA. For the detection of direct proof of gene doping in whole-blood DNA in the short- and long-term experiments, the primers and TaqMan probes were designed to target the
EPO gene (2 types), WPRE (Woodchuck hepatitis virus posttranscriptional regulatory element; named Pr-WPRE), and CMVp (cytomegalovirus promoter; named Pr-CMVp) to ensure specific amplification of the rAAV9-h
EPO genome using the Primer-BLAST web tool [
21]. The primers and TaqMan probes for the two types of h
EPO genes were designed with exon–exon junctions (exons 2–4 and 4–5; primer names are Pr-hEPO-1 and Pr-hEPO-2), which are considered non-amplifying structures in the human genome. This strategy of designing primers/probes for the h
EPO gene to detect gene doping follows WADA’s guidelines [
22]. The primers and probes were also checked for specificity with in silico PCR using Primer-BLAST; these evaluations confirmed the absence of amplification in the human and mouse genomes. The sequences of the primers and TaqMan probes are shown in
Supplementary Table S1. The primers and probes in a double quencher system were systemized by Integrated DNA Technologies (IDT; Coralville, IA, USA). Next, the TaqMan qPCR assay was performed in duplicate to detect direct proof in whole-blood DNA by absolute quantification using PrimeTime Gene Expression Master Mix (Cat# 1055771; IDT) with the primers and TaqMan probes on QuantStudio 5 Real-Time PCR Systems (Thermo Fisher Scientific, Waltham, MA, USA). The template DNA volume was 2 µL, and the primer and probe concentrations were 200 nM and 200 nM, respectively, for a total reaction volume of 10 µL per well. Negative control wells were also established using Milli-Q water instead of a template. DNA of 6 human cell lines (fibroblast, HK2cell, Caco-2 cell, HEK293 cell, mesenchymal stem cell, and HepG2 cell) were used as the negative control. pAAV expression vectors including the h
EPO gene, WPRE, and CMVp (pAAV-h
EPO) were used at 10 pg/μL to prepare a standard curve for absolute quantification, and the range of the standard curves was set to 0.95 to 1.86x10^6 copy/μL for the pAAV. The conditions of thermal cycling for all primer/probe pairs were 95 °C for 5 min, followed by 40 cycles of 95 °C for 2 s and 60 °C for 20 s. All standard curves had R2 > 0.99 [
8].
2.9. Sanger Sequencing
After the TaqMan qPCR, solutions including the amplicon were pooled in a 1.5 mL microtube and then subjected to electrophoresis using a 2% agarose gel. The bands of the DNA amplicons were visualized using ethidium bromide solution. Subsequently, the PCR amplicons were purified using a NucleoSpin Gel and PCR Clean-up kit (Cat# 740609; Takara Bio, Kusatsu, Shiga, Japan). Next, to check the sequence of the DNA amplicons, 5 ng of the purified DNA was subjected to Sanger sequencing via outsourcing to an external company (GENEWIZ, Shinagawa, Tokyo, Japan). The Sanger sequencing data were analyzed with BioEdit ver. 7.2.5 (developer: Tom Hall, Carlsbad, CA, USA) [
8]. Alignment analysis for 42 nucleotides obtained from the Sanger sequence was performed referring to the DNA sequence of the rAAV9-h
EPO.
2.10. Total RNA-Seq
Total RNA-seq was performed to identify RNA as novel indirect proof based on the concept of the ABP [
20]. The total RNA of the mice (Con., N=6; AAV-h
EPO, N=6) in the short-term experiments was extracted from 100 µL of whole blood using RNAiso Blood (Cat# 9112; Takara Bio) according to the manufacturer’s instructions. The RNA pellets were dissolved in 30 µL of Milli-Q Water, and the RNA solutions of 12 samples (Con.: n = 6; AAV-h
EPO: n = 6) were checked for integrity using Agilent RNA 600 Nano Kit (Cat# 5067-1511; Agilent Technologies, Santa Clara, CA, USA) on a Bioanalyzer (Agilent Technologies). The RNA Integrity Number (RIN) of all samples was 9.5 or higher; thus, the RNAs of all eight samples could be subjected to library preparations for total RNA-seq. Using 500 ng of the RNAs from each sample, libraries were created using the NEBNext Ultra II RNA Library Prep Kit for Illumina and the NEBNext rRNA Depletion Kit v2 (Cat# E7770S and E7400L; New England Biolabs, Ipswich, MA, USA) according to the manufacturer’s instructions, and the final PCR cycle was 15. Concentrations and size distributions of the libraries were measured using an Agilent DNA 7500 kit (Cat#5067-1506; Agilent Technologies, Santa Clara, CA, USA) with Bioanalyzer. All samples were passed for analyses on NGS equipment. The libraries were pooled, and the concentrations were adjusted to 1 nM. The pooled libraries were subjected to denaturation and neutralization. Subsequently, the libraries were diluted to 1.8 pM and then applied for an NGS run using NextSeq500/550 v2.5 (75 Cycles) Kits (Cat#20024906; Illumina, San Diego, CA, USA) in the NextSeq 500 System (Illumina). The sequencing was performed with paired-end reads of 36 bases. After the sequencing run, FASTQ files were exported, and the basic information of the NGS run data were checked via the CLC Genomics Workbench 24.0 software package (QIAGEN, Hilden, Germany). In the quality assessment of the reads, a PHRED score over 20 was confirmed for 99.65% of all reads, indicating the success of the run. The read number was approximately 11.4 to 16.1 million per sample as paired-end reads [
8].
2.11. Bioinformatics Analysis
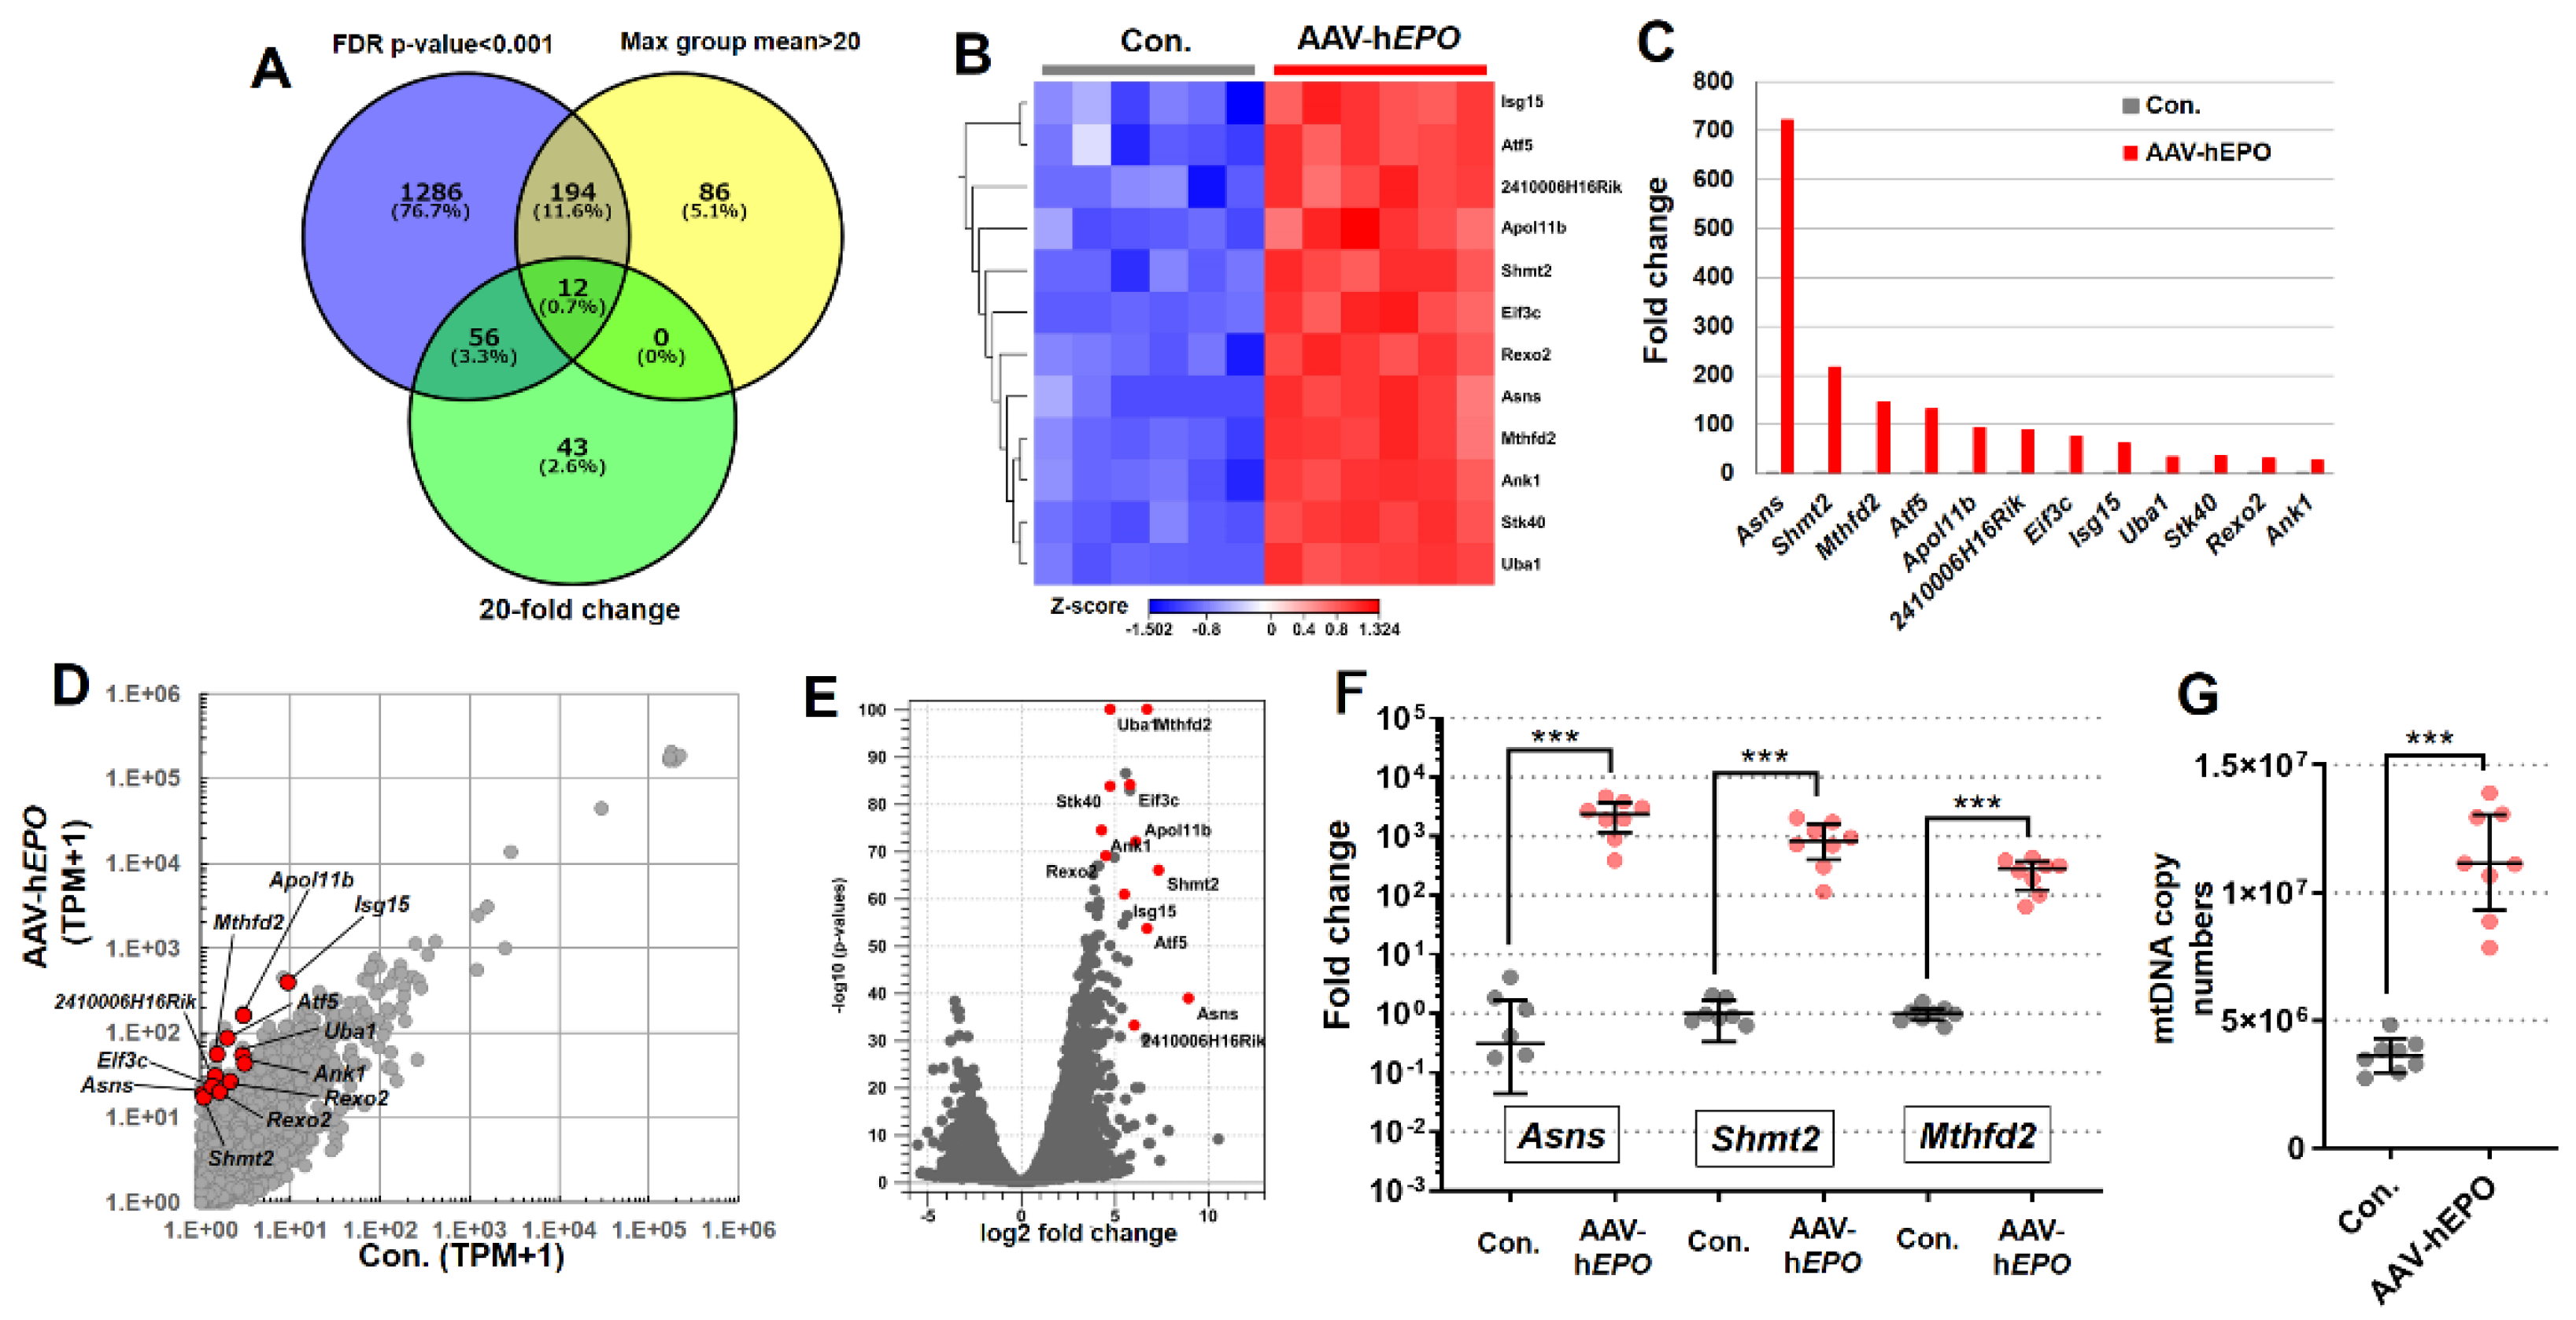
The following analysis was performed to identify RNA markers (genes) as novel indirect proof based on the concept of the ABP using NGS run data. FASTQ files were mapped to the mouse genome (GRCm39) using the CLC software (QIAGEN). A statistical differential expression test was performed using the Differential Expression in Two Groups tool in the software package. A principal component analysis (PCA) plot was created using the CLC software. Transcripts Per Kilobase Million (TPM) or CPM (Counts per Million mapped reads) values were used as an expression value for figure visualizations. A cluster dendrogram was created using R (ver. 4.1.1). A tool for enrichment analysis was performed using Gene Set Enrichment Analysis (GSEA; version 4.3.3) with Mouse MSigDB (a database for enrichment analysis; mouse-ortholog hallmark gene sets; v2022.1.Mm) [
23,
24]. The Venny ver.2.1.0 [
25] web tool was used to identify RNAs with dramatically fluctuating expression.
Supplementary Table S2 shows the quantitative expression values, fold changes, and p-values of all genes obtained by analysis using the CLC software.
2.12. Measurements of mtDNA Copy Numbers in the Whole Blood
The results from the GSEA analysis of the above bioinformatics analysis showed that the gene set related to mitochondrial activity was significantly hit, so we checked the consistency of the results. The number of mitochondrial DNA (mtDNA) was measured using the whole-blood DNAs that were obtained from mice in the short-term experiment. The TB Green qPCR Assay was employed as described in
Section 2.5. Primer pairs were designed to target nuclear DNA (nDNA) and mtDNA (
Supplementary Table S1). The number of mtDNA per nDNA was quantified using CT values obtained from the qPCR assay.
2.13. TB Green qPCR Assay for Whole-Blood RNA
To confirm whether the genes identified as being indirect proof of gene doping showed reproducibility for the total RNA-seq results, a TB Green qPCR assay was performed for all samples (Con.: n = 8; AAV9-h
EPO: n= 8) in the short-term experiment. RNA extraction from 100 µL whole-blood samples was performed using the same methods mentioned in the “Total RNA-seq” section. Subsequently, the TB Green qPCR assay for assessing whether the identified genes were indirect proof was performed using the same method described in the “TB Green qPCR assay for tissue RNAs” section. The primer sequences used in this section are shown in
Supplementary Table S1. In addition, to investigate the period for which the identified indirect proof could be positively detected, the same qPCR assay was also performed using 50 µL whole-blood samples (n = 11) from the long-term experiment. Subsequently, the expression values of each targeted gene were normalized by
B2m (
Beta 2-microglobulin) gene expression [
8].
2.14. Statistical Analysis
All data except the total RNA-seq data were statistically analyzed using GraphPad Prism version 10.2.0 (GraphPad, San Diego, CA, USA). All experimental data were first evaluated with the Shapiro–Wilk normality test to check the normality of the distributions. Subsequently, nonparametric tests were used for all data. Comparisons of three or more groups were performed with Kruskal–Wallis H tests (one-way ANOVA of ranks) followed by a two-stage Benjamini, Krieger, and Yekutieli FDR procedure as a post hoc test. A p-value less than 0.05 was considered to indicate statistical significance. All graphs without data from the bioinformatics analysis of the total RNA-seq are shown as individual plots and medians with interquartile ranges [
8].
4. Discussion
The first objective of this study was to create a mouse model that mimics gene doping with confirmed hematopoietic effects using rAAV9 carrying the h
EPO gene. rAAV9, when injected into a mouse vein, accumulates in the liver and induces long-term expression of the target gene [
26]. It has also been confirmed that the period of continuous expression is more than 9 months [
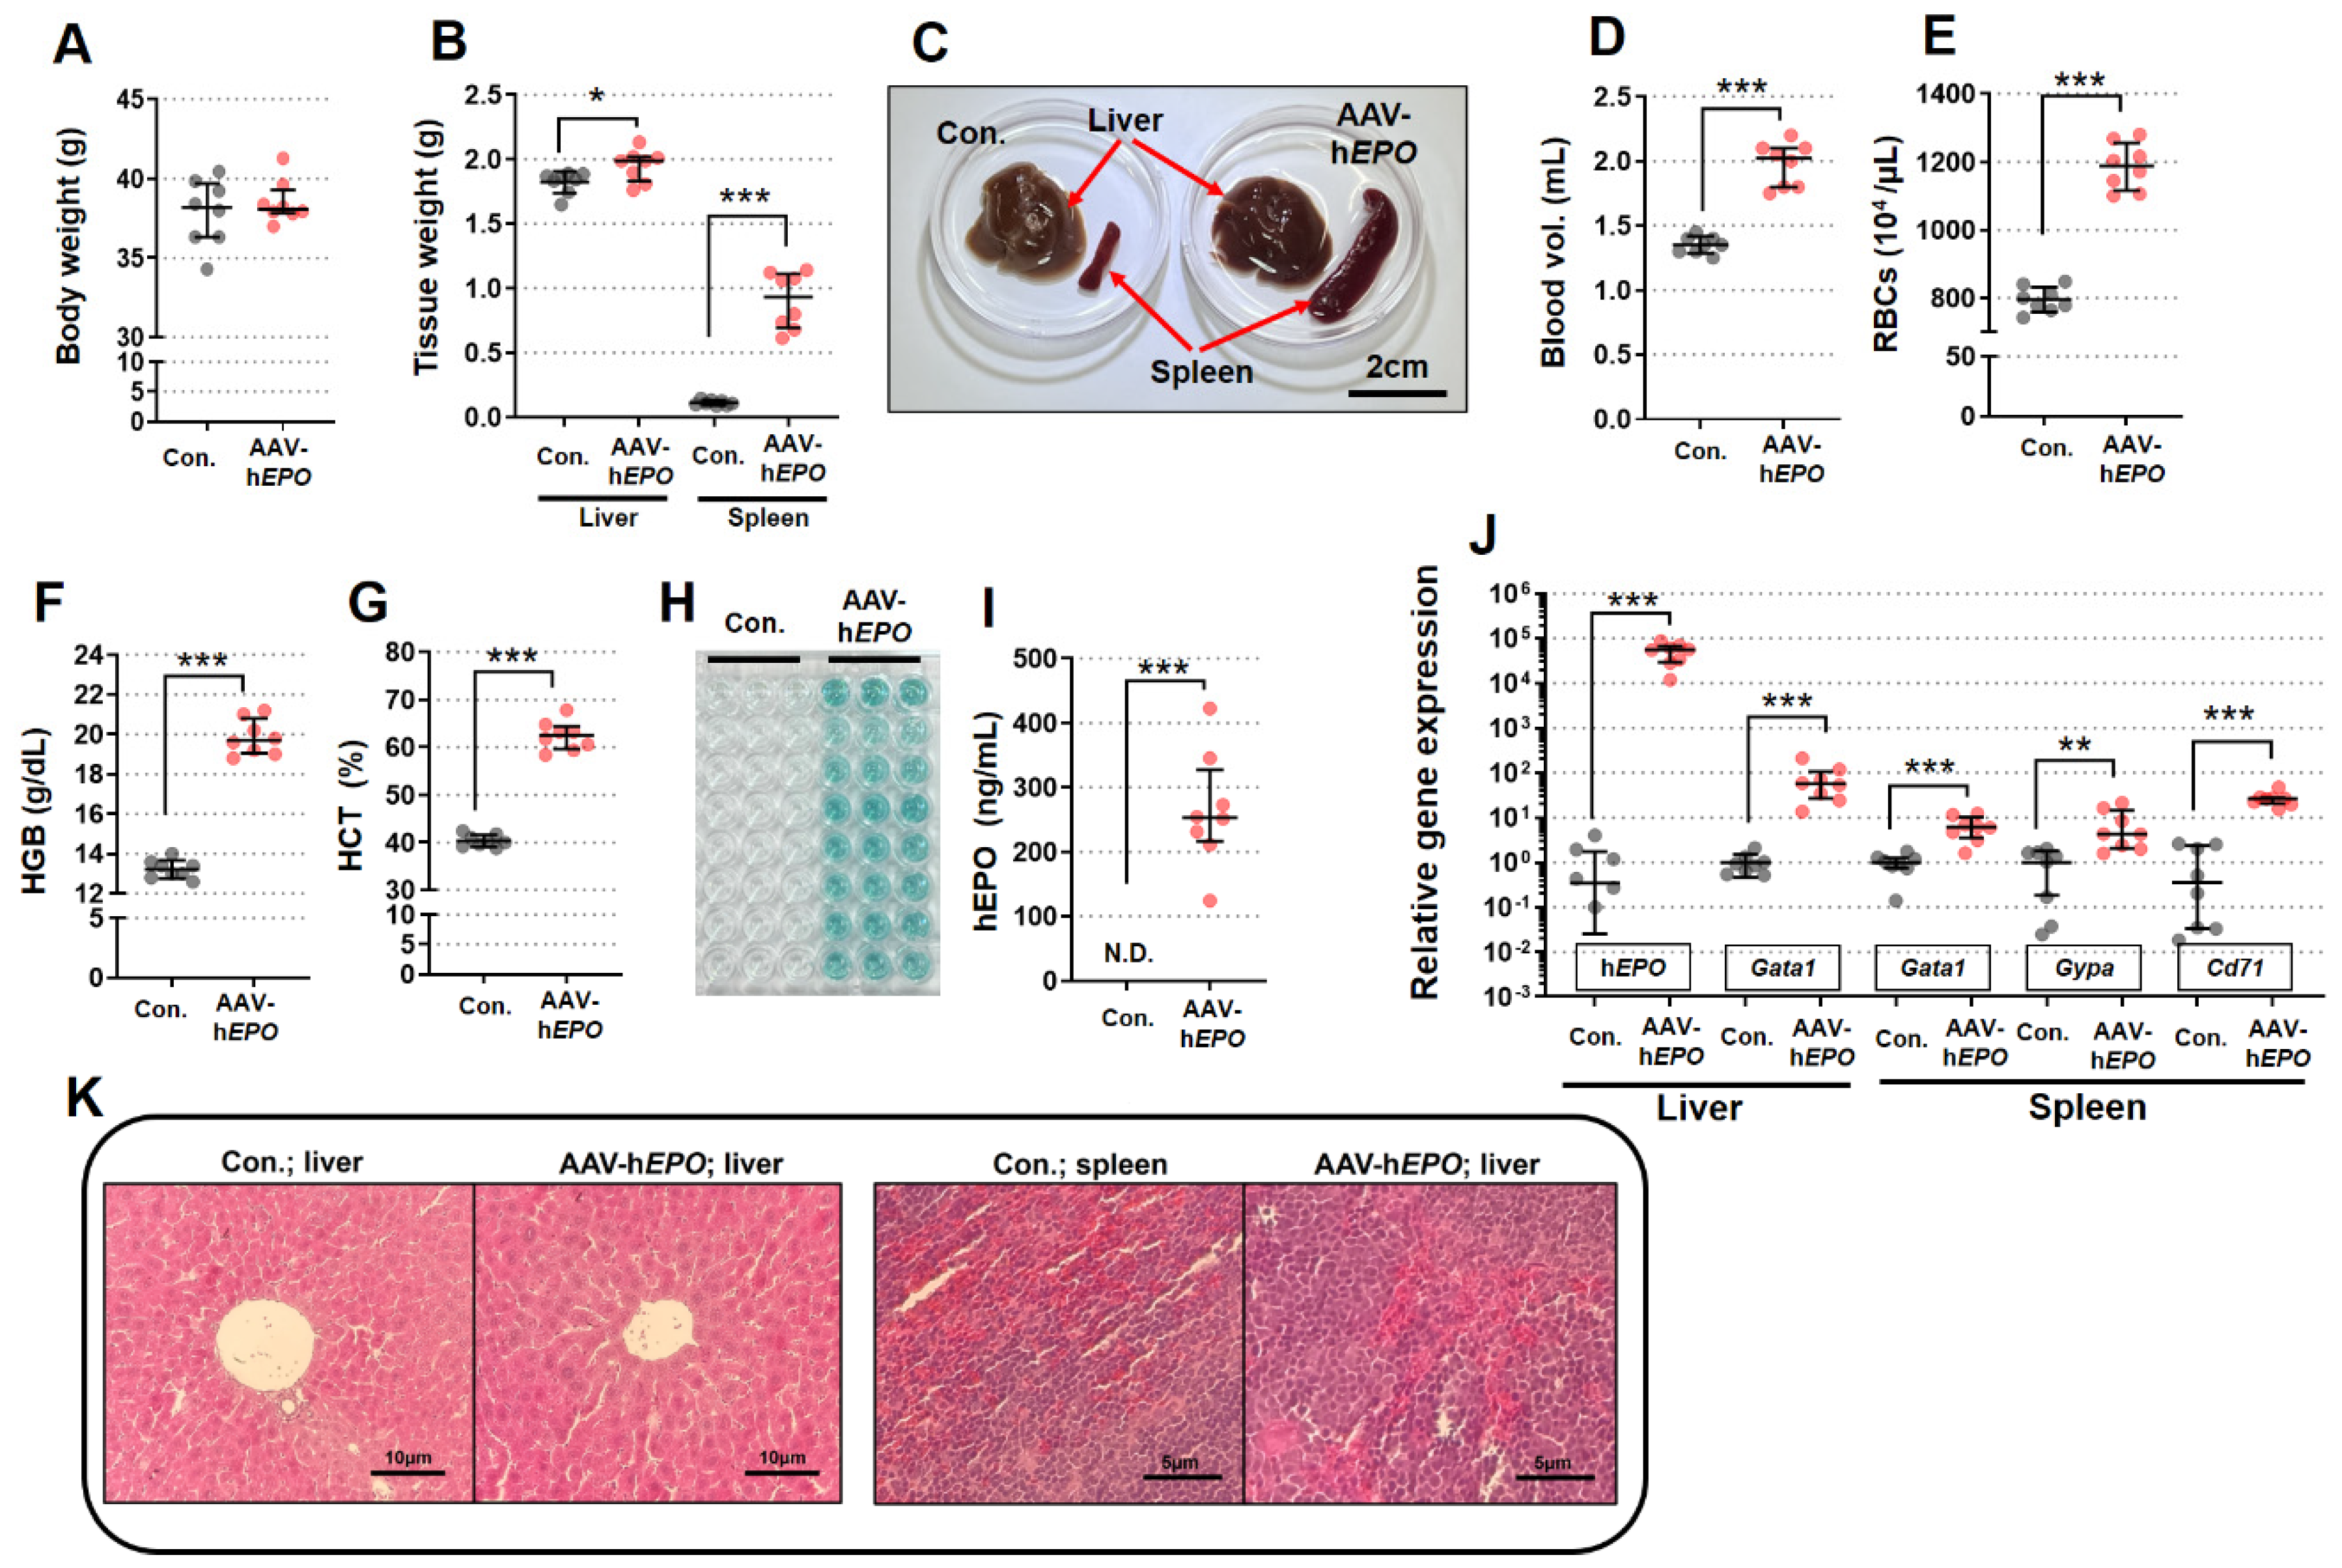
26]. Therefore, in this study, it can be assumed that the injected rAAV9 reached the mice liver and induced h
EPO gene expression in the hepatocytes over a long-term period. In support of this speculation, gene expression of h
EPO was detected in the liver. The h
EPO gene contains a secreted signal peptide, so the translated protein is also expected to circulate throughout the whole body as a hormone via blood. In fact, an ELISA confirmed the presence of human erythropoietin in the AAV-h
EPO group, confirming that it circulates throughout the body. In addition, the main hematopoietic organ in adult mice is the spleen [
27]. In this animal experiment, the spleen of mice was enlarged, and the expression of hematopoietic marker genes was significantly increased. Moreover, RBCs, HGB, HCT, and blood volume, which directly reflect hematopoietic effects, were also significantly increased in the AAV-h
EPO group. Taken together, these results suggest that the rAAV9-h
EPO vector induces the expression of h
EPO in the liver after intravenous injection, and that hEPO hormone reaches the spleen through the bloodstream, thereby upregulating hematopoiesis. Therefore, the first objective in this study has been achieved, meaning that the establishment of a biological model of gene doping using AAV and h
EPO genes has been accomplished for the first time. In previous studies on gene doping tests targeting h
EPO, detection methods were developed by artificially mixing plasmids with blood as a spike-in test [
28,
29,
30,
31]. On the other hand, our model, however, uses an actual living organism and can consider the metabolic state of the vector, so it has the potential to be developed into a more practical model. Therefore, in the future, we plan to provide various technical support so that any researchers around the world can use our models with good reproducibility.
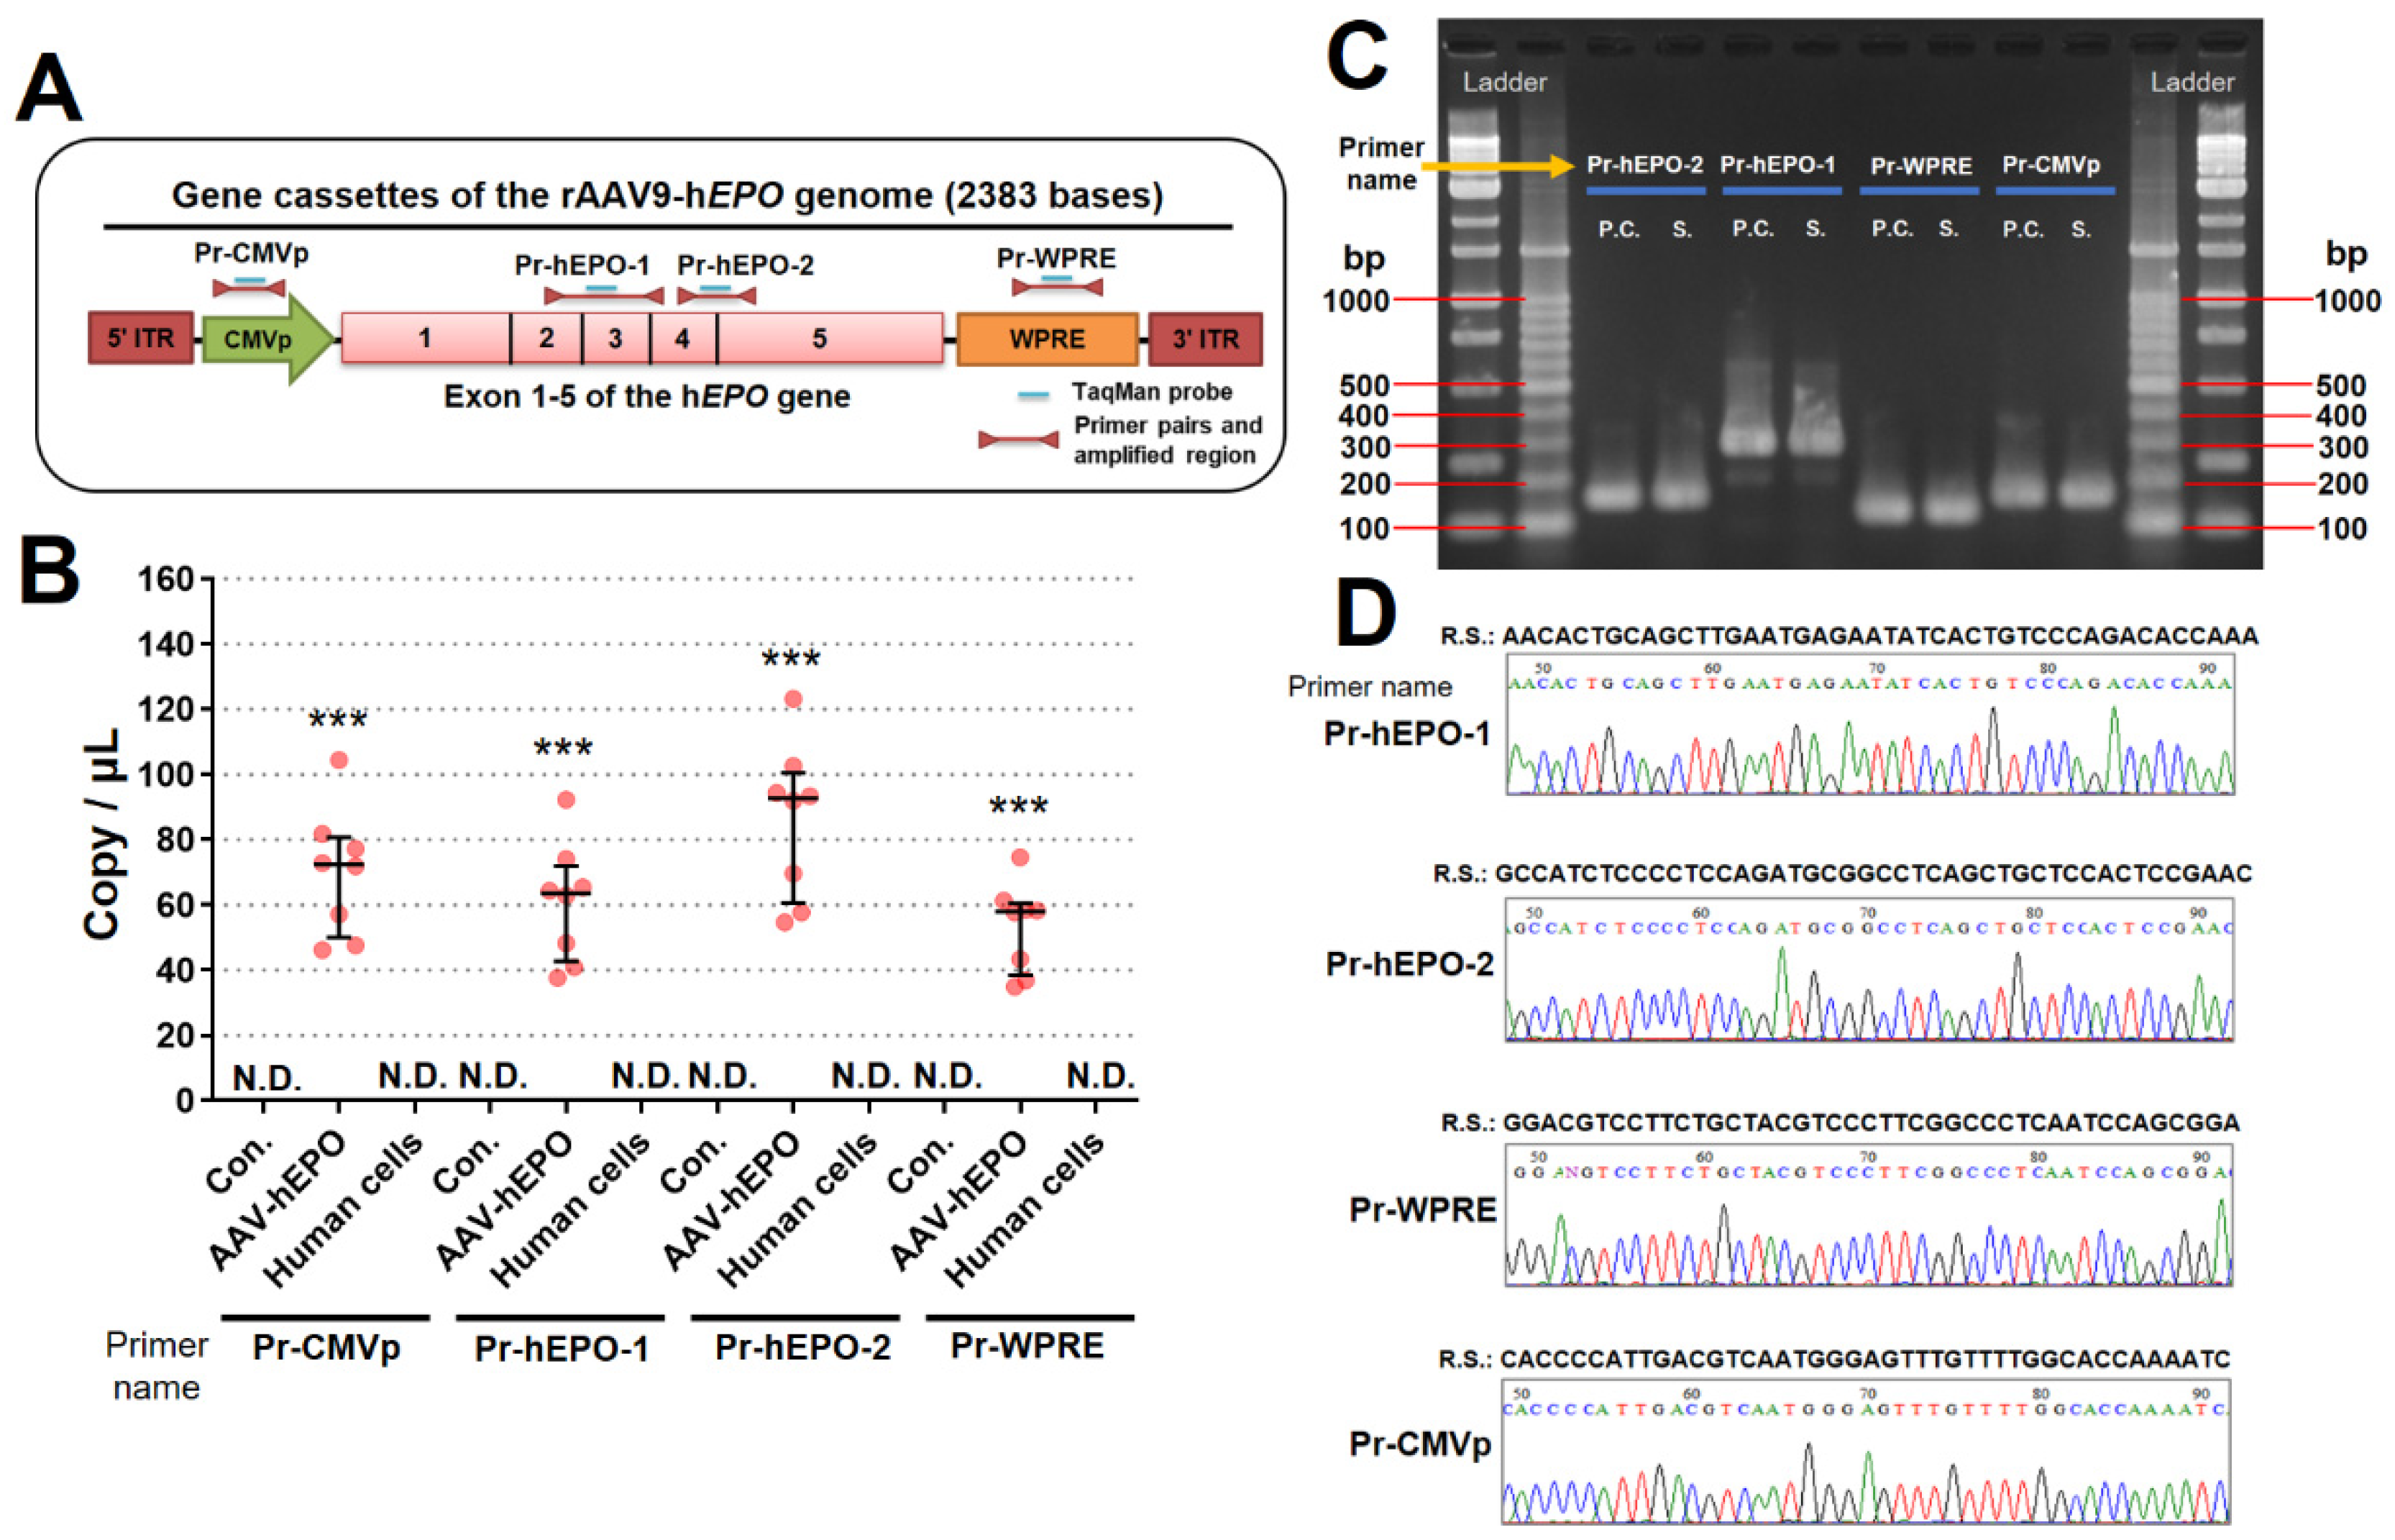
In this study, four specific primer/probes were generated to target DNA sequences in rAAV9-h
EPO as direct proof of gene doping. For the h
EPO gene, we designed the probe to span the exon–exon junction, in accordance with WADA guidelines [
21]. Although the WADA guidelines do not mention the use of multiple primers/probes, the use of this method may increase the scientific validity and accuracy of the test. In addition, the use of multiple primers/probes would allow for an estimation of the type of vector used. However, in this study, one qPCR assay was performed on one target. In the future, it would be desirable to establish a multiplex assay and develop a kit with a panel comprising each vector and gene. This would reduce the test time and cost. In addition, the four primer probes used in this study detected positive reactions only in mice induced with the rAAV9-h
EPO vector, with no nonspecific amplification from human DNAs or an NTC (non-template control). An analysis of the standard curve showed that the detection limit was approximately 1 copy/ul, indicating the high detection sensitivity of these primers/probes. Therefore, in the future, it may be possible for these four primers/probes to be directly used for testing of gene doping testing using blood DNA samples from athletes.
Based on the ABP concept proposed by WADA [
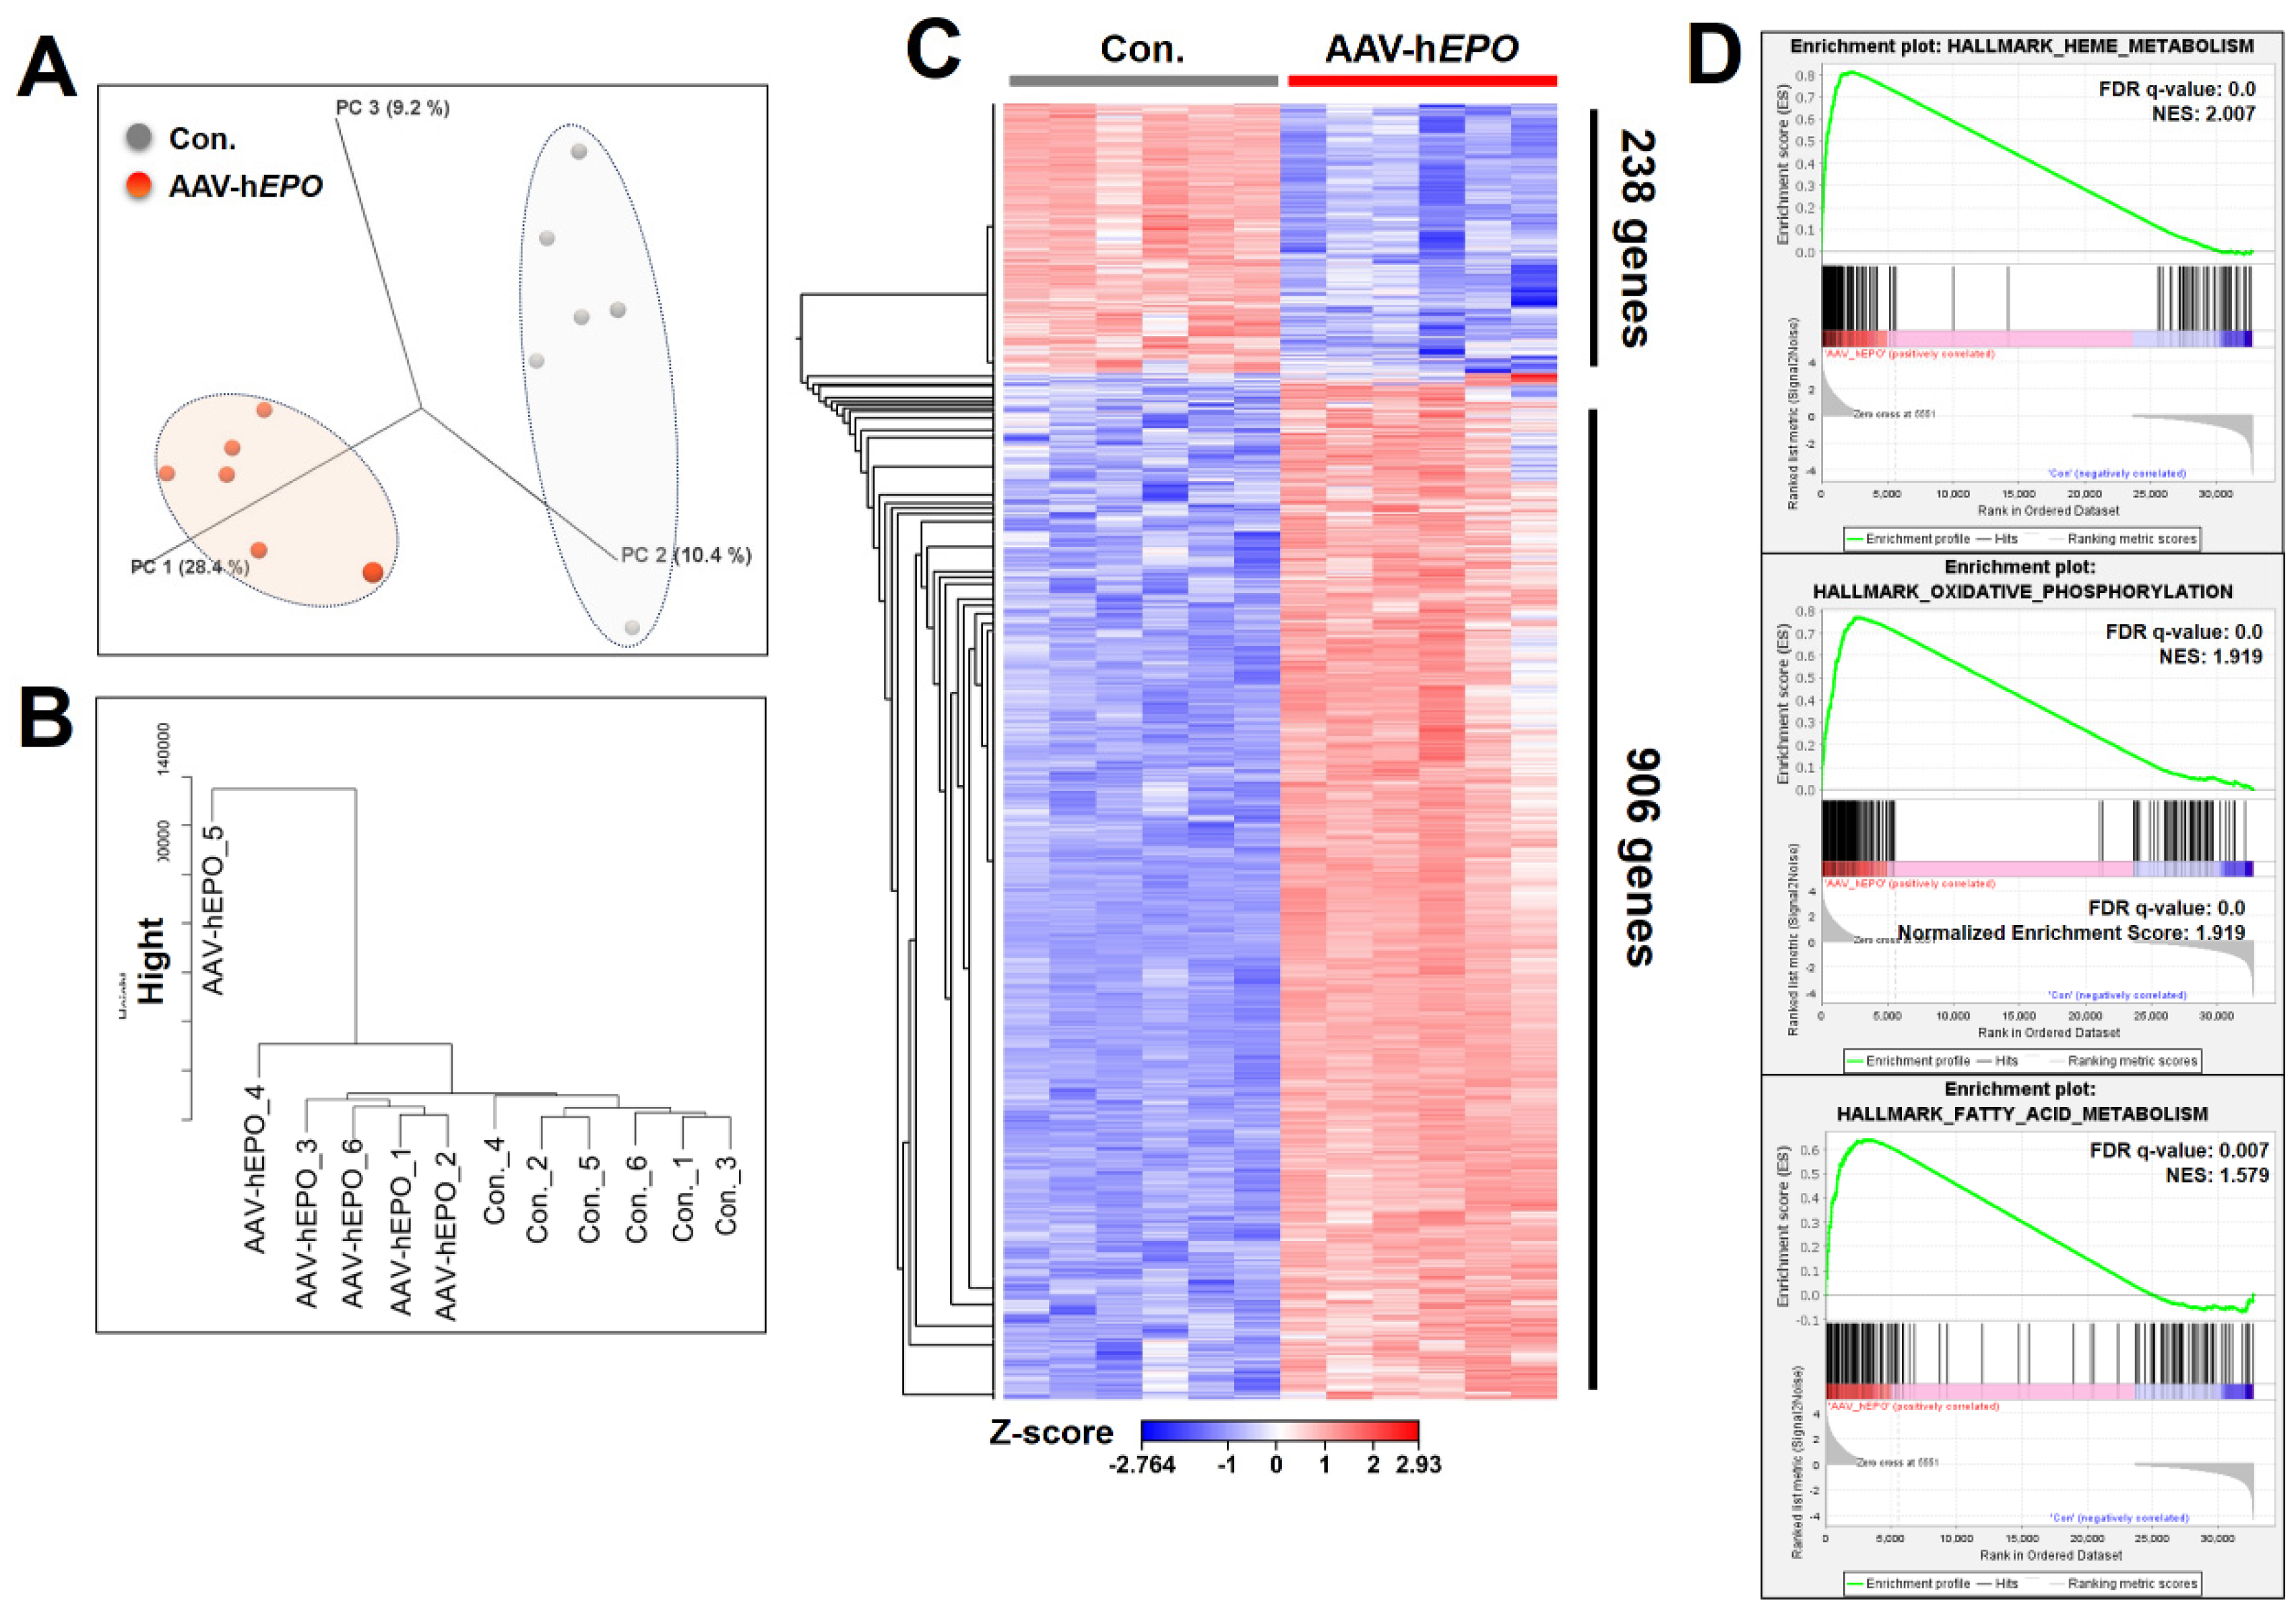
9], we hypothesized and tested the hypothesis that RNA (gene expression) in whole blood may be targeted as a new ABP marker. As a result, in the total RNA-seq, we found that mice induced with the rAAV9-h
EPO vector showed significant changes in the expression of many RNAs in whole blood, and heme metabolism, oxidative phosphorylation, and fatty acid metabolism were significantly hit in terms of their biological significance, and pathways in terms of their gene sets. Further bioinformatics analysis identified three dramatically upregulated RNAs (genes), which remained highly expressed after 30 days. These results suggest that pathway analysis using a specific set of genes or analysis for single RNA markers can be very useful as a measure of ABP. However, the total RNA-seq performed in this study is expensive in terms of reagents and analysis costs, and the equipment required is also expensive. Although the application of RNA-seq technology to ABP testing is promising, the cost and difficulty of the technology may be prohibitive. Therefore, cost reductions and technological innovations are eagerly awaited.
If this were translated to humans, it would be possible to detect genetic doping with only a trace amount of blood (one drop of blood) drawn from a fingertip after a competition. If the amount of specimen is only one drop, the development of small testing devices may also enable rapid testing for genetic doping in the field. The closest social implementation would be a PCR test for Severe Acute Respiratory Syndrome Coronavirus 2 (SARS-CoV-2) infection, also known as the COVID-19 pandemic, which has raged in recent years. With the current proliferation of various simplified test reagents and small qPCR devices, rapid PCR testing has been implemented in the field around the world. These technologies are probably very compatible with on-site rapid tests for genetic doping. Therefore, a future may not be far off in which primary on-site screening for genetic doping will be available for many athletes.
It is important to mention there are several limitations in this study. Although this study was the first in the world to establish a mouse model of gene doping using the rAAV9 vector including the h
EPO gene, and the first to develop a detection method, it is only a mouse model and cannot yet be said to be applicable to actual human athletes. In future studies, the most accurate findings could be obtained by using blood samples from actual gene-doped athletes, but this is not possible due to legal or ethical aspects. As an alternative, it would be most reasonable to validate the results of this study using surplus blood samples from patients undergoing gene therapy with rAAV. As indicated in the database, many clinical trials using rAAV are being conducted around the world [
19]. In addition, several Food and Drug Administration (FDA)-approved rAAV therapies [
32,
33,
34,
35] have become widely available in recent times. Research and development to prevent gene doping would require collaboration with patients receiving rAAV medications and their health care providers, as well as clinical trials. In doing so, the findings of this study would be helpful in creating safe experimental protocols and setting conditions for detection methods.
Author Contributions
Conceptualization, T.S.; methodology, T.S., Y.T. (Y. Takeuchi), and Y.K.; validation, T.S. and A.H.; formal analysis, T.S. and A.H.; investigation, T.S., N.O., and A.H.; writing—original draft preparation, T.S., N.O., K.N., and A.H.; writing—review and editing, T.S., A.H., N.O., Y.K., K.N., T.T., K.W., Y.T. (Y. Takeuchi), N.Y., and Y.T. (Y. Takahashi); visualization, T.S. and A.H.; supervision, T.S. and Y.T. (Y. Takahashi); project administration, T.S.; funding acquisition, T.S. and K.W. All authors have read and agreed to the published version of the manuscript.

