Submitted:
02 May 2024
Posted:
03 May 2024
You are already at the latest version
Abstract
Keywords:
1. Introduction
2. Theoretical Background
2.1. Scientific Models of Microgrid Technologies
2.2. Scientific Methods for Microgrid Deployment
2.2.1. Clustering Techniques
2.2.1.1. k-means Clustering Model
2.2.1.2. Elbow Method
2.2.2 Haversine Method
2.2.3. Open-Source Spatial Planning for Electrification Method: Onsset
2.3. Bibliographical Reviews
3. Materials and Method
3.1. Materials
3.2. Method
3.2.1. Microgrid System Model
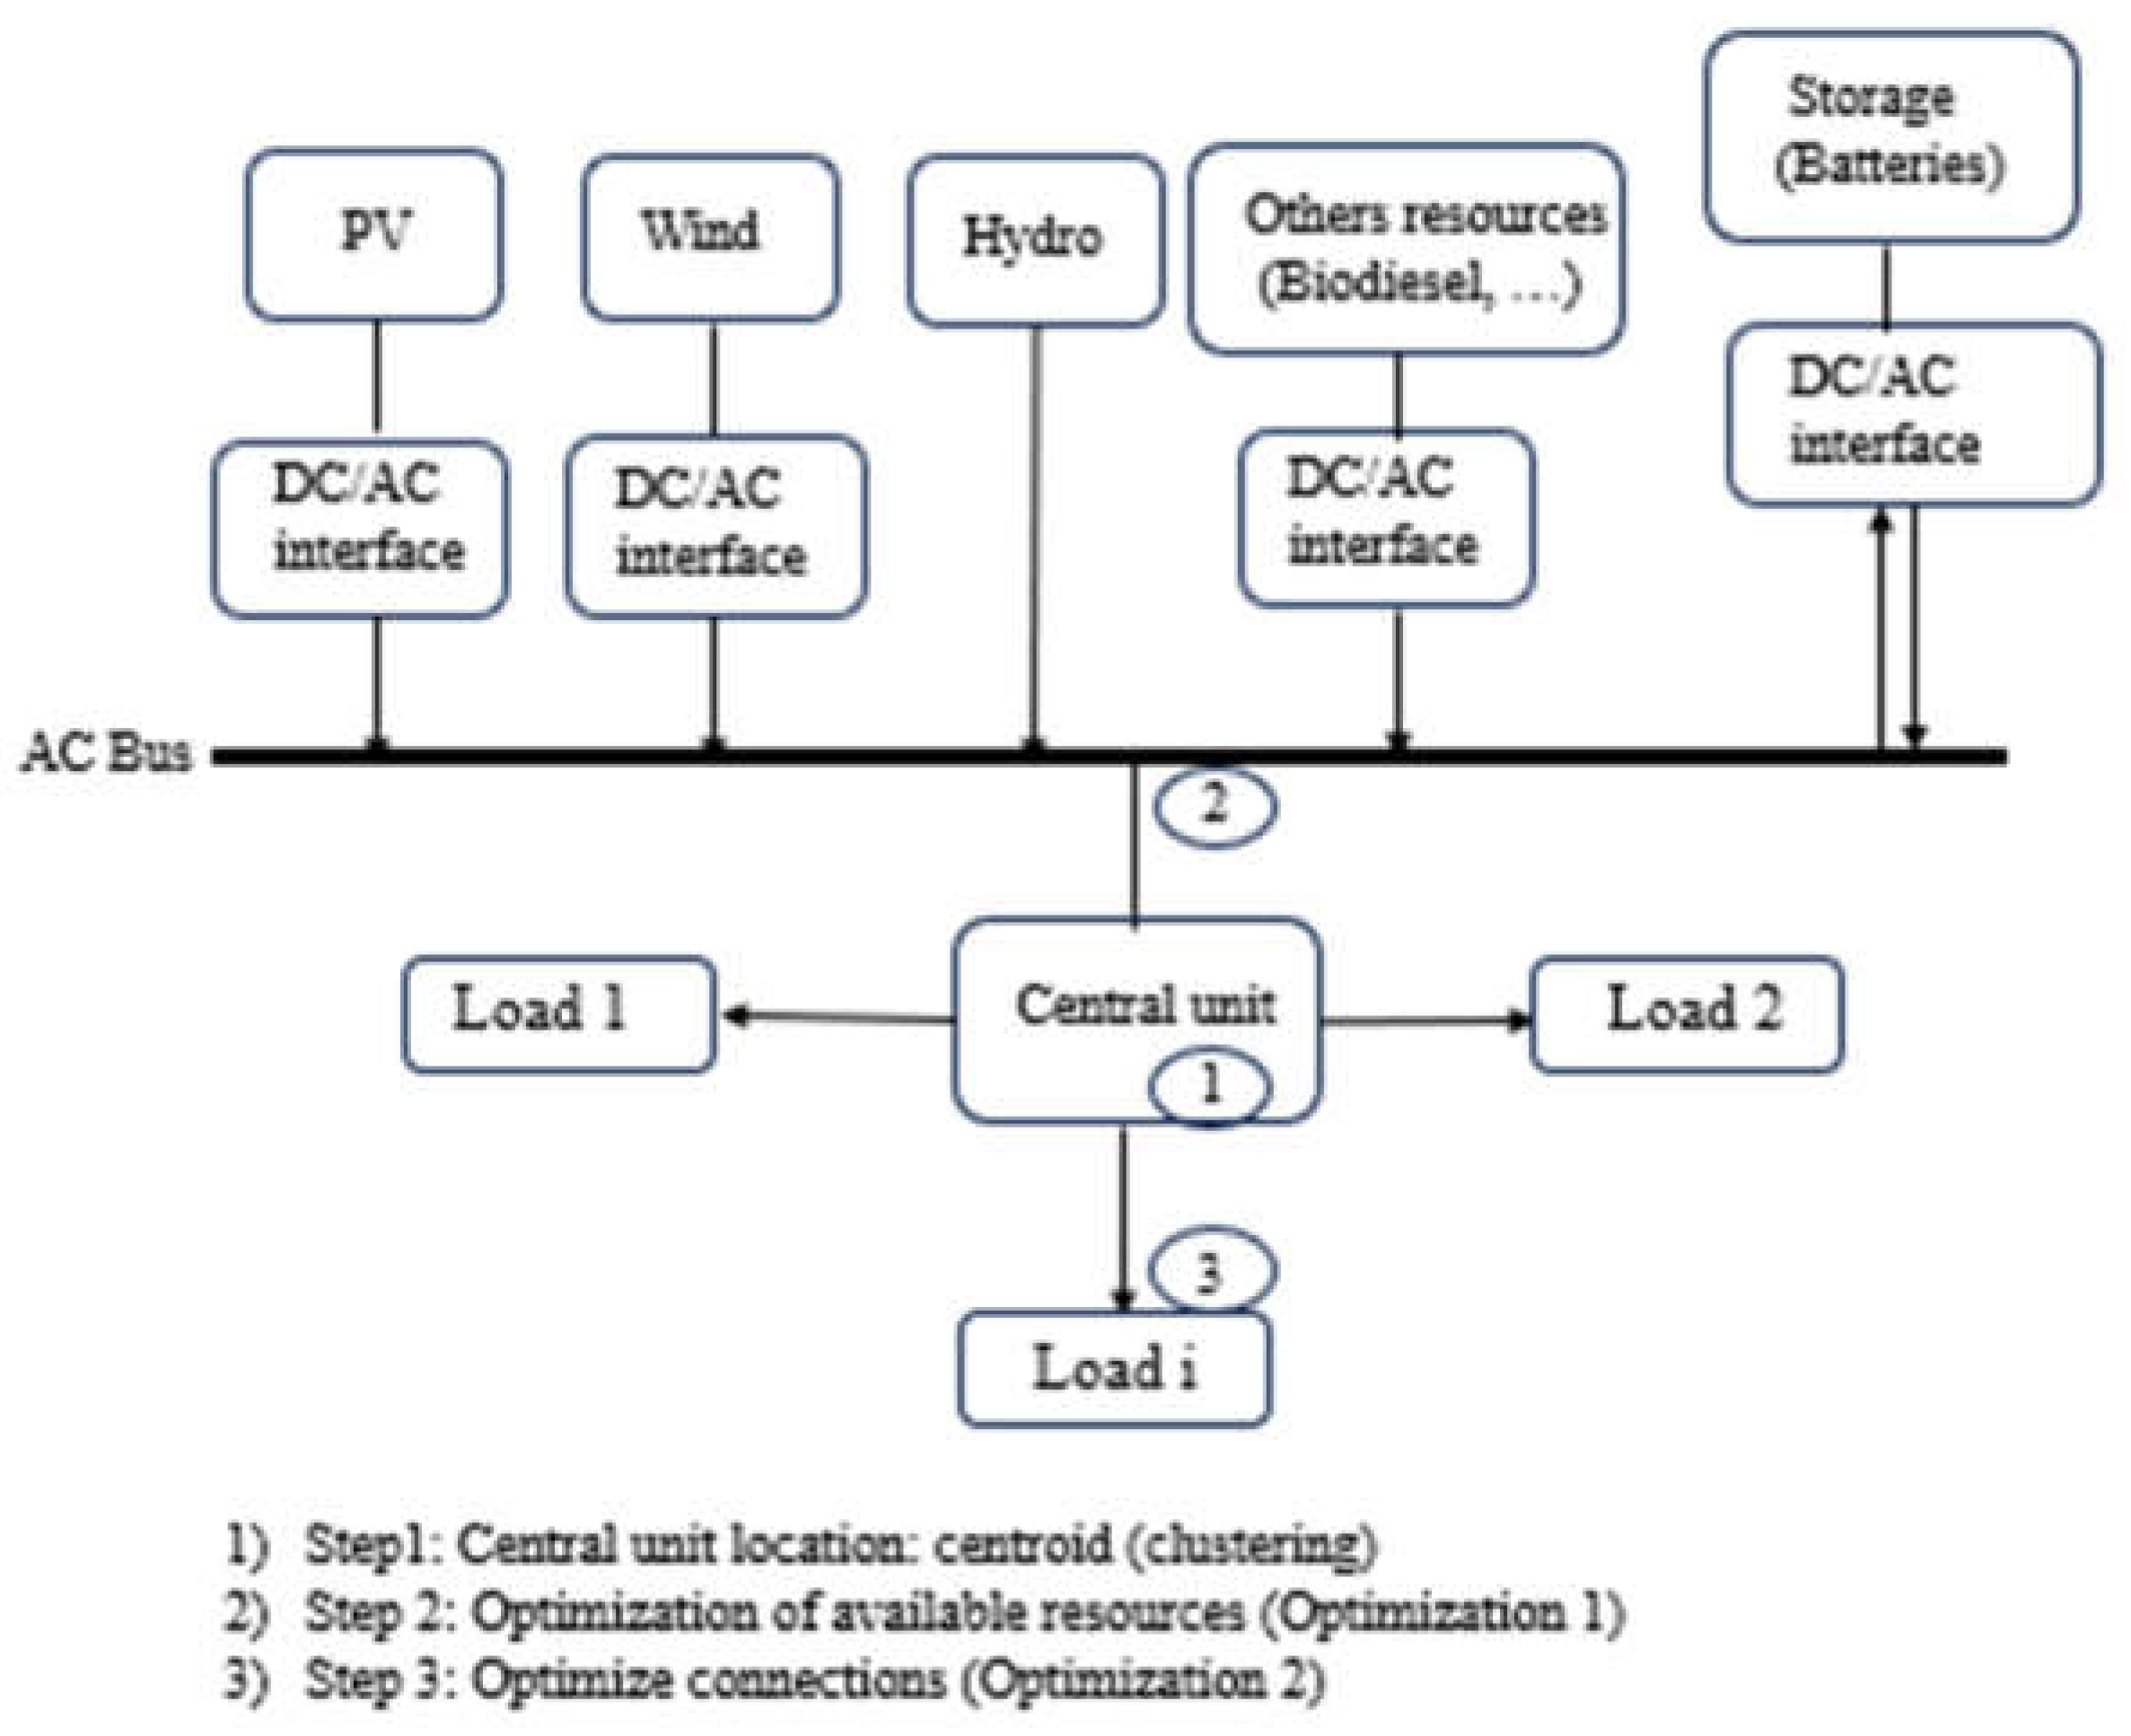
3.2.2. Optimization Problem Formulation
- Enter data for each vector
- Initialize the position of the centers:
-
Calculate mk averages of vectors in cluster k
- -
- Until there are no more changes in the mk
- -
- Do Each Vi point is assigned to the nearest cluster
- -
- Calculate new mk
- -
- End As long as
3.2.3. Data
| Months | Solar radiation (W/m2) | Temperature (degree) | Humidity relative (%) | Wind speed (m/s) | ||||||||||||
| Min | Max | Min | Max | Min | Max | Min | Max | |||||||||
| J | 85.46 | 115.71 | 99.01 | 5.87 | 26.12 | 28.41 | 27.59 | 0.59 | 60.56 | 85.62 | 75.25 | 6.92 | 2.04 | 4.45 | 3.27 | 0.68 |
| F | 85.98 | 113.63 | 103.63 | 6.95 | 27.58 | 28.57 | 28.05 | 0.23 | 69.75 | 85.19 | 80.92 | 2.97 | 2.21 | 5.17 | 3.94 | 0.76 |
| M | 84.98 | 122.43 | 108.85 | 9.69 | 27.83 | 28.96 | 28.38 | 0.23 | 78.44 | 86.31 | 81.99 | 1.89 | 3.99 | 6.11 | 4.78 | 0.57 |
| A | 109.64 | 137.14 | 127.32 | 7.0 | 26.95 | 28.38 | 27.67 | 0.46 | 78.31 | 88.31 | 83.72 | 2.35 | 1.86 | 5.49 | 3.7 | 0.91 |
| M | 108.89 | 132.91 | 126.36 | 4.72 | 26.49 | 28.11 | 27.41 | 0.41 | 76.19 | 88.62 | 85.21 | 2.59 | 1.91 | 4.47 | 3.41 | 0.56 |
| J | 112.42 | 128.5 | 121.95 | 3.63 | 25.09 | 27.42 | 26.25 | 0.73 | 79.0 | 92.88 | 87.34 | 3.28 | 1.9 | 5.6 | 3.69 | 0.85 |
| J | 117.48 | 129.11 | 123.56 | 2.93 | 24.44 | 25.9 | 25.10 | 0.36 | 82.19 | 90.81 | 87.35 | 2.33 | 3.42 | 6.55 | 5.06 | 0.66 |
| A | 117.97 | 134.07 | 127.02 | 3.74 | 23.64 | 25.35 | 24.34 | 0.46 | 82.62 | 92.31 | 87.89 | 2.0 | 2.4 | 7.82 | 5.29 | 1.36 |
| S | 125.77 | 140.23 | 134.24 | 3.19 | 24.95 | 25.87 | 25.45 | 0.24 | 82.88 | 91.5 | 87.28 | 2.18 | 3.26 | 6.55 | 4.85 | 0.88 |
| O | 113.06 | 133.61 | 125.49 | 4.72 | 25.17 | 27.4 | 26.32 | 0.63 | 84.62 | 90.69 | 87.60 | 1.55 | 2.16 | 5.55 | 3.19 | 0.89 |
| N | 106.05 | 122.58 | 114.64 | 4.22 | 26.64 | 27.83 | 27.24 | 0.3 | 79.44 | 87.0 | 83.24 | 1.78 | 1.65 | 4.77 | 3.03 | 0.71 |
| D | 90.72 | 111.33 | 103.36 | 4.46 | 25.9 | 27.8 | 27.01 | 0.35 | 61.62 | 86.62 | 78.24 | 6.64 | 1.62 | 4.3 | 2.94 | 0.61 |
4. Results and Discussions
4.1. Optimization Results
4.1.1. Results on Cluster Formation
4.1.2. Renewable Energy Resources Availability Results
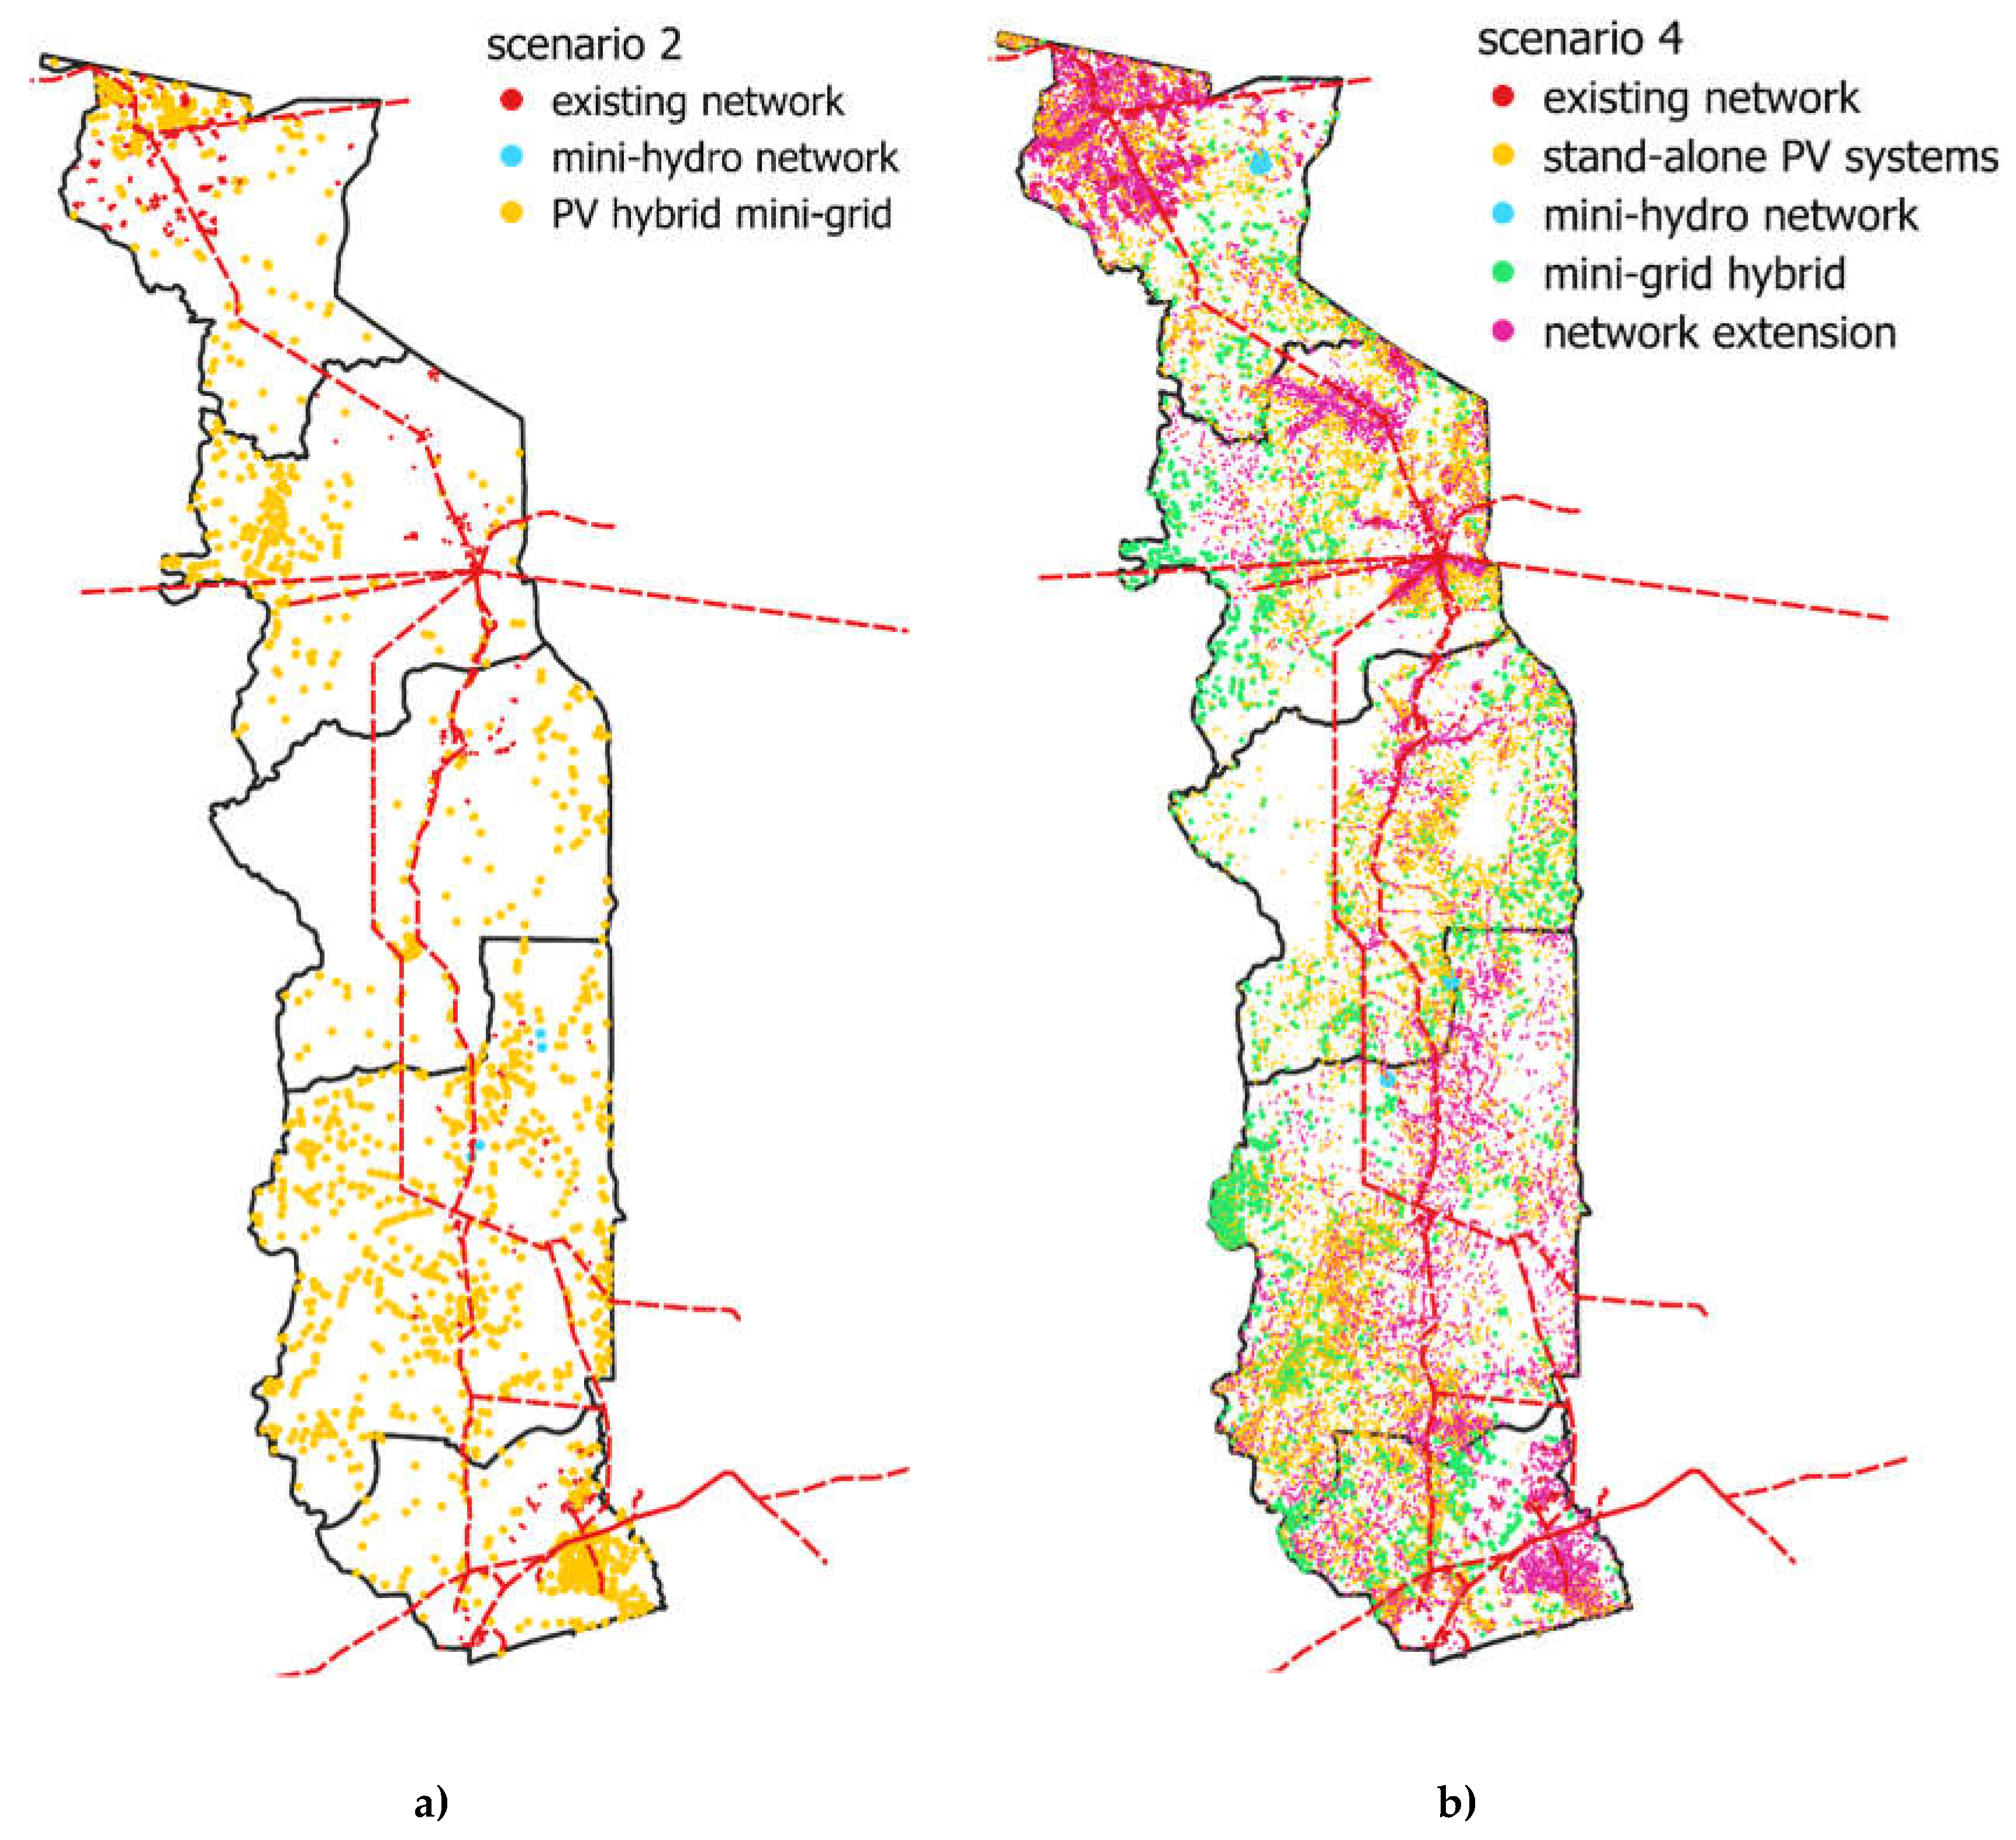
4.1.3. Optimization Results for Technology Selection
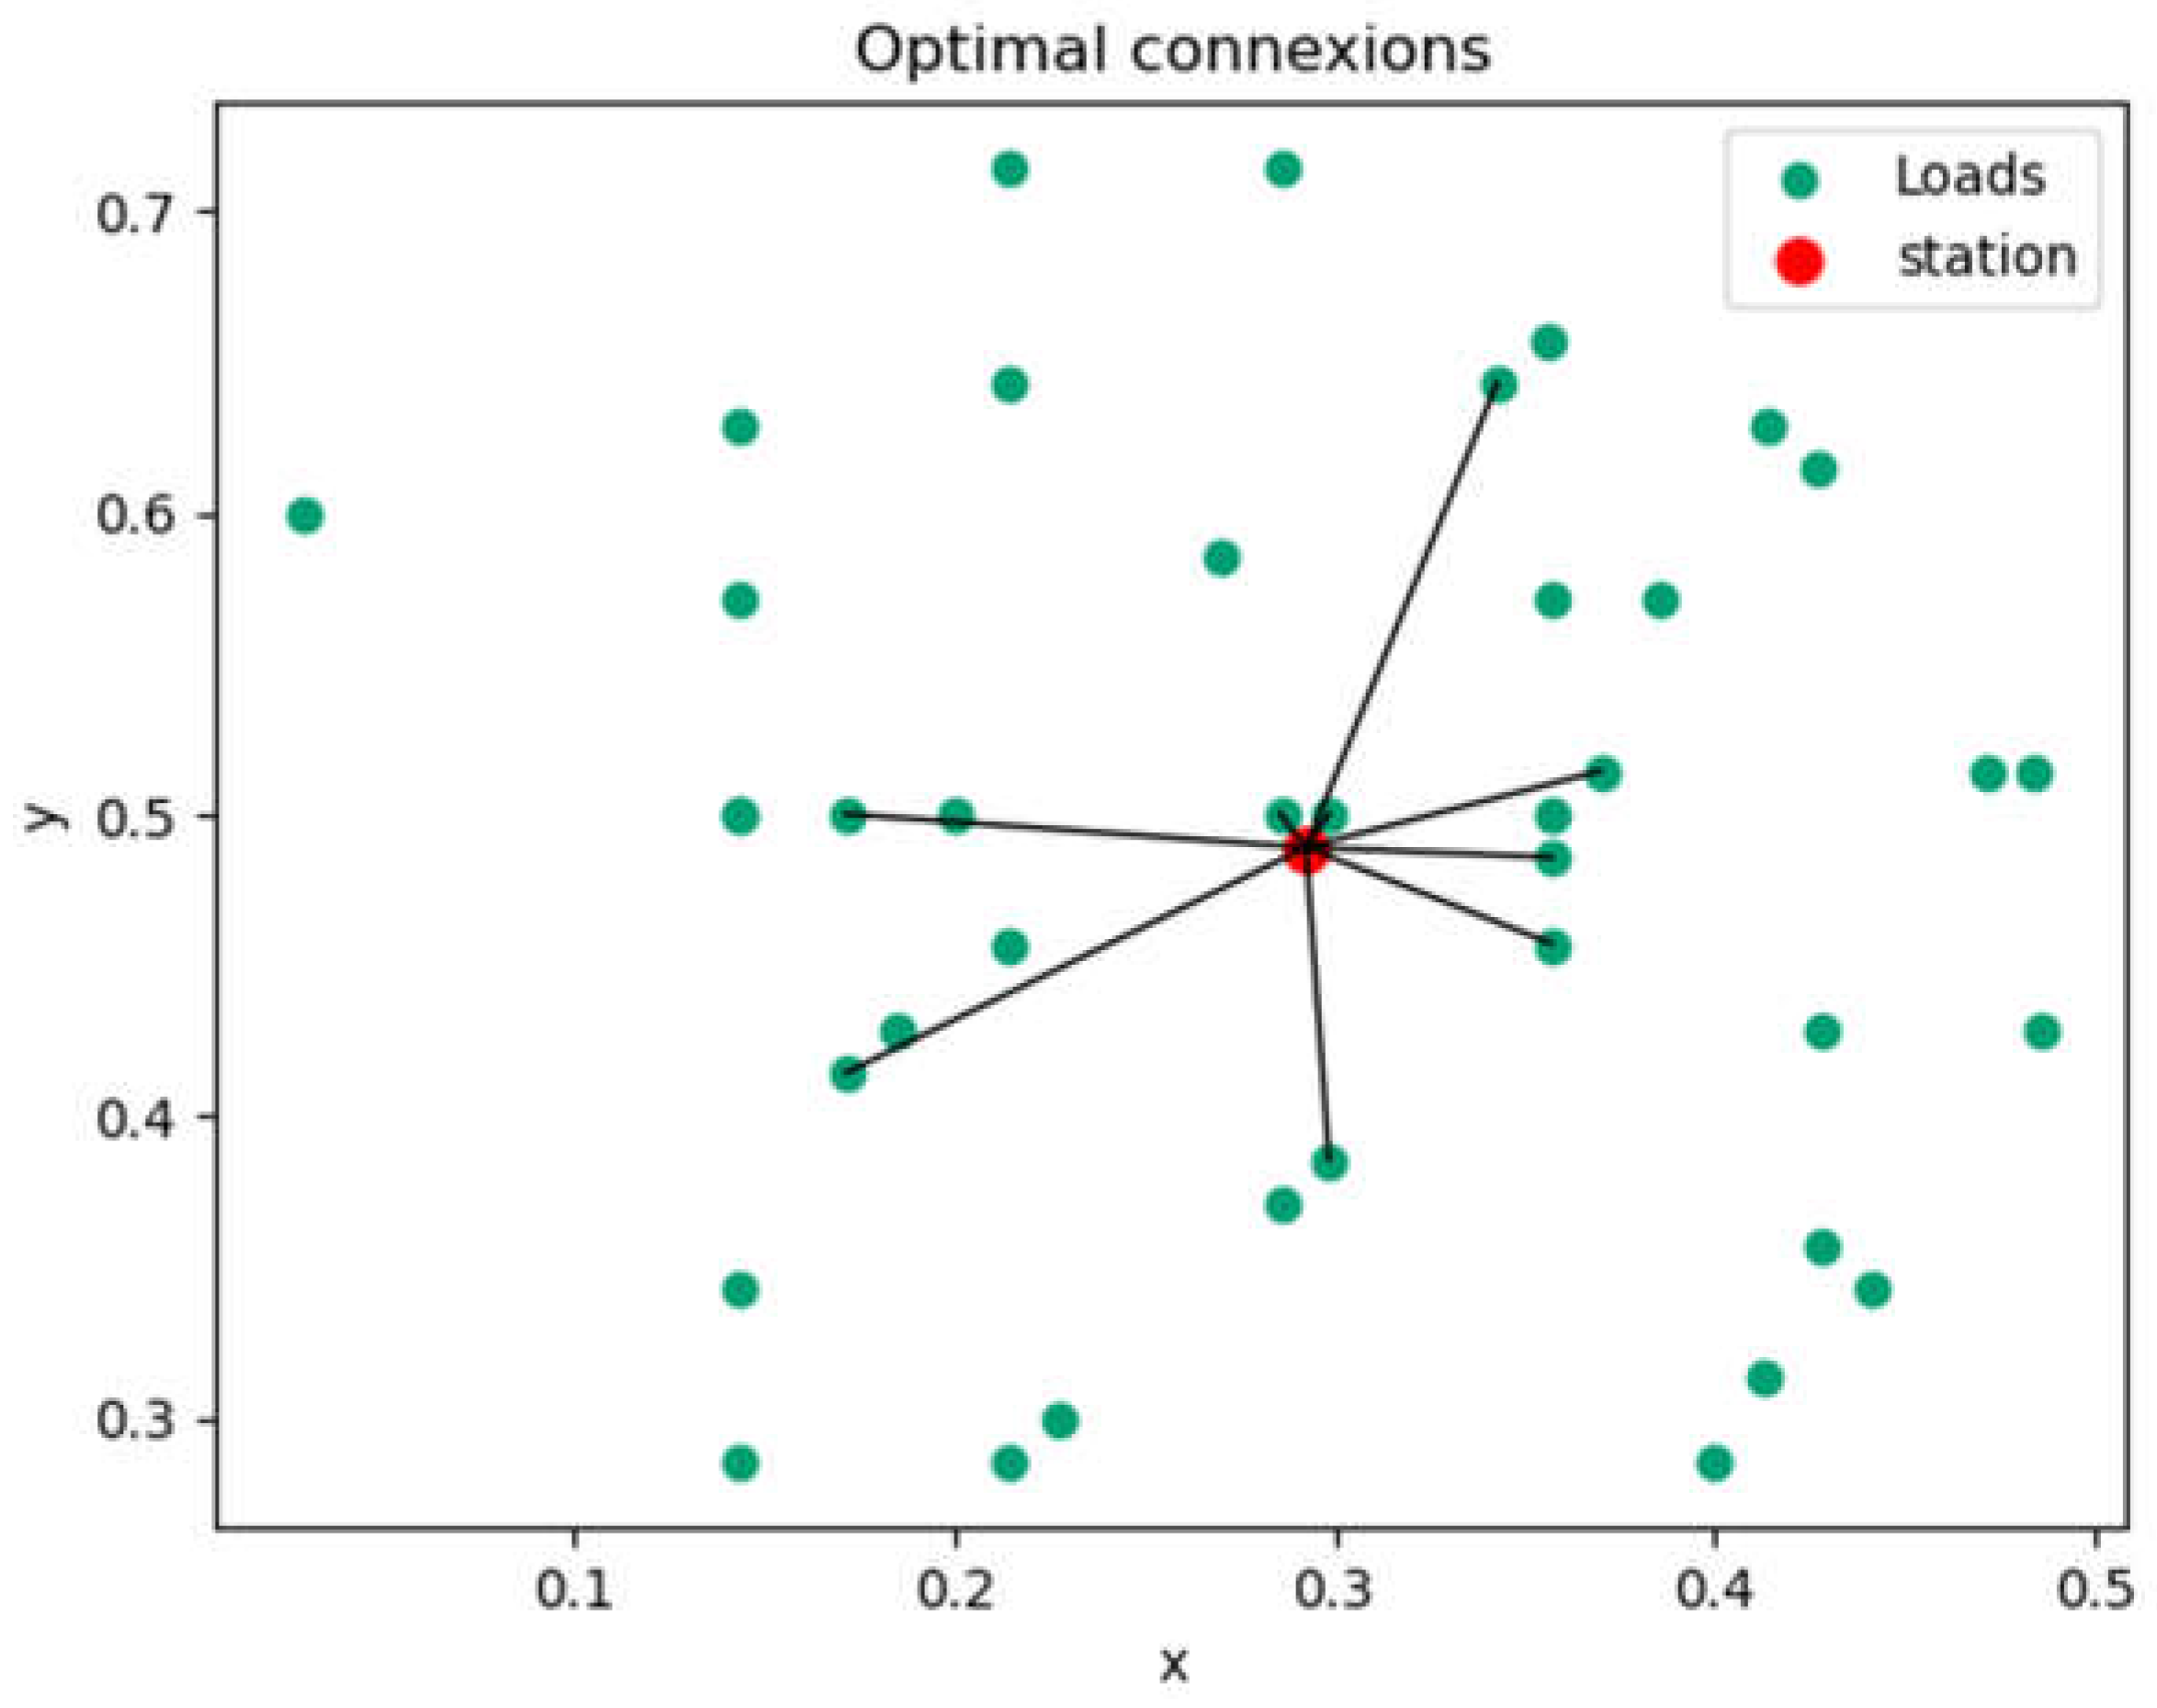
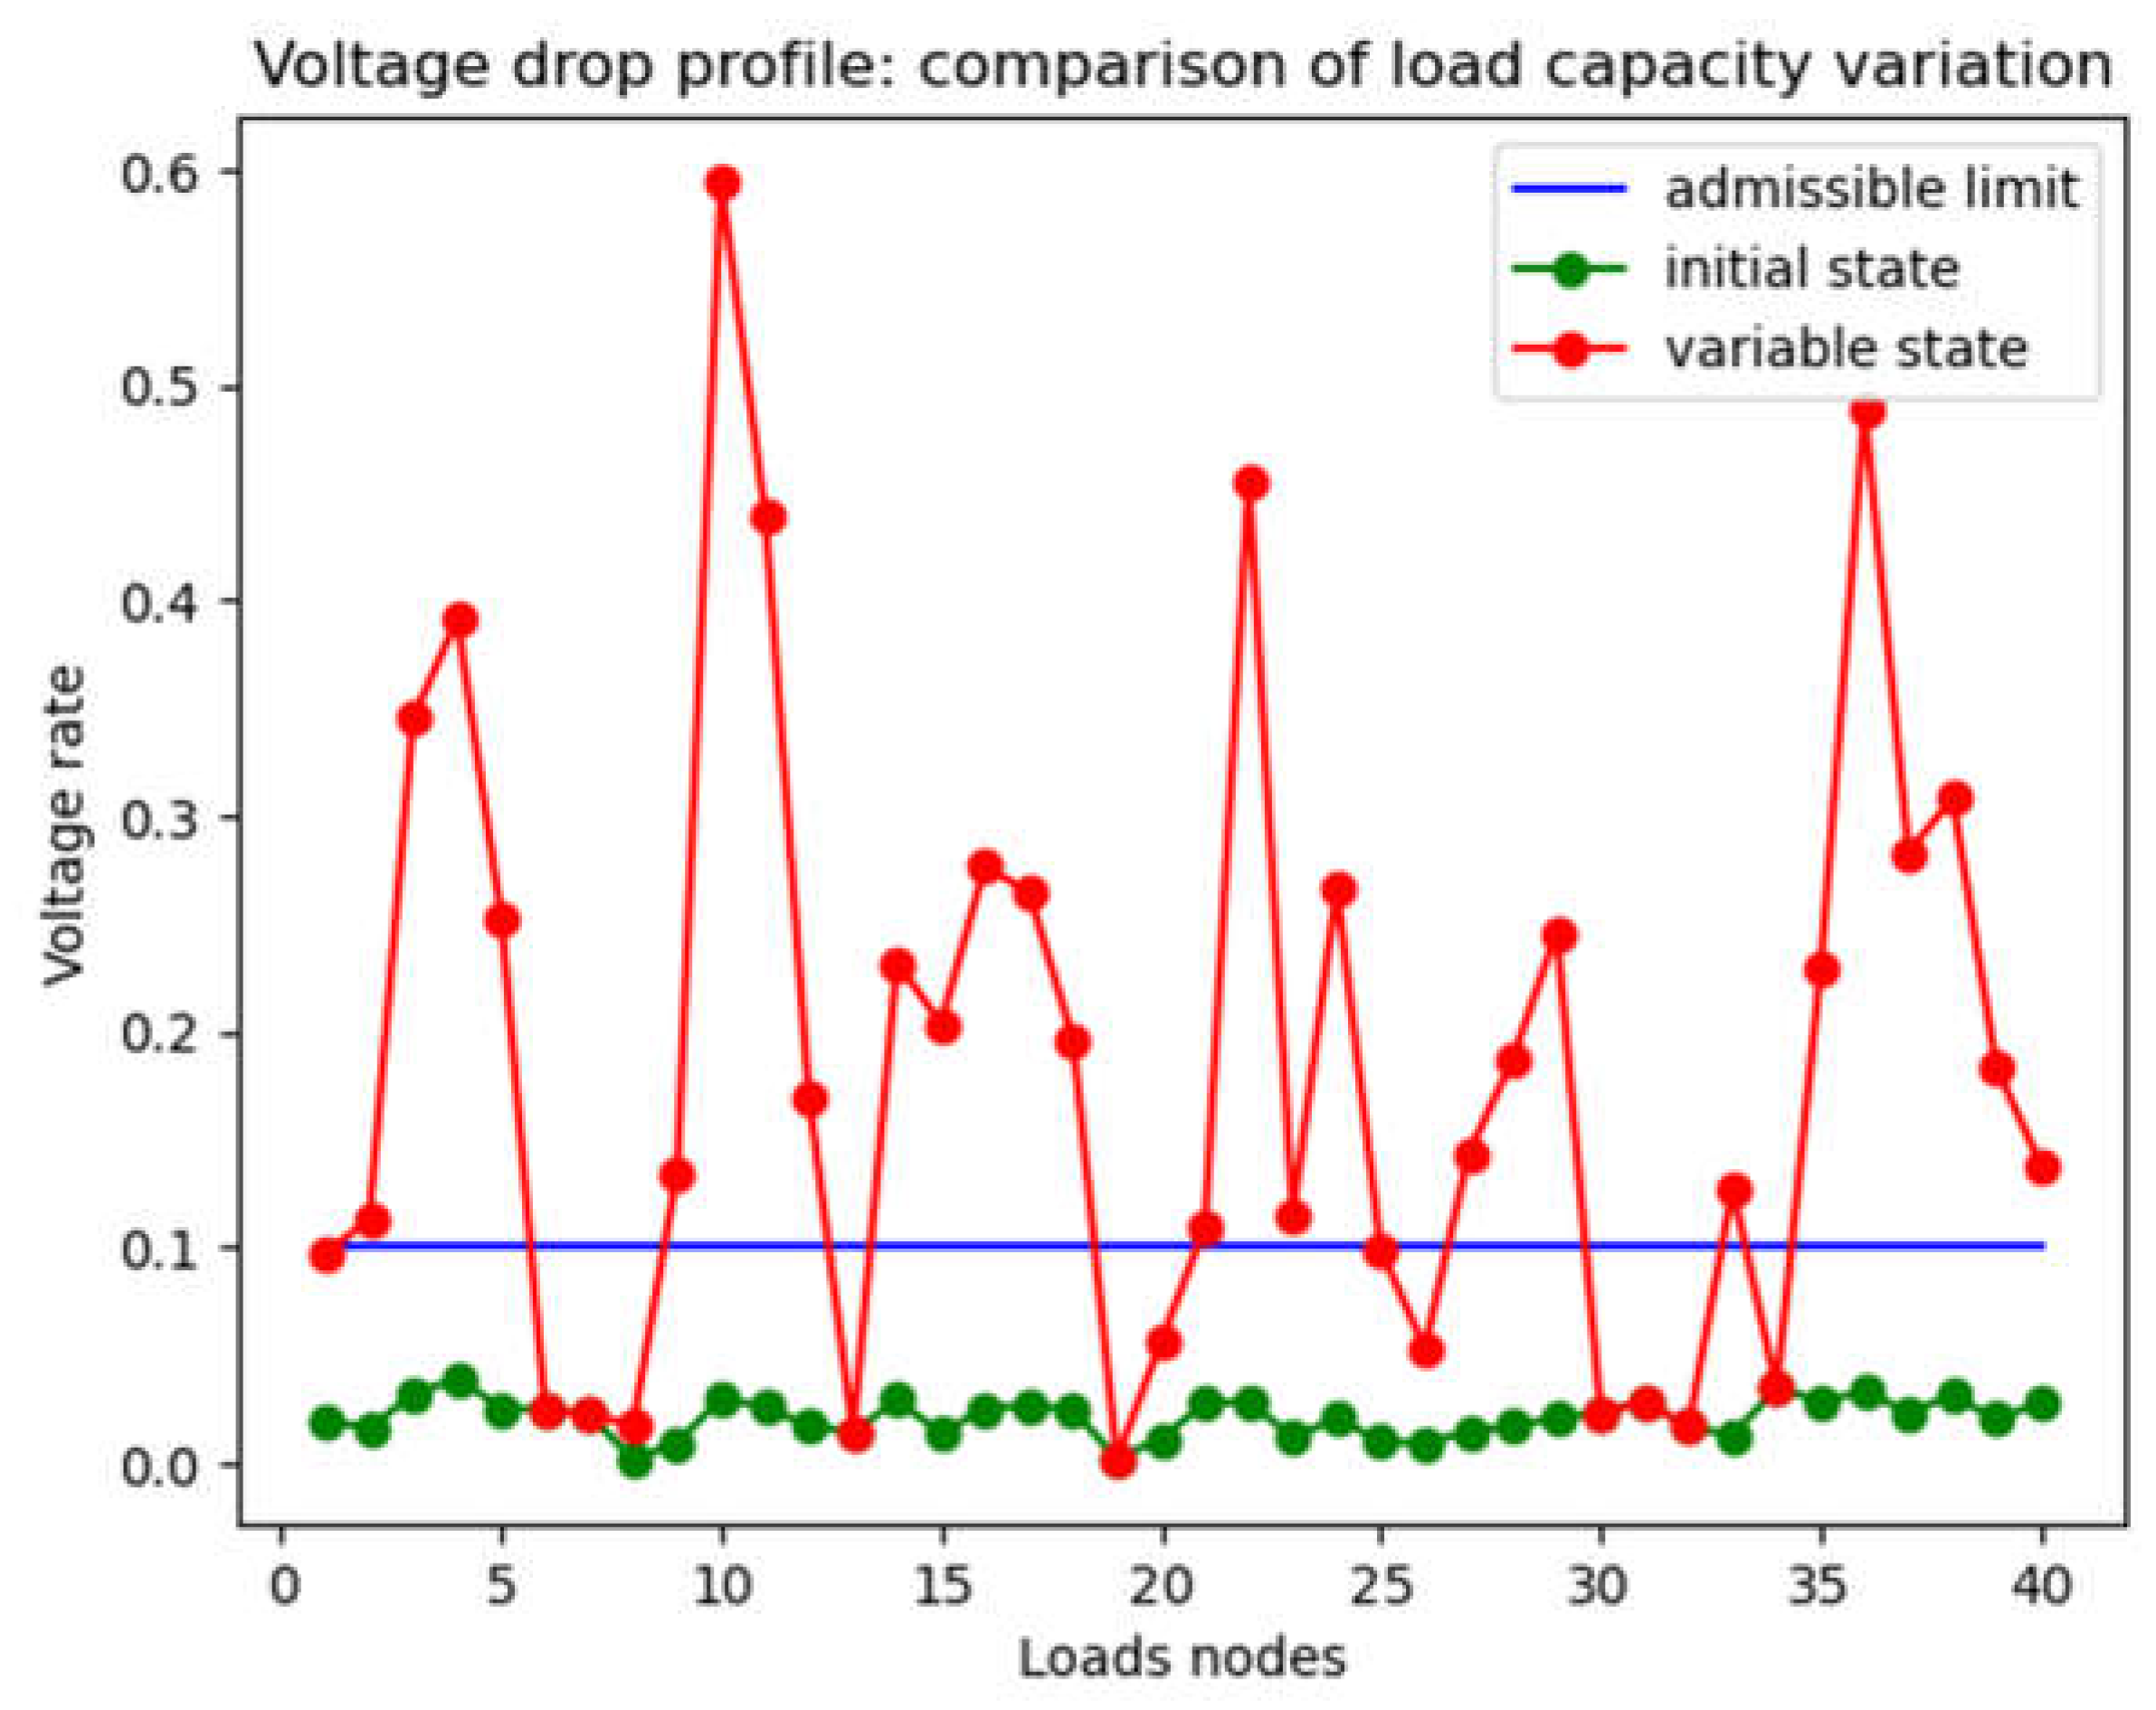
4.1.4. Capacity and Connection Optimization Results
- a)
- Scenario 1: results on voltage rate profile/distance
- b) Scenario 2: influence of load capacity
4.2. Discussion
5. Conclusions
Acknowledgments
Conflicts of Interest
Nomenclature
| = puissance solaire variable | |
| = charging (80%) and discharging (20%) rates | i= index |
| = performance | |
| = performance rate | |
| = area | |
| = temperature differential | = load vector matrix |
| = decision variable | = vector i |
| = standard temperature | |
| = battery storage at t+1 | |
| = battery storage at t | |
| = battery power | |
| = number of batteries | , : latitudes |
| = battery capacity | , : longitudes |
| = battery volatge | |
| = battery efficiency | |
| = wind power | |
| = air density | |
| = area swept by the turbine | |
| = wind power efficiency | |
| = wind decision variable | |
| = probability density | |
| = scale factor | j = substation index |
| = wind speed | |
| = standard deviation | |
| = average speed | |
| = average power | |
| = gamma fucntion | |
| = hydroelectric power | |
| = density of water | |
| = acceleration | |
| = water flow rate | |
| = waterfall height | |
| = hydroelectric efficiency | |
References
- F. Antonanzas-Torres, J. Antonanzas, and J. Blanco-Fernandez, “State-of-the-Art of Mini Grids for Rural Electrification in West Africa,” Energies 2021, Vol. 14, Page 990, vol. 14, no. 4, p. 990, Feb. 2021. [CrossRef]
- “Un défi pour la planète : les Objectifs de développement durable en débat | Enhanced Reader.
- R. B. Swain and A. Karimu, “Renewable electricity and sustainable development goals in the EU,” 2019. [CrossRef]
- K. Farhana et al., “Energy consumption, environmental impact, and implementation of renewable energy resources in global textile industries: an overview towards circularity and sustainability Nano-fluid Technology View project NASA HUNCH-Sleeping Rack for Astronauts View pro”. [CrossRef]
- M. S. Nazir, Z. M. Ali, M. Bilal, H. M. Sohail, and H. M. N. Iqbal, “Environmental impacts and risk factors of renewable energy paradigm—a review,” Environ. Sci. Pollut. Res., vol. 27, no. 27, pp. 33516–33526, Sep. 2020. [CrossRef]
- K. Sedzro, … A. L.-I. T. on, and undefined 2017, “Allocation of resources using a microgrid formation approach for resilient electric grids,” ieeexplore.ieee.orgKSA Sedzro, AJ Lamadrid, LF ZuluagaIEEE Trans. Power Syst. 2017•ieeexplore.ieee.org, Accessed: Mar. 02, 2024. [Online]. Available:. Available online: https://ieeexplore.ieee.org/abstract/document/8019829/.
- H. A. Muqeet et al., “Sustainable Solutions for Advanced Energy Management System of Campus Microgrids: Model Opportunities and Future Challenges,” 2022. [CrossRef]
- Khan, M. Naeem, M. Iqbal, … S. Q.-… and S. E., and undefined 2016, “A compendium of optimization objectives, constraints, tools and algorithms for energy management in microgrids,” Elsevier, Accessed: Mar. 02, 2024. [Online]. Available online: https://www.sciencedirect.com/science/article/pii/S1364032115016421.
- L. Mariam, M. Basu, and M. F. Conlon, “A Review of Existing Microgrid Architectures,” J. Eng. (United Kingdom), vol. 2013, 2013. [CrossRef]
- F. S. Al-Ismail, “DC Microgrid Planning, Operation, and Control: A Comprehensive Review,” IEEE Access, vol. 9, pp. 36154–36172, 2021. [CrossRef]
- S. Diego, “Office of Electricity Delivery and Energy Reliability Smart Grid R&D Program DOE Microgrid Workshop Report”.
- P. Premadasa, C. Silva, … D. C.-J. of E., and undefined 2023, “A multi-objective optimization model for sizing an off-grid hybrid energy microgrid with optimal dispatching of a diesel generator,” Elsevier, Accessed: Jan. 25, 2024. [Online]. Available online: https://www.sciencedirect.com/science/article/pii/S2352152X23010186.
- J. Viteri, F. Henao, J. Cherni, I. D.-J. of C. Production, and undefined 2019, “Optimizing the insertion of renewable energy in the off-grid regions of Colombia,” Elsevier, Accessed: Jan. 23, 2024. [Online]. Available:. Available online: https://www.sciencedirect.com/science/article/pii/S0959652619323042.
- K. Sedzro, A. Salami, P. Agbessi, M. K.- Energies, and undefined 2022, “Comparative Study of Wind Energy Potential Estimation Methods for Wind Sites in Togo and Benin (West Sub-Saharan Africa),” mdpi.comKSA Sedzro, AA Salami, PA Agbessi, MK KodjoEnergies, 2022•mdpi.com, Accessed: Jan. 25, 2024. [Online]. Available online: https://www.mdpi.com/1996-1073/15/22/8654.
- S. A.-R. energy and undefined 2007, “Optimised model for community-based hybrid energy system,” Elsevier, vol. 32, pp. 1155–1164, 2007. [CrossRef]
- R. Hassan, B. Das, M. H.- Energy, and undefined 2022, “Integrated off-grid hybrid renewable energy system optimization based on economic, environmental, and social indicators for sustainable development,” Elsevier, Accessed: Jan. 27, 2024. [Online]. Available online: https://www.sciencedirect.com/science/article/pii/S0360544222007265.
- X. Chen et al., “An improved brain storm optimization for a hybrid renewable energy system,” ieeexplore.ieee.orgXR Chen, JQ Li, Y Han, B Niu, L Liu, B ZhangIeee Access, 2019•ieeexplore.ieee.org, Accessed: Jan. 27, 2024. [Online]. Available. Available online: https://ieeexplore.ieee.org/abstract/document/8676318/.
- M. Ming, R. Wang, Y. Zha, T. Z.- Energies, and undefined 2017, “Multi-objective optimization of hybrid renewable energy system using an enhanced multi-objective evolutionary algorithm,” mdpi.com, 2017. [CrossRef]
- H. Yang, L. Lu, W. Z.-S. energy, and undefined 2007, “A novel optimization sizing model for hybrid solar-wind power generation system,” Elsevier, 2006. [CrossRef]
- D. K. Dhaked, Y. Gopal, and D. Birla, “Battery Charging Optimization of Solar Energy based Telecom Sites in India,” Eng. Technol. Appl. Sci. Res., vol. 9, no. 6, pp. 5041–5046, 2019. [CrossRef]
- K. Prakash Kumar and B. Saravanan, “Recent techniques to model uncertainties in power generation from renewable energy sources and loads in microgrids-A review ARTICLE INFO,” 2016. [CrossRef]
- S. Talari, M. Yazdaninejad, and M. R. Haghifam, “Stochastic-based scheduling of the microgrid operation including wind turbines, photovoltaic cells, energy storages and responsive loads,” IET Gener. Transm. Distrib., vol. 9, no. 12, pp. 1498–1509, Sep. 2015. [CrossRef]
- Zakariazadeh, S. Jadid, and P. Siano, “Smart microgrid energy and reserve scheduling with demand response using stochastic optimization,” Int. J. Electr. POWER ENERGY Syst., vol. 63, pp. 523–533, 2014. [CrossRef]
- W. Labeeuw and G. Deconinck, “Residential Electrical Load Model based on Mixture Model Clustering and Markov Models,” 2013. [CrossRef]
- “Integration K-Means Clustering Method and Elbow Method For Identification of The Best Customer Profile Cluster”. [CrossRef]
- E. Umargono, J. E. Suseno, and V. Gunawan, “K-Means Clustering Optimization using the Elbow Method and Early Centroid Determination Based-on Mean and Median”. [CrossRef]
- W. GUNAWAN, E. KABURUAN, … B. R.-J. of T., and undefined 2023, “DESIGN AND BUILD OF SEARCHING SYSTEM FOR THE NEAREST FISH SHOP ON AN ORNAMENTAL FISH MARKET WEBSITE USING THE HAVERSINE,” jatit.orgW GUNAWAN, ER KABURUAN, B RUDIANTO, A PUSPITASARI, B SUDRAJAT, D ERRIJournal Theor. Appl. Inf. Technol. 2023•jatit.org, Accessed: Mar. 02, 2024. [Online]. Available. Available online: https://www.jatit.org/volumes/hundredone16.php.
- N. Jaya, S. Asst, and A. Professor, “PRAGMATIC INVESTIGATIONS TO SMART DUSTS LOCATION APPRAISAL PRECISELY USING MACHINE LEARNING,” J. Theor. Appl. Inf. Technol., vol. 31, no. 16, 2023, Accessed: Mar. 02, 2024. [Online]. Available. Available online: www.jatit.org.
- J. G. Peña Balderrama et al., “Incorporating high-resolution demand and techno-economic optimization to evaluate micro-grids into the Open Source Spatial Electrification Tool (OnSSET),” Energy Sustain. Dev., vol. 56, pp. 98–118, 2020. [CrossRef]
- B. Y. K. S. S. M. A. T. P. L. Y. Kabe Moyème, “GLOBAL ATLAS OF RENEWABLES ENERGIES: A COMPLEMENTARY TO AN OPTIMAL ELECTRIFICATION PLANNING METHOD AT SHORT AND LONG TERMS- CASE STUDY OF TOGO,” Int. J. Eng. Sci. Res. Technol., vol. 12, no. 11, pp. 18–35, Nov. 2023. [CrossRef]
- K. Gao et al., “A review of optimization of microgrid operation,” mdpi.com, Accessed: Mar. 04, 2024. [Online]. Available. Available online: https://www.mdpi.com/1996-1073/14/10/2842.
- B. Li, R. Roche, and A. Miraoui, “Microgrid sizing with combined evolutionary algorithm and MILP unit commitment,” MILP unit commitment. Appl. Energy, vol. 188, 2017, Accessed: Mar. 04, 2024. [Online]. Available. Available online: https://hal.science/hal-02131005.
- A. Parisio, E. Rikos, and L. Glielmo, “A Model Predictive Control Approach to Microgrid Operation Optimization,” IEEE Trans. Control Syst. Technol., vol. 22, no. 5, p. 1813, 2014. [CrossRef]
- L. Guo, W. Liu, J. Cai, B. Hong, and C. Wang, “A two-stage optimal planning and design method for combined cooling, heat and power microgrid system,” Energy Convers. Manag., vol. 74, pp. 433–445, Oct. 2013. [CrossRef]
- D. P. E Silva, M. D. Queiroz, J. F. Fardin, J. L. F. Sales, and M. T. D. Orlando, “Hybrid modeling of energy storage system and electrical loads in a pilot-microgrid,” 2018 13th IEEE Int. Conf. Ind. Appl. INDUSCON 2018 - Proc., pp. 433–438, Jul. 2019. [CrossRef]
- X. Y. Mah et al., “Optimization of a standalone photovoltaic-based microgrid with electrical and hydrogen loads,” Energy, vol. 235, Nov. 2021. [CrossRef]
- “A Self Sustaining Microgrid for Supplying Electrical Load in Rural Areas,” 2020 IEEE Reg. 10 Symp. TENSYMP 2020, pp. 1836–1839, Jun. 2020. [CrossRef]
- Nazari and R. Keypour, “Participation of responsive electrical consumers in load smoothing and reserve providing to optimize the schedule of a typical microgrid,” Energy Syst., vol. 11, no. 4, pp. 885–908, Nov. 2020. [CrossRef]
- L. Aiswariya, T. P. Imthias Ahamed, and S. Mohammed S, “Optimal Microgrid Battery Scheduling Using Simulated Annealing,” 2020 IEEE Int. Conf. Power Electron. Renew. Energy Appl. PEREA 2020, Nov. 2020. [CrossRef]
- “Simulated annealing algorithms: an overview - IEEE Circuits and Devices Magazine | Enhanced Reader.
- H. Liang, W. Z.- Energies, and undefined 2014, “Stochastic modeling and optimization in a microgrid: A survey,” mdpi.com, vol. 7, pp. 2027–2050, 2014. [CrossRef]
- N. Nikmehr, S. Najafi-Ravadanegh, A. K.-A. energy, and undefined 2017, “Probabilistic optimal scheduling of networked microgrids considering time-based demand response programs under uncertainty,” Elsevier, Accessed: Mar. 04, 2024. [Online]. Available:. Available online: https://www.sciencedirect.com/science/article/pii/S0306261917304774.
- T. Wu and J. Wang, “Artificial intelligence for operation and control: The case of microgrids,” Electr. J., vol. 34, p. 106890, 2021. [CrossRef]
- S. Leonori, M. Paschero, F. Massimo, F. Mascioli, and A. Rizzi, “Optimization strategies for Microgrid energy management systems by Genetic Algorithms,” Appl. Soft Comput. J., vol. 86, p. 105903, 2020. [CrossRef]
- T. Khatib, A. Mohamed, and K. Sopian, “Optimization of a PV/wind micro-grid for rural housing electrification using a hybrid iterative/genetic algorithm: Case study of Kuala Terengganu, Malaysia,” Energy Build., vol. 47, pp. 321–331, Apr. 2012. [CrossRef]
- Das and Z. Ni, “A computationally efficient optimization approach for battery systems in islanded microgrid,” IEEE Trans. Smart Grid, vol. 9, no. 6, pp. 6489–6499, Nov. 2018. [CrossRef]
- D. Tenfen and C. Finardi, “A mixed integer linear programming model for the energy management problem of microgrids,” Electr. Power Syst. Res., vol. 122, pp. 19–28, 2015. [CrossRef]
- M. Sigalo, A. Pillai, S. Das, M. A.- Energies, and undefined 2021, “An energy management system for the control of battery storage in a grid-connected microgrid using mixed integer linear programming,” mdpi.com, Accessed: Mar. 04, 2024. [Online]. Available:. Available online: https://www.mdpi.com/1996-1073/14/19/6212.
- S. M. Dawoud, X. Lin, and M. I. Okba, “Hybrid renewable microgrid optimization techniques: A review,” Renew. Sustain. Energy Rev., vol. 82, pp. 2039–2052, Feb. 2018. [CrossRef]
- R. Ramakumar, P. S. Shetty, and K. Ashenayi, “LINEAR PROGRAMMING APPROACH TO THE DESIGN OF INTEGRATED RENEWABLE ENERGY SYSTEMS FOR DEVELOPING COUNTRIES.,” IEEE Trans. Energy Convers., vol. EC-1, no. 4, pp. 18–24, 1986. [CrossRef]
- R. Ramakumar, I. Abouzahr, and K. Ashenayi, “A knowledge-based approach to the design of integrated renewable energy systems,” IEEE Trans. Energy Convers., vol. 7, no. 4, pp. 648–659, 1992. [CrossRef]
- A. Tabares, G. Muñoz-Delgado, … J. F.-I. J. of, and undefined 2022, “Multistage reliability-based expansion planning of AC distribution networks using a mixed-integer linear programming model,” Elsevier, Accessed: Jan. 22, 2024. [Online]. Available. Available online: https://www.sciencedirect.com/science/article/pii/S0142061521011285.
- S. Twaha and M. A. M. Ramli, “Title: A review of optimization approaches for hybrid distributed energy generation systems: off-grid and grid-connected systems A review of optimization approaches for hybrid distributed energy generation systems: off-grid and grid-connected systems A review of optimization approaches for hybrid distributed energy generation systems: off-grid and grid-connected systems,” Sustain. Cities Soc., 2018. [CrossRef]
- O. Kunle Ajiboye, C. Victor Ochiegbu, E. Antwi Ofosu, and S. Gyamfi, “A review of hybrid renewable energies optimisation: design, methodologies, and criteria,” Int. J. Sustain. Energy, vol. 42, no. 1, pp. 648–684, 2023. [CrossRef]
- M. Rezkallah, A. Chandra, … B. S.-I. T. on, and undefined 2017, “Microgrid: configurations, control and applications,” ieeexplore.ieee.orgM Rezkallah, A Chandra, B Singh, S SinghIEEE Trans. Smart Grid, 2017•ieeexplore.ieee.org, Accessed: Mar. 24, 2024. [Online]. Available. Available online: https://ieeexplore.ieee.org/abstract/document/8066372/.
- F. R. Badal, P. Das, S. K. Sarker, and S. K. Das, “A survey on control issues in renewable energy integration and microgrid,” Prot. Control Mod. Power Syst., vol. 4, no. 1, Dec. 2019. [CrossRef]
- A. Alzahrani, M. Ferdowsi, P. Shamsi, C. D.-P. C. Science, and undefined 2017, “Modeling and simulation of microgrid,” ElsevierA Alzahrani, M Ferdowsi, P Shamsi, CH DagliProcedia Comput. Sci. 2017•Elsevier, Accessed: Mar. 24, 2024. [Online]. Available. Available online: https://www.sciencedirect.com/science/article/pii/S1877050917318574.
- M. S. Mahmoud, M. Saif, U. Rahman, and M. A. L. -Sunni, “Review of microgrid architectures-a system of systems perspective”. [CrossRef]
- M. Kamal, I. Ashraf, E. F.-E. Storage, and undefined 2022, “Efficient two-layer rural electrification planning and techno-economic assessment integrating renewable sources,” Wiley Online Libr. Kamal, I Ashraf, E FernandezEnergy Storage, 2022•Wiley Online Libr., vol. 4, no. 3, Jun. 2021. [CrossRef]
- J. P. Viteri, F. Henao, J. Cherni, and I. Dyner, “Optimizing the insertion of renewable energy in the off-grid regions of Colombia,” J. Clean. Prod., vol. 235, pp. 535–548, Oct. 2019. [CrossRef]
- R. Al Afif, Y. Ayed, O. M.-R. Energy, and undefined 2023, “Feasibility and optimal sizing analysis of hybrid renewable energy systems: A case study of Al-Karak, Jordan,” Elsevier, Accessed: Jan. 27, 2024. [Online]. Available. Available online: https://www.sciencedirect.com/science/article/pii/S096014812201905X.

| Indicators | Min | Max | |||
| Data | 100 | 0.028 | 0.9 | 0.455 | 0.25 |
| Costs /systems | PV (USD /kW) | Batteries/6V (USD/unit) |
Wind (USD /kW) |
Hydraulic (USD /kW) |
Biodiesel (USD /kW) |
| Installation cost | 800-2000 | 900-1300 | 1800 | 2000 | 650 |
| Maintenance and operating costs | 8-200 | 9-14 | 700-1000 | 100/an | 20/an |
| Replacement cost | 700 | 1300 | - | - | - |
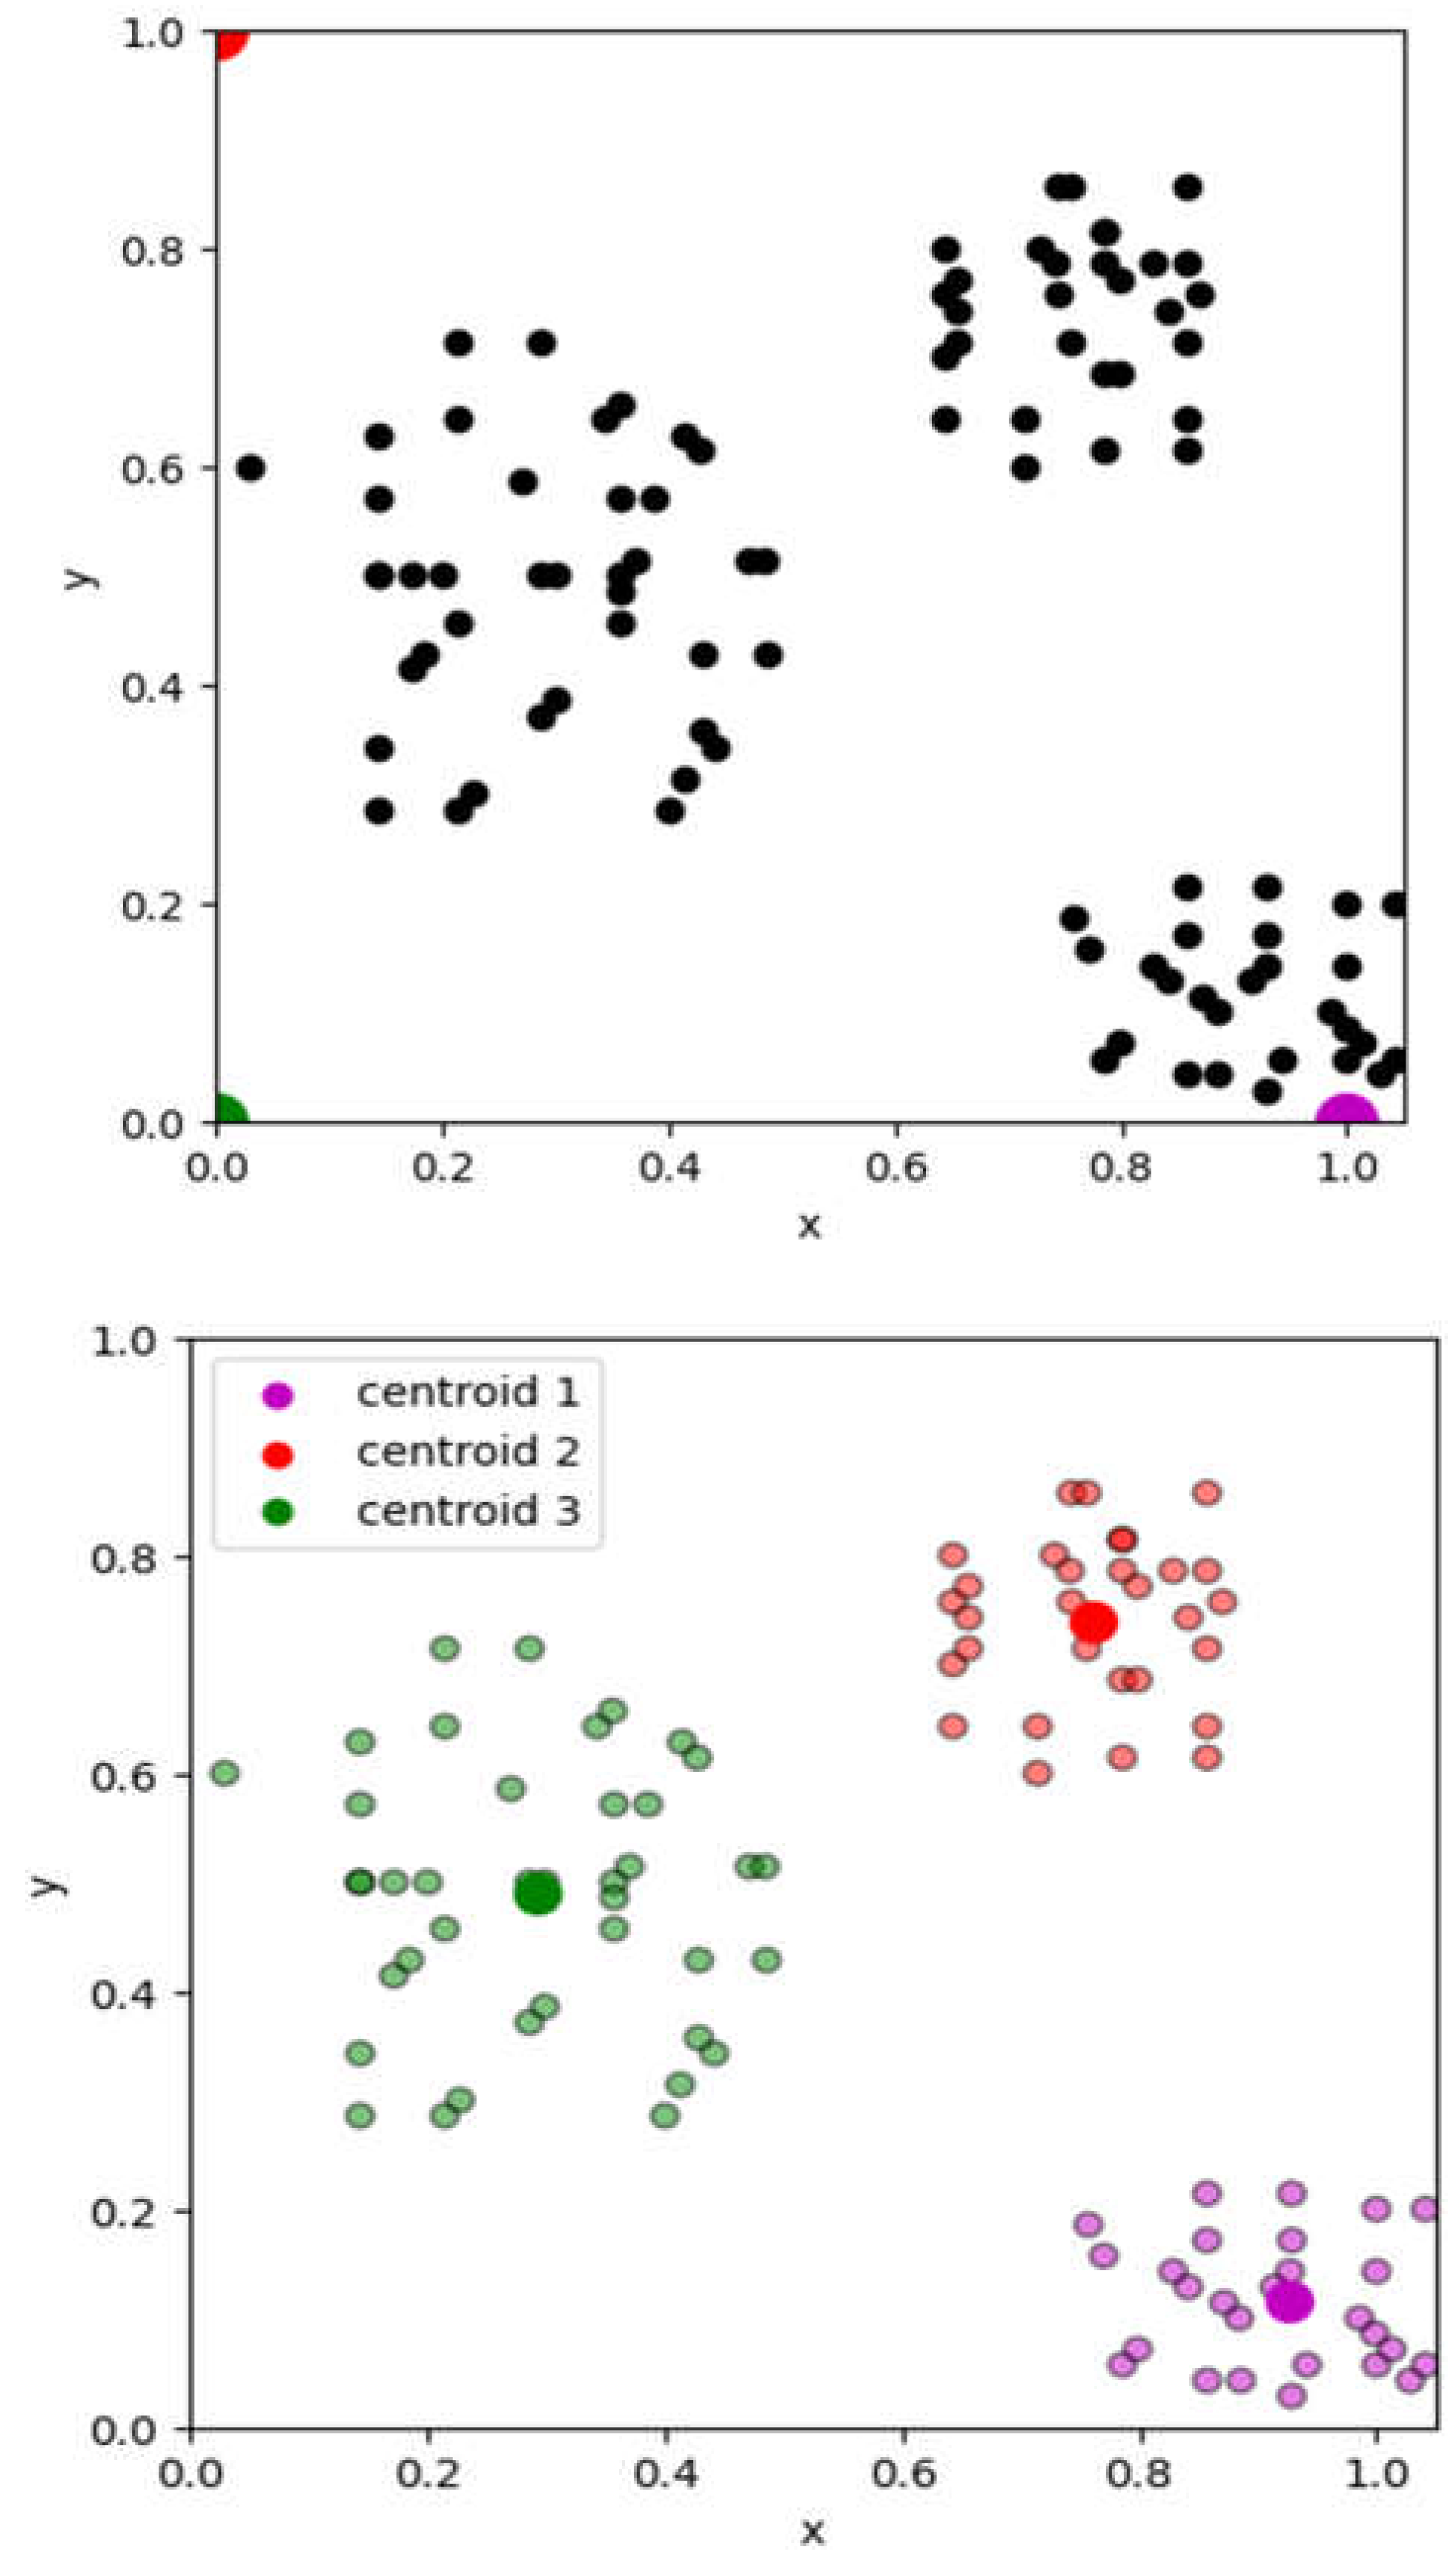
| Centroïds/axis | x | y |
| Centroïd 1 | 0.92463054 | 0.11527094 |
| Centroïd 2 | 0.75952381 | 0.74047619 |
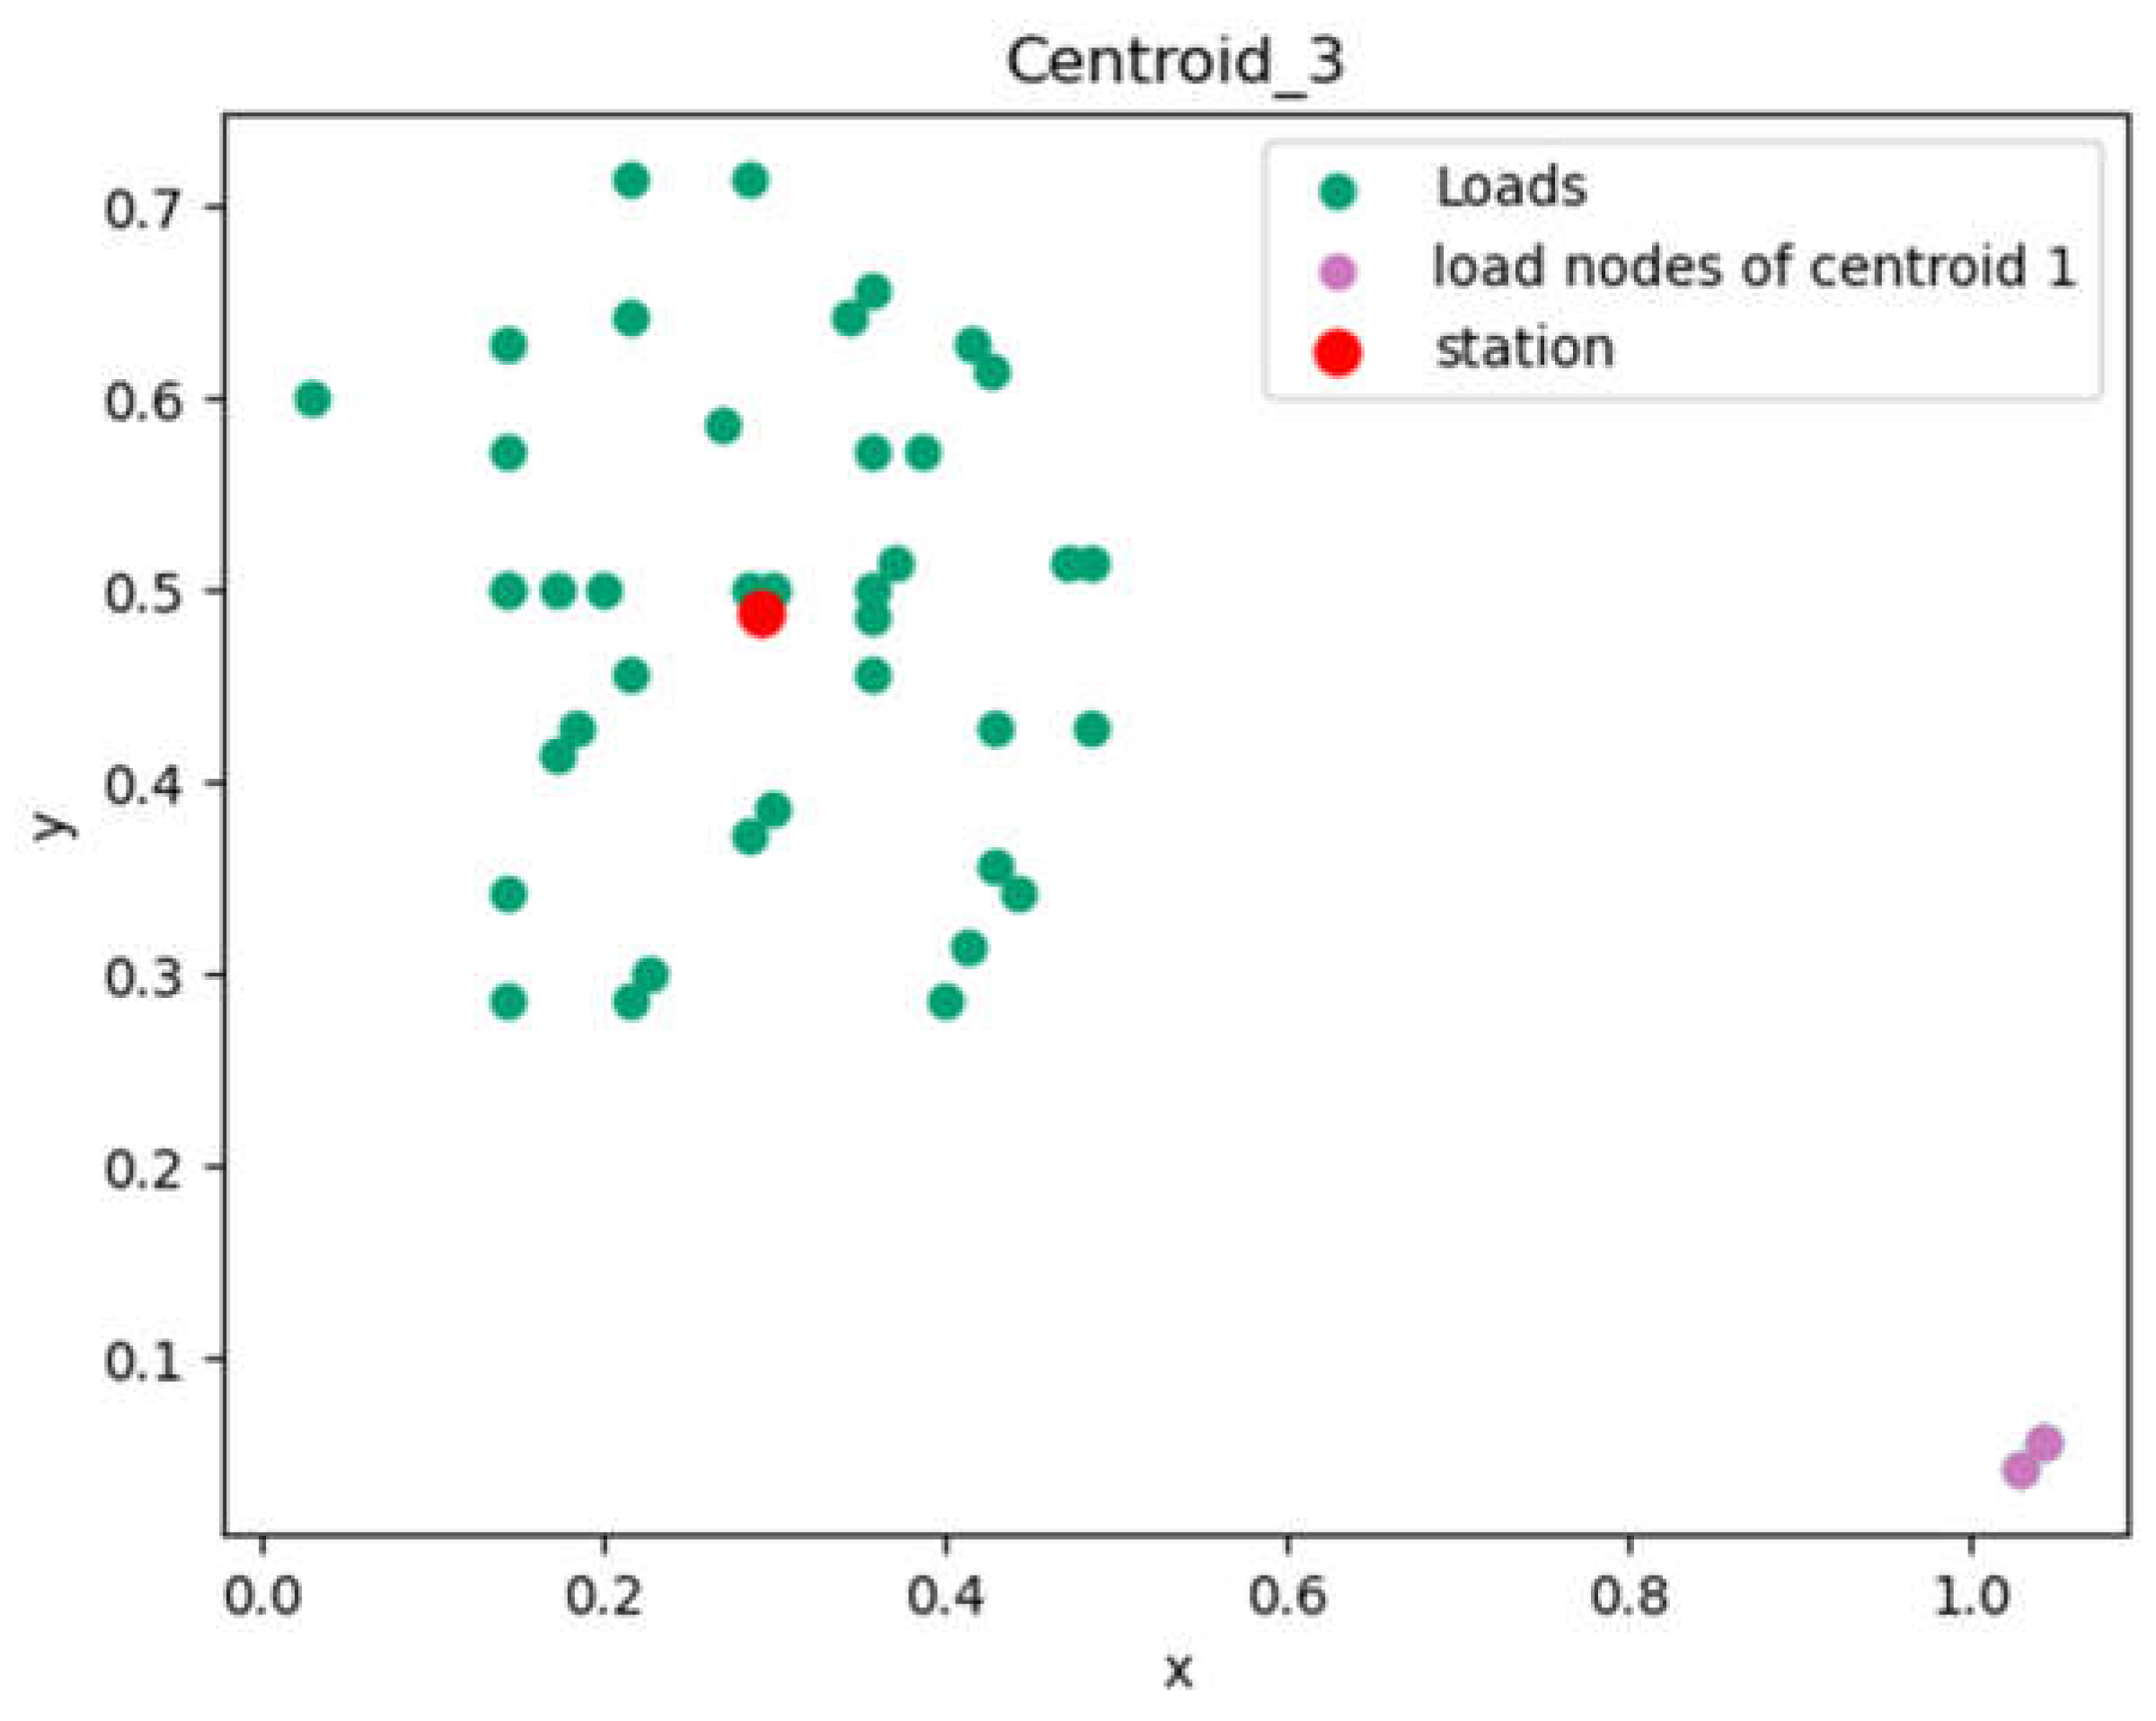
| Centroïd 3 | 0.29246429 | 0.48892857 |
| Horizon/Year | 2024-2030 | 2030-2050 | ||
| Population | 8.095.498 | > 12 000 000 | ||
| Scenarios | Scenario 2 | Scenario 4 | ||
| Technologies/costs | Capacity (MW) |
Investment (In million USD) |
Capacity (MW) |
Investment (In million USD) |
| Mini-grid PV hybrid |
320 | 564 | 720 | 1371 |
| Mini-grid hydraulic |
˂ 1 | 1.12 | 1 | 4.42 |
| Mini-grid wind, biodiesel |
0 | 0 | 0 | 0 |
| Extension |
- | - | 274 | 964 |
| PV Systems stand-alone |
- | - | 62 | 280 |
Disclaimer/Publisher’s Note: The statements, opinions and data contained in all publications are solely those of the individual author(s) and contributor(s) and not of MDPI and/or the editor(s). MDPI and/or the editor(s) disclaim responsibility for any injury to people or property resulting from any ideas, methods, instructions or products referred to in the content. |
© 2024 by the authors. Licensee MDPI, Basel, Switzerland. This article is an open access article distributed under the terms and conditions of the Creative Commons Attribution (CC BY) license (http://creativecommons.org/licenses/by/4.0/).


