Preprint
Article

Updated Risk Factors of Early Endothelial Deregulation in Type-1 Diabetes: A Meta-Analysis

Altmetrics

Downloads

171

Views

74

Comments

0

Submitted:

02 May 2024

Posted:

06 May 2024

You are already at the latest version

Alerts
Abstract
Background This study aimed to identify the prominent risk factors that may trigger danger signals of early onset of vascular deregulation in T1D. The risk factors we have identified may serve as dual-purpose biomarkers of rapid diagnosis that offer prospective tailor-made resolution therapeutics. Methods The healthy control (HC) was compared with individuals diagnosed with T1D for the risk factors of vascular deregulation in published research studies from year 2013 to 2023. The PubMed, Web of Science and Google Scholar databases were searched from 1/1/2013 to 1/9/2023. The risk of bias was assessed with the Cochrane (ROBINS-I ) tool, which is relevant to clinical subjects. A random effect model for continuous data was followed and analysed by RevMan 5.4 and GraphPad Prism software. Results 80 relevant case-control studies having 5293 HC and 7492 T1D patients were included. The age and sex-matched HC consisted of persons free of disease and not under any medication while clinical subjects of all age groups were included. 28 risk factors were grouped into six primary outcome models, all of which favoured the T1D synonymous with a high risk of CVD. Conclusions Our findings have strong implications for improving the quality of life and health economics related to vascular disease in T1D. HbA1c% is the most effective biomarker, followed by FBG, LDL-C, and AI% which the clinicians could evaluate using a simple blood test or non-invasive techniques. (Protocol registered at https://www.crd.york.ac.uk/prospero/ CRD42022384636).
Keywords: 
Subject: Biology and Life Sciences  -   Endocrinology and Metabolism
Highlights
  • Six major biomarkers have been identified as potential diagnostic surrogates that could indicate the onset of diabetes-induced ED in persons under the age of 40 years.
  • They consist of HbA1c%, FBG, LDL-c, AI%, sICAM-1, and FMD% which could be measured with a simple blood test or non-invasive techniques.
  • These markers are particularly important for the children, adolescents, young adults, and clinicians who find managing diabetes a very challenging and arduous task.
  • These markers should be regularly tested in the clinic as routine investigative metabolic checkpoints that will reveal the health status of the younger population which is vitally important for their wellbeing.
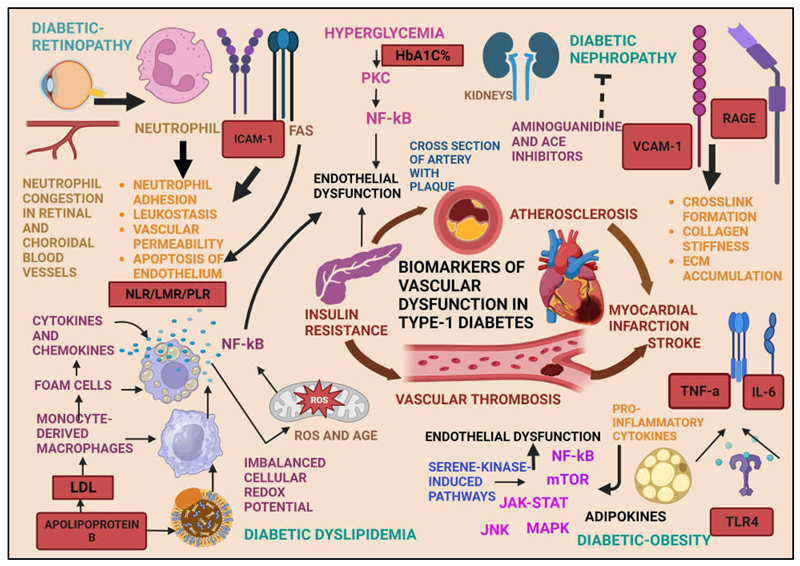
Graphical Abstract
Preprints 105488 i001

1. Introduction

1.1. Diabetes

Diabetes is a chronic metabolic disorder which is caused by inadequate insulin production that results in impaired glucose homeostasis [1]. A high fasting blood glucose level above 5.5 mmol/L determines the level of diabetes risk [2], which delineates pre- diabetes, type 1 diabetes (T1D), type-2 diabetes (T2D), gestational diabetes, and monogenic diabetes [3] that comprise of a global population that varies substantially within the age groups [4]. T1D, or insulin-dependent Diabetes mellitus is the focus of this study, which can affect individuals from as young as 2 months old to young adults up to 40 years of age [5]. Unlike in the mature adult population, the management of diabetes in children is very challenging owing to its many epigenetic risk factors that could originate from physiological, behavioural, immunological causatives and genetic pre-disposition which increase the complexity of the disease [6]. T1D is an autoimmune disease in which pancreatic beta cells are destroyed by the immune system, failing to recognize the beta cells in the islets of Langerhans as self[7]. High glucose levels in free circulation requires either bolus or regular injectable insulin or an insulin pump for the sustenance of normoglycaemia [8] which if unmanaged, also inflicts wide-spread organs damage that manifests as diabetic nephropathy, neuropathy, retinopathy, and cardiovascular disease (CVD) [9].

1.2. T1D

T1D has its highest prevalence in the very low age brackets such as infants up to young adults. When diagnosed with T1D at a very small age, administering insulin therapy and diabetic treatment becomes difficult. When vascular dysfunction sets in, with an overload of medication the life expectancy in such patients is shortened . In most of these young patients, diagnosis is delayed or missed out until late, which leads to early mortality [10]. Hence accurate and timely diagnosis necessitates the establishment of the modifiable risk factors serving dual purposes: early detection and early initiation of targeted therapy.
As per the statistical estimates of the international diabetes federation (IDF), 537 million people within the age range of 20-79 were diagnosed with T1D in the year 2022, and the majority of the patients were reported from low and middle-income countries worldwide (Figure 1) [11]. The projected estimates for the years 2030 and 2045 are 643 million patients and 784 million patients, respectively, which is in 7 years- time. The global health expenditure on diabetes in the year 2021 was estimated at US dollar 966 billion which is a massive 316% increase from the last 15 years[12]. Further, 9 million patients were diagnosed with T1D in the year 2022 worldwide, of which most were children and young adults, although newer reports have shown that the persons of all age groups could develop T1D . According to the T1D index, 8.75 million people worldwide live with T1D, and 182,000 deaths occur from it every year[13] . These patients require easy access to education, therapeutics, and supplies in order to administer self-care as well as prompt and timely screening of the blood glucose level and other risk-associated parameters to control the disease, prevent severe complications, maintain the quality of life, and prolong their lifespan [12].
Figure 1. The life expectancy of T1D when diagnosed at 10 years of age by the continents in the year 2022, which are the latest statistics documented by the International Diabetes Federation. The worst-affected continent is Africa and the South-East Asia (Courtesy of IDF Atlas Reports, 2022).
Preprints 105488 g001

1.3. CVD

CVD comprises of a group of diseases of the heart and blood vessels and is the major cause of mortality in diabetic patients [14]. Vascular disease is a serious complication associated with T1D that causes morbidity and mortality very early in life and those who succumb to it are mostly adolescents and young adults [13] . The link between diabetes and CVD arises from chronic hyperglycaemia which impairs antioxidant mechanisms and produces excess toxic oxygen metabolites from modifications in the macromolecular structures leading to oxidative stress [15]. A common mechanism of vascular dysfunction is insufficient release of endothelial nitric oxide (NO) which maintains the normal vasoconstriction function, but chronic hyperglycaemia influences its progressive decrease and thereby initiates arterial stiffness [16]. Declining NO induces an imbalance between athero-protective and atherogenic properties of the endothelium, which impairs the regulation of vasoconstrictor inhibitors and pro-inflammatory substances[17]. Arterial stiffness is a prominent characteristic of T1D, which correlates with lower brachial artery distensibility [18], carotid intima media thickness [19], higher pulse wave velocity and augmentation index (A175) percent [20,21]. Studies have shown that the evaluation of these parameters could lead to an early, more accurate prognosis and initiation of intensive treatment particularly in adolescents and young adults with T1D as they bear a higher CVD risk at a fairly young age [22].

1.4. Risk Factors

According to the American Heart Association, the multiple risk factors of CVD are named core health behaviours (including diet, smoking, physical exercise, and body weight) and health factors (including hypertension, hyperglycaemia and hypercholesteremia) [23]. The aim of this analysis was to identify the strongest and most reliable of the functional biomarkers of vascular deregulation in T1D which could be used in clinical practice for early detection of vascular pathology. In total, 28 prospective biomarkers were evaluated using data from 80 case-control primary research studies published in the last decade on T1D subjects within the age group of 7 to 40 years.

1.5. Research Question

The PICOS evaluation question in this study was "Which risk factors aggravate the development of vascular stress, leading to an early onset of vascular disease or CVD in children and young adults diagnosed with type-1 diabetes?" The study population comprised of children and young adults (ranging in age from 1 to 40 years) diagnosed with T1D. The intervention is evaluating the risk factors determining the onset of vascular disease. The comparators were healthy children and young adults versus children and young adults diagnosed with T1D. The outcome is the development of vascular stress leading to an early onset of vascular disease. The study design consists of primary case-control baseline studies published in the past decade from 2013 to 2023.

2. Methods

2.1. Eligibility Criteria for Considering Studies for This Meta-Analysis

Only clinical case-control studies of patients diagnosed with T1D are compared with age and sex-matched healthy control subjects with a disease duration of 1 to 25 years over which they had been on insulin treatment. The median age of the study population was 10 years in children, 20 in adolescents and 30 in the adults. The dose and the mode of insulin delivery was not considered although all the confirmed T1D patients had an HbA1c% above 6.5% [24].
The inclusion criteria for the participants were being children, young adults, and adults of 1-40 years of age. The intervention group consist of individuals diagnosed with and currently undergoing treatment for T1D, encompass both genders, and each eligible study must have a minimum of 3 participants. The control group should comprise of healthy individuals who do not have T1D or any other medical conditions, must be within 1-40 years old and should not be receiving treatment for any disease condition. The control group must be non-smokers, and not consume alcohol, fast food, or an unsuitable diet, and not be genetically predisposed to diabetes or endothelial stress. The control group could be treated with a placebo, must not be socioeconomically disadvantaged and must not be migrants.
The intervention is evaluating endothelial stress in the setting of T1D. Its prime risk factors are hypertension, hyperglycaemia, genetic predisposition, age, lifestyle, and disease conditions (CVD, dyslipidaemia, autoimmune and immunocompromised) subgroups in the setting of T1D. Pharmacological stimuli include intra-arterial infusion of endothelium-dependent vasodilators such as acetylcholine (Ach), bradykinin, or serotonin, via the release of NO and/or other endothelium-derived vasoactive substances. The widely used diagnostic method was flow-mediated dilation (FMD) of the brachial artery. Only endothelium-dependent responses were included. The exclusion criteria were other CVD except for vascular dysfunction, endothelial stress caused by diseases other than T1D, endothelial stress stimulated by endothelium-independent mechanisms and endothelial damage in people above the age of 40 years.
The inclusion criteria for screening of articles included only peer-reviewed and published, full-text research articles with a DOI, including only children and young adults in the age bracket of 1-40 years, diagnosed with only T1D, and receiving treatment only for TID. Further, research studies performed on endothelial stress or injury involving the risk factors of vascular dysfunction were included in this review. The studies that had evaluated vascular dysfunction by the method described above and published within the last decade-inclusive of years 2013 and 2023 having a clear conclusion and a significant outcome were included. No country restrictions were introduced.

2.2. Types of Outcome Measures

There are six primary outcomes that were evaluated with no secondary outcomes. The six primary outcomes were grouped into six models and analysed in a meta-analysis between the control and treatment/intervention groups to identify which model comprised of the strongest risk factors for developing T1D-induced CVD. The models comprised of (i) blood pressure -SBP, DBP, MAP , eGFR (ii) glycaemic -FBG, HbA1C% (iii) lipidemic -TC, TG, HDL-C, LDL-C, APO A, APO B (iv) vascular function – sICAM-1, sVCAM-1, SE-Selectin, FMD%, CIMT, PWV, AI%@75 (v) inflammatory – CRP, IL-6, TNF-A, ALT, AST, GGT (vi) obesity-related – BMI, BW, HT, Age markers.

2.3. Search Methods for Identification of Studies
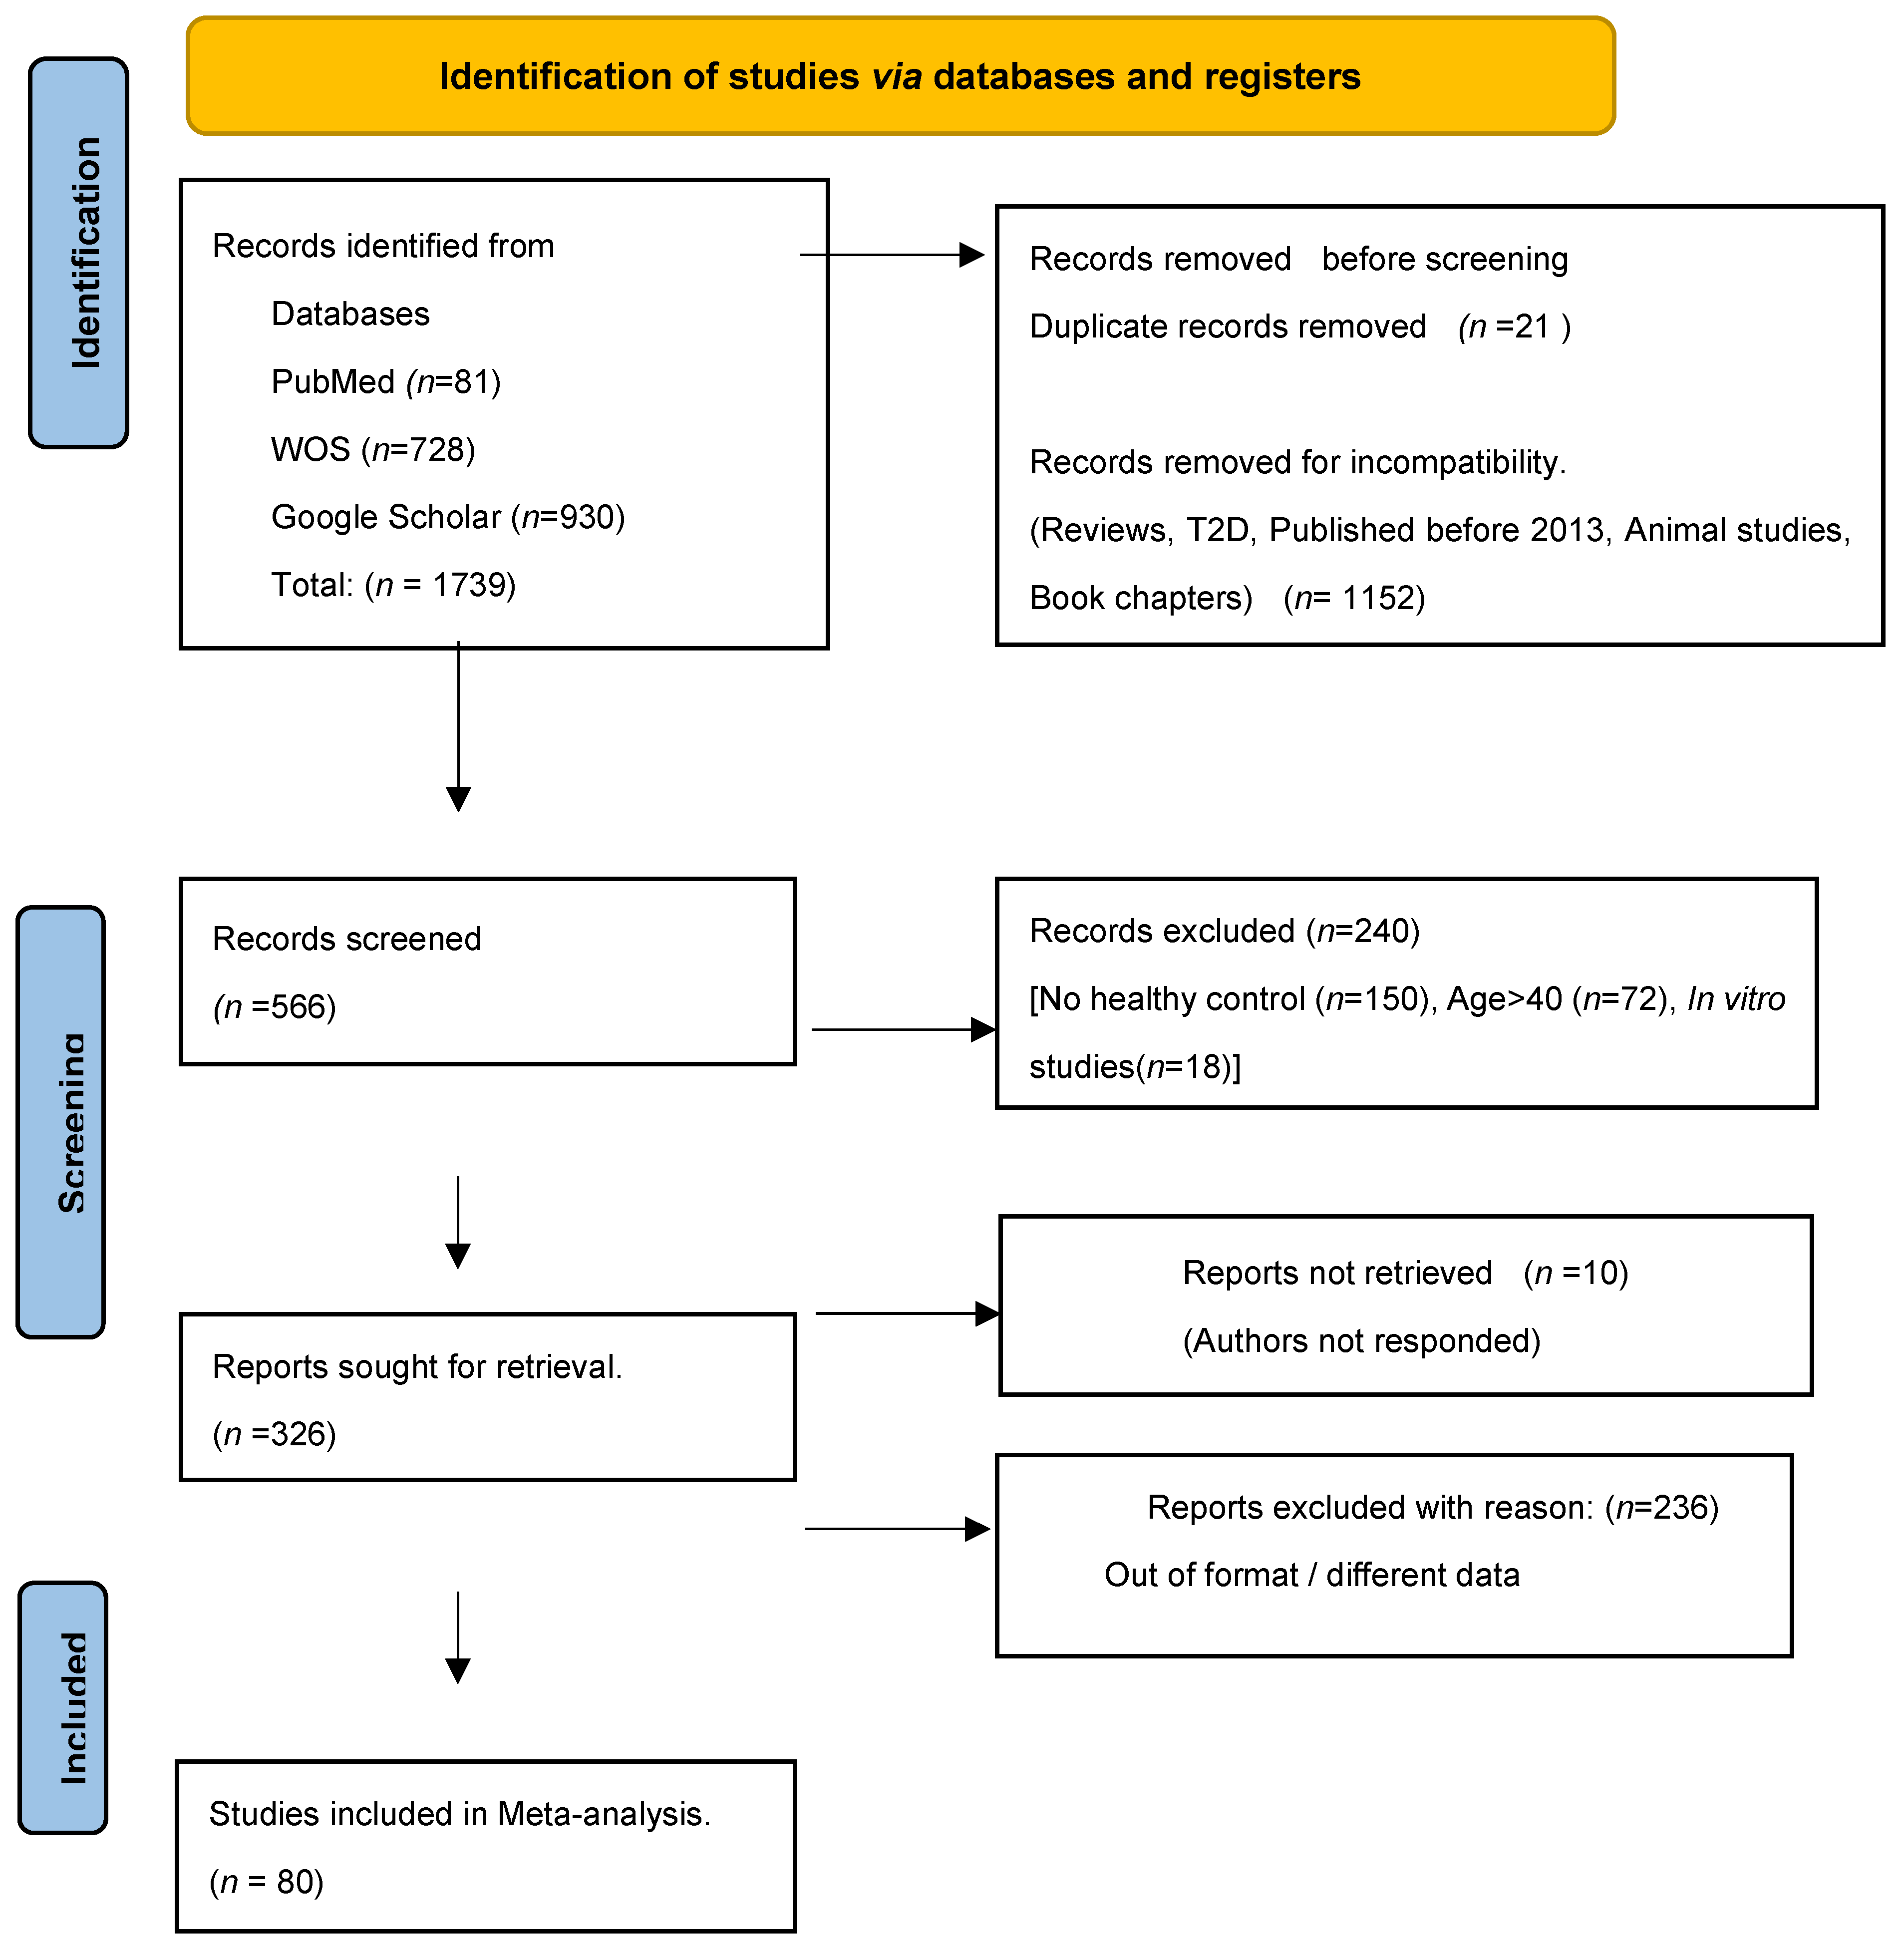
The PRISMA and the Cochrane collaboration guidelines applicable to meta-analyses of diseased subjects (Figure 2) were adhered to in conducting the search and extracting data for this study. The meta-analysis was registered at the PROSPERO register in January 2023 (Available from: https://www.crd.york.ac.uk/prospero/display_record.php?ID=CRD42022384636). The PubMed, Web of Science (WOS) and Google Scholar (grey literature) electronic databases were searched from 2013 January to September 2023 using MeSH and Boolean terms (type 1 diabetes OR vascular dysfunction AND clinical studies OR T1D AND endothelial dysfunction OR T1D AND vascular disease AND clinical studies. The first author conducted the search, identification, and screening of the manuscripts while another author independently repeated the screening and selecting the studies as per the eligibility criteria.
Figure 2. A modified version of the PRISMA flowchart of year 2020 used for reporting the included studies (Adopted from the Cochrane Collaboration. Org).
Preprints 105488 g002

2.4. Data Collection and Analysis

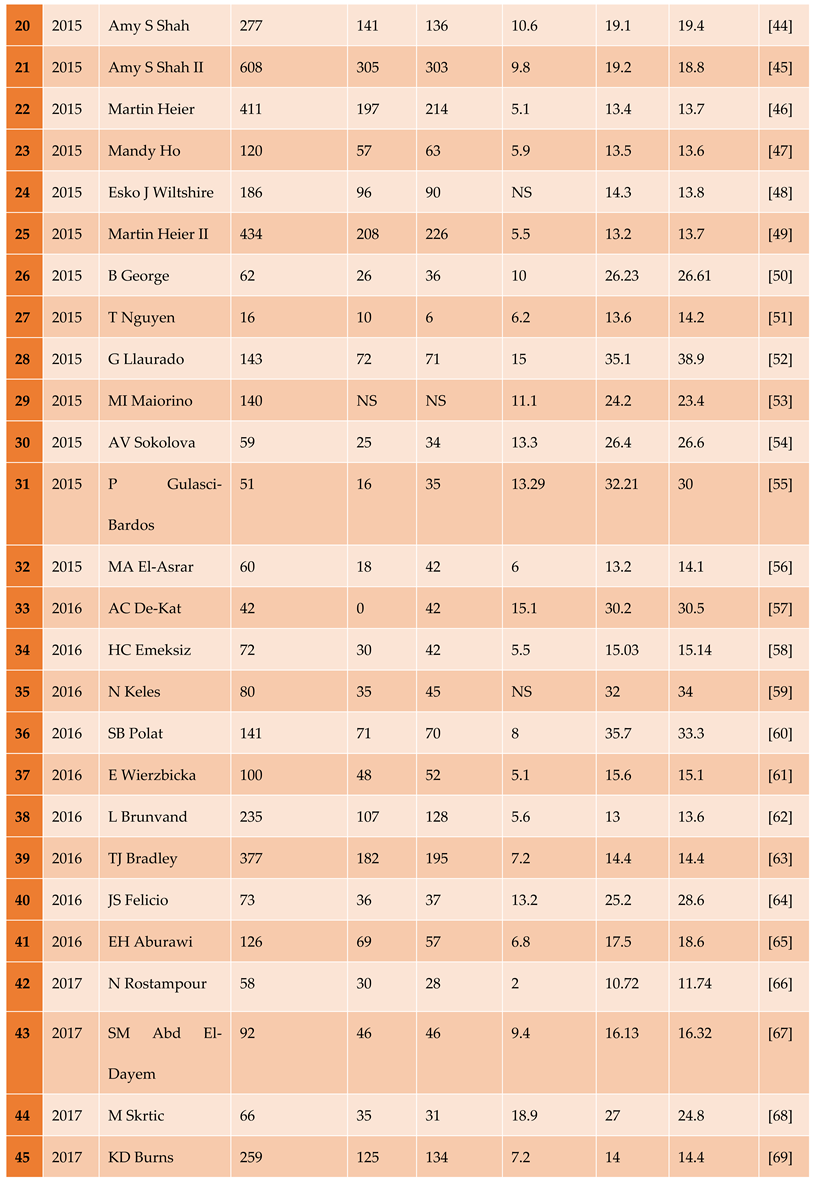
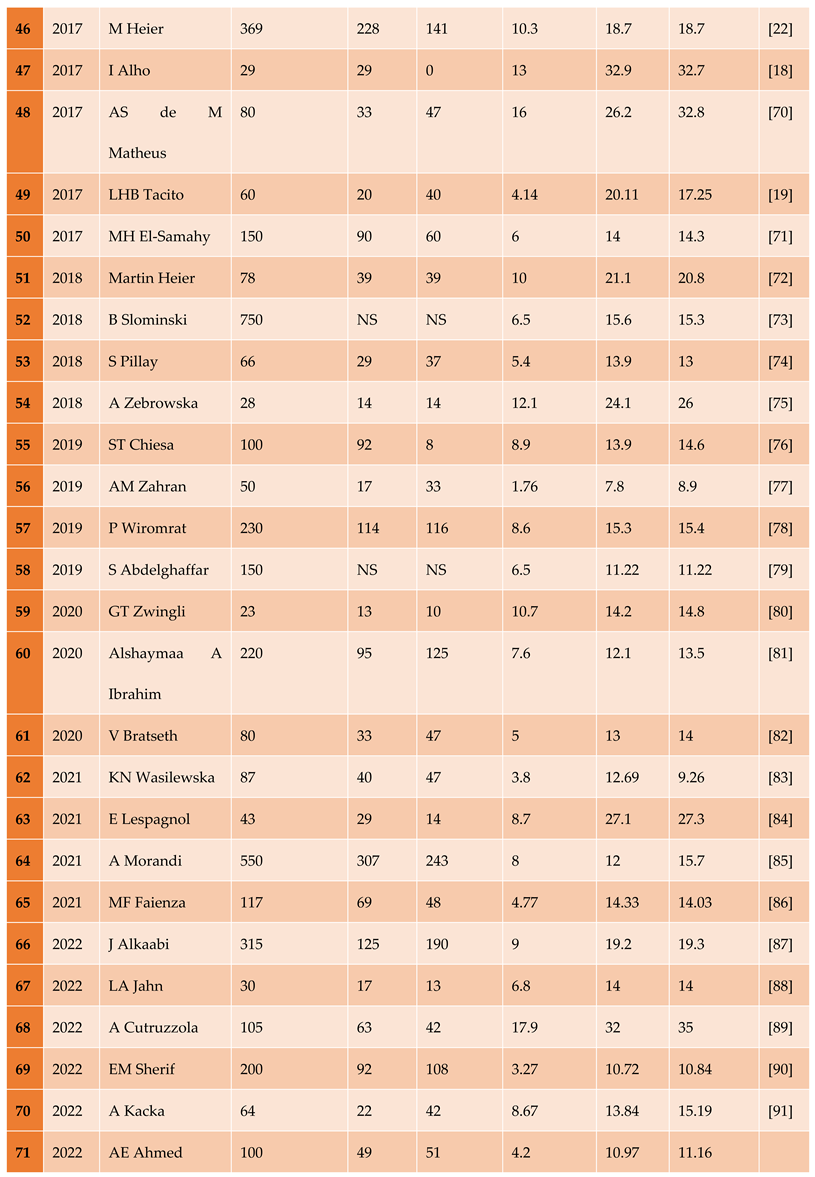
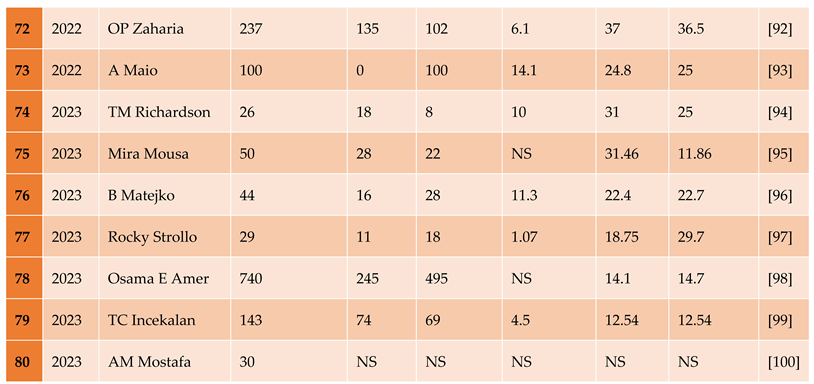
The first author conducted a thorough review of the full text articles identified in the database searches and extracted the data, as per the pre-specified inclusion criteria defined. The basic characteristics of the included studies are defined in Table 1. The statistical analysis of the data was carried out by creating a forest plot, Z -score, parametric paired student t-test, estimation plots, chi-squared distribution, the I2 metric for each of the primary outcomes that were evaluated. The identification of the strongest risk factors was based on the effect size of each risk factor that was evaluated.

2.5. Data Extraction and Management

A standardized, pre-piloted form (data extraction spreadsheets) was used to extract data from the included studies for assessment of study quality and evidence synthesis. The extracted information include baseline characteristics (age, and number of participants by gender), details of the disease (disease duration) control conditions, risk factor metrics, and for each primary outcome, the mean, standard deviation (SD), and the participant number (n) were recorded for both the control and intervention/disease groups.

2.6. Assessment of Risk of Bias

All included studies located were assessed for risk of bias by two of the authors according to the criteria suggested in the Cochrane guidelines as outlined in the Cochrane Handbook for Systematic Reviews of clinical disease subjects. Each included article was reviewed, and the risk of bias assessment procedure was conducted and recorded using the Cochrane risk of bias (ROBINS-I ) tool, which is relevant to clinical subjects. For the articles that are indicated as having high-risk of bias, a sensitivity analysis will be performed and the results of the estimate in the presence and absence of these studies will be considered.

2.6.1. Assessment of Reporting Biases

Assessing publication bias involves examining whether there is a systematic difference between published studies and unpublished studies that have the same research question. One commonly used method for assessing publication bias is by using funnel plots, which visually display the relationship between effect size estimates and study precision. If there is no publication bias, the studies will be evenly distributed around the overall effect size estimate, forming a symmetrical funnel shape, while if there is publication bias, studies with larger effect sizes or smaller standard errors may be more likely to be published, resulting in an asymmetrical funnel plot.

2.7. Data Synthesis and Measures of Treatment Effect Size

The results were synthesized using both a narrative approach and quantitative meta-analysis and presented in the results and interpreted in the discussion sections. For the quantitative meta-analysis, RevMan 5.4 version software was utilized to conduct the analysis. Since all the evaluated primary outcomes consisted of continuous data, a standardized mean difference (SMD) was calculated. As heterogeneity was expected among the effect sizes in the included studies, a random-effects model was employed, and a forest plot was produced to display the results. The random-effects model is often preferred over the fixed-effects model in the presence of heterogeneity, as it considers the variability in effect sizes across studies, providing a more cautious estimate of the true effect size. The data was not converted to the same unit because it will increase the standard deviation from the mean but tabulated separately into subgroups when the data was reported in different units. Different units of analysis were included if the minimum individual participant number exceeded 10. Missing data was requested from the authors up to two times. If there was no response from the authors, the study was excluded from the analysis. Two reviewers extracted the data independently, and any discrepancy identified was resolved through discussion with the third author where necessary. Data were tabulated in an excel spreadsheet that compared the healthy control group compared with the T1D group that met the eligibility criteria.

2.8. Assessment of Heterogeneity

Assessing heterogeneity is an important step in meta-analysis and can be done using various methods, such as visual inspection of forest plots, Q statistic, and the I-squared statistic (I2). Forest plot is a graphical representation of the effect sizes and confidence intervals of each included study in the meta-analysis. I2 metric is another measure of the proportion of variability in effect sizes across studies due to heterogeneity. I2 value between 0% to 25% indicates low heterogeneity, while a value greater than 50% suggests high heterogeneity.

2.8.1. Subgroup Analysis and Investigation of Heterogeneity

Subgroup analysis is important when there is significant heterogeneity in the overall results. Subgroup analysis was only conducted when there are more than 10 participants in any set of given studies where different units of measurement have been used.

2.8.2. Sensitivity Analysis

A sensitivity analysis is a repeat of the primary analysis of the meta-analysis to assess the robustness of the overall results and to investigate the effect of alternative decisions or ranges of values for decisions that were arbitrary or unclear. Sensitivity analysis was performed to identify and assess the impact of risk of bias across studies, outliers, and missing data across studies, where necessary. Four studies which had an effect size of 0.00 were removed from the forest plot on SBP (given on the right). It changed the original SMD of 0.41 at a 95% confidence interval (0.29, 0.53) to a more robust SMD of 0.45 (0.33, 0.57).

3. Results

3.1. Description of Included Studies

3.1.1. The Included Studies Comprised of 80 Relevant Research Articles

A total of 5293 healthy control subjects and 7492 patients diagnosed with T1D were included in this review. The mean age of the healthy control was 19.7+8.23 years and 20.03+8.49 years in the T1D group. In the healthy control cohort, 46.3% were males and 53.7% were females. In the T1D cohort, 49.8% were males and 50.2% were females. These data confirm that age and sex-matched participants had been recruited in all the included studies. The mean disease duration in the T1D group was 9.1+5.11 years. The minimum disease duration in this study cohort was 1.07 years and the maximum disease duration was 23.5 years. The disease duration at the 95th percentile is 17.5 years, which is a 23.1 % increase from the mean disease duration. A total of 1739 studies were retrieved from the PubMed (n=81), Web of Science (n=728), and Google Scholar (n=930) databases out of which duplicates (n=21), not having healthy control (n=150), book chapters (n=39), animal studies (n=317), in vitro studies (n=18), age >40 years (n=72), published before the year 2013 (n=32), and reporting incompatible and irrelevant research data (n=236) were removed. The final number of studies included after screening was 80 and their basic characteristics are described in Table 1.

3.2. Results of the Search

The methods used to display the results of individual studies are the forest plot, bar graph of the student-t test, estimation plot, a heatmap comparing the results against the accepted standards introduced from recognized world bodies such as the world health organization (WHO) or the American Heart Association (AHA).

3.2.1. The Blood Pressure Makes a Moderate Impact on the T1D-Induced ED
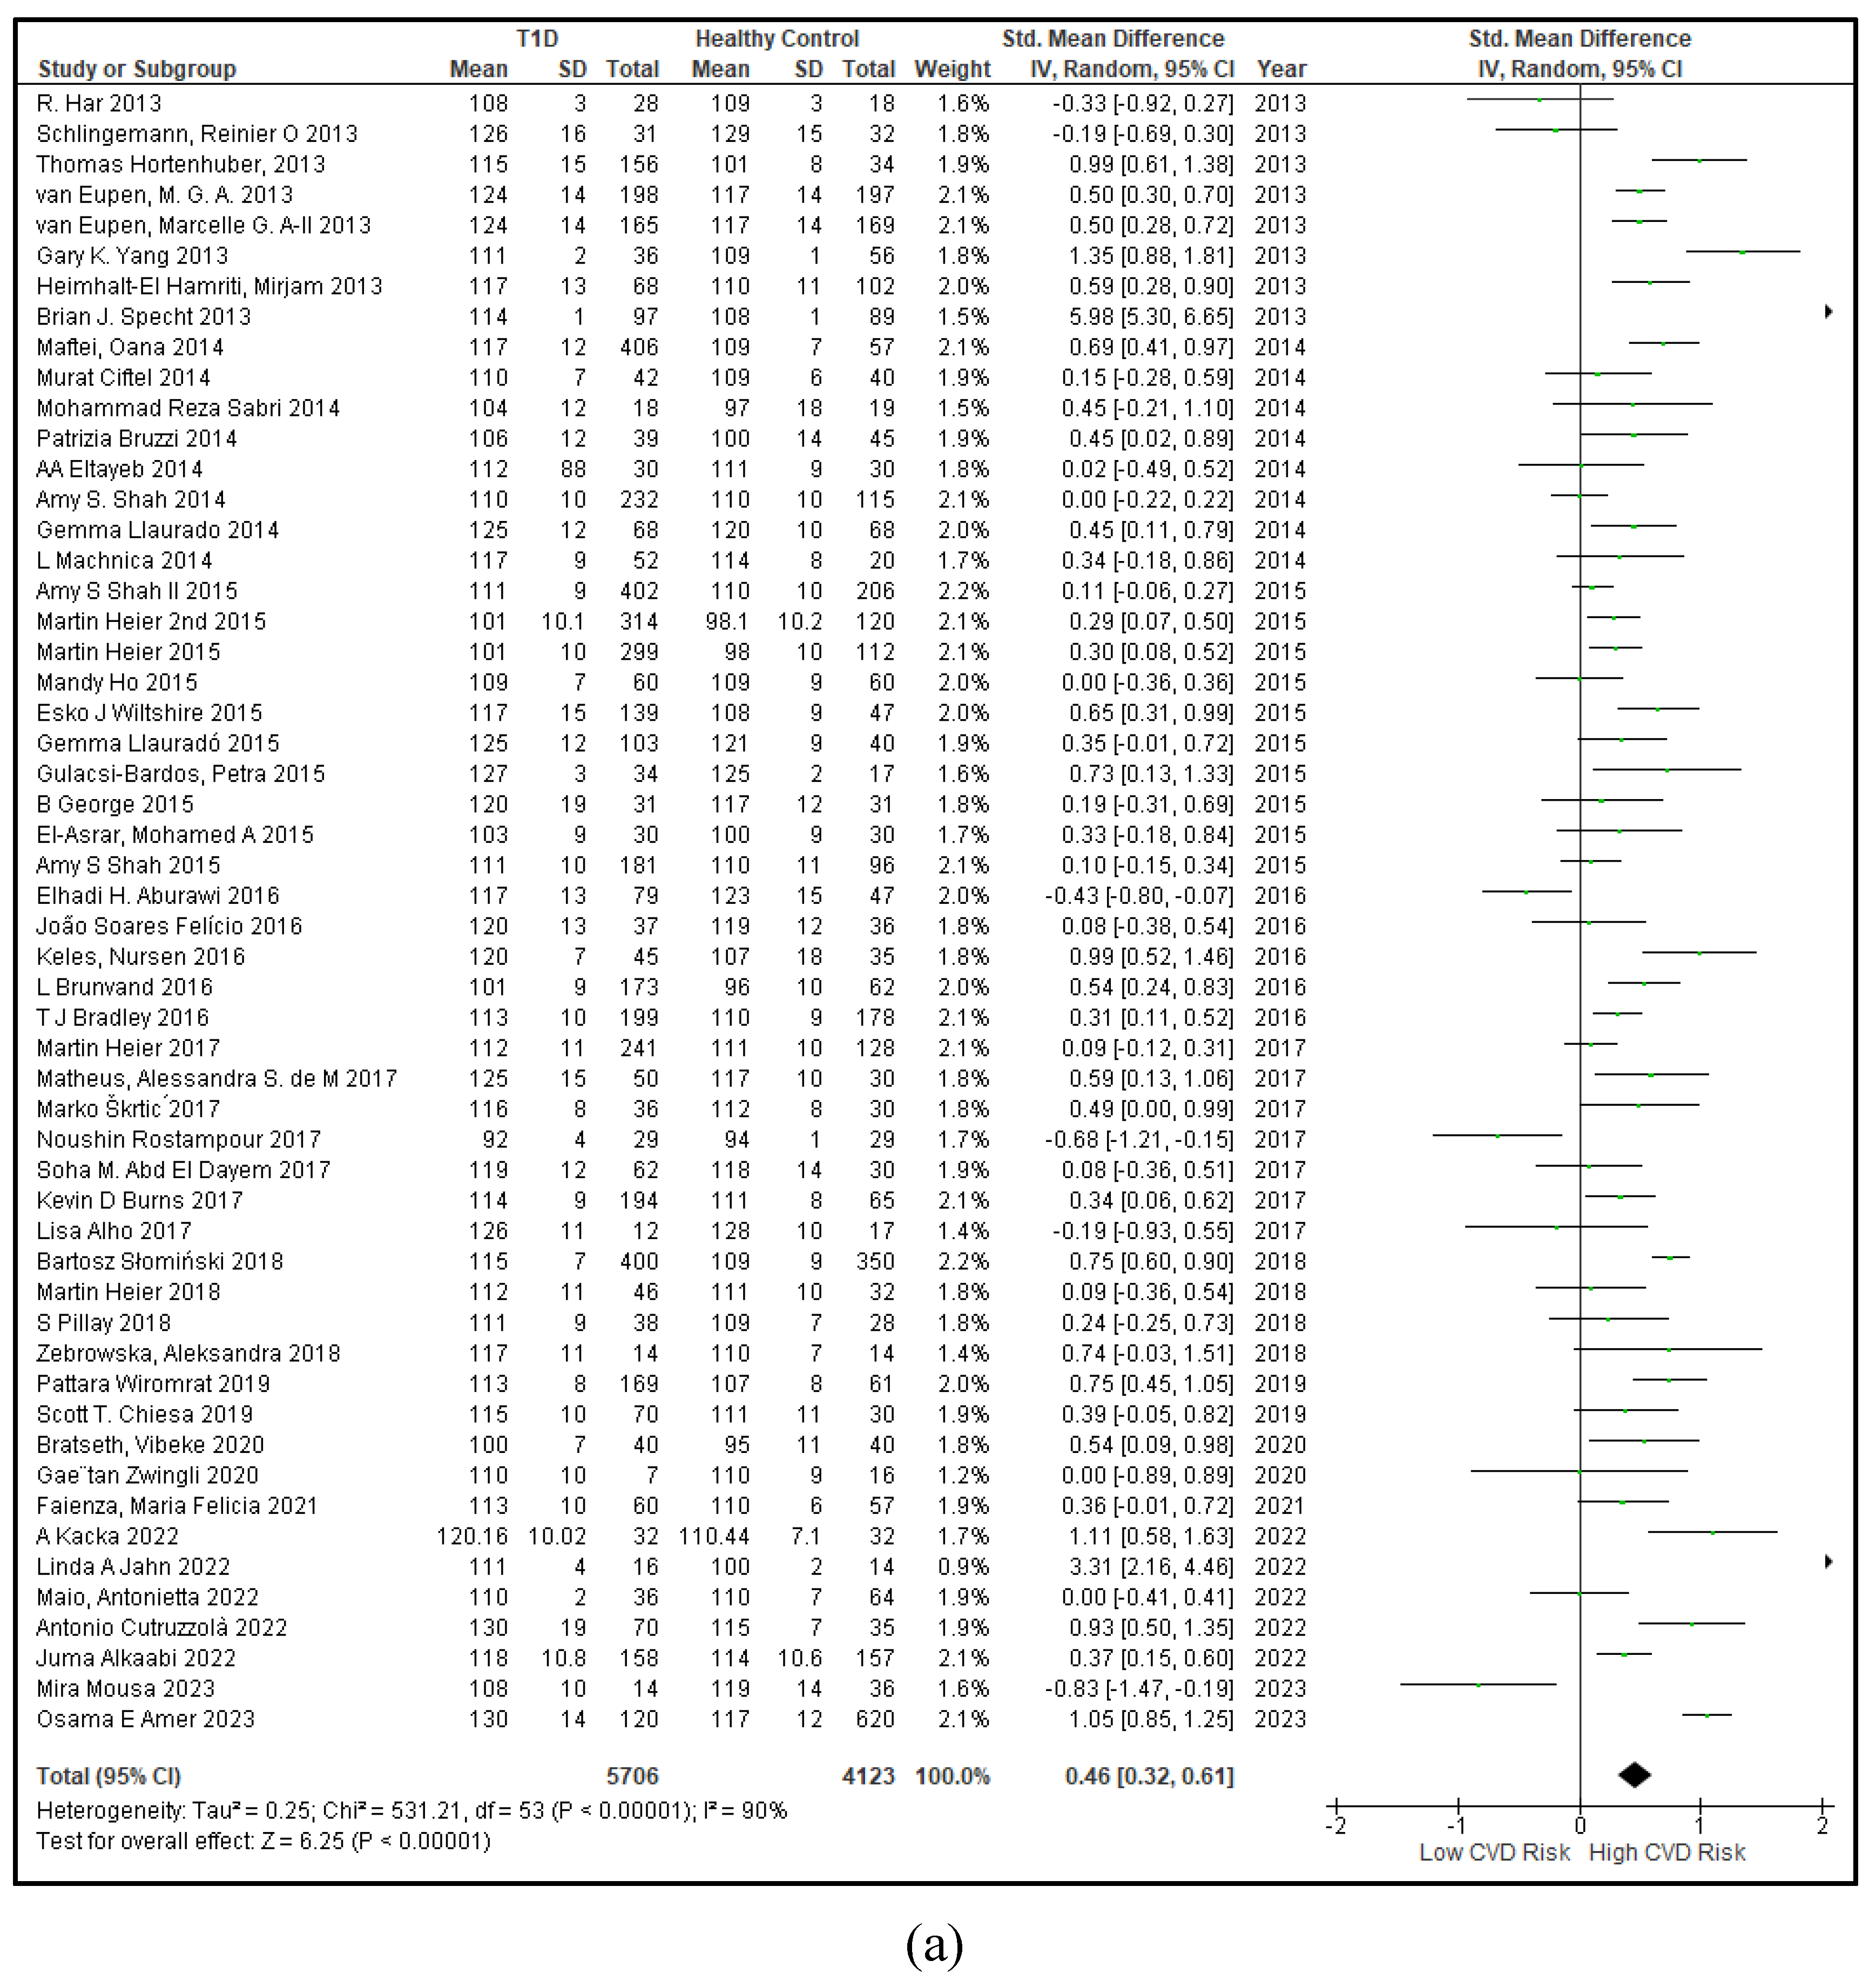
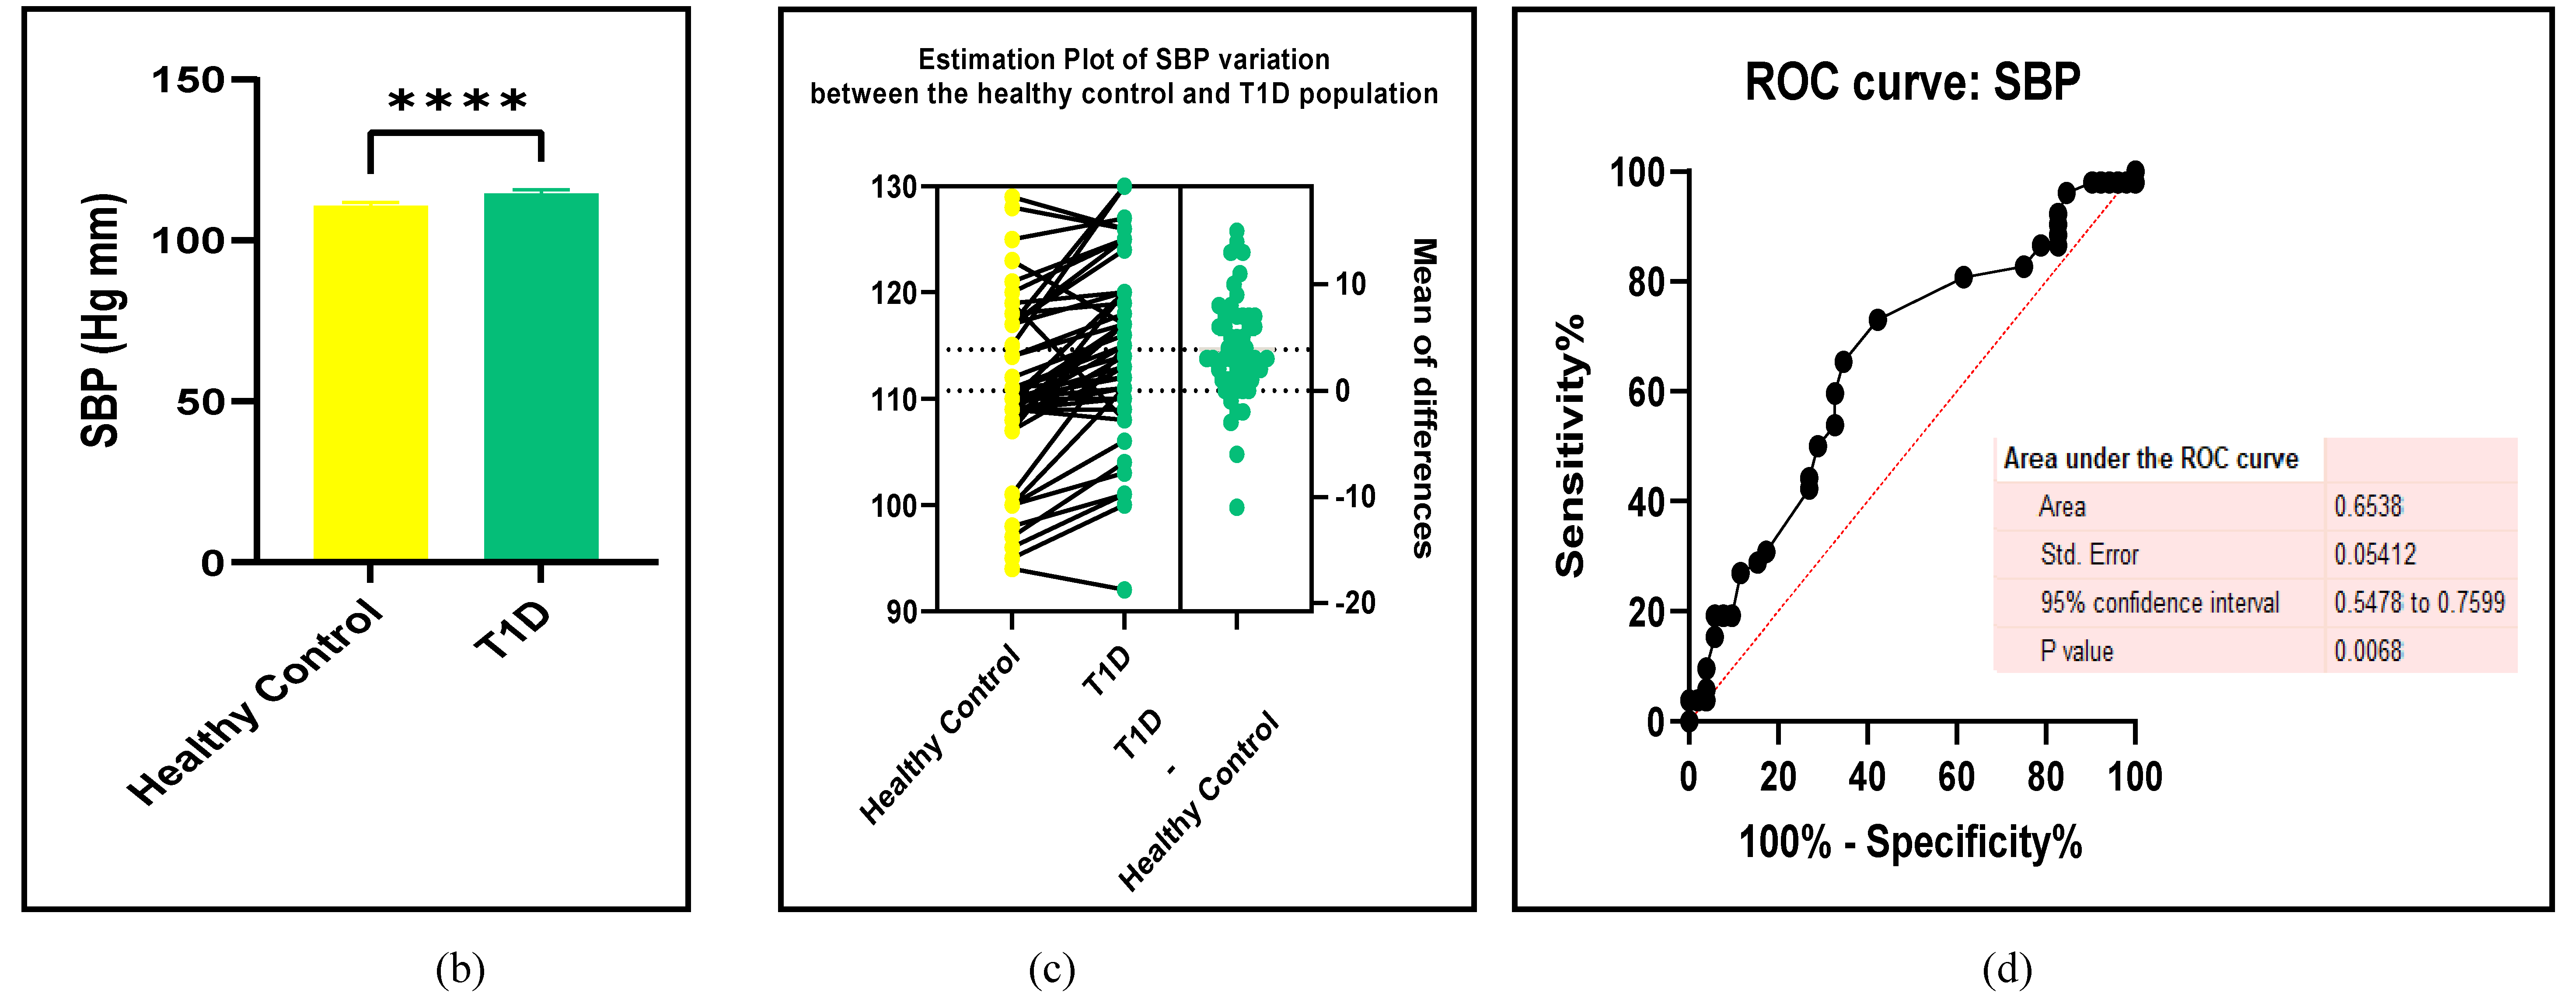
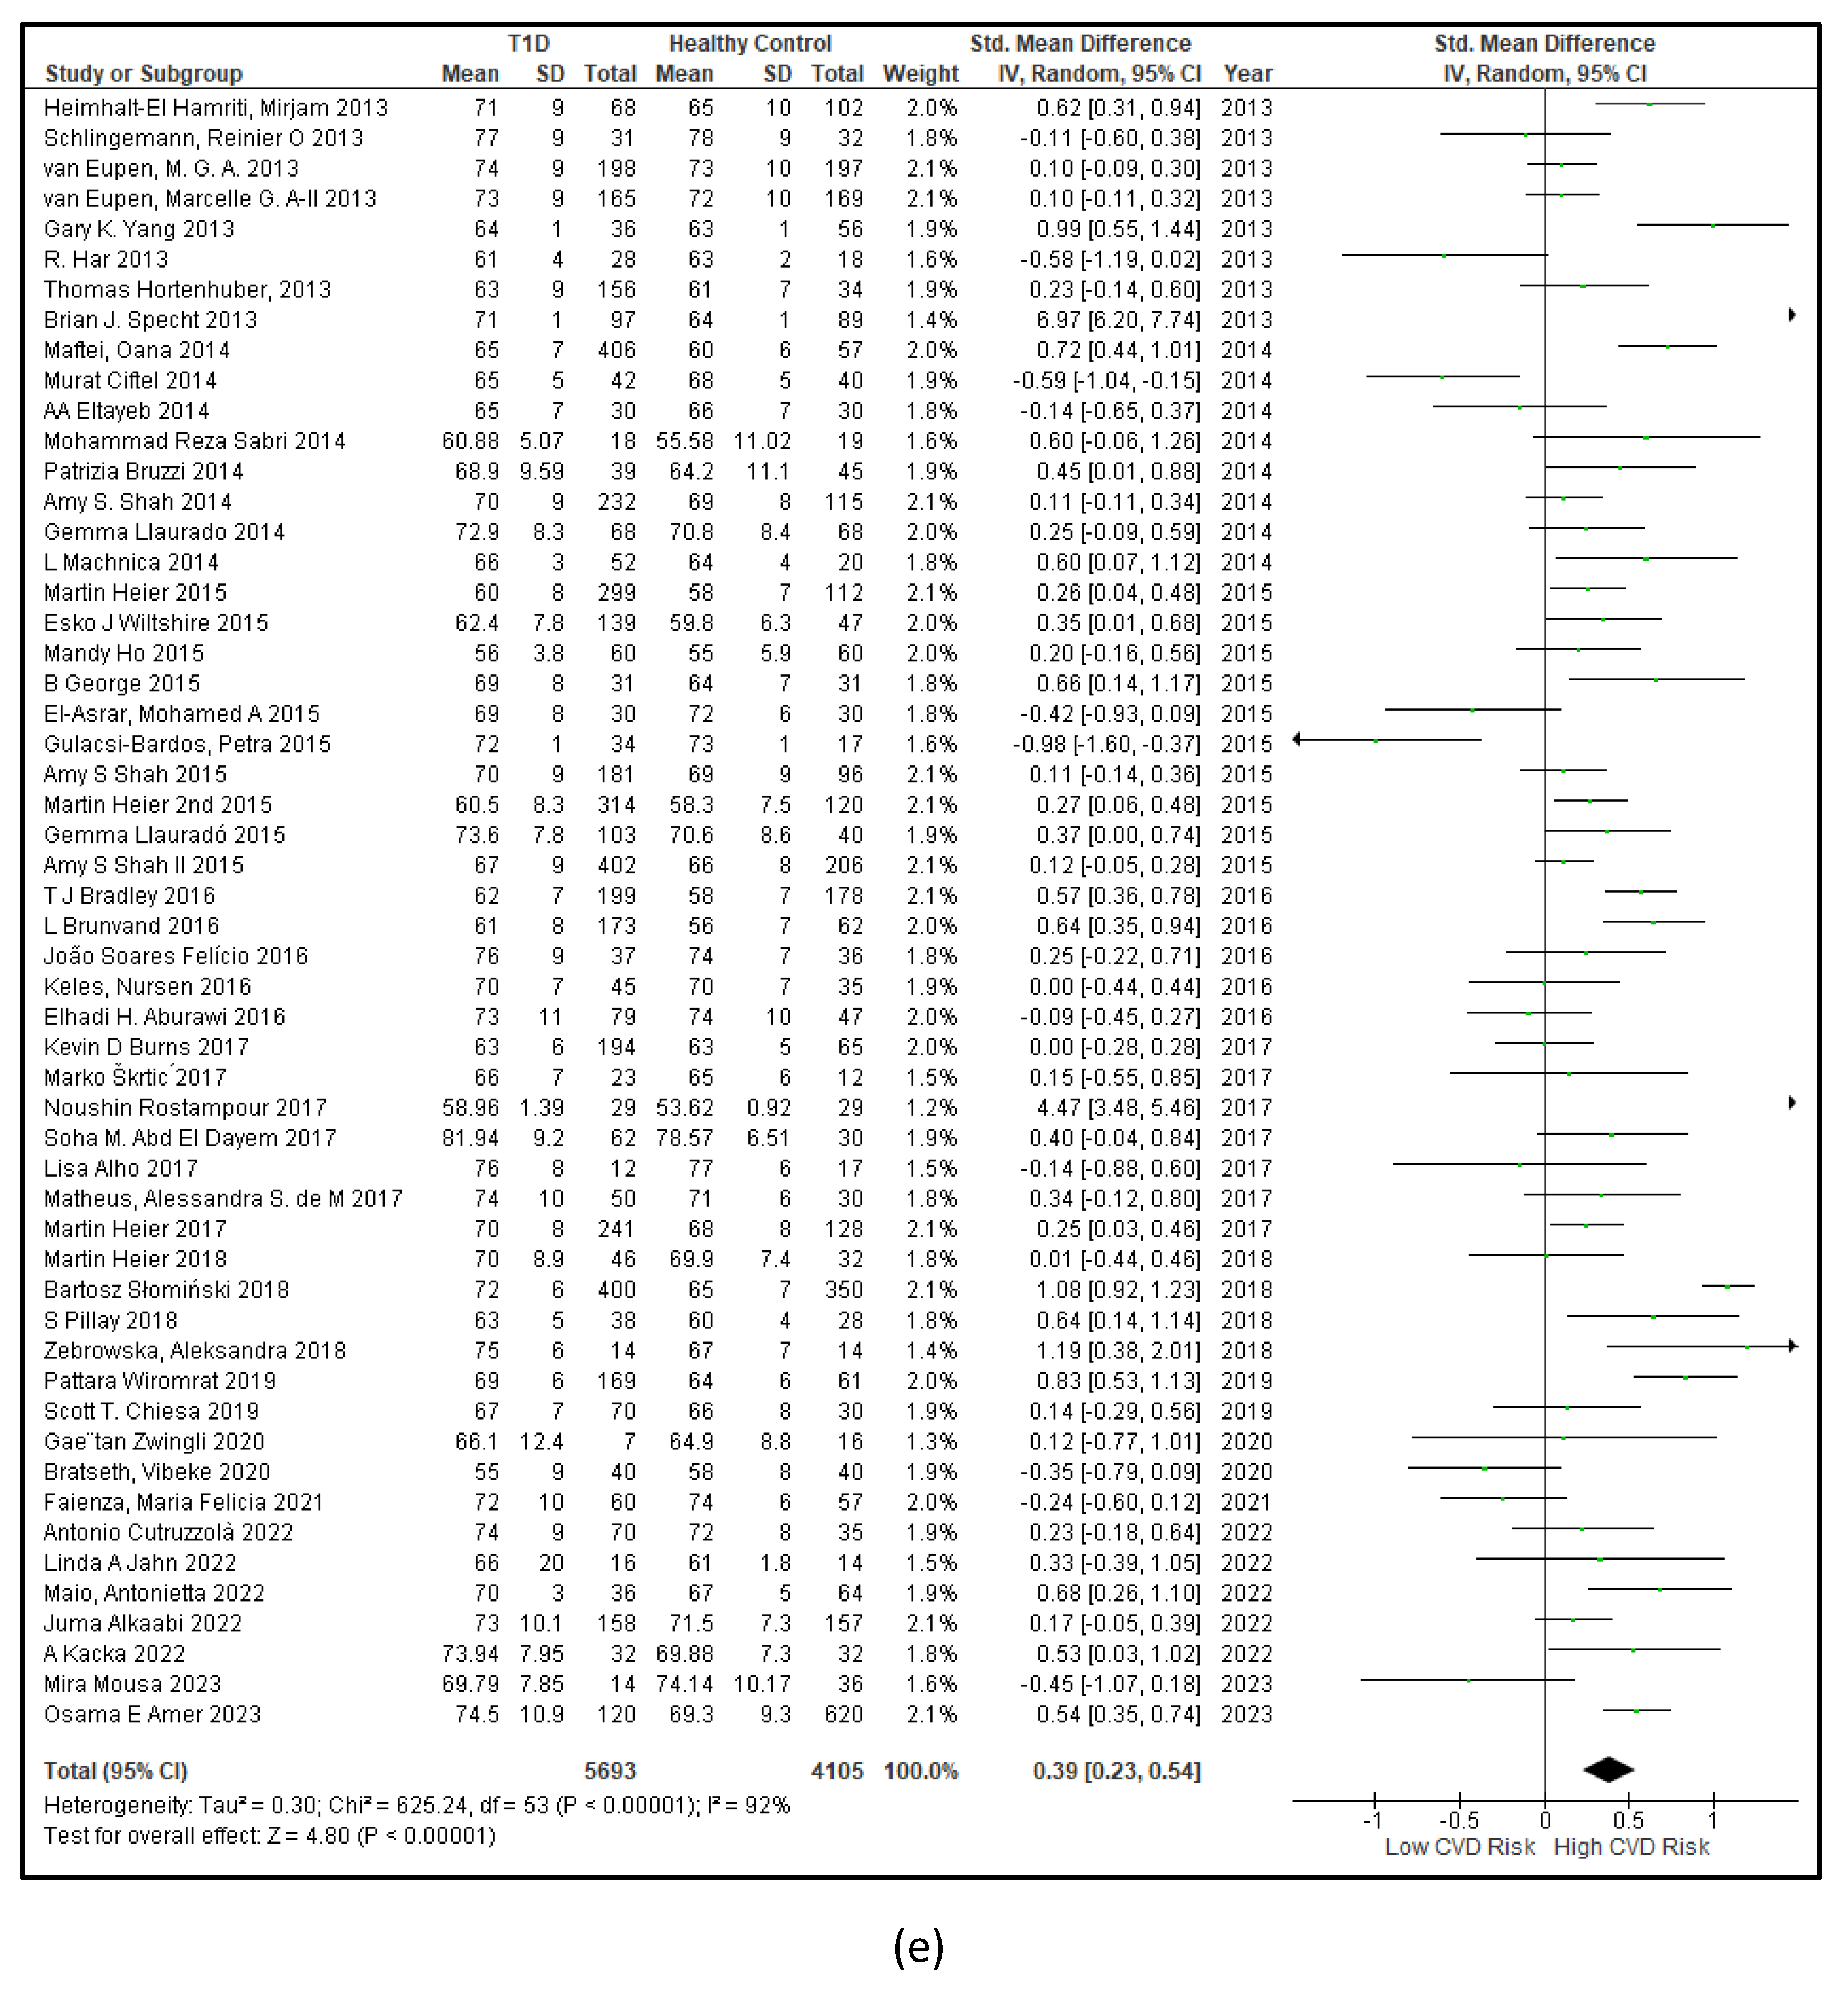
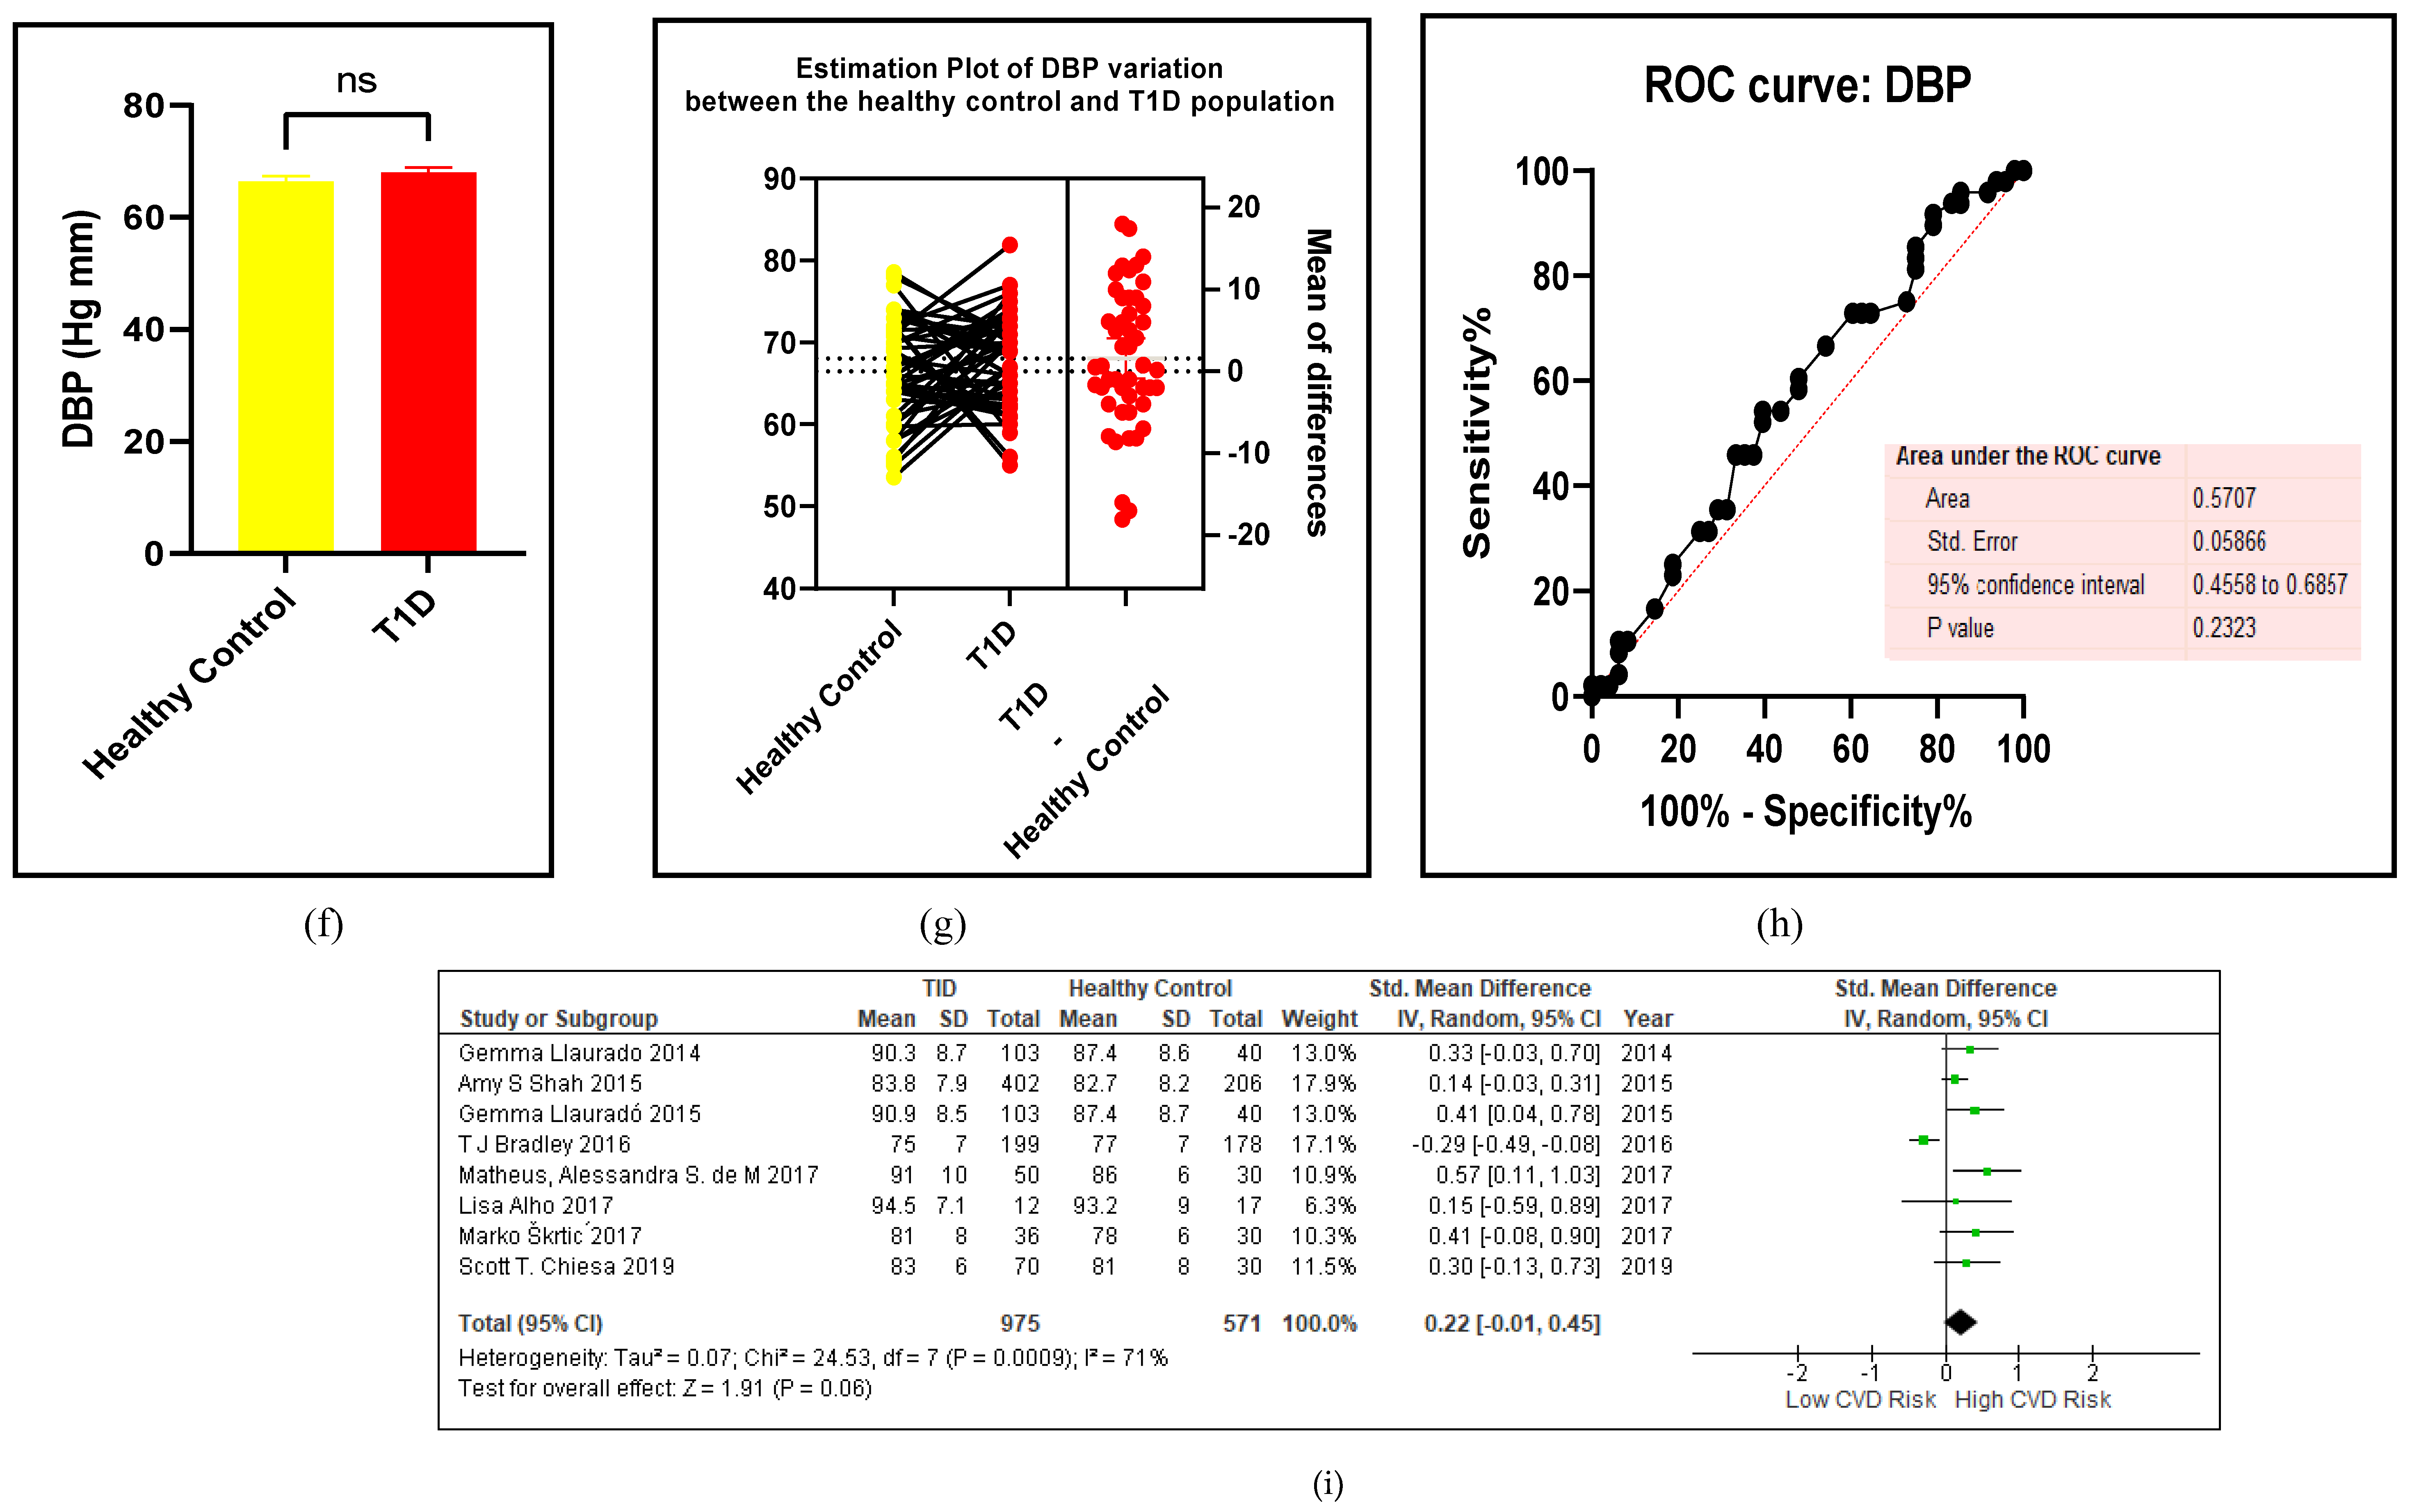
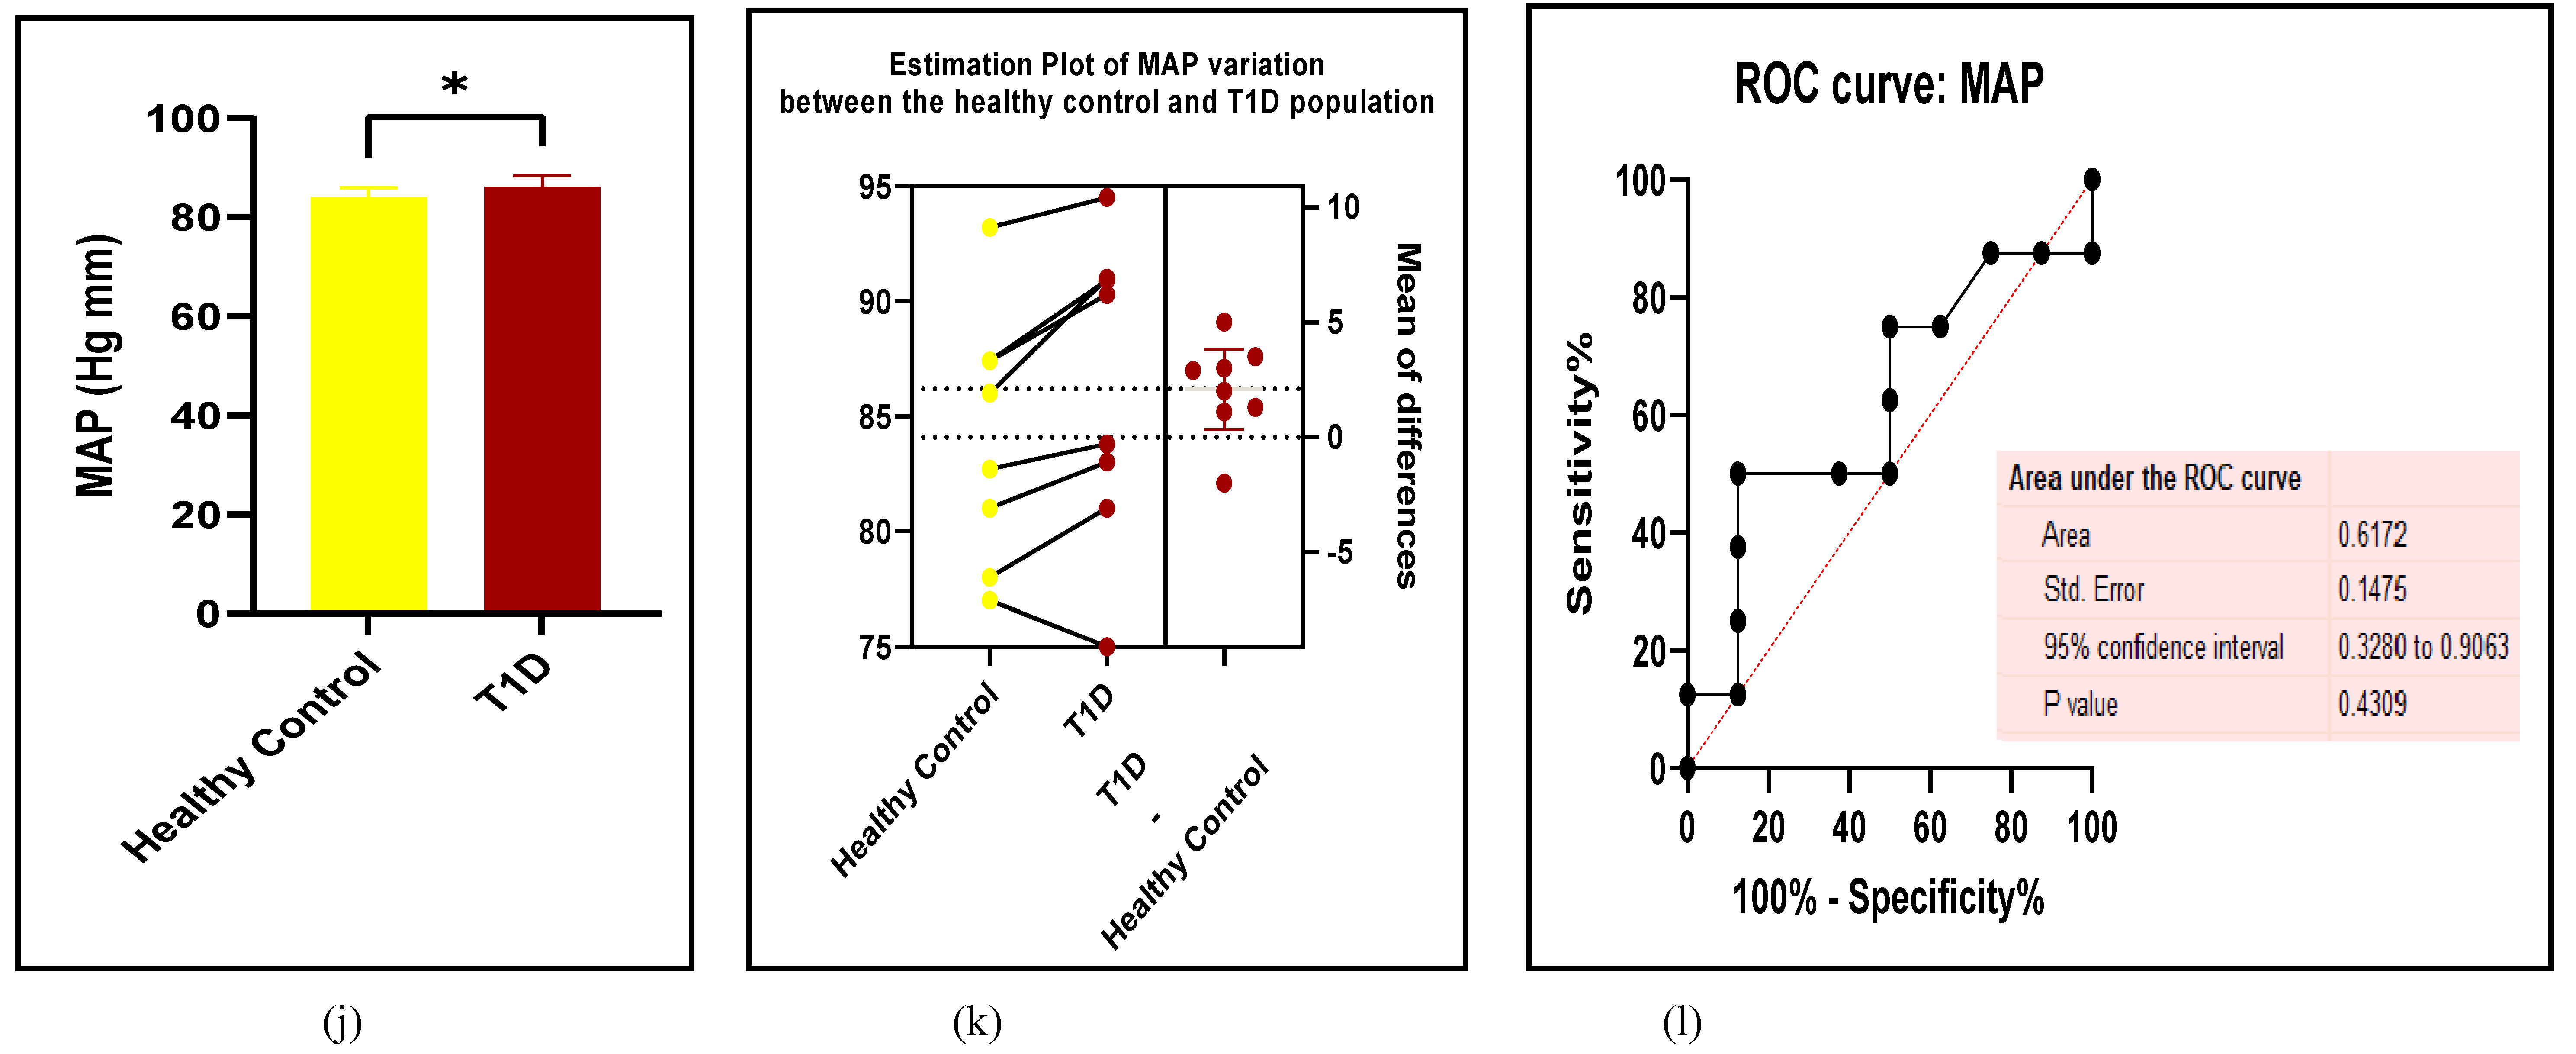
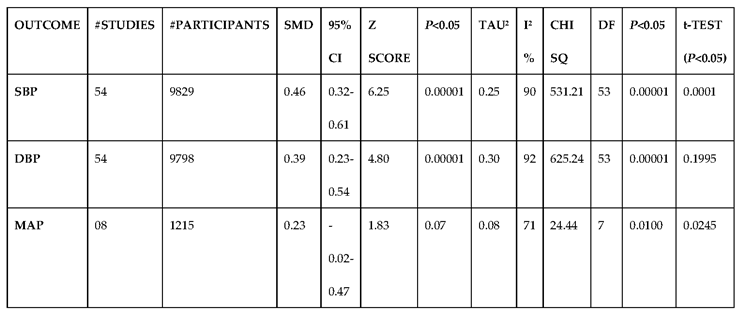
High blood pressure is a traditional risk factor of T1D-induced endothelial deregulation which causes vascular dysfunction[101] . Hypertension could arise from impaired angiotensin II enzyme activity that leads to vasoconstriction via the type 1 receptor (AT1R) blockage, low bioavailability of NO which is required for endothelium-dependent relaxation and arterial occlusion from plaque buildup that leads to both macrovascular and microvascular complication s [101]. The findings of this study are given in Figure 3a-l and Table 2.
Figure 3. (a-l): Assessments of BP between the T1D and HC. (a) forest plot of SBP (b) paired t-test bar graph of SBP, (c) EP of SBP, ( d) the ROC curve for SBP, (e) forest plot of DBP (f) paired t-test bar graph of DBP, (g) EP of DBP, ( h) the ROC curve for DBP (i) forest plot of MAP (j) paired t-test bar graph of MAP, (k) EP of MAP, ( l) the ROC curve for MAP. Results are statistically significant at p < 0.05.
Preprints 105488 g003aPreprints 105488 g003bPreprints 105488 g003cPreprints 105488 g003dPreprints 105488 g003e

3.2.2. Glucose Metabolism Is the Best Diagnostic Biomarker for Confirming T1D-Induced ED
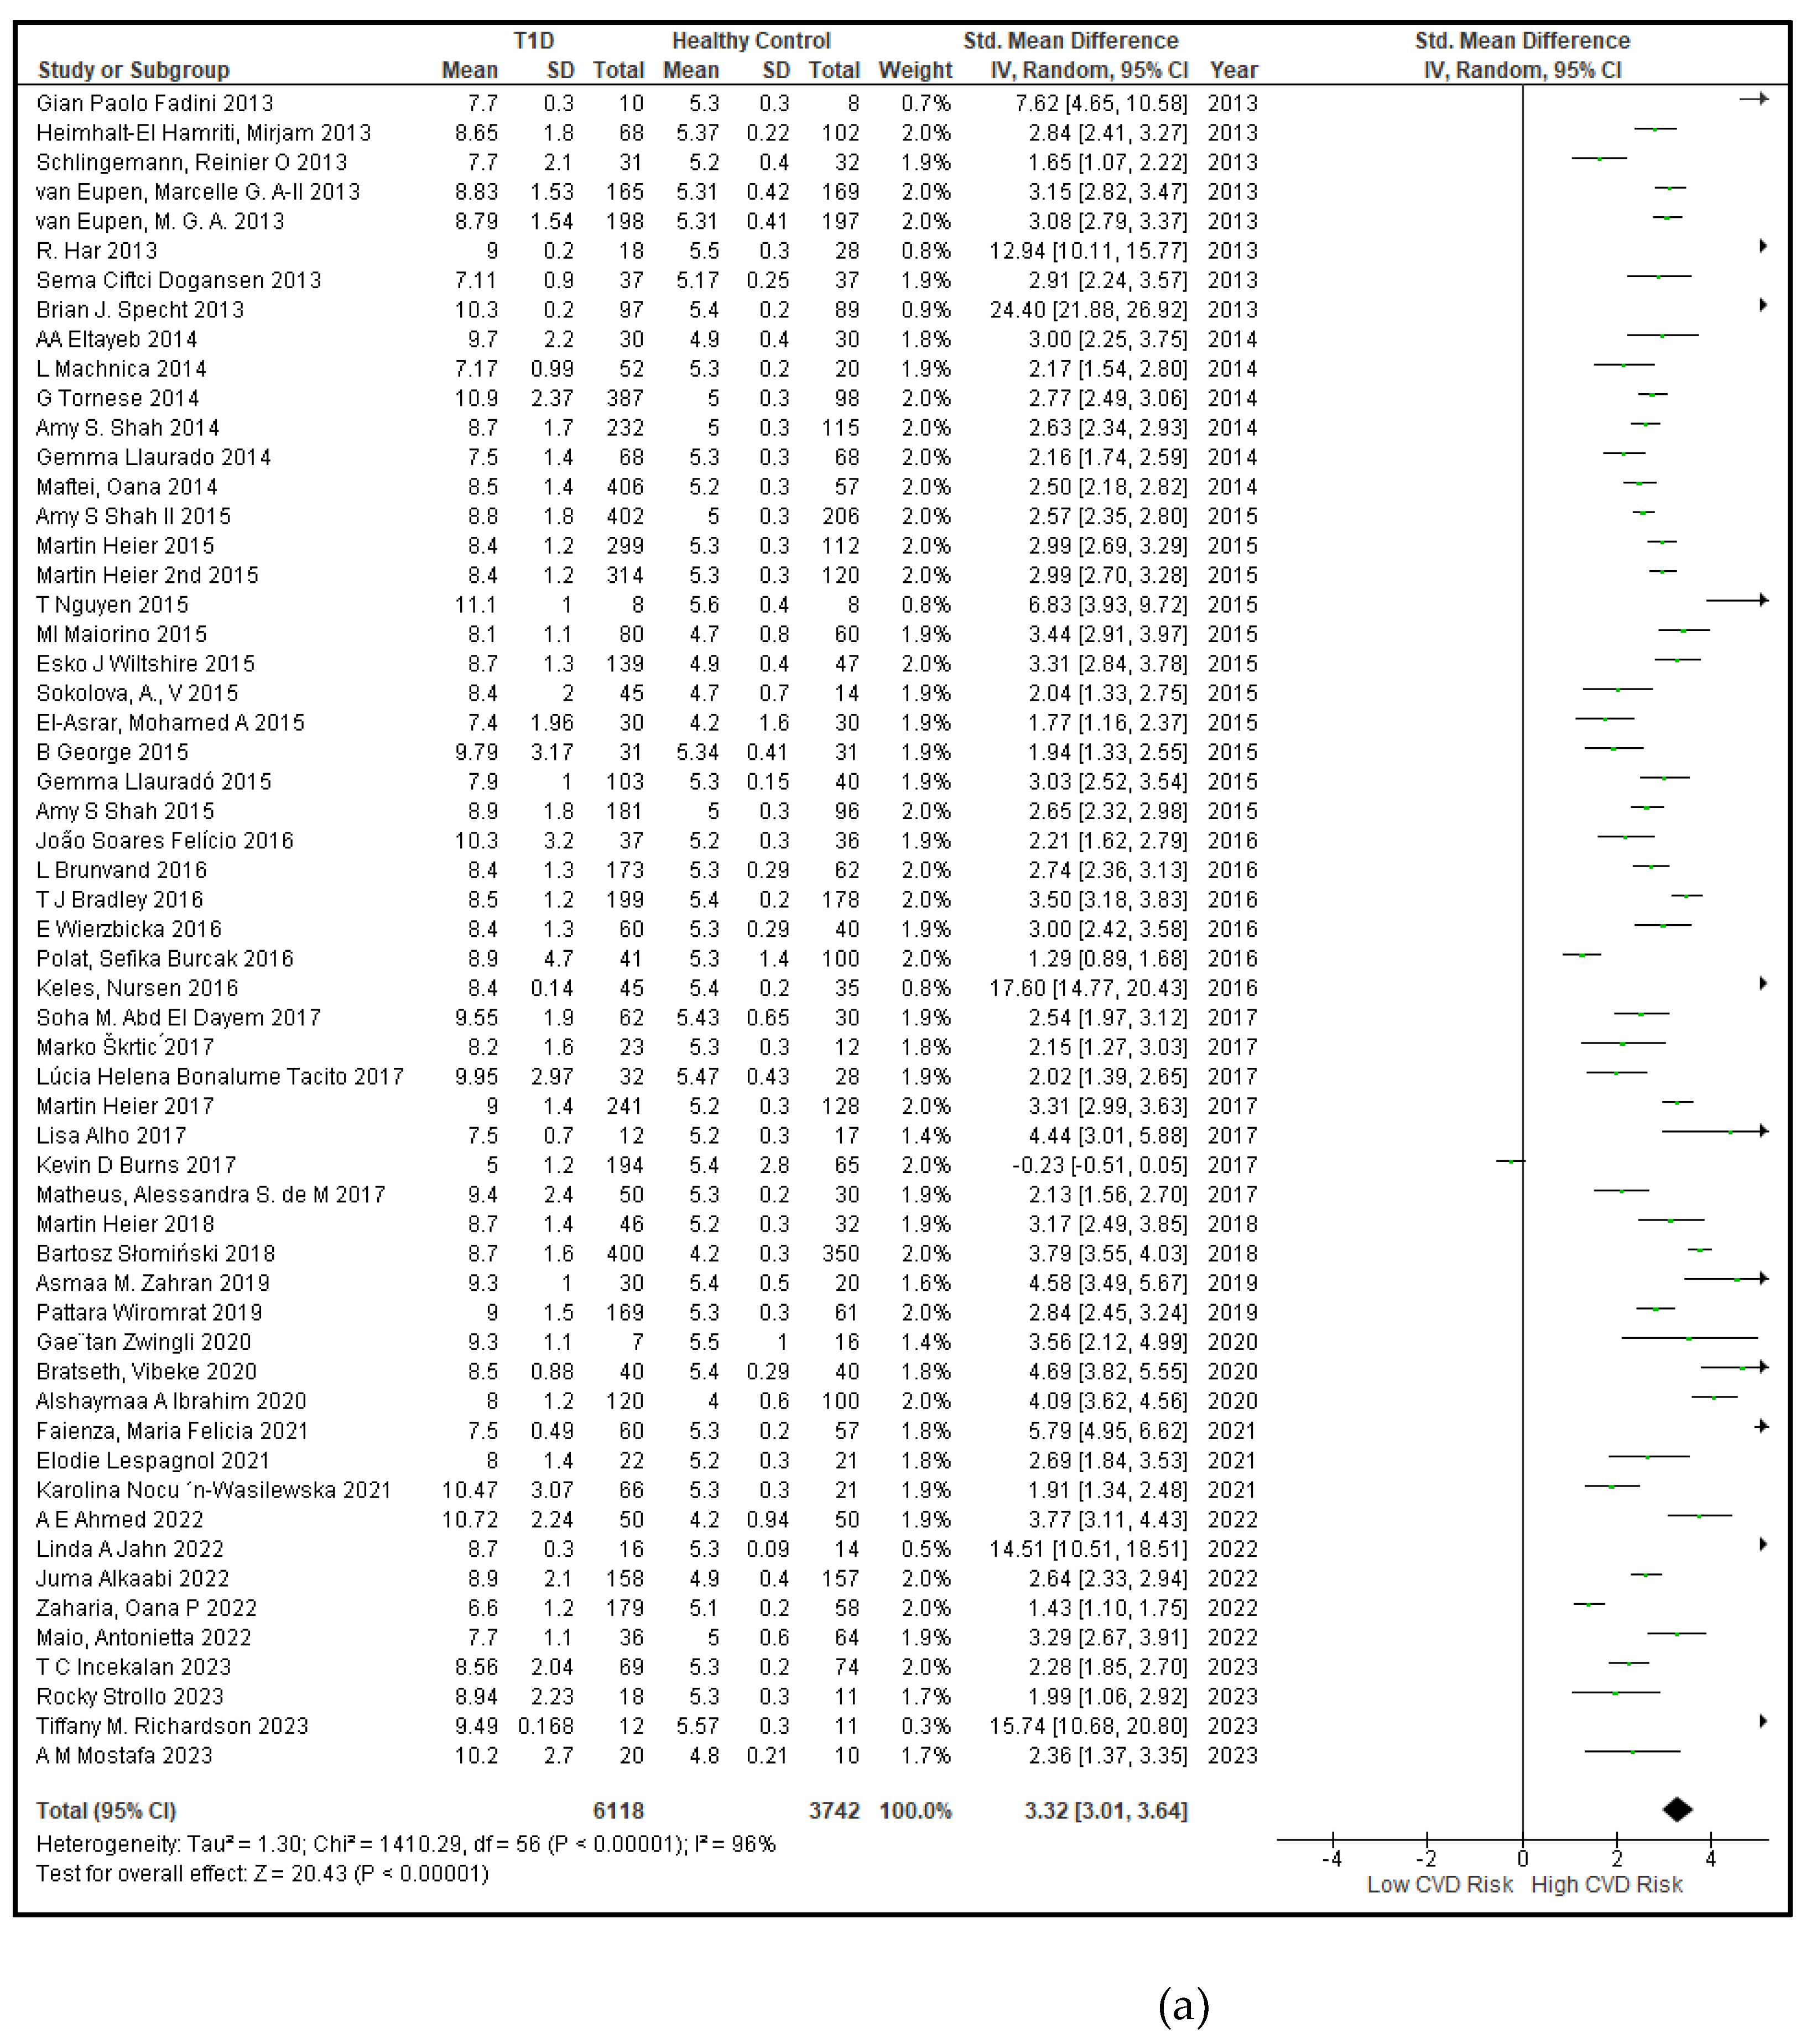
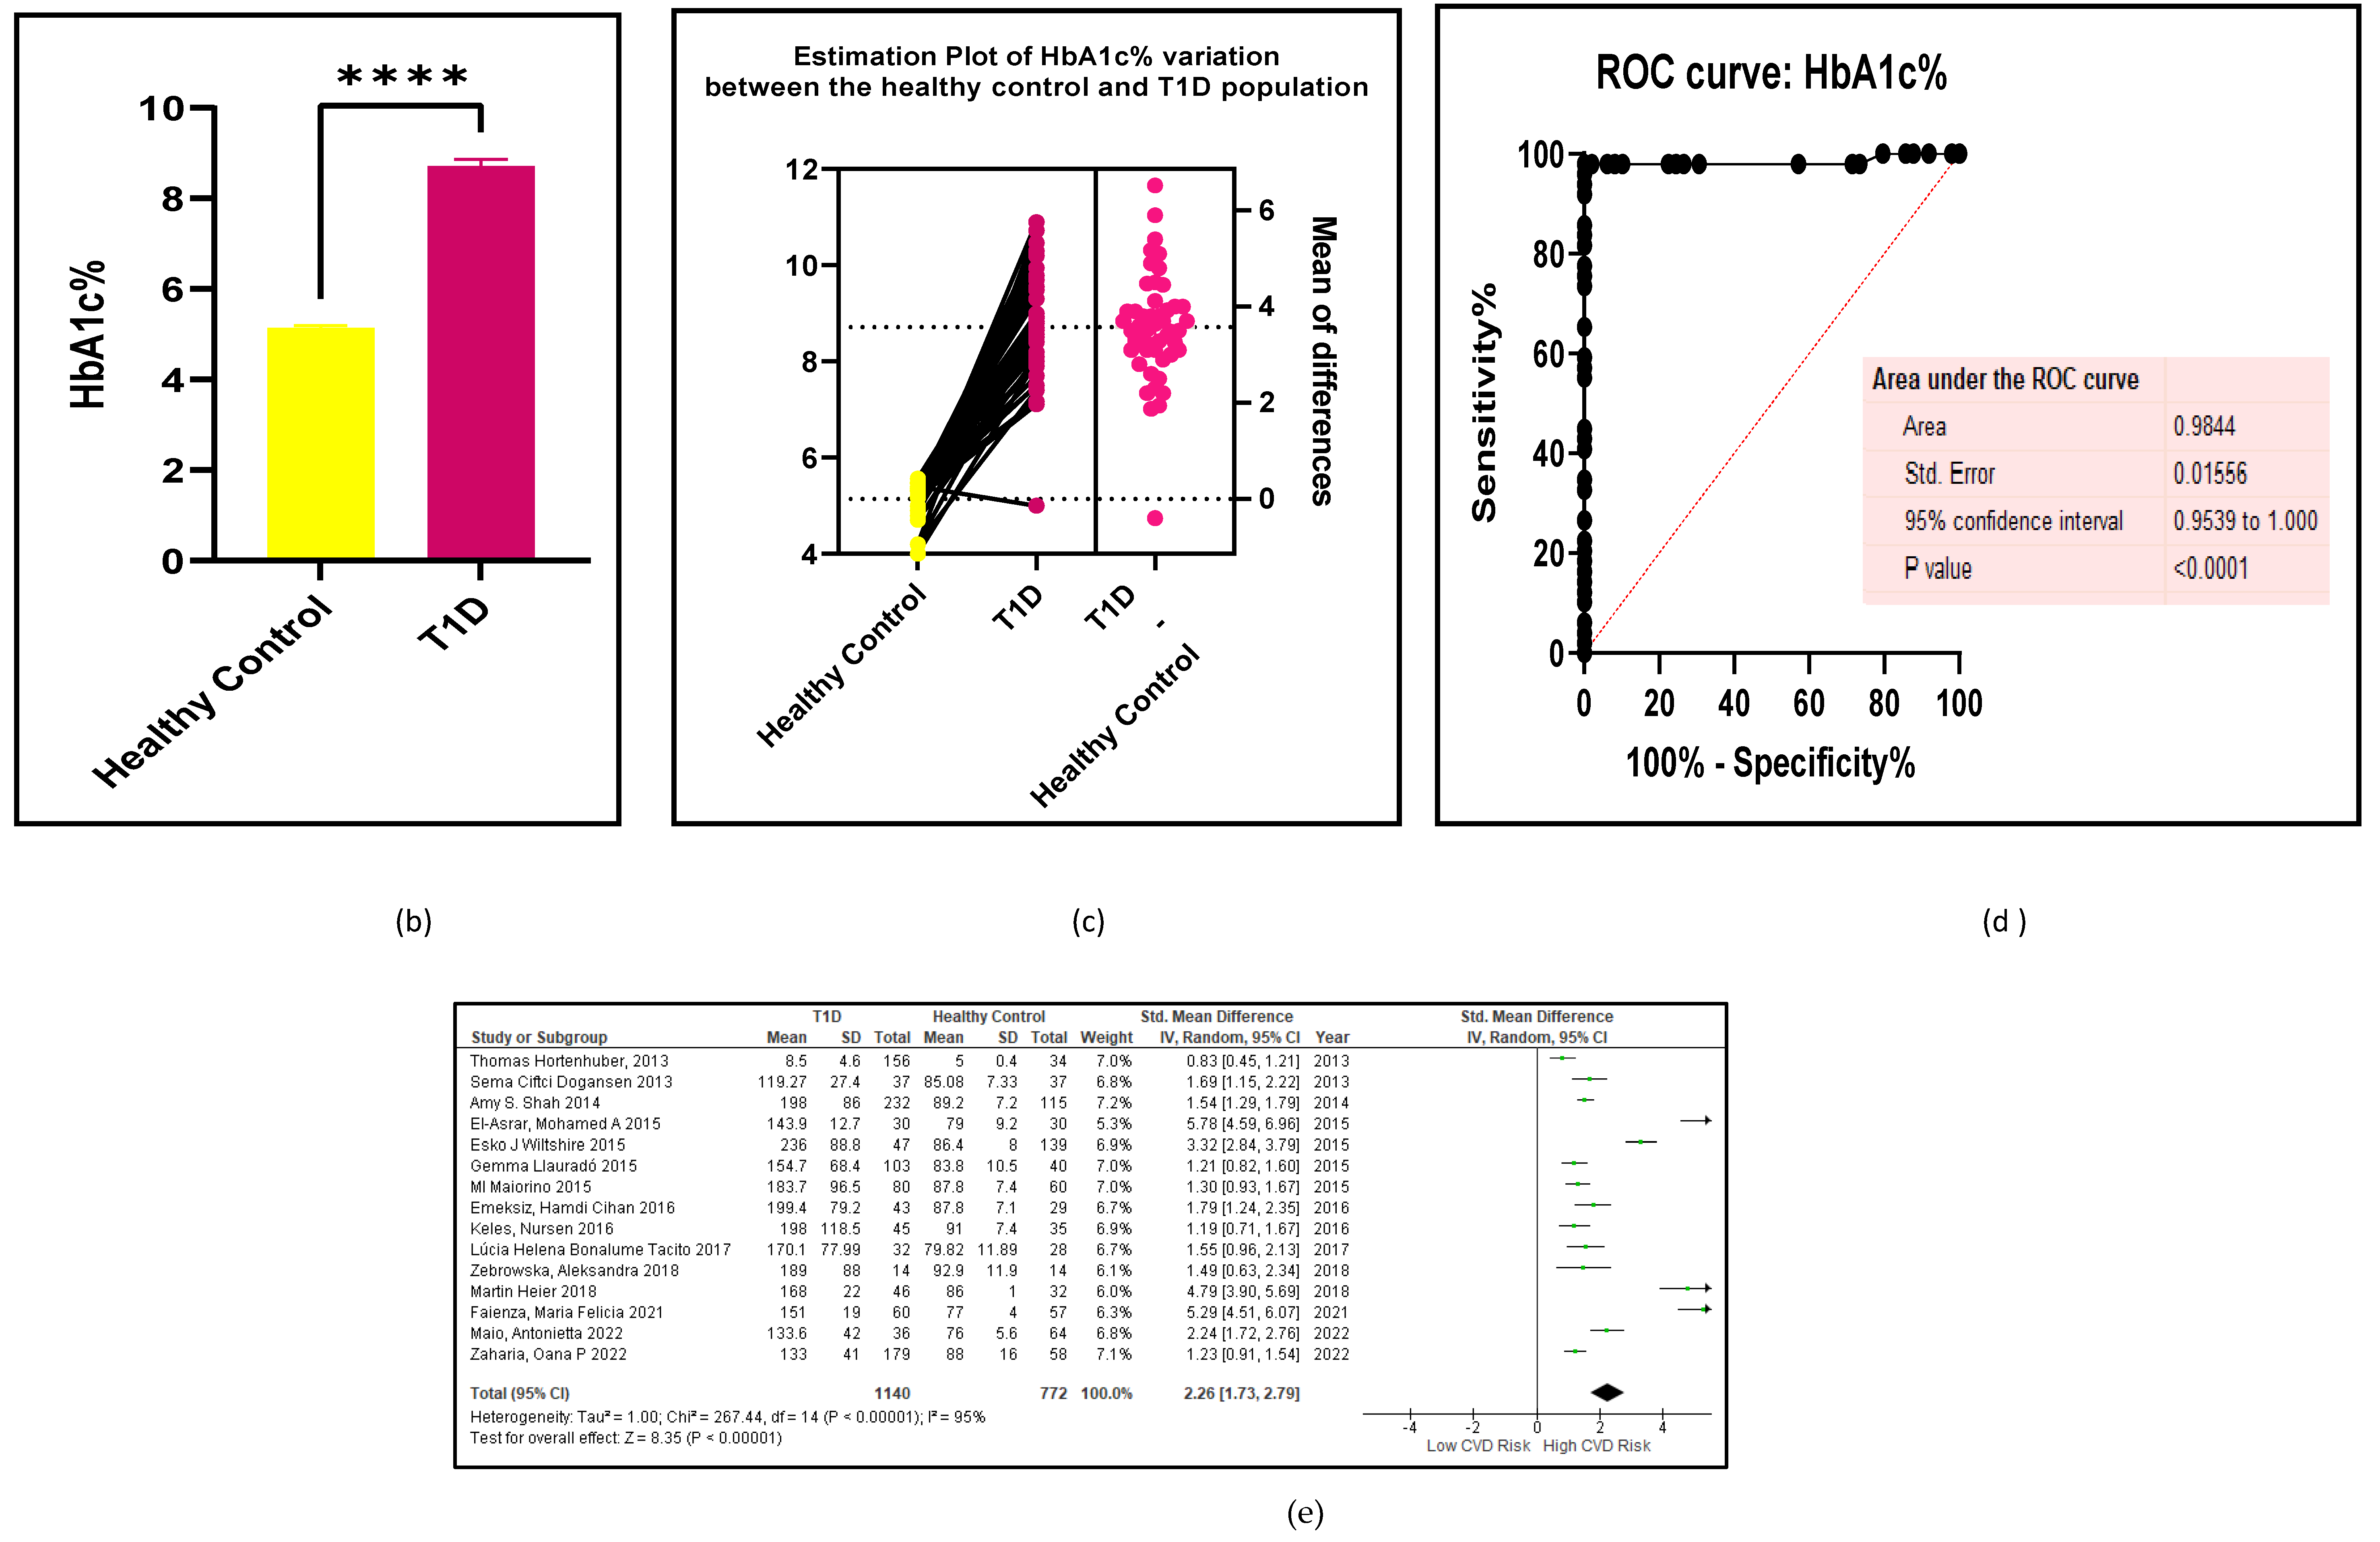
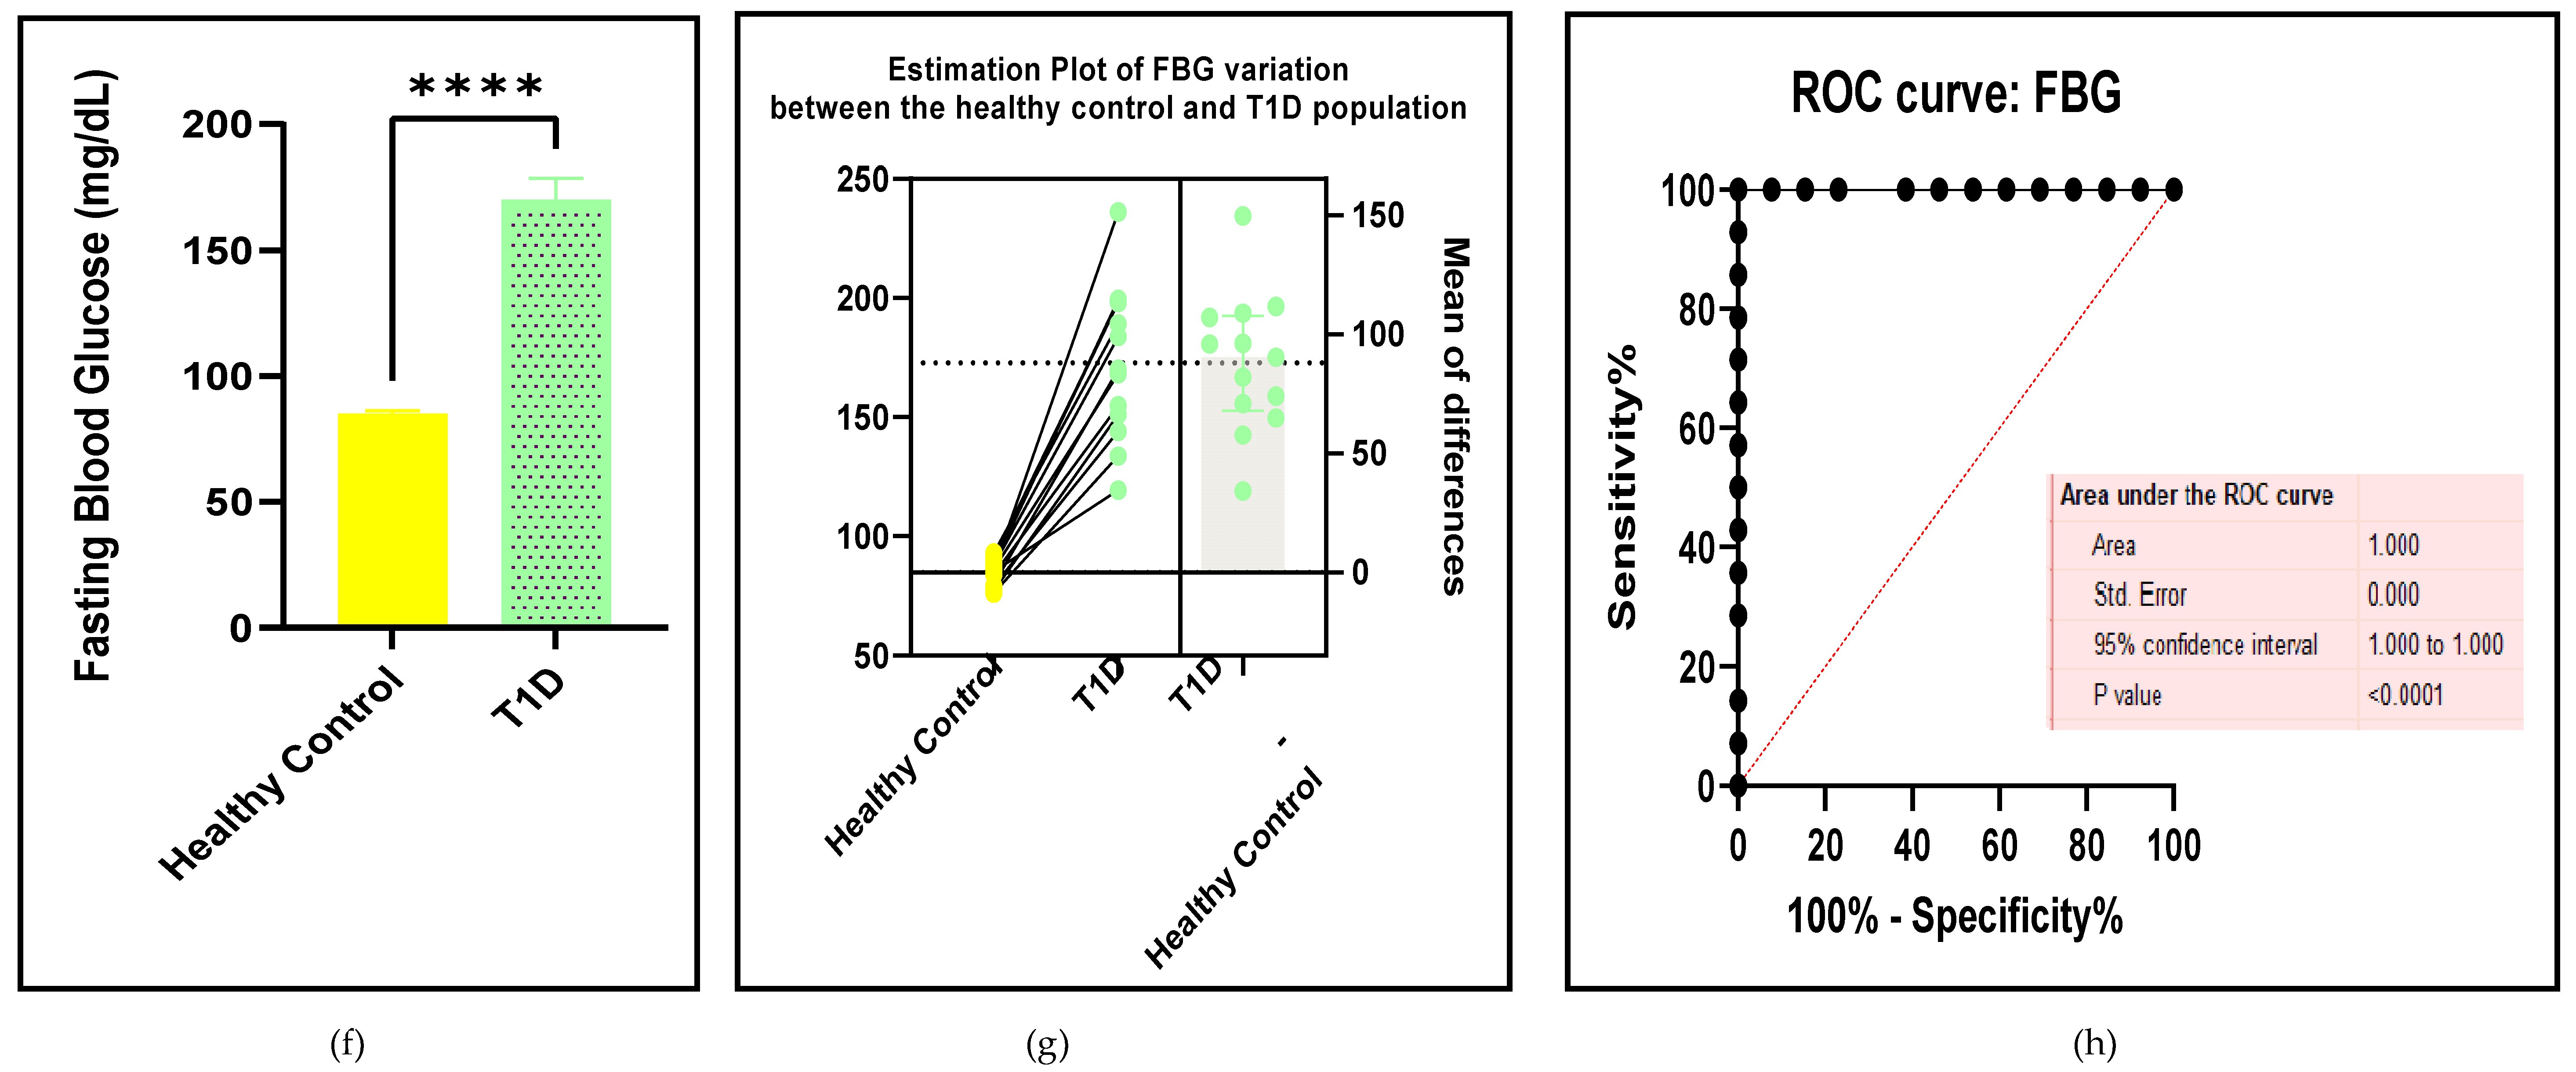
Hyperglycaemia is the most critical risk factor in T1D-induced endothelial or vascular deregulation [102]. The glycated haemoglobin percentage (HbA1c%) and fasting blood glucose (FBG) titres are the most reliable biomarker that indicate concurrently impaired glucose and insulin metabolism which is also confirmed by the results of this study (Figure 4a-h and Table 3).
Figure 4. (a-h): Assessments of the glycaemic status between the T1D and HC groups. (a) forest plot of HbA1c%, (b) paired student t-test bar graph of HbA1c%, ( c) EP of HbA1c%, (d) the ROC curve for HbA1c%, ( e) forest plot of FBG, (f) paired t-test bar graph of FBG, (g) EP of FBG, ( h) the ROC curve for FBG. Results are statistically significant at p < 0.05.
Preprints 105488 g004aPreprints 105488 g004bPreprints 105488 g004c

3.2.3. The Lipid Profile Remains as Traditional Biomarkers of T1D-Induced ED
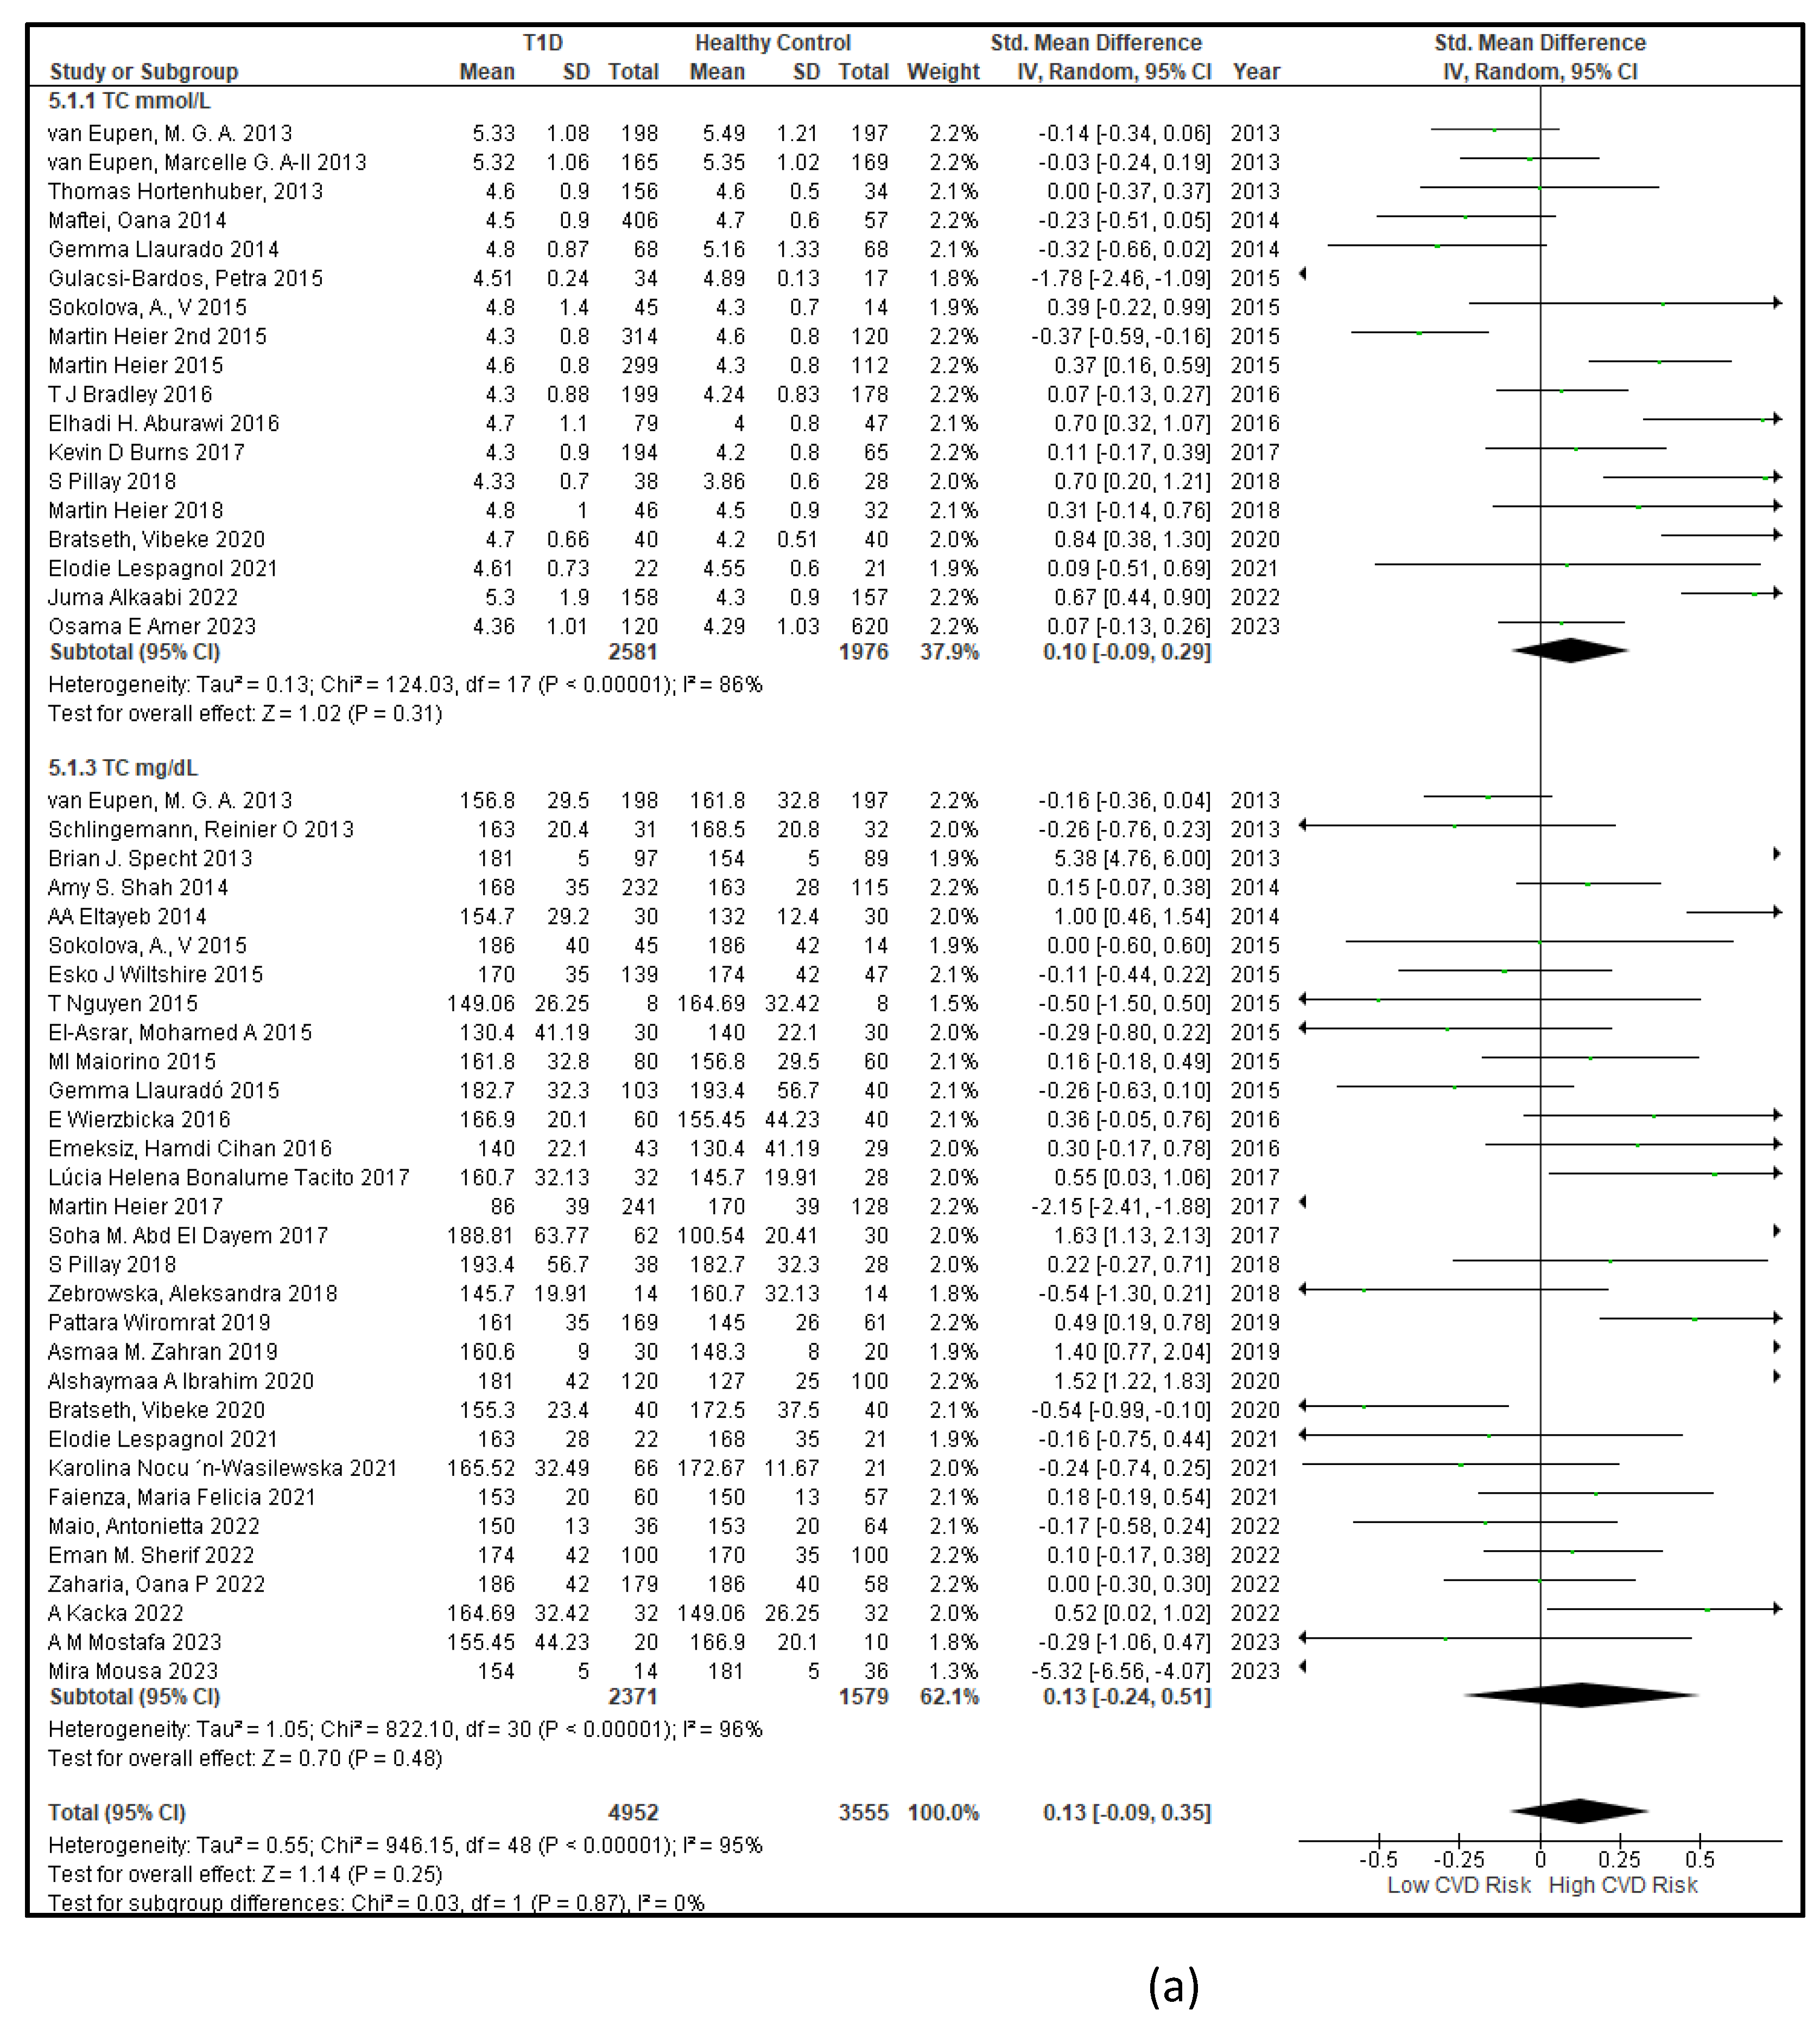
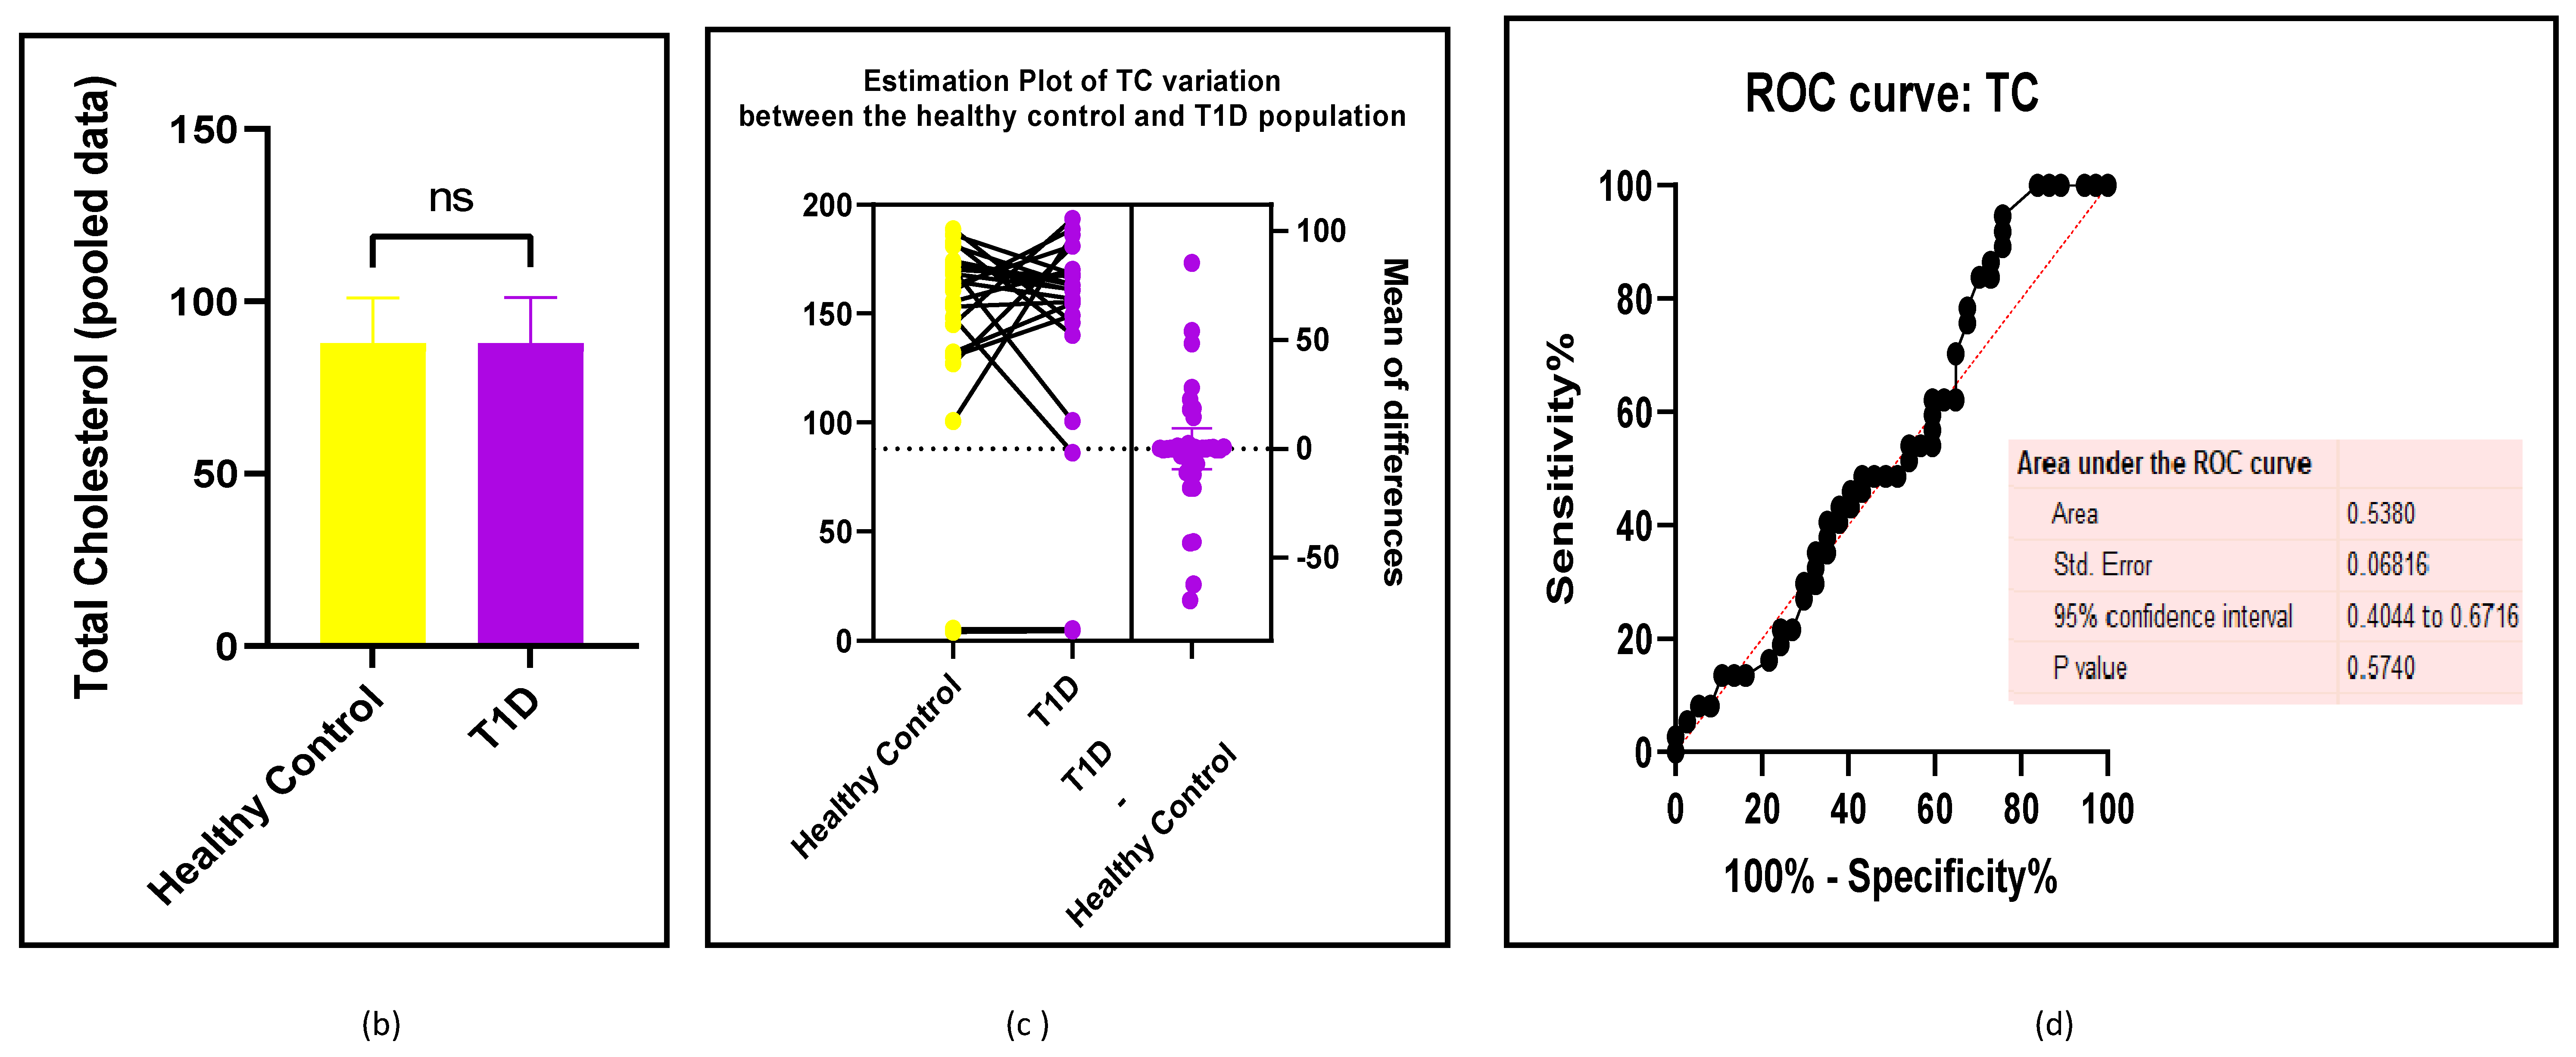
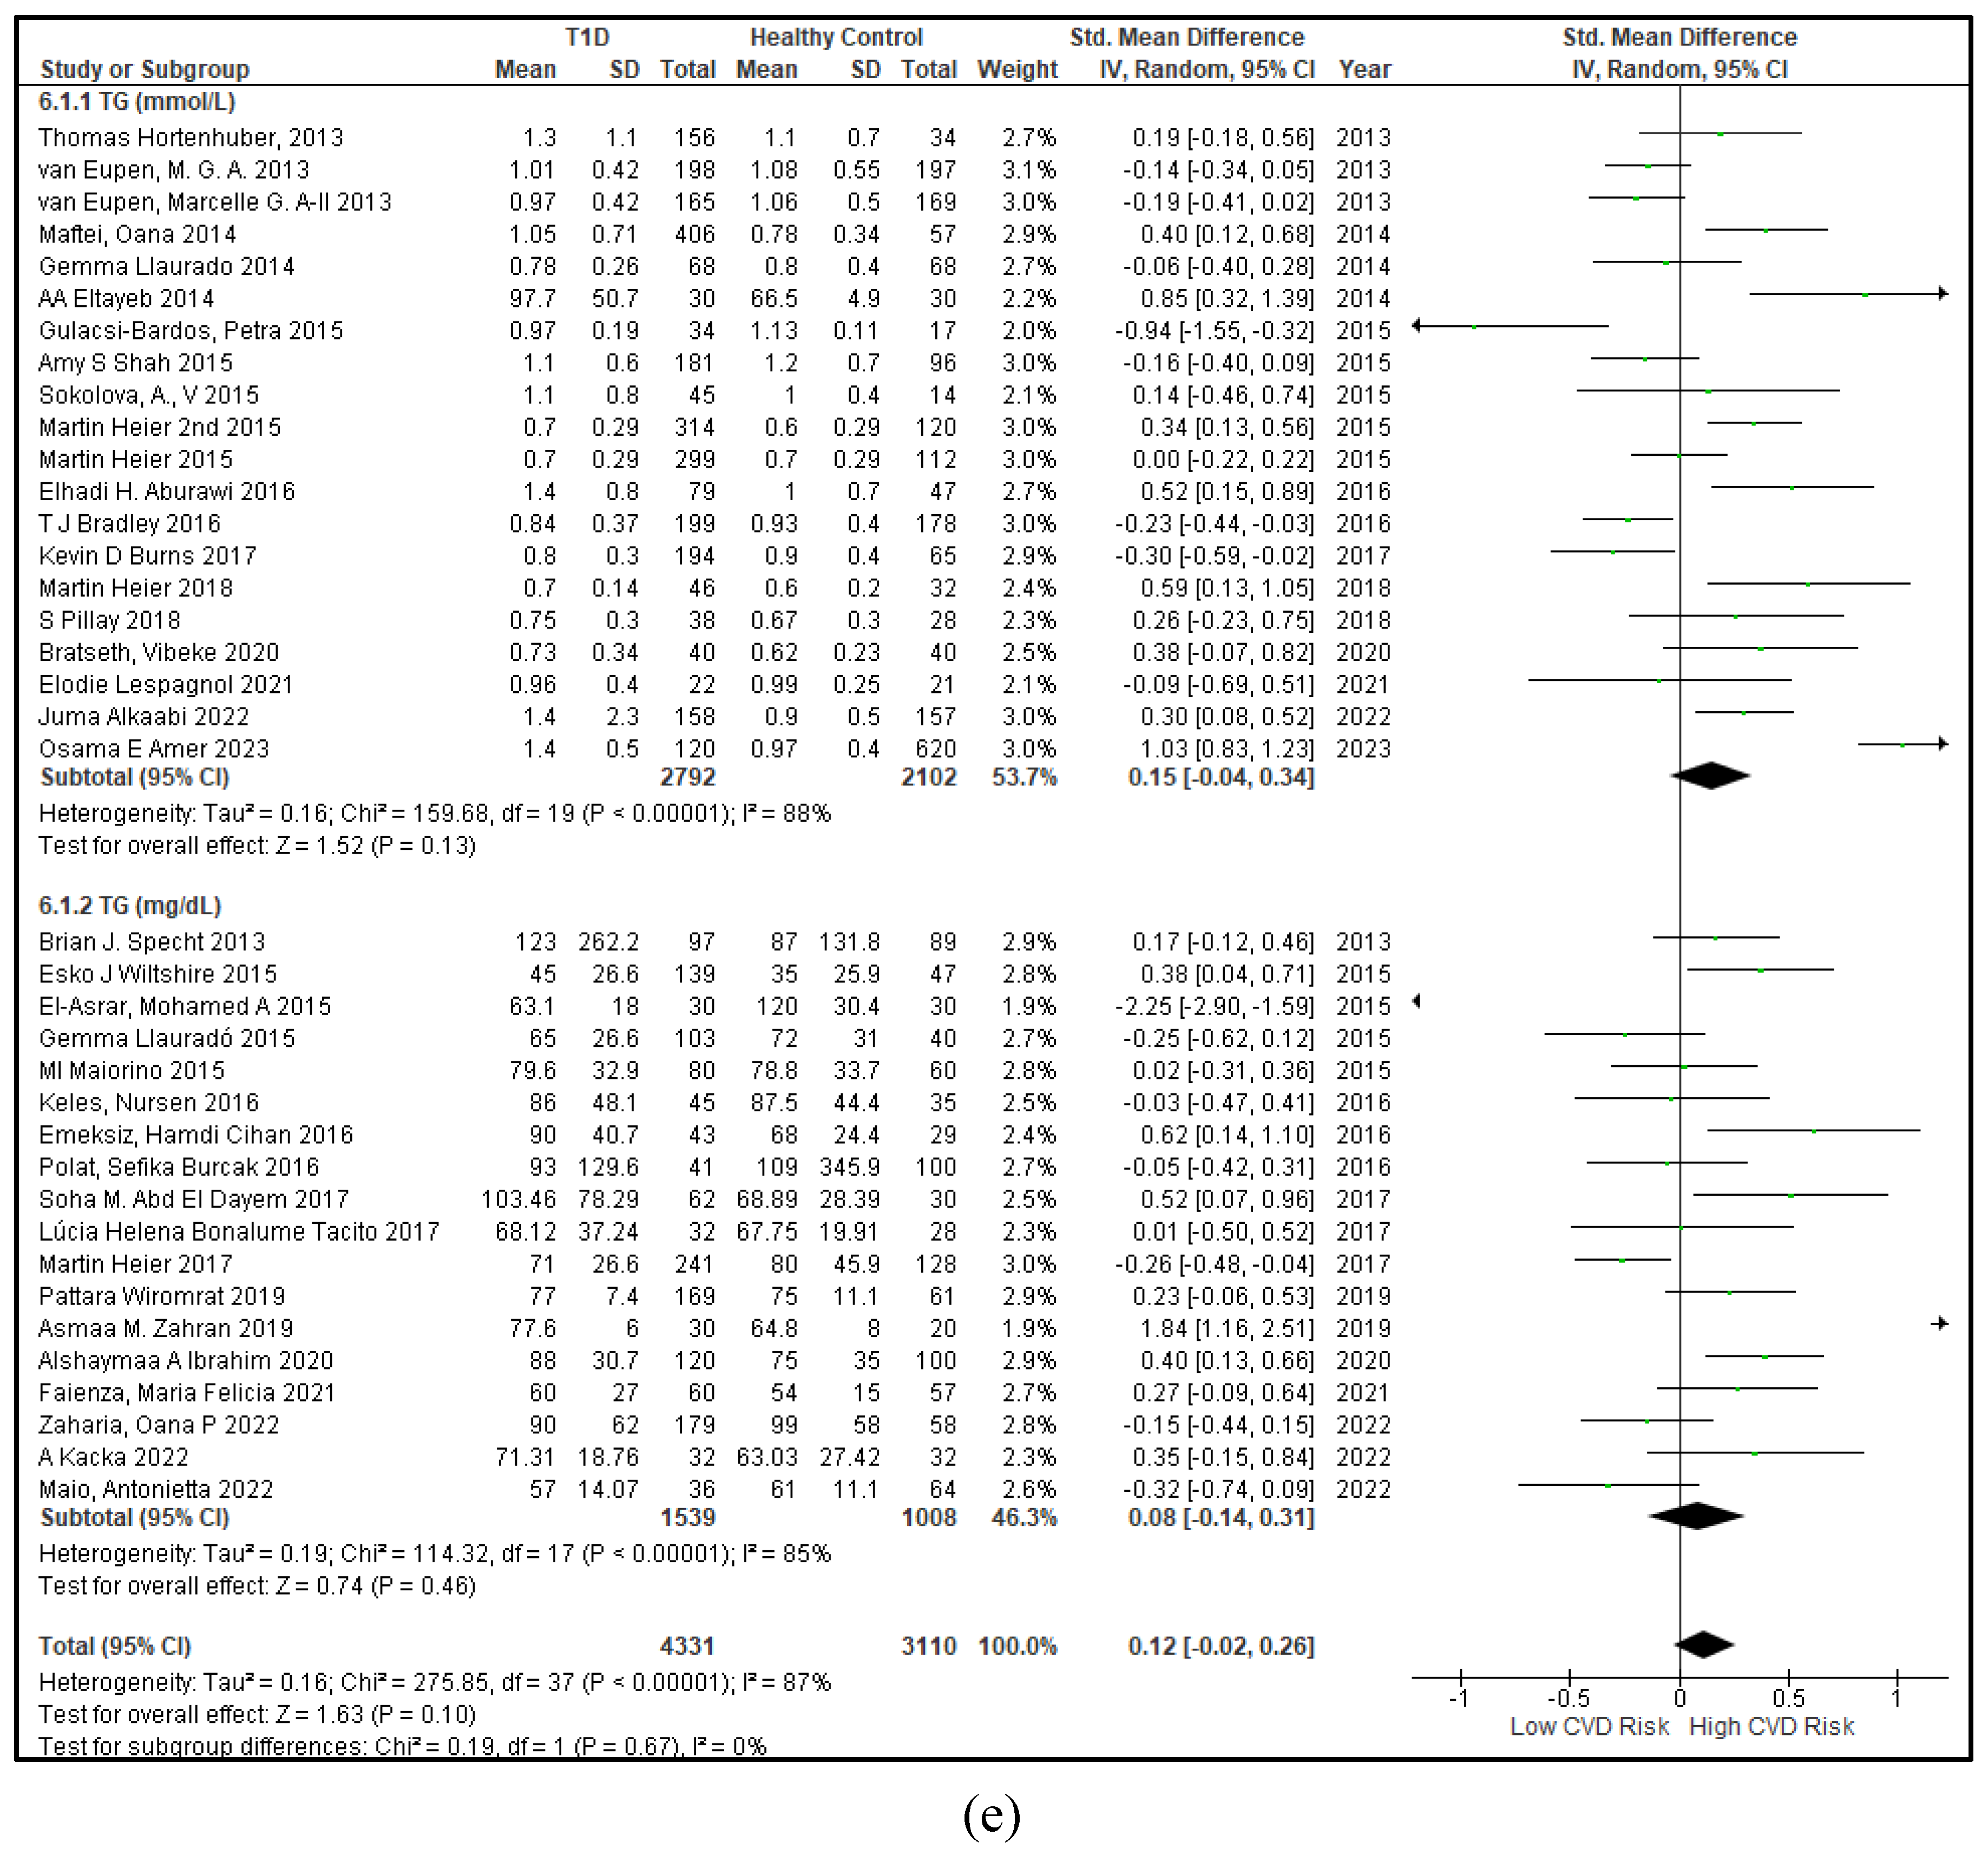
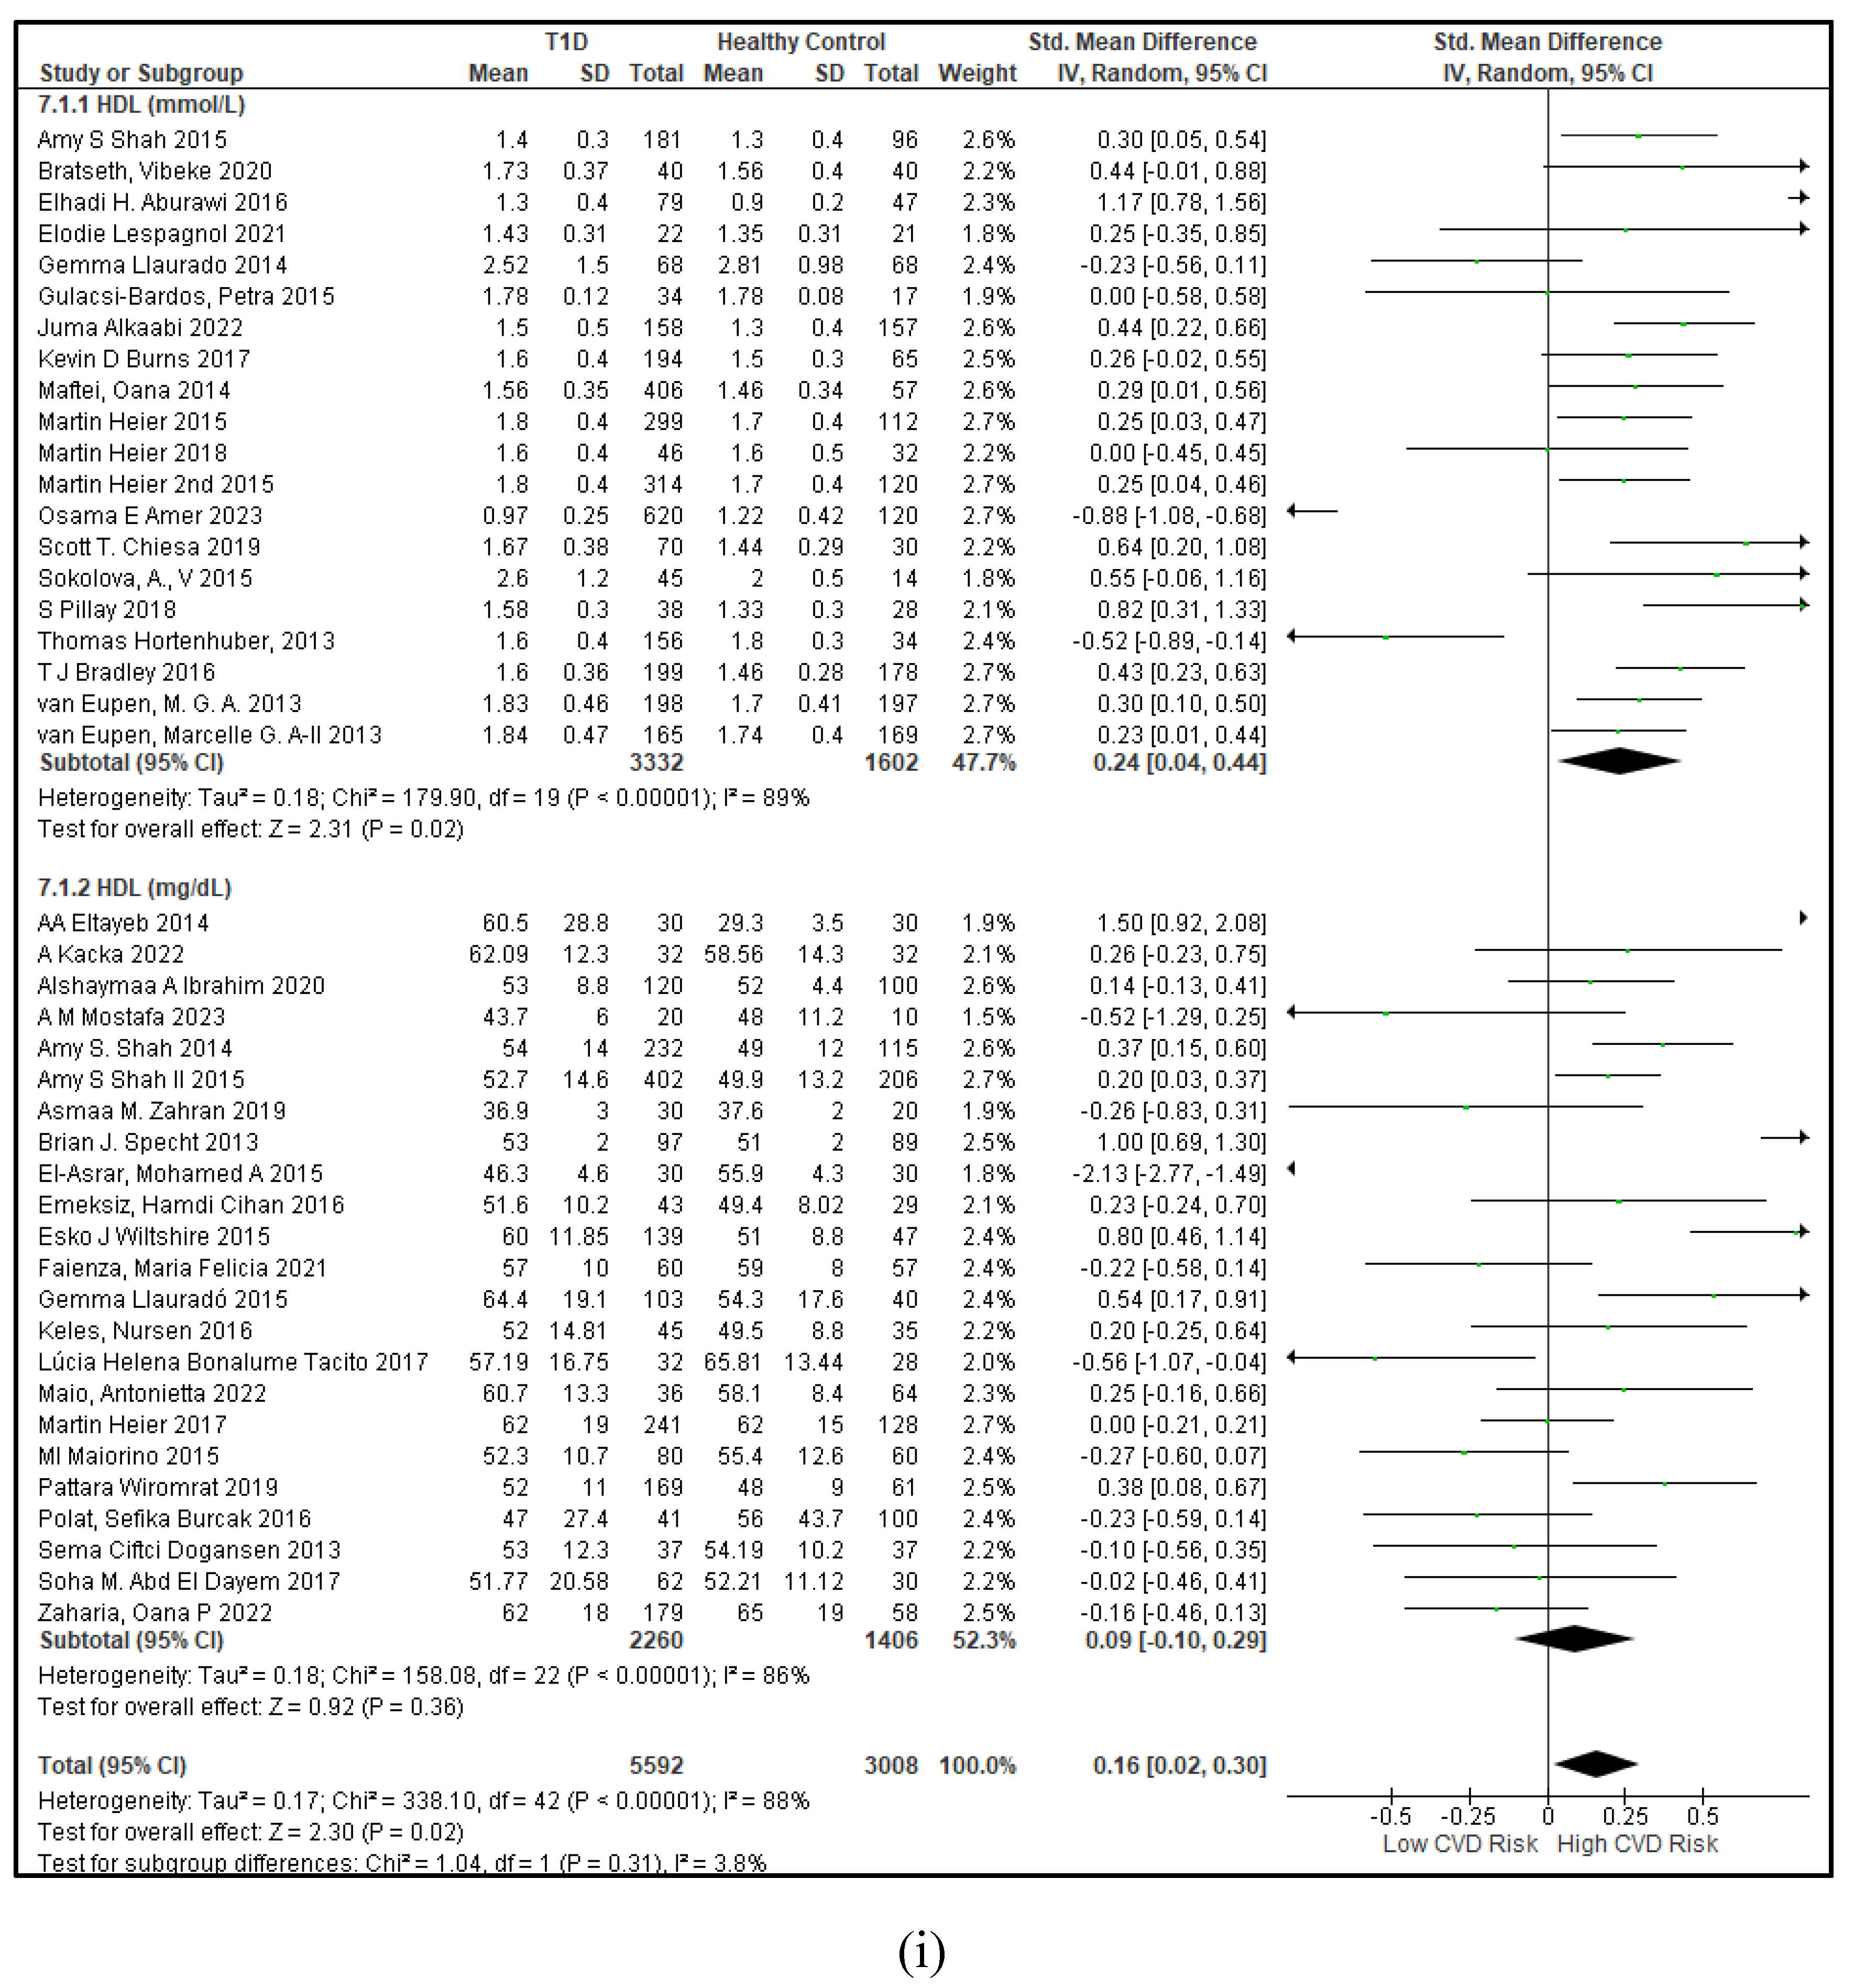
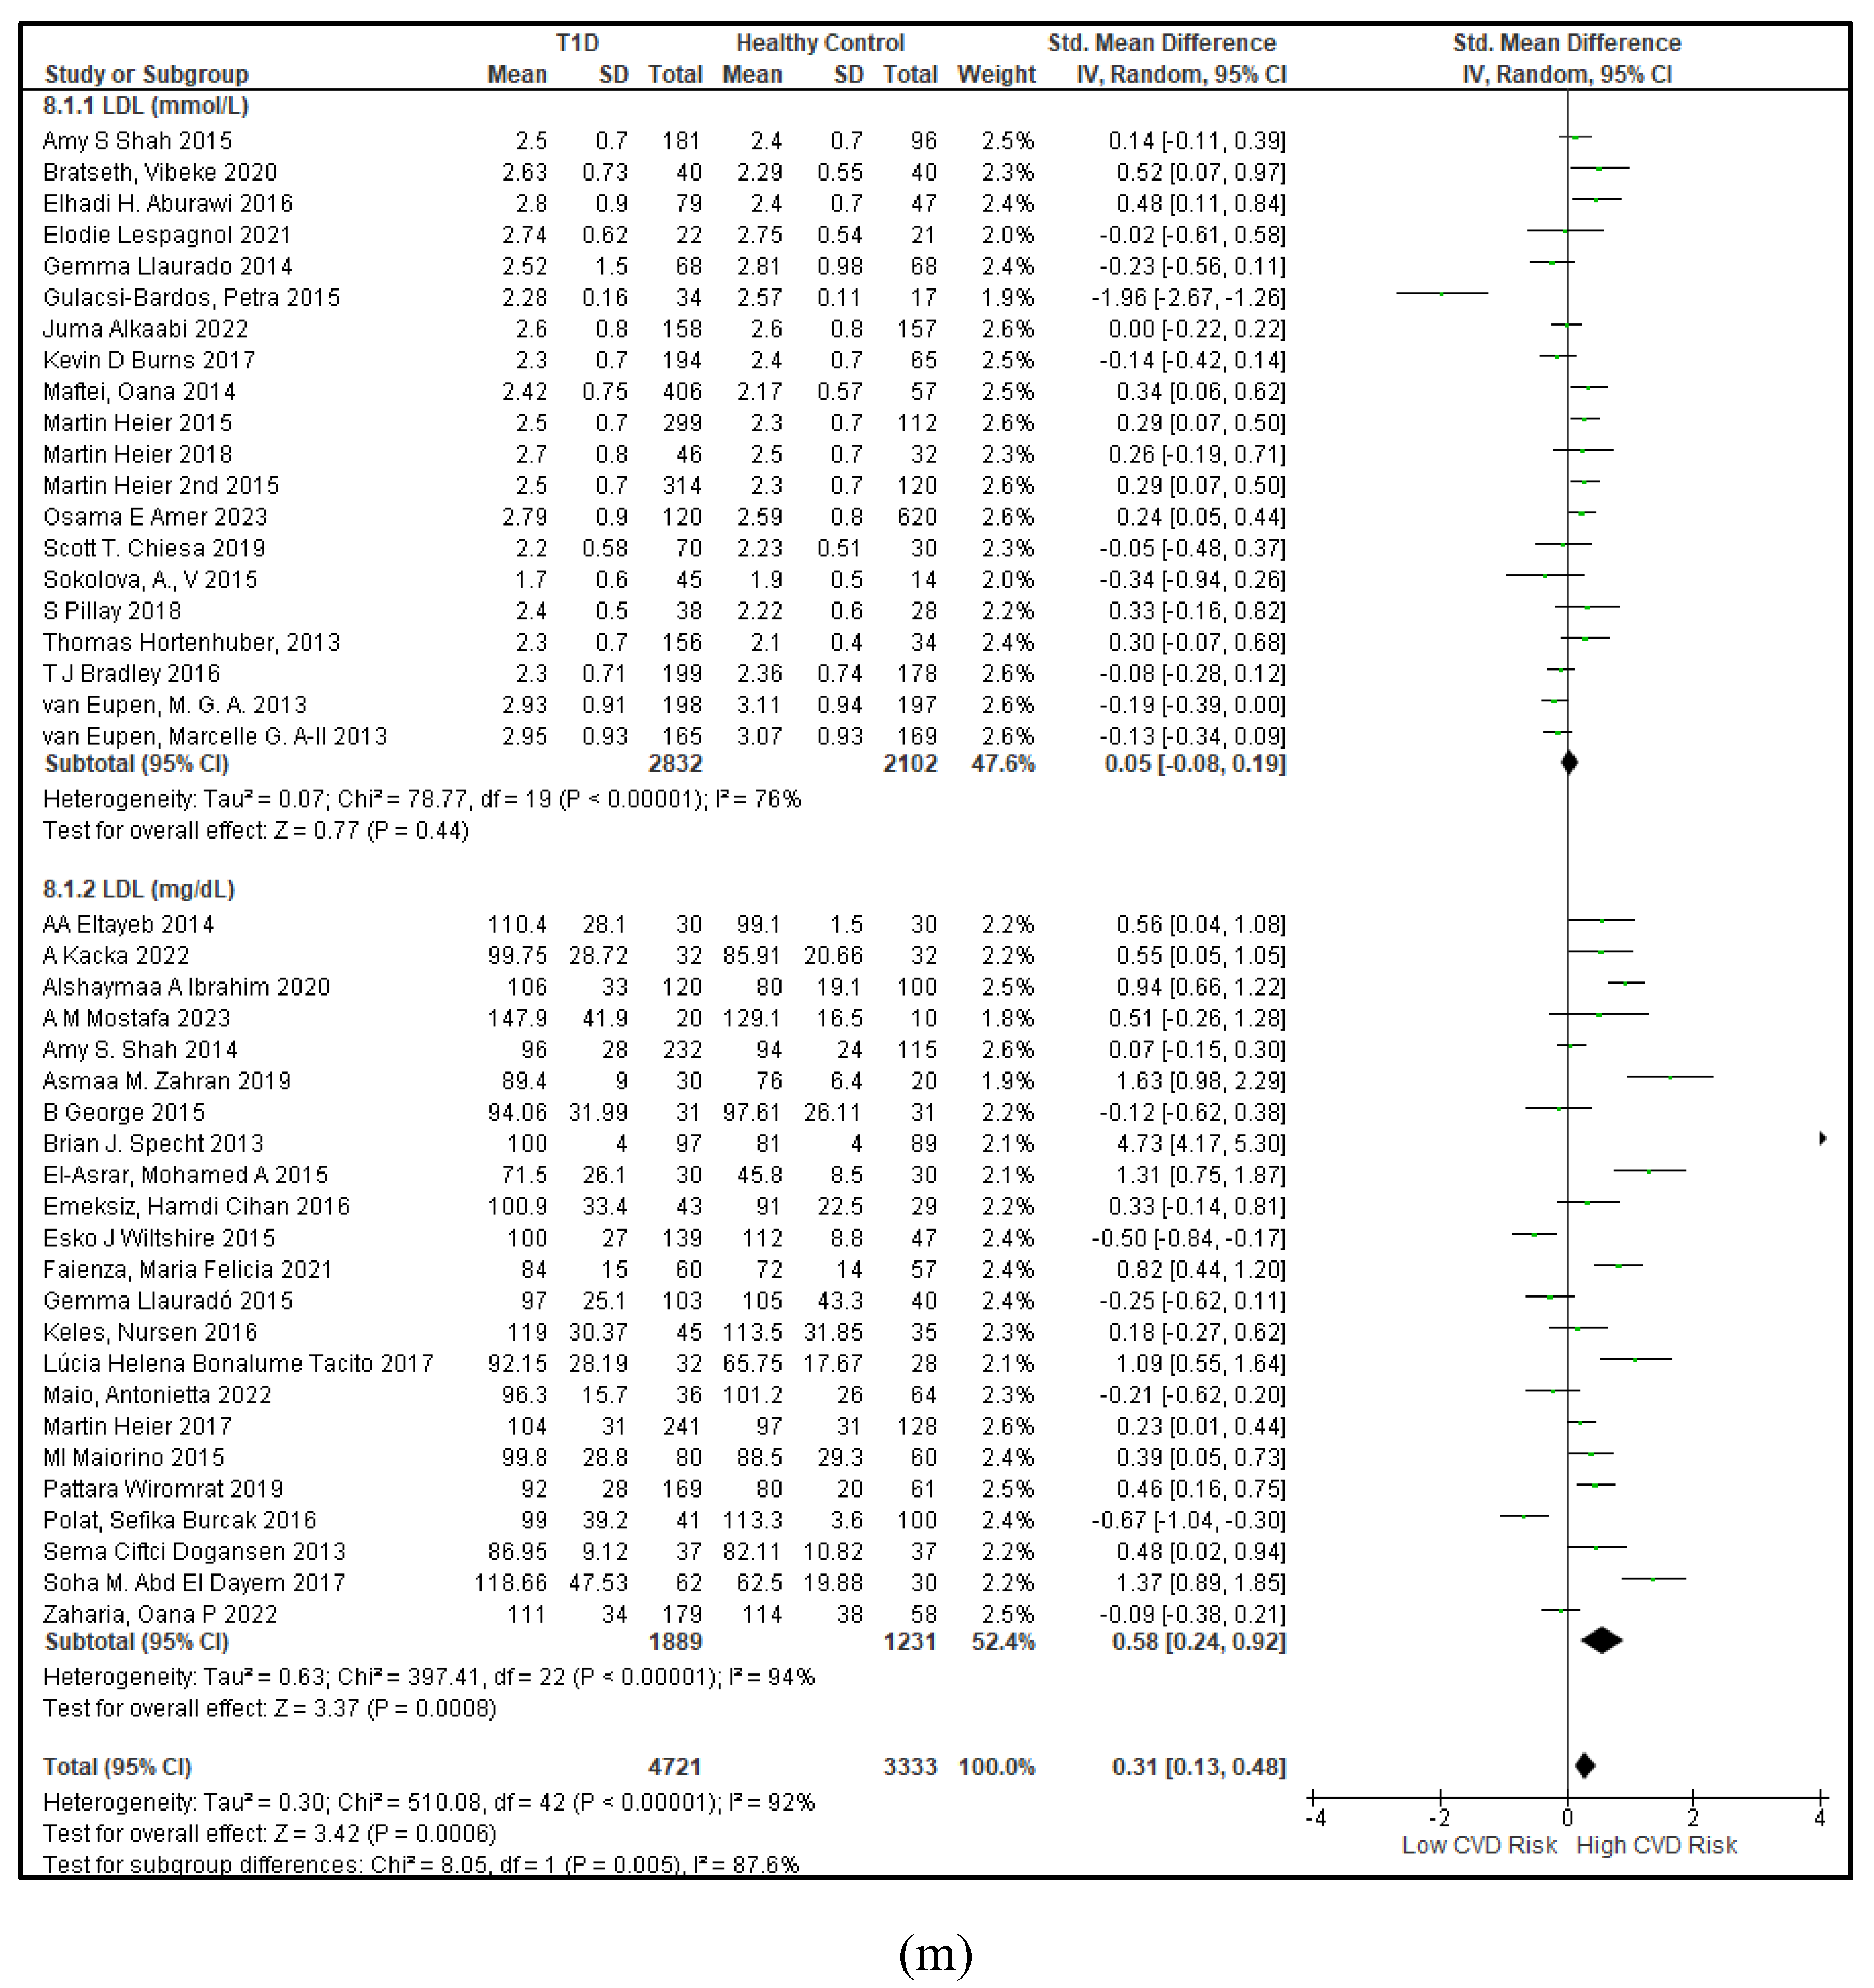
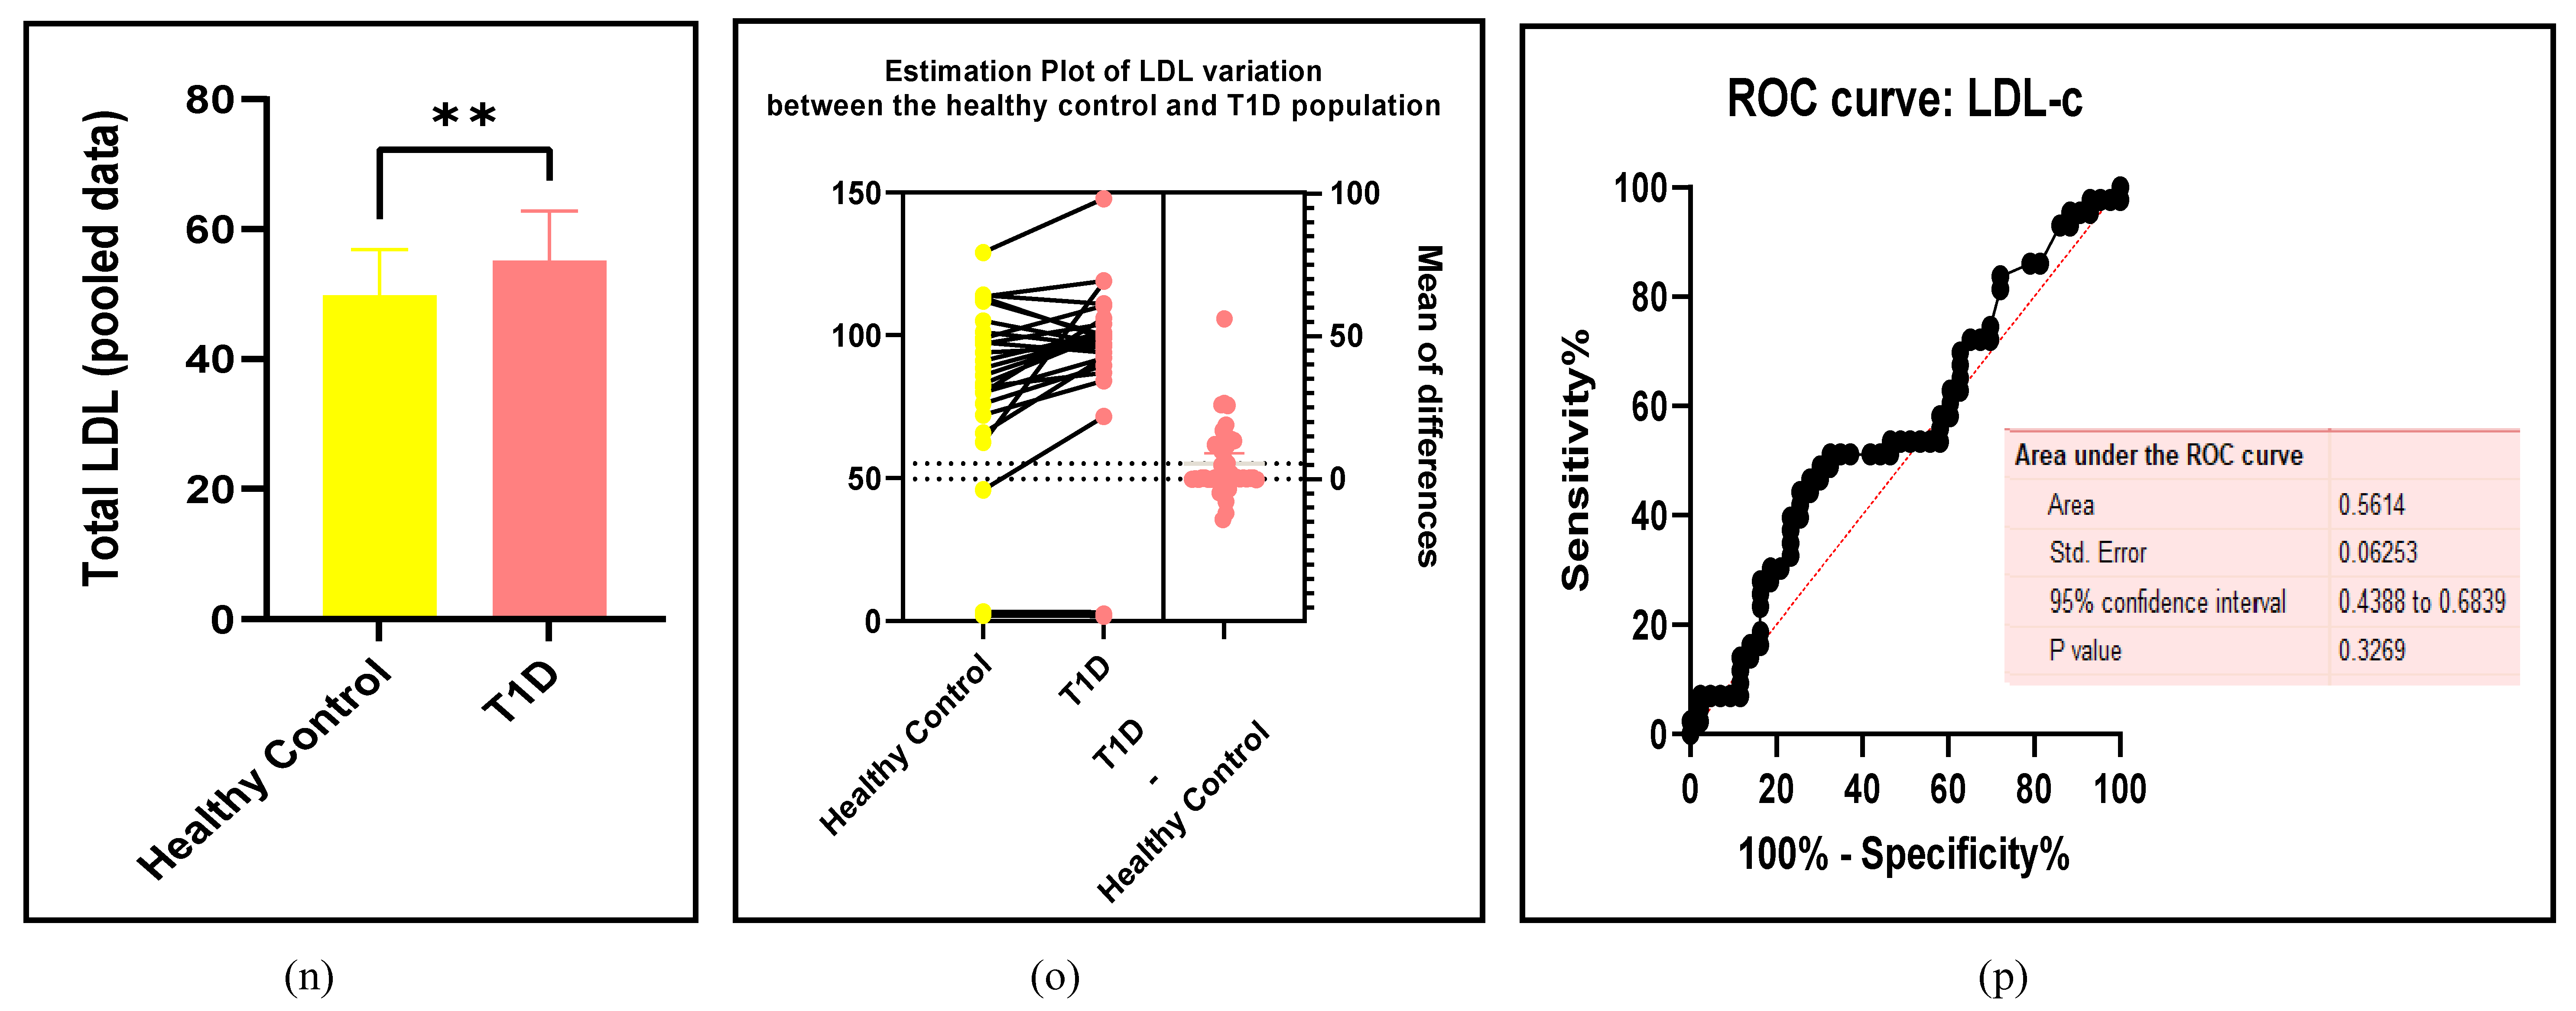
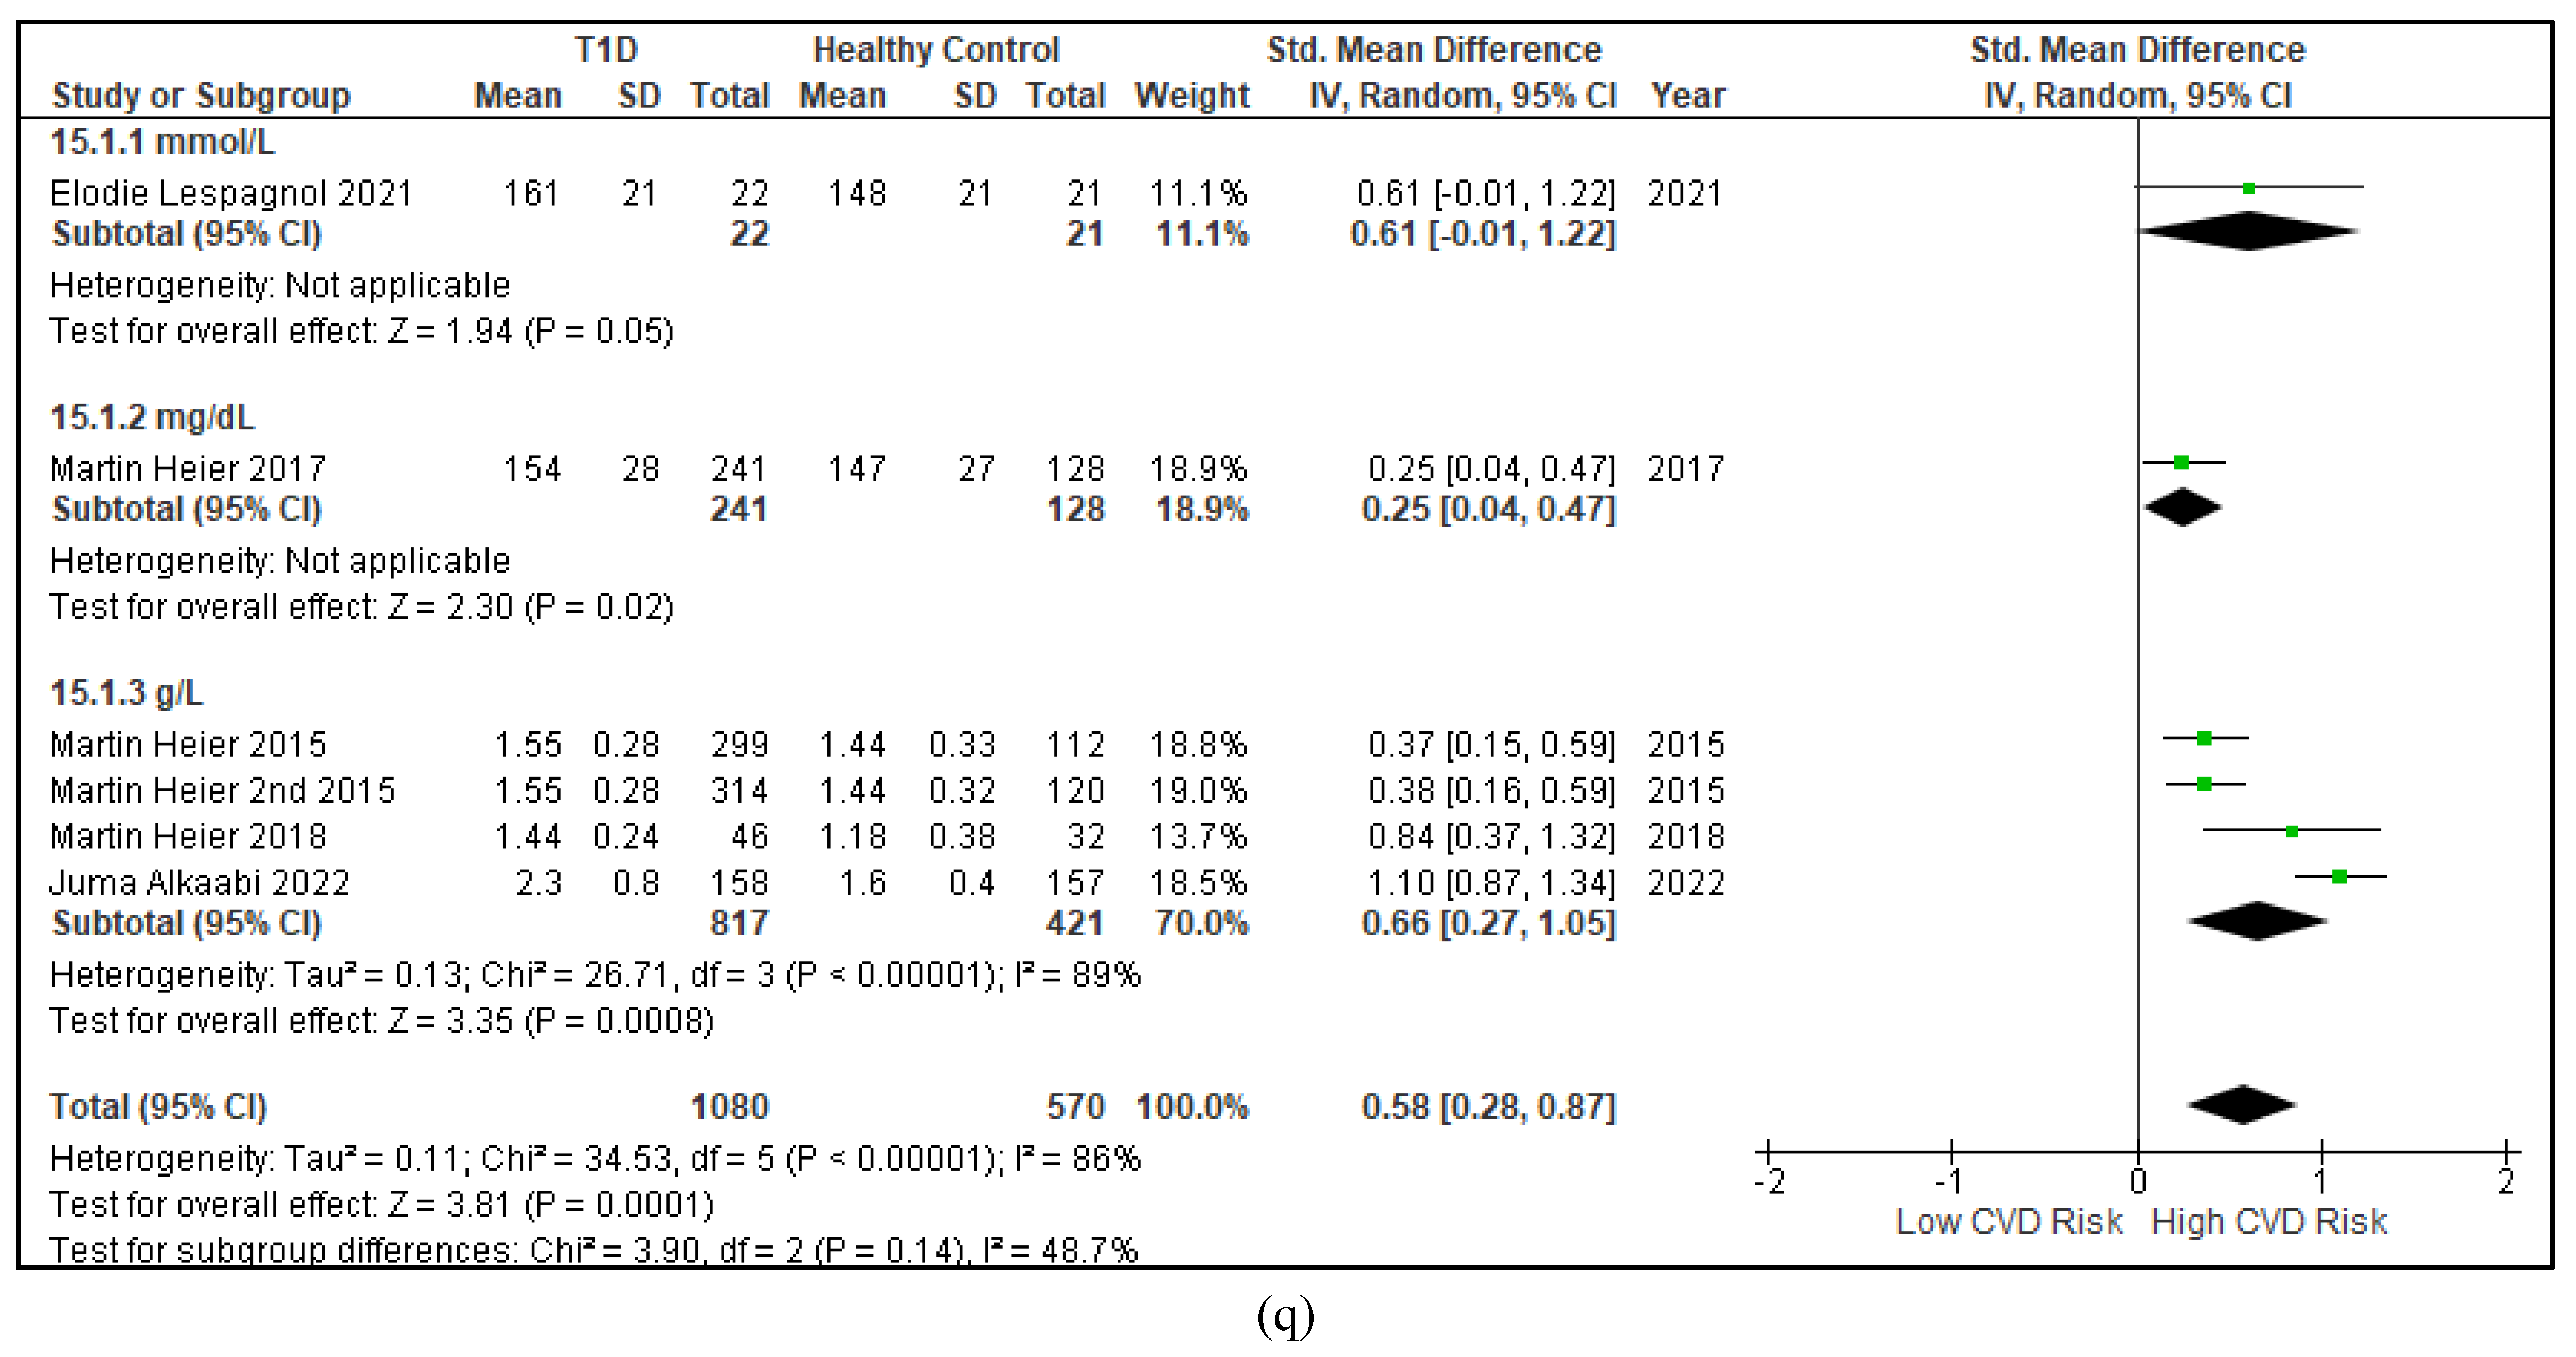
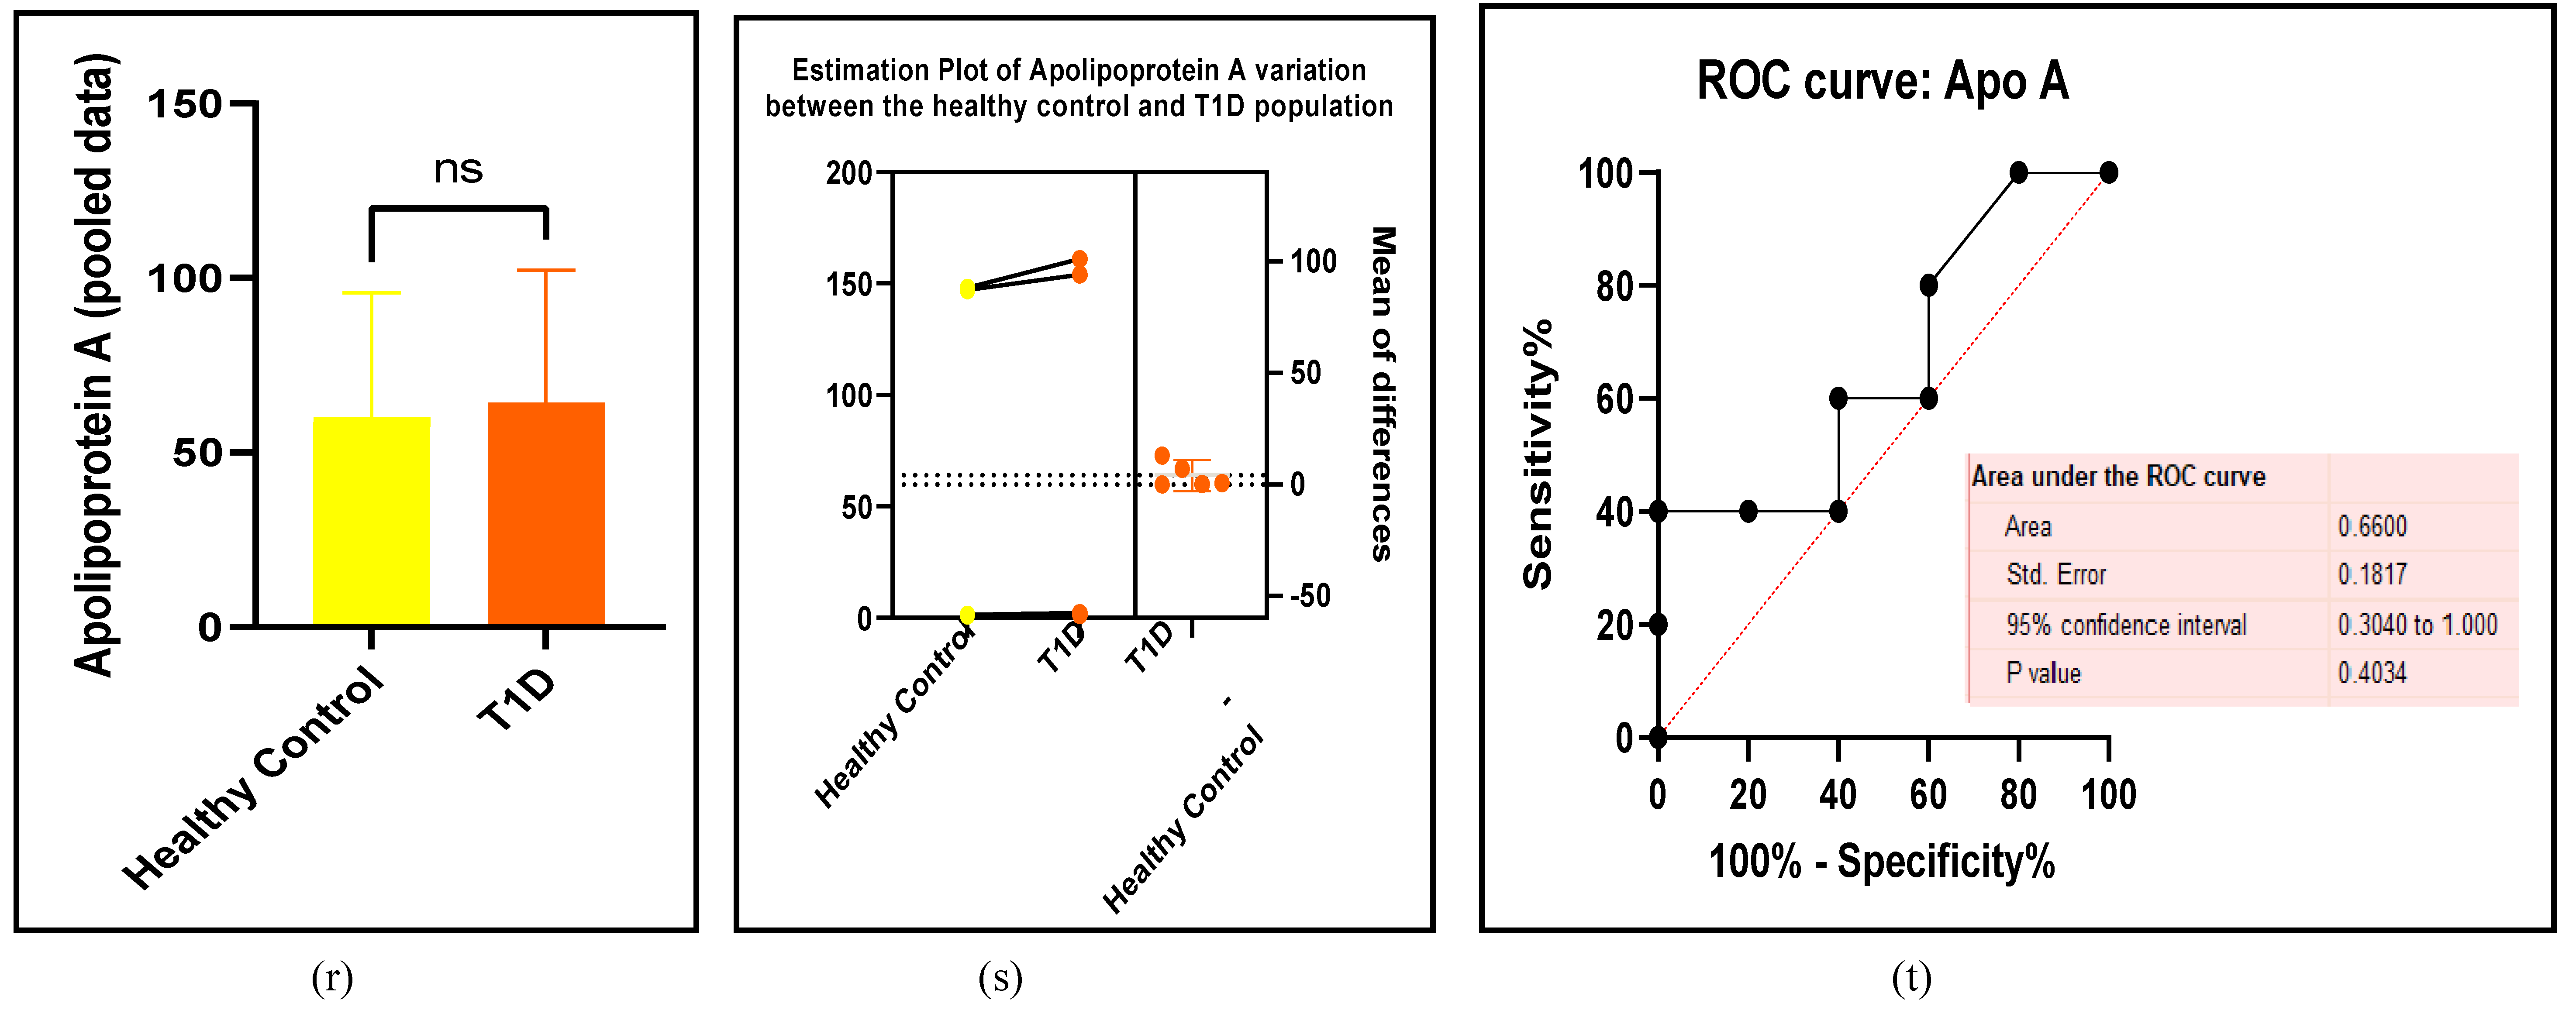
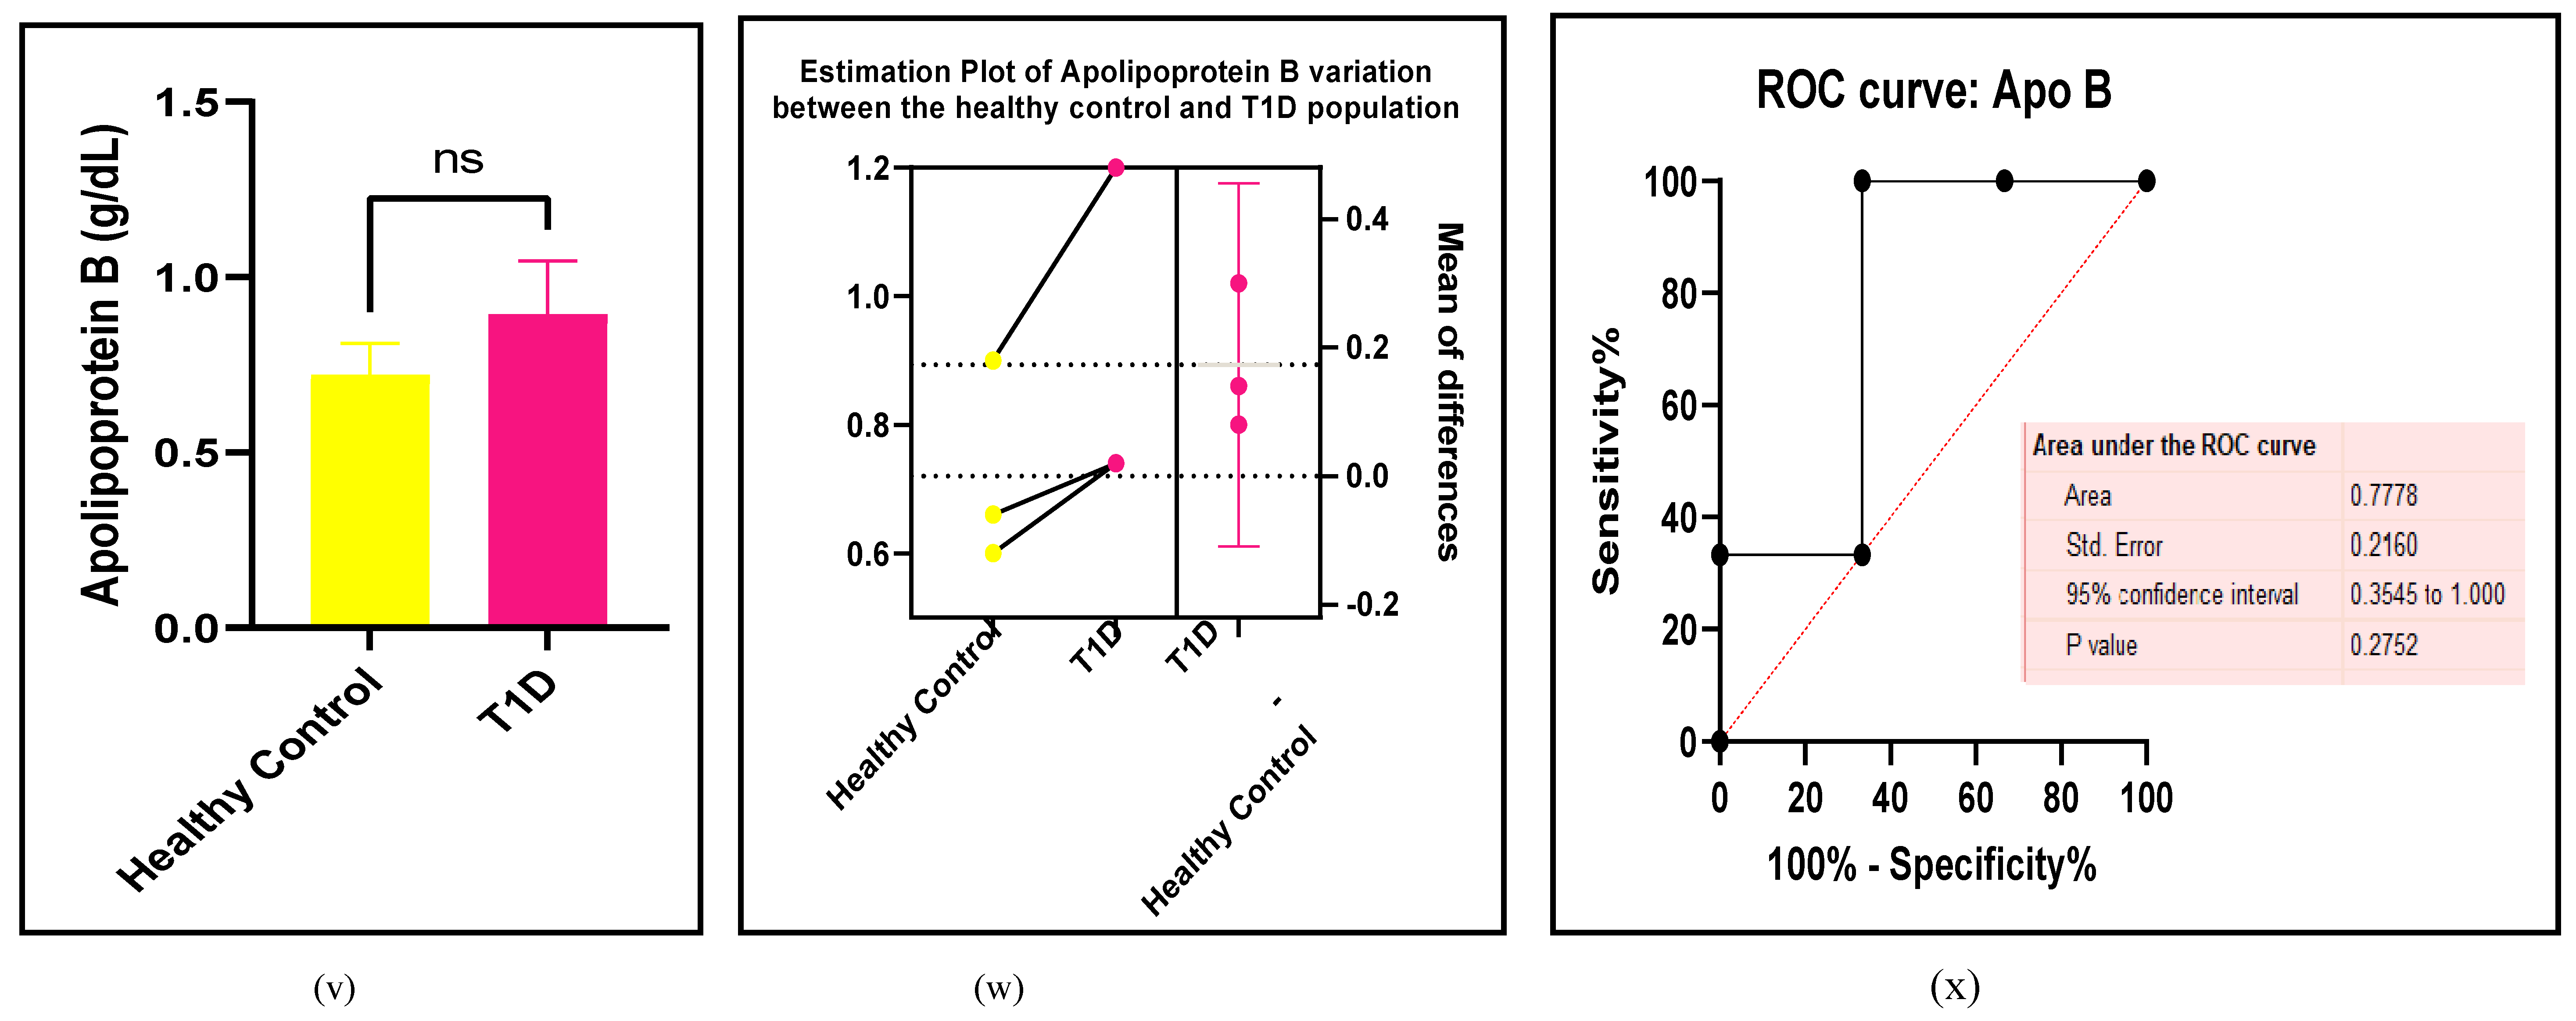
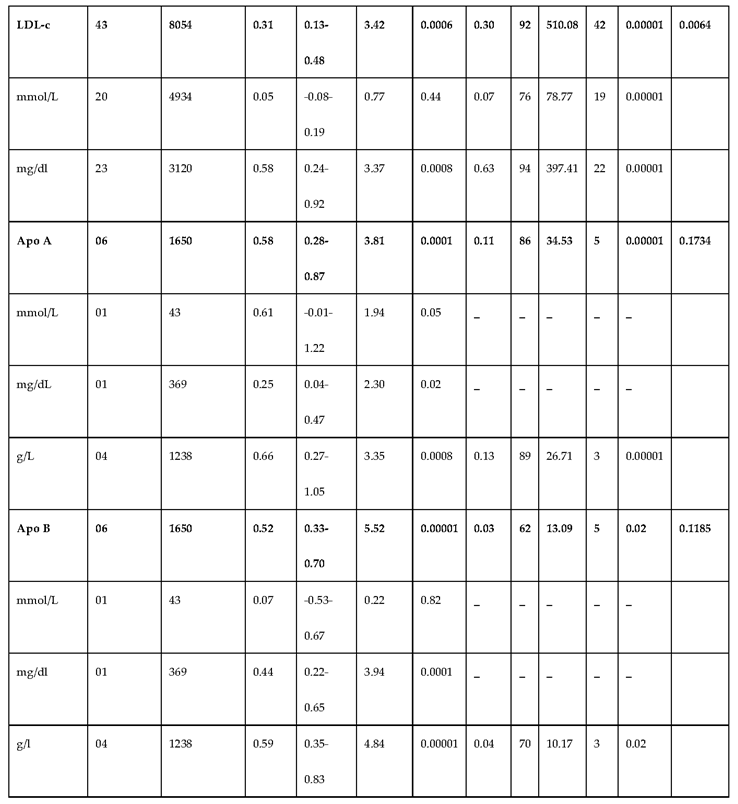
Dyslipidaemia is the third traditional risk factor that is always elevated in the T1D cohort compared to the HC [103]. It is an imbalance between the favourable and the unfavourable cholesterol with the low-density lipoprotein cholesterol (LDL-c) being more than the high-density lipoprotein cholesterol (HDL-c) [104] . The unfavourable lipids undergo lipid peroxidation such as the polyunsaturated fatty acids, generating reactive oxygen species (ROS) which cause oxidative stress [76] leading to vascular disease (Figure 5a-h and Table 4) .
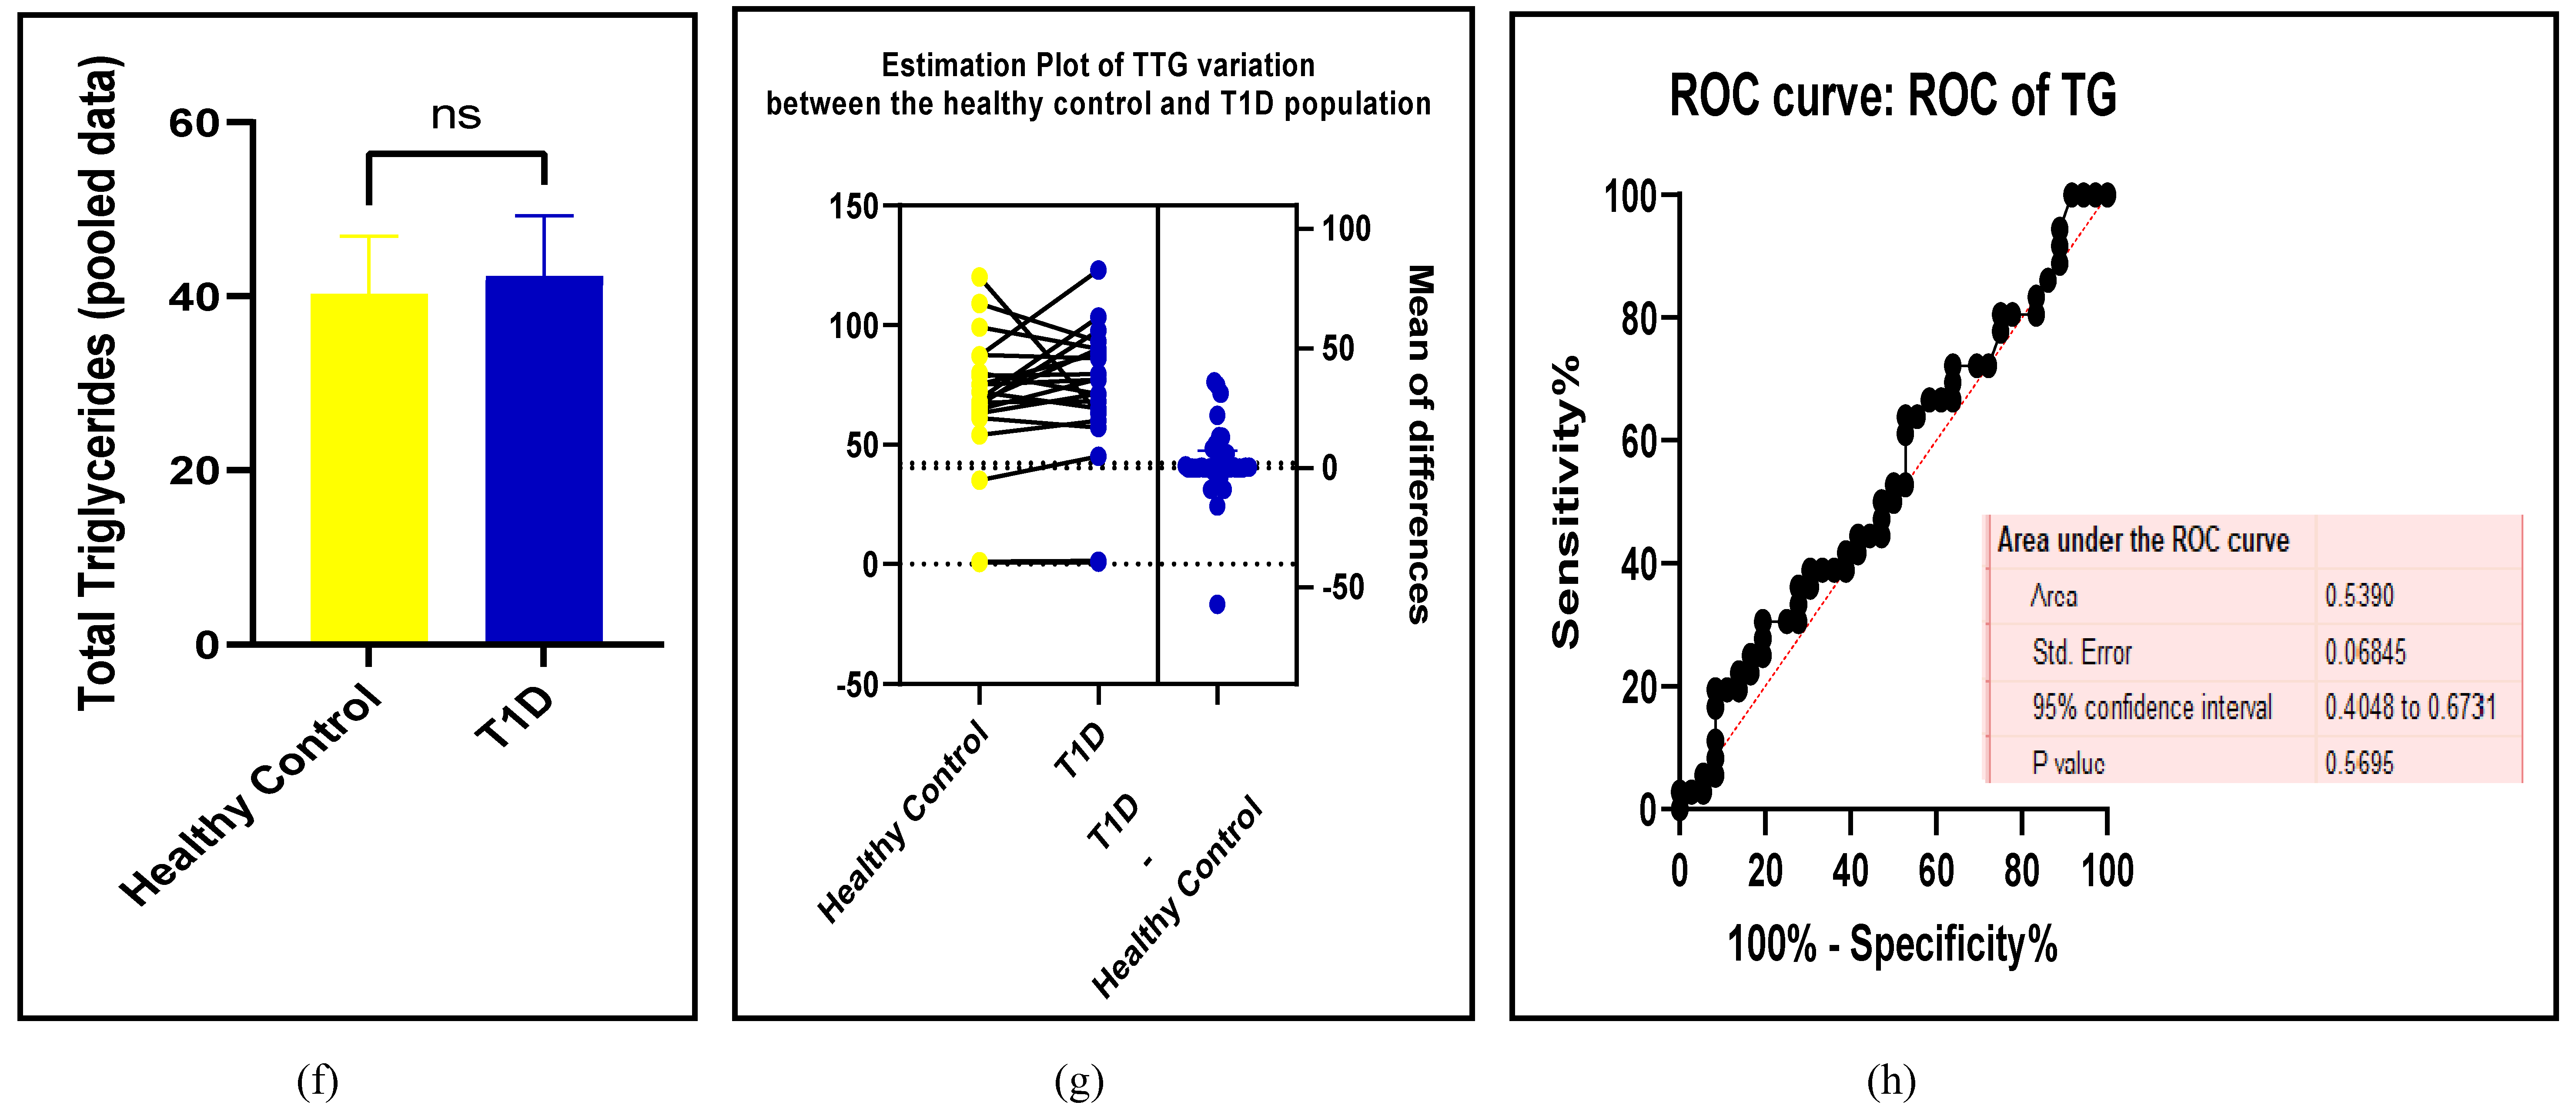
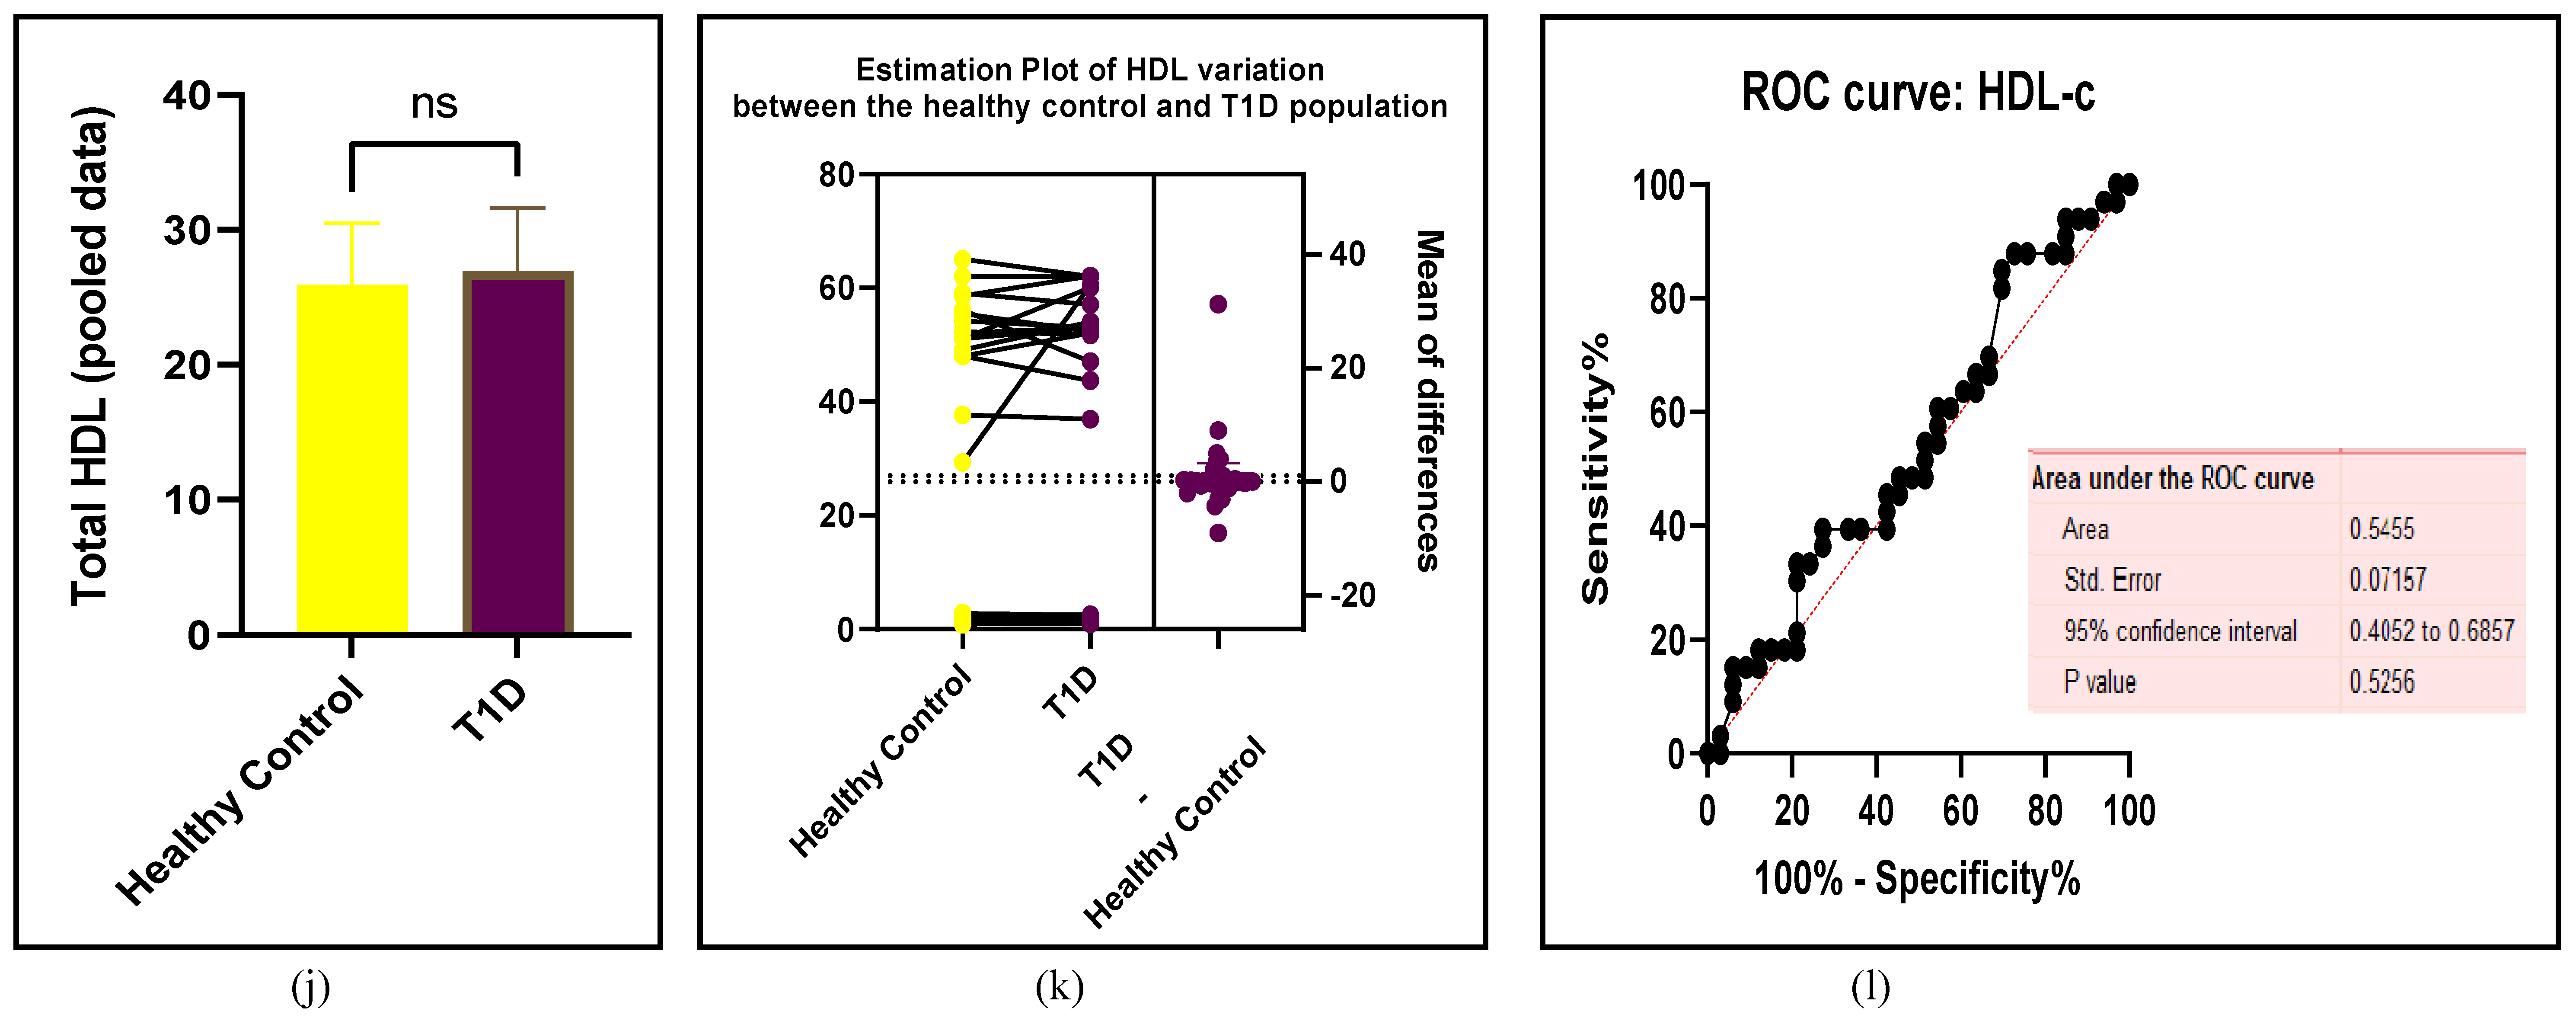
Figure 5. (a-x): Assessments of the lipids between the T1D and HC groups. (a) forest plot of TC (b) paired t-test bar graph of TC (c) EP of TC ( d) ROC curve of TC (e) forest plot of TG (f) paired t-test bar graph of TG (g) EP of TG ( h) ROC curve of TG (i) forest plot of HDL-c (j) paired t-test bar graph of HDL-c (k) EP of HDL-c ( l) ROC curve of HDL-c (m) forest plot of LDL-c (n) paired t-test bar graph of LDL-c (o) EP of LDL-c ( p) ROC curve of LDL-c (q) forest plot of Apo-A (r) paired t-test bar graph of Apo-A (s) EP of Apo-A ( t) ROC curve of Apo-A (u) forest plot of Apo-B (v) paired t-test bar graph of Apo-B (W) EP of Apo-B ( x) ROC curve of Apo-B. Results are statistically significant at p < 0.05.
Preprints 105488 g005aPreprints 105488 g005bPreprints 105488 g005cPreprints 105488 g005dPreprints 105488 g005ePreprints 105488 g005fPreprints 105488 g005gPreprints 105488 g005hPreprints 105488 g005iPreprints 105488 g005jPreprints 105488 g005kPreprints 105488 g005l

3.2.4. The Biomarkers of Vascular Function Are the Second-Best Indicators of T1D-Induced ED

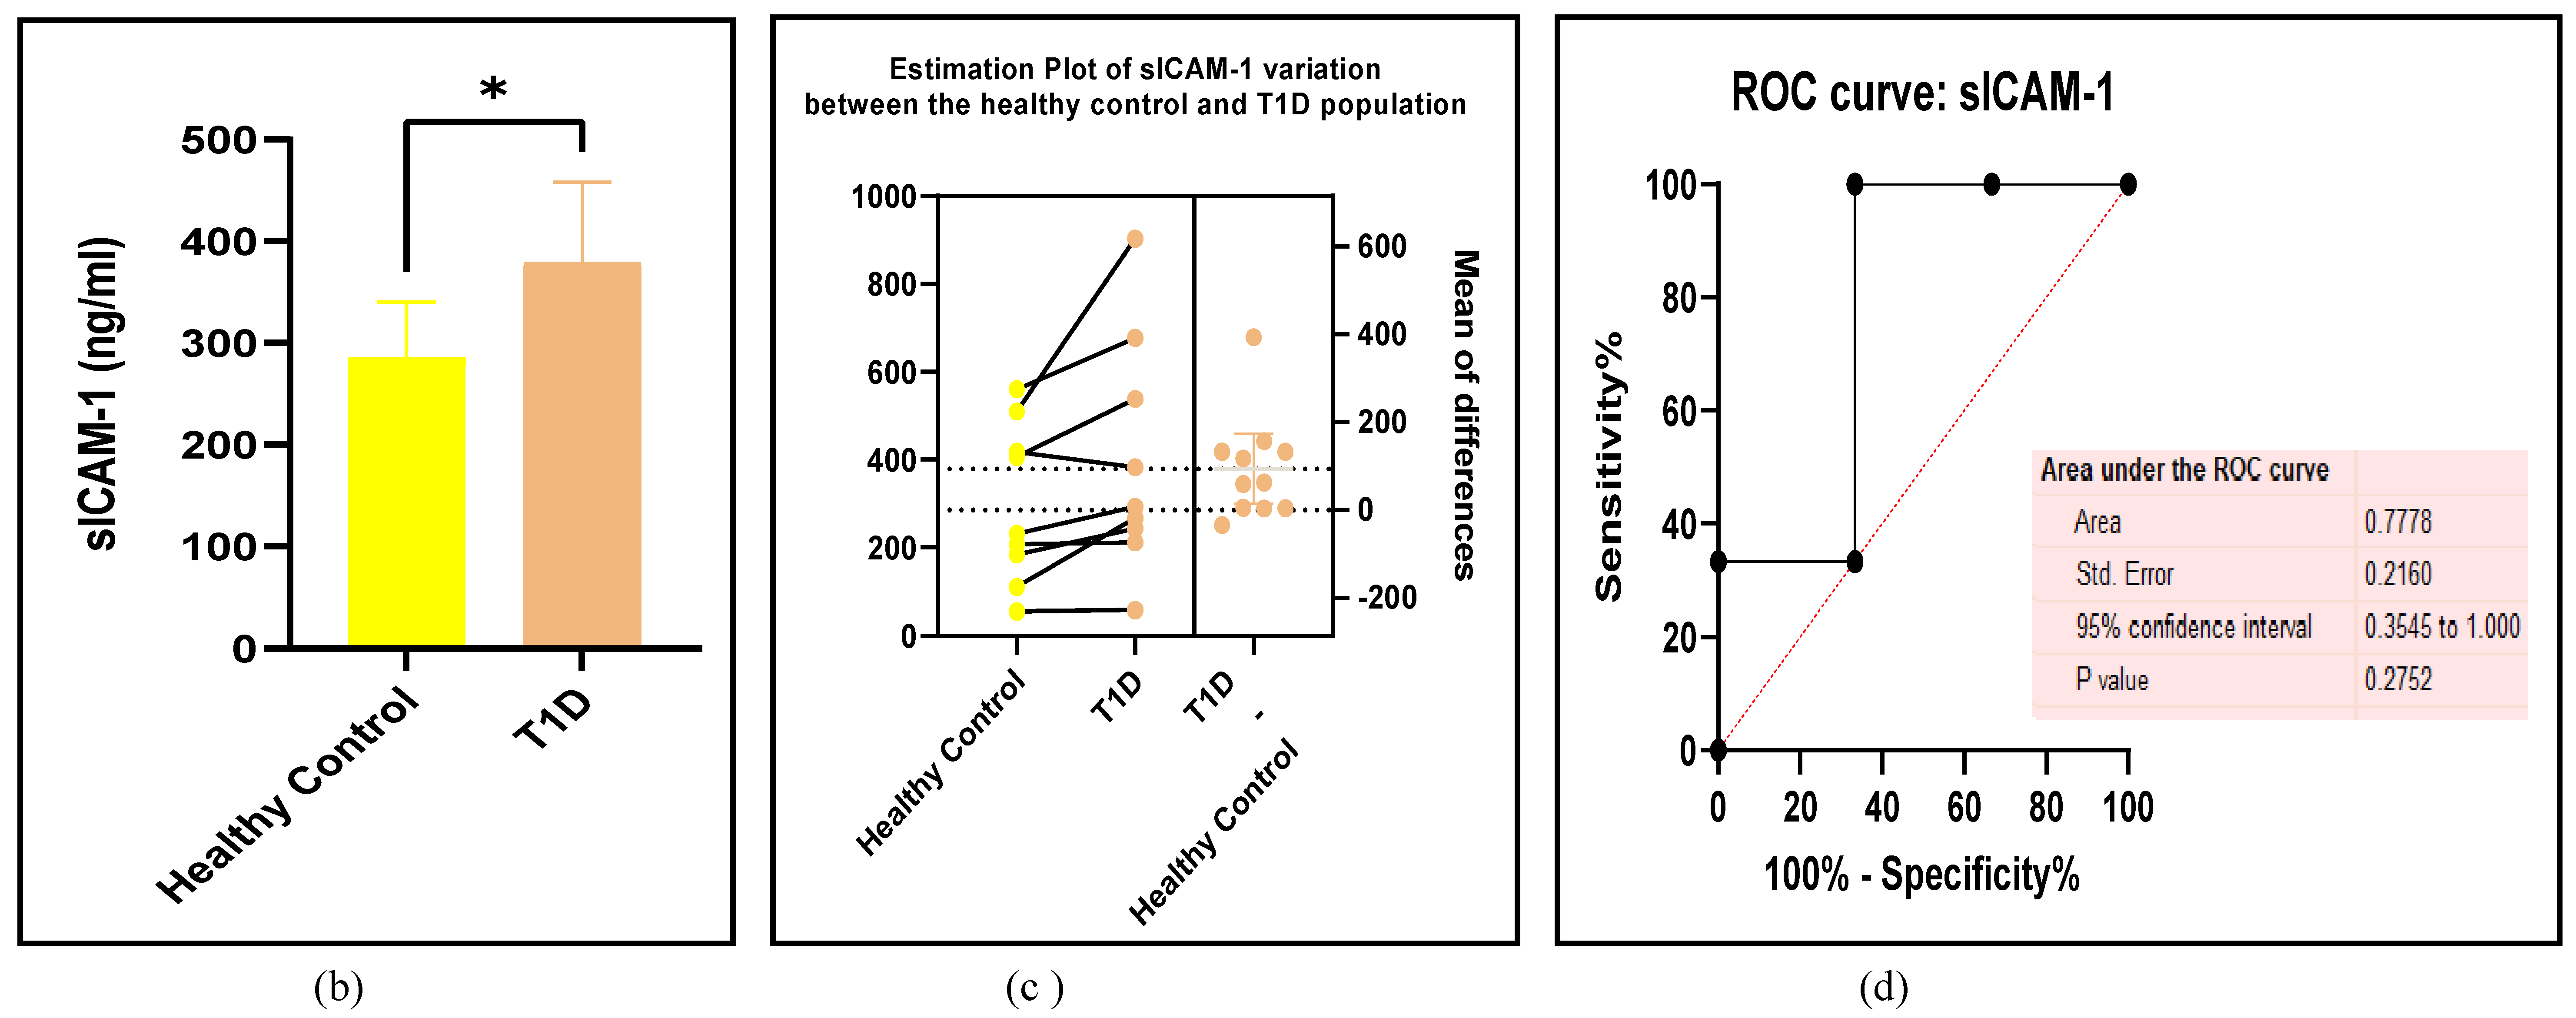
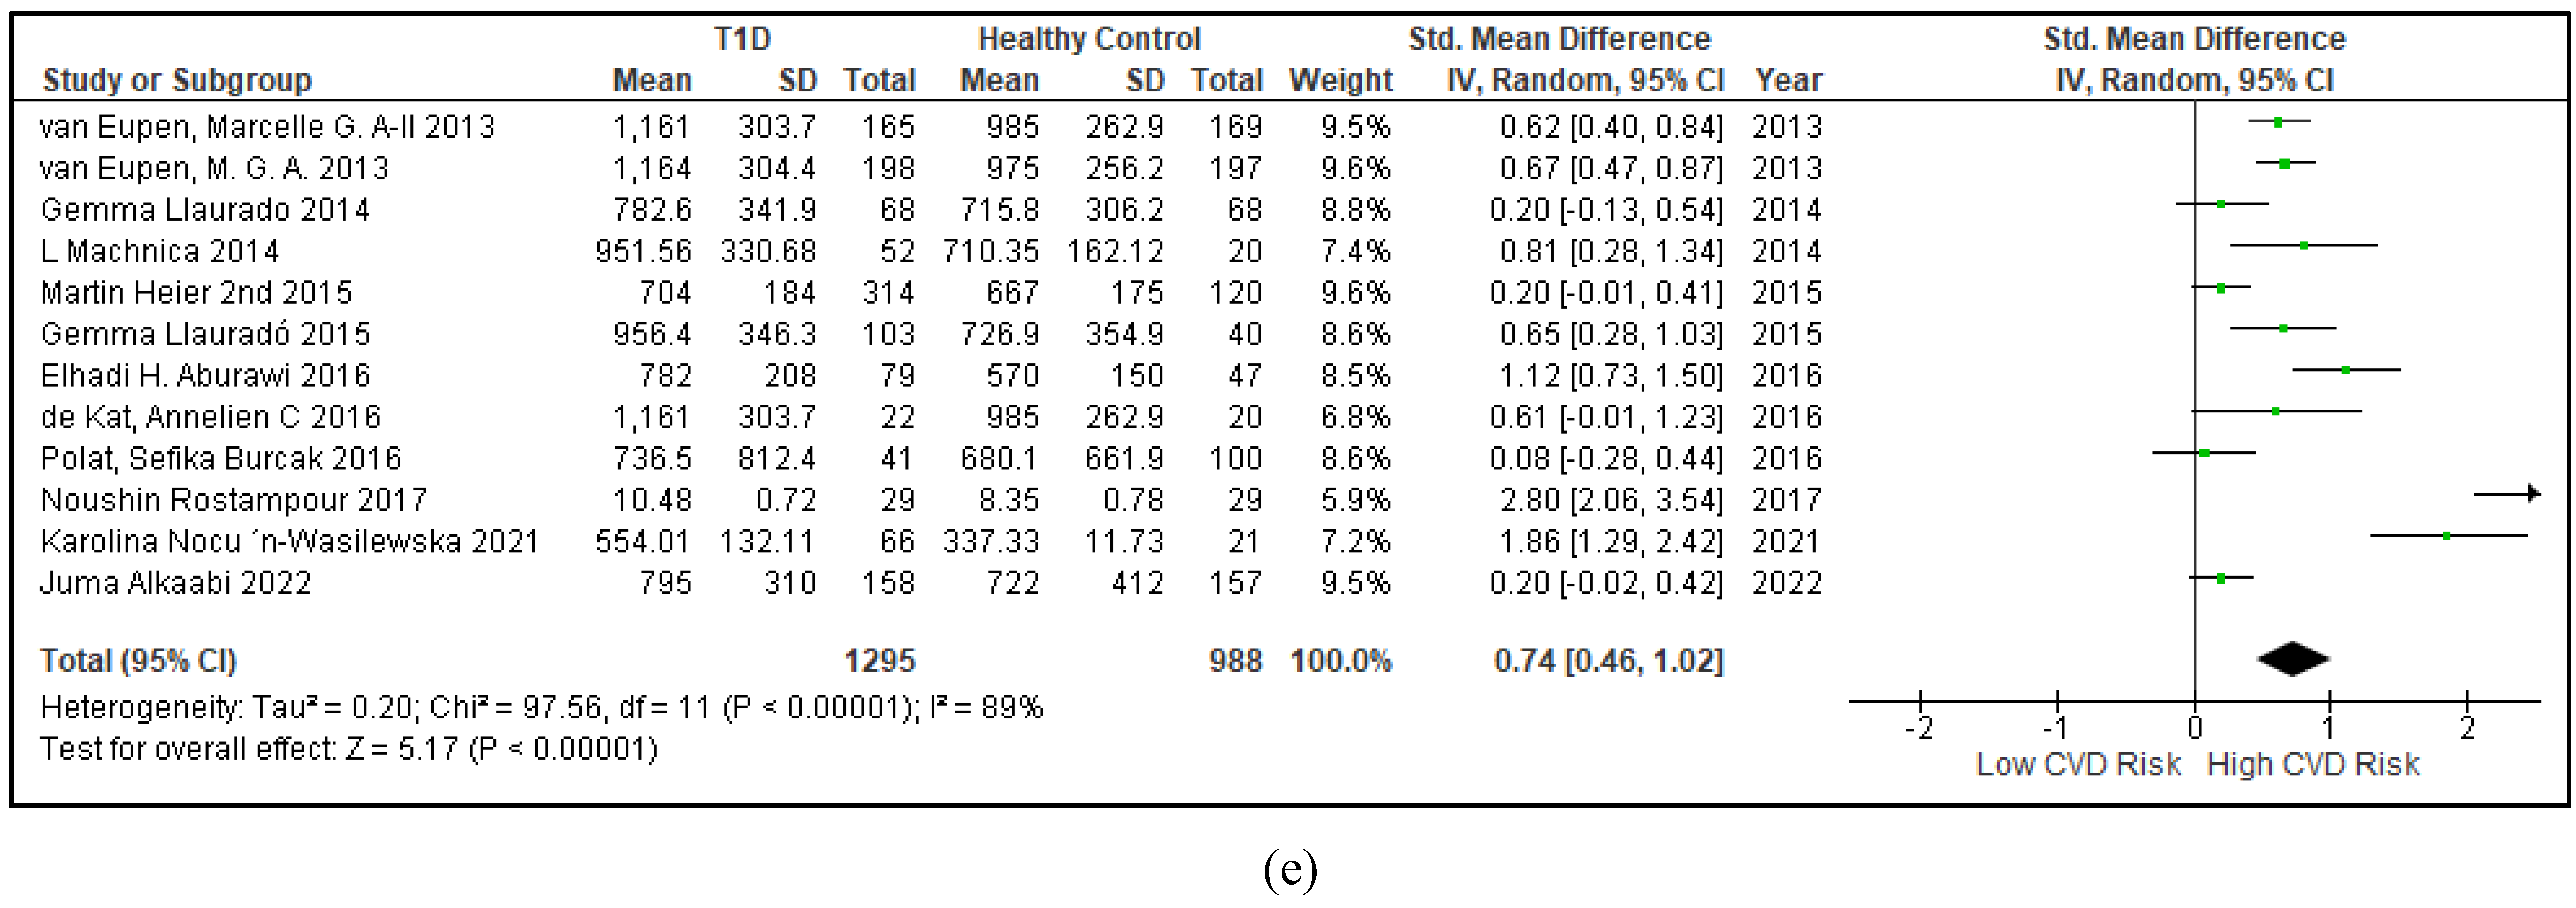
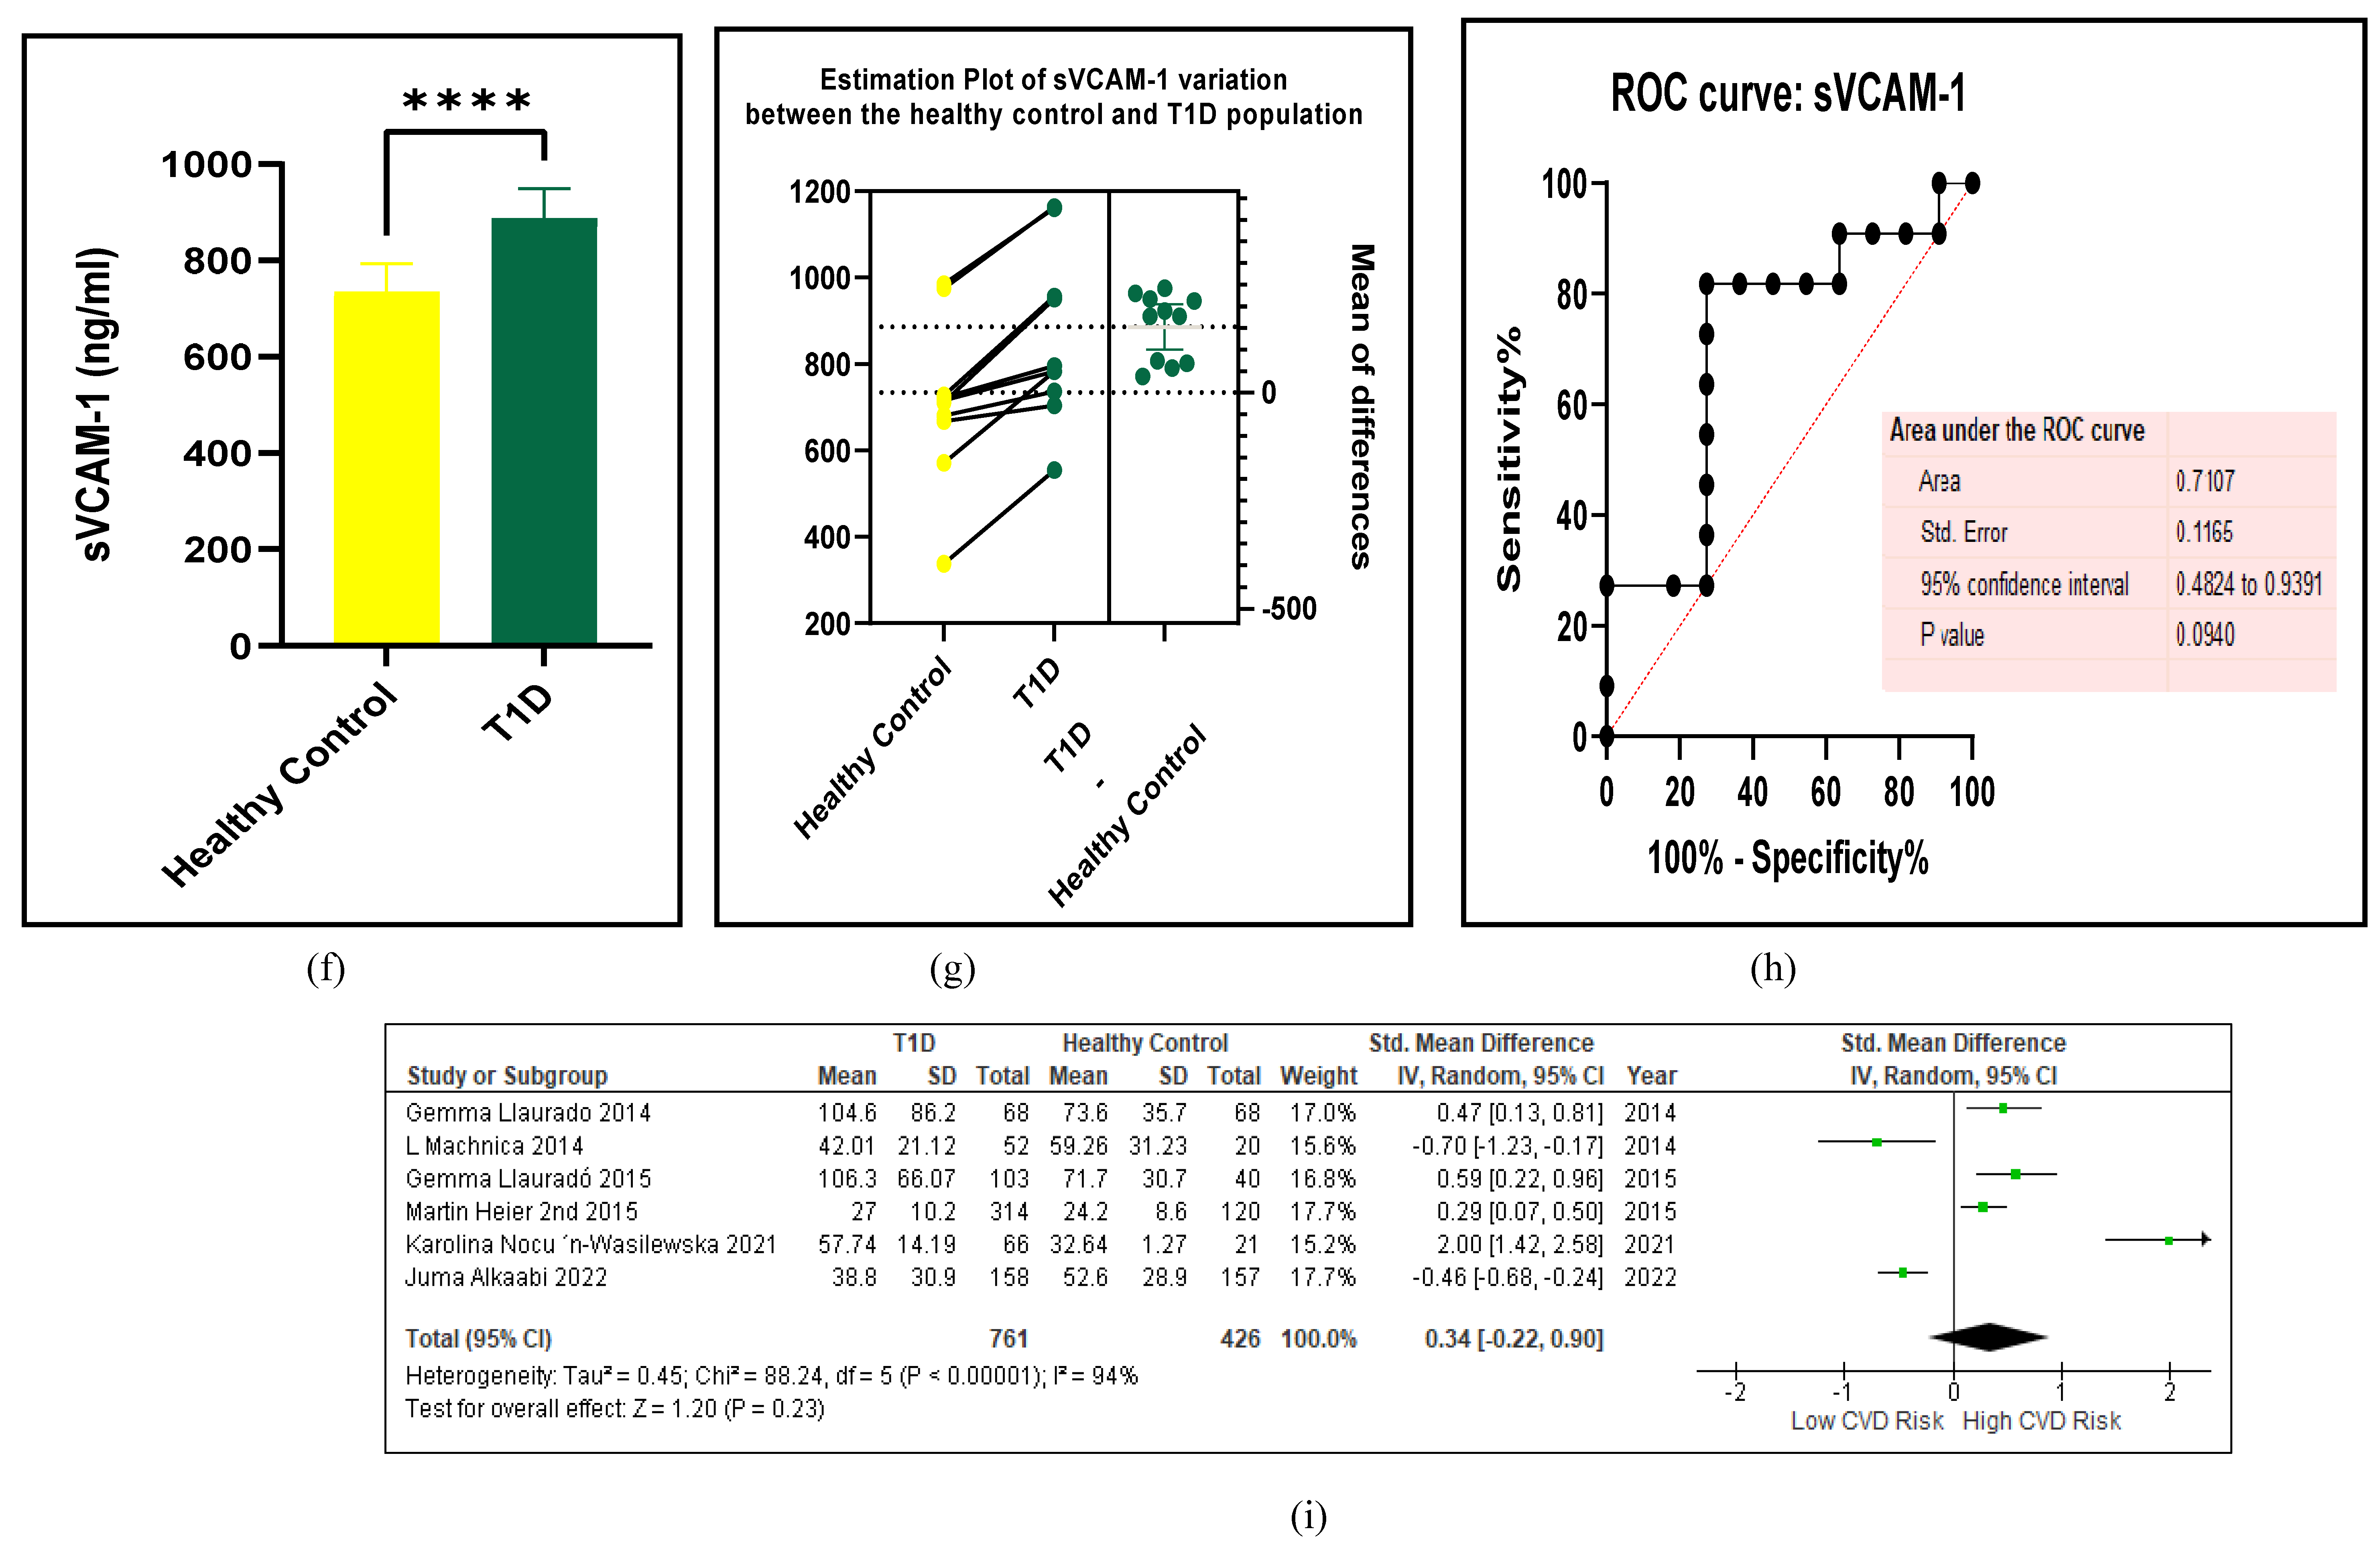
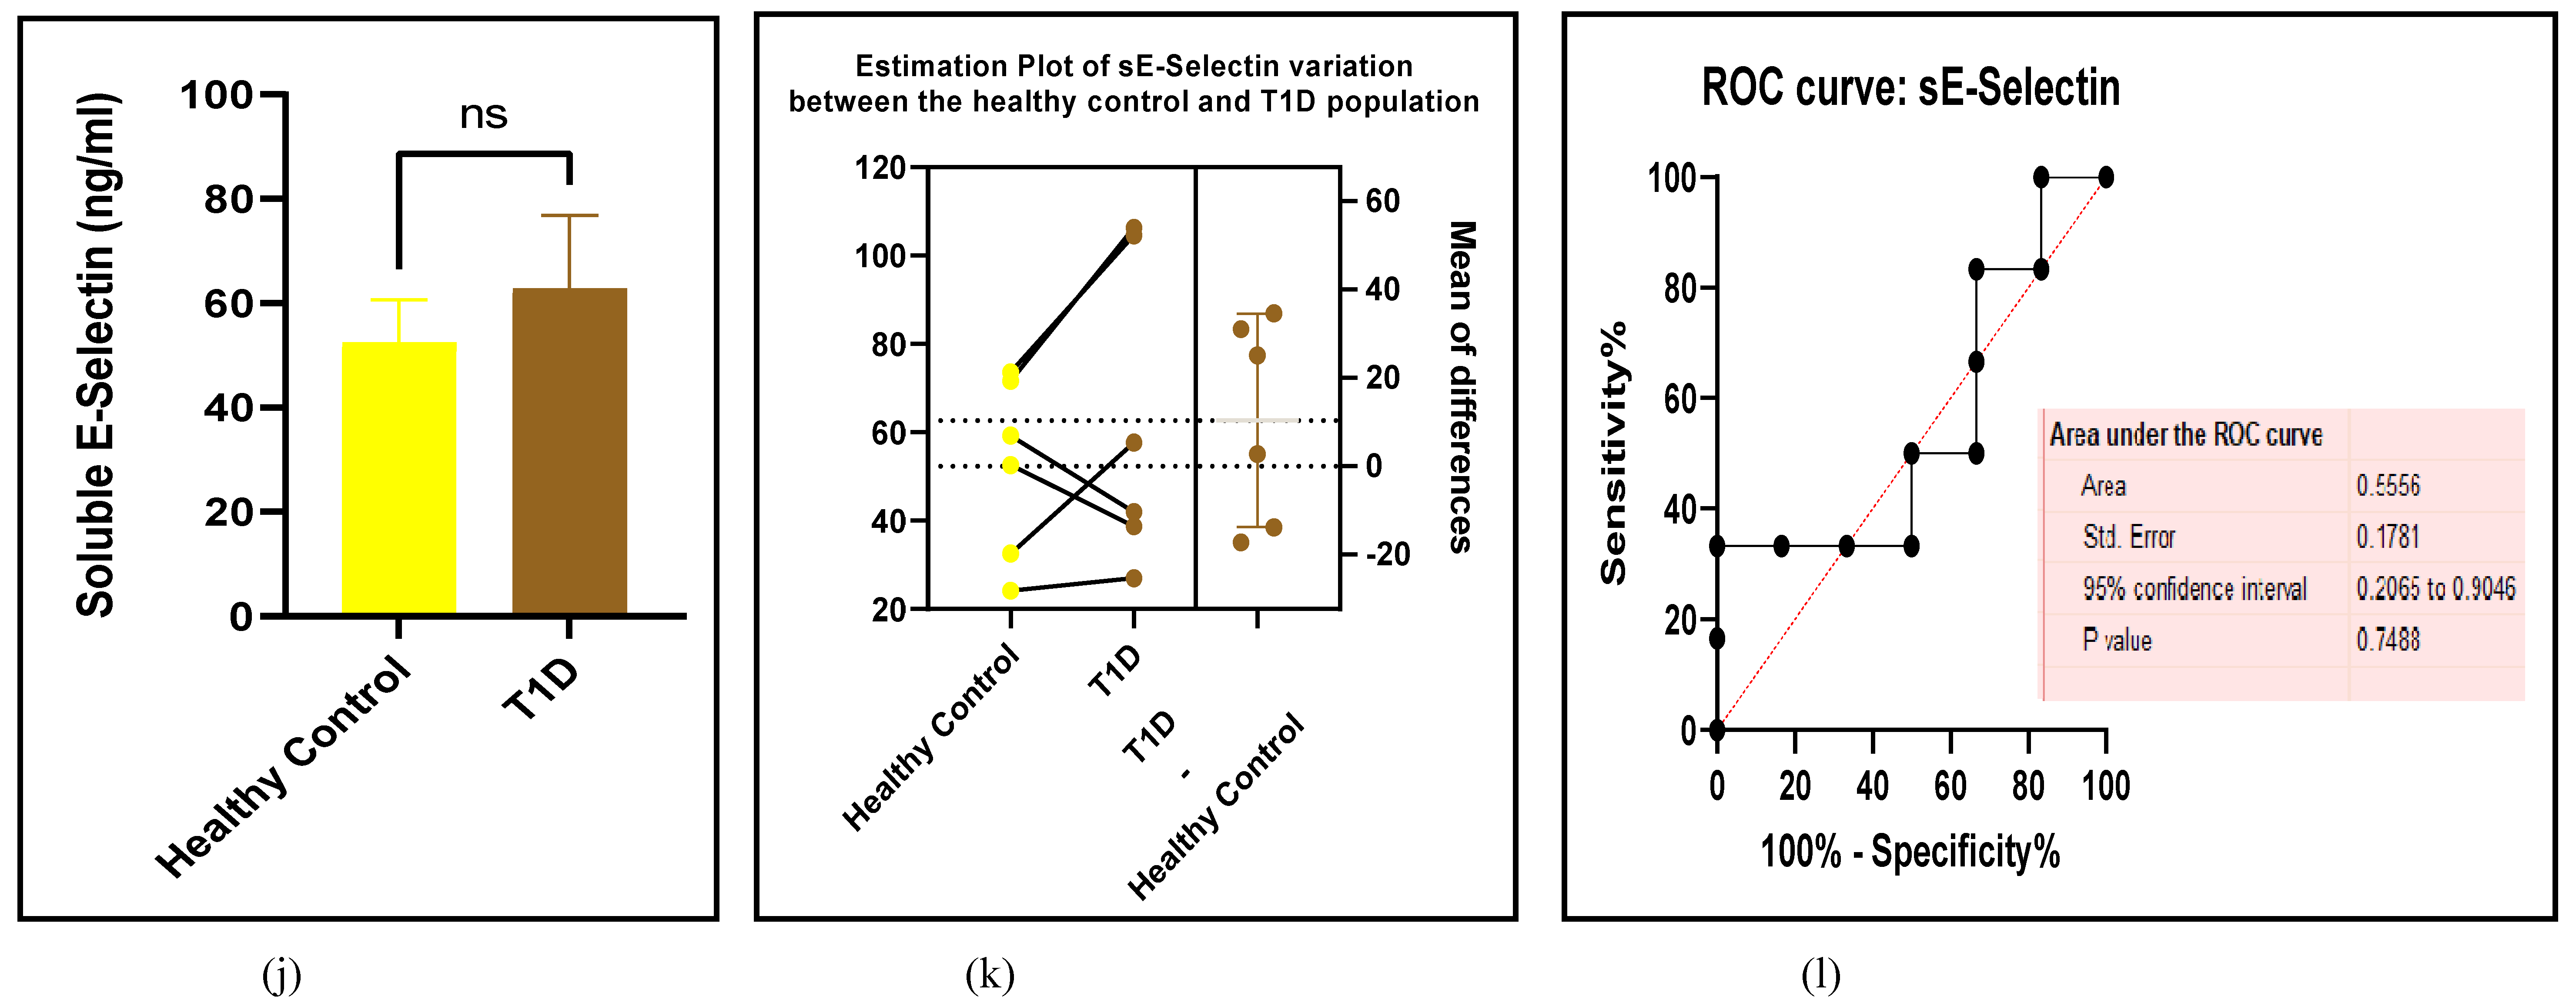
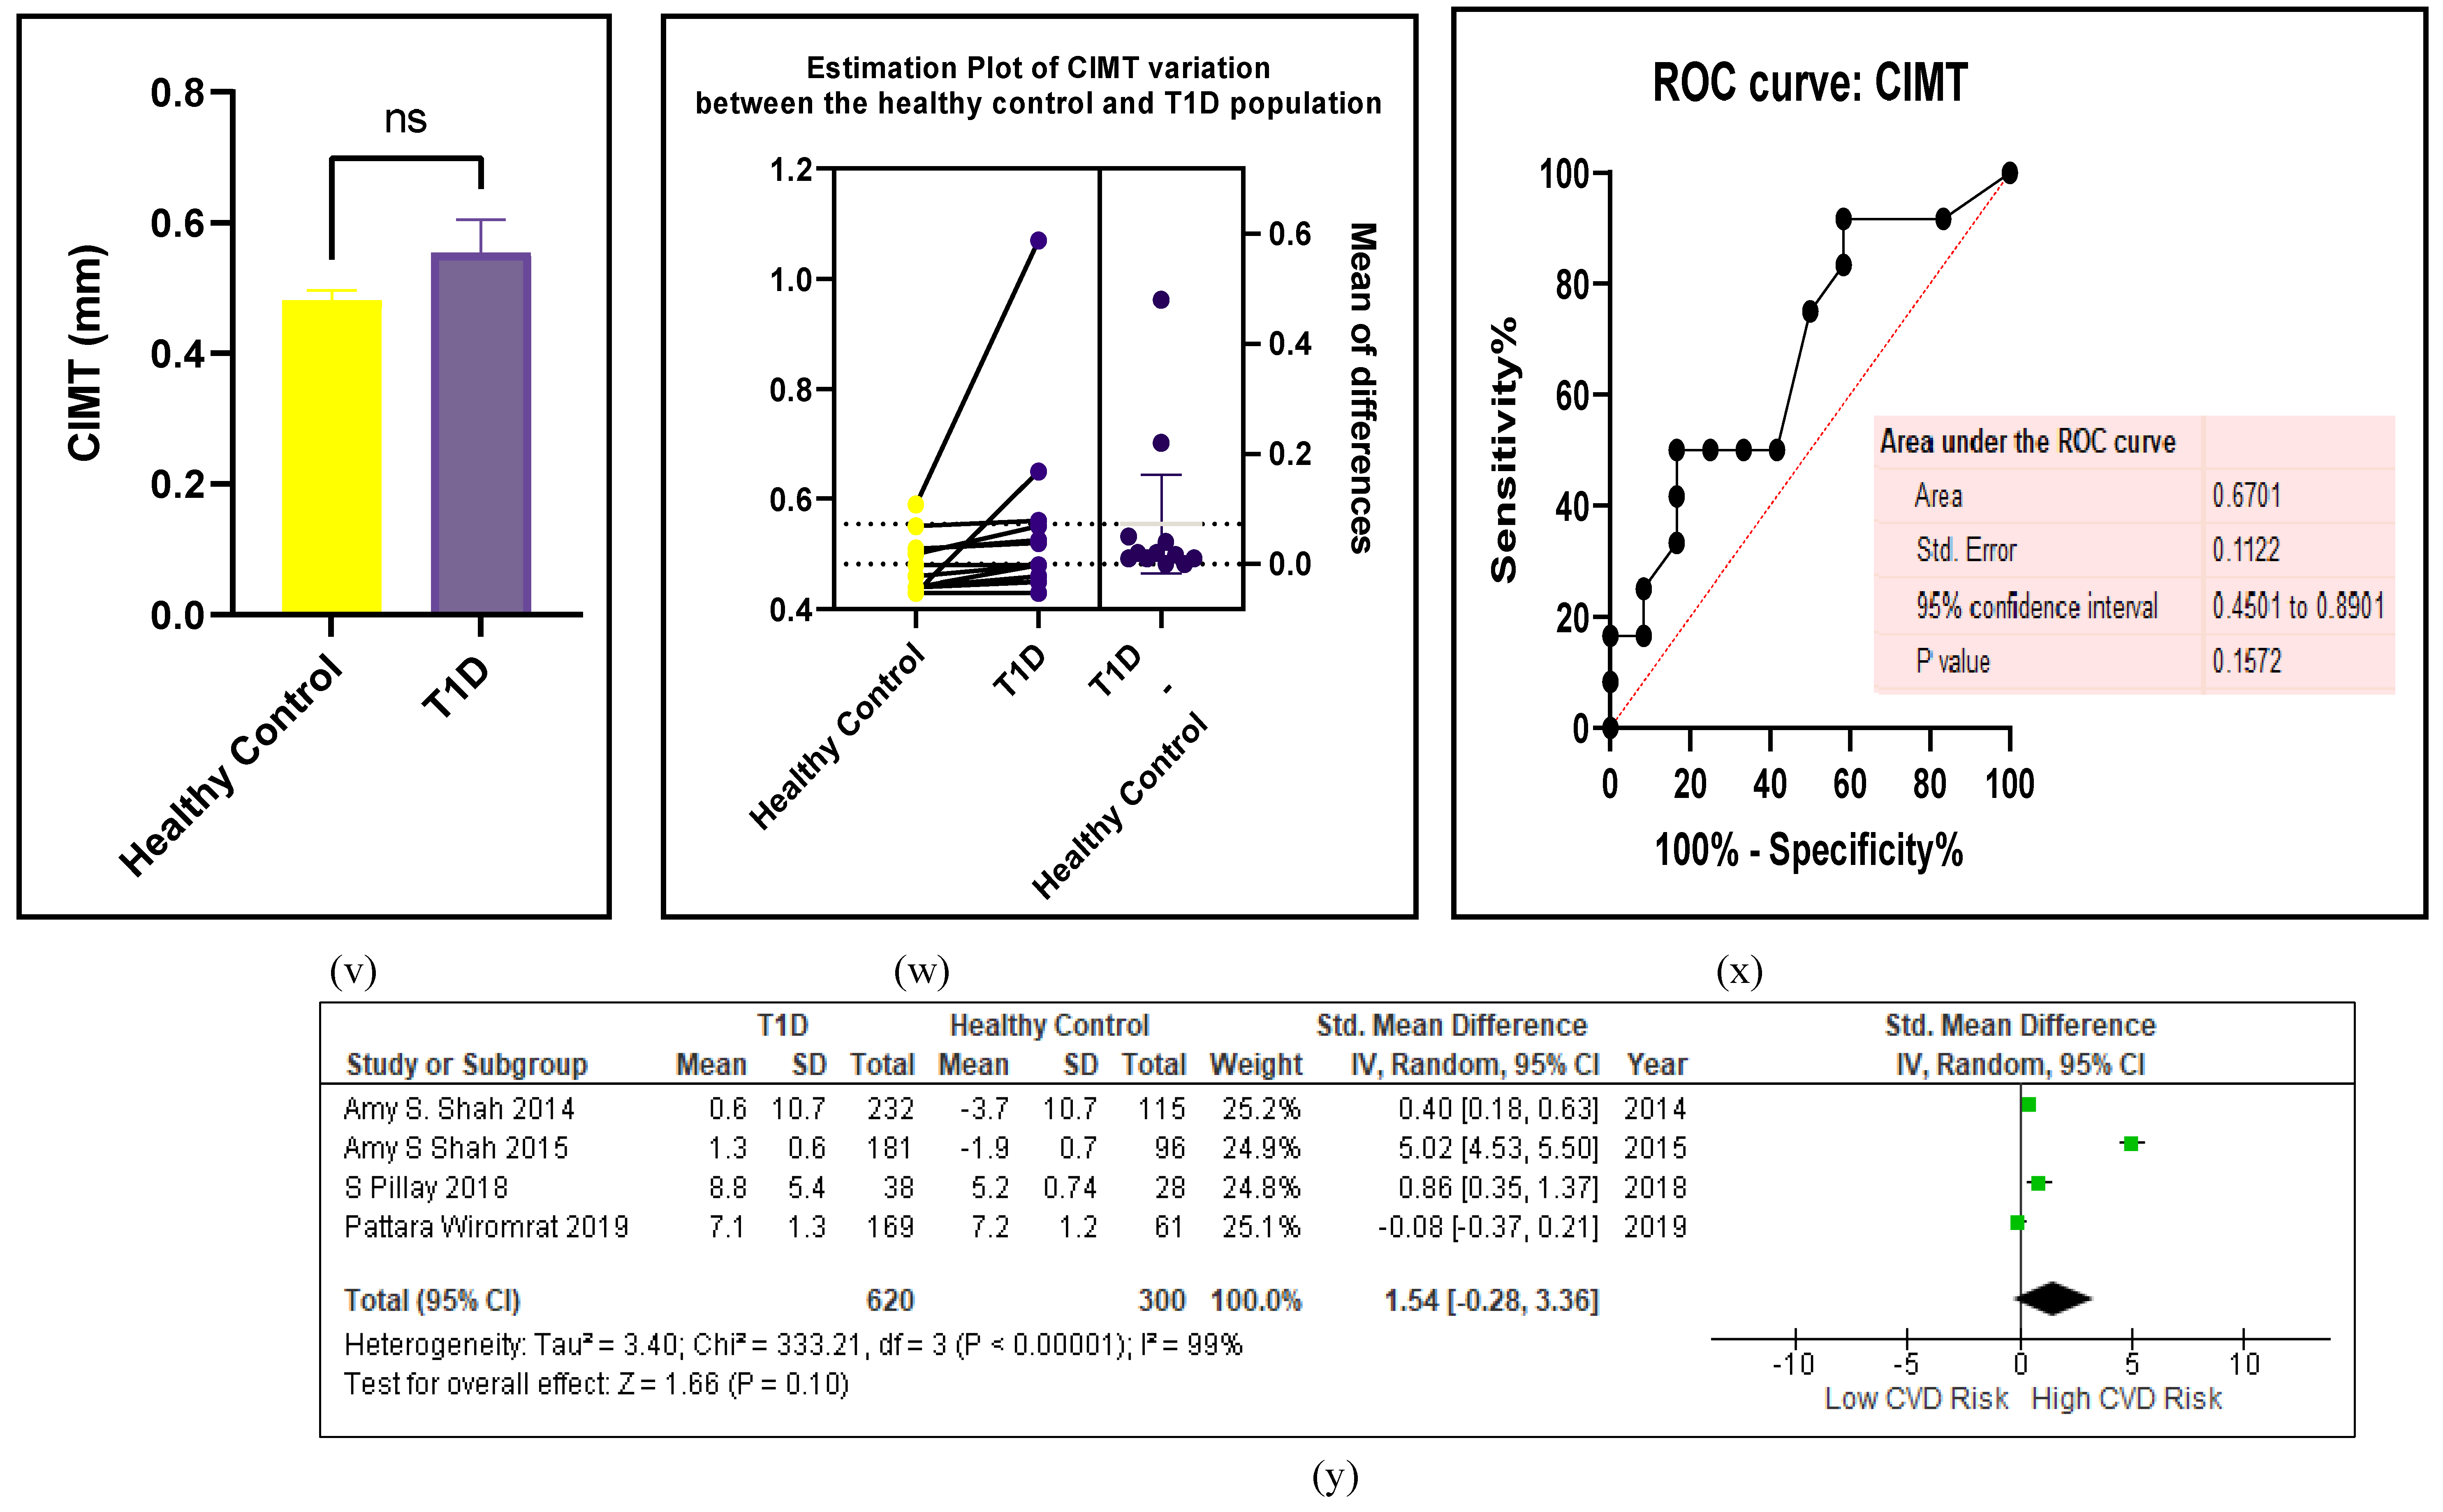
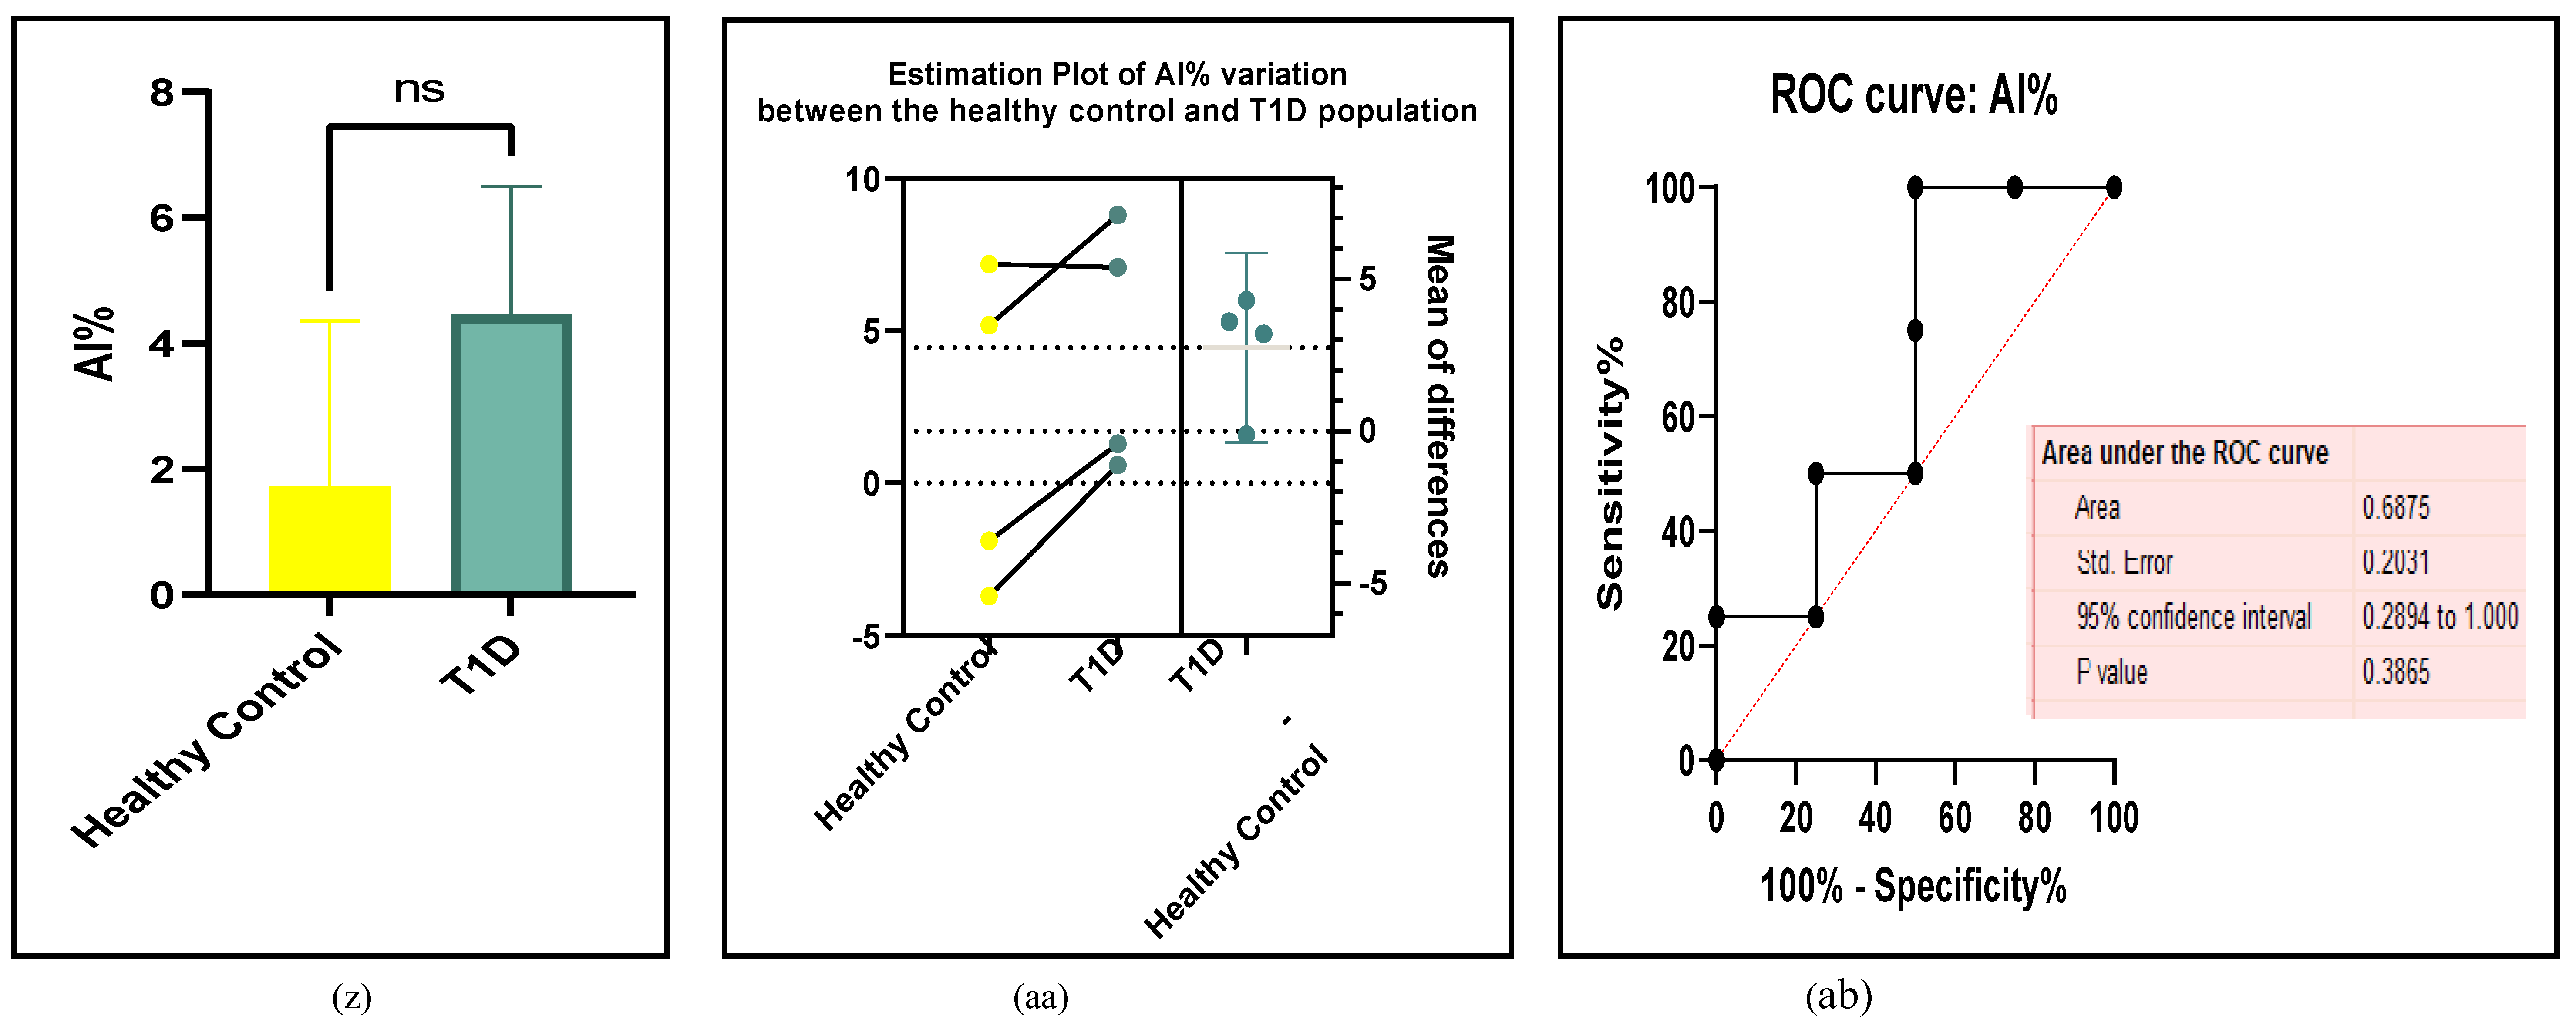
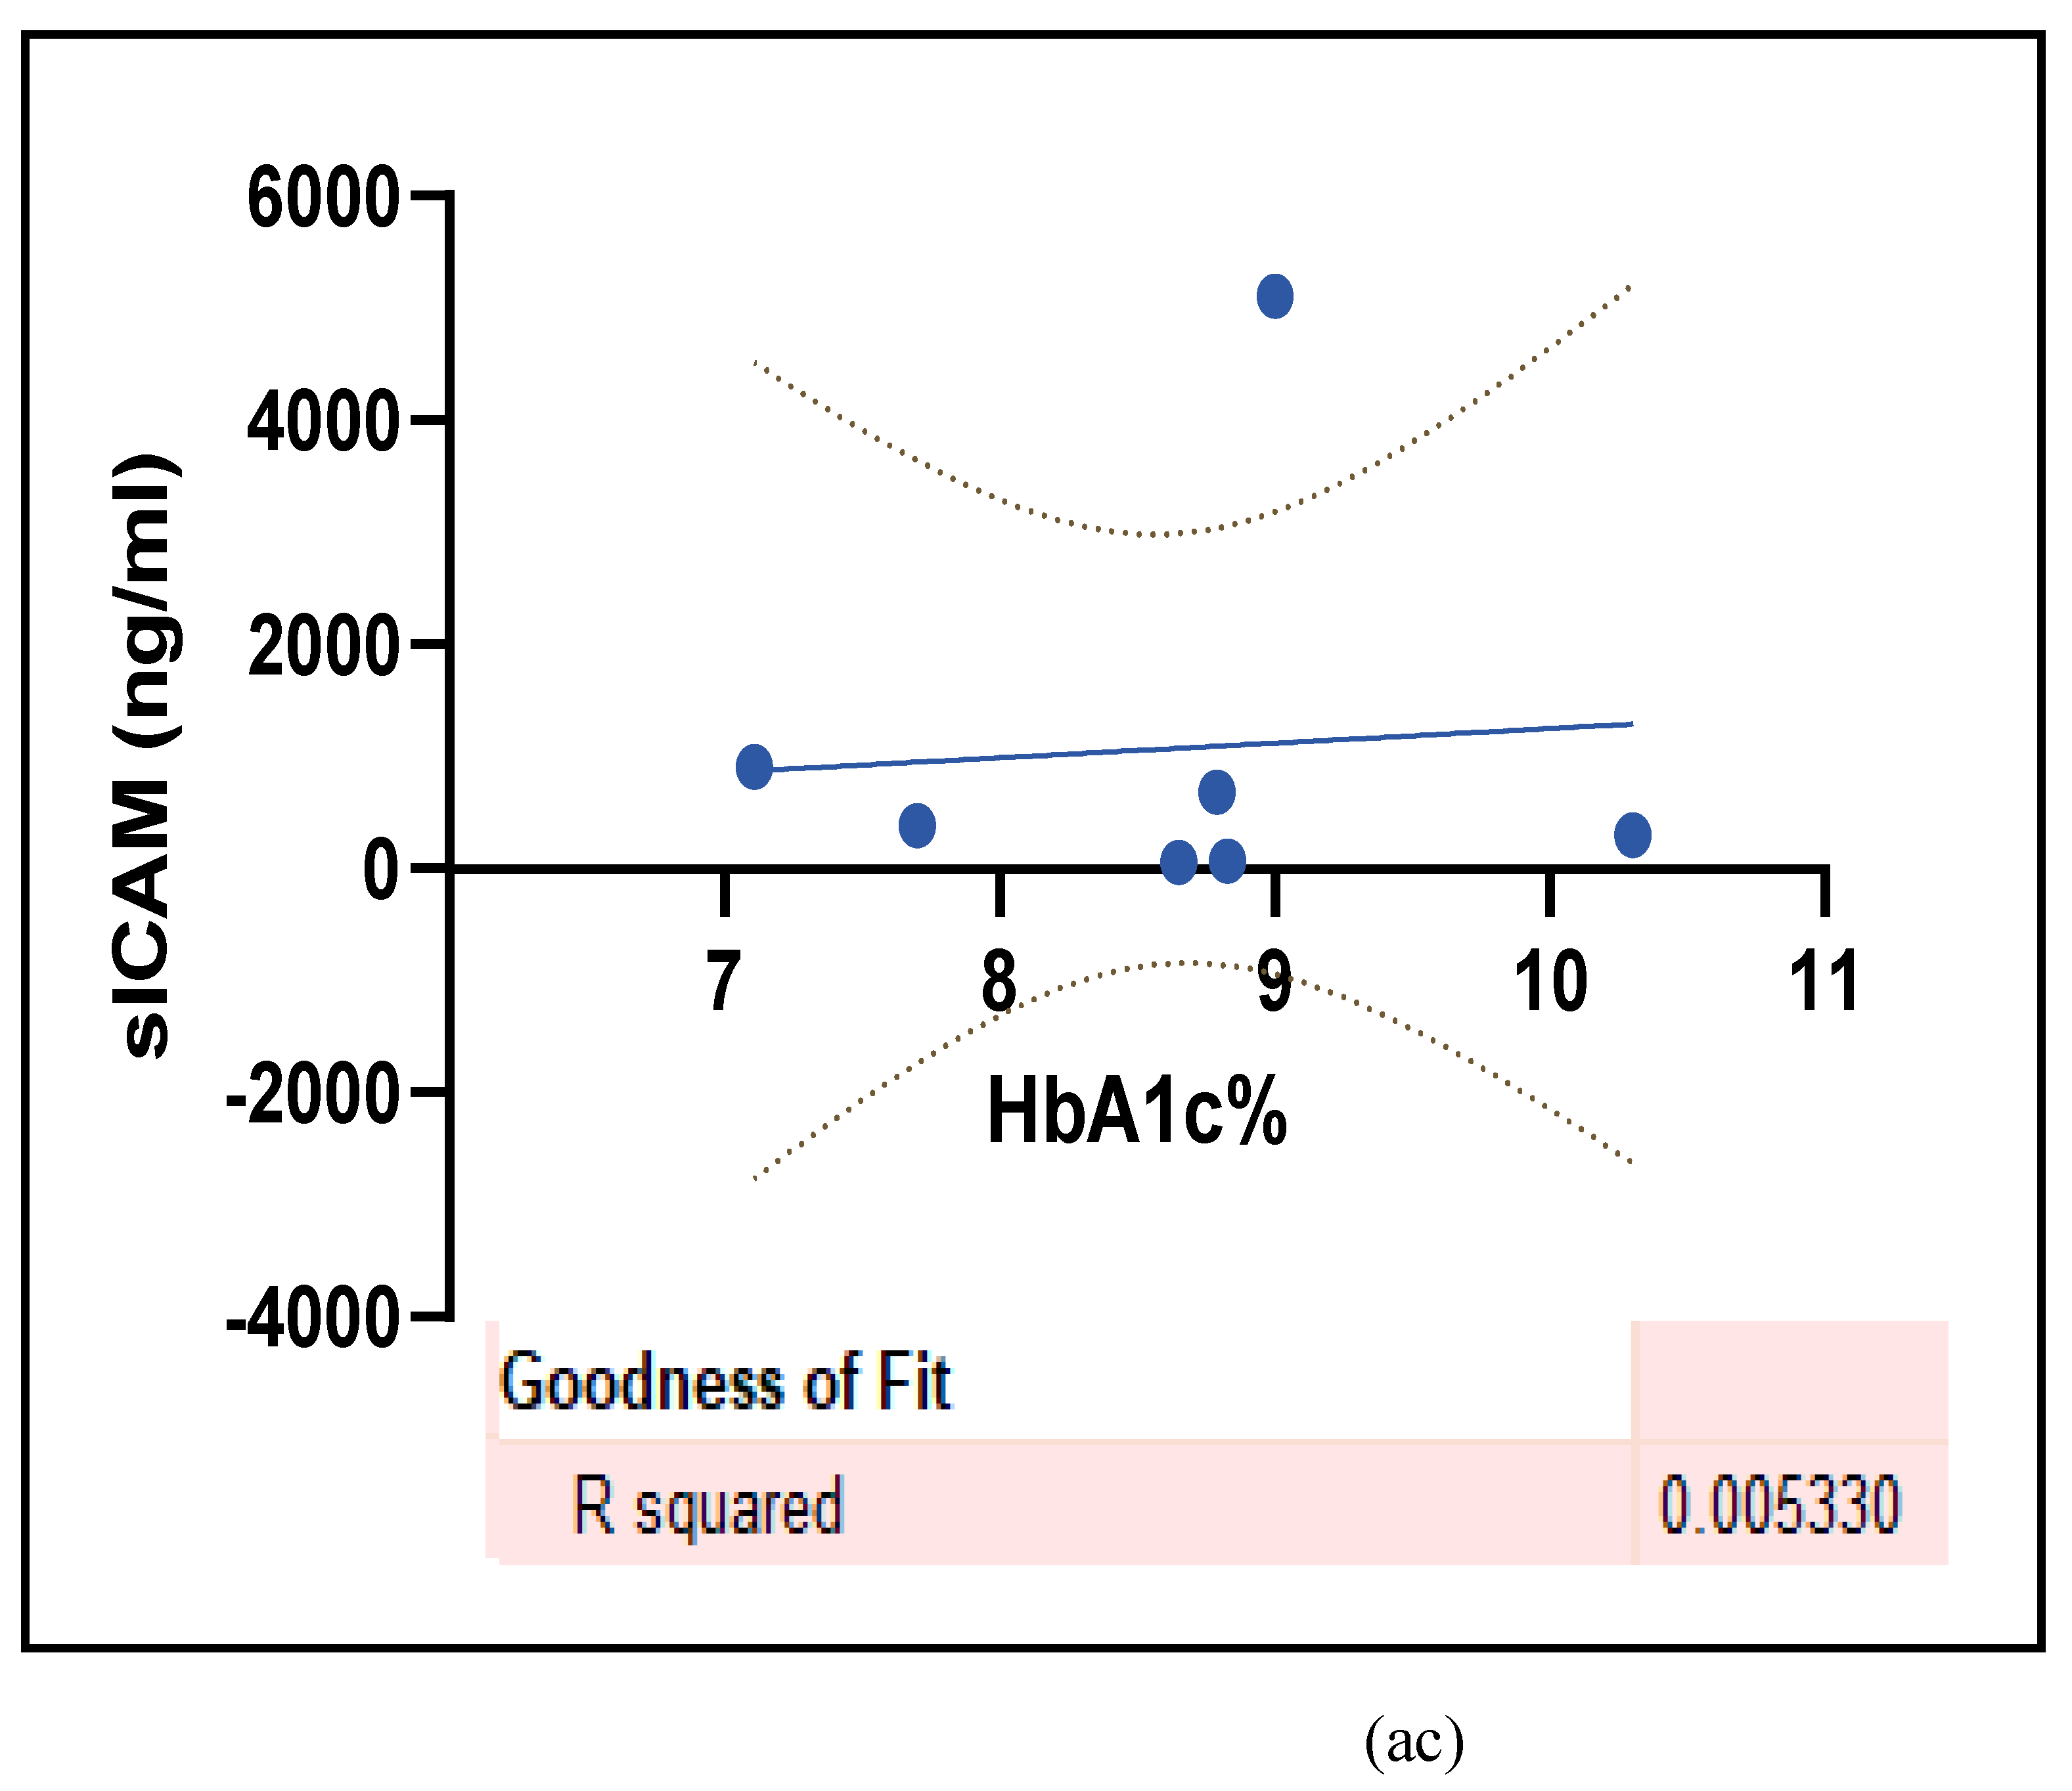
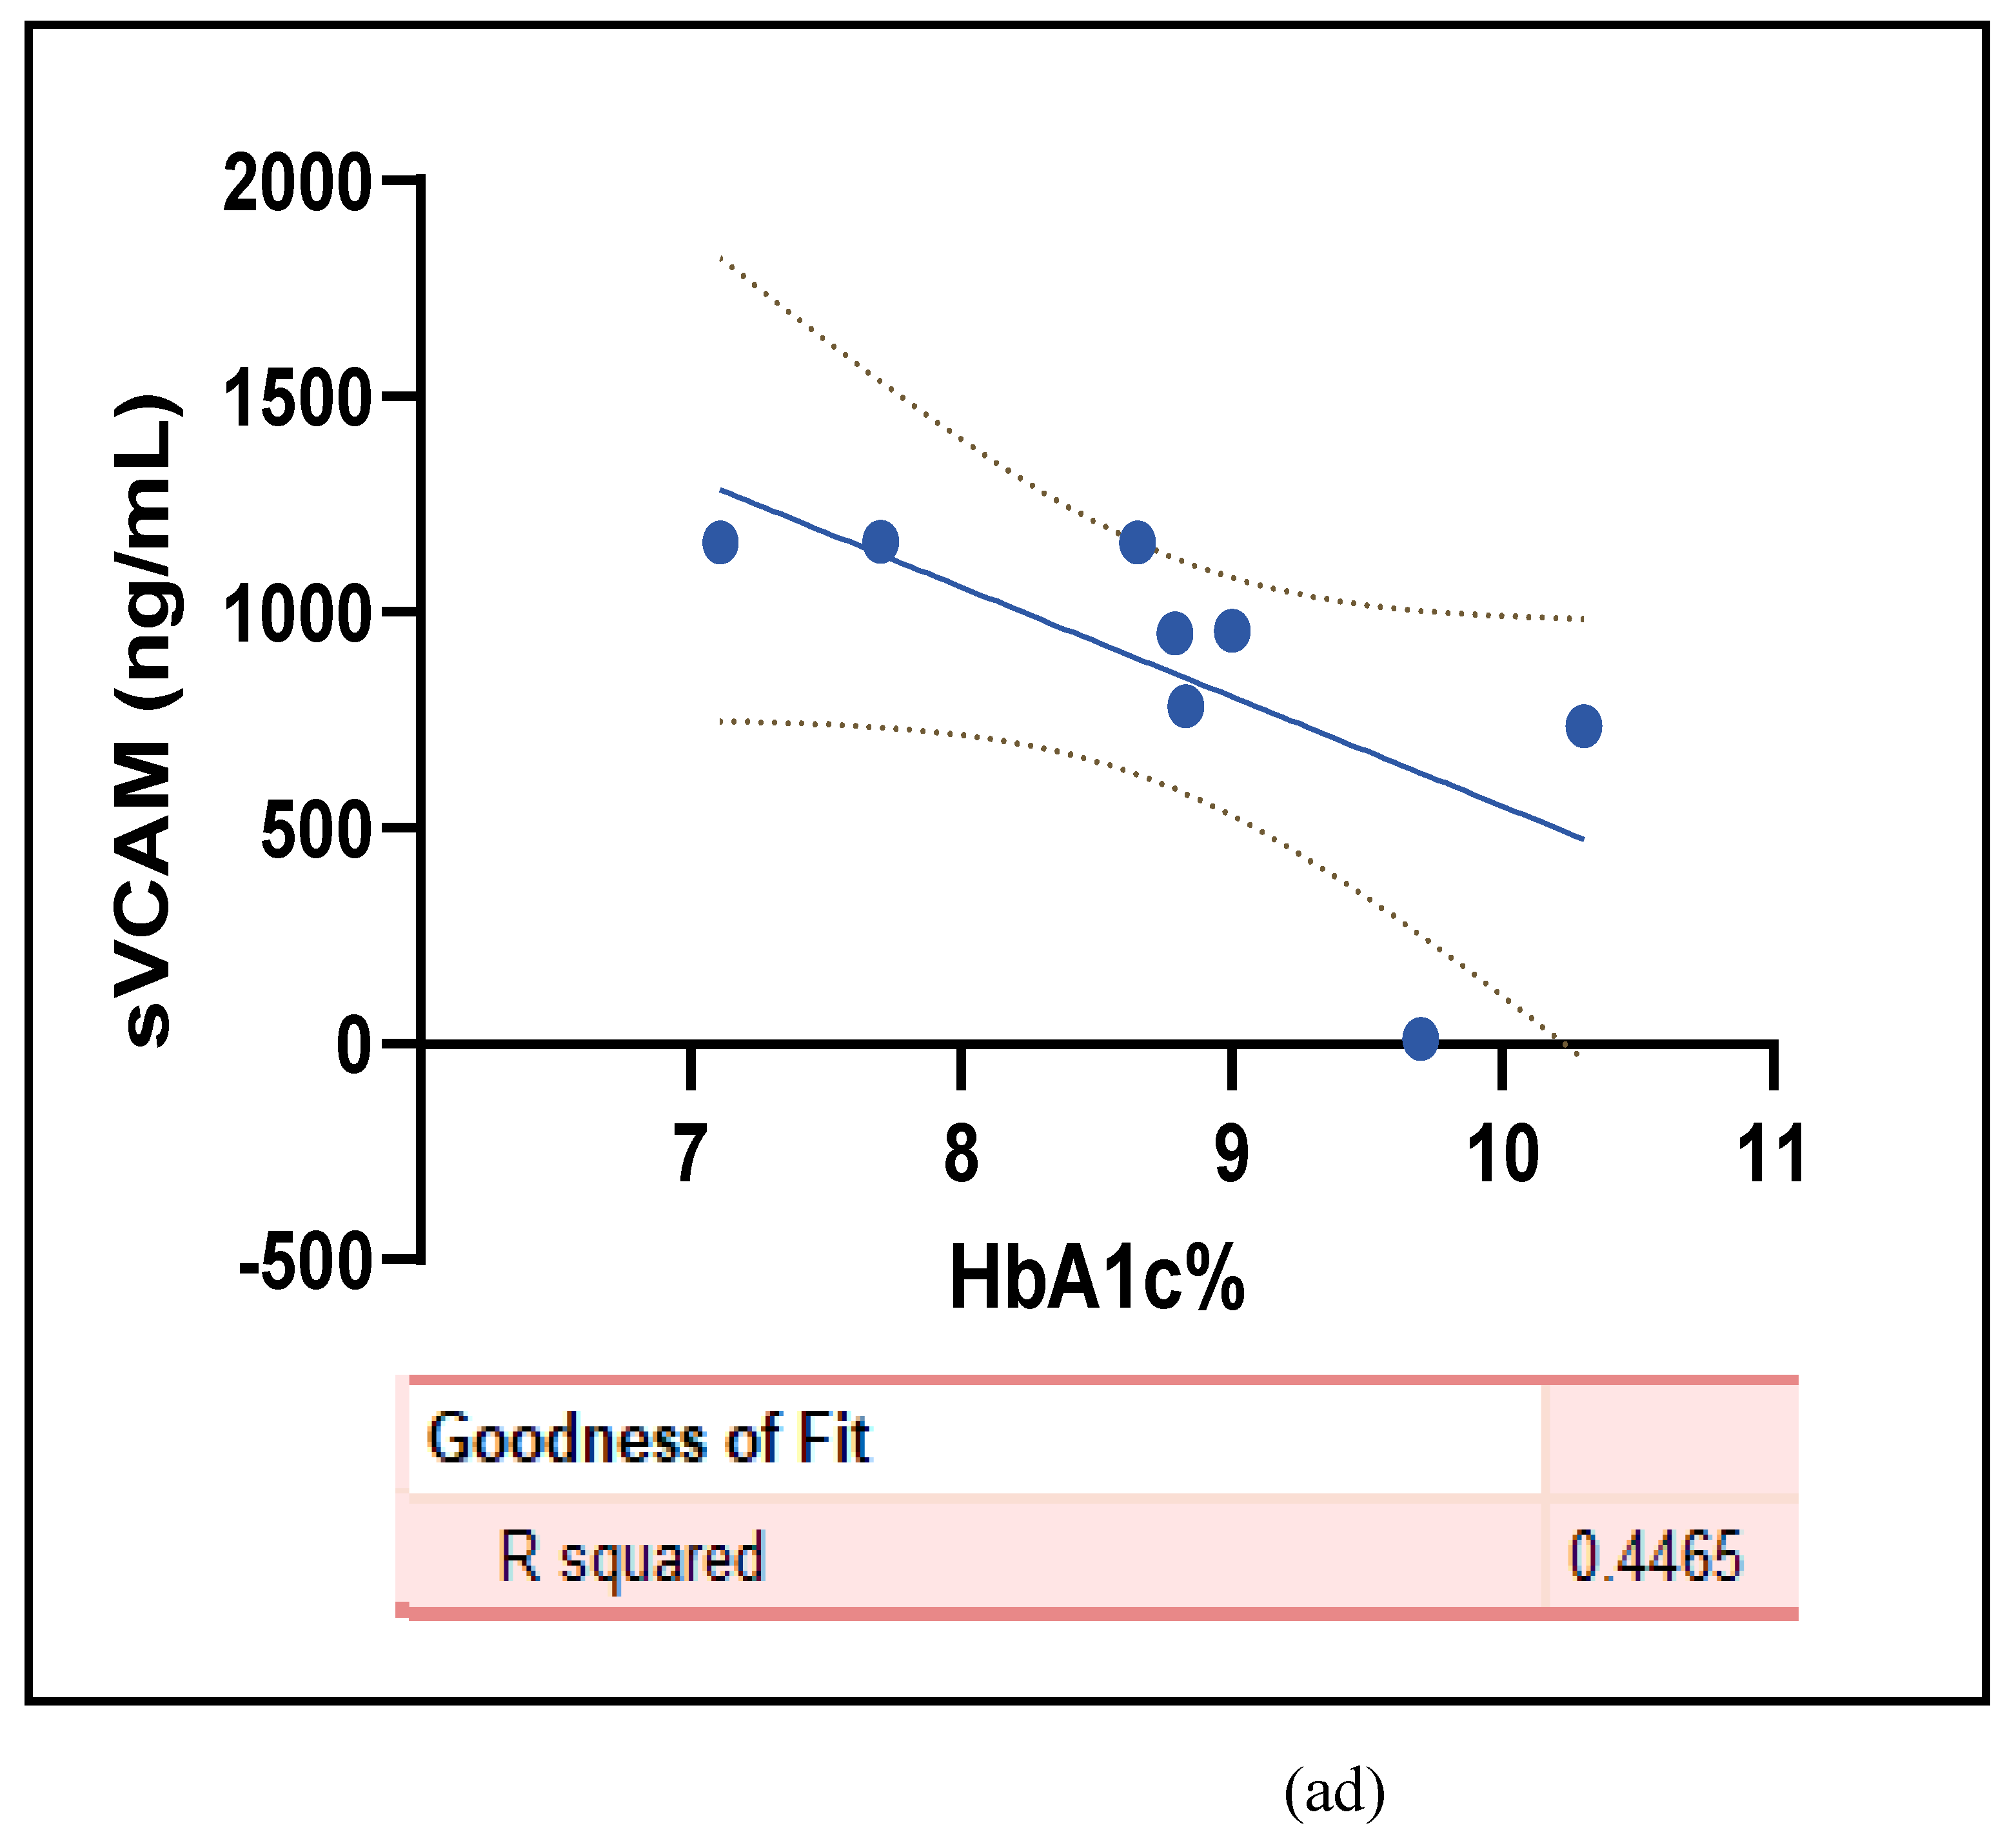
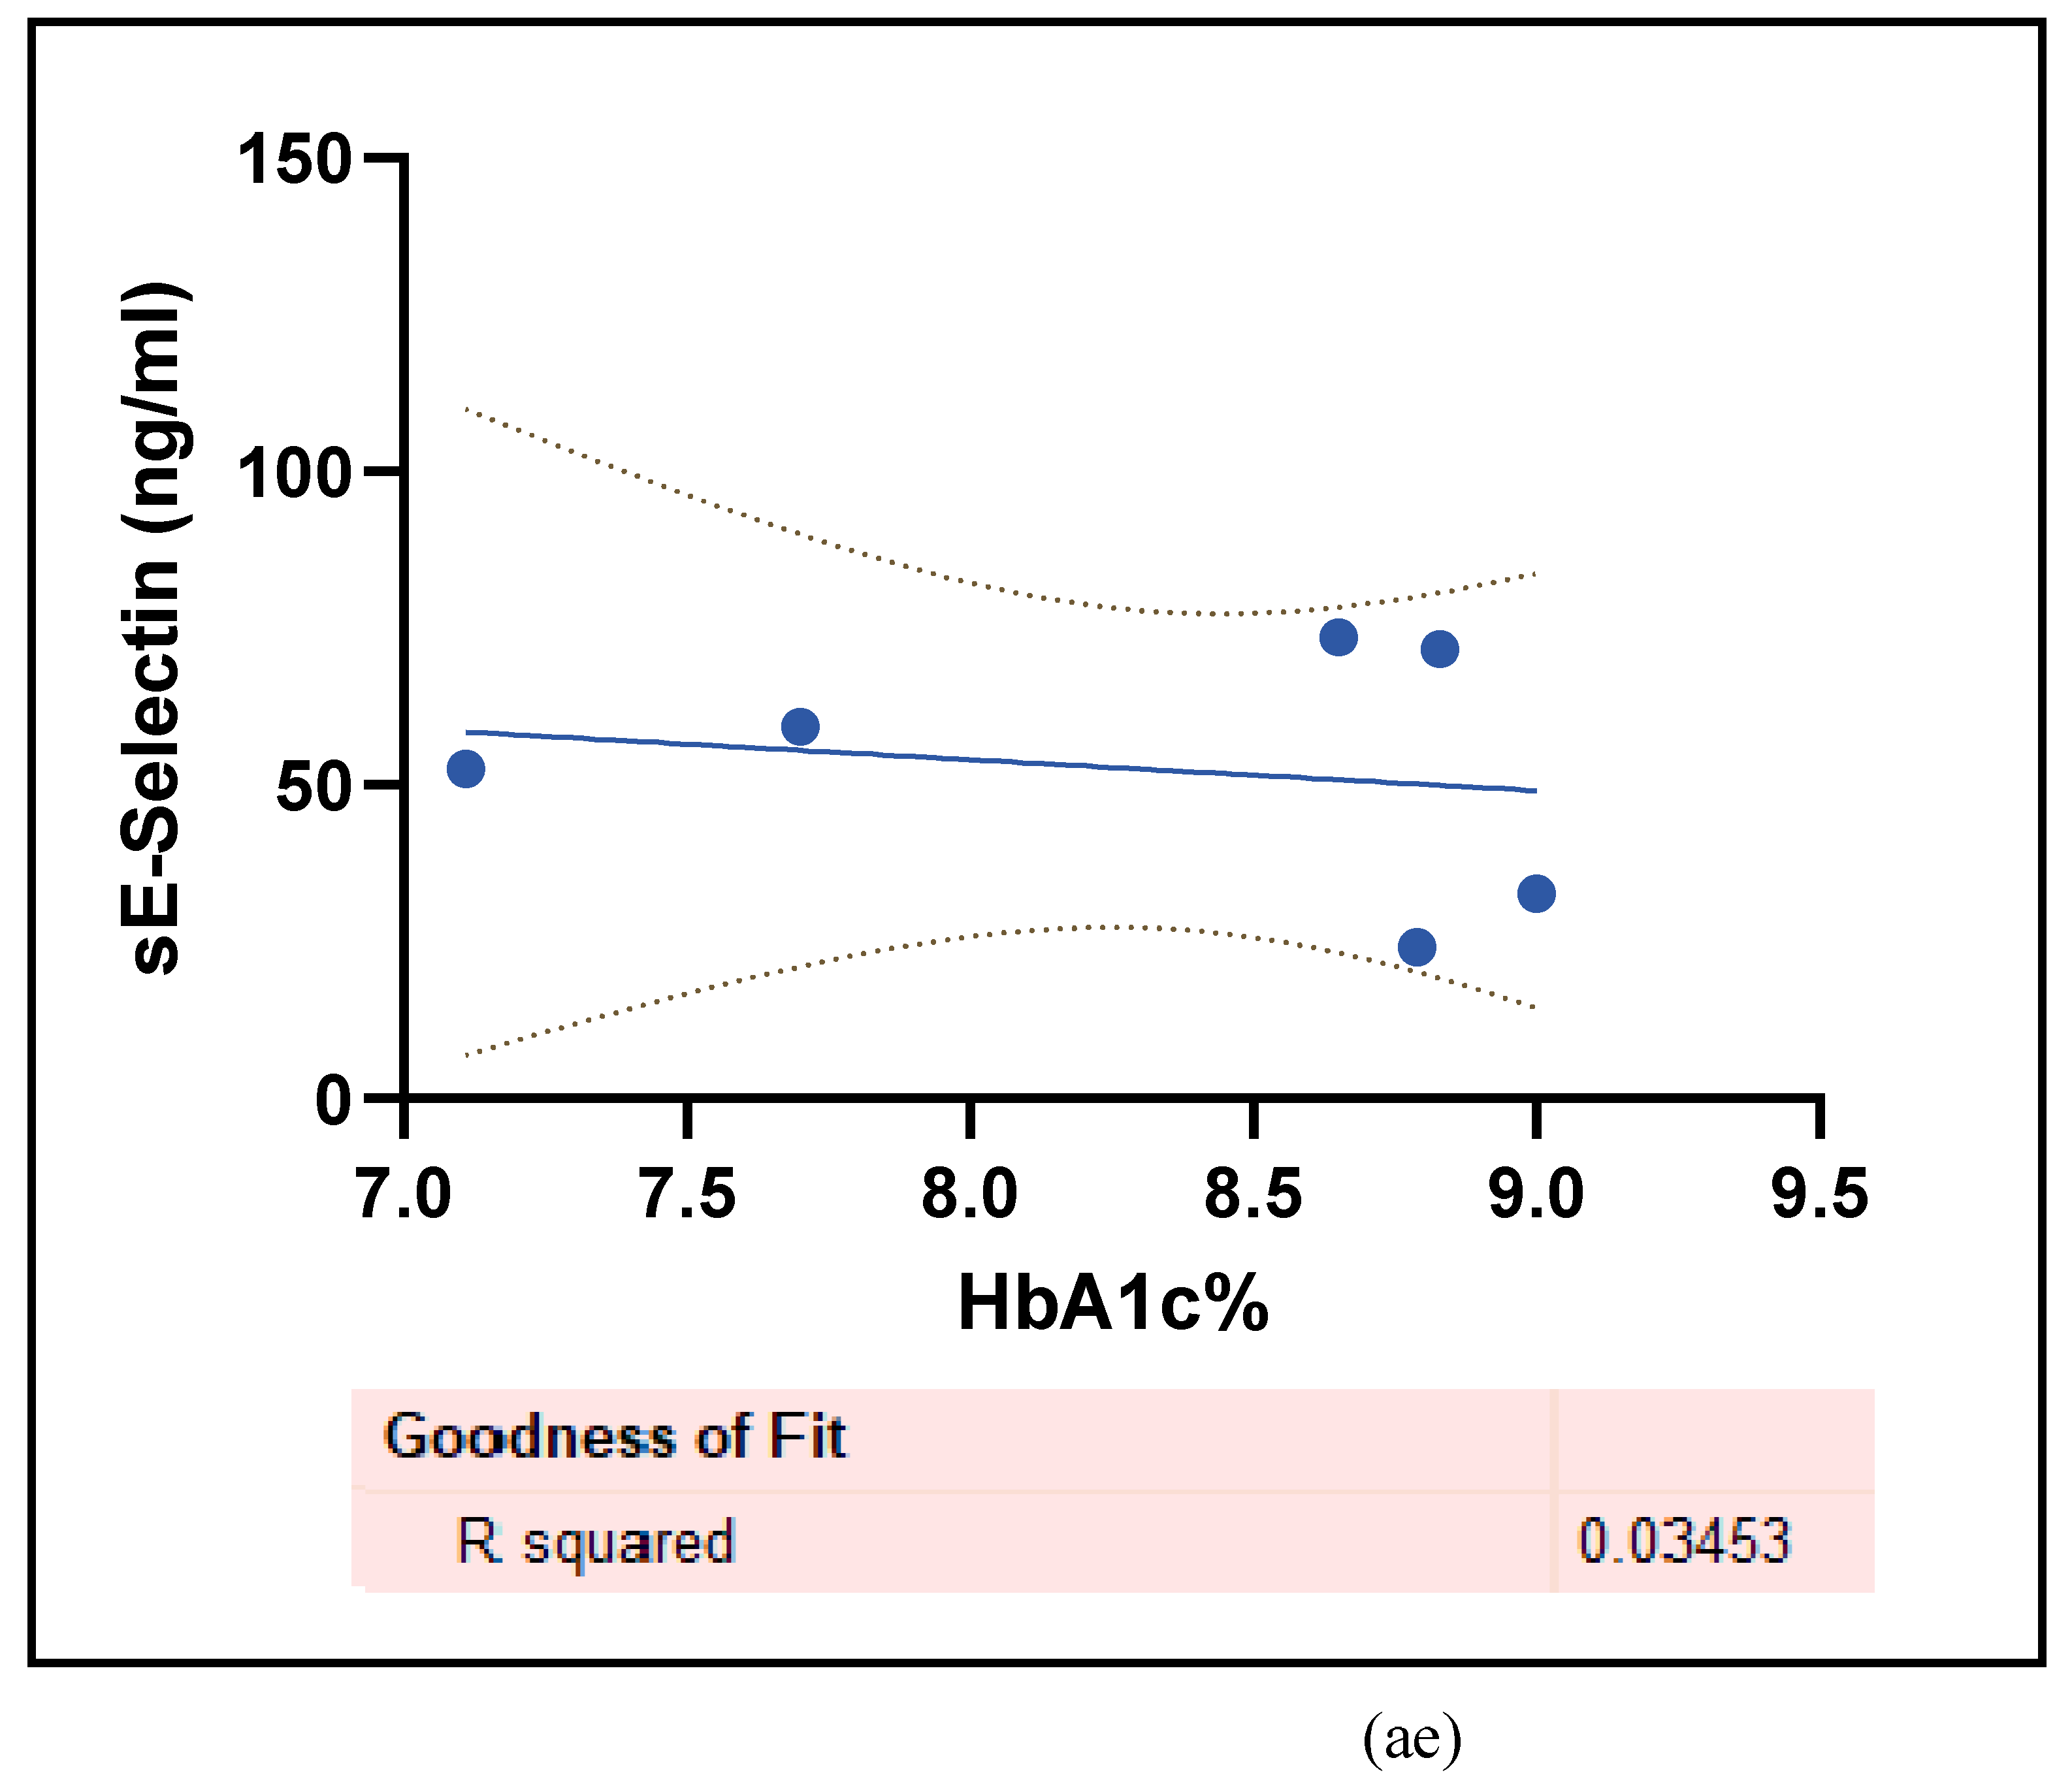
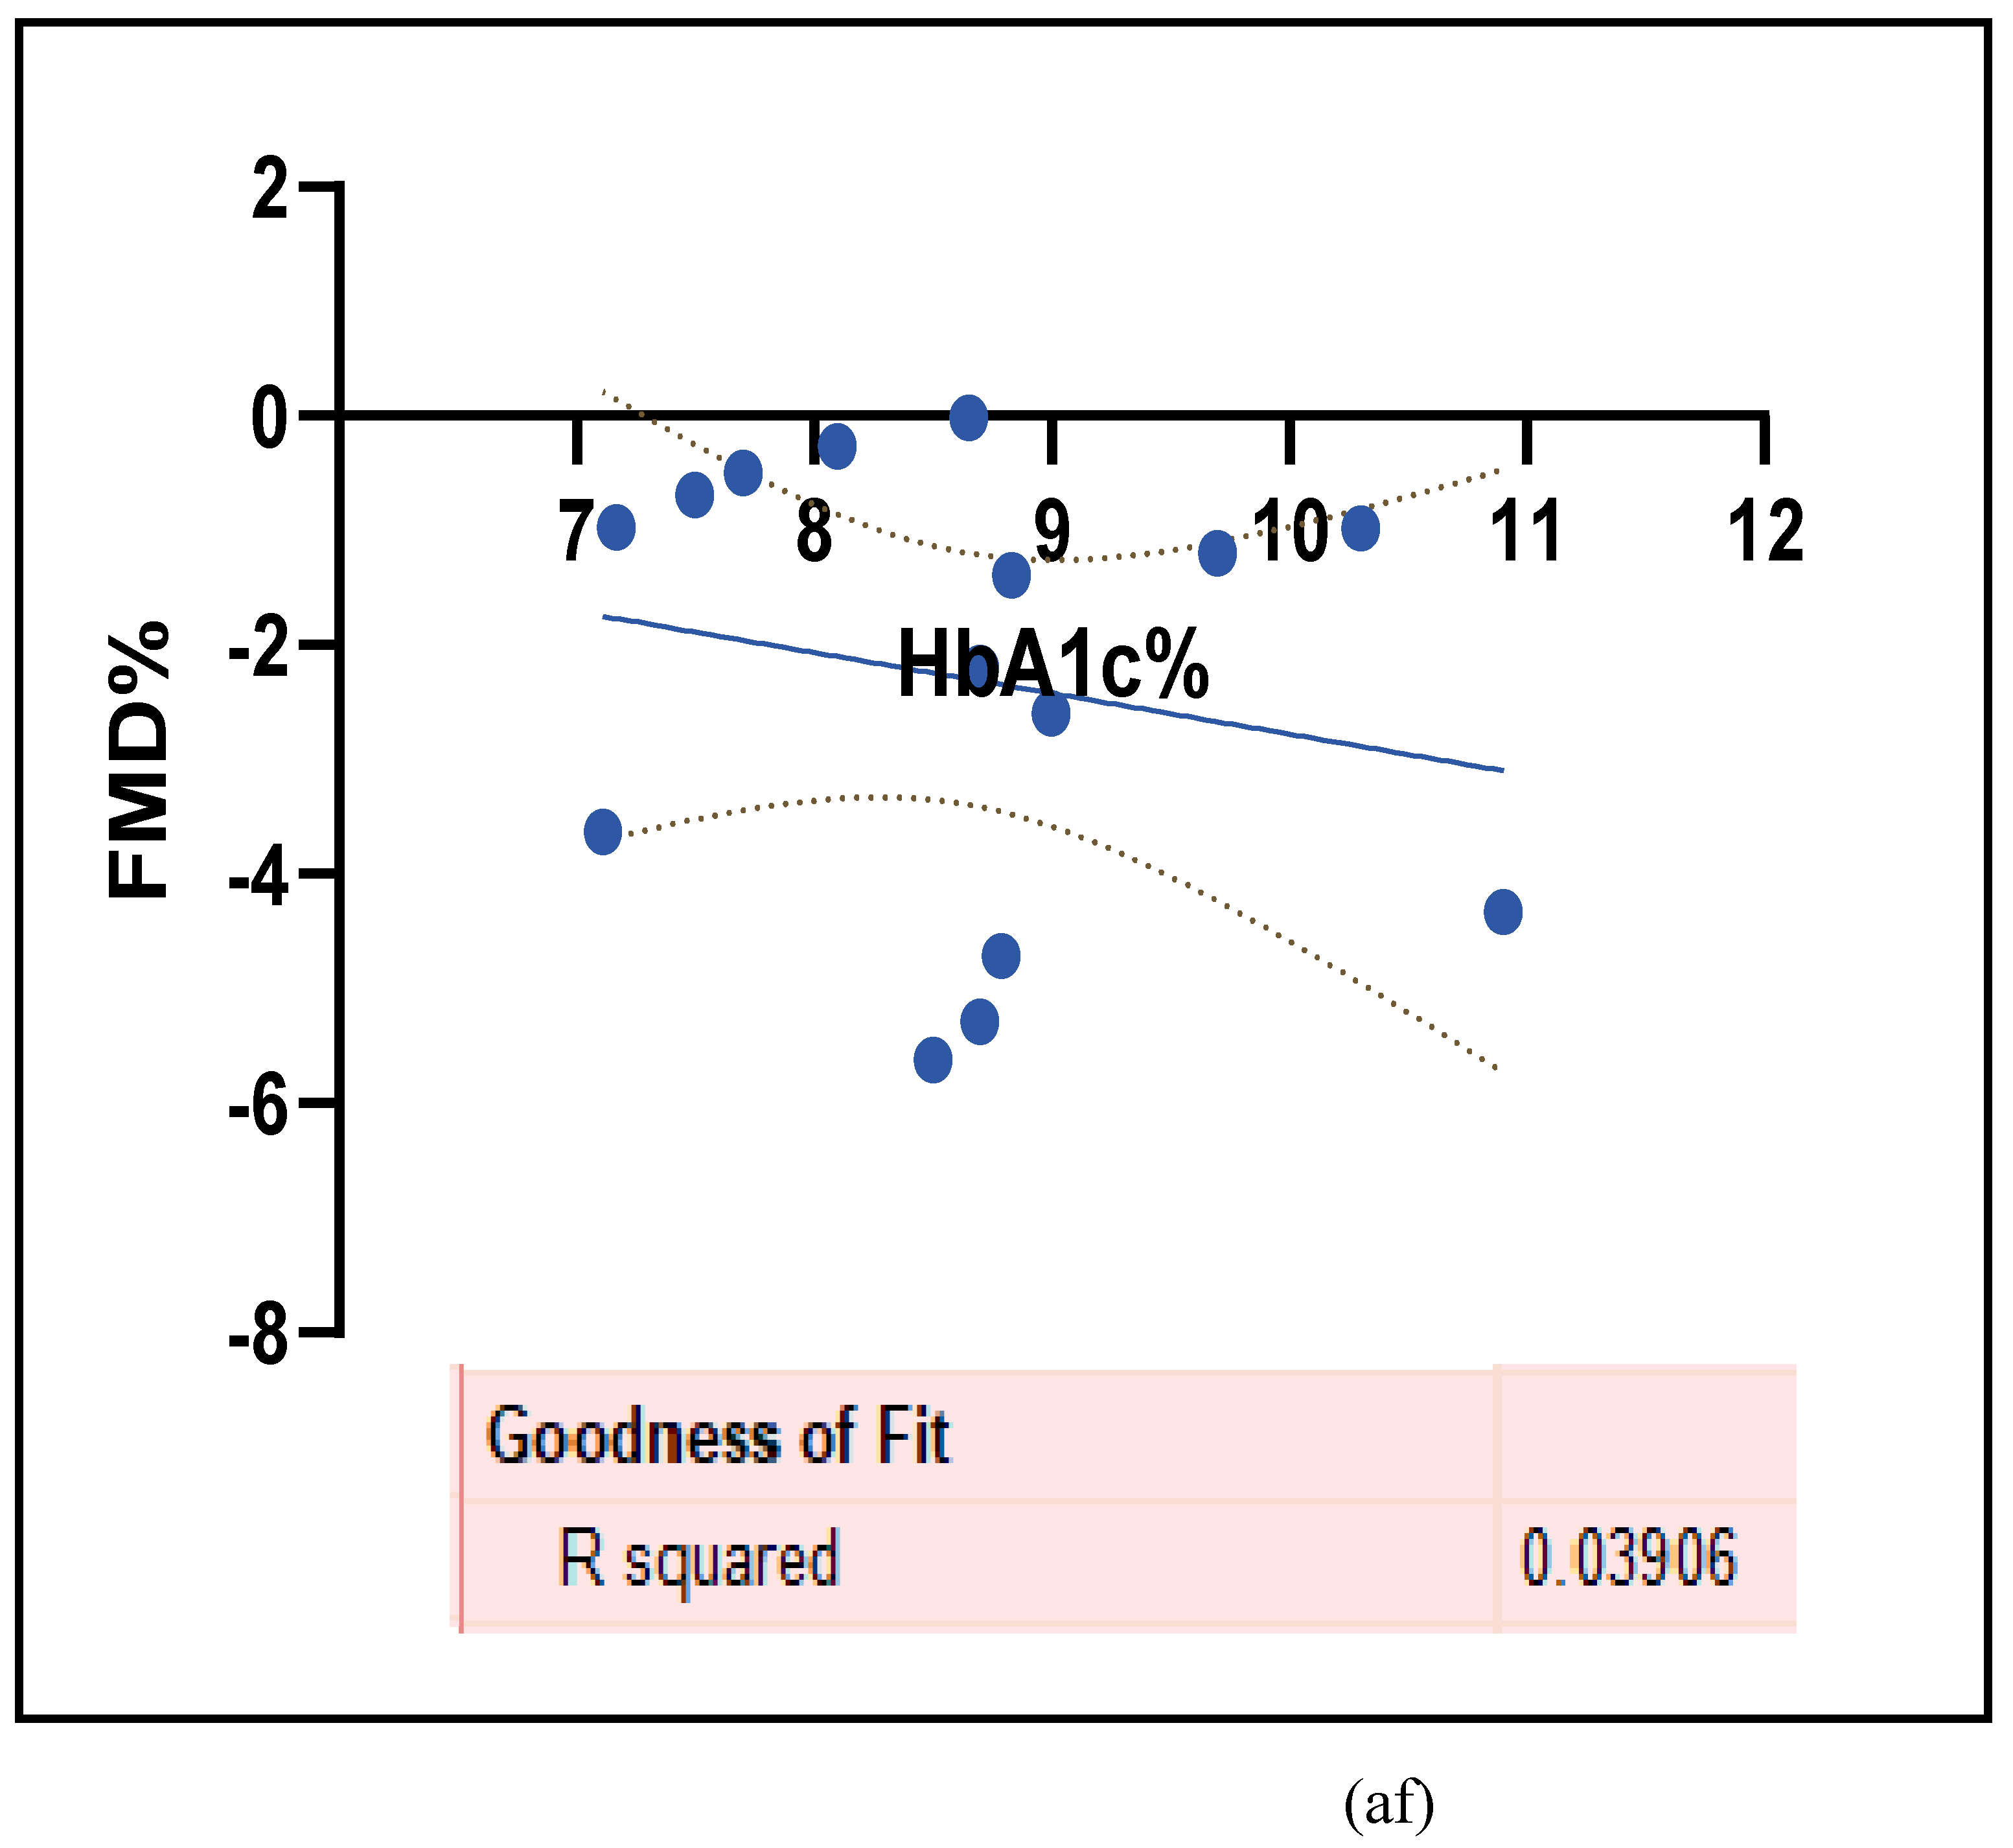
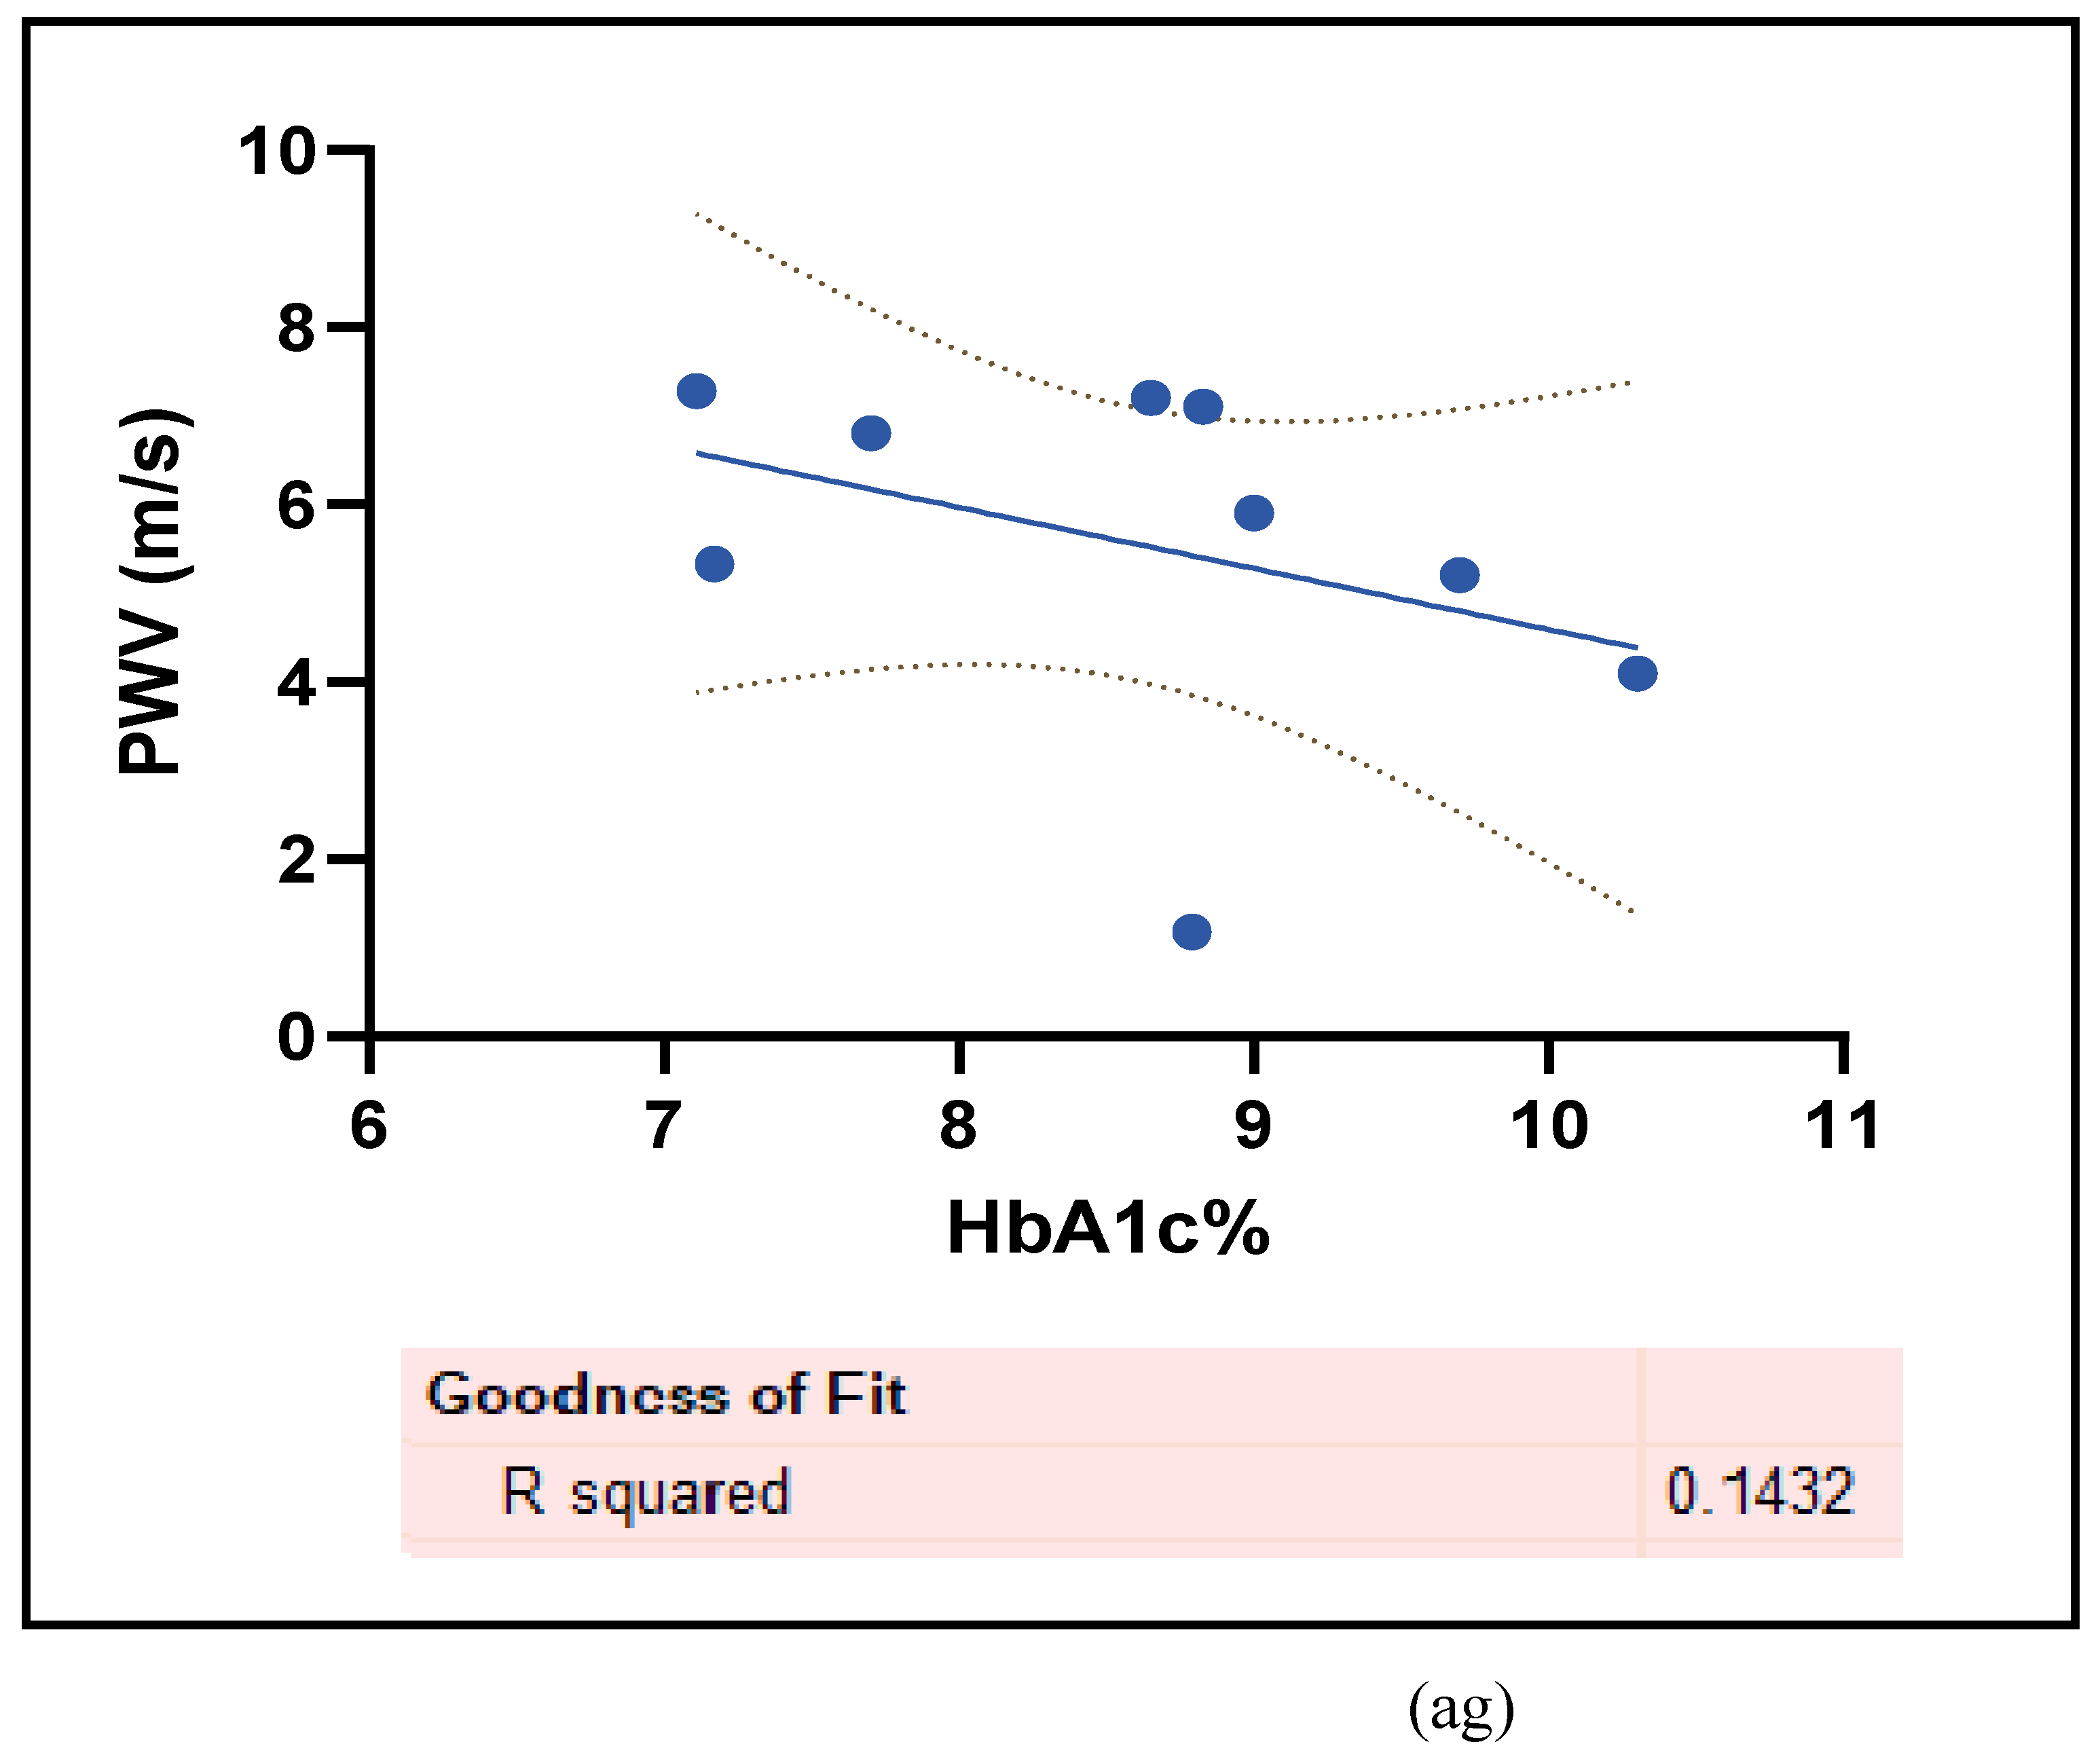
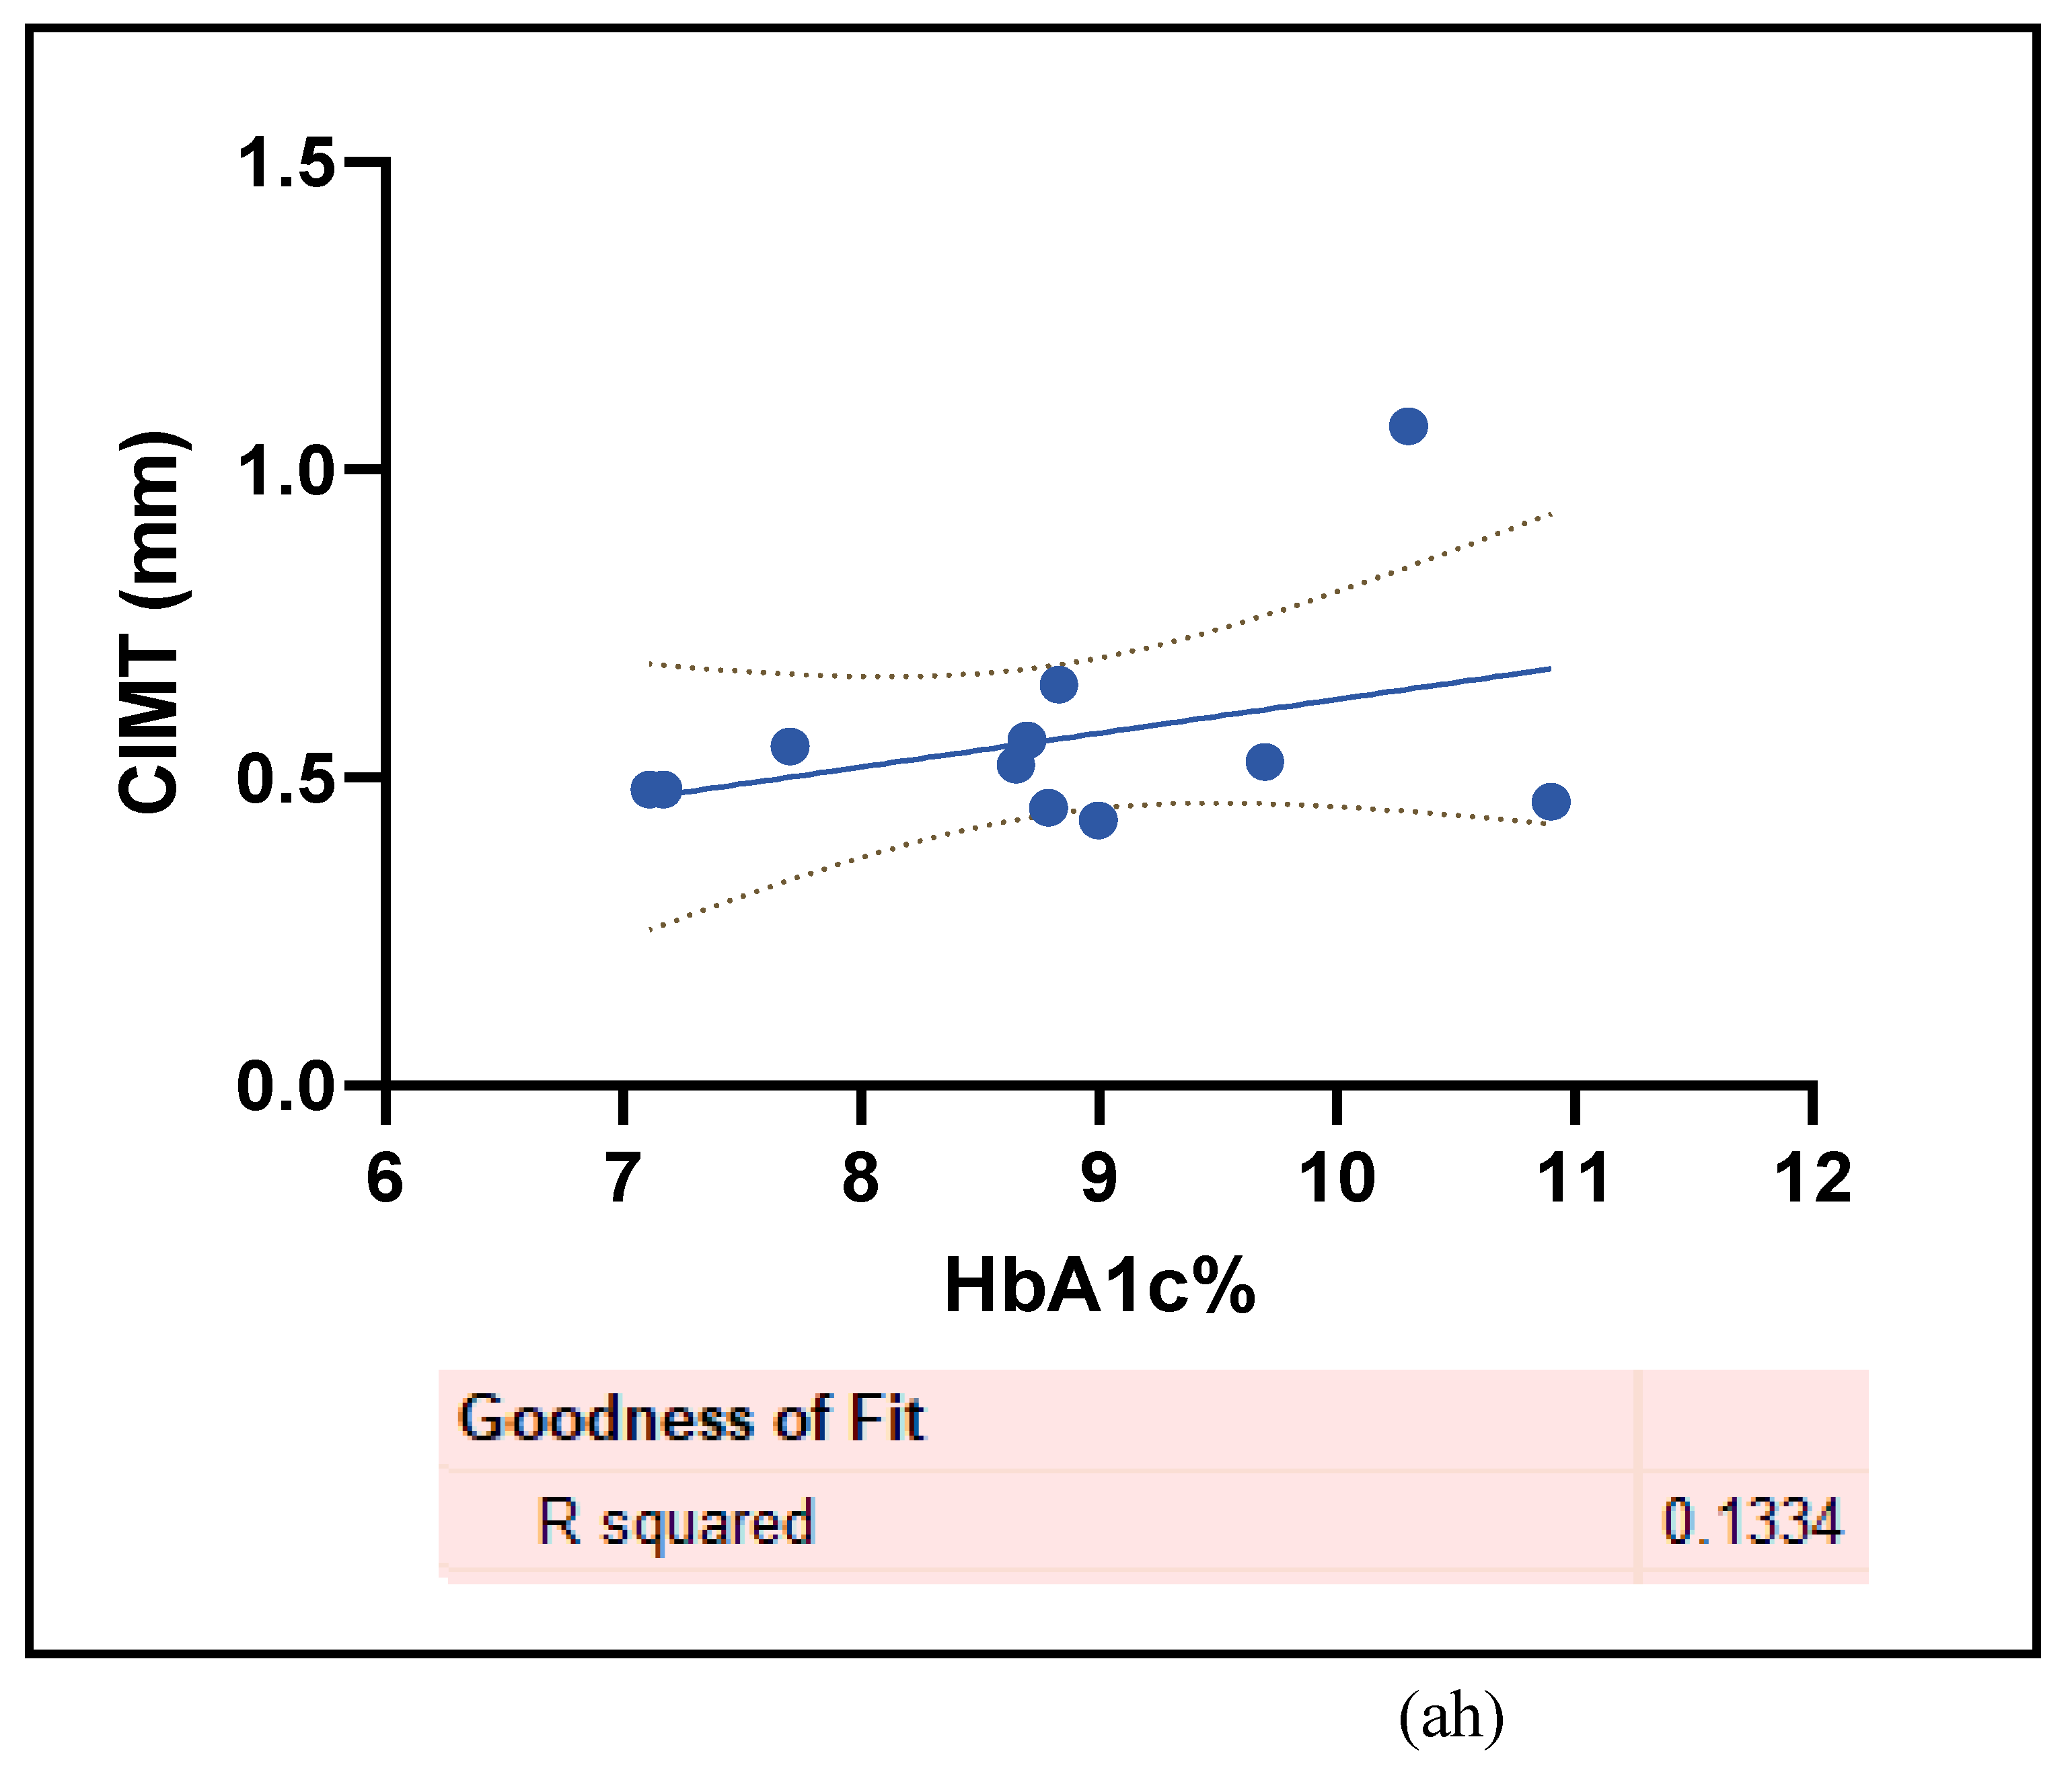
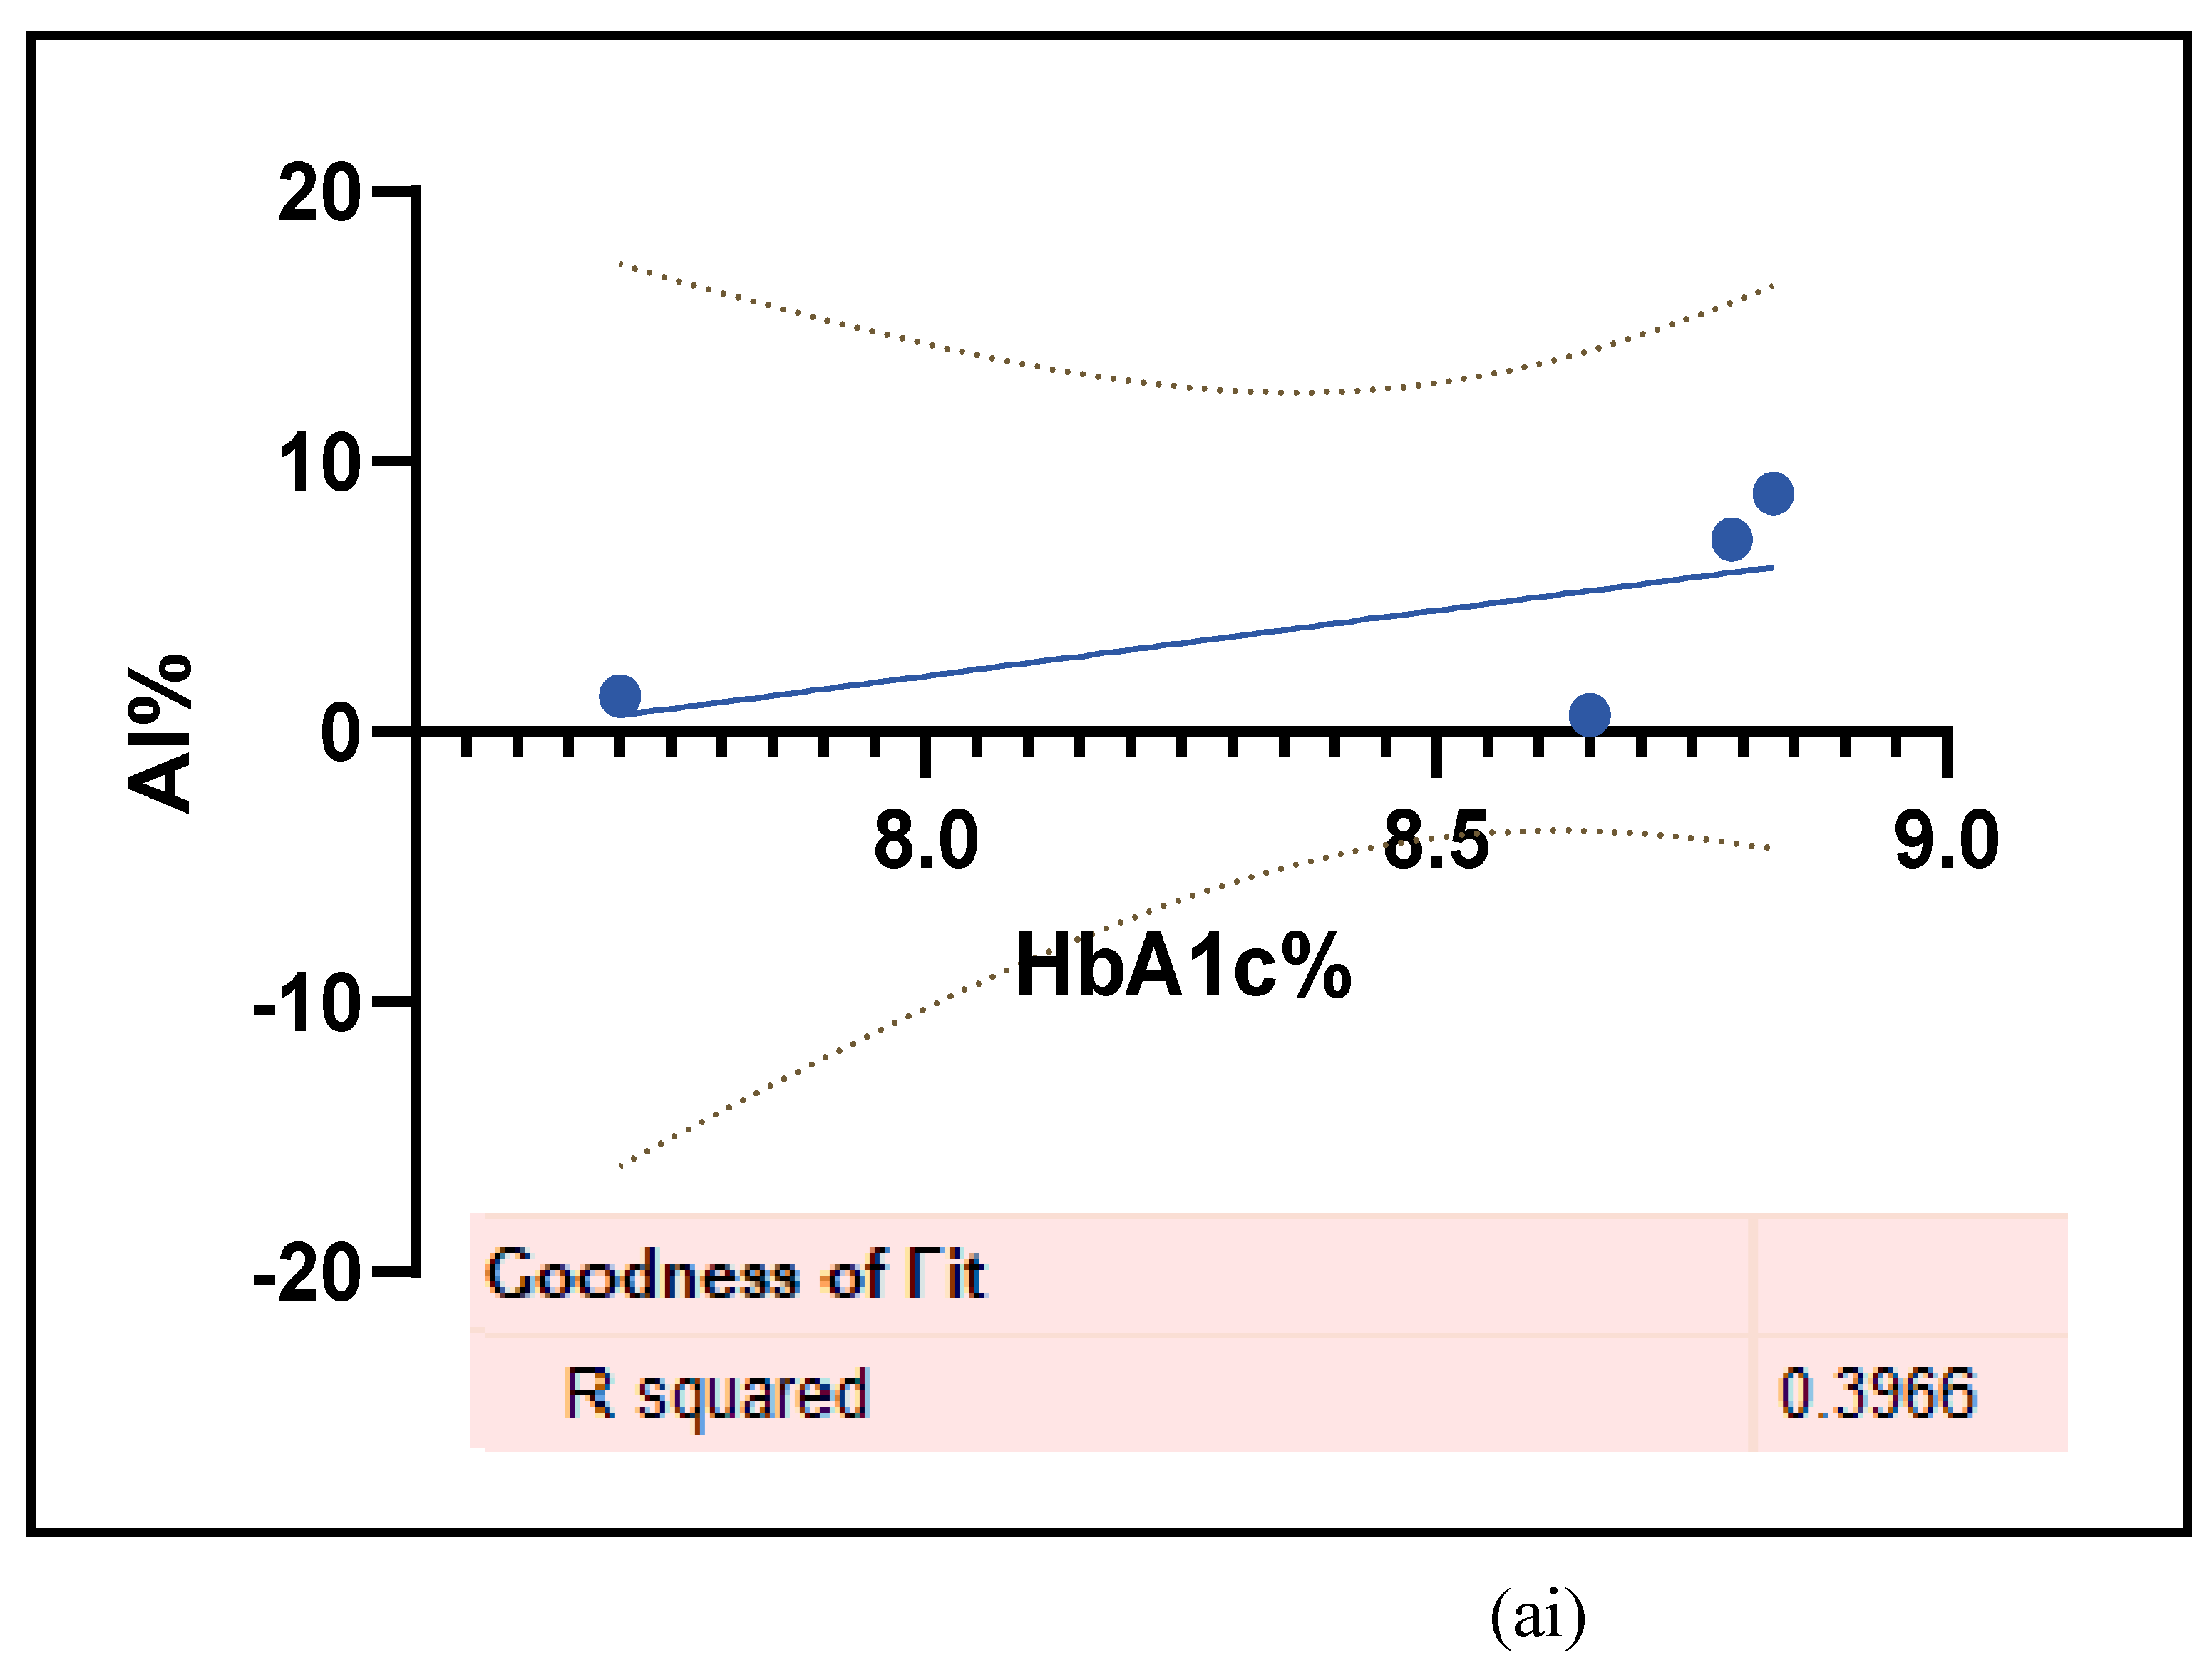
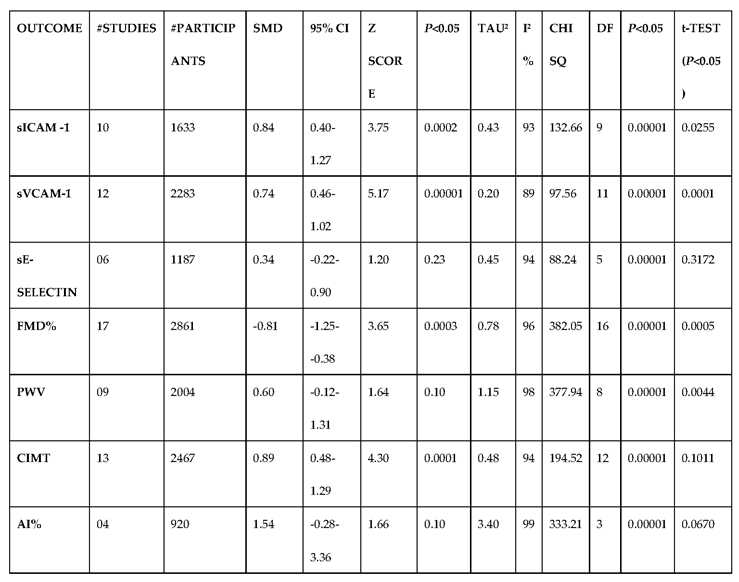
This study has used 7 different biomarkers that are integral for the survival of the T1D patients because vascular dysfunction arises concomitantly with T1D and carries a high risk of mortality. These biomarkers are also risk factors of T1D-induced CVD/ED of which some can be used as a diagnostic tool or a therapeutic target in novel research [63]. Figure 6 (a- ai) and the Table 5 have mostly demonstrated an increase in these functional markers in the T1D cohort compared to the HC. Simple linear regression was performed between HbA1c% and the vascular functional markers at 95% CI, which displayed non-significant increases with AI%@75 (r2 =0.3966, p= 0.37 ), CIMT ( r2=0.1334, p=0.2694), and sICAM -1 (r2= 0.0053, p= 0.8764) while there were decreases with FMD% change (r2= 0.039, p= 0.4802), PWV (r2= 0.1432, p=0.3153), and sVCAM-1 (r2= 0.4465, p=0.0701). The ROC curves displayed there were no false positives or outliers in the data that was compared between the HC and the T1D cohorts.
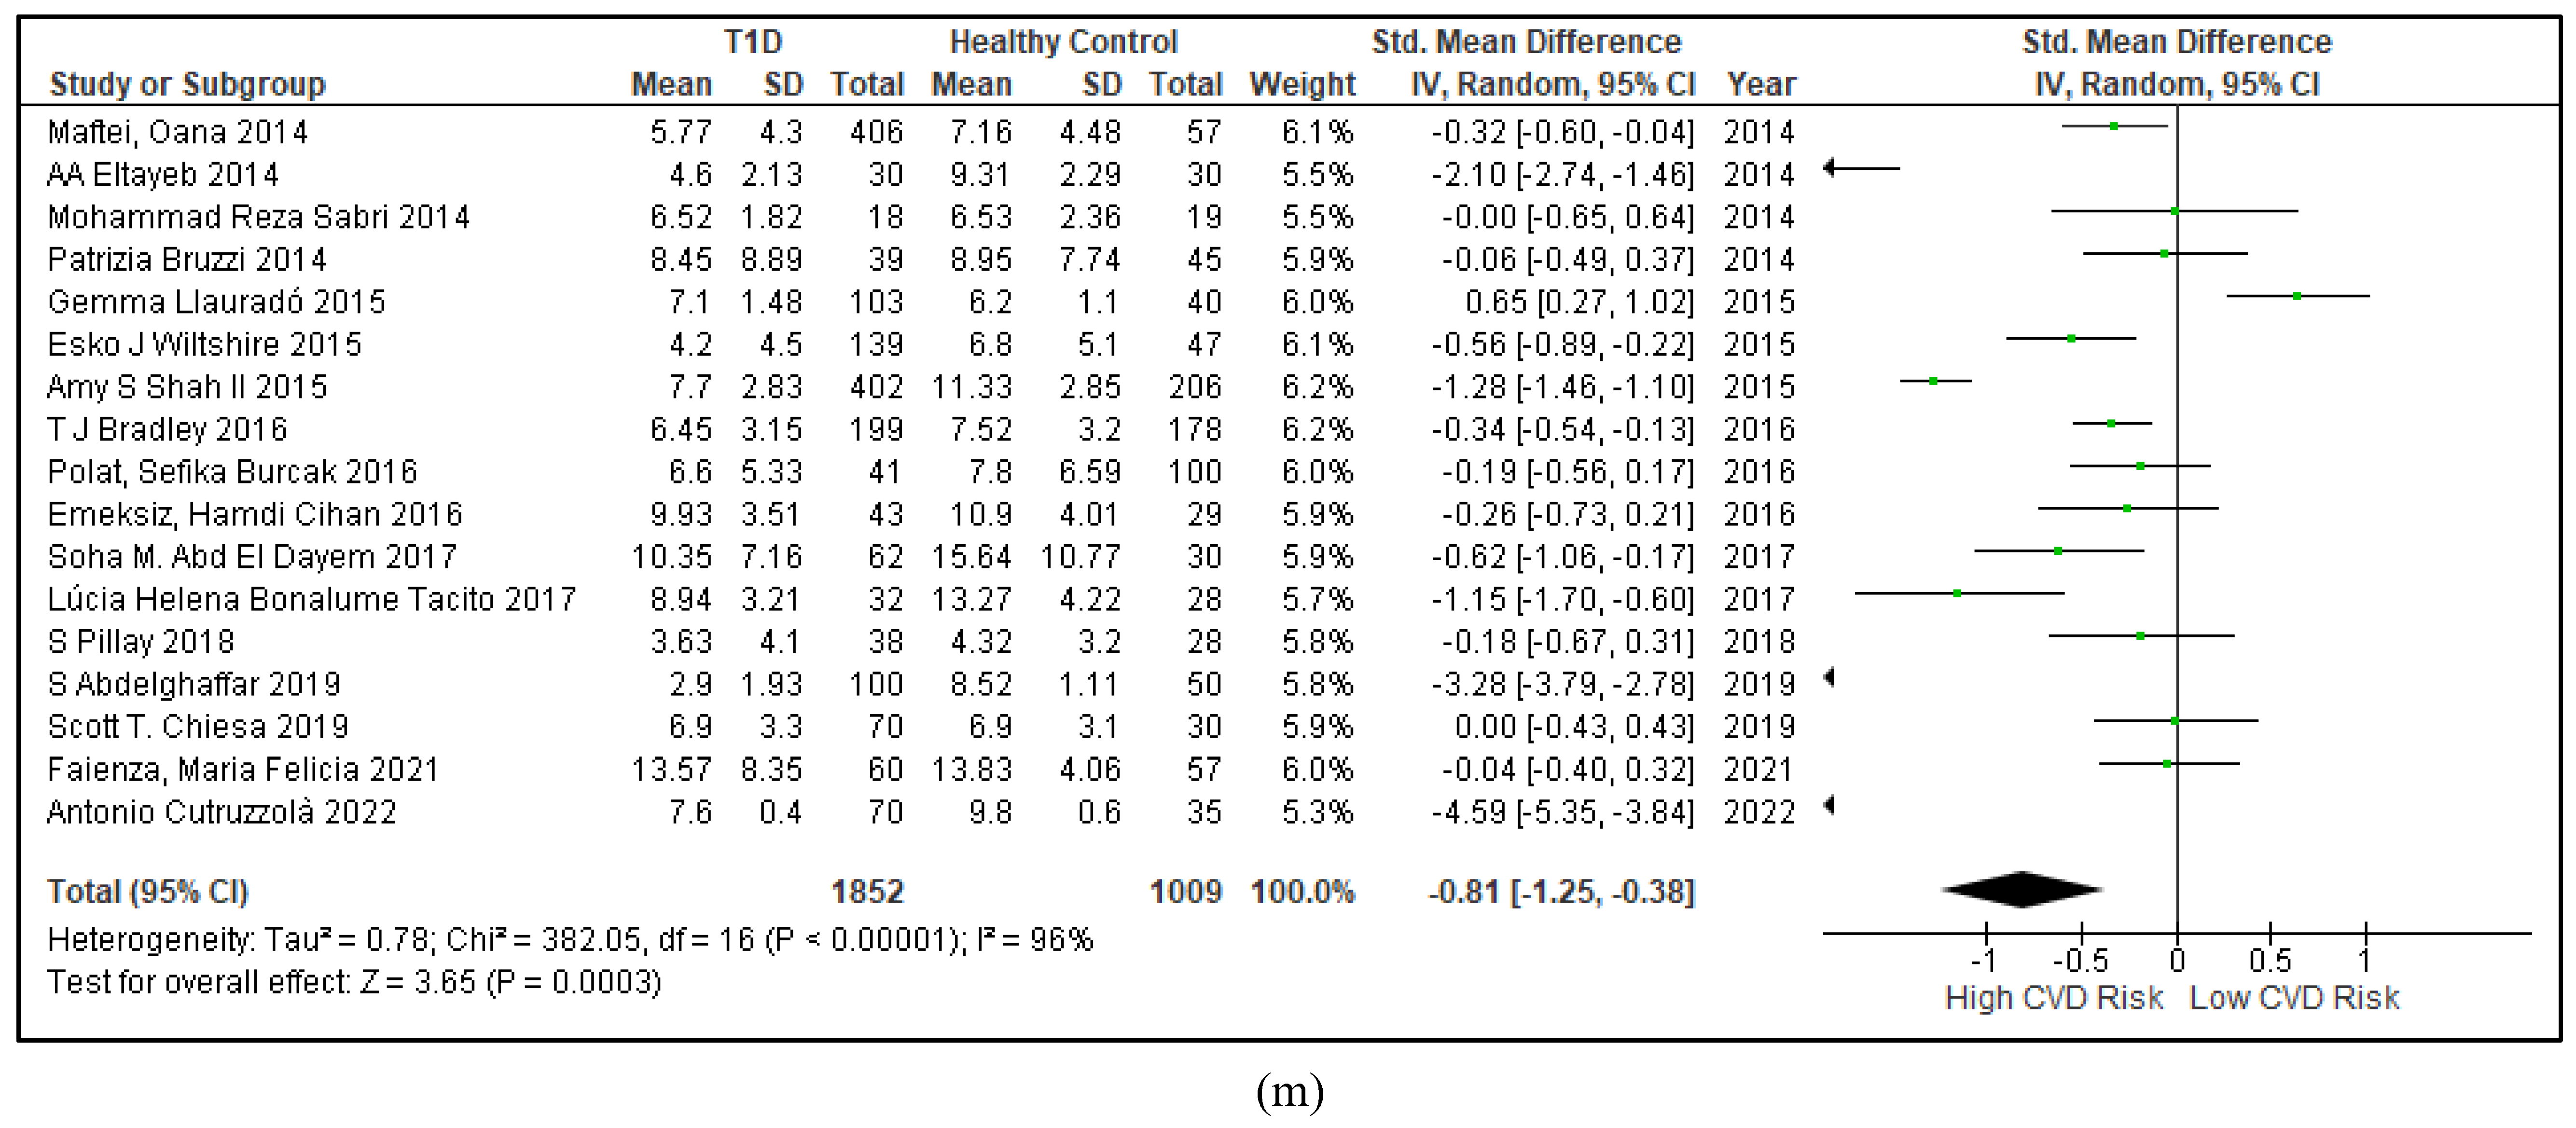
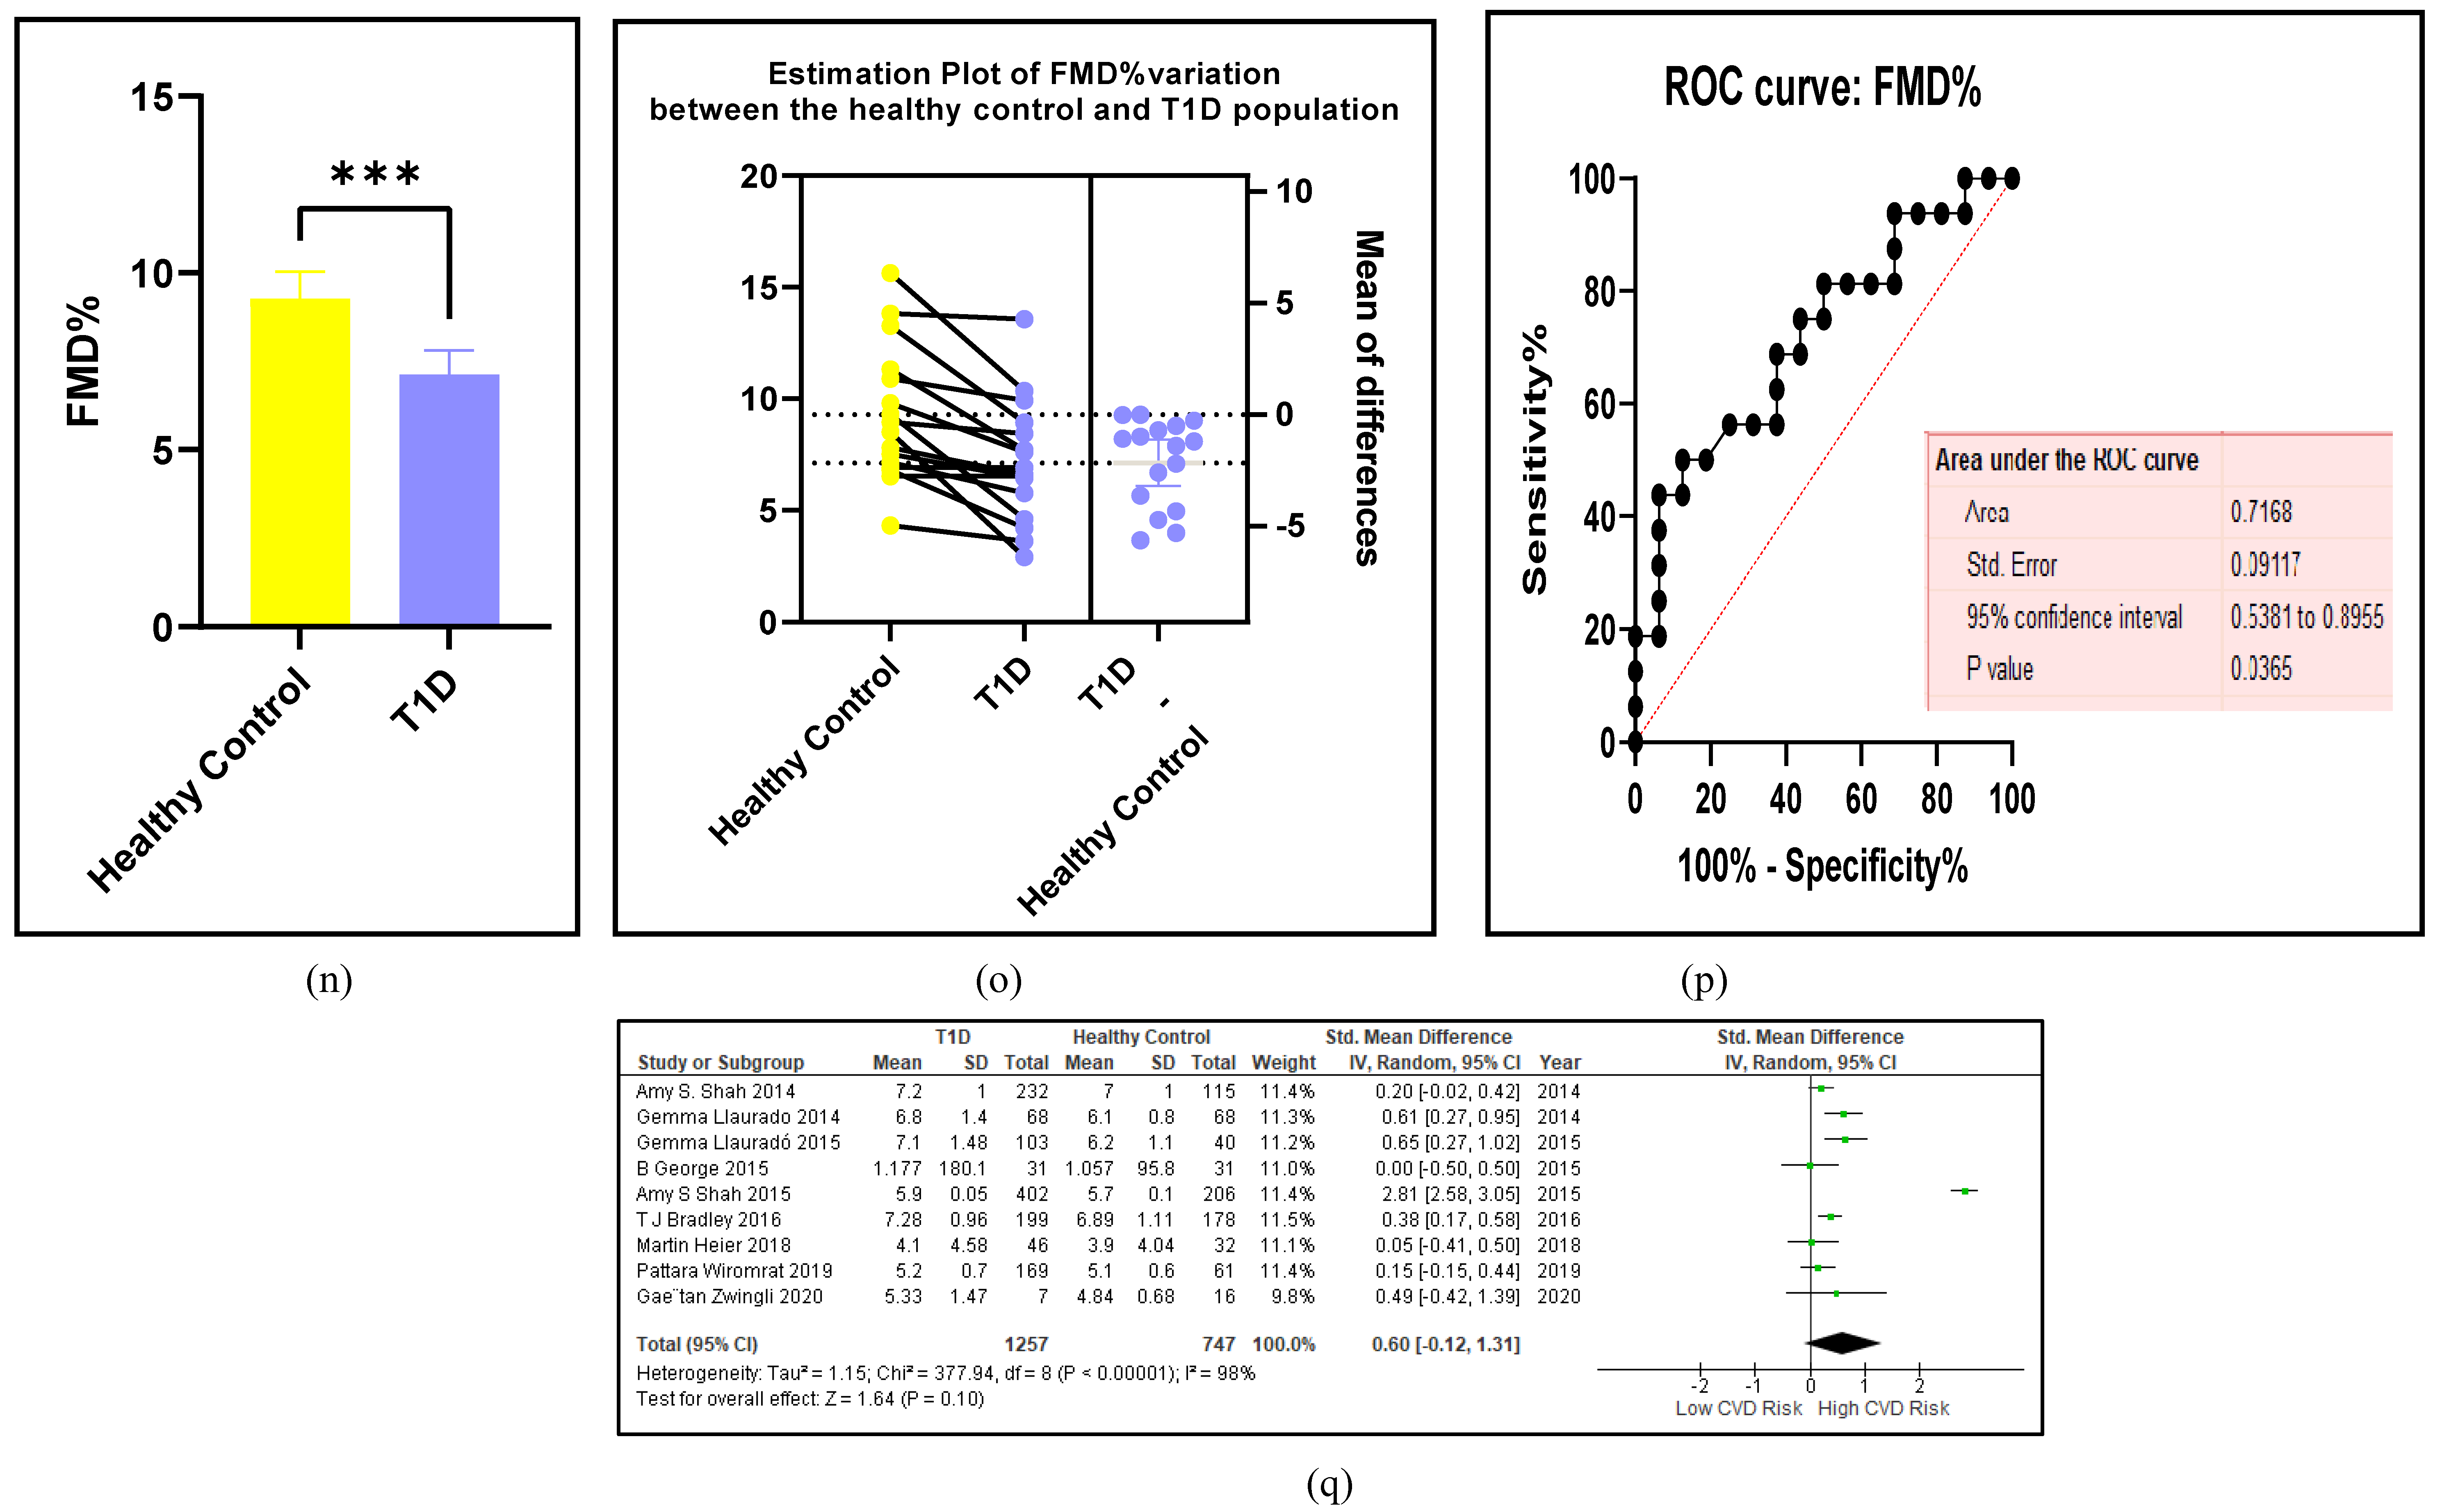
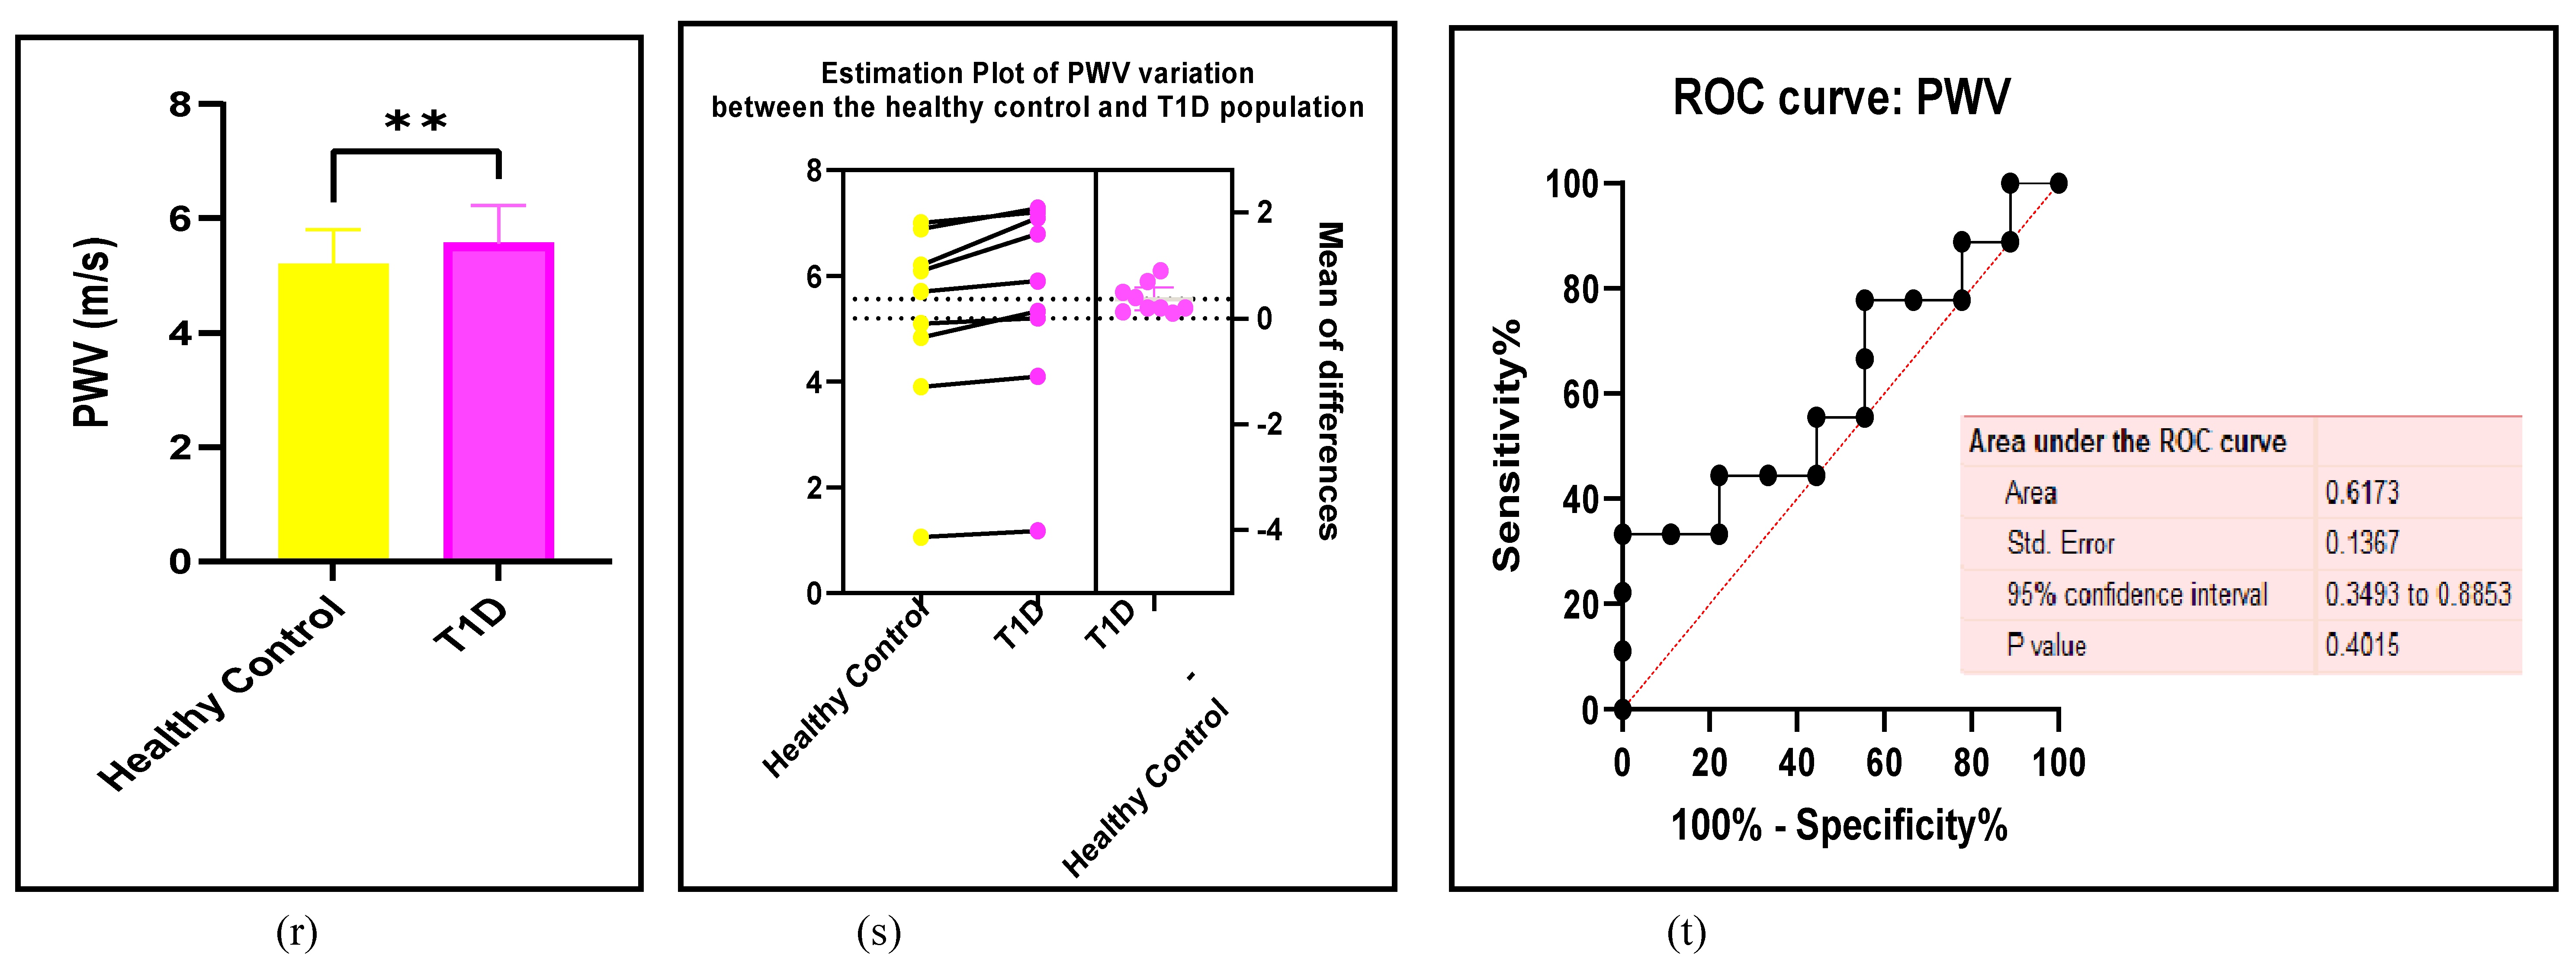
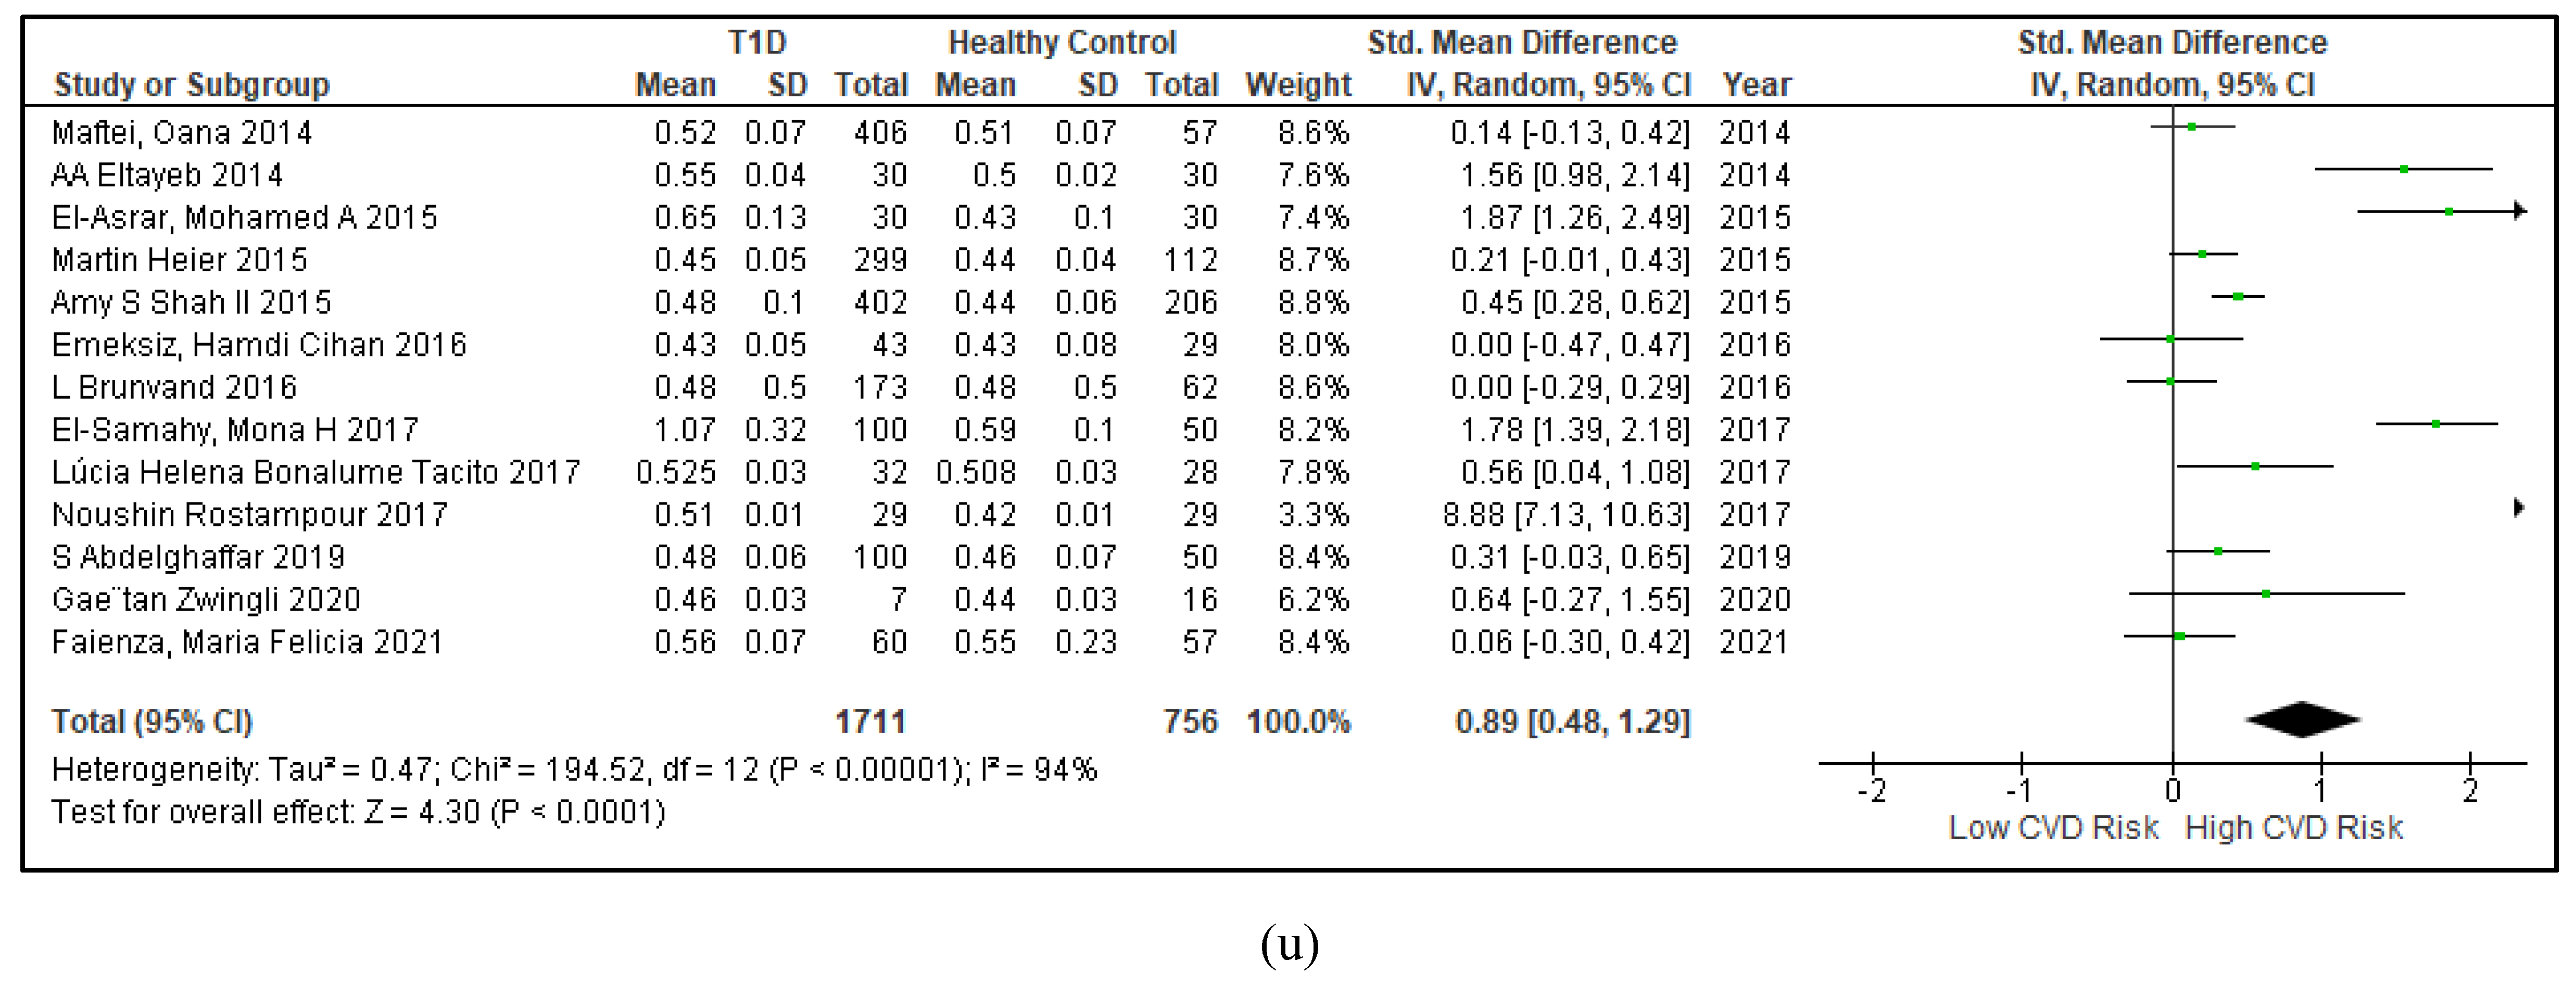
Figure 6. (a-ai): Assessments of the vascular functions between the T1D and HC groups. (a) forest plot of sICAM-1 (b) paired student-t test bar graph of sICAM-1 ( c) EP of sICAM-1 (d) ROC of sICAM-1 (e ) forest plot of sVCAM-1 (f) paired student-t test bar graph of sVCAM-1 ( g) EP of sVCAM-1 (h) ROC of sVCAM-1 (i) forest plot of sE-Selectin (j) paired student-t test bar graph of sE-Selectin ( k) EP of sE-Selectin (l) ROC of sE-Selectin (m) forest plot of FMD%, (n) paired student-t test bar graph of FMD%, ( o) EP of FMD%, (p) ROC of FMD% (q) forest plot of PWV (r) paired student-t test bar graph of PWV, ( s) EP of PWV, (t) ROC of PWV (u) forest plot of CIMT (v) paired student-t test bar graph of CIMT ( w) EP of CIMT (x) ROC of PWV (y) forest plot of AI% (z) paired student-t test bar graph of AI% ( aa) EP of AI% (ab) ROC of AI% (ac) simple linear regression between HbA1c% and sICAM -1 (ad) simple linear regression between HbA1c% and sVCAM- 1 (ae) simple linear regression between HbA1c% and the change in sE-Selectin (af) simple linear regression between HbA1c% and the change in FMD% (ag) simple linear regression between HbA1c% and PWV (ah) simple linear regression between HbA1c% and CIMT (ai) simple linear regression between HbA1c% and AI%. Results are statistically significant at p < 0.05.
Preprints 105488 g006aPreprints 105488 g006bPreprints 105488 g006cPreprints 105488 g006dPreprints 105488 g006ePreprints 105488 g006fPreprints 105488 g006gPreprints 105488 g006hPreprints 105488 g006iPreprints 105488 g006jPreprints 105488 g006kPreprints 105488 g006lPreprints 105488 g006mPreprints 105488 g006nPreprints 105488 g006oPreprints 105488 g006pPreprints 105488 g006qPreprints 105488 g006r

3.2.5. The Inflammatory Targets Were Mostly in Favour of the T1D-Induced ED

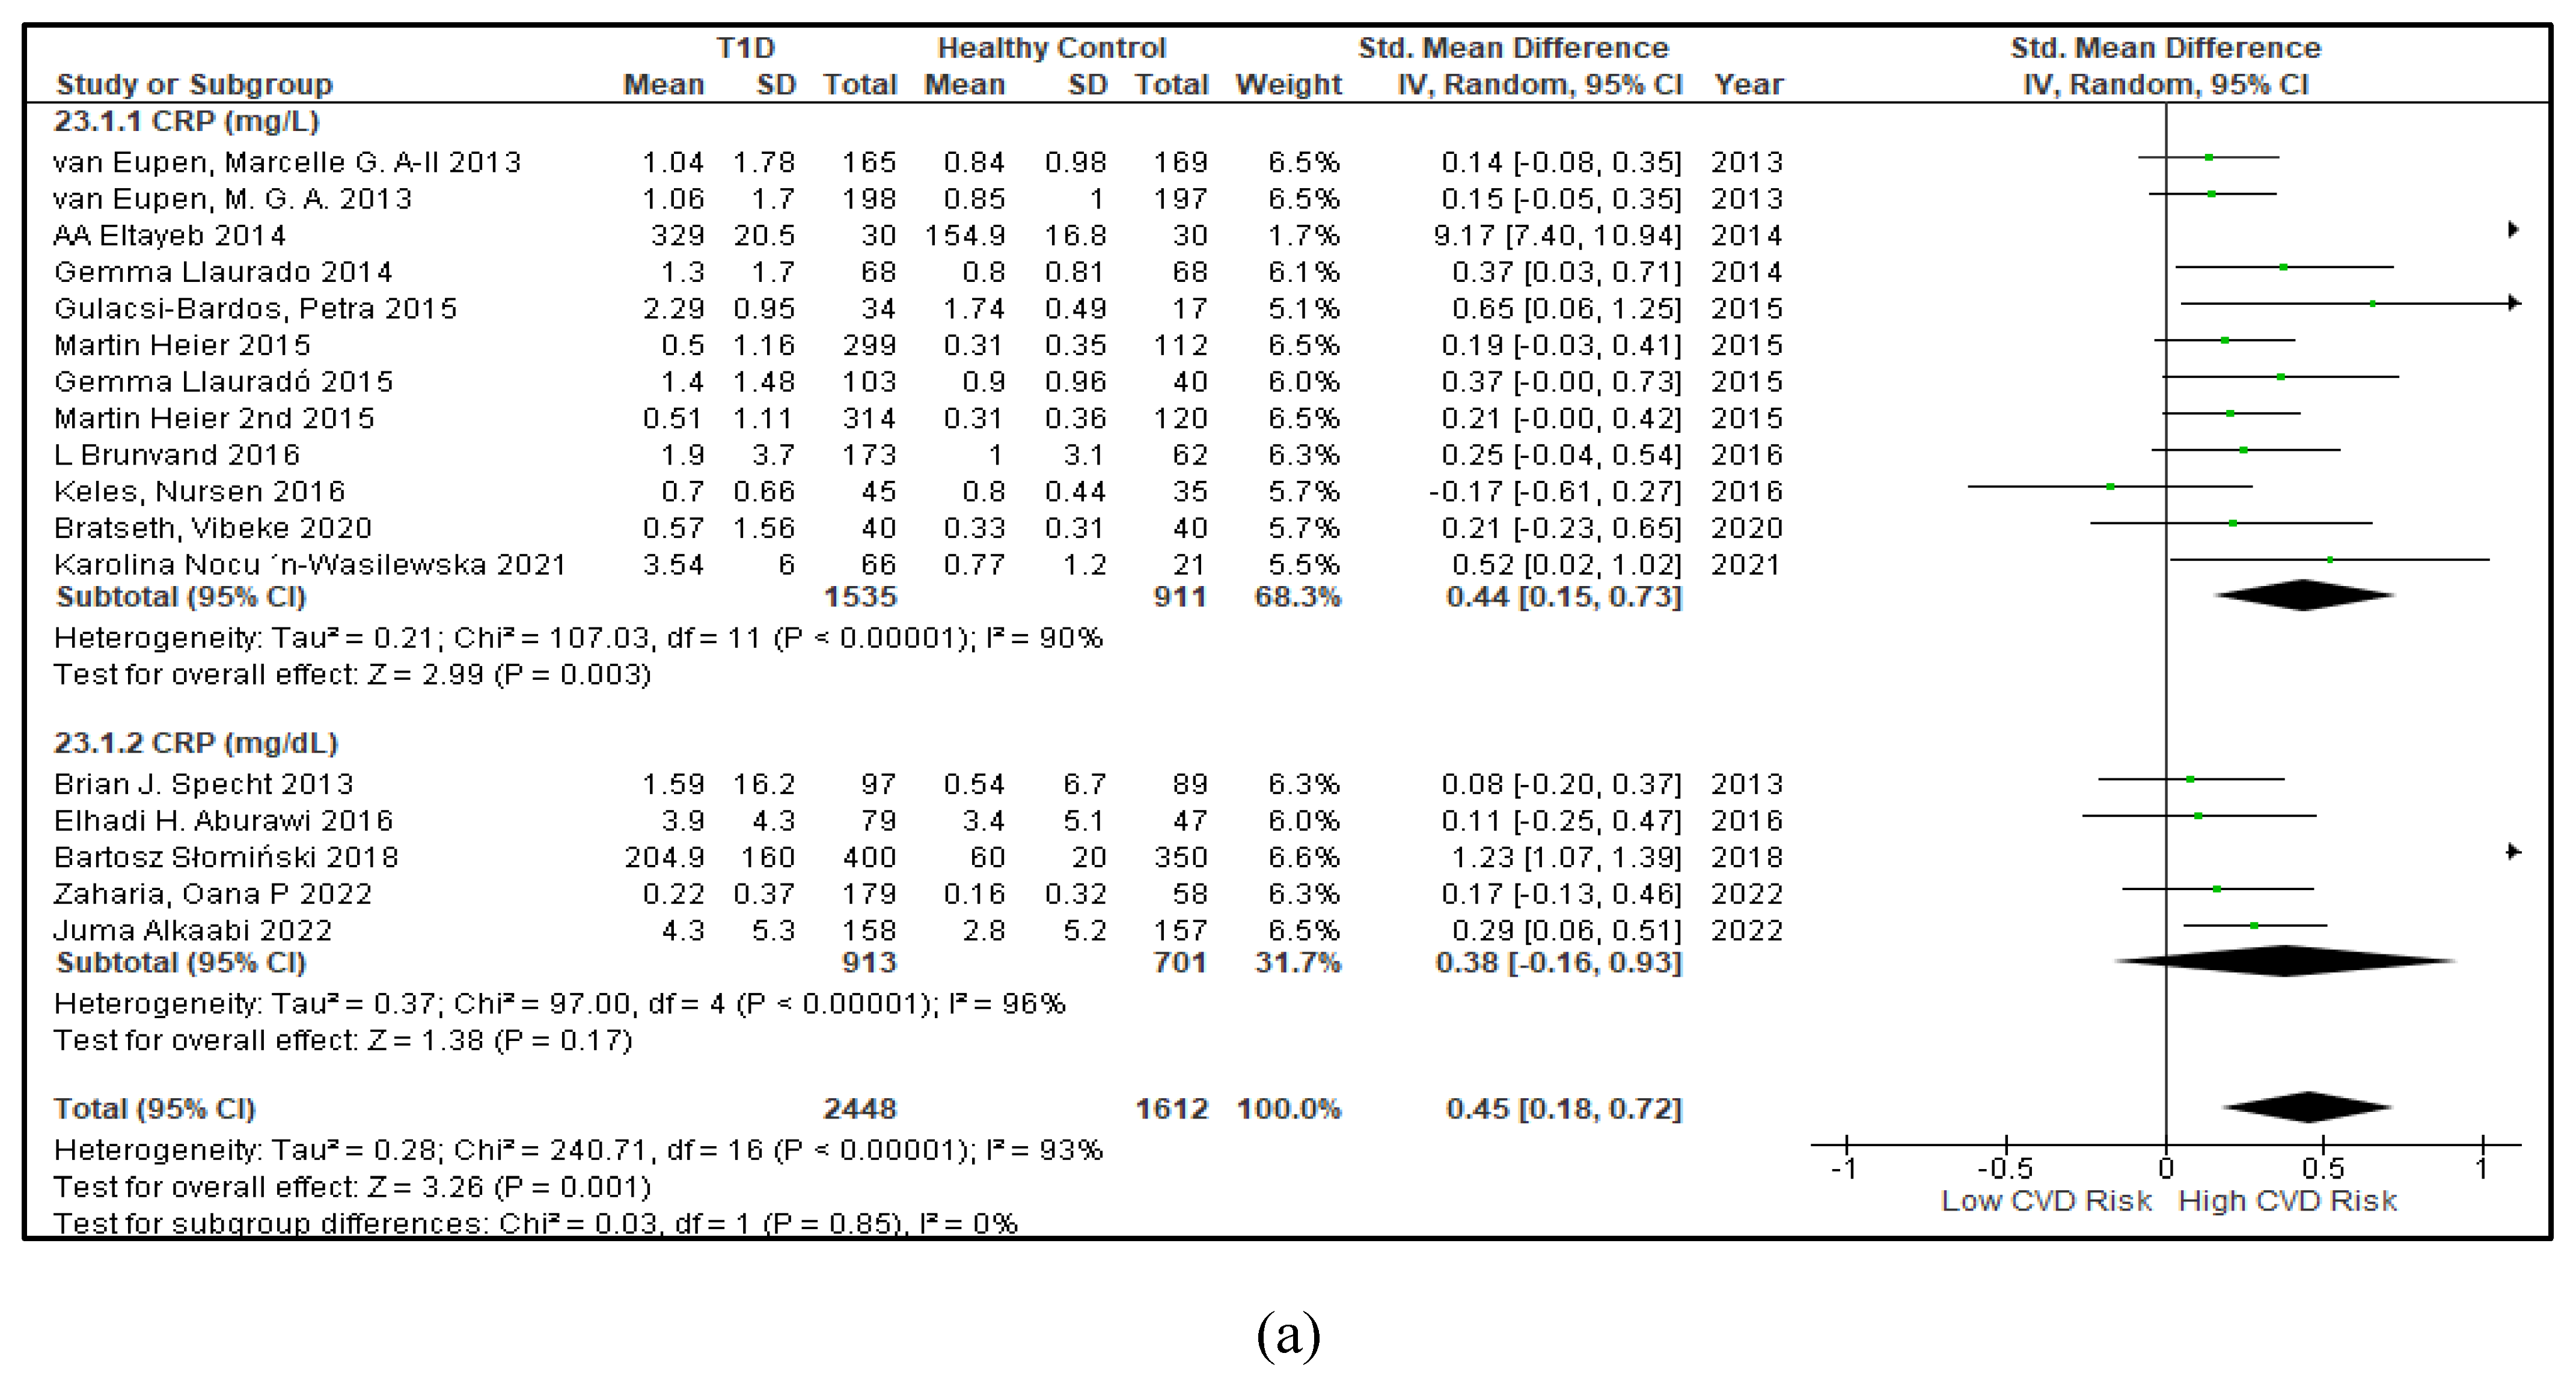
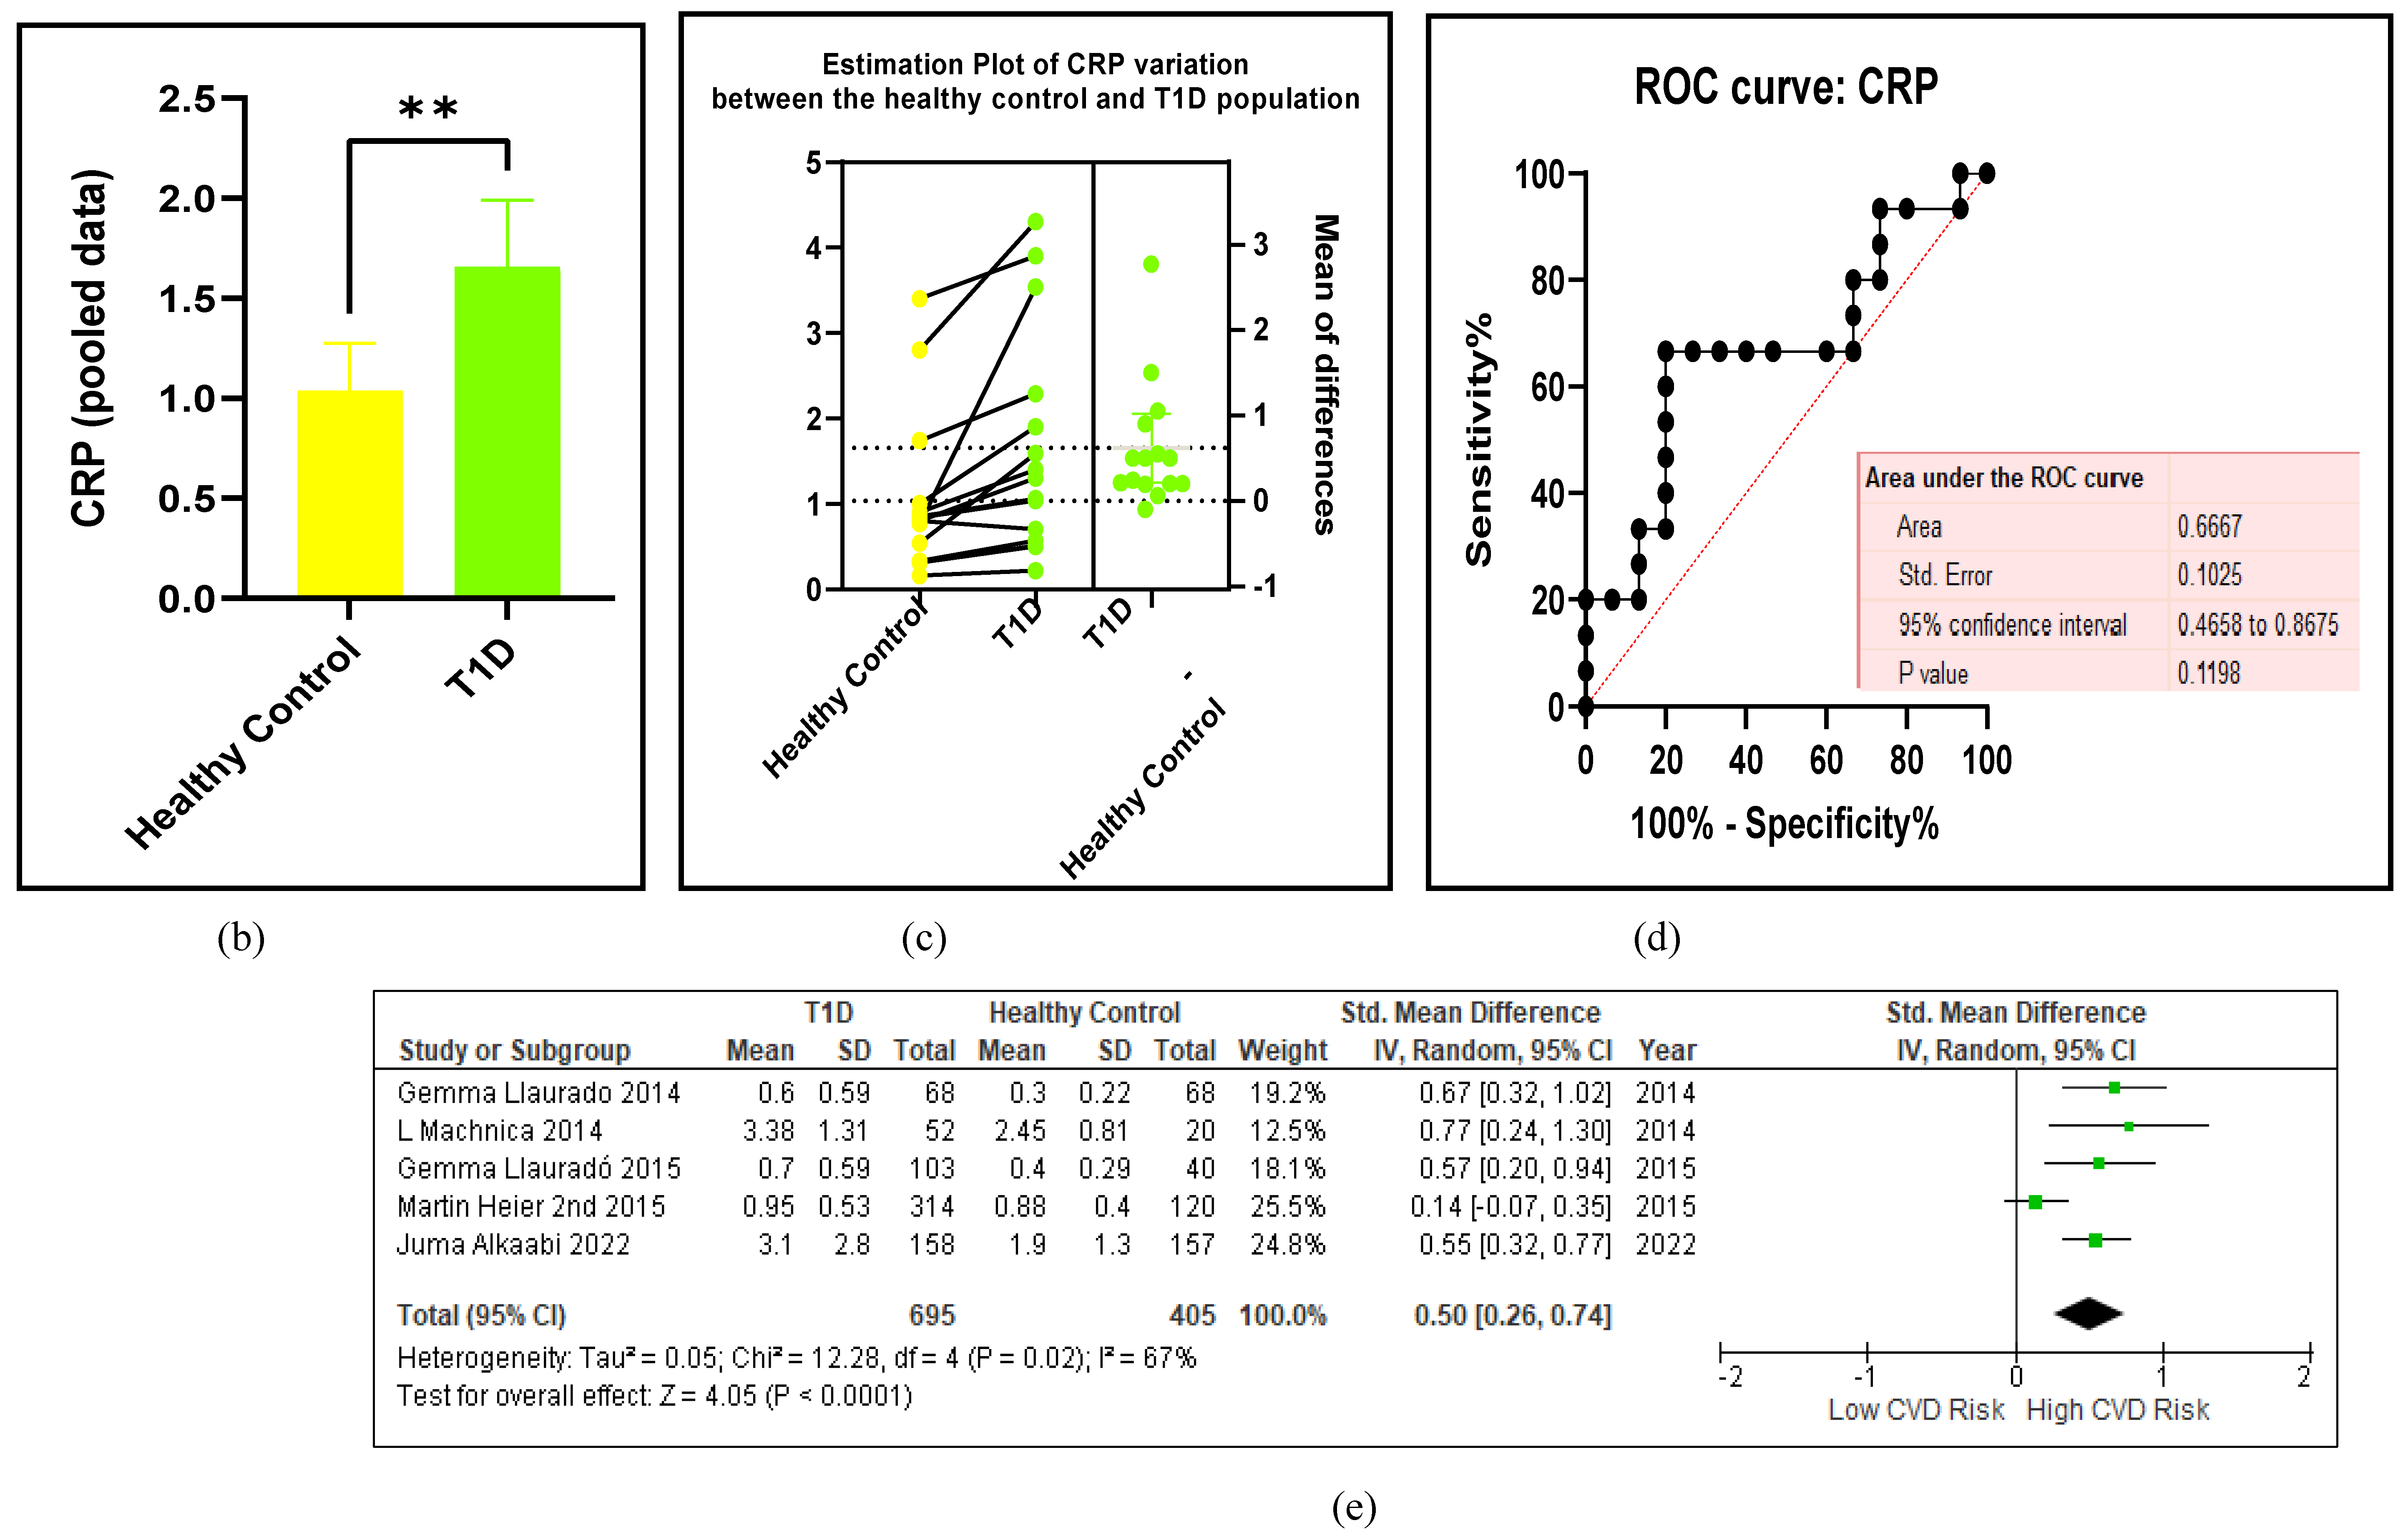
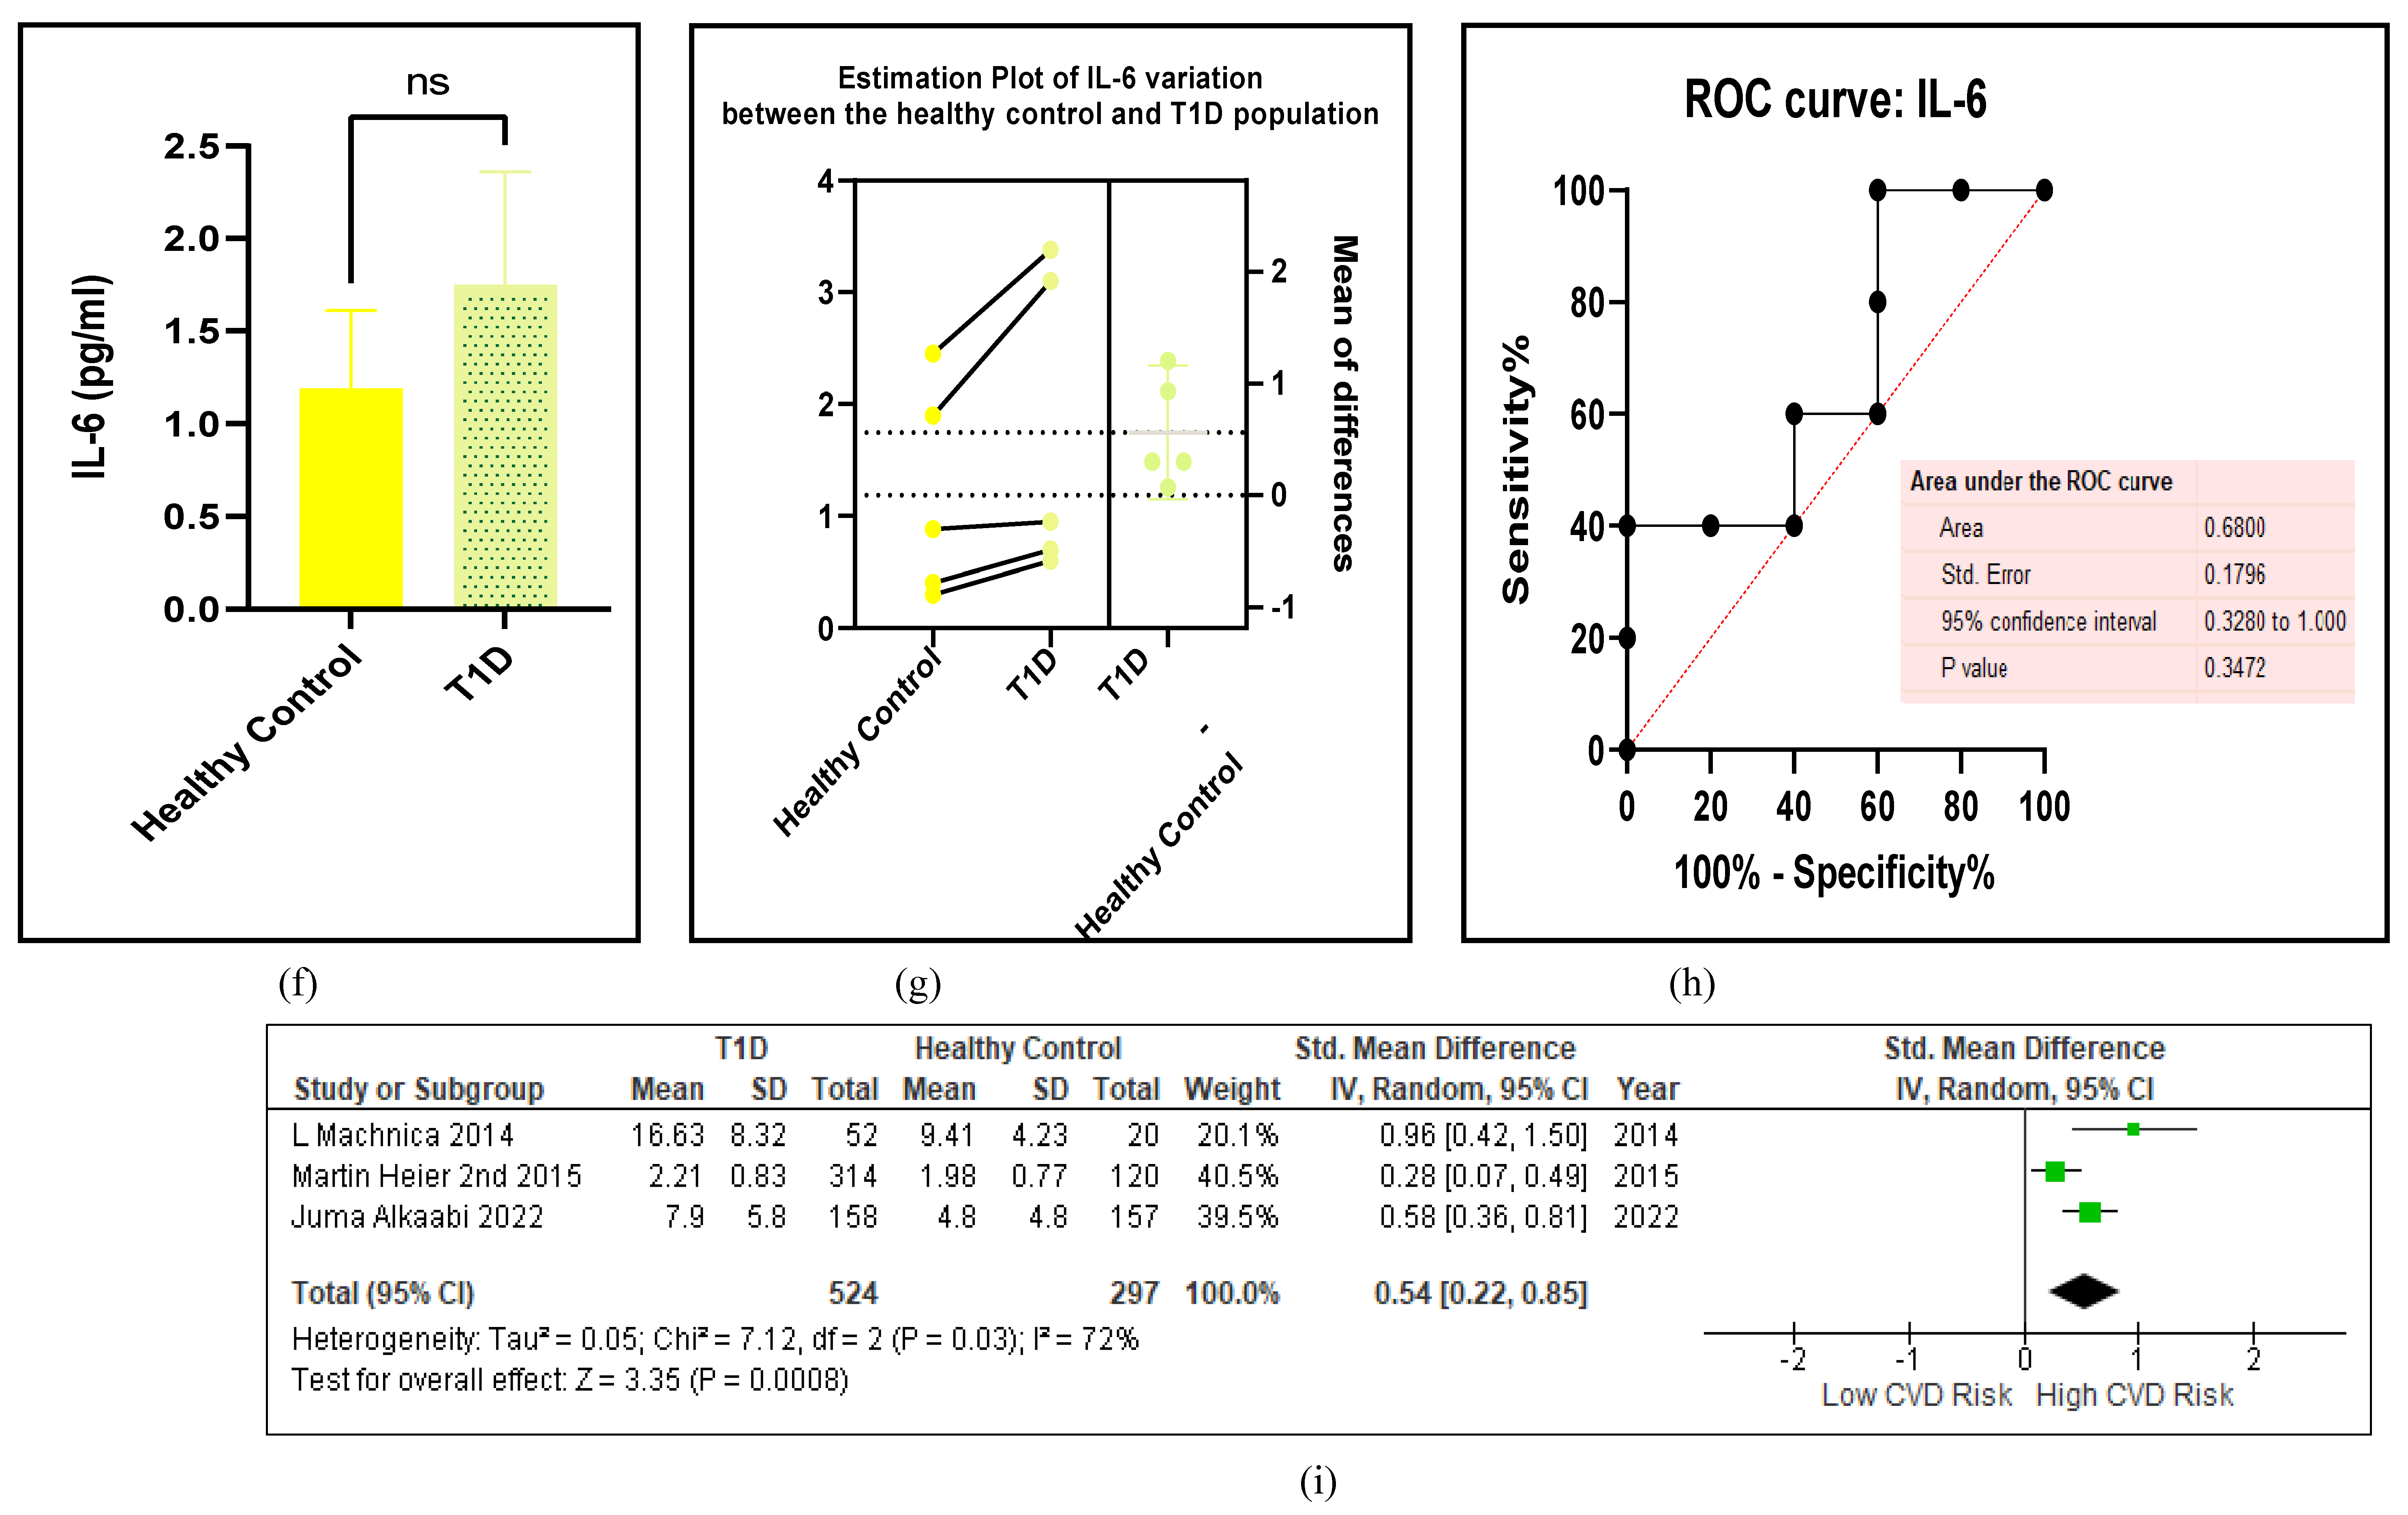
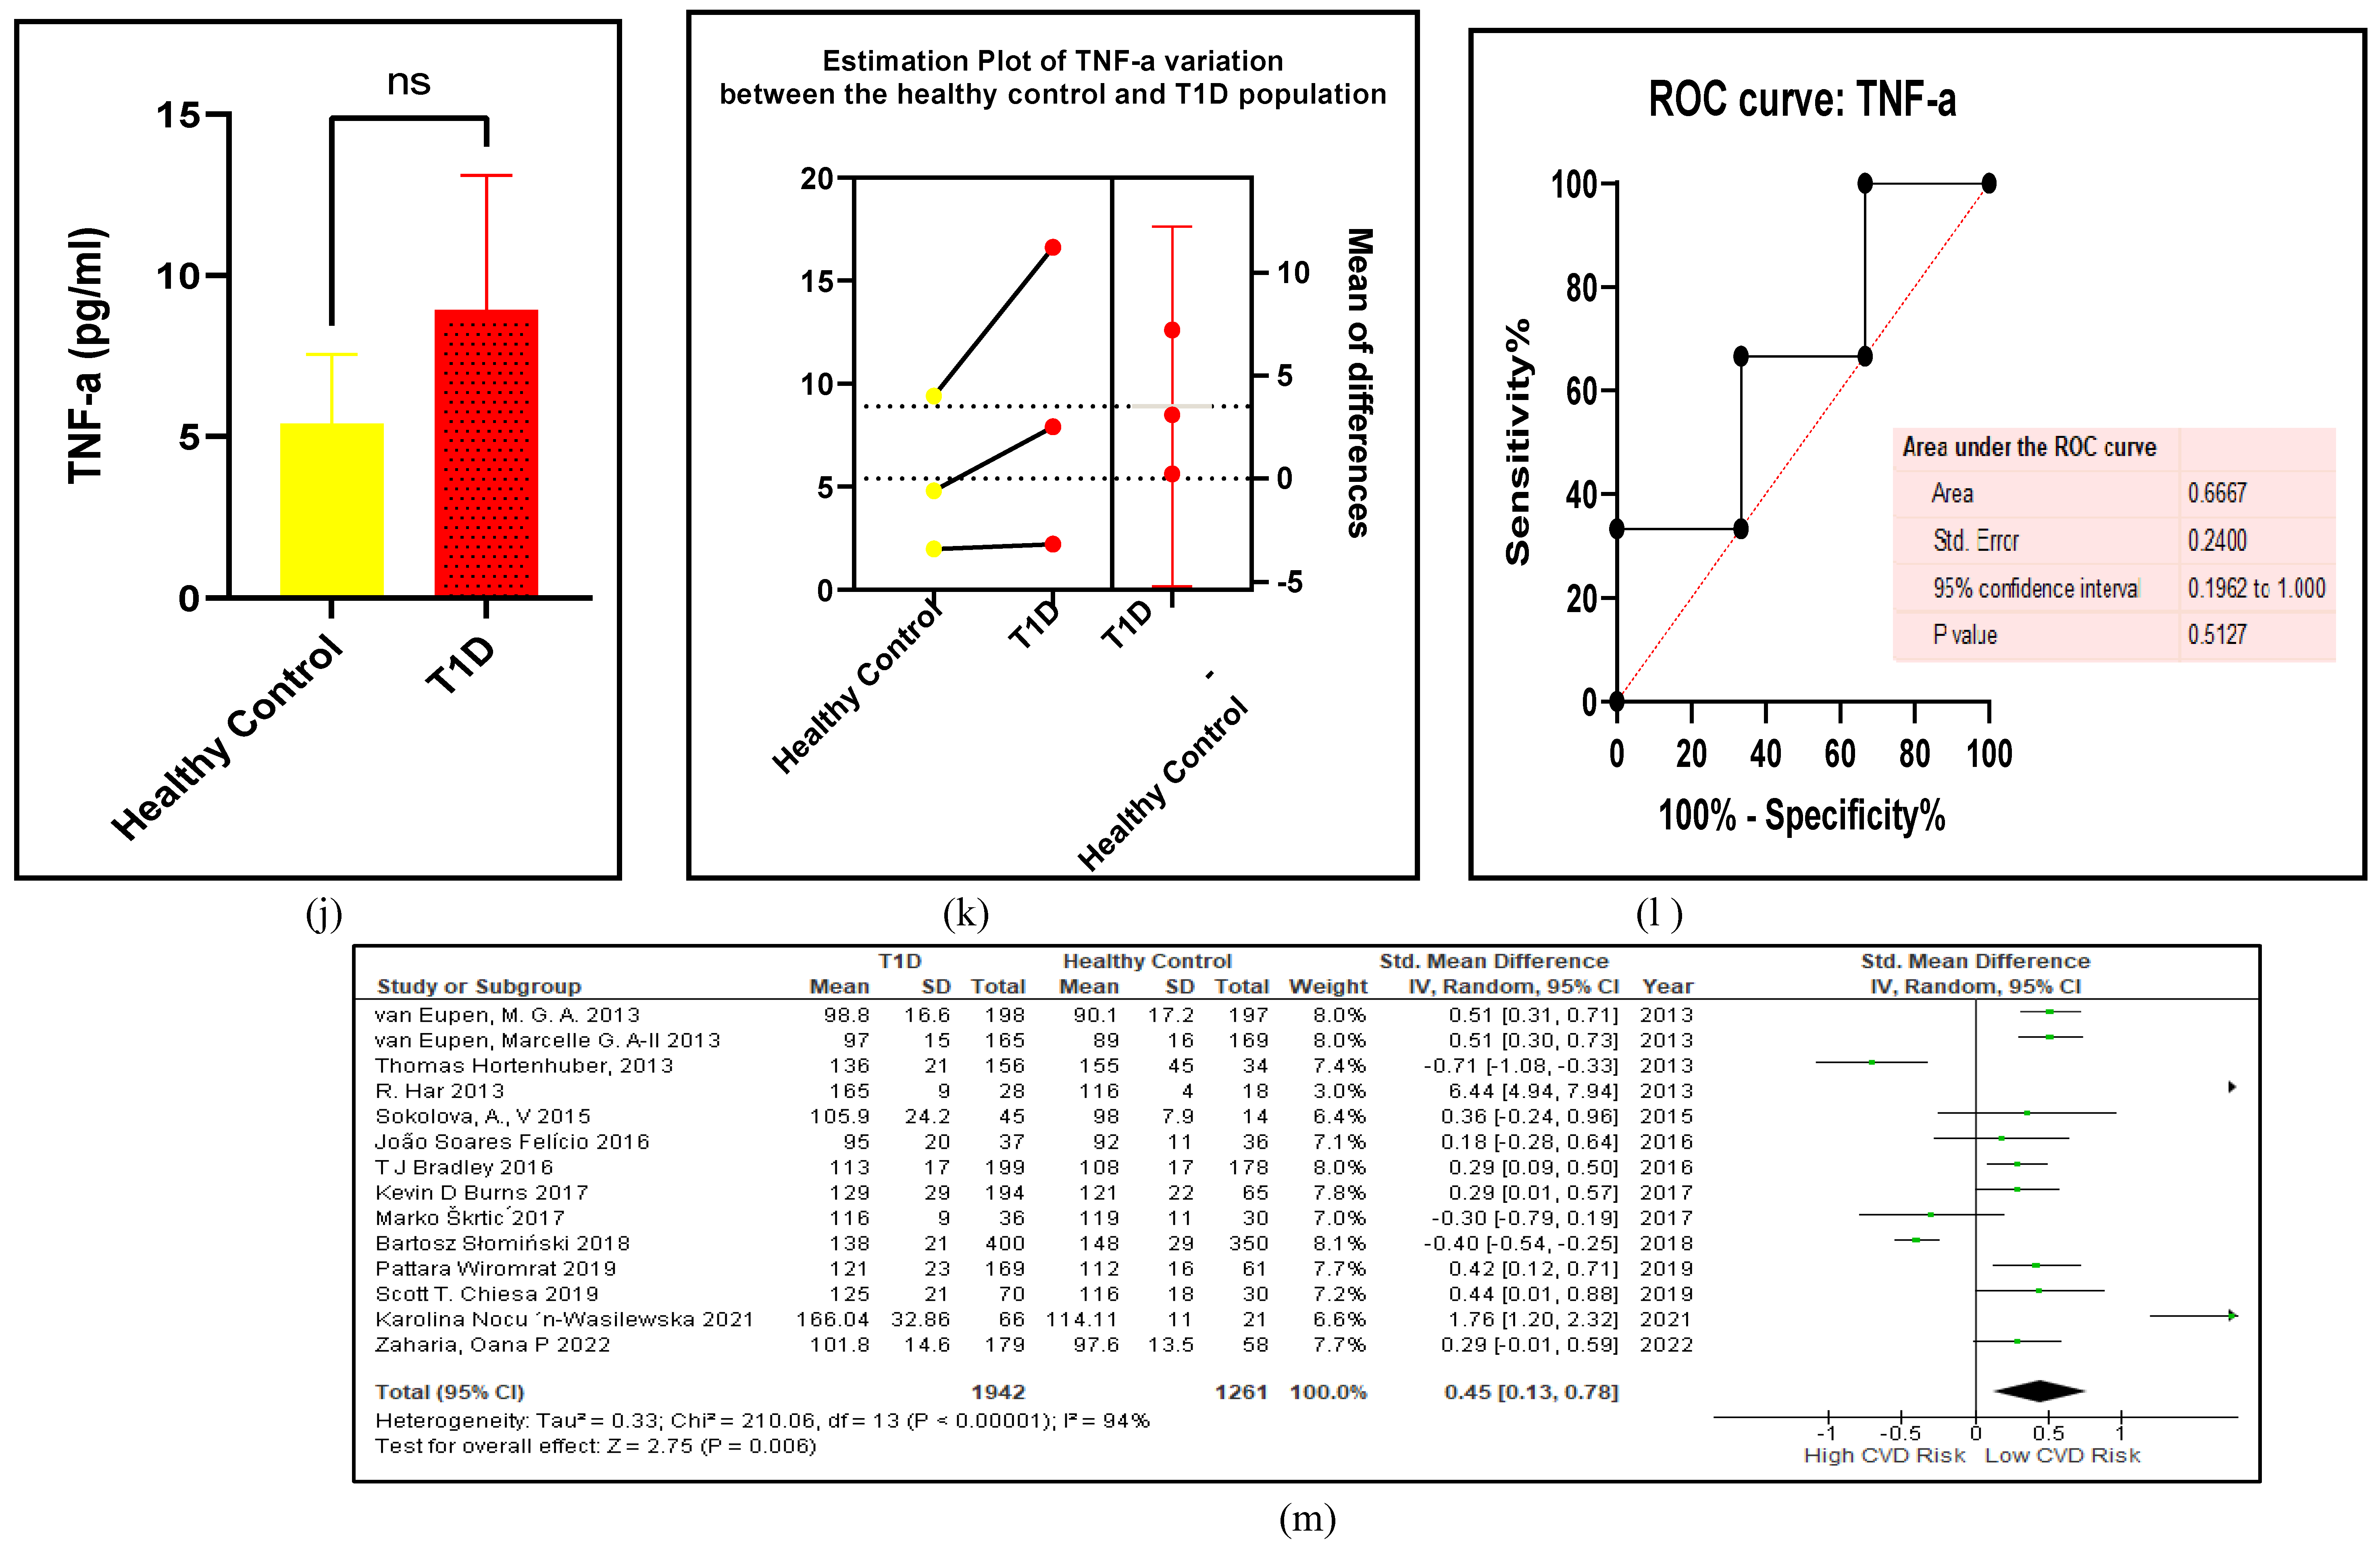
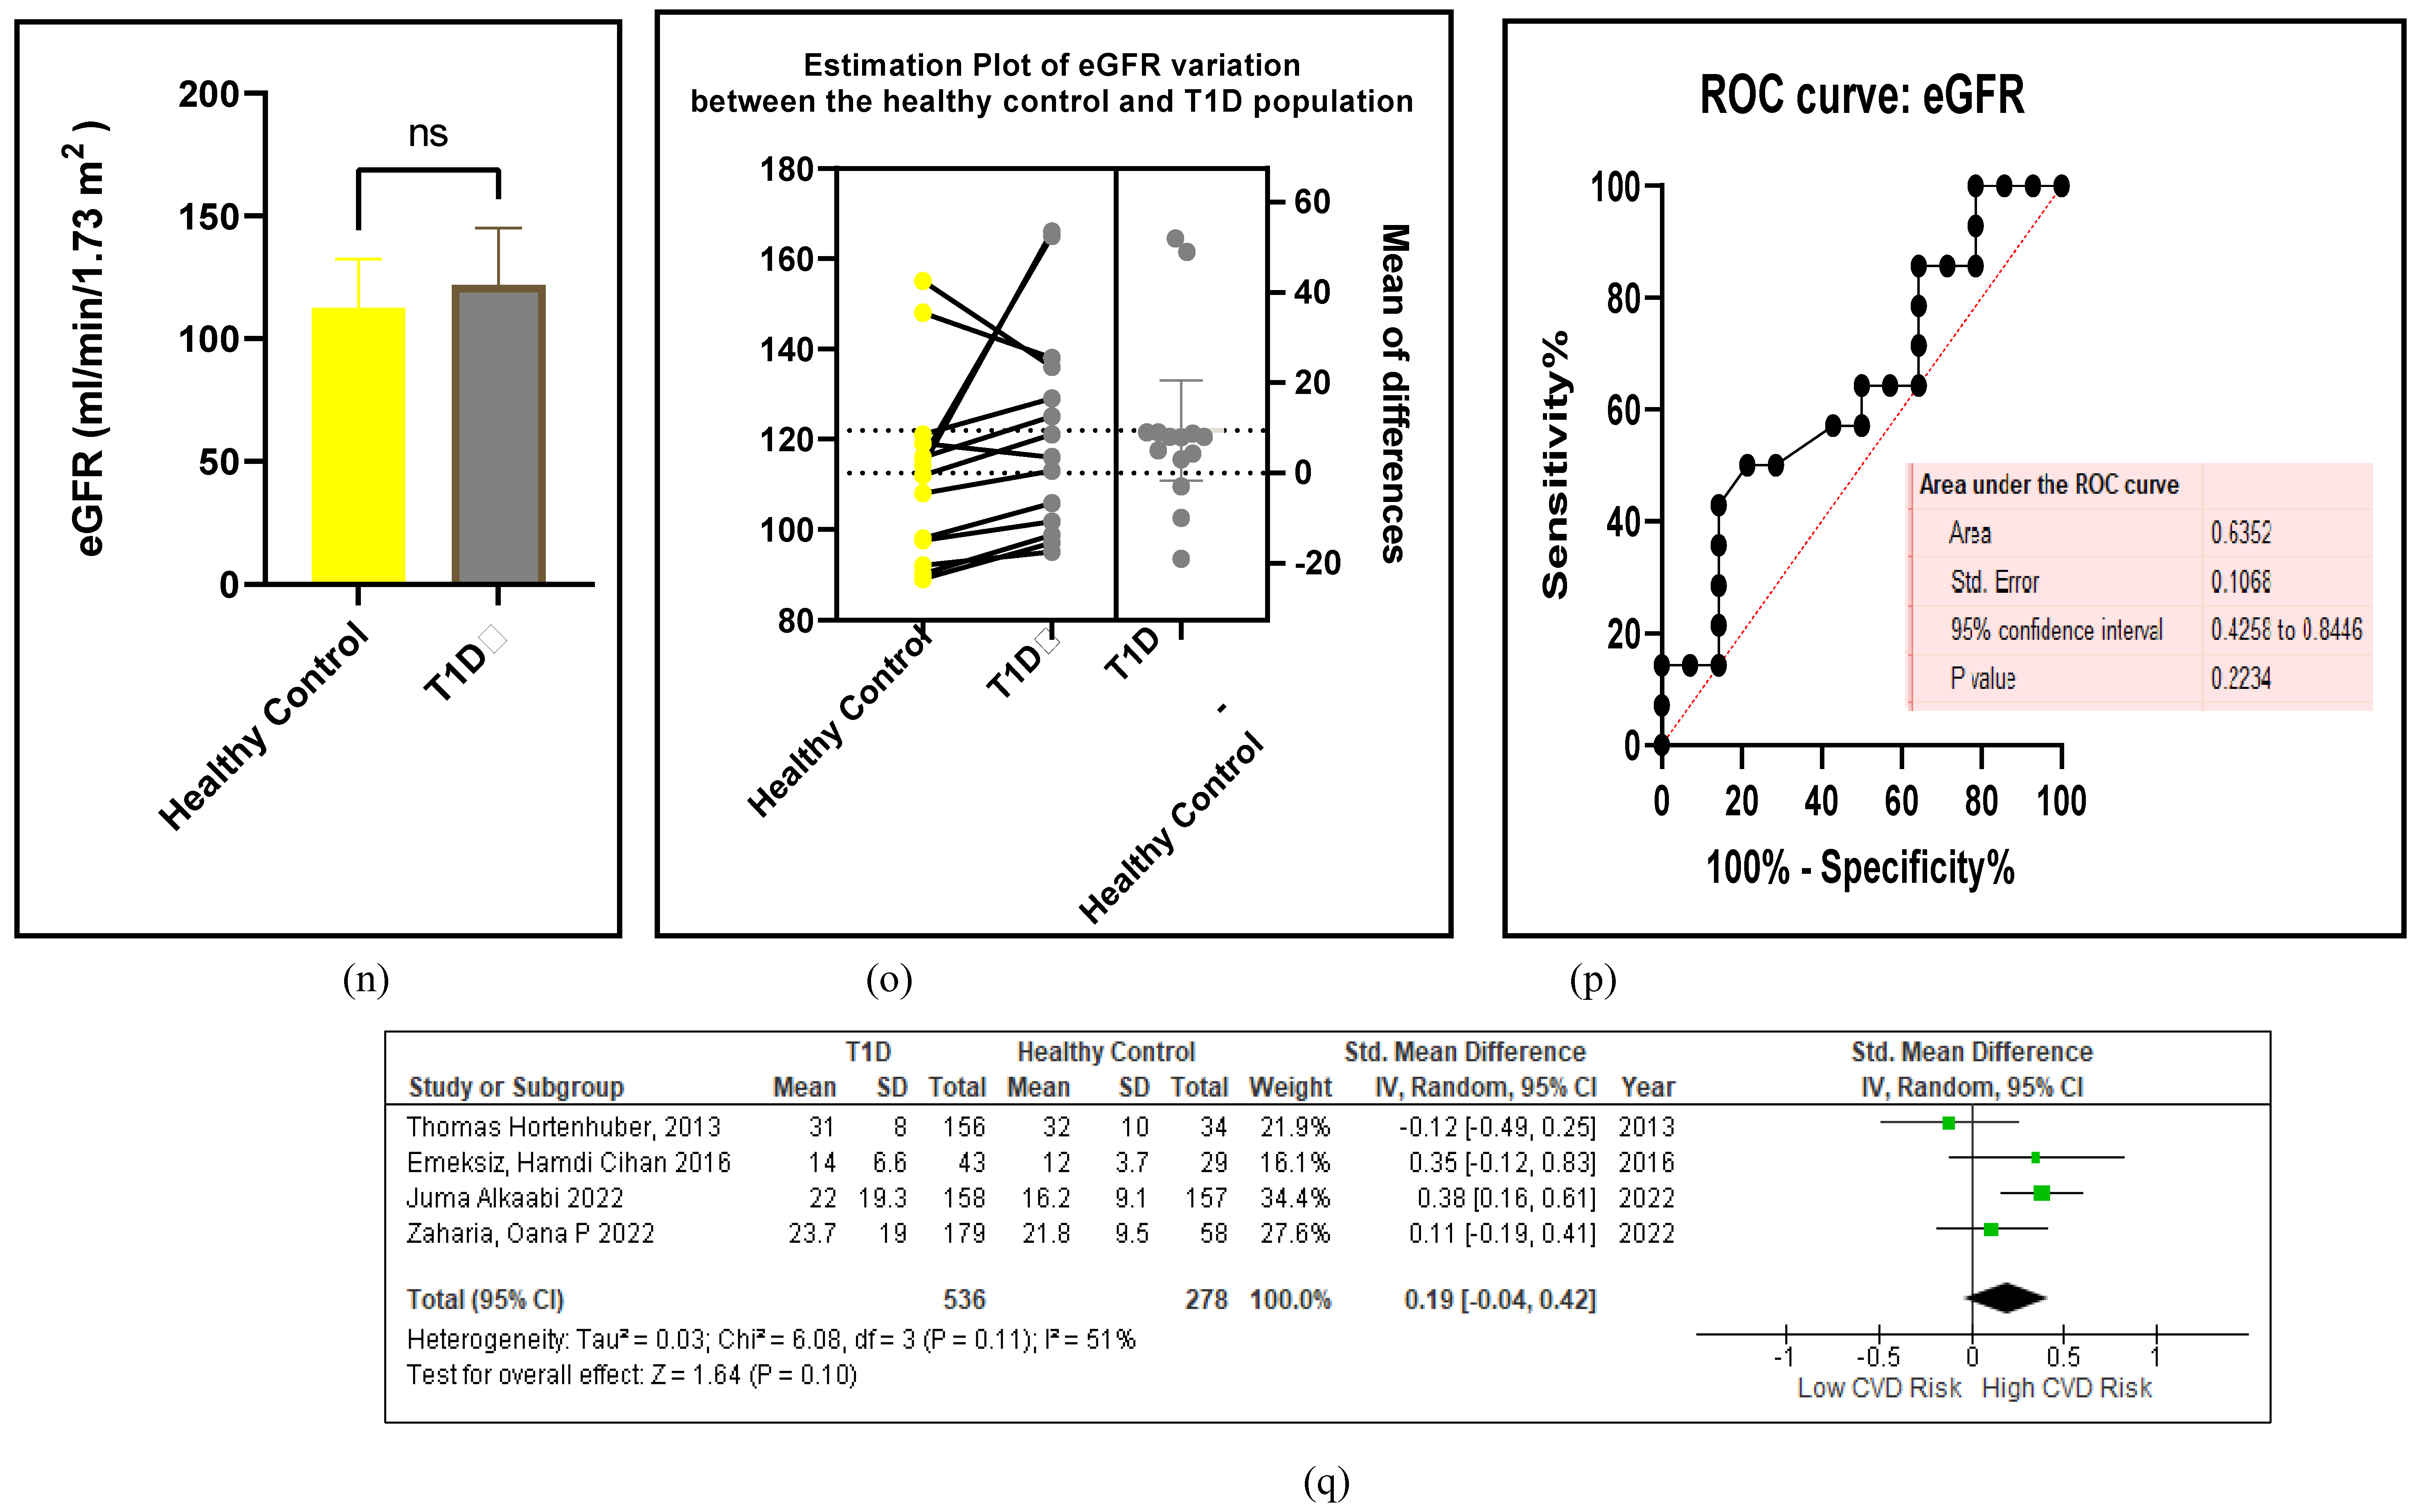
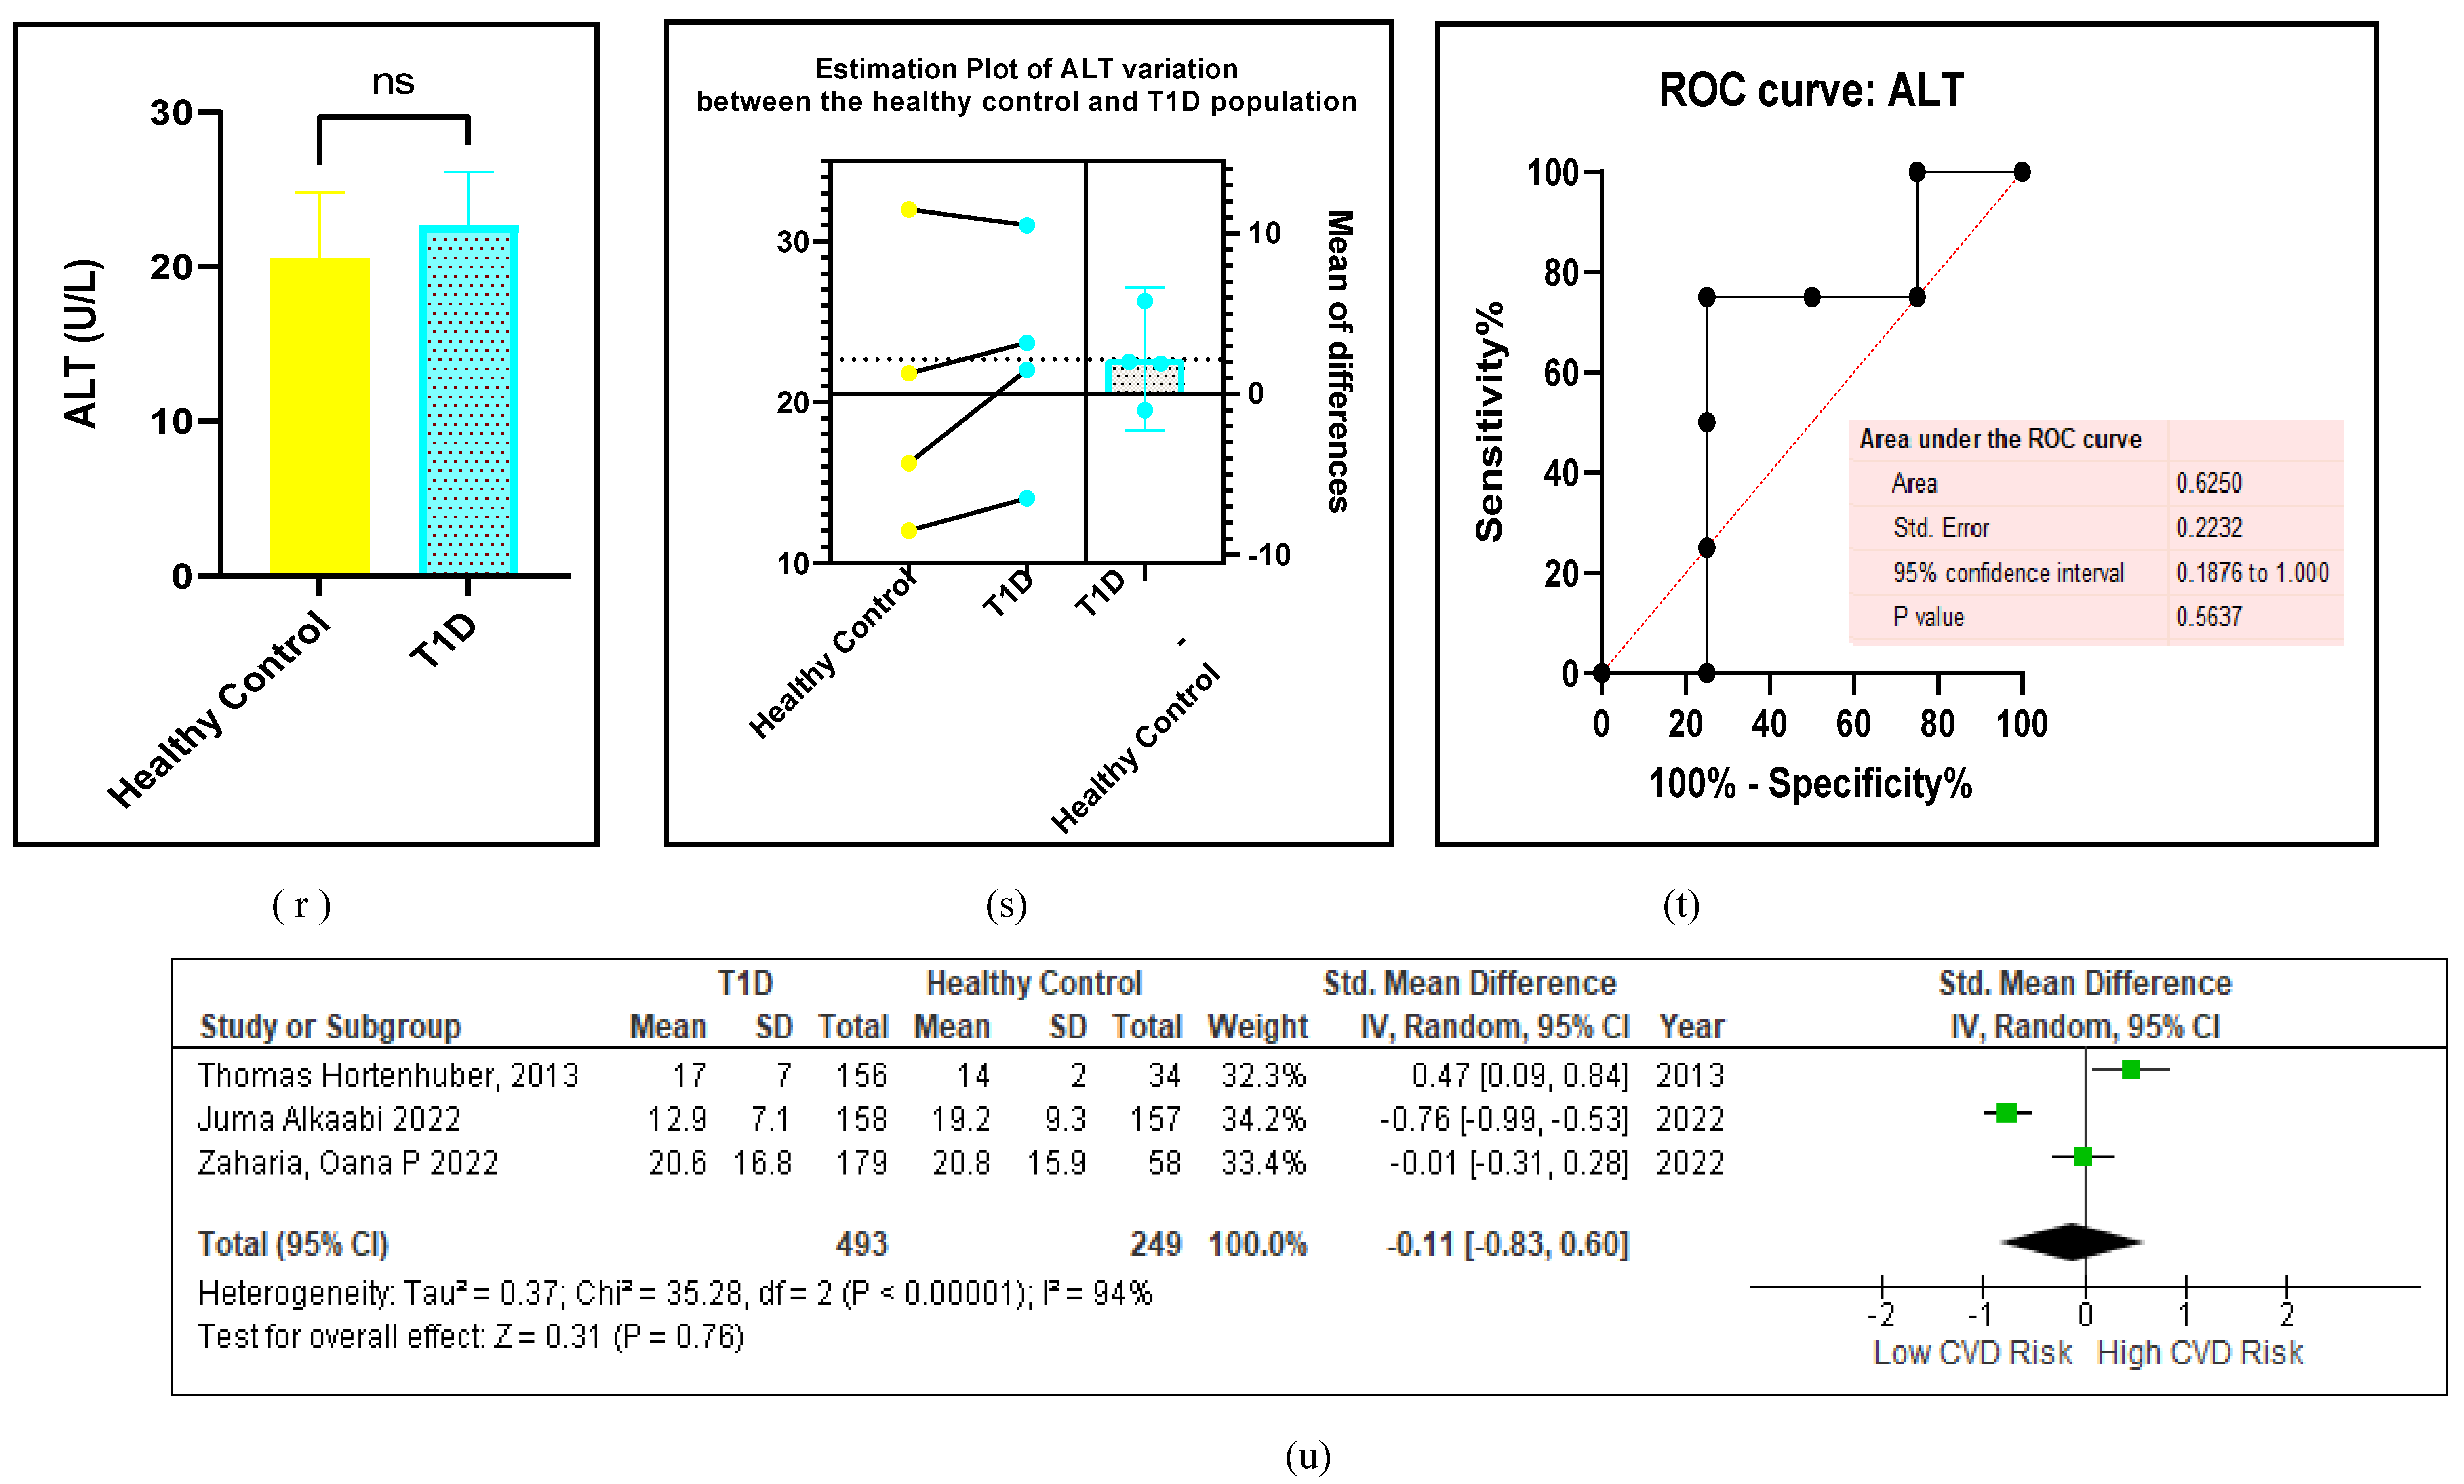
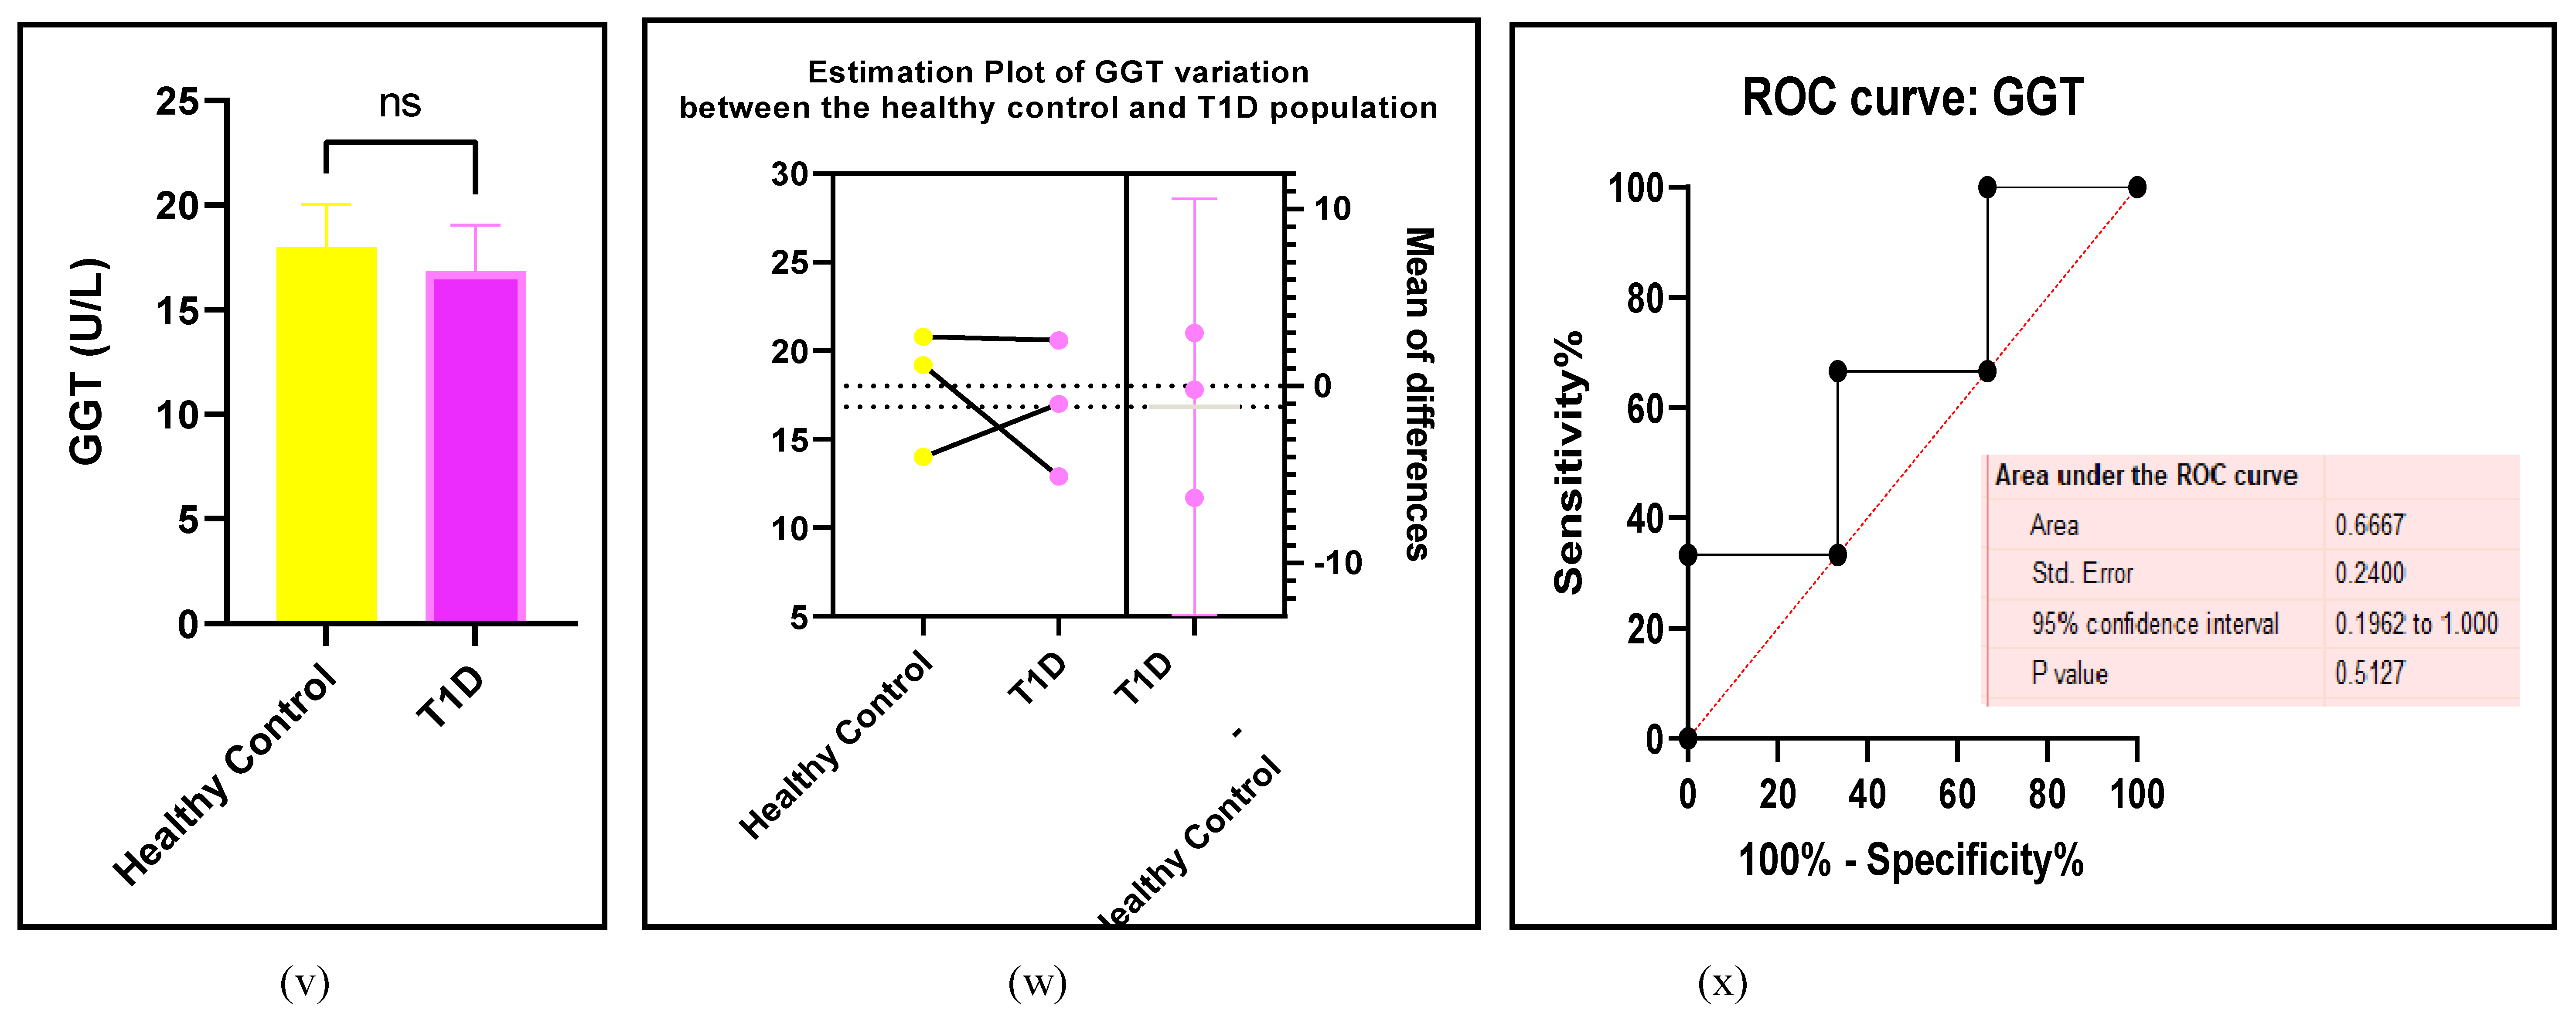
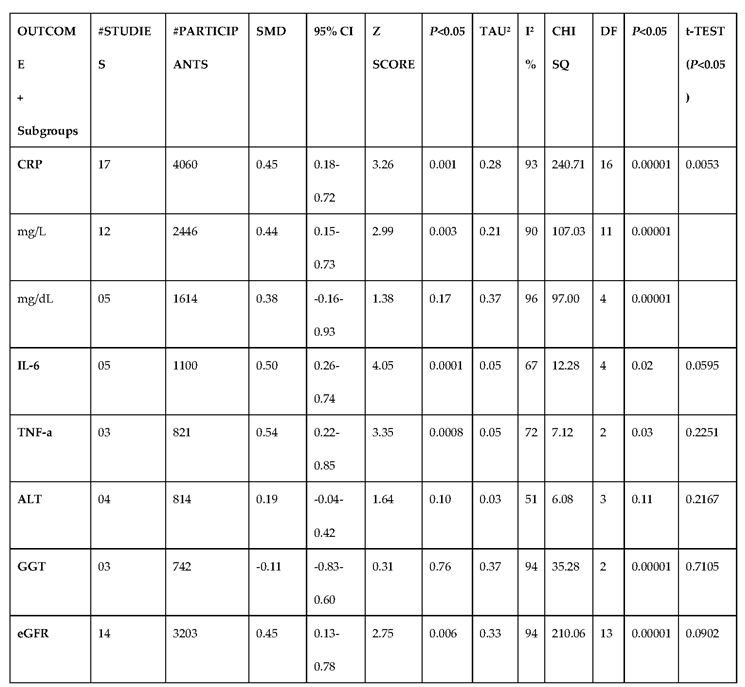
Inflammation is an important factor in the resolution of disease, which plays a pivotal role in innate and adaptive immunity. Inflammatory responses are immune responses that suppress the progression of disease. An evaluation of the prominent inflammatory targets such as proteins, cytokines, and enzymes, reveal the severity of disease such as T1D -induced CVD/ED [65]. Figure 7 (a-x) and Table 6 in this study have assessed six pathological biomarkers that are indicators of vascular disease upregulated by T1D. The forest plots of CRP (p=0.001), IL-6 (p=0.0001 ), TNF-a (p=0.0008) and eGFR (p=0.006) showed a significantly high risk of CVD/ED in the T1D in comparison with the HC.
Figure 7. (a-x): Assessments of the inflammatory biomarkers between the T1D and HC groups. (a) forest plot of CRP (b) paired student-t test bar graph of CRP ( c) EP of CRP (d) ROC of CRP (e ) forest plot of IL-6 (f) paired student-t test bar graph of IL-6 ( g) EP of IL-6 (h) ROC of IL-6 (i) forest plot of TNF-a (j) paired student-t test bar graph of TNF-a ( k) EP of TNF-a (l) ROC of TNF-a (m) forest plot of eGFR (n) paired student-t test bar graph of eGFR ( o) EP of eGFR (p) ROC of eGFR (q) forest plot of ALT (r) paired student-t test bar graph of ALT ( s) EP of ALT (t) ROC of ALT (u) forest plot of GGT (v) paired student-t test bar graph of GGT ( w) EP of GGT (x) ROC of GGT. Results are statistically significant at p < 0.05.
Preprints 105488 g007aPreprints 105488 g007bPreprints 105488 g007cPreprints 105488 g007dPreprints 105488 g007ePreprints 105488 g007fPreprints 105488 g007g

3.2.6. The Obesity Targets Are Also Fitting Biomarkers of T1D-Induced ED
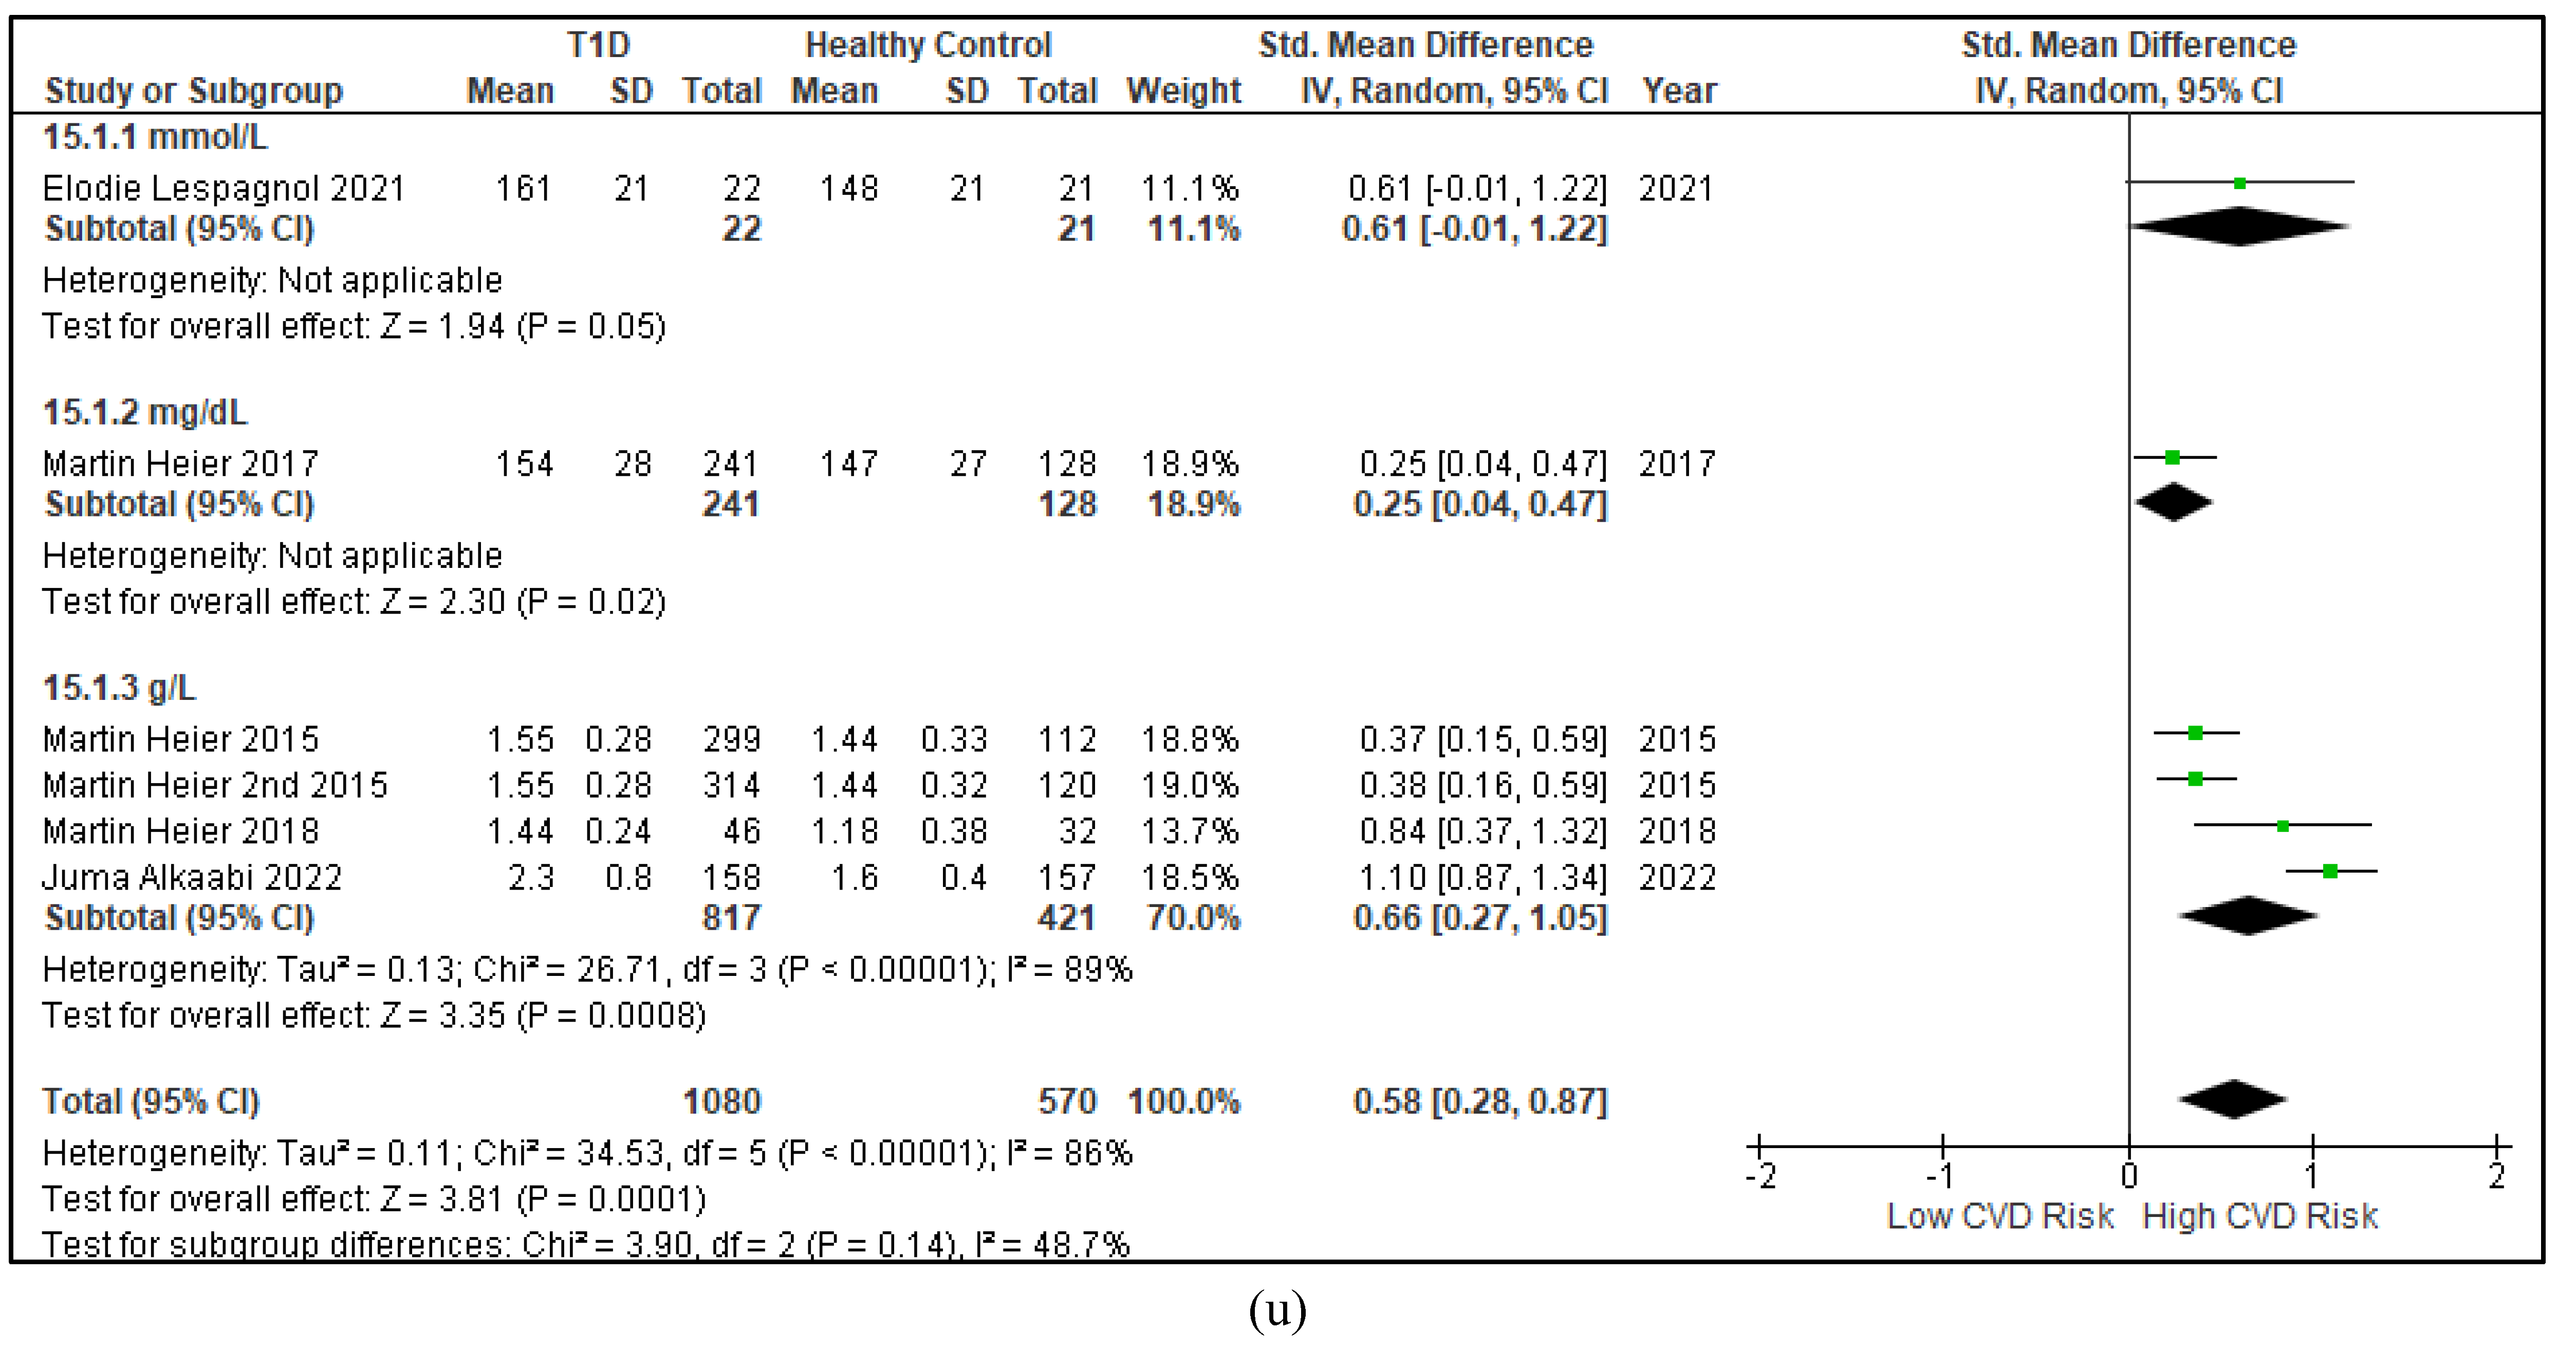
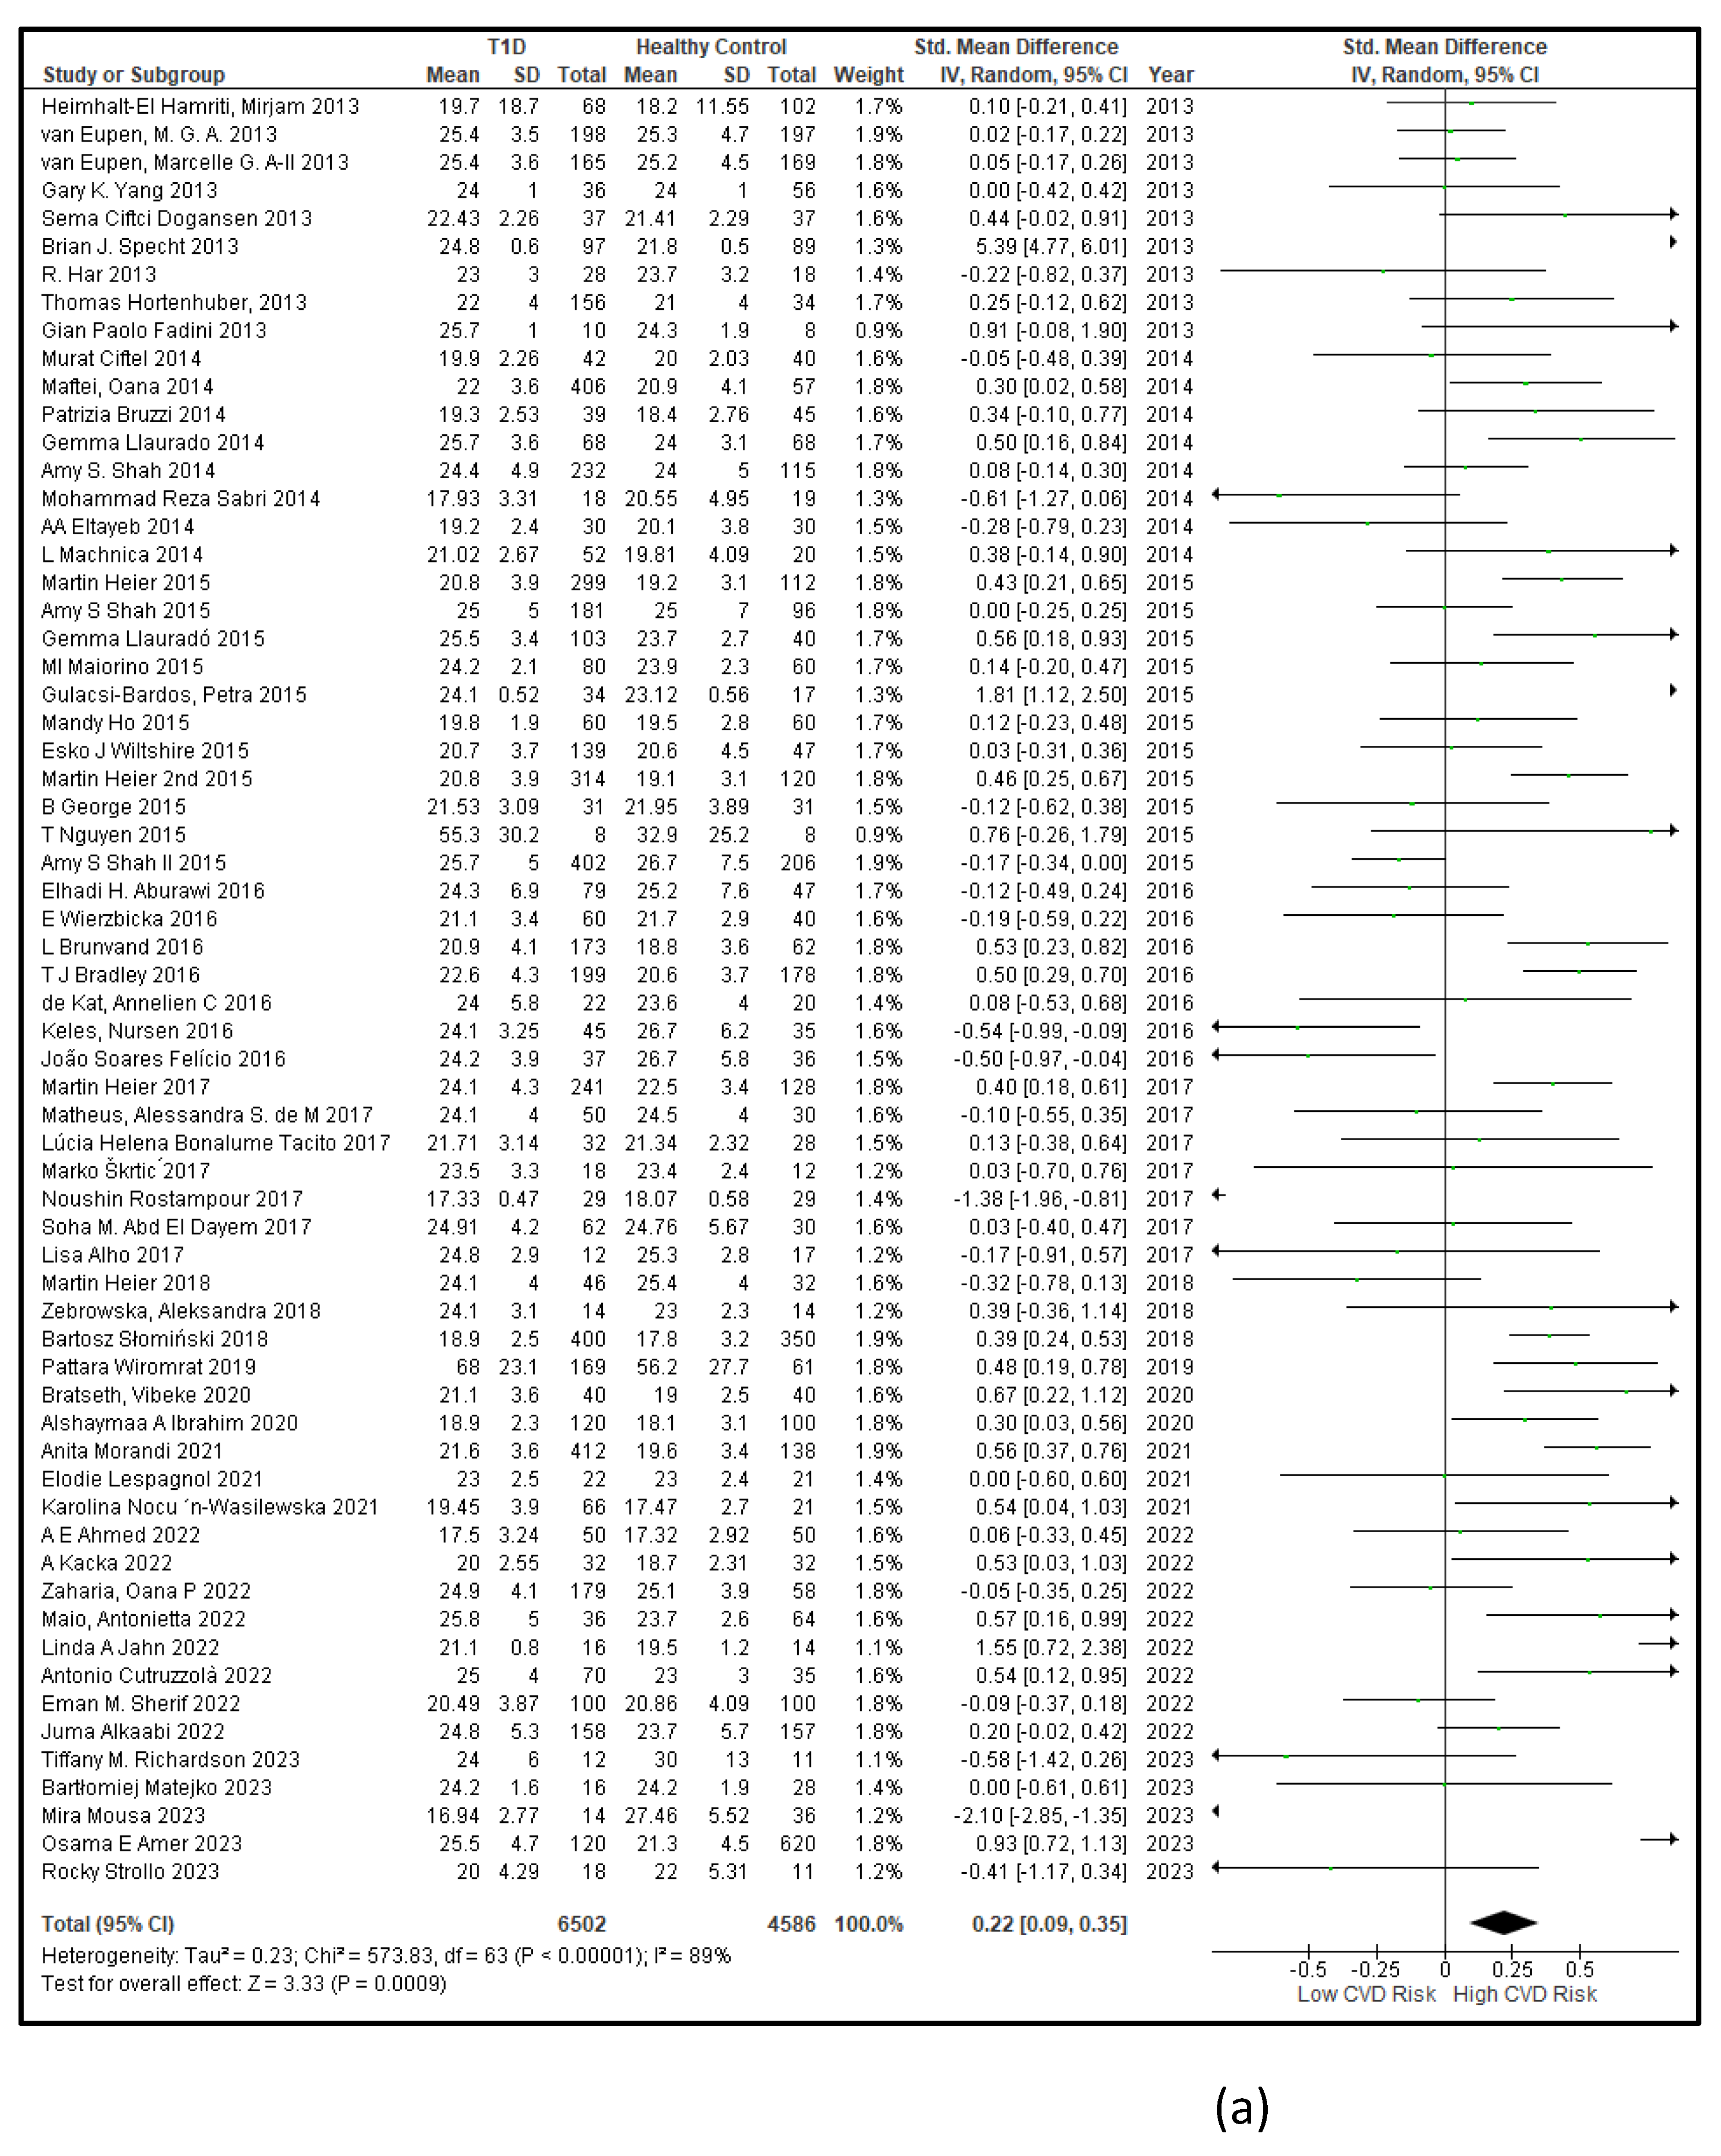
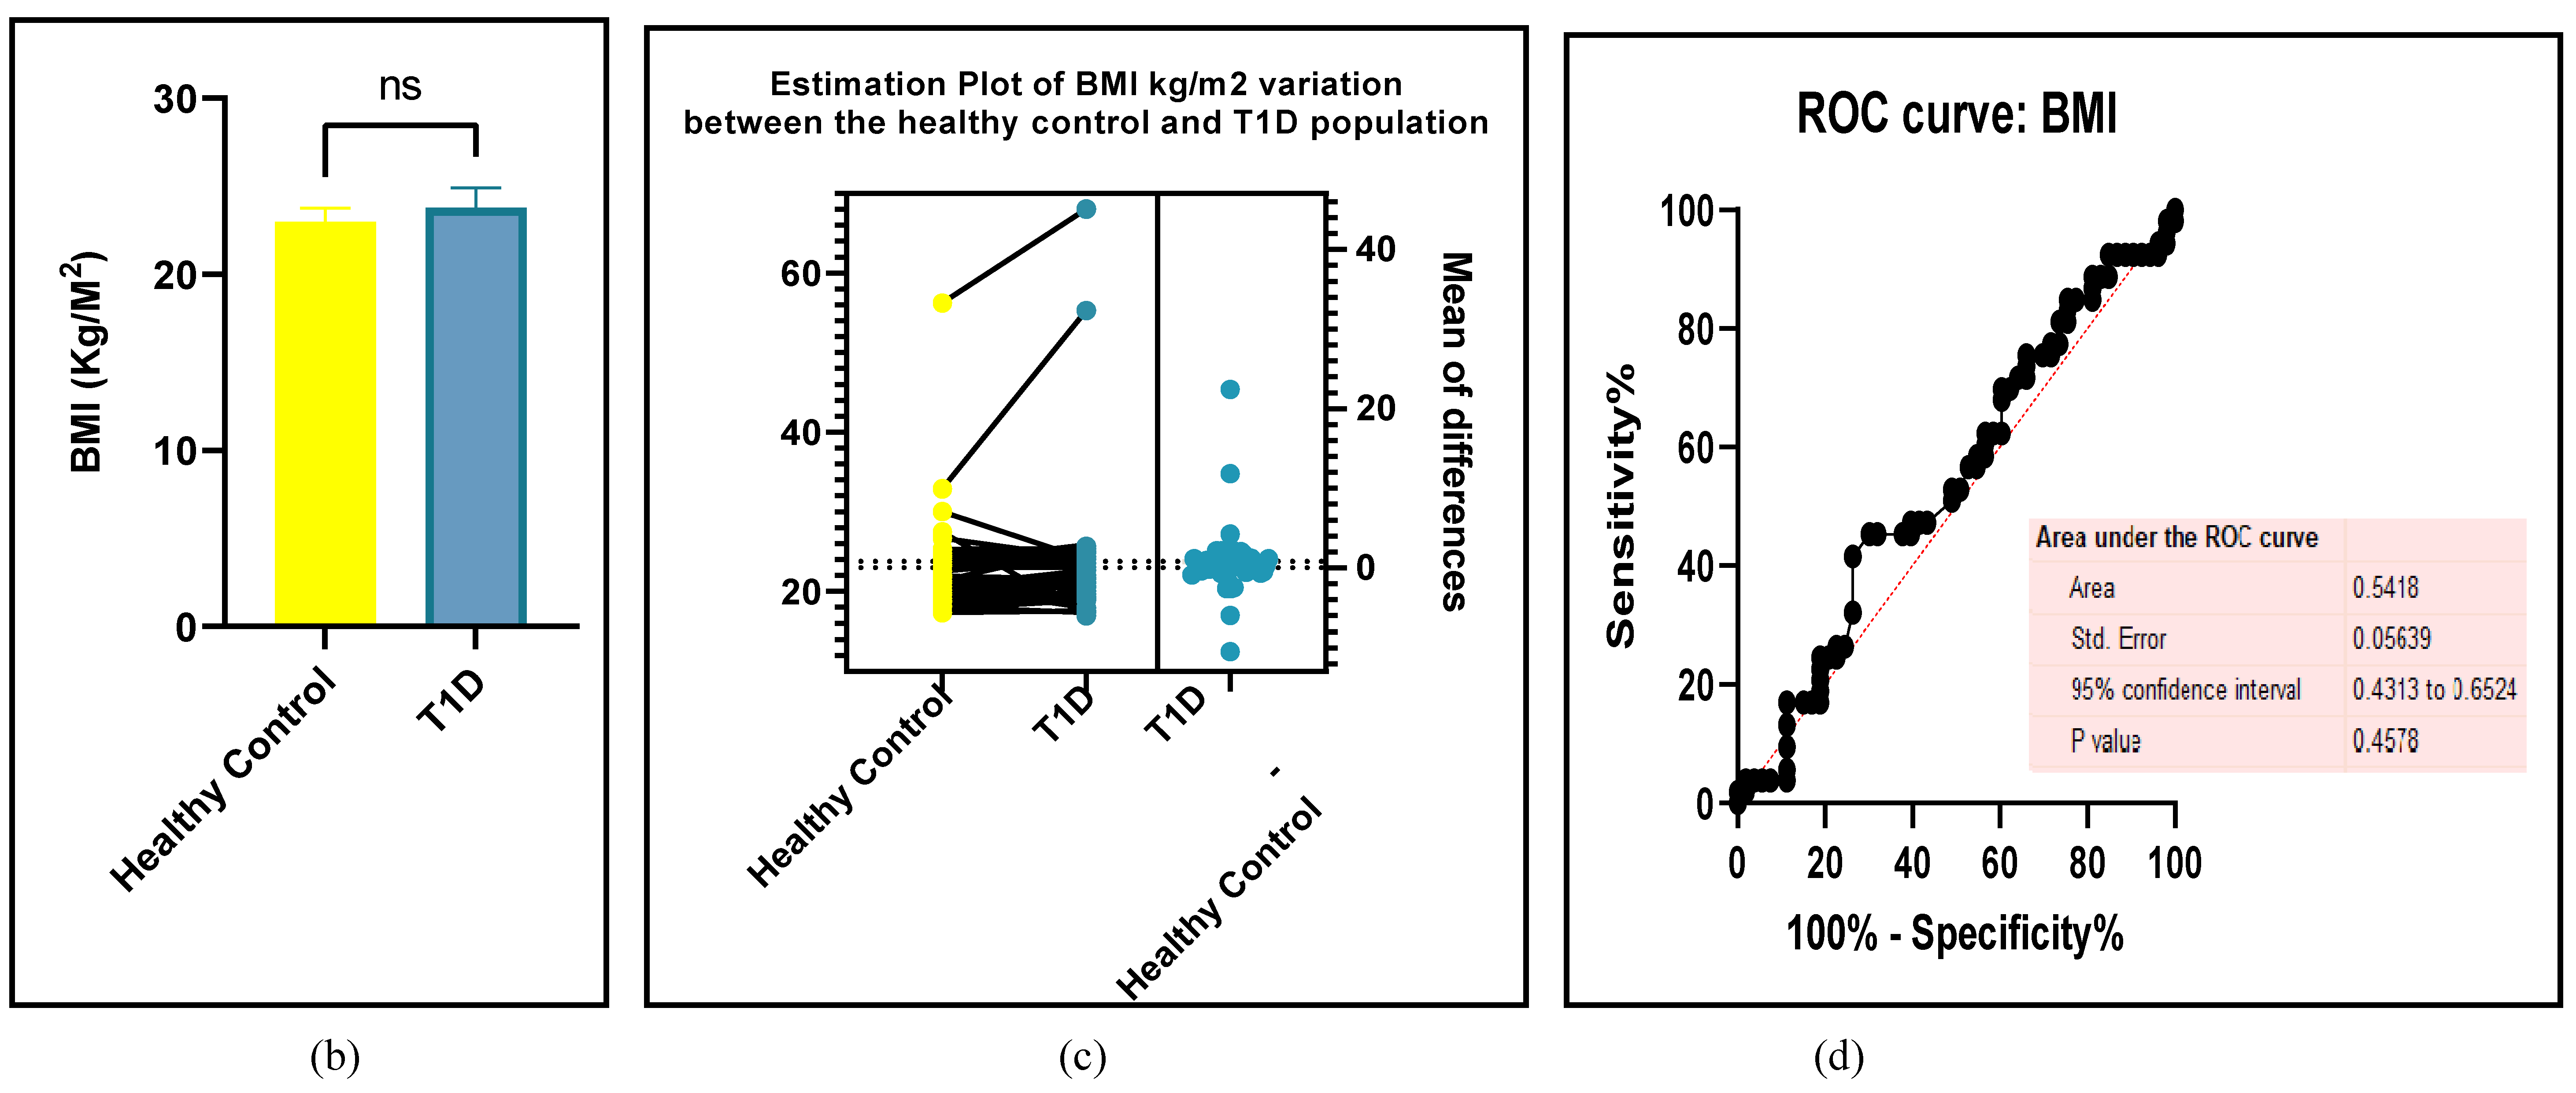
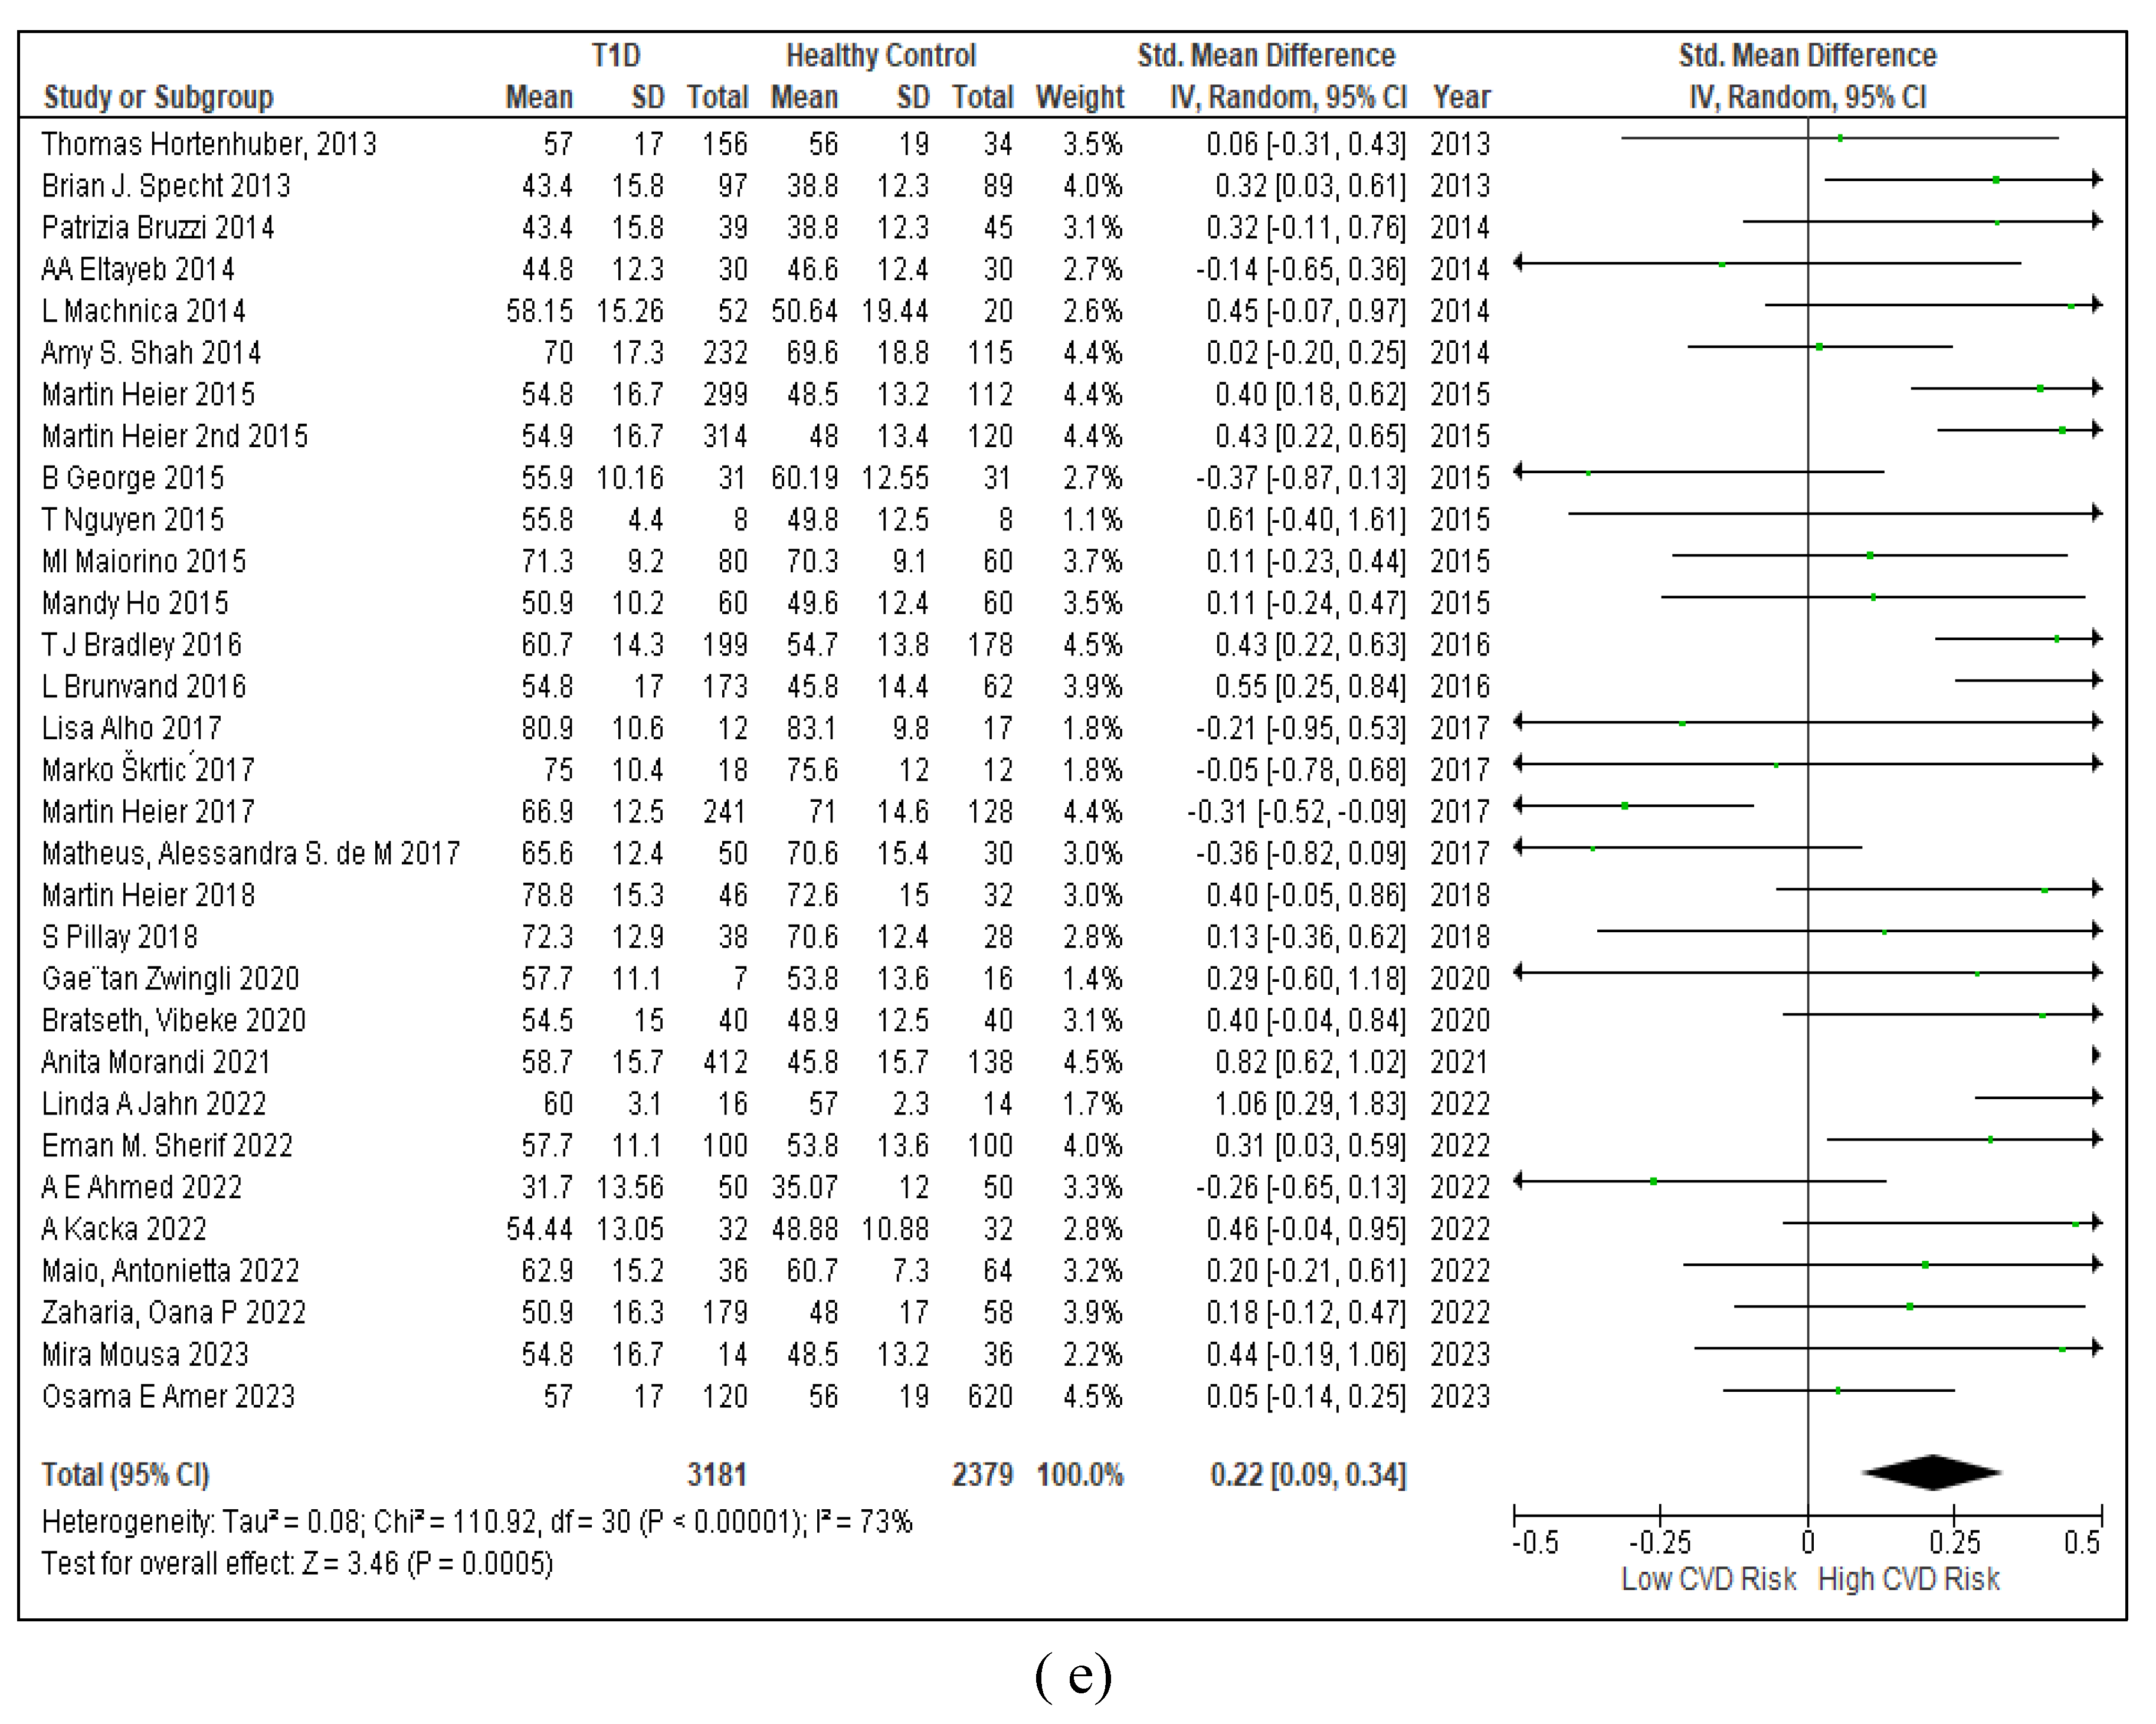
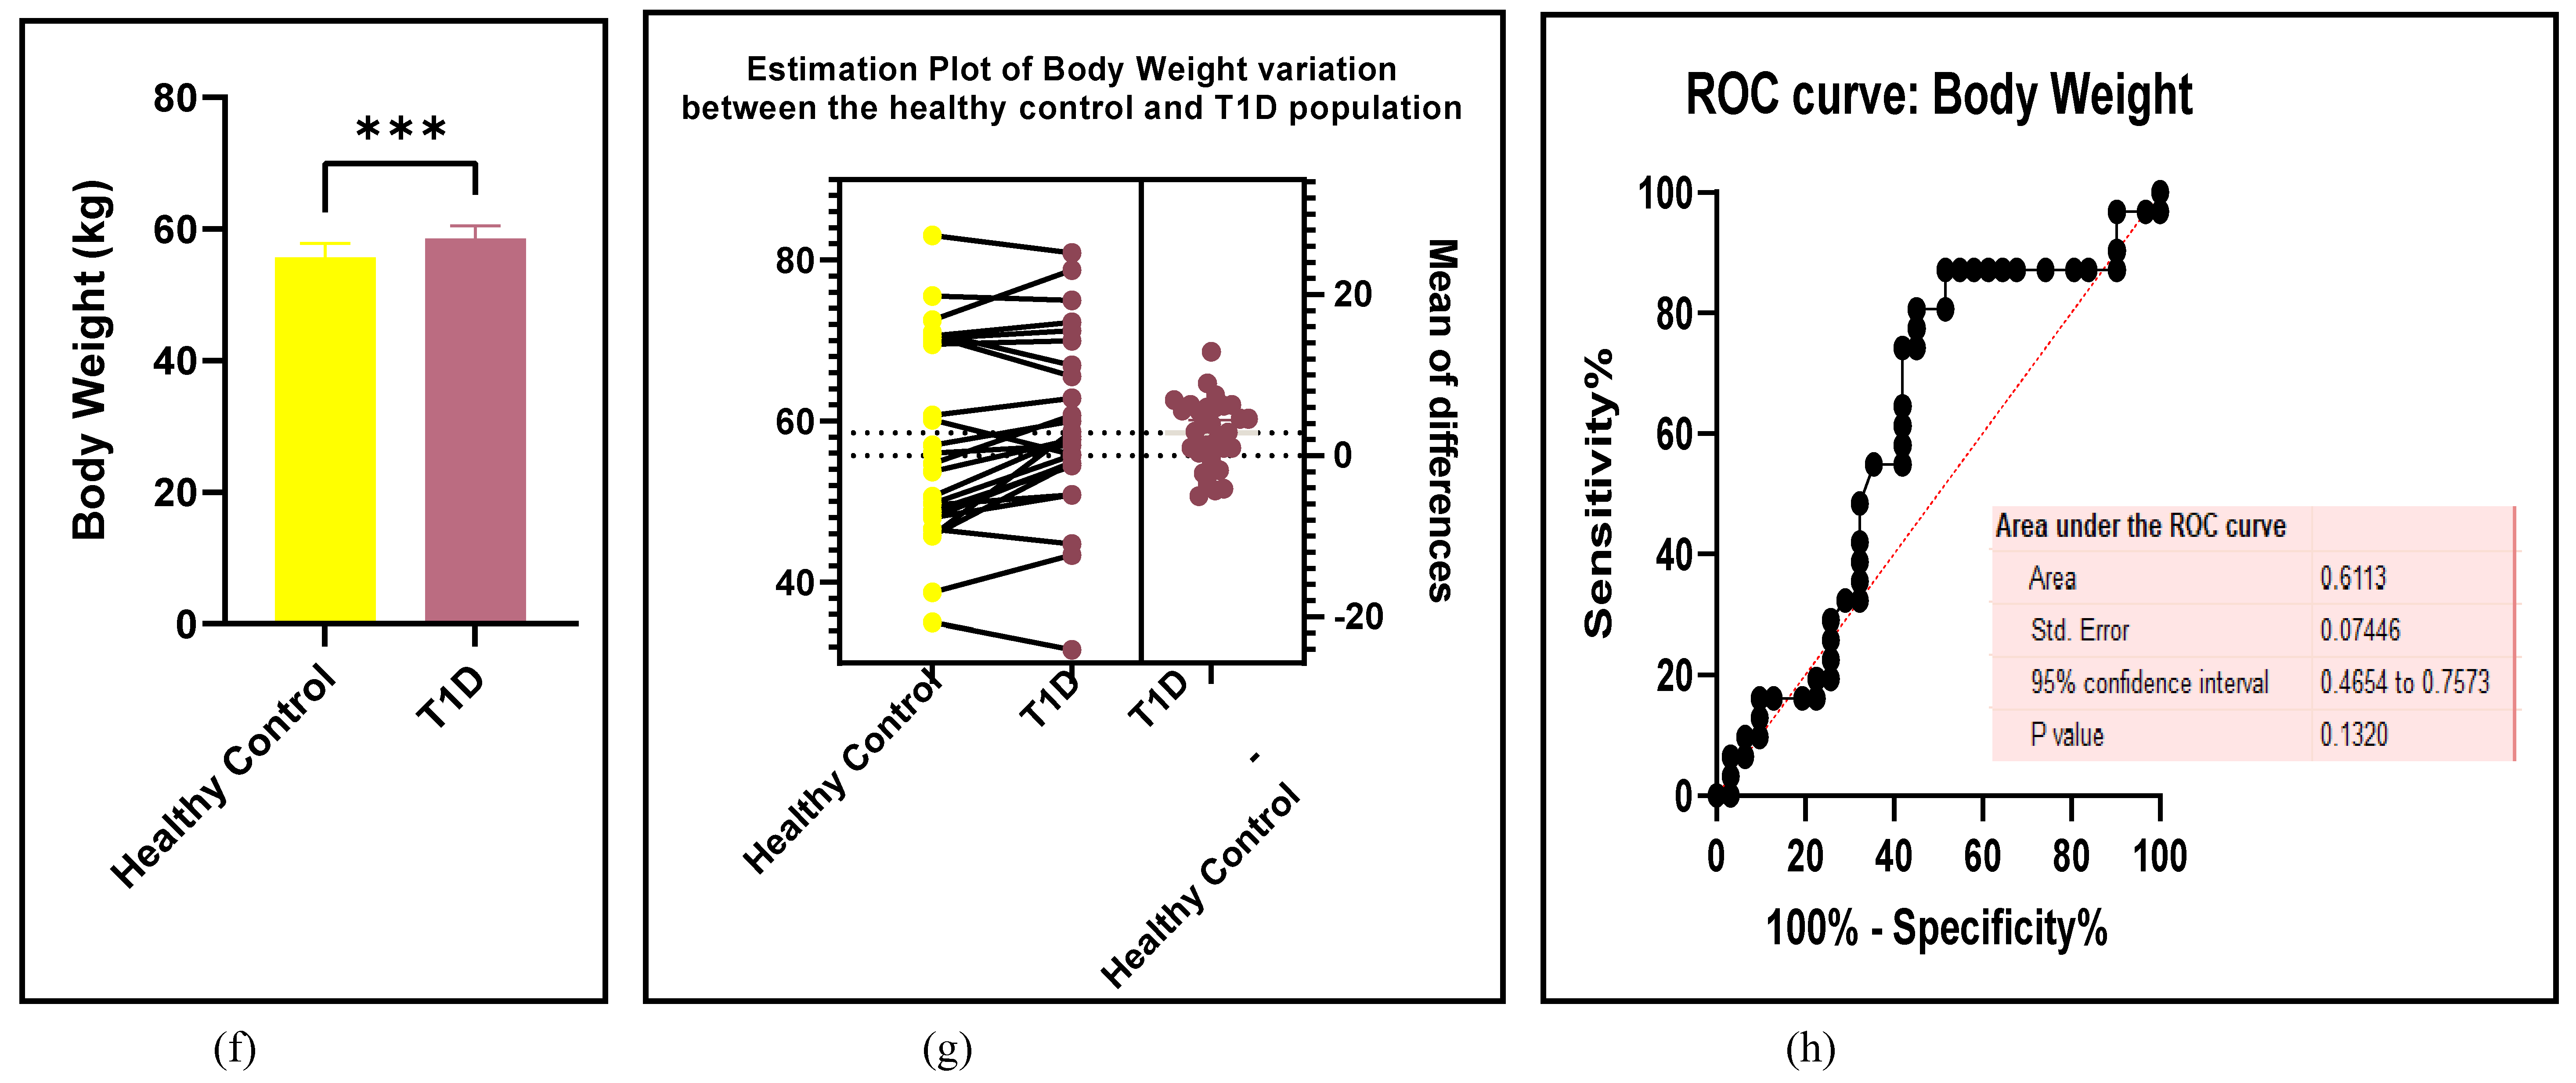
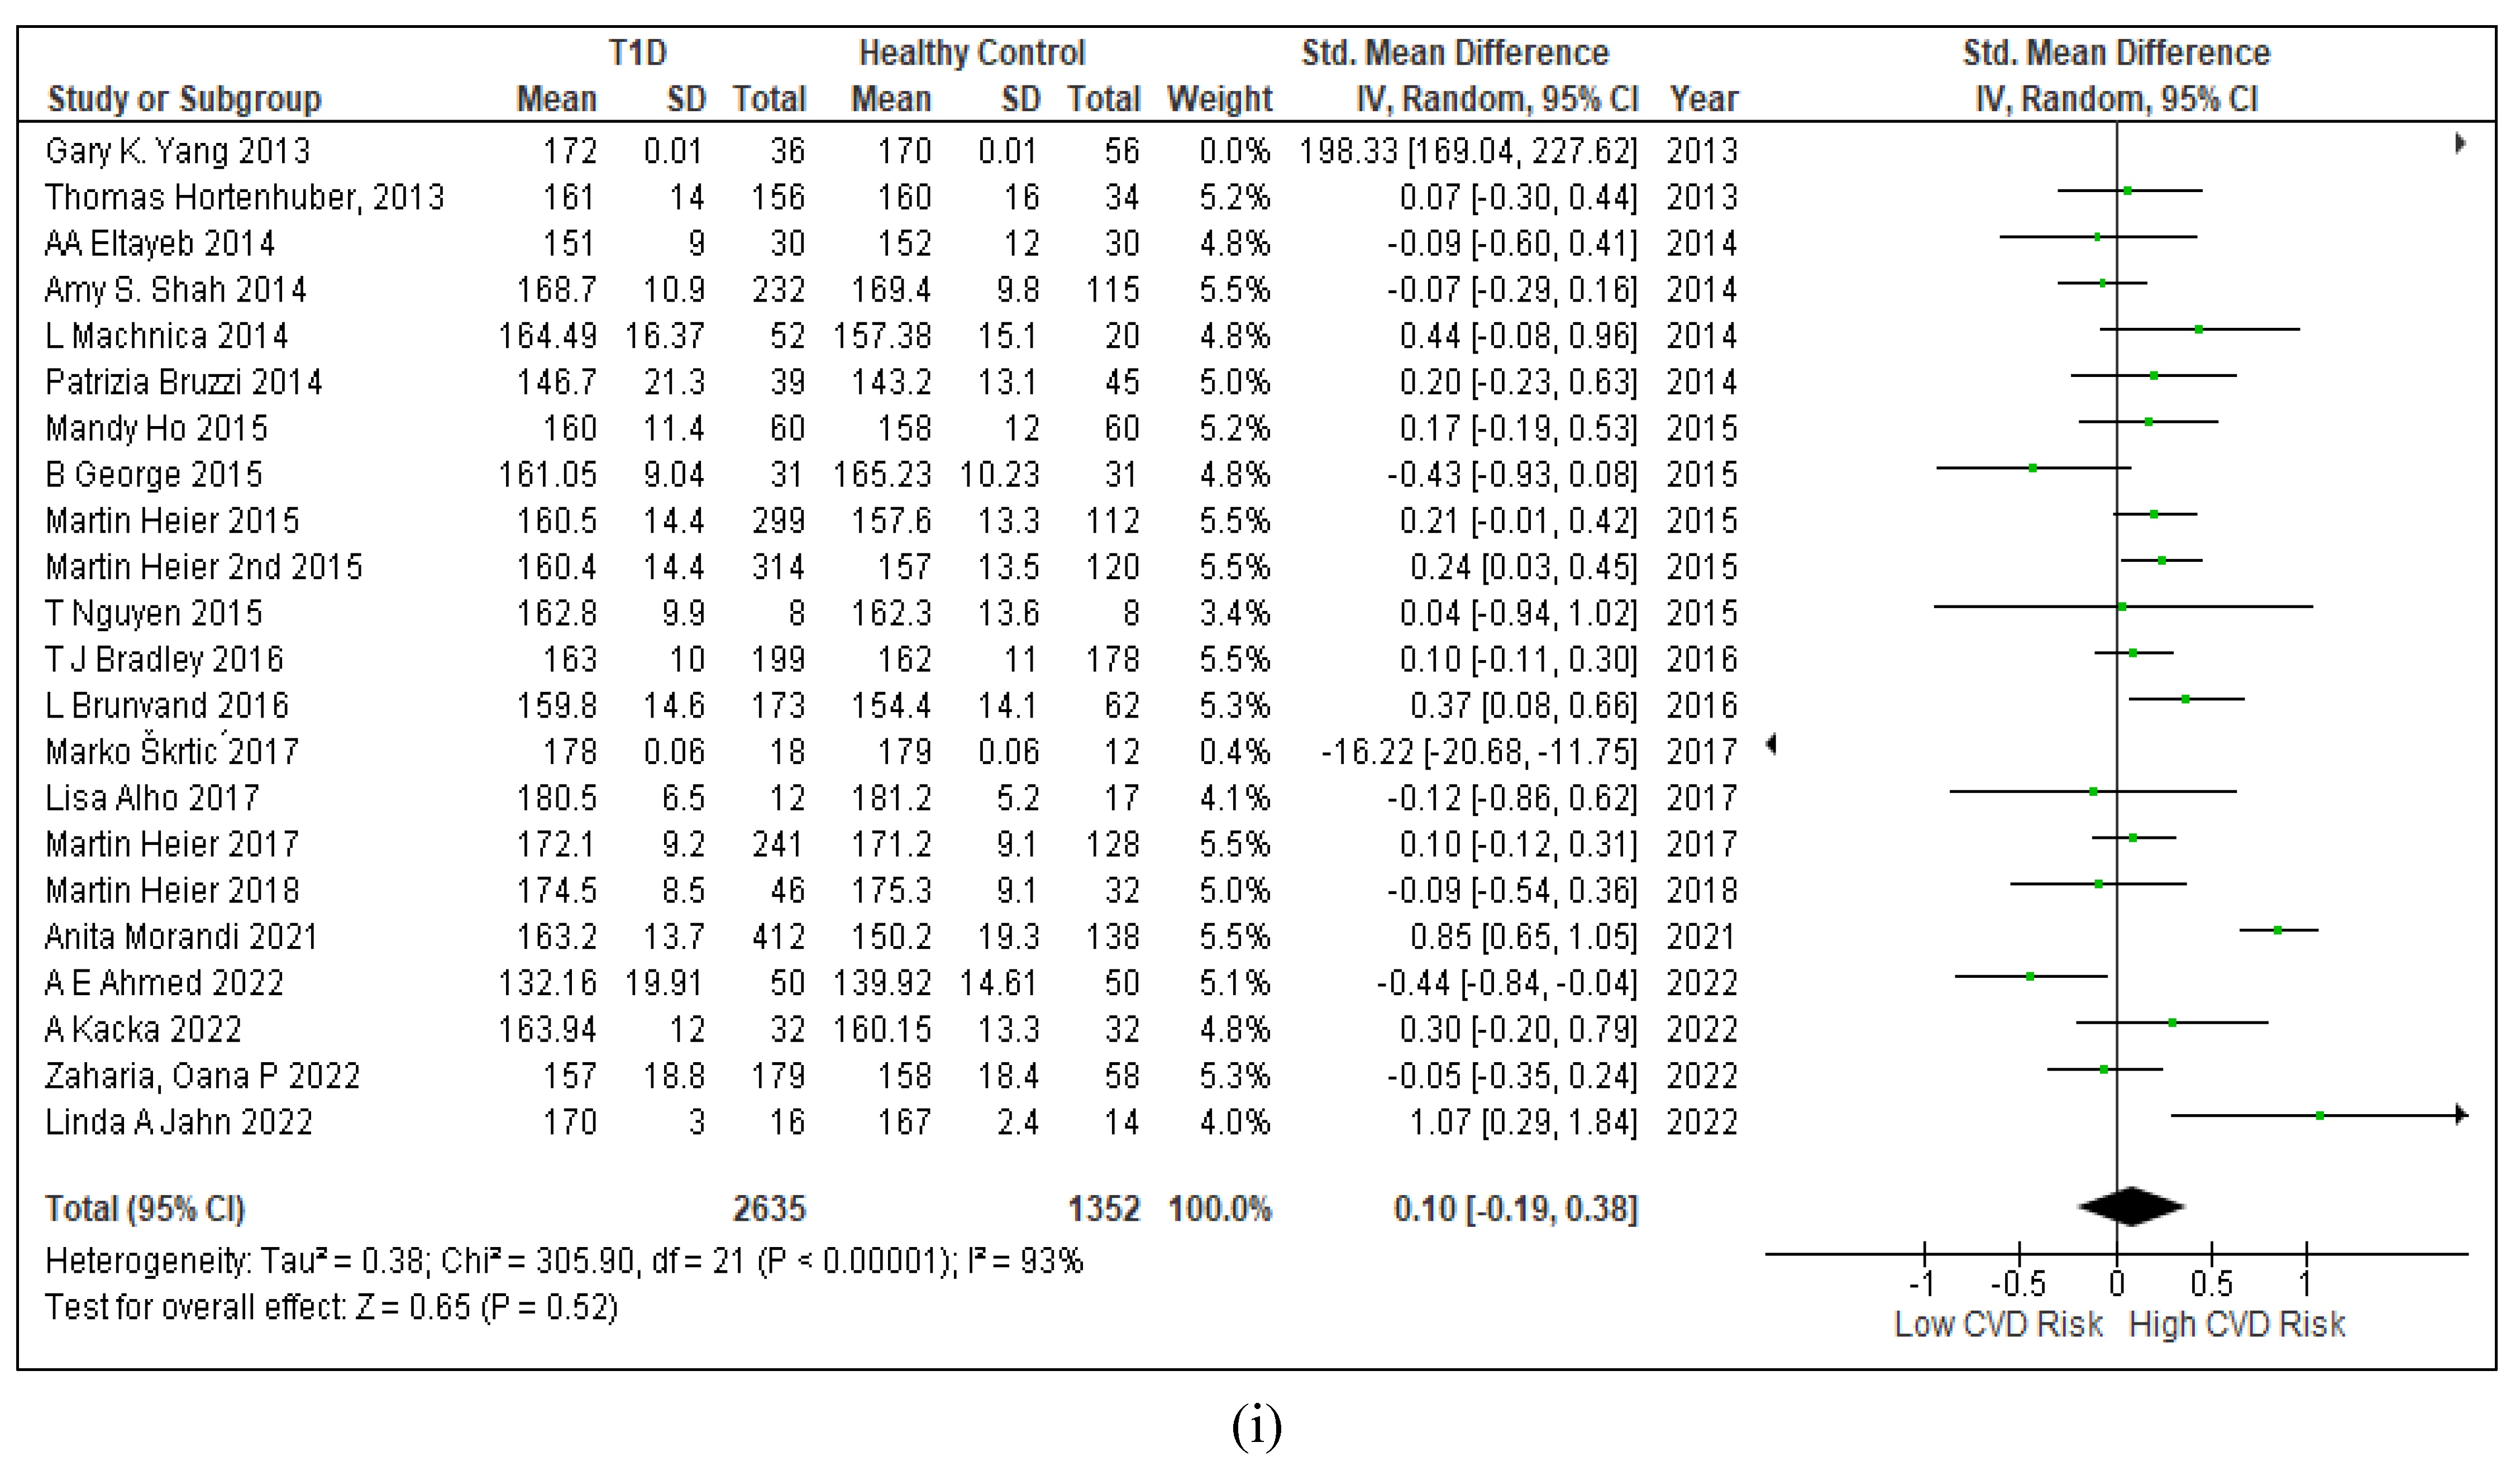
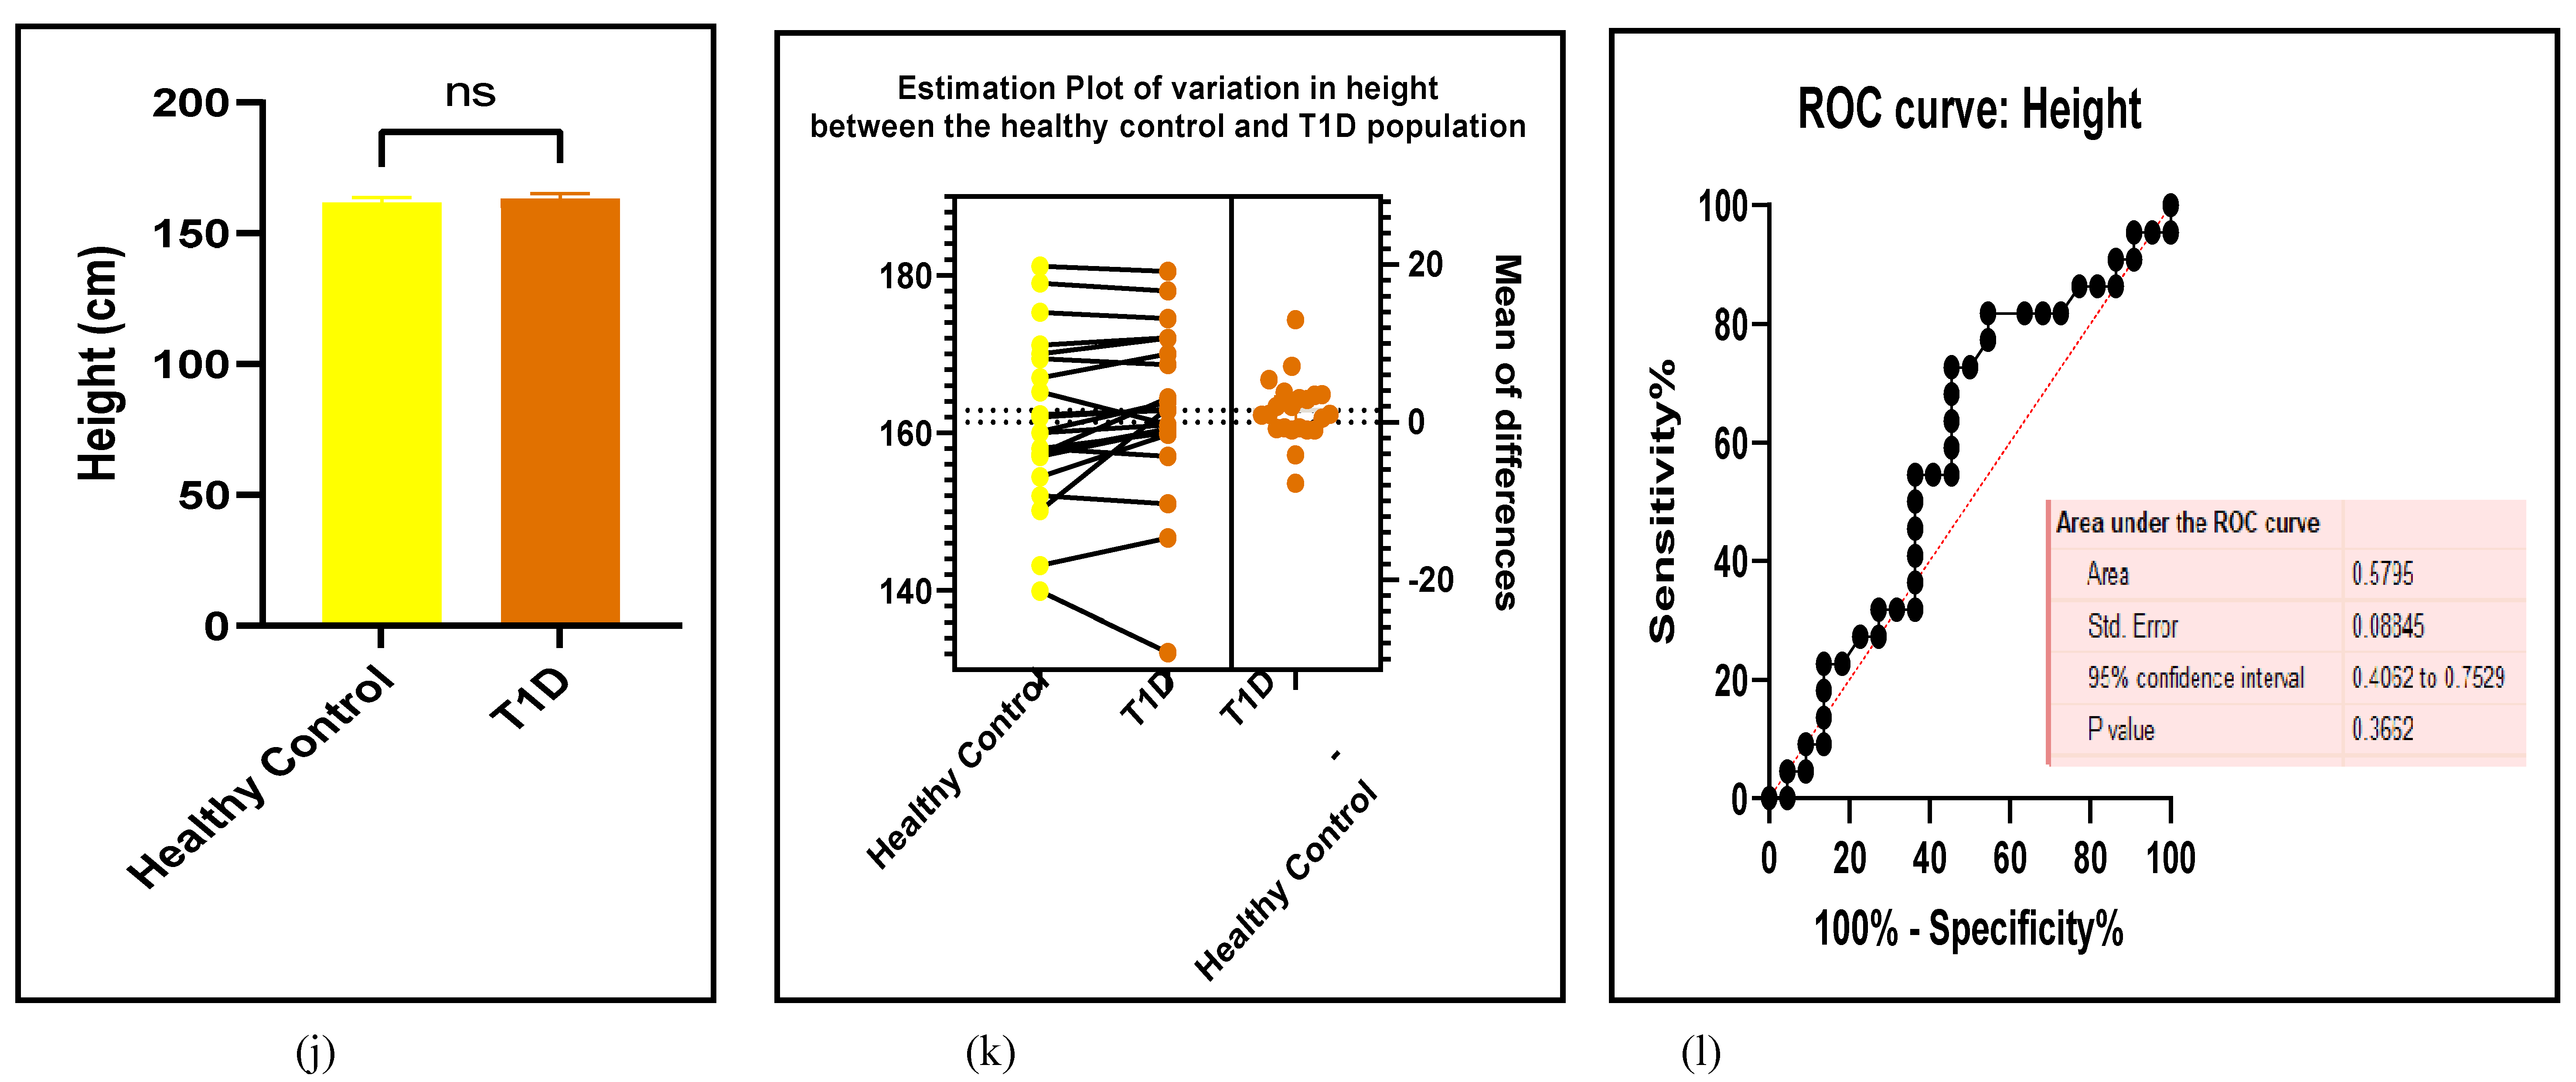
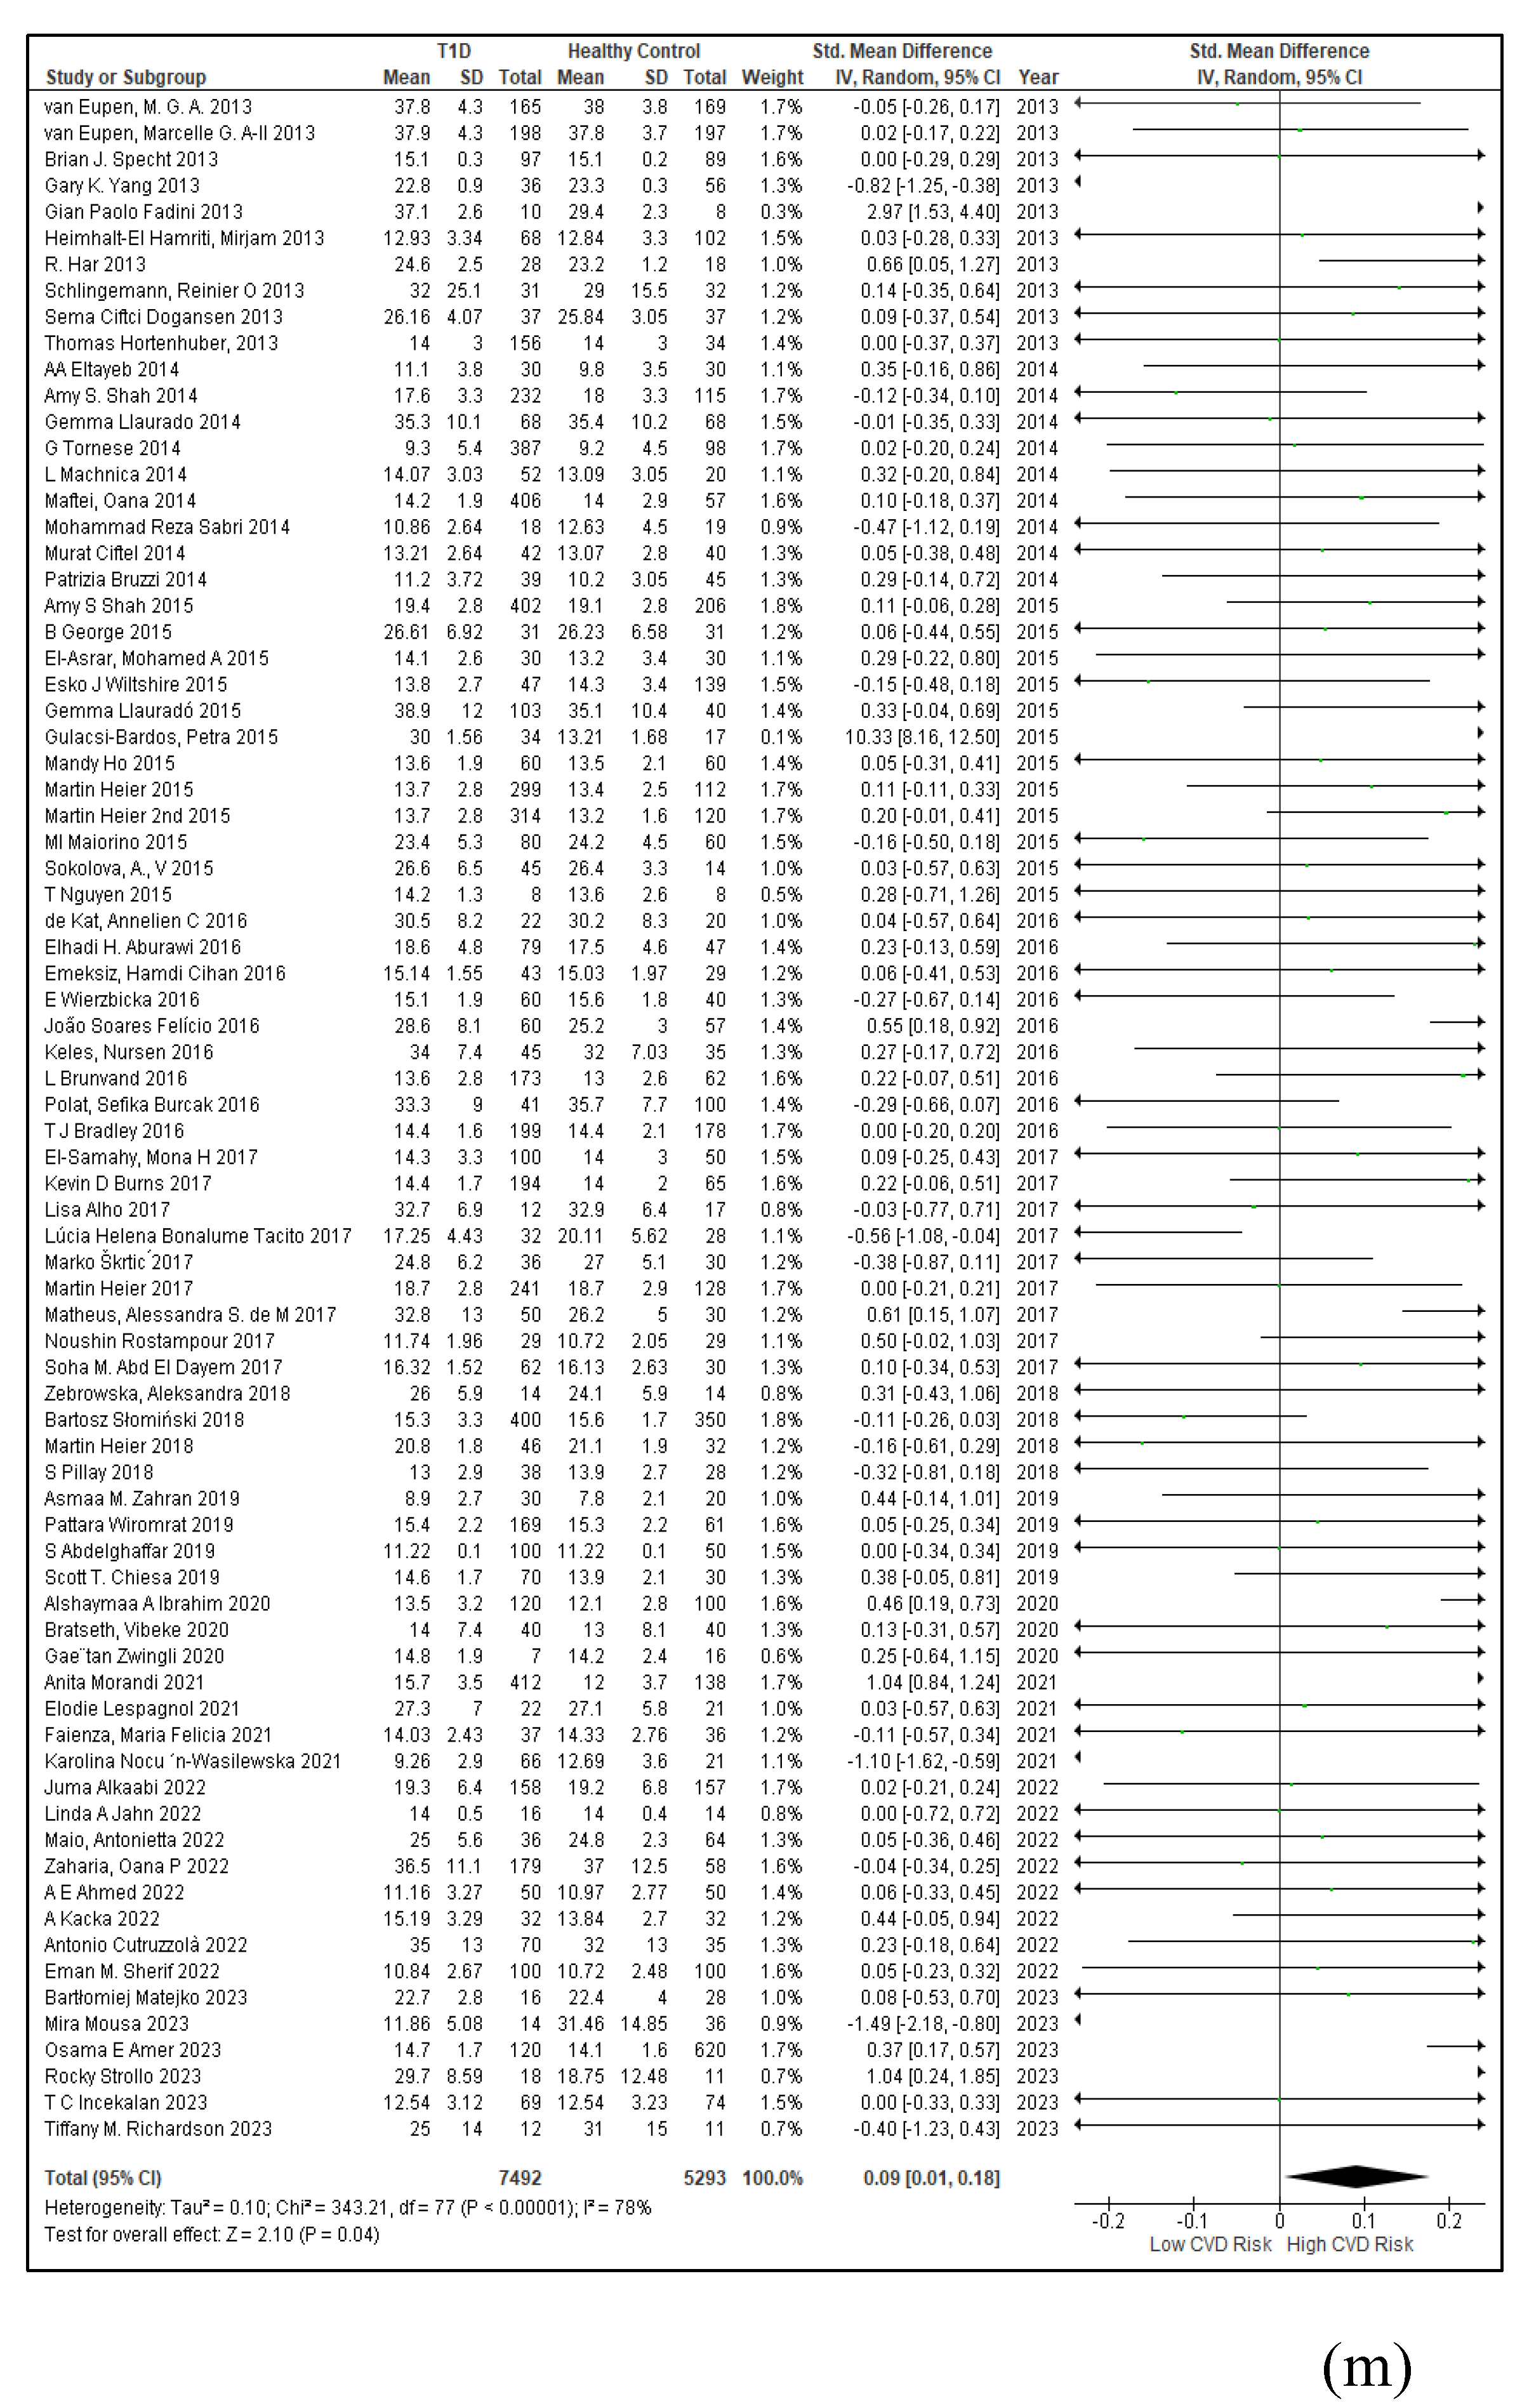
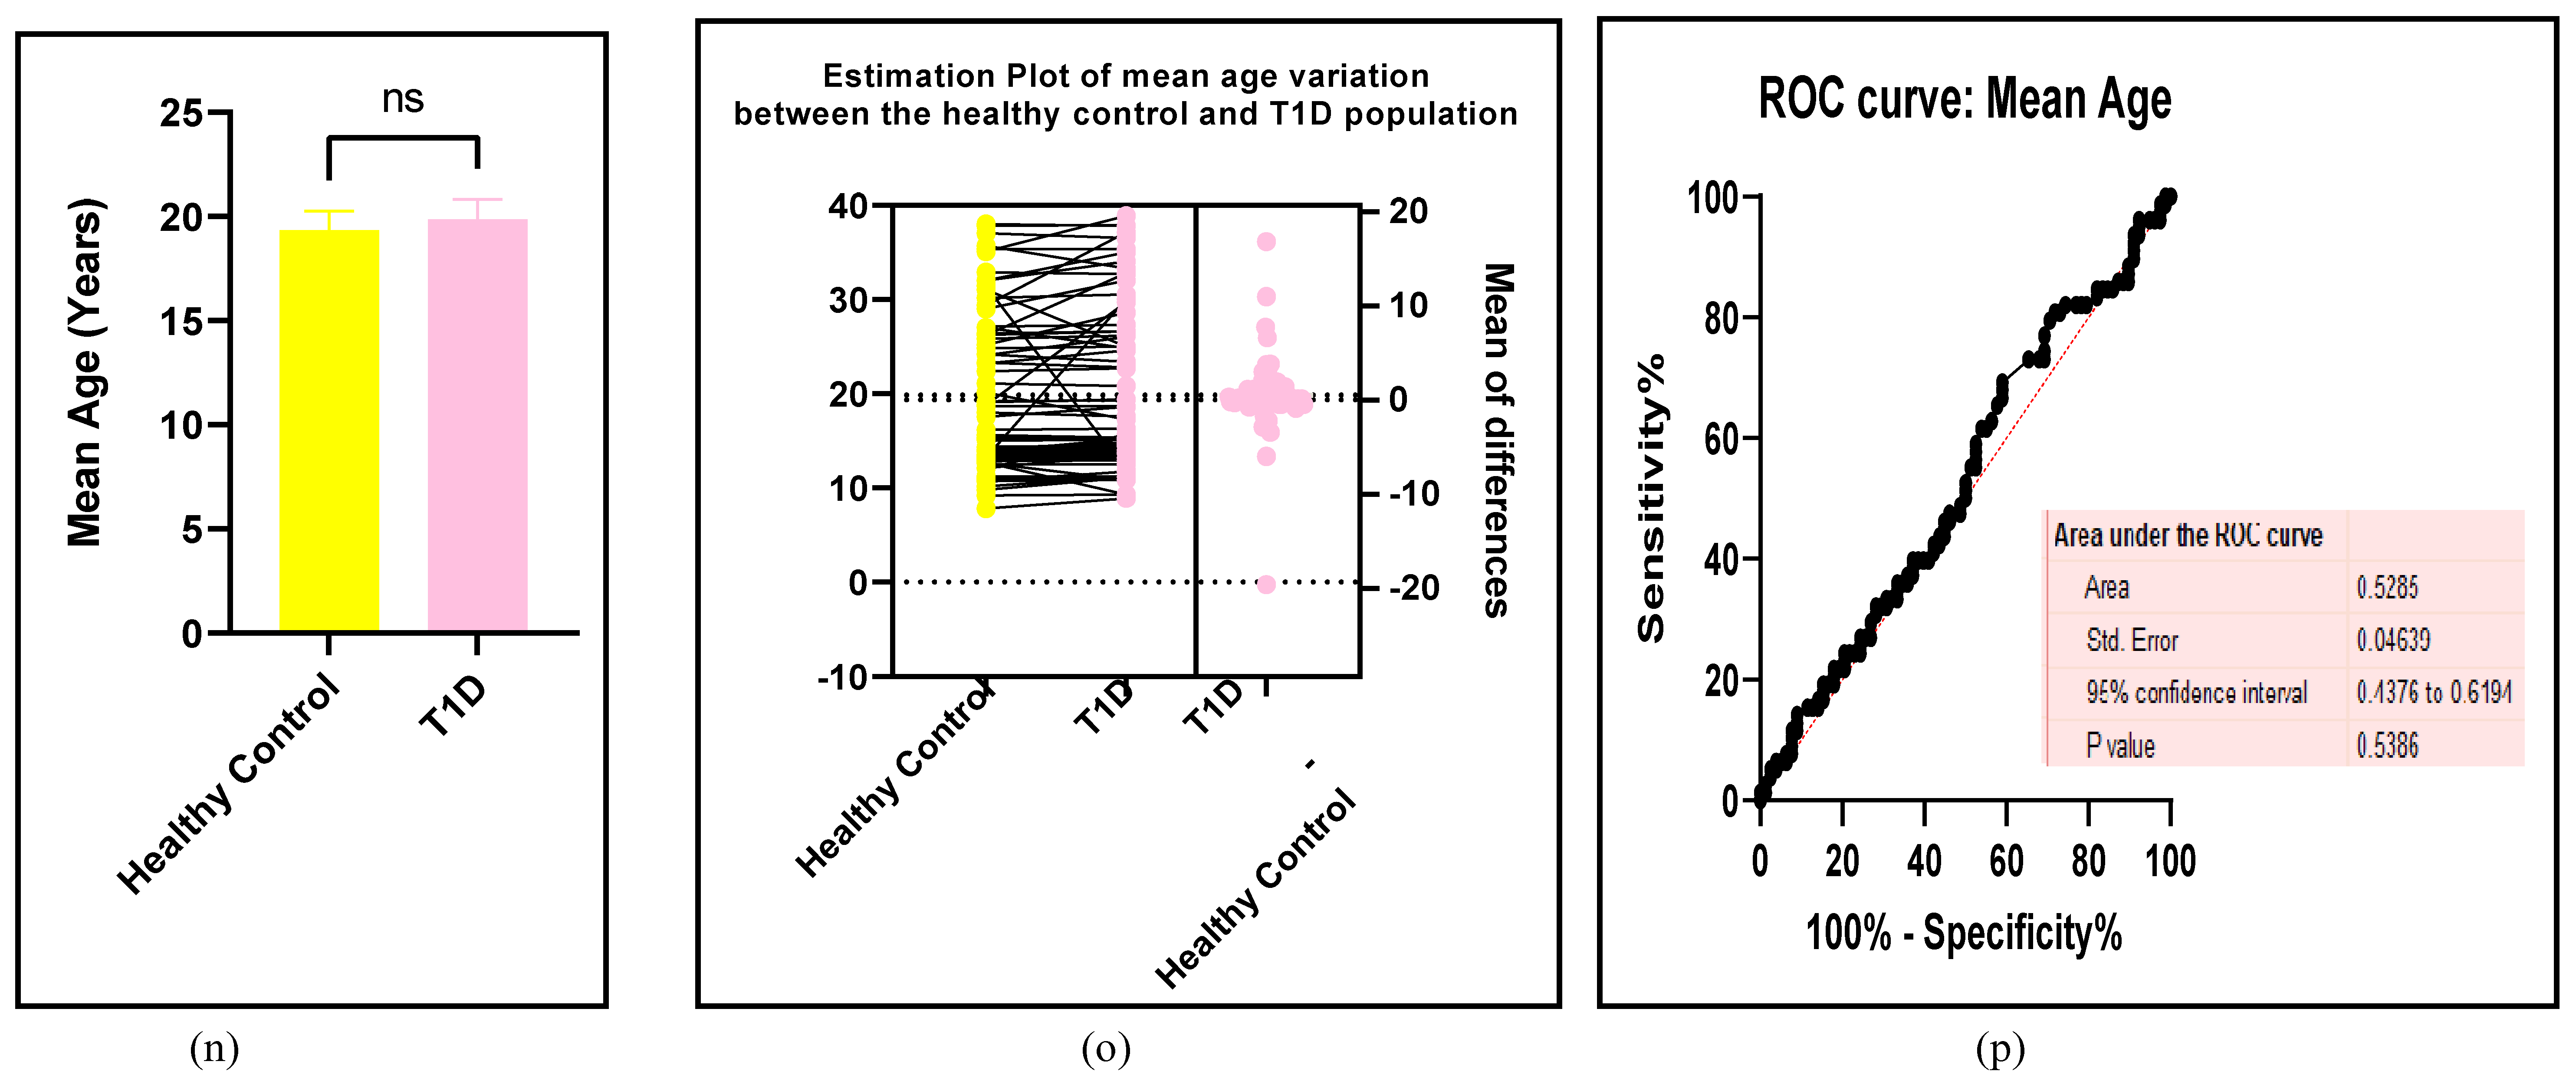
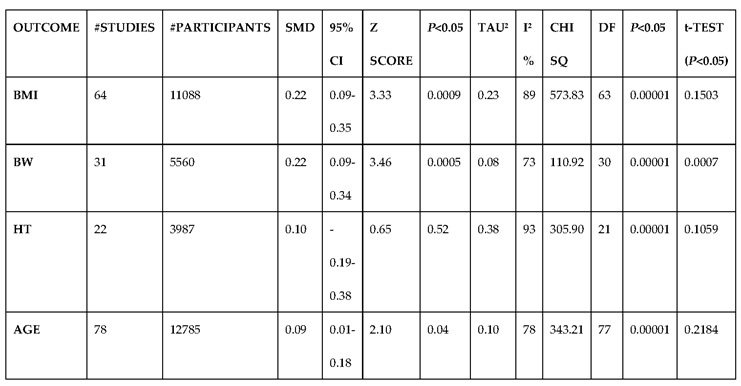
Obesity is a high-risk factor for T1D and mostly encompasses the lifestyle factors which are also modifiable risk factors that lead to ED [91]. This study has investigated the influence of the BMI, body weight (BW), height (HT), and the mean age as risk factors of T1D-induced CVD in the Figure 8 (a-l) and in the Table 7.
Figure 8. (a-l): Assessments of the obesity biomarkers between the T1D and HC groups. (a) forest plot of BMI (b) paired student-t test bar graph of BMI ( c) EP of BMI (d) ROC of BMI (e ) forest plot of BW (f) paired student-t test bar graph of BW ( g) EP of BW (h) ROC of BW (i) forest plot of HT (j) paired student-t test bar graph of HT ( k) EP of HT (l) ROC of HT (m) forest plot of Age (n) paired student-t test bar graph of Age ( o) EP of Age (p) ROC of Age. Results are statistically significant at p < 0.05.
Preprints 105488 g008aPreprints 105488 g008bPreprints 105488 g008cPreprints 105488 g008dPreprints 105488 g008ePreprints 105488 g008fPreprints 105488 g008gPreprints 105488 g008h

3.2.7. Assessment of the Risk of Bias
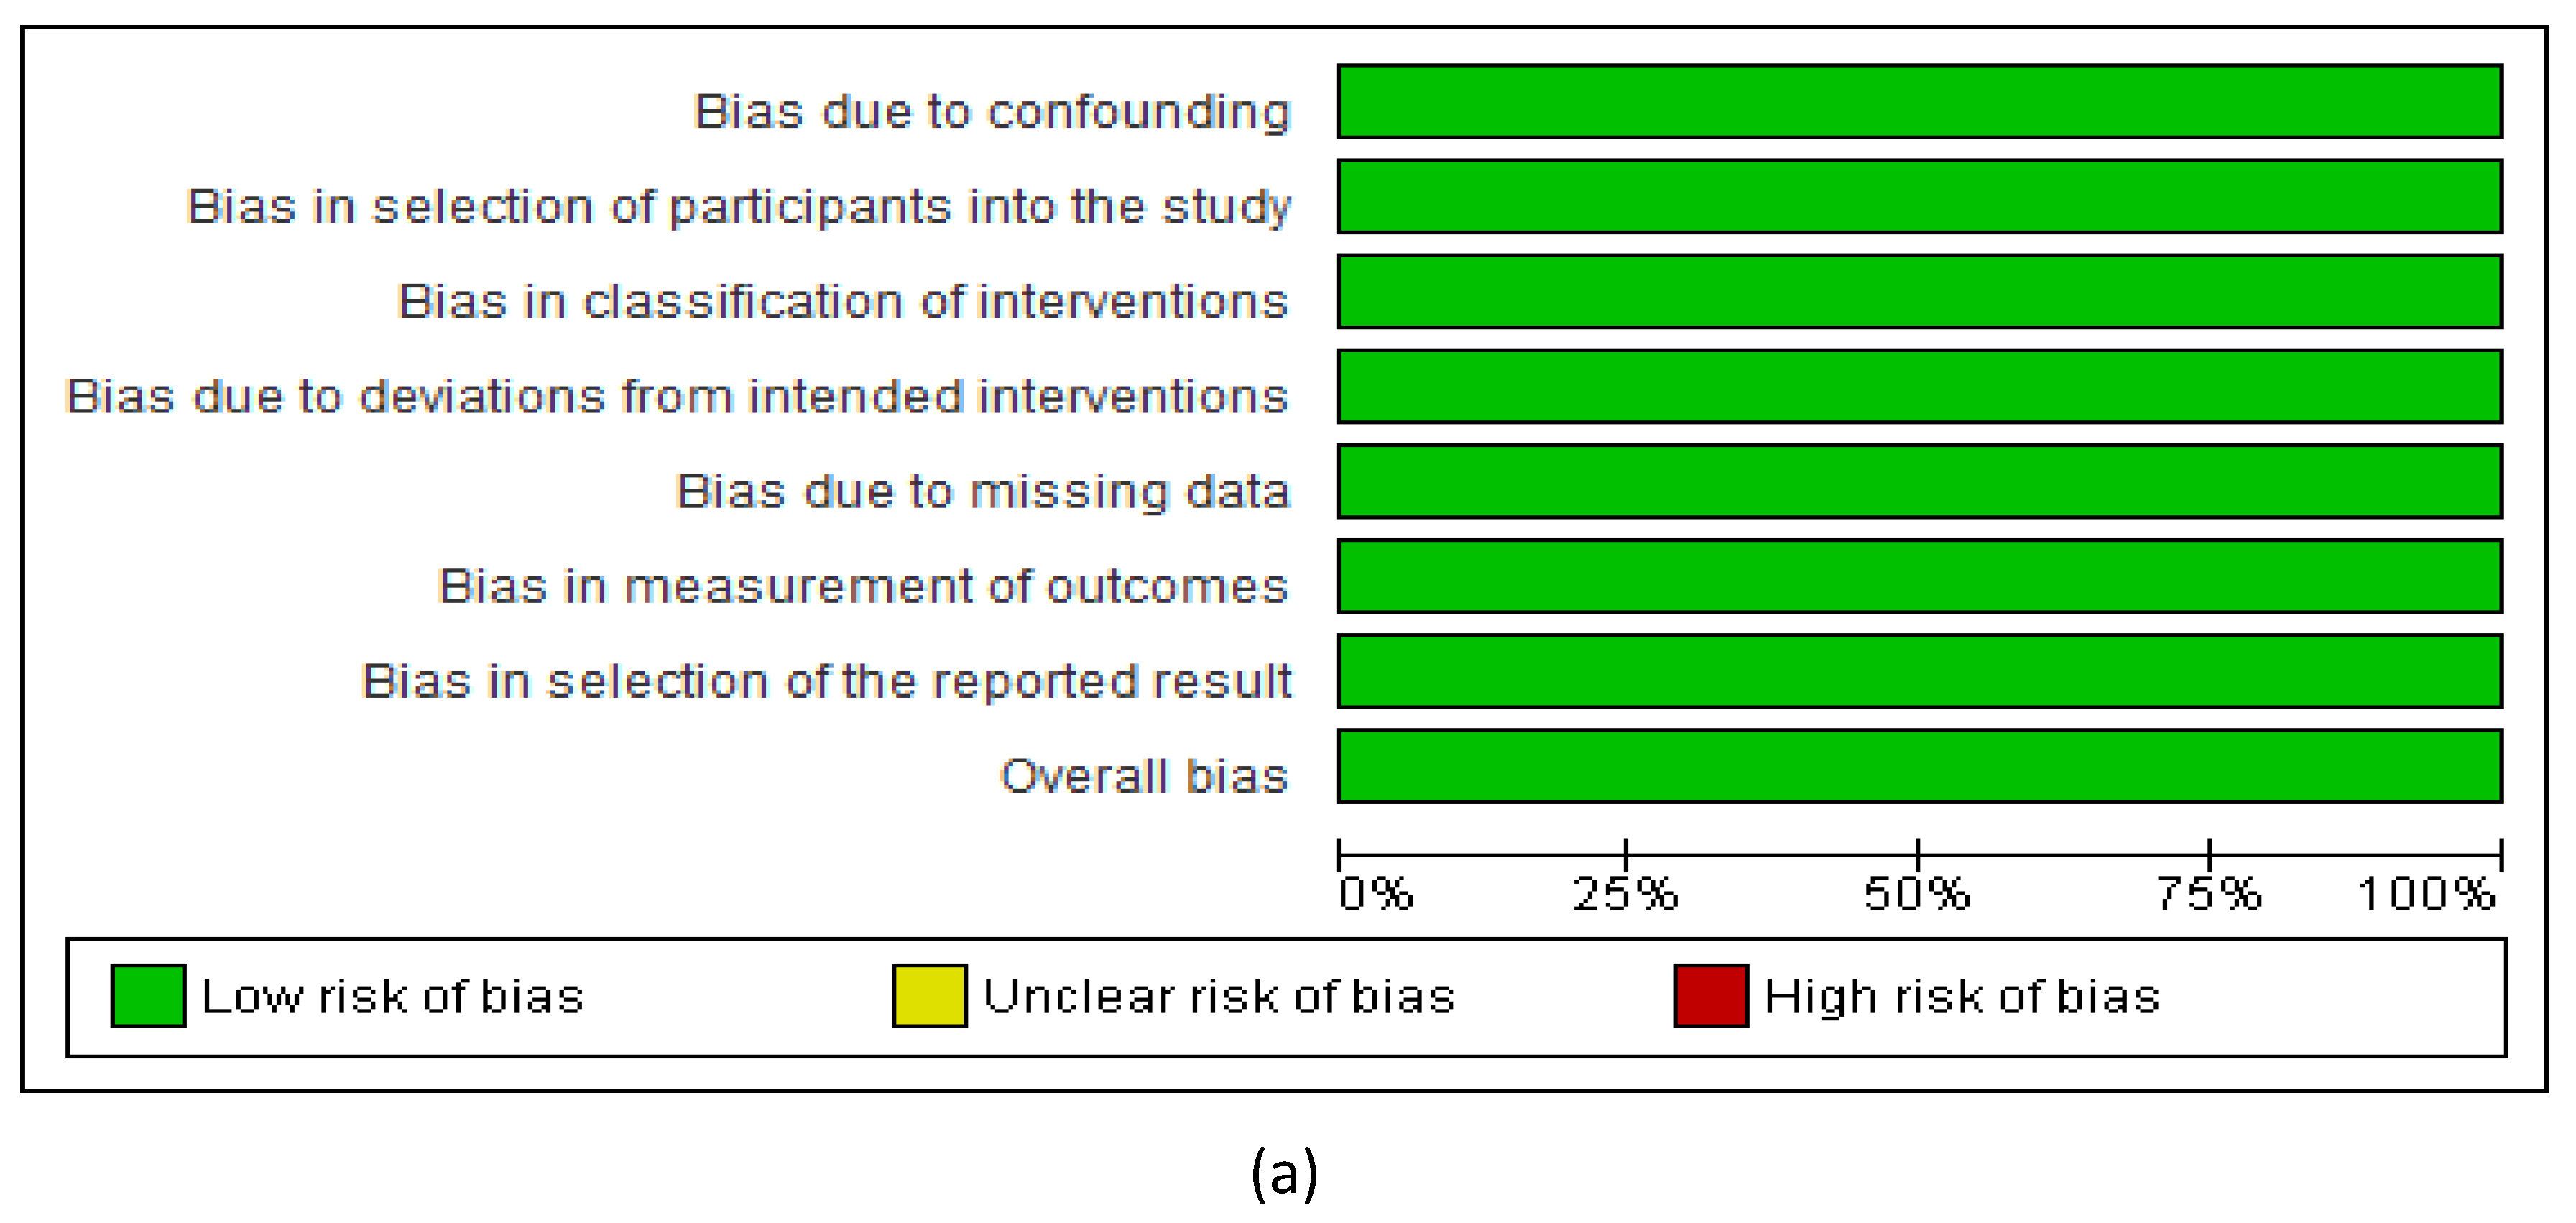
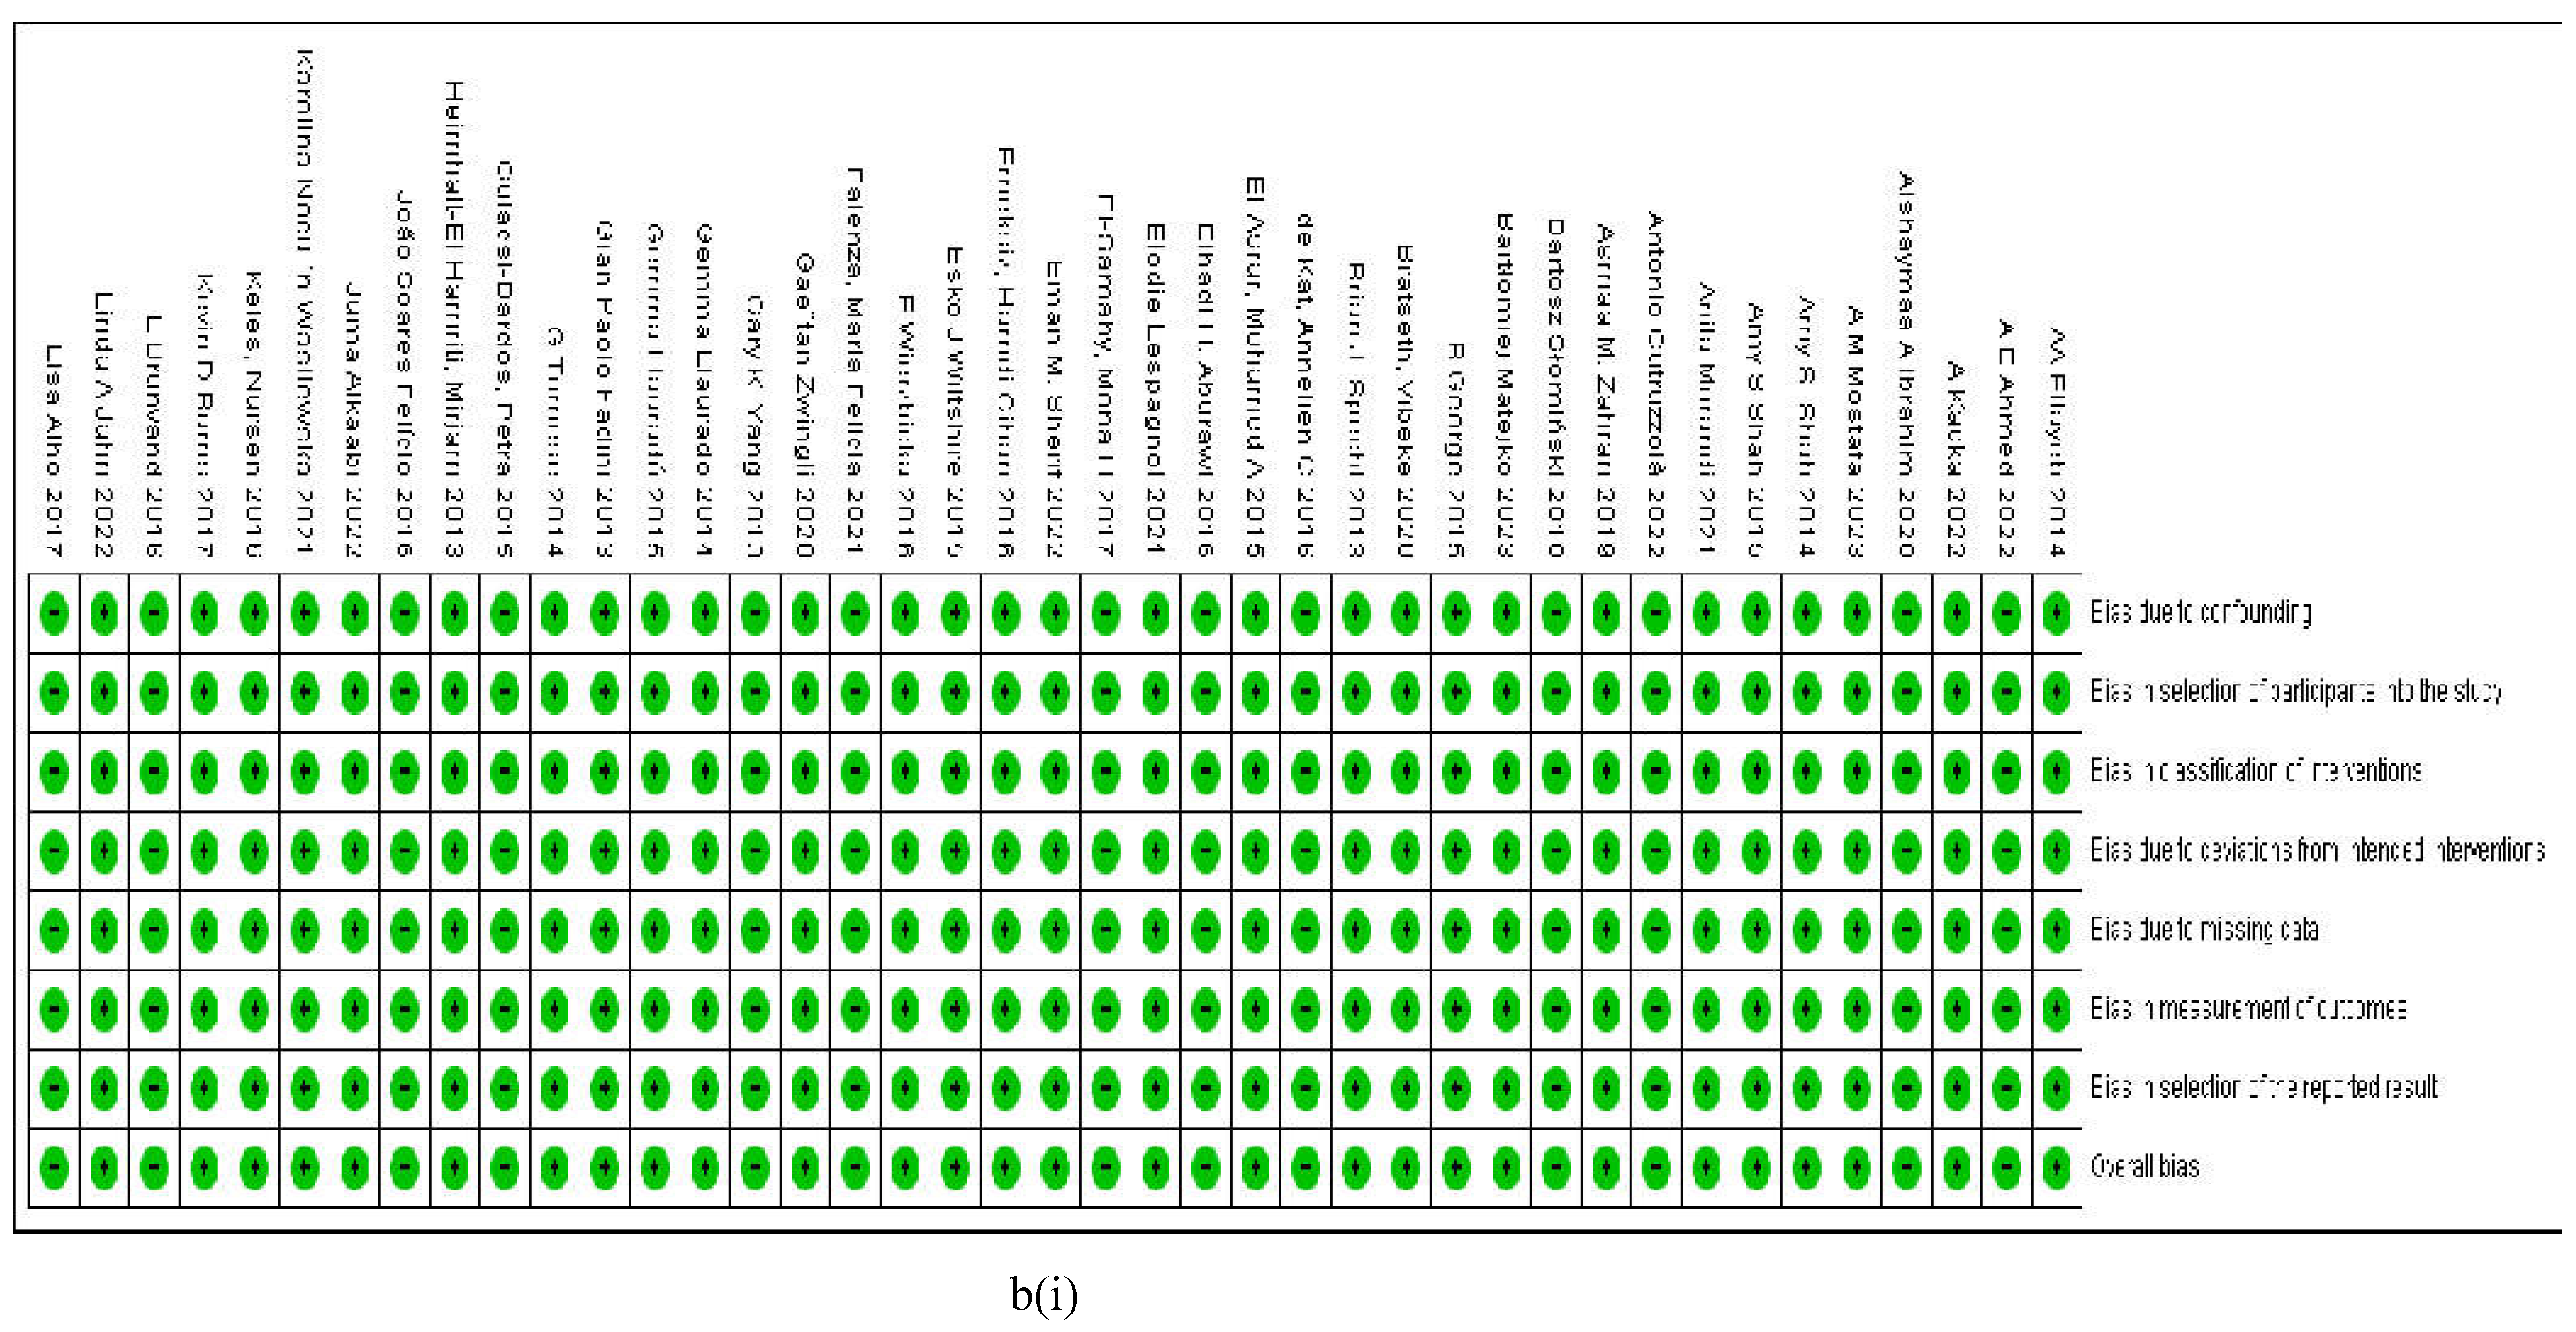
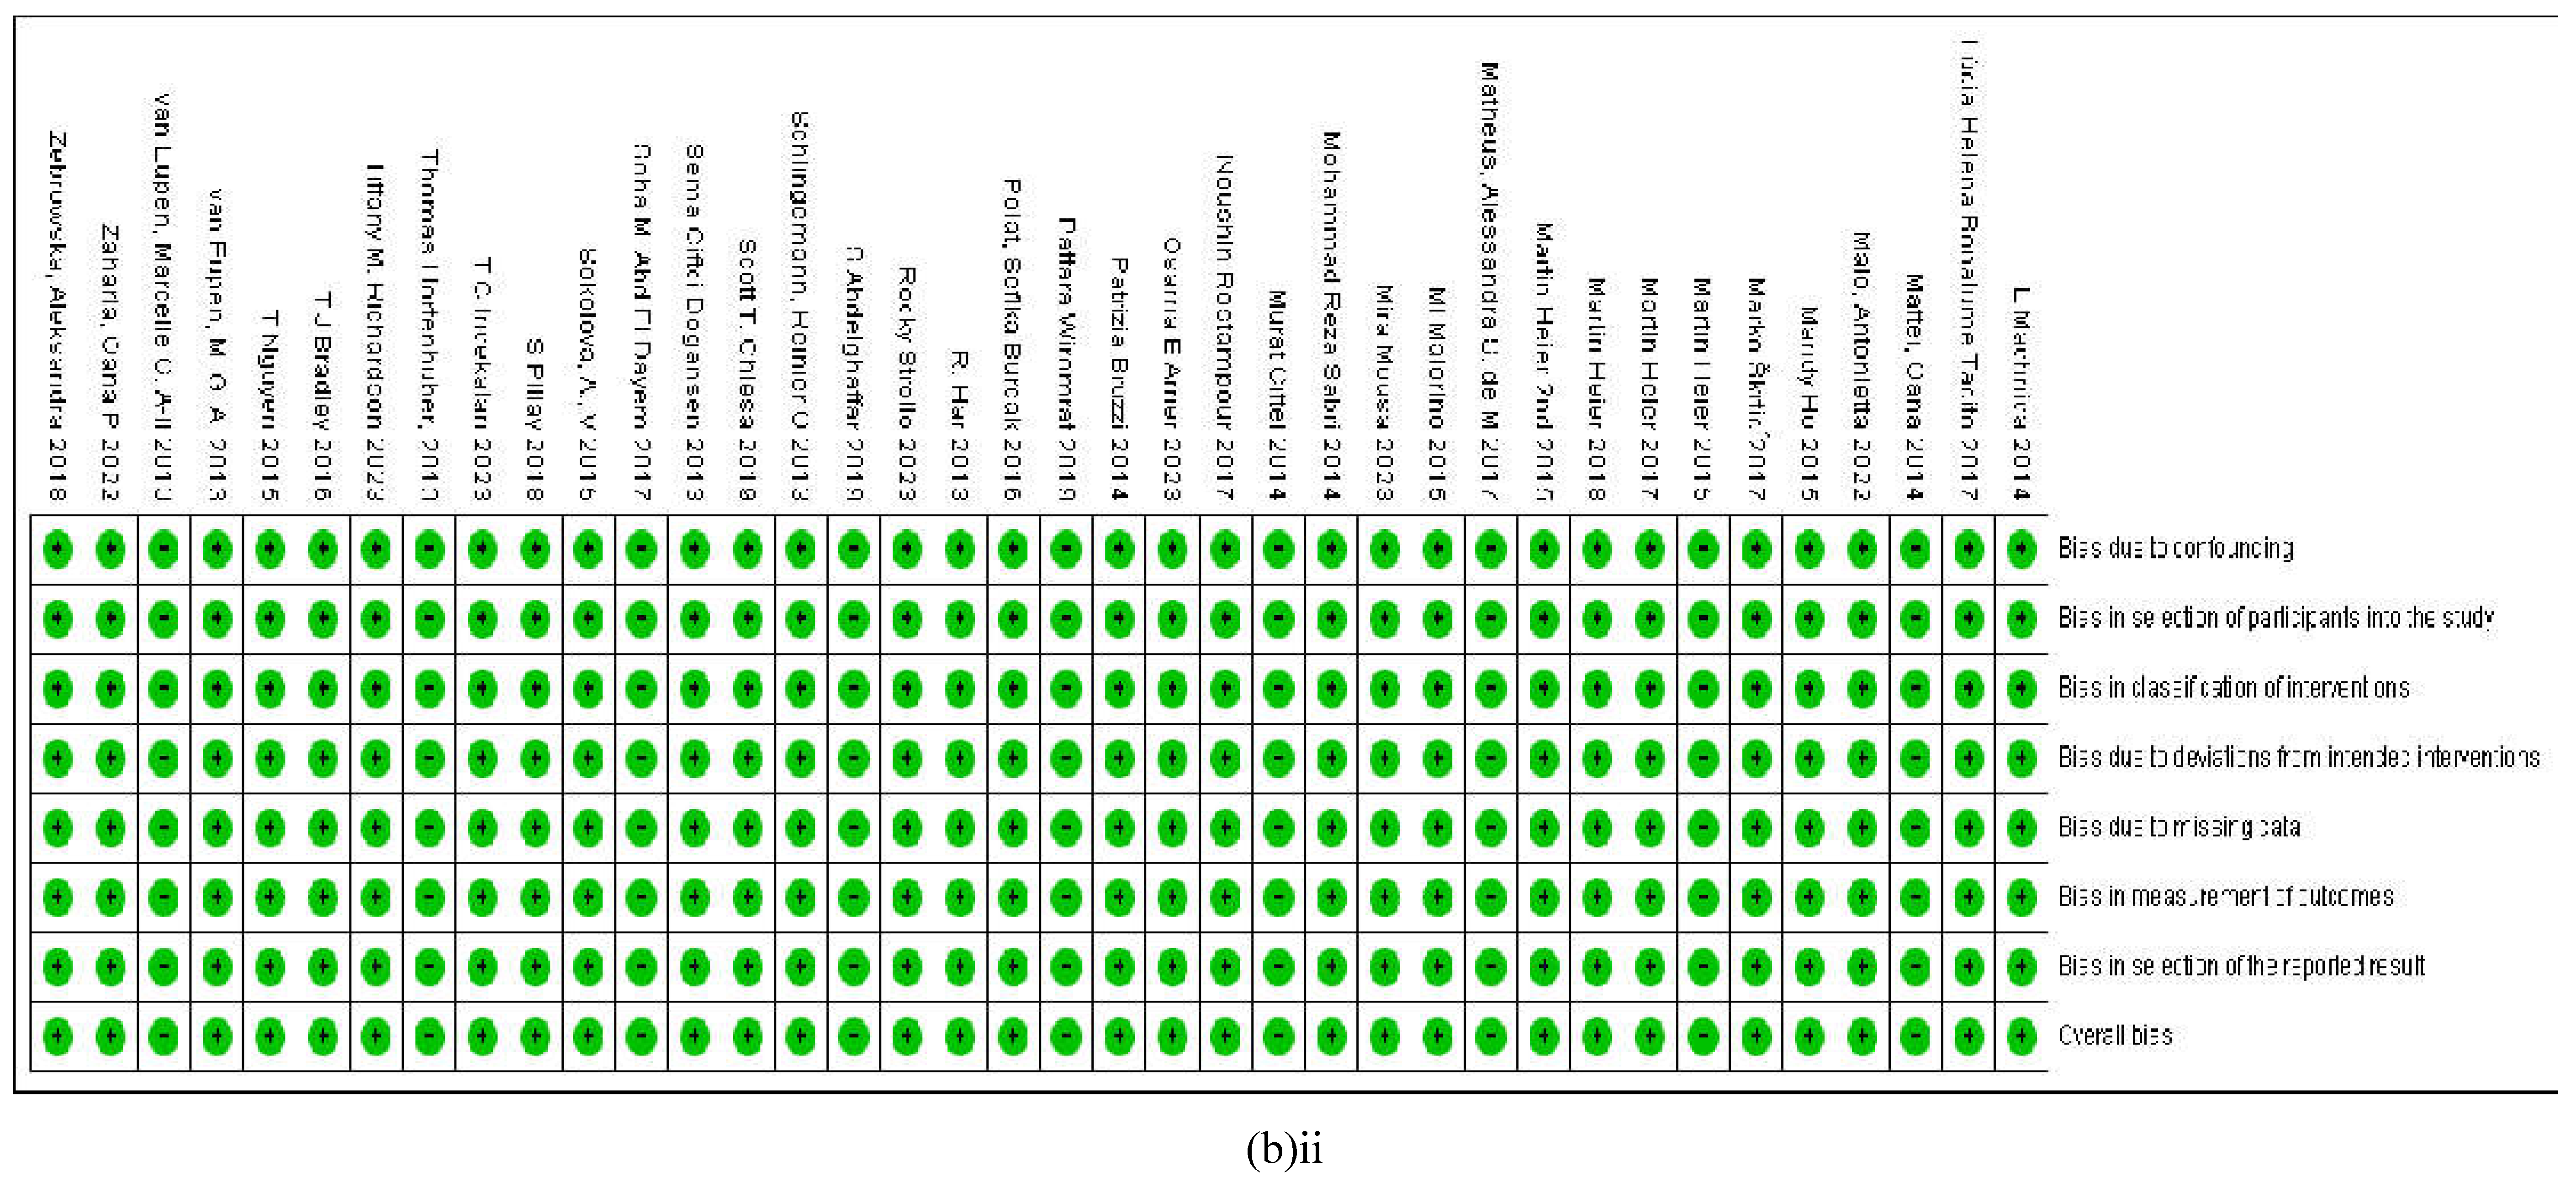
The risk of bias was evaluated using the ROBINS-I tool which stands for the Risk of Bias In Non-randomized Studies of Interventions belonging to the Cochrane methods that are available for the assessment of risk of bias in clinical studies involving human participants and their data. This tool measures the potential benefit or harm that arises from bias that occurs when the allocation of the intervention was done without randomization as opposed to those that were randomized. The ROBINS-I tool evaluates the bias arising from confounding factors, the selection of participants, the classification of and deviations from the intended intervention, the handling of missing data, measurements of the outcomes and the method of reporting results with an overall assessment of bias in each study. Interestingly, all the eligible studies that were included in this meta-analysis did not show any risk of bias that in any of the parameters that were assessed with the ROBINS-I tool. All these studies were screened for any potential items of bias which yielded no confounders, randomized selection of participants, direct identification of the interventions without deviating into unintended interventions which also had no missing data. Further, there were no grey areas regarding the measurement of the outcomes or in the reporting of the results obtained from a properly planned research study which had appropriate controls introduced at appropriate timepoints. Thus, the overall appraisal did not produce any concerns regarding any significant bias in the present study. In all the eligible studies, the risk of bias remained conspicuously low which validates the findings of our study Figures 9a-bi-ii and 10a-ab).
Figure 9. (a-bi-ii): (a) An overall assessment of the risk of bias in all the included studies. (b) Assessment of the risk of bias in the individual studies that are included in this meta-analysis made according to the ROBINS-I tool of risk of bias applicable to clinical intervention studies involving human participants.
Preprints 105488 g009aPreprints 105488 g009bPreprints 105488 g009c

4. Discussion

The recent International Diabetes Federation reports have confirmed that persons of any age category could develop T1D [11], and the exposure to prolonged T1D invariably should present with confirmed CVD. A high risk of mortality from vascular disease [24] occurs in type-1 diabetics If not properly managed by daily monitoring of the blood glucose level, insulin treatment, medication, diet, physical exercise, and minimalized psychological stress [11]. Another recent publication from the Australasian diabetes data network (ADDN) study group states that T1D patients less than 30 years of age carry a five-fold higher risk of mortality due to cardiovascular complications [105]. The findings of the present meta-analysis which we have based on a comprehensive group of multivariate biomarkers associated with diabetes-induced vascular complications are consistent with the factual data reported by many authors including the ADDN study group, EURODIAB, FINNDANE, DCCT/EDIC, SEARCH CVD, ACCORD and ADVANCE clinical trials [45,106,107,108,109]. There is a consensus that if children are diagnosed with T1D at the age of 10 years, may potentially lose 17 years of life [11]. In our study, 46% of the participants with T1D were below the mean age of 15 years and as such are highly vulnerable to CVD-related mortality. Given these facts, it is of utmost importance to establish a set of reliable and easily accessible biomarkers and methods to evaluate childhood vascular dysfunction, before putting them on life-long medication, which would otherwise add organ damage to its sequelae.
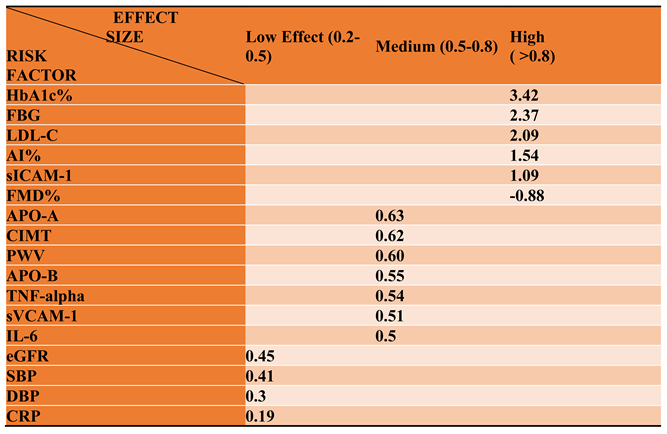
The effect size is a valuable tool in determining the impact of an intervention between the diseased group and the healthy control group. According to the Cohen’s classification, an effect size of 0.2 is considered a small difference between the control and intervention, which is a difference of 0.2 standard deviations which is a negligible difference. In other words, the effect size is the magnitude of the difference between the comparators. It is a population measure and is not affected by the sample size. An effect size of 0.2-0.5 is considered a small effect, 0.5-0.8 is a medium effect and above 0.8 is considered a high effect that signifies a large difference between the control and the intervention cohorts [110]. Therefore, in analysing the data of this study, out of the 28 biomarkers that were evaluated, the following categorisation reveals the small, medium and the large effects produced by the risk factors of vascular dysfunction in individuals diagnosed with T1D.
The hallmark of Type-1-diabetes is the patients are combinedly diagnosed with hyperglycaemia, hypertension, and hyperlipidaemia which are characteristic symptoms of the disease [111] and have been confirmed by this study. Out of the six categories of the biomarkers that were evaluated in Figures 3–8, this meta-analysis has reaffirmed that in T1D, the blood pressure, glycaemic and the cholesterol metabolism are conspicuously impaired. There were significant differences between the healthy control and the baseline T1D populations in SBP (SMD: 0.41, p< 0.0001), DBP (SMD: 0.3, P<0.0001), HbA1c% (SMD: 3.42, p<0.0001), HDL (SMD: 0.17, p<0.0001), LDL (SMD: 2.09, p<0.0001), Apo A (SMD: 0.63, p<0.0001) and Apo B (SMD: 0.55, p<0.0001) that were elevated in the T1D, as evidenced by the standardized mean difference in the forest plots. In the student-t-distribution bar graphs, only SBP (p< 0.0001), MAP (p< 0.0245), HbA1c% (p<0.0001) and LDL (p< 0.0064) produced significant upregulation in their values.
However, when the risk factors identified in this study are arranged from having high to low CVD risk based on the effect size, the 6 most reliable biomarkers are HbA1c% (3.42), FBG (2.37), LDL-C (2.09), AI% (1.54), sICAM-1 (1.09), and FMD% (-0.88) which is a deviation from the already established traditional risk factor milieu. The risk factors evaluated in this study appear to have evolved from mainly lifestyle factors that are linked to modifiable eating habits and beverage intake, physical exercise, and medication, which along with socioeconomic conditions, had contributed to this change.
Prolonged hypertension is a predictor of CVD. In the present study, the augmentation index percentage (AI%) is the third most reliable biomarker of T1D-induced CVD, also known as AI75, which is based on the arterial pressure measured at 75 beats per minute [112]. Irrespective of the number of studies that measured AI% in this analysis was very few with a total participant number of 620, the overall result was that it creates a remarkable difference between the control and T1D groups. Therefore, arterial pressure features as a better prognostic marker than the traditional markers of BP that comprise of SBP and DBP.
The blood pressure readings are considered to be hypertensive when it is greater than the 95th percentile for T1D individuals less than 18 years of age, and the ideal SBP and DBP should fall below its 95th percentile [105]. In this study, the 95th percentile of SBP/DBP for the healthy control was 119/72 and for the T1D subjects it was 120/74 Hg mm respectively. In this cohort, the SBP was higher by 10.8% in the control group and 21.7% in the T1D group. The DBP was higher by 18% in the control group and 13.6% in the T1D group. The children and young adults usually carry an excess risk of premature mortality from vascular complications specially if they are co-morbid with hypertension [113]. The CVD risk in T1D is further increased if uncontrolled hypertension had persisted for a longer duration with the additional risk of developing cardiac failure, limb amputation, stroke, and sudden death [114]. Published reports have highlighted that 16% of young adults having T1D also have hypertension and up to 50% of the T1D youth develop hypertension worldwide [115]. Studies have confirmed that a high glycated haemoglobin percentage positively correlates with hypertension and its risk factors are hyperglycaemia, male gender, higher BMI and the frequency and dosage of insulin treatment [116].
Diabetes is an independent risk factor for childhood-onset CVD [117]. Elevated blood pressure is common in the T1D and the healthy control population is also vulnerable to having increased SBP, influenced by epigenetic factors [118]. SBP is also influenced by high pulse pressure which brings forth arterial stiffness [119]. Arterial stiffness is a common occurrence among the T1D population and an early predictor of subclinical atherosclerosis [120]. It is a surrogate marker of hyperglycaemia and ensuing vascular complications [121]. Arterial stiffness sets in long before the signs of CVD emerge. The central arterial pressure wave consists of a forward-travelling wave generated by the contraction of the left ventricle and a reflected wave that arrives combinedly from the arteries in the periphery [122]. With arterial stiffness the reflected wave from the periphery arrives too early during the systolic phase, thereby increasing the aortic pulse pressure, the left ventricular afterload, left ventricular mass, stroke volume and the oxygen demand [123]. These events subsequently initiates atherosclerosis and left-ventricular hypertrophy. The carotid-femoral pulse wave velocity and the AI% are considered as the gold-standard to measure arterial stiffness [124].
Intensive insulin treatment has shown to regulate the SBP, although a HbA1c greater than 7.5% is a strong risk factor for the plaque build-up in arteries despite being asymptomatic to coronary artery disease [125]. Although there is no elevation in blood pressure in some of the T1D children, they show high increases in SBP during the night, who are without the usual nocturnal dip in blood pressure as seen in the healthy subjects [126]. The loss of the nocturnal dip of SBP is considered a predictor of CIMT in children [127]. These patients are considered at a higher risk for vascular dysfunction and hence are exposed to early-onset CVD. Hypertension may lead to diabetic nephropathy with an increased thickness of the basement membrane and a declining estimated glomerular filtration rate [128]. However, the methods of determining hypertension may be outdated in many previous studies with the ambulatory BP measurements not reflecting the true status. An ultrasound -guided echocardiogram would add more weight to its readings which require the establishment of a fool-proof method that is reliable for all the ages of T1D. The FinnDiane laboratories in Helsinki have introduced de novo methodology to assess vascular health, leaving aside the obsolete instruments such as the sphygmomanometer [129]. They include applanation tonometry to measure arterial stiffness, peripheral tonometry to assess endothelial deregulation and the ultrasound to evaluate CIMT [130,131]. The finger-pressure waves are measured by a plethysmograph to assess the autonomic functions [132].
There are some noteworthy facts that have emerged from this study, being consistent with previous findings on the influence of T1D on vascular disease and subsequent exposure to early onset of CVD. The flow-mediated dilatation percentage (FMD%), which is a direct method of determining vascular dysfunction is significantly decreased (SMD: -0.88) in the T1D compared to the healthy control group [74], and the pulse-wave velocity (PWV; SMD: 0.6) in the brachial or femoral artery and the carotid intima media thickness (CIMT; SMD: 0.62) significantly elevated in the T1D cohort [133]. These findings are supported by both the forest plots and the paired student t-test bar graphs. Therefore, the low FMD% [108] high PWV [108] and the CIMT [134] markers indicate that the T1D population with a mean age of 20 years is highly vulnerable to developing vascular disease as well as CVD quite early-on.
There is a large body of evidence gathered from a plethora of clinical studies which confirm that the T1D subjects invariably develop vascular defects from having hypertension, hyperglycaemia, and dyslipidaemia either alone or in combination and are at high risk of developing much-debilitating CVD or ED.
The mean HbA1c% in this study was 5.07 + 0.34 in the control group and 8.56 + 1.08 in the T1D group. There was a 68% increase in the mean value of HbA1c% in the T1D compared to the healthy control. The 95th percentile for the HbA1c % in this T1D study was 10.2 and 53.5% of the readings were above the mean value that was computed, indicating that rigorous glycaemic control is needed for this T1D population. These results are consistent with the readings published in previous literature and correlates positively with the vascular parameters such as CIMT, sICAM-1, AI% and FMD% (Figure 6) with which it can be concluded that these vascular functionality measures are not dependent on the age, BP and other traditional biomarkers of CVD, but are extremely dependent on the level of hyperglycaemia in the T1D.
Intensive insulin therapy is not without its advantages. When a rigorous treatment regimen is followed at the beginning, there seem to be retention of metabolic memory in the T1D subjects [108] . A previous study that exerted intensive glycaemic control at the onset of T1D, had their CVD risk reduced by 57% even after 17 years of disease duration [134] . Insulin therapy and the regulation of the glucose titres in plasma identified by a declining HbA1c% has reconfirmed that glycaemic control is extremely important to children and the youth with T1D. Early optimal plasma glucose control was shown to be highly effective in regulating the risk of CVD evidenced by the diabetes control and complications trial (DCCT) which had the longest duration of longitudinal evaluation of the traditional CVD risk factors spanning 30 years [135]. Prolonged and mismanaged hyperglycaemia takes a heavy toll on the vasculature, one of the best examples being the increasing CIMT [136]. Secondarily, it causes arterial stiffness which will steadily progress towards atherosclerosis and other CVD complications. A child diagnosed with T1D during the first year from birth will invariably have developed CVD by 20 years and will be highly prone to death by 55 years of age [137].
The mean LDL-c value in this study was 2.5+0.28 mmol/L (100.24 + 15 mg/dL) in the T1D group and 2.45+0.3 mmol/L (90.42 + 19.88 mg/dL) in the control group. The 95th percentile for the LDL-c was 2.7 mmol/L (104 mg/dL) in the present analysis. Up to 47% (in the mmol/L subgroup; n=3782) and 42.8% (in mg/dL subgroup; n=2298) of the total readings were above the respective mean values. There are published studies which have yielded similar results as this present study [137]. In our lipid profile, the total cholesterol (TC; SMD: 0.02), and total triglycerides (TG; SMD: 0.12), HDL-c (SMD: 0.17, p<0.01) and LDL-c (SMD: 2.09, p<0.0006) markers of dyslipidaemia showed only a very small upregulation in the T1D group. There are clinical studies that have reported strong positive correlation between high HbA1c% and LDL- cholesterol level [138], which has significant associations with plaque-build-up and obliterating the vasculature causing blockages that induce cerebrovascular infarcts or stroke, which is somewhat controversial given the results of this study. Apo A (SMD: 0.63, p < 0.001) and Apo B (SMD: 0.55, p < 0.00001) have shown significant elevations in the T1D subjects in the forest plots in comparison to the healthy control participants. Out of the lipid markers that were evaluated, LDL cholesterol and Apo B are classified as atherogenic lipids that favour CVD [139] which is disproven for LDL-c by this study which produced non-significant results in the student-t -test bar graphs as well. The ratio of Apo B/Apo A-1 (has been suggested as a better biomarker of CVD prognosis, in the recent decades [140]. However, Mazanderani et al (2009) have reported that Apo B is a better biomarker than LDL-c in diagnosing T1D and the decision to initiate lipid-lowering therapy in T1D patients should not be based upon the LDL-c levels alone because T1D is aggravated by poor glycaemic control and not from dyslipidaemia per se [141]. These lipids are also risk factors of obesity that is prevalent among the children, owing to their excessive consumption of fatty and oily junk food [142]. The notion that a higher BMI (SMD: 0.17, p < 0.003) and increased body weight (SMD: 0.22, p < 0.0005) and having a higher level of fasting lipids in sera, particularly LDL titres greater than 3.4 mmol/L or 130-159 mg/dL are strong contenders for CVD [143], is disputed by the effect sizes of BMI and the BW of the present study. The Apo B molecule comprises of atherogenic lipids: LDL and very low-density lipoproteins (VLDL) cholesterol which is frequently high in T1D patients and contributes to the development of arterial stiffness [144]. Although LDL is a surrogate marker for vascular disease, and an independent risk factor for CIMT [136], LDL-c (SMD: 2.09) has a very small effect on developing CVD.
Inflammation is another common characteristic in the T1D population and is linked to autoimmunity which induces the pancreatic beta cell destruction through immune mediation [145]. High glucose variability was shown to increase the inflammatory biomarker, C-reactive protein (CRP; SMD: 0.33 ) which in this analysis has displayed a small increase in the T1D cohort, compared to the healthy control [146]. The cytokines are prominent immunomodulatory substances which promote inflammation and the sensitisation of the distinctive T helper cell repertoires, macrophages and dendritic cells that leads to the destruction of the islets of Langerhans, in T1D [147]. Studies have shown that the blockage of the pro-inflammatory cytokines results in a decrease in autoimmunity directed at the pancreas which limits its insulin production and secretion [148]. This study has shown a small risk with CRP titres in blood in the T1D cohort compared to its healthy control (SMD: 0.19, p < 0.002) alongside significantly elevated IL-6 (SMD: 0.5, p < 0.0001) and TNF-alpha (SMD: 0.54, p < 0.0008) titres in the T1D evidenced by the forest plots. These are potential immunotherapeutic targets in the treatment of T1D which hold promise for future pharmacotherapy. The slight elevation in the CRP titres was also confirmed by the t-test bar graph (p < 0.0053). The ALT and GGT are biochemical markers of liver function and hepatic insulin sensitivity and resistance [149]. In this study, the ALT (SMD: 0.19) and GGT (SMD: -0.11) levels in TID were not significantly different from the healthy control possibly owing to the fewer number of studies. However, ALT is a biomarker for the liver fat, being an epidemiologic marker for the non-alcoholic fatty liver syndrome, while GGT is a biomarker of cellular oxidative stress [150]. The pancreatic beta cells are highly sensitive to oxidative stress which results in decreased secretion of insulin [151].
The body-mass index (BMI) and the body weight (BW) are already known risk factors of CVD in T1D which increase proportionately with rising hyperglycaemic status [152]. Intense insulin treatment causes weight gain [153] and hence an increase in these two parameters. It also depends on the type, dose and frequency of the insulin intake given the fact that insulin is a growth hormone [154]. These rapid increases in body weight and the BMI could be controlled by regular physical exercise, diet, and other behavioural practices . In this study, there were negligible differences in the BMI between the control and T1D groups (SMD: 0.17, p=0.003) although the T1D cohort displayed a significant BW gain (SMD: 0.22, p=0.0005) in comparison to the healthy control. The excess glucose is converted to fat and stored in the muscles and the adipose tissue but in T1D in which the glucose metabolism is impaired, these individuals could experience hypoglycaemic attacks as well during binge-eating episodes [155]. The BMI and body weight parameters were not identified as potential biomarkers for T1D in the present study as it indicated a negligible risk of CVD although the forest plots and the paired t-test results indicated a significant difference between the HC and T1D groups.
The elevation of the soluble intracellular adhesion molecule (sICAM-1) titres is a common occurrence in T1D [156] . The sICAM is well-known for its role in mediating inflammatory and immune-modulatory responses, particularly in downregulating the TH1 type immune responses that are responsible for the autoimmune destruction of the beta cells in the pancreatic islets [157]. Its immune-protective functions include leucocyte recruitment and adhesion, triggering signal transduction in the islet cells and regulating the endothelial and epithelial barrier functions [158]. The forest plot of sICAM indicated a clear mandate for a high CVD risk with an effect size or SMD of 1.09 (p< 0.0001) and additional confirmation from the student’s t-test which reported a significant difference between the healthy control and the T1D population (p= 0.02). Similarly, soluble vascular cell adhesion molecule (sVCAM-1; SMD 0.51) is a strong biomarker of endothelial dysfunction and hence a high-risk factor for CVD in both young and the old that are diagnosed with T1D [159]. Both types of CAM are surrogate markers that display an increase in pulse pressure and hypertension, leading to progressive arterial stiffness [159]. In this study, the sVCAM-1 showed a remarkably significant elevation in the T1D population compared to the healthy control by 20% evidenced by both the forest plot (SMD: 0.74; p < 0.00001) and the paired student t-test (p < 0.0001).
Diabetic nephropathy and renal microangiopathy are classical symptoms of progressive deterioration of the kidney functions, which is a grave consequence of T1D [160]. The estimated glomerular filtration rate is a reliable parameter of renal disease accompanied by increased serum albuminuria, which is also a biomarker of vascular dysfunction [161]. An eGFR below 60 mL/min/1.73 m2 signifies impaired kidneys [162]. This study has identified the eGFR as a low-risk factor of CVD, although it was not confirmed by the paired t-distribution that showed no significant difference between the healthy control and the T1D. The mean eGFR value in this study was 122 mL/min/1.73 m2 which did not indicate impairment of renal functions probably because the mean age of the T1D cohort was less than 40 years.
Interestingly, in this study, the risk of bias which was evaluated using the ROBINS-I tool displayed an overall low estimate. The eligible studies that were included, apparently were meticulously planned, and carried out (Figures 9 and 10). The publication bias was assessed by funnel plots that are included in Figure 10. In most of the included studies, the authors measured the traditional risk factors of T1D, but not many studies reported the markers of vascular function or the inflammatory biomarkers. For this reason, the number of studies that were more were the ones of BP, glycaemic, lipidemic and obesity targets which are apparent from the respective funnel plots. However, in the other funnel plots, even though the number of studies are very few, the participant number mostly exceeded 100.
The data published by the Australasian Diabetes Data Network (ADDN) study in its 2023 publication states that most adolescents and young adults are diagnosed with hypertension, and it imposes an additive effect on the other modifiable risk factors of diabetes such as hyperglycaemia and BMI. They recommended careful revision of the existing healthcare models to reflect the true nature of diabetes-induced vascular dysfunction in order to establish an effective treatment strategy for the younger population, also stating that the diagnosis of elevated BP is often masked, and white-coat hypertension could become misleading. However, our findings do not flag hypertension as a high- risk factor of CVD which may be due to effective management of the disease with effective pharmacotherapies although the outcome of the ADDN study cannot be ignored due to the very large sample size [105]. The data published by the SEARCH CVD study, conducted a decade ago, measured arterial stiffness with PWV that increased proportionately to the duration of diabetes in the youth. The PWV in the present study was identified as a medium risk factor of vascular remodelling, which could still be counted as a reliable measure of arterial stiffness in the youth diagnosed with T1D [106]. A large observational cohort study that utilized data from the Swedish National Diabetes Registry on limb amputation in the T1D patients had hyperglycaemia and impaired renal functions as its strongest contenders, but not LDL-c or BMI which even in the present study displayed a low or negligible effect on T1D-associated CVD. Our findings have strong implications in improving the quality of life and health economics related to vascular disease in T1D patients that introduces a trend shift from the traditional risk factors as better markers of disease prognosis.
This study has several limitations, such as some risk factors were reported by a few studies. Contrastingly, the traditional risk factors were reported by almost all the included studies. This disparity will be reflected in the final outcome resulting in high and/or low standard deviations or standard error of the mean that impacts the effect size. Another limitation is that the study populations are distributed worldwide, belonging to different ethnicities, which hugely impacts the final outcome, given their differences in genetic, lifestyle and environmental factors. T1D is highly influenced by the socioeconomic conditions, educational and financial status, which varies widely among the participant populations. Thus it is difficult to maintain consistency in sampling sizes, sampling methods and data analysis methods. However, these drawbacks are compensated for by the large numbers of participants included per study. There are limitations also in the review process such as in retrieving full-text articles of eligible research studies from electronic databases. In some instances the authors do not respond to our requests for full-text reports or data that are missing such as the standard deviation.
The goal of this meta-analysis was to underpin the most reliable of the biomarkers of early vascular remodelling in a T1D population of children and youth below the age of 40 years because T1D features as a high-risk factor for paediatric CVD-related mortality. Our results agree with certain previous publications to date, but the primary outcome of this study has taken a new direction, with most of the risk factors that displayed a medium to large effect size being effective biomarkers of robust vascular function. Hence the clinicians and the diagnostic laboratories could further evaluate these biomarkers that we have presented in our analysis in future analytical research.

5. Conclusion

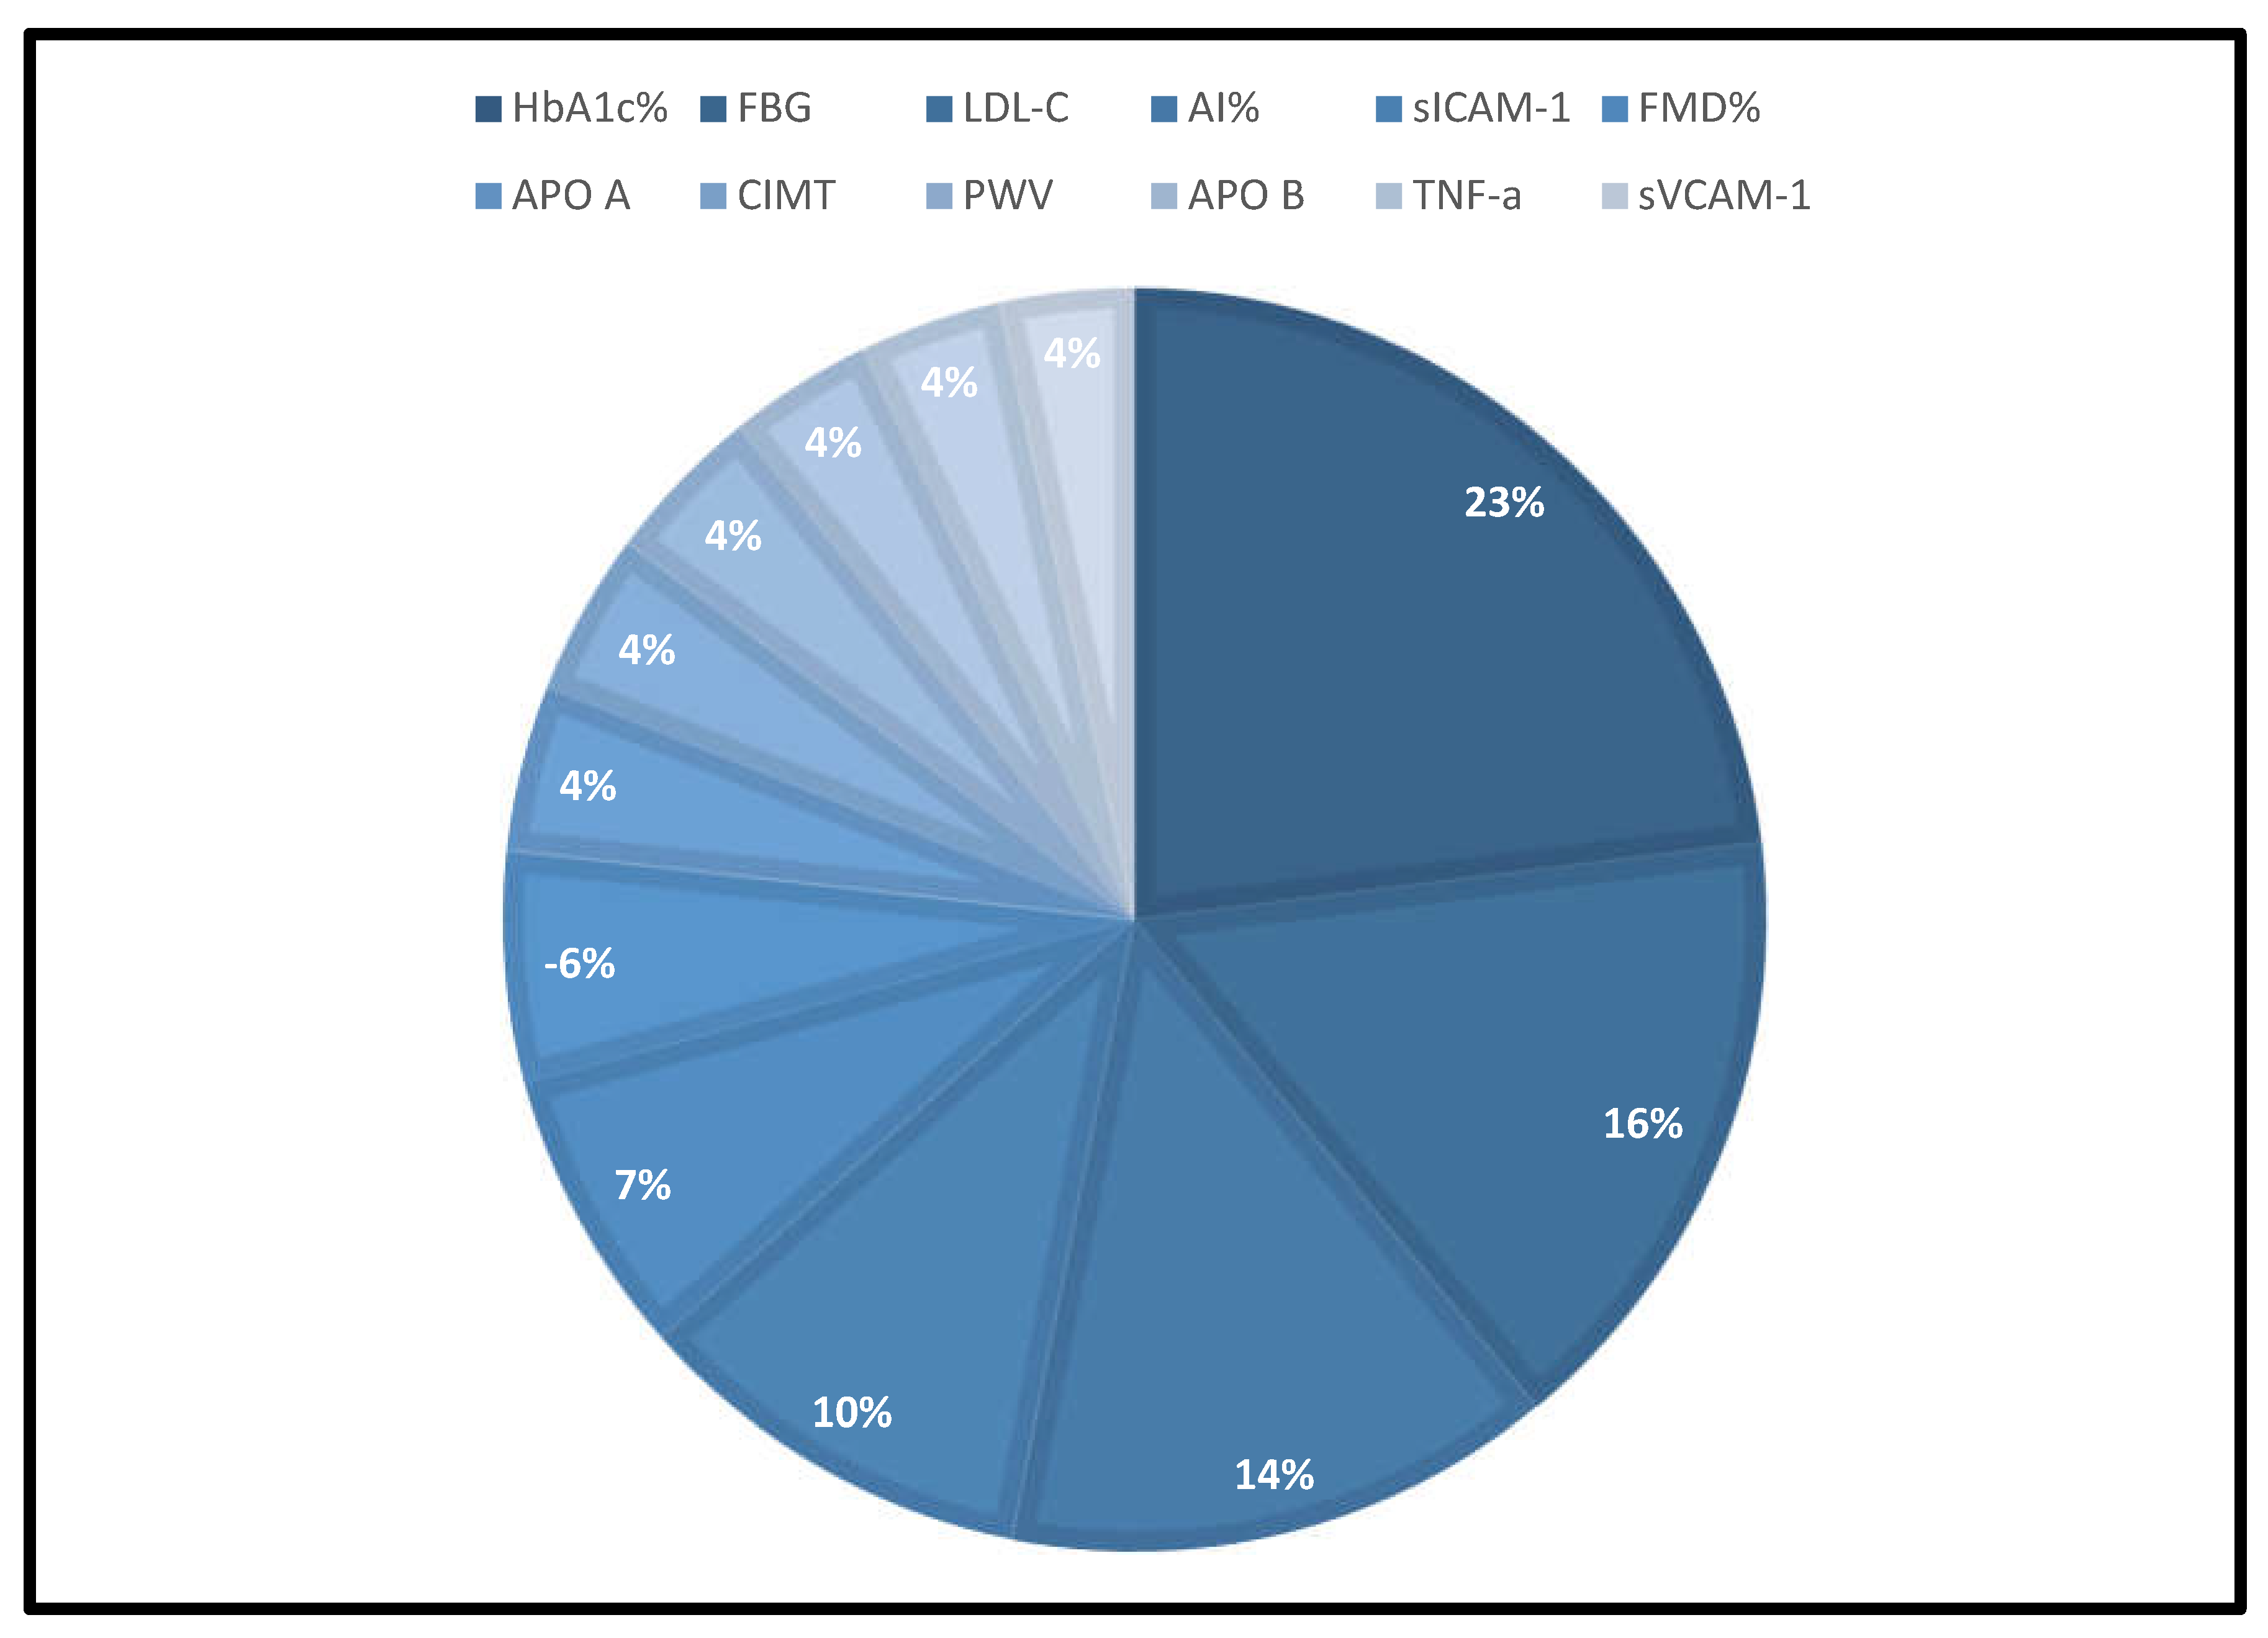
A total of 12 CVD-predisposed biomarkers have been statistically validated in a meta-analysis as the most effective for early vascular dysfunction screening in T1D. These biomarkers were selected from an assessment of 28 risk factors that were divided into 6 categories. The evaluation criteria can be found in Table 8 and are presented in a pie-chart (Figure 11), which ranks the criteria from most effective to least dependable based on the SMD or the effect size of each risk factor, in a forest plot. The findings of this meta-analysis indicate that HbA1c% is the most effective biomarker, followed by FBG, LDL-C, AI%, sICAM-1 and FMD%, which the clinicians could evaluate using a simple blood tests or non-invasive techniques. Based on these clinical data, personalized treatment strategies, including novel medications, islet transplants, gene therapy, mRNA and antibody therapy could be implemented because early diagnosis would lead to a better prognosis of these two cohabitant diseases that will reduce the risk of premature mortality.
Figure 11. Pie -chart depicting the 12 best biomarkers that were identified in this study, based on the effect sizes given in Table 8.
Preprints 105488 g010

Author Contributions

Ranmali Ranasinghe (RR), Michael Mathai (MM), Mohammed Abdullah Alshawsh (MAA), Anthony Zulli (AZ). RR created the topic, did the writing, organizing, and referencing of the manuscript. AZ introduced the concept of meta-analysis and MAA. AZ and MM offered constructive criticism, guidance and editing of the manuscript.

Funding

No funding has been received

Acknowledgments

First author is a recipient of the Research Training Programme (RTP) Scholarship from the Australian Government for Ph.D. candidature.

Disclosure Ethics

As this article is a meta-analysis and data have been obtained from published studies and no live or dead animal/mouse experiments have been carried out, the requirement for obtaining ethics does not arise for this manuscript.

Ethics approval and consent to participate

Not applicable.

Consent for publication

All authors of this review have consented for publication.

Competing interests

No competing interests exist.

Abbreviations

ACCORD Action to control cardiovascular risk in type -2 diabetes
Ach acetylcholine
ADVANCE Action in diabetes and vascular disease -PreterX and DiamicronN controlled evaluation
AHA American heart association
AI augmentation index
ALT alanine transaminase
APO A-apolipoprotein-A
APO B apolipoprotein B
ATIR angiotensin-II type 1 receptor
BMI body mass index
BP blood pressure
BW body weight
CIMT carotid intima media thickness
CRP C-reactive protein
CVD cardiovascular disease/disorders
DBP diastolic blood pressure
DCCT/EDIC Diabetes control and complications trial/epidemiology of diabetes interventions and complications trial
ED endothelial deregulation
eGFR estimated glomerular filtration rate
EP estimation plot
EURODIAB/IDDM European diabetes centres study of complications in patients with Insulin-dependent Diabetes Mellitus.
FBG fasting blood glucose
FINN/DIANE Finnish diabetic nephropathy study
FMD flow mediated dilatation
GGT gamma glutamyl transferase
g gram
HbA1c glycated haemoglobin
HC healthy control
HDL c-high-density lipoprotein-cholesterol
HT height
IDF international diabetes federation
IL 6-interleukin-6
kg kilograms
LDL c-low-density lipoprotein-cholesterol
l litre
m metre
MAP mean arterial pressure
MeSH medical subject headings
mg/dl milligram per decilitre
min minutes
mmol/L millimole per litre
m/s meters per second
n number
NO nitric oxide
NS not specified
p probability
pg/ml picogram per millilitre
PON-1 paraoxonase-1
PRISMA preferred reporting items for systematic reviews and meta-analyses
PWV pulse wave velocity
ROBINS-1 risk of bias in non-randomized studies-1
ROS reactive oxygen species
SBP systolic blood pressure
SD standard deviation
SEARCH-CVD SEARCH for Diabetes in Youth study
sE-Selectin soluble E-selectin
sICAM soluble intracellular cell adhesion marker
SMD standardized mean difference
sVCAM soluble vascular cell adhesion marker
TC total cholesterol
T1D type-1 diabetes
T2D type-2-diabetes
TG total triglycerides
TNF a-tumour necrosis factor-alpha
WHO world health organization
WOS web of science

References

  1. Mauvais-Jarvis, F. Gender differences in glucose homeostasis and diabetes. Physiology & behavior. 2018, 187, 20–23. [Google Scholar]
  2. Perry, R.C.; Shankar, R.R.; Fineberg, N.; McGill, J.; Baron, A.D. HbA1c measurement improves the detection of type 2 diabetes in high-risk individuals with nondiagnostic levels of fasting plasma glucose: the Early Diabetes Intervention Program (EDIP). Diabetes Care. 2001, 24, 465–471. [Google Scholar] [CrossRef]
  3. Li, L.-M.; Jiang, B.-G.; Sun, L,-L. HNF1A: from monogenic diabetes to type 2 diabetes and gestational diabetes mellitus. Frontiers in Endocrinology. 2022, 13, 829565. [Google Scholar] [CrossRef]
  4. Tamayo, T.; Rosenbauer, J.; Wild, S.; et al. Diabetes in Europe: an update. Diabetes research and clinical practice. 2014, 103, 206–217. [Google Scholar] [CrossRef]
  5. Komulainen, J.; Lounamaa, R.; Knip, M.; Kaprio, E.A.; Akerblom, H.K. Ketoacidosis at the diagnosis of type 1 (insulin dependent) diabetes mellitus is related to poor residual beta cell function. Childhood Diabetes in Finland Study Group. Archives of disease in childhood. 1996, 75, 410–415. [Google Scholar] [CrossRef] [PubMed]
  6. Gasmi, A.; Noor, S.; Menzel, A.; Pivina, L.; Bjørklund, G. Obesity and insulin resistance: associations with chronic inflammation, genetic and epigenetic factors. Current Medicinal Chemistry. 2021, 28, 800–826. [Google Scholar]
  7. Katsarou, A.; Gudbjörnsdottir, S.; Rawshani, A.; et al. Type 1 diabetes mellitus. Nature reviews Disease primers. 2017, 3, 1–17. [Google Scholar] [CrossRef] [PubMed]
  8. Mukhtar, Y.; Galalain, A.; Yunusa, U. A modern overview on diabetes mellitus: a chronic endocrine disorder. European Journal of Biology. 2020, 5, 1–14. [Google Scholar] [CrossRef]
  9. Yokoyama, H.; Araki, S.-i.; Kawai, K.; et al. Declining trends of diabetic nephropathy, retinopathy and neuropathy with improving diabetes care indicators in Japanese patients with type 2 and type 1 diabetes (JDDM 46). BMJ Open Diabetes Research and Care. 2018, 6, e000521. [Google Scholar] [CrossRef]
  10. Morgan, E.; Cardwell, C.R.; Black, C.J.; McCance, D.R.; Patterson, C.C. Excess mortality in Type 1 diabetes diagnosed in childhood and adolescence: a systematic review of population-based cohorts. Acta diabetologica. 2015, 52, 801–807. [Google Scholar] [CrossRef]
  11. Sun, H.; Saeedi, P.; Karuranga, S.; et al. IDF Diabetes Atlas: Global, regional and country-level diabetes prevalence estimates for 2021 and projections for 2045. Diabetes research and clinical practice. 2022, 183, 109119. [Google Scholar] [CrossRef]
  12. Gomber, A.; Ward, Z.J.; Ross, C.; et al. Variation in the incidence of type 1 diabetes mellitus in children and adolescents by world region and country income group: A scoping review. PLOS Global Public Health. 2022, 2, e0001099. [Google Scholar] [CrossRef] [PubMed]
  13. Morrish, N.; Wang, S.-L.; Stevens, L.; Fuller, J.; Keen, H.; Group, W.M.S. Mortality and causes of death in the WHO Multinational Study of Vascular Disease in Diabetes. Diabetologia. 2001, 44, S14–S21. [Google Scholar] [CrossRef] [PubMed]
  14. Chalakova, T.; Yotov, Y.; Tzotchev, K.; et al. Type 1 diabetes mellitus-risk factor for cardiovascular disease morbidity and mortality. Current Diabetes Reviews. 2021, 17, 37–54. [Google Scholar] [CrossRef] [PubMed]
  15. Shen, J.; Yang, T.; Xu, Y.; et al. δ-Tocotrienol, isolated from rice bran, exerts an anti-inflammatory effect via MAPKs and PPARs signaling pathways in lipopolysaccharide-stimulated macrophages. International journal of molecular sciences. 2018, 19, 3022. [Google Scholar] [CrossRef]
  16. Sen, C.K. Human wound and its burden: updated 2022 compendium of estimates. In. Vol 12: Mary Ann Liebert, Inc., publishers 140 Huguenot Street, 3rd Floor New …; 2023:657-670.
  17. Avogaro, A.; de Kreutzenberg, S.V.; Fadini, G. Endothelial dysfunction: causes and consequences in patients with diabetes mellitus. Diabetes research and clinical practice. 2008, 82, S94–S101. [Google Scholar] [CrossRef]
  18. Alho, I. Ankle-Brachial Index and Cardio-Ankle Vascular Index and their association with cardiorespiratory fitness and leisure-time physical activity in men with type 1 diabetes. 2017.
  19. Tacito, L.H.B.; Pires, A.C.; Yugar-Toledo, J.C. Impaired flow-mediated dilation response and carotid intima-media thickness in patients with type 1 diabetes mellitus with a mean disease duration of 4.1 years. Archives of Endocrinology and Metabolism. 2017, 61, 542–549. [Google Scholar] [CrossRef] [PubMed]
  20. Scheen, A.J.; Ronnback, M.; Fagerudd, J.; Forsblom, C. POSTERS: COMPLICATIONS, MACROVASCULAR-ATHEROSCLEROTIC CVD AND HUMAN DIABETES. Diabetes. 2004, 53, A169. [Google Scholar]
  21. Gildea, N. Pulmonary oxygen uptake and muscle deoxygenation responses during ramp incremental exercise and moderate-and heavy-intensity exercise subsequent to priming exercise in type 2 diabetes, Trinity College Dublin; 2017.
  22. Heier, M.; Borja, M.S.; Brunborg, C.; et al. Reduced HDL function in children and young adults with type 1 diabetes. Cardiovascular diabetology. 2017, 16, 1–8. [Google Scholar] [CrossRef]
  23. Benjamin, E.J.; Muntner, P.; Alonso, A.; et al. Heart disease and stroke statistics—2019 update: a report from the American Heart Association. Circulation. 2019, 139, e56–e528. [Google Scholar]
  24. Sousa, G.R.; Pober, D.; Galderisi, A.; et al. Glycemic Control, Cardiac Autoimmunity, and Long-Term Risk of Cardiovascular Disease in Type 1 Diabetes Mellitus: A DCCT/EDIC Cohort–Based Study. Circulation. 2019, 139, 730–743. [Google Scholar] [CrossRef] [PubMed]
  25. Yang, G.K.; Maahs, D.M.; Perkins, B.A.; Cherney, D.Z. Renal hyperfiltration and systemic blood pressure in patients with uncomplicated type 1 diabetes mellitus. PloS one. 2013, 8, e68908. [Google Scholar] [CrossRef] [PubMed]
  26. Hörtenhuber, T.; Rami-Mehar, B.; Satler, M.; et al. Endothelial progenitor cells are related to glycemic control in children with type 1 diabetes over time. Diabetes care. 2013, 36, 1647–1653. [Google Scholar] [CrossRef] [PubMed]
  27. Fadini, G.P.; Albiero, M.; Vigili de Kreutzenberg, S.; et al. Diabetes impairs stem cell and proangiogenic cell mobilization in humans. Diabetes care. 2013, 36, 943–949. [Google Scholar] [CrossRef]
  28. Dogansen, S.C.; Helvaci, A.; Adas, M.; Onal, S.D. The relationship between early atherosclerosis and endothelial dysfunction in type 1 diabetic patients as evidenced by measurement of carotid intima-media thickness and soluble CD146 levels: a cross sectional study. Cardiovascular Diabetology. 2013, 12, 1–7. [Google Scholar] [CrossRef]
  29. Specht, B.J.; Wadwa, R.P.; Snell-Bergeon, J.K.; Nadeau, K.J.; Bishop, F.K.; Maahs, D.M. Estimated insulin sensitivity and cardiovascular disease risk factors in adolescents with and without type 1 diabetes. The Journal of pediatrics. 2013, 162, 297–301. [Google Scholar] [CrossRef] [PubMed]
  30. Har, R.; Scholey, J.; Daneman, D.; et al. The effect of renal hyperfiltration on urinary inflammatory cytokines/chemokines in patients with uncomplicated type 1 diabetes mellitus. Diabetologia. 2013, 56, 1166–1173. [Google Scholar] [CrossRef]
  31. Van Eupen, M.G.; Schram, M.T.; Colhoun, H.M.; Scheijen, J.L.; Stehouwer, C.D.; Schalkwijk, C.G. Plasma levels of advanced glycation endproducts are associated with type 1 diabetes and coronary artery calcification. Cardiovascular diabetology. 2013, 12, 1–9. [Google Scholar] [CrossRef]
  32. Heimhalt-El Hamriti, M.; Schreiver, C.; Noerenberg, A.; et al. Impaired skin microcirculation in paediatric patients with type 1 diabetes mellitus. Cardiovascular diabetology. 2013, 12, 1–9. [Google Scholar] [CrossRef]
  33. Schlingemann, R.O.; Van Noorden, C.J.; Diekman, M.J.; et al. VEGF levels in plasma in relation to platelet activation, glycemic control, and microvascular complications in type 1 diabetes. Diabetes care. 2013, 36, 1629–1634. [Google Scholar] [CrossRef]
  34. Van Eupen, M.; Schram, M.; Colhoun, H.; et al. The methylglyoxal-derived AGE tetrahydropyrimidine is increased in plasma of individuals with type 1 diabetes mellitus and in atherosclerotic lesions and is associated with sVCAM-1. Diabetologia. 2013, 56, 1845–1855. [Google Scholar] [CrossRef] [PubMed]
  35. Çiftel, M.; Ertuğ, H.; Parlak, M.; Akçurin, G.; Kardelen, F. Investigation of endothelial dysfunction and arterial stiffness in children with type 1 diabetes mellitus and the association with diastolic dysfunction. Diabetes and Vascular Disease Research. 2014, 11, 19–25. [Google Scholar] [CrossRef] [PubMed]
  36. Sabri, M.R.; Tavana, E.N.; Ahmadi, A.; Hashemipour, M. The effect of vitamin C on endothelial function of children with type 1 diabetes: an experimental study. International journal of preventive medicine. 2014, 5, 999. [Google Scholar] [PubMed]
  37. Bruzzi, P.; Predieri, B.; Patianna, V.D.; et al. Longitudinal evaluation of endothelial function in children and adolescents with type 1 diabetes mellitus: A long-term follow-up study. Pediatrics International. 2014, 56, 188–195. [Google Scholar] [CrossRef] [PubMed]
  38. Shah, A.S.; Dabelea, D.; Talton, J.W.; et al. Smoking and arterial stiffness in youth with type 1 diabetes: the SEARCH Cardiovascular Disease Study. The Journal of pediatrics. 2014, 165, 110–116. [Google Scholar] [CrossRef] [PubMed]
  39. Llauradó, G.; Ceperuelo-Mallafré, V.; Vilardell, C.; et al. Advanced glycation end products are associated with arterial stiffness in type 1 diabetes. J Endocrinol. 2014, 221, 405–413. [Google Scholar] [CrossRef] [PubMed]
  40. Tornese, G.; Iafusco, D.; Monasta, L.; et al. The levels of circulating TRAIL at the onset of type 1 diabetes are markedly decreased in patients with ketoacidosis and with the highest insulin requirement. Acta diabetologica. 2014, 51, 239–246. [Google Scholar] [CrossRef] [PubMed]
  41. Eltayeb, A.A.; Ahmad, F.-A.; Sayed, D.M.; Osama, A.M. Subclinical vascular endothelial dysfunctions and myocardial changes with type 1 diabetes mellitus in children and adolescents. Pediatric cardiology. 2014, 35, 965–974. [Google Scholar] [CrossRef] [PubMed]
  42. Machnica, L.; Deja, G.; Polanska, J.; Jarosz-Chobot, P. Blood pressure disturbances and endothelial dysfunction markers in children and adolescents with type 1 diabetes. Atherosclerosis. 2014, 237, 129–134. [Google Scholar] [CrossRef]
  43. Maftei, O.; Pena, A.S.; Sullivan, T.; et al. Early atherosclerosis relates to urinary albumin excretion and cardiovascular risk factors in adolescents with type 1 diabetes: Adolescent type 1 Diabetes cardio-renal Intervention Trial (AdDIT). Diabetes care. 2014, 37, 3069–3075. [Google Scholar] [CrossRef]
  44. Shah, A.S.; Black, S.; Wadwa, R.P.; et al. Insulin sensitivity and arterial stiffness in youth with type 1 diabetes: the SEARCH CVD study. Journal of Diabetes and its Complications. 2015, 29, 512–516. [Google Scholar] [CrossRef]
  45. Shah, A.S.; Wadwa, R.P.; Dabelea, D.; et al. Arterial stiffness in adolescents and young adults with and without type 1 diabetes: the SEARCH CVD study. Pediatric diabetes. 2015, 16, 367–374. [Google Scholar] [CrossRef]
  46. Heier, M.; Margeirsdottir, H.D.; Brunborg, C.; Hanssen, K.F.; Dahl-Jørgensen, K.; Seljeflot, I. Inflammation in childhood type 1 diabetes; influence of glycemic control. Atherosclerosis. 2015, 238, 33–37. [Google Scholar] [CrossRef] [PubMed]
  47. Ho, M.; Benitez-Aguirre, P.Z.; Donaghue, K.C.; et al. Arterial elasticity in obese adolescents with clinical features of insulin resistance. Diabetes and Vascular Disease Research. 2015, 12, 62–69. [Google Scholar] [CrossRef]
  48. Wiltshire, E.J.; Peña, A.S.; MacKenzie, K.; Bose-Sundernathan, T.; Gent, R.; Couper, J.J. A NOS3 polymorphism determines endothelial response to folate in children with type 1 diabetes or obesity. The Journal of Pediatrics. 2015, 166, 319–325 e311. [Google Scholar] [CrossRef] [PubMed]
  49. Heier, M.; Margeirsdottir, H.D.; Gaarder, M.; et al. Soluble RAGE and atherosclerosis in youth with type 1 diabetes: a 5-year follow-up study. Cardiovascular diabetology. 2015, 14, 1–8. [Google Scholar] [CrossRef] [PubMed]
  50. George, B.; Bantwal, G.; Ayyar, V.; Mathew, V. Occurrence of increased arterial stiffness in a cohort of adult patients with type 1 diabetes mellitus when compared to normoglycemic controls. Journal of Diabetes Science and Technology. 2014, 9, 138–144. [Google Scholar] [CrossRef]
  51. Nguyen, T.; Obeid, J.; Walker, R.G.; et al. Fitness and physical activity in youth with type 1 diabetes mellitus in good or poor glycemic control. Pediatric Diabetes. 2015, 16, 48–57. [Google Scholar] [CrossRef]
  52. Llaurado, G.; Sevastianova, K.; Sädevirta, S.; et al. Liver fat content and hepatic insulin sensitivity in overweight patients with type 1 diabetes. The Journal of Clinical Endocrinology & Metabolism. 2015, 100, 607–616. [Google Scholar]
  53. Maiorino, M.I.; Della Volpe, E.; Olita, L.; Bellastella, G.; Giugliano, D.; Esposito, K. Glucose variability inversely associates with endothelial progenitor cells in type 1 diabetes. Endocrine. 2015, 48, 342–345. [Google Scholar] [CrossRef]
  54. Sokolova, A.; Kochegura, T.; Parfyonova, E.; Shestakova, M. Examination number of circulating progenitor endothelial cells in patients with type 1 diabetes mellitus. Diabetes mellitus. 2015, 18, 51–56. [Google Scholar] [CrossRef]
  55. Gulácsi-Bárdos, P.; Nieszner, É.; Tóth-Zsámboki, E.; et al. Non-invasive, Complex Examination of Micro-and Macrovascular System of Patients with Type 1 Diabetes Mellitus with or Without Vascular Complications. Journal of Cardiovascular Emergencies. 2015, 1, 12–22. [Google Scholar] [CrossRef]
  56. El-Asrar, M.A.; Andrawes, N.G.; Ismail, E.A.; Salem, S.M. Kallistatin as a marker of microvascular complications in children and adolescents with type 1 diabetes mellitus: Relation to carotid intima media thickness. Vascular medicine. 2015, 20, 509–517. [Google Scholar] [CrossRef] [PubMed]
  57. de Kat, A.C.; Gremmels, H.; Verhaar, M.C.; Broekmans, F.J.; Yarde, F. Early vascular damage in young women with DM-1 and its relation to anti-Müllerian hormone: a cross-sectional study. International Journal of Endocrinology. 2016, 2016. [Google Scholar] [CrossRef]
  58. Emeksiz, H.C.; Bideci, A.; Damar, Ç.; et al. Soluble endoglin level increase occurs prior to development of subclinical structural vascular alterations in diabetic adolescents. Journal of clinical research in pediatric endocrinology. 2016, 8, 313. [Google Scholar] [CrossRef]
  59. Keles, N.; Dogan, B.; Kalcik, M.; et al. Is serum Klotho protective against atherosclerosis in patients with type 1 diabetes mellitus? Journal of Diabetes and its Complications. 2016, 30, 126–132. [Google Scholar] [CrossRef]
  60. Polat, S.B.; Ugurlu, N.; Aslan, N.; Cuhaci, N.; Ersoy, R.; Cakir, B. Evaluation of biochemical and clinical markers of endothelial dysfunction and their correlation with urinary albumin excretion in patients with type 1 diabetes mellitus. Archives of endocrinology and metabolism. 2016, 60, 117–124. [Google Scholar] [CrossRef]
  61. Wierzbicka, E.; Szalecki, M.; Pludowski, P.; Jaworski, M.; Brzozowska, A. Vitamin D status, body composition and glycemic control in Polish adolescents with type 1 diabetes. Minerva endocrinologica. 2016, 41, 445–455. [Google Scholar]
  62. Brunvand, L.; Fugelseth, D.; Stensaeth, K.H.; Dahl-Jørgensen, K.; Margeirsdottir, H.D. Early reduced myocardial diastolic function in children and adolescents with type 1 diabetes mellitus a population-based study. BMC cardiovascular disorders. 2016, 16, 1–5. [Google Scholar] [CrossRef]
  63. Bradley, T.J.; Slorach, C.; Mahmud, F.H.; et al. Early changes in cardiovascular structure and function in adolescents with type 1 diabetes. Cardiovascular diabetology. 2016, 15, 1–12. [Google Scholar] [CrossRef]
  64. Felício, J.S.; Luz, R.M.; De Melo FTC, et al. Vitamin D on early stages of diabetic kidney disease: a cross-sectional study in patients with type 1 diabetes mellitus. Frontiers in endocrinology. 2016, 7, 149. [Google Scholar] [CrossRef]
  65. Aburawi, E.H.; AlKaabi, J.; Zoubeidi, T.; et al. Subclinical inflammation and endothelial dysfunction in young patients with diabetes: a study from United Arab Emirates. PLoS One. 2016, 11, e0159808. [Google Scholar] [CrossRef] [PubMed]
  66. Rostampour, N.; Fekri, K.; Hashemi-Dehkordi, E.; Obodiat, M. Association between vascular endothelial markers and carotid intima-media thickness in children and adolescents with type 1 diabetes mellitus. Journal of Clinical and Diagnostic Research: JCDR. 2017, 11, SC01. [Google Scholar] [CrossRef]
  67. Abd El Dayem, S.M.; Abd El Kader, M.; Ibrahim, S.; Mokhtar, E.; Abd El Megeed, E. Leptin and lipid profile in overweight patient with type 1 diabetes. Open access Macedonian journal of medical sciences. 2017, 5, 131. [Google Scholar] [CrossRef]
  68. Škrtić, M.; Lytvyn, Y.; Bjornstad, P.; et al. Influence of sex on hyperfiltration in patients with uncomplicated type 1 diabetes. American Journal of Physiology-Renal Physiology. 2017, 312, F599–F606. [Google Scholar] [CrossRef]
  69. Burns, K.D.; Lytvyn, Y.; Mahmud, F.H.; et al. The relationship between urinary renin-angiotensin system markers, renal function, and blood pressure in adolescents with type 1 diabetes. American Journal of Physiology-Renal Physiology. 2017, 312, F335–F342. [Google Scholar] [CrossRef] [PubMed]
  70. Matheus, A.S.d.M.; Clemente, E.L.S.; Rodrigues, M.d.L.G.; Valença, D.C.T.; Gomes, M.B. Assessment of microvascular endothelial function in type 1 diabetes using laser speckle contrast imaging. Journal of Diabetes and its Complications. 2017, 31, 753–757. [Google Scholar] [CrossRef] [PubMed]
  71. El-Samahy, M.H.; Tantawy, A.A.; Adly, A.A.; et al. Expression of CD4+ CD28null T lymphocytes in children and adolescents with type 1 diabetes mellitus: Relation to microvascular complications, aortic elastic properties, and carotid intima media thickness. Pediatric Diabetes. 2017, 18, 785–793. [Google Scholar] [CrossRef]
  72. Heier, M.; Espeland, C.N.; Brunborg, C.; et al. Preserved endothelial function in young adults with type 1 diabetes. PLoS One. 2018, 13, e0206523. [Google Scholar] [CrossRef]
  73. Słomiński, B.; Ryba-Stanisławowska, M.; Skrzypkowska, M.; Myśliwska, J.; Myśliwiec, M. The KL-VS polymorphism of KLOTHO gene is protective against retinopathy incidence in patients with type 1 diabetes. Biochimica et Biophysica Acta (BBA)-Molecular Basis of Disease. 2018, 1864, 758–763. [Google Scholar] [CrossRef]
  74. Pillay, S.; Anderson, J.; Couper, J.; Maftei, O.; Gent, R.; Peña, A.S. Children with type 1 diabetes have delayed flow-mediated dilation. Canadian Journal of Diabetes. 2018, 42, 276–280. [Google Scholar] [CrossRef]
  75. Żebrowska, A.; Hall, B.; Maszczyk, A.; Banaś, R.; Urban, J. Brain-derived neurotrophic factor, insulin like growth factor-1 and inflammatory cytokine responses to continuous and intermittent exercise in patients with type 1 diabetes. Diabetes research and clinical practice. 2018, 144, 126–136. [Google Scholar] [CrossRef]
  76. Chiesa, S.T.; Charakida, M.; McLoughlin, E.; et al. Elevated high-density lipoprotein in adolescents with Type 1 diabetes is associated with endothelial dysfunction in the presence of systemic inflammation. European Heart Journal. 2019, 40, 3559–3566. [Google Scholar] [CrossRef]
  77. Zahran, A.M.; Mohamed, I.L.; El Asheer, O.M.; et al. Circulating endothelial cells, circulating endothelial progenitor cells, and circulating microparticles in type 1 diabetes mellitus. Clinical and Applied Thrombosis/Hemostasis. 2019, 25, 1076029618825311. [Google Scholar] [CrossRef] [PubMed]
  78. Wiromrat, P.; Bjornstad, P. ; RONCAL-JIMENEZ CA, et al. Serum uromodulin (SUMOD) inversely correlates with aortic stiffness in type 1 diabetes (T1D) youth. Diabetes.
  79. Abdelghaffar, S.; Shora, H.; Abdelatty, S.; et al. MicroRNAs and risk factors for diabetic nephropathy in egyptian children and adolescents with type 1 diabetes. Diabetes, Metabolic Syndrome and Obesity. 2494. [Google Scholar]
  80. Zwingli, G.; Yerly, J.; Mivelaz, Y.; et al. Non-invasive assessment of coronary endothelial function in children and adolescents with type 1 diabetes mellitus using isometric handgrip exercise—MRI: A feasibility study. Plos one. 2020, 15, e0228569. [Google Scholar] [CrossRef]
  81. Ibrahim, A.A.; Wahby, A.A.; Ashmawy, I.; Saleh, R.M.; Soliman, H. Association of exosomal miR-34a with markers of dyslipidemia and endothelial dysfunction in children and adolescents with T1DM. Journal of Clinical Research in Pediatric Endocrinology. 2020, 12, 401. [Google Scholar] [CrossRef] [PubMed]
  82. Bratseth, V.; Margeirsdottir, H.D.; Chiva-Blanch, G.; et al. Annexin V+ Microvesicles in Children and Adolescents with Type 1 Diabetes: A Prospective Cohort Study. Journal of Diabetes Research. 2020, 2020, 1–8. [Google Scholar] [CrossRef] [PubMed]
  83. Nocuń-Wasilewska, K.; Zwolińska, D.; Zubkiewicz-Kucharska, A.; Polak-Jonkisz, D. Evaluation of Vascular Endothelial Function in Children with Type 1 Diabetes Mellitus. Journal of Clinical Medicine. 2021, 10, 5065. [Google Scholar] [CrossRef]
  84. Lespagnol, E.; Tagougui, S.; Fernandez, B.O.; et al. Circulating biomarkers of nitric oxide bioactivity and impaired muscle vasoreactivity to exercise in adults with uncomplicated type 1 diabetes. Diabetologia. 2021, 64, 325–338. [Google Scholar] [CrossRef]
  85. Morandi, A.; Corradi, M.; Orsi, S.; et al. Oxidative stress in youth with type 1 diabetes: Not only a matter of gender, age, and glycemic control. Diabetes Research and Clinical Practice. 2021, 179, 109007. [Google Scholar] [CrossRef]
  86. Faienza, M.F.; Scicchitano, P.; Lamparelli, R.; et al. Vascular and Myocardial Function in Young People with Type 1 Diabetes Mellitus: Insulin Pump Therapy Versus Multiple Daily Injections Insulin Regimen. Exp Clin Endocrinol Diabetes. 2021, 130, 415–422. [Google Scholar] [PubMed]
  87. Alkaabi, J.; Sharma, C.; Yasin, J.; et al. Relationship between lipid profile, inflammatory and endothelial dysfunction biomarkers, and type 1 diabetes mellitus: A case-control study. American Journal of Translational Research. 2022, 14, 4838. [Google Scholar]
  88. Jahn, L.A.; Logan, B.; Love, K.M.; et al. Nitric oxide-dependent micro-and macrovascular dysfunction occurs early in adolescents with type 1 diabetes. American Journal of Physiology-Endocrinology and Metabolism. 2022, 322, E101–E108. [Google Scholar] [CrossRef] [PubMed]
  89. Cutruzzolà, A.; Parise, M.; Scavelli, F.B.; Barone, M.; Gnasso, A.; Irace, C. Time in range does not associate with carotid artery wall thickness and endothelial function in type 1 diabetes. Journal of Diabetes Science and Technology. 2022, 16, 904–911. [Google Scholar] [CrossRef]
  90. Sherif, E.M.; Matter, R.M.; Salah, N.Y.; Abozeid, N.E.H.; Atif, H.M.; Tantawy, N.M. Changes in early optical coherence tomography angiography among children and adolescents with type 1 diabetes: Relation to fibroblast growth factor 21. Diabetes/Metabolism Research and Reviews. 2023, 39, e3598. [Google Scholar] [CrossRef] [PubMed]
  91. Kącka, A.; Charemska, A.; Jarocka-Cyrta, E.; Głowińska-Olszewska, B. Comparison of novel markers of metabolic complications and cardiovascular risk factors between obese non-diabetic and obese type 1 diabetic children and young adults. Frontiers in Endocrinology. 2022, 13, 1036109. [Google Scholar] [CrossRef]
  92. Zaharia, O.P.; Lanzinger, S.; Rosenbauer, J.; et al. Comorbidities in recent-onset adult type 1 diabetes: a comparison of German cohorts. Frontiers in Endocrinology. 2022, 13, 760778. [Google Scholar] [CrossRef] [PubMed]
  93. Maio, A.; Maiorino, M.I.; Longo, M.; et al. Change in Circulating Levels of Endothelial Progenitor Cells and Sexual Function in Women With Type 1 Diabetes. The Journal of Clinical Endocrinology & Metabolism. 2022, 107, e3910–e3918. [Google Scholar]
  94. Richardson, T.M.; Saunders, D.C.; Haliyur, R.; et al. Human pancreatic capillaries and nerve fibers persist in type 1 diabetes despite beta cell loss. American Journal of Physiology-Endocrinology and Metabolism. 2023, 324, E251–E267. [Google Scholar] [CrossRef]
  95. Mousa, M.; Albarguthi, S.; Albreiki, M.; et al. Whole-Exome Sequencing in Family Trios Reveals De Novo Mutations Associated with Type 1 Diabetes Mellitus. Biology. 2023, 12, 413. [Google Scholar] [CrossRef]
  96. Matejko, B.; Tota, Ł.; Morawska-Tota, M.; Pałka, T.; Malecki, M.T.; Klupa, T. Assessment of selected muscle damage markers and zonulin concentration after maximum-intensity exercise in men with type 1 diabetes treated with a personal insulin pump. Acta Diabetologica. 2023; 1–9. [Google Scholar]
  97. Strollo, R.; Vinci, C.; Man, Y.S.; et al. Autoantibody and T cell responses to oxidative post-translationally modified insulin neoantigenic peptides in type 1 diabetes. Diabetologia. 2023, 66, 132–146. [Google Scholar] [CrossRef] [PubMed]
  98. Amer, O.E.; Sabico, S.; Khattak, M.N.; Al-Daghri, N.M. Circulating Nitric Oxide and Metabolic Syndrome in Arab Children and Adolescents: A Case–Control Study. Children. 2023, 10, 210. [Google Scholar] [CrossRef] [PubMed]
  99. İncekalan, T.K.; Akbaş, E.D.; Şimdivar, G.H.N. Detection of Early Retinal Neurovascular Changes in Children and Adolescents with Type 1 Diabetes Mellitus Without Diabetic Retinopathy. Retina-Vitreus/Journal of Retina-Vitreous. 2023; 32. [Google Scholar]
  100. Mostafa, A.M.; El Agouza, I.; Hafez, H.; Banna, M. Assesment of serum taurine level as a potential biomarker for early diagnosis of diabetic nephropathy. GSC Biological and Pharmaceutical Sciences. 2023, 22, 312–320. [Google Scholar] [CrossRef]
  101. Konukoglu, D.; Uzun, H. Endothelial dysfunction and hypertension. Hypertension: from basic research to clinical practice.
  102. Bakker, W.; Eringa, E.C.; Sipkema, P.; van Hinsbergh, V.W. Endothelial dysfunction and diabetes: roles of hyperglycemia, impaired insulin signaling and obesity. Cell and tissue research. 2009, 335, 165–189. [Google Scholar] [CrossRef] [PubMed]
  103. Boarescu, P.-M.; Boarescu, I.; Pop, R.M.; et al. Evaluation of oxidative stress biomarkers, pro-inflammatory cytokines, and histological changes in experimental hypertension, dyslipidemia, and type 1 diabetes mellitus. International Journal of Molecular Sciences. 2022, 23, 1438. [Google Scholar] [CrossRef] [PubMed]
  104. Hirano, T. Pathophysiology of diabetic dyslipidemia. Journal of atherosclerosis and thrombosis. 2018, 25, 771–782. [Google Scholar] [CrossRef] [PubMed]
  105. James, S.; Perry, L.; Lowe, J.; Harris, M.; Colman, P.G.; Craig, M.E. Blood pressure in adolescents and young adults with type 1 diabetes: data from the Australasian Diabetes Data Network registry. Acta Diabetologica. 2023, 60, 797–803. [Google Scholar] [CrossRef] [PubMed]
  106. Dabelea, D.; Talton, J.W.; D’Agostino Jr, R.; et al. Cardiovascular risk factors are associated with increased arterial stiffness in youth with type 1 diabetes: the SEARCH CVD study. Diabetes care. 2013, 36, 3938–3943. [Google Scholar] [CrossRef] [PubMed]
  107. Baptist, A.; Salvi, S.; Yajnik, C. Vascular Complications of Type 1 Diabetes among Indian Patients. Indian Journal of Public Health Research & Development. 2020; 11. [Google Scholar]
  108. Chen, Z.; Miao, F.; Paterson, A.D.; et al. Epigenomic profiling reveals an association between persistence of DNA methylation and metabolic memory in the DCCT/EDIC type 1 diabetes cohort. Proceedings of the National Academy of Sciences. 2016, 113, E3002–E3011. [Google Scholar] [CrossRef]
  109. Dluhy, R.G.; McMahon, G.T. Intensive glycemic control in the ACCORD and ADVANCE trials. N Engl J Med. 2008, 358, 2630–2633. [Google Scholar] [CrossRef]
  110. Sullivan, G.M.; Feinn, R. Using effect size—or why the P value is not enough. Journal of graduate medical education. 2012, 4, 279–282. [Google Scholar] [CrossRef] [PubMed]
  111. Hallström, S.; Svensson, A.-M.; Pivodic, A.; et al. Risk factors and incidence over time for lower extremity amputations in people with type 1 diabetes: an observational cohort study of 46,088 patients from the Swedish National Diabetes Registry. Diabetologia. 2021, 64, 2751–2761. [Google Scholar] [CrossRef] [PubMed]
  112. Haller, M.J.; Samyn, M.; Nichols, W.W.; et al. Radial artery tonometry demonstrates arterial stiffness in children with type 1 diabetes. Diabetes care. 2004, 27, 2911–2917. [Google Scholar] [CrossRef] [PubMed]
  113. James, S.; Perry, L.; Gallagher, R.; et al. Service usage and vascular complications in young adults with type 1 diabetes. BMC Endocrine Disorders. 2014, 14, 1–9. [Google Scholar] [CrossRef] [PubMed]
  114. Sun, W.; Wang, Q.; Chen, B.; Liu, J.; Liu, H.; Xu, W. γ-Tocotrienol-induced apoptosis in human gastric cancer SGC-7901 cells is associated with a suppression in mitogen-activated protein kinase signalling. British journal of nutrition. 2008, 99, 1247–1254. [Google Scholar] [CrossRef] [PubMed]
  115. Downie, M.L.; Ulrich, E.H.; Noone, D.G. An update on hypertension in children with type 1 diabetes. Canadian Journal of Diabetes. 2018, 42, 199–204. [Google Scholar] [CrossRef] [PubMed]
  116. Åkesson, K.; Hanberger, L.; Samuelsson, U. The influence of age, gender, insulin dose, BMI, and blood pressure on metabolic control in young patients with type 1 diabetes. Pediatric diabetes. 2015, 16, 581–586. [Google Scholar] [CrossRef]
  117. Miller, R.G.; Costacou, T.; Orchard, T.J. Risk factor modeling for cardiovascular disease in type 1 diabetes in the Pittsburgh epidemiology of diabetes complications (EDC) study: a comparison with the diabetes control and complications trial/epidemiology of diabetes interventions and complications study (DCCT/EDIC). Diabetes. 2019, 68, 409–419. [Google Scholar]
  118. Zhang, X.; Ammous, F.; Lin, L.; et al. The Interplay of Epigenetic, Genetic, and Traditional Risk Factors on Blood Pressure: Findings from the Health and Retirement Study. Genes. 2022, 13, 1959. [Google Scholar] [CrossRef]
  119. Laurent, S.; Cockcroft, J.; Van Bortel, L.; et al. Expert consensus document on arterial stiffness: methodological issues and clinical applications. European heart journal. 2006, 27, 2588–2605. [Google Scholar] [CrossRef]
  120. Kupfer, R.; Larrúbia, M.R.; Bussade, I.; et al. Predictors of subclinical atherosclerosis evaluated by carotid intima-media thickness in asymptomatic young women with type 1 diabetes mellitus. Archives of endocrinology and metabolism. 2017, 61, 115–121. [Google Scholar] [CrossRef]
  121. Lamacchia, O.; Sorrentino, M.R. Diabetes mellitus, arterial stiffness and cardiovascular disease: clinical implications and the influence of SGLT2i. Current Vascular Pharmacology. 2021, 19, 233–240. [Google Scholar] [CrossRef]
  122. Palombo, C.; Kozakova, M. Arterial stiffness, atherosclerosis and cardiovascular risk: Pathophysiologic mechanisms and emerging clinical indications. Vascular pharmacology. 2016, 77, 1–7. [Google Scholar] [CrossRef]
  123. Ikonomidis, I.; Aboyans, V.; Blacher, J.; et al. The role of ventricular–arterial coupling in cardiac disease and heart failure: Assessment, clinical implications and therapeutic interventions. A consensus document of the European Society of Cardiology Working Group on Aorta & Peripheral Vascular Diseases, European Association of Cardiovascular Imaging, and Heart Failure Association. European journal of heart failure. 2019, 21, 402–424. [Google Scholar]
  124. Van Bortel, L.M.; Laurent, S.; Boutouyrie, P.; et al. Expert consensus document on the measurement of aortic stiffness in daily practice using carotid-femoral pulse wave velocity. Journal of hypertension. 2012, 30, 445–448. [Google Scholar] [CrossRef]
  125. Bourdel-Marchasson, I.; Doucet, J.; Bauduceau, B.; et al. Key priorities in managing glucose control in older people with diabetes. JNHA-The Journal of Nutrition, Health and Aging. 2009, 13, 685–691. [Google Scholar] [CrossRef]
  126. Dost, A.; Bechtold-Dalla Pozza, S.; Bollow, E.; et al. Blood pressure regulation determined by ambulatory blood pressure profiles in children and adolescents with type 1 diabetes mellitus: Impact on diabetic complications. Pediatric diabetes. 2017, 18, 874–882. [Google Scholar] [CrossRef]
  127. Atabek, M.E.; Akyürek, N.; Eklioglu, B.S.; Alp, H. Impaired systolic blood dipping and nocturnal hypertension: An independent predictor of carotid intima–media thickness in type 1 diabetic patients. Journal of Diabetes and its Complications. 2014, 28, 51–55. [Google Scholar] [CrossRef]
  128. Öberg, C.M.; Lindström, M.; Grubb, A.; Christensson, A. Potential relationship between eGFRcystatin C/eGFRcreatinine-ratio and glomerular basement membrane thickness in diabetic kidney disease. Physiological Reports. 2021, 9, e14939. [Google Scholar] [CrossRef]
  129. Harjutsalo, V.; Barlovic, D.P.; Gordin, D.; Forsblom, C.; King, G.; Groop, P.-H. Presence and determinants of cardiovascular disease and mortality in individuals with type 1 diabetes of long duration: the FinnDiane 50 years of diabetes study. Diabetes Care. 2021, 44, 1885–1893. [Google Scholar] [CrossRef]
  130. Torrado, J.; Farro, I.; Zócalo, Y.; et al. Preeclampsia is associated with increased central aortic pressure, elastic arteries stiffness and wave reflections, and resting and recruitable endothelial dysfunction. International journal of hypertension. 2015, 2015. [Google Scholar] [CrossRef]
  131. Skrzypczyk, P.; Pańczyk-Tomaszewska, M. Methods to evaluate arterial structure and function in children–State-of-the art knowledge. Advances in medical sciences. 2017, 62, 280–294. [Google Scholar] [CrossRef]
  132. Bernardi, L.; Gordin, D.; Bordino, M.; et al. Oxygen-induced impairment in arterial function is corrected by slow breathing in patients with type 1 diabetes. Scientific reports. 2017, 7, 6001. [Google Scholar] [CrossRef]
  133. Giannopoulou, E.Z.; Doundoulakis, I.; Antza, C.; et al. Subclinical arterial damage in children and adolescents with type 1 diabetes: A systematic review and meta-analysis. Pediatric Diabetes. 2019, 20, 668–677. [Google Scholar] [CrossRef]
  134. Snell-Bergeon, J.K.; Nadeau, K. Cardiovascular disease risk in young people with type 1 diabetes. Journal of cardiovascular translational research. 2012, 5, 446–462. [Google Scholar] [CrossRef]
  135. Nathan, D.M.; Group, D.E.R. The diabetes control and complications trial/epidemiology of diabetes interventions and complications study at 30 years: overview. Diabetes care. 2014, 37, 9–16. [Google Scholar] [CrossRef]
  136. Sibal, L.; Agarwal, S.C.; Home, P.D. Carotid intima-media thickness as a surrogate marker of cardiovascular disease in diabetes. Diabetes, metabolic syndrome and obesity: targets and therapy. 2011; 23–34. [Google Scholar]
  137. Gourgari, E.; Dabelea, D.; Rother, K. Modifiable risk factors for cardiovascular disease in children with type 1 diabetes: can early intervention prevent future cardiovascular events? Current Diabetes Reports. 2017, 17, 1–11. [Google Scholar] [CrossRef]
  138. Laugier-Robiolle, S.; Vergès, B.; Le Bras, M.; et al. Glycaemic control influences the relationship between plasma PCSK9 and LDL cholesterol in type 1 diabetes. Diabetes, Obesity and Metabolism. 2017, 19, 448–451. [Google Scholar] [CrossRef]
  139. Cullum, C.M.; Rossetti, H.C.; Batjer, H.; Festa, J.R.; Haaland, K.Y.; Lacritz, L.H. 16 Cerebrovascular Disease. Textbook of Clinical Neuropsychology. 2017; 350. [Google Scholar]
  140. Walldius, G.; Jungner, I. The apoB/apoA-I ratio: a strong, new risk factor for cardiovascular disease and a target for lipid-lowering therapy–a review of the evidence. Journal of internal medicine. 2006, 259, 493–519. [Google Scholar] [CrossRef]
  141. Mazanderani, A.B.; Wise, S.J.; Tildesley, H.D. Apolipoprotein B levels in adults with type 1 diabetes not receiving lipid-lowering therapy. Clinical biochemistry. 2009, 42, 1218–1221. [Google Scholar] [CrossRef]
  142. Cadario, F.; Prodam, F.; Pasqualicchio, S.; et al. Lipid profile and nutritional intake in children and adolescents with Type 1 diabetes improve after a structured dietician training to a Mediterranean-style diet. Journal of endocrinological investigation. 2012, 35, 160–168. [Google Scholar]
  143. Reynolds, P.S. When power calculations won’t do: Fermi approximation of animal numbers. Lab animal. 2019, 48, 249–253. [Google Scholar] [CrossRef]
  144. Bjornstad, P.; Nguyen, N.; Reinick, C.; et al. Association of apolipoprotein, B.; LDL-C and vascular stiffness in adolescents with type 1 diabetes. Acta diabetologica. 2015, 52, 611–619. [Google Scholar] [CrossRef]
  145. Santin, I.; Eizirik, D.L. Candidate genes for type 1 diabetes modulate pancreatic islet inflammation and β-cell apoptosis. Diabetes, Obesity and Metabolism. 2013; 15, 71–81. [Google Scholar]
  146. Pérez-Segura, P.; De Dios, O.; Herrero, L.; et al. Children with type 1 diabetes have elevated high-sensitivity C-reactive protein compared with a control group. BMJ Open Diabetes Research and Care. 2020, 8, e001424. [Google Scholar] [CrossRef]
  147. Singh, B.; Nikoopour, E.; Huszarik, K.; Elliott, J.F.; Jevnikar, A.M. Immunomodulation and regeneration of islet beta cells by cytokines in autoimmune type 1 diabetes. Journal of Interferon & Cytokine Research. 2011, 31, 711–719. [Google Scholar]
  148. Pirot, P.; Cardozo, A.K.; Eizirik, D.L. Mediators and mechanisms of pancreatic beta-cell death in type 1 diabetes. Arquivos Brasileiros de Endocrinologia & Metabologia. 2008, 52, 156–165. [Google Scholar]
  149. Bonnet, F.; Ducluzeau, P.-H.; Gastaldelli, A.; et al. Liver enzymes are associated with hepatic insulin resistance, insulin secretion, and glucagon concentration in healthy men and women. Diabetes. 2011, 60, 1660–1667. [Google Scholar] [CrossRef]
  150. Quetglas-Llabrés, M.M.; Monserrat-Mesquida, M.; Bouzas, C.; et al. Mediterranean Diet Improves Plasma Biomarkers Related to Oxidative Stress and Inflammatory Process in Patients with Non-Alcoholic Fatty Liver Disease. Antioxidants. 2023, 12, 833. [Google Scholar] [CrossRef]
  151. Gorasia, D.G.; Dudek, N.L.; Veith, P.D.; et al. Pancreatic beta cells are highly susceptible to oxidative and ER stresses during the development of diabetes. Journal of Proteome Research. 2015, 14, 688–699. [Google Scholar] [CrossRef]
  152. Ma, S.H.; Park, B.-Y.; Yang, J.J.; et al. Interaction of body mass index and diabetes as modifiers of cardiovascular mortality in a cohort study. Journal of Preventive Medicine and Public Health. 2012, 45, 394. [Google Scholar] [CrossRef]
  153. Westphal, S.A.; Palumbo, P.J. Weight gain and management concerns in patients on insulin therapy. Insulin. 2007, 2, 31–36. [Google Scholar] [CrossRef]
  154. Laron, Z. Insulin–a growth hormone. Archives of physiology and biochemistry. 2008, 114, 11–16. [Google Scholar] [CrossRef]
  155. Kelishadi, R.; Ardalan, G.; Gheiratmand, R.; et al. Association of physical activity and dietary behaviours in relation to the body mass index in a national sample of Iranian children and adolescents: CASPIAN Study. Bulletin of the world health organization. 2007, 85, 19–26. [Google Scholar] [CrossRef] [PubMed]
  156. Frier, B.M. How hypoglycaemia can affect the life of a person with diabetes. Diabetes/metabolism research and reviews. 2008, 24, 87–92. [Google Scholar] [CrossRef]
  157. Witkowska, A.M.; Borawska, M.H. Soluble intercellular adhesion molecule-1 (sICAM-1): an overview. European cytokine network. 2004, 15, 91–98. [Google Scholar] [PubMed]
  158. Bui, T.M.; Wiesolek, H.L.; Sumagin, R. ICAM-1: A master regulator of cellular responses in inflammation, injury resolution, and tumorigenesis. Journal of Leucocyte Biology. 2020, 108, 787–799. [Google Scholar] [CrossRef]
  159. Ferreira, I.; Hovind, P.; Schalkwijk, C.G.; Parving, H.-H.; Stehouwer, C.D.; Rossing, P. Biomarkers of inflammation and endothelial dysfunction as predictors of pulse pressure and incident hypertension in type 1 diabetes: a 20 year life-course study in an inception cohort. Diabetologia. 2018, 61, 231–241. [Google Scholar] [CrossRef]
  160. Huang, J.X.; Casper, T.C.; Pitts, C.; et al. Association of acute kidney injury during diabetic ketoacidosis with risk of microalbuminuria in children with type 1 diabetes. JAMA pediatrics. 2022, 176, 169–175. [Google Scholar] [CrossRef]
  161. Stankute, I.; Radzeviciene, L.; Monstaviciene, A.; Dobrovolskiene, R.; Danyte, E.; Verkauskiene, R. Serum cystatin C as a biomarker for early diabetic kidney disease and dyslipidemia in young type 1 diabetes patients. Medicina. 2022, 58, 218. [Google Scholar] [CrossRef]
  162. Ix, J.H.; Shlipak, M.G.; Katz, R.; et al. Kidney function and aortic valve and mitral annular calcification in the Multi-Ethnic Study of Atherosclerosis (MESA). American journal of kidney diseases. 2007, 50, 412–420. [Google Scholar] [CrossRef]
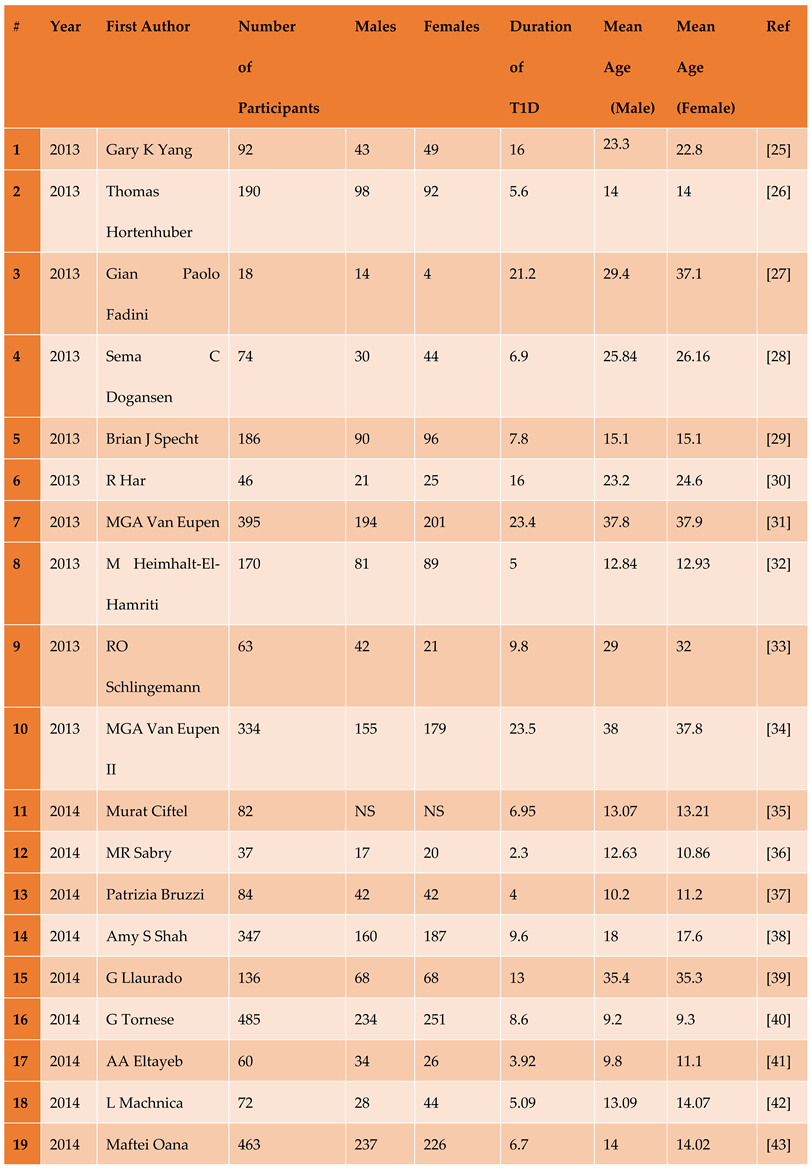
Table 1. Study Characteristics comprising of the year of study, name of first author, number of participants by gender, duration of T1D and the mean age.
Preprints 105488 i002a
Preprints 105488 i002b
Preprints 105488 i002c
Preprints 105488 i002d
NS=not specified.
Table 2. Summary statistics of BP between the diabetic participants compared with the healthy control participants.
Preprints 105488 i003
Table 3. Summary statistics of glucose metabolism between the diabetic participants compared with the healthy control participants.
Preprints 105488 i004
Table 4. Summary statistics of lipid biomarkers between the diabetic participants compared with the healthy control participants.
Preprints 105488 i005a
Preprints 105488 i005b
Table 5. Summary statistics of the vascular function biomarkers between the diabetic participants compared with the healthy control participants.
Preprints 105488 i006
Table 6. Summary statistics of the inflammatory biomarkers between the diabetic participants compared with the healthy control participants.
Preprints 105488 i007
Table 7. Summary statistics of the obesity targets between the diabetic participants compared with the healthy control participants.
Preprints 105488 i008
Table 8. The effect size and level of risk of the best biomarkers identified.
Preprints 105488 i009
Disclaimer/Publisher’s Note: The statements, opinions and data contained in all publications are solely those of the individual author(s) and contributor(s) and not of MDPI and/or the editor(s). MDPI and/or the editor(s) disclaim responsibility for any injury to people or property resulting from any ideas, methods, instructions or products referred to in the content.
Copyright: This open access article is published under a Creative Commons CC BY 4.0 license, which permit the free download, distribution, and reuse, provided that the author and preprint are cited in any reuse.
Prerpints.org logo

Preprints.org is a free preprint server supported by MDPI in Basel, Switzerland.

Subscribe

© 2024 MDPI (Basel, Switzerland) unless otherwise stated