1. Introduction
Since the start of the new century, the issues of energy scarcity and escalating environmental challenges have intensified. Consequently, the expansion of renewable green energy sources such as geothermal energy has gained universal agreement [
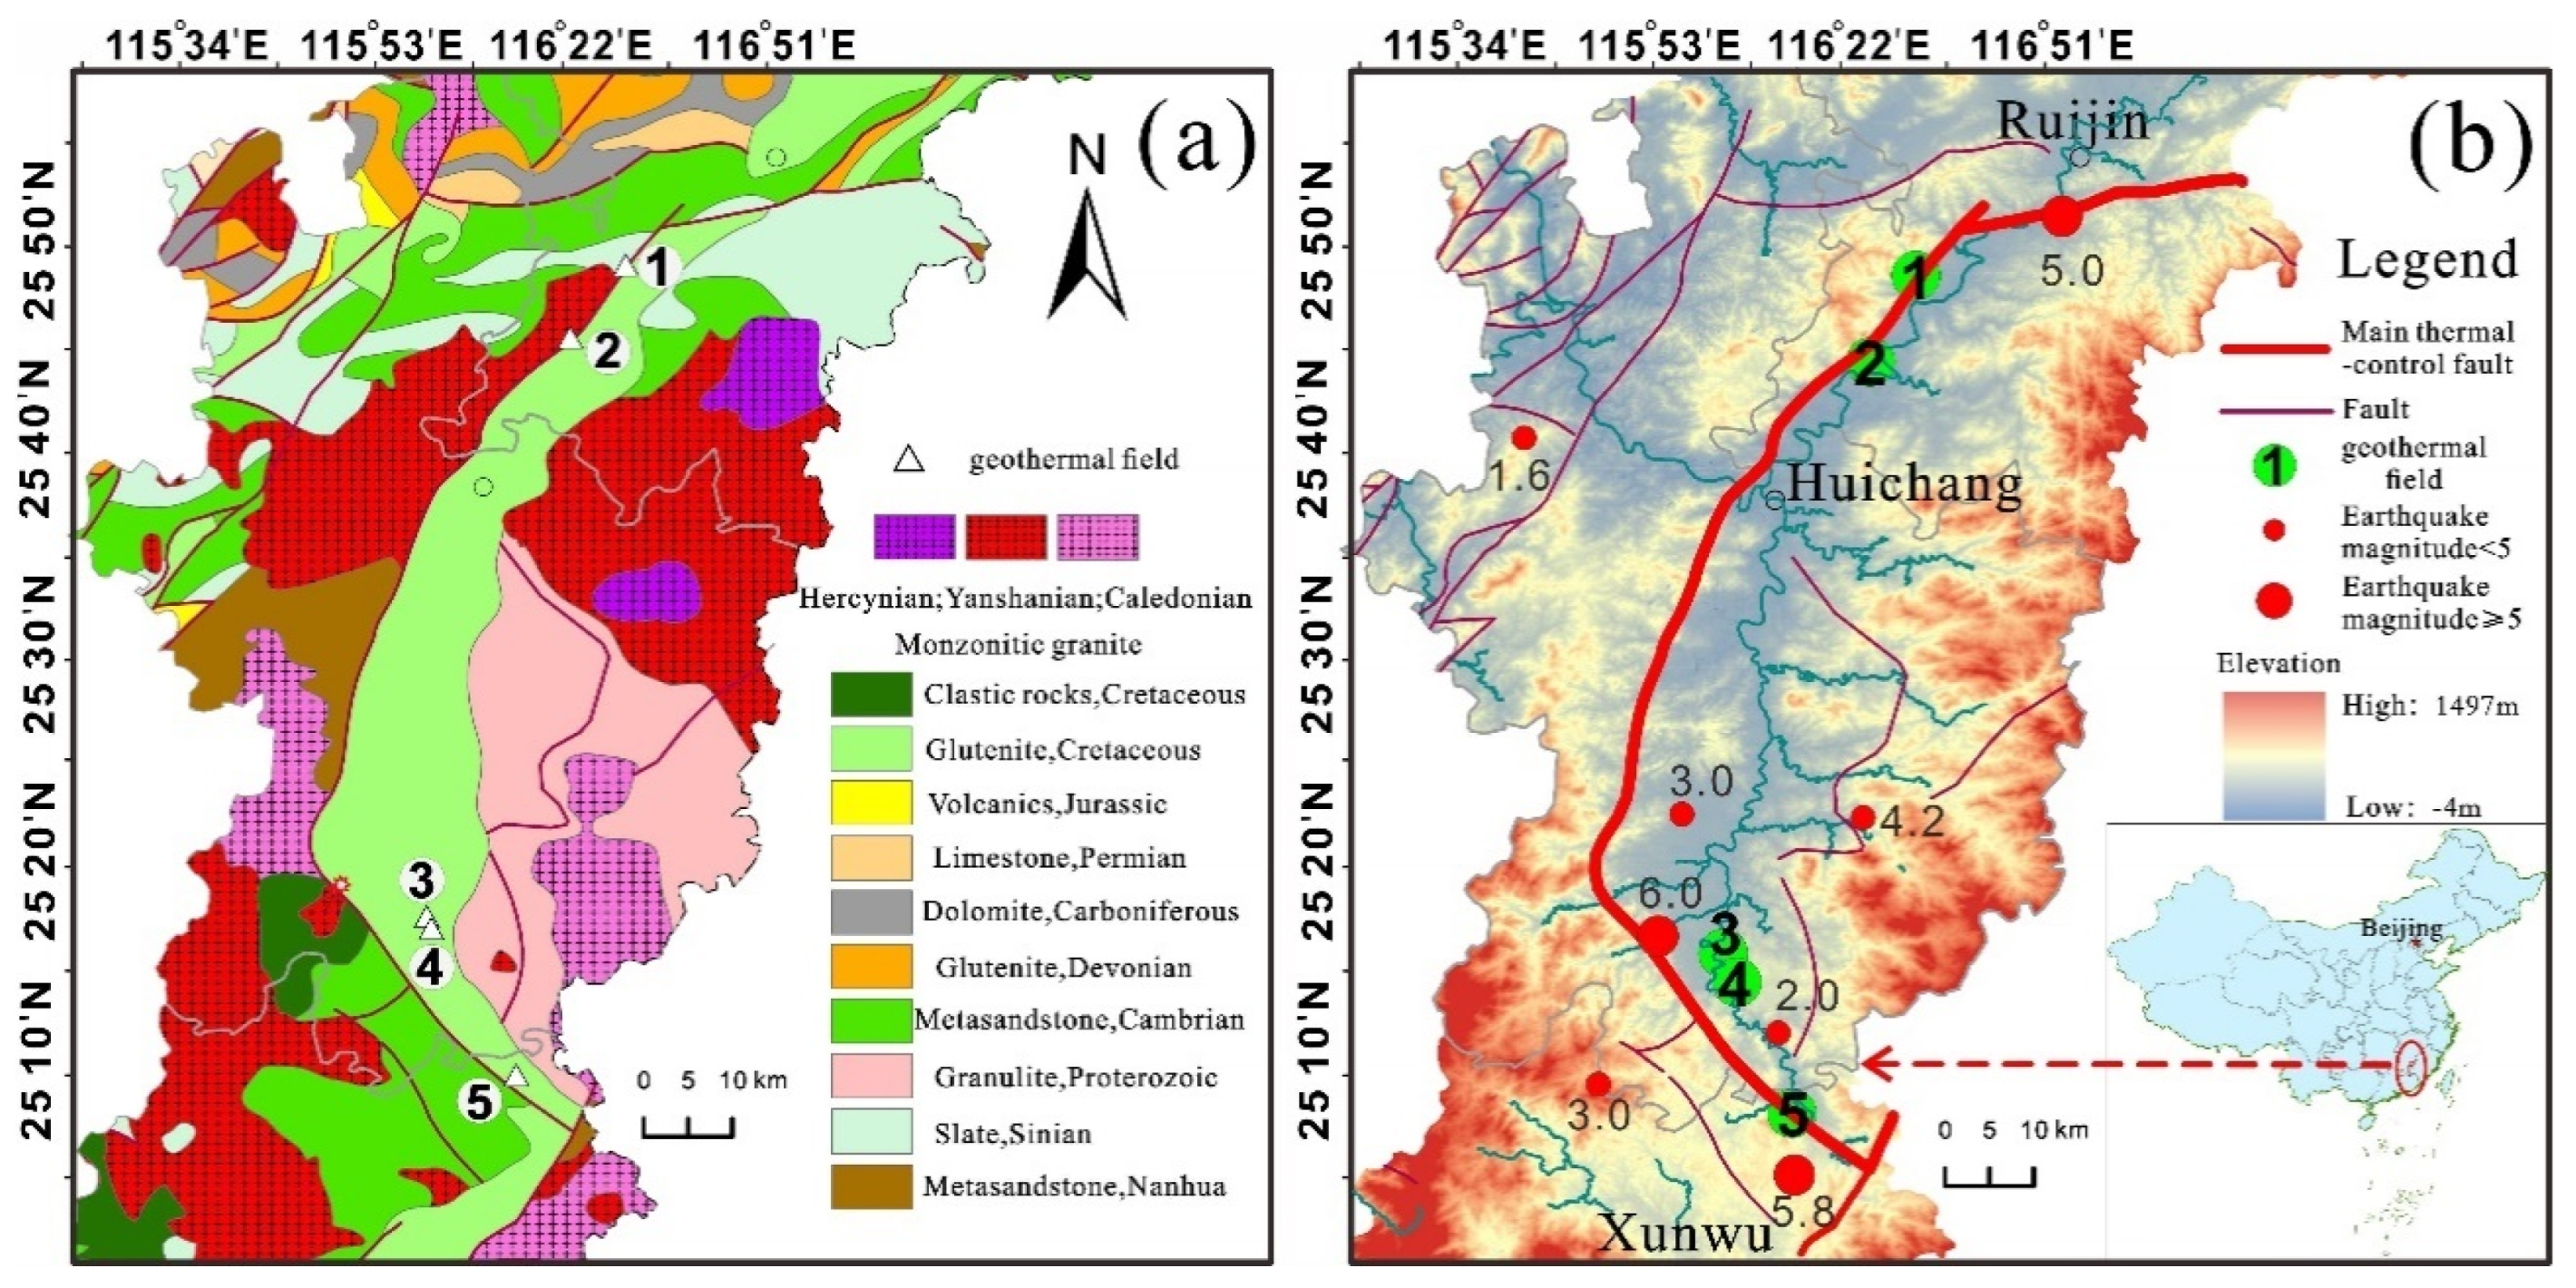
1]. Efficiently developing and utilizing geothermal water not only facilitates low-carbon economic growth and contributes to poverty alleviation but also holds significant practical importance for advancing the consumption revolution, fostering ecological civilization, and supporting rural revitalization strategies. The Huichang fault basin, situated within the Shaowu-Heyuan deep fault zone, extends from Ruijin City and Huichang County to the northern reaches of Xunwu on the western flank of the Nanwuyi Mountains. This region in Jiangxi Province, known for its dense hot springs distribution, boasts abundant medium and low-temperature geothermal water resources (25°C < T < 150°C). Thus, investigating the chemical properties and genesis mechanisms of geothermal water in this fault basin is crucial for the scientifically sound exploitation of geothermal resources in the area.
In the Huichang Basin, located in the Shaowu-Heyuan deep fault zone, researchers have assessed the geothermal potential, particularly in terms of dry hot rocks. Yu Min, Bo Hui, and colleagues identified the basin as a promising area for dry hot rock exploration, highlighting the Ruijin high-temperature anomaly gradient zone where temperatures exceed 150°C at depths of 5.5 km [
2,
3]. Studies by Yang Huaze et al. (2018) underscore the favorable geothermal prospects due to high ground heat flow and active seismic zones in the area [
4]. Liu Qianjin and others attribute the primary heat source to the radioactive decay in granite, with water temperatures influenced by the thickness of the overlying layers and the radioactive content of adjacent rocks [
5]. Regarding the chemistry and origin of geothermal water, Sun Zhanxue posits that it predominantly derives from atmospheric precipitation [
6]. Conversely, Zou Guoyao, Yang Qian, Chu Xiaodong, Wang Jin, and colleagues argue that geothermal water is significantly influenced by the fault structure, formation lithology, and other geological factors. They describe the geothermal water system as a convective heat storage system with zonal (vein) distribution, tightly governed by fault lines [
7,
8,
9]. Chen Sibao and collaborators suggest that the Cretaceous fault zones serve as the principal heat storage sites for geothermal water in the Huichang Basin. Following recharge, these fault zones are heated by deep runoff from the south-southwest to the north-northeast. Due to neotectonic movements, some water in the fault zones is expelled to the surface through joint fractures, while the remainder continues to flow north-northeast along the fault lines [
10].
Current research predominantly focuses on the metamorphic rock region of Shicheng County in the northern part of the basin and the volcanic rock region of Xunwu County in the south. However, studies on the geothermal water in the red bed sand conglomerate area of the Huichang Basin are sparse. In recent years, several high-temperature geothermal wells have been drilled continuously in the Huichang Red Bed basin, yet comprehensive analysis of the hydrochemical characteristics and genetic mechanisms of the geothermal system in the fault basin remains insufficient. Consequently, this study utilizes basin structure and geothermal geological conditions to select a representative geothermal field for detailed hydrochemical and isotopic analyses of both geothermal and cold water samples from the area. This approach provides reliable data on heat storage temperature and circulation depth, aiming to elucidate the formation and evolution of geothermal water. The findings offer theoretical support for the development and utilization of geothermal resources in the study area and aid in optimizing target zones for medium-high temperature geothermal exploration.
2. Geological and Hydrological Settings
The research area encompasses Ruijin, Huichang, and Xunwu counties within Ganzhou City, situated at the junction of Guangdong, Fujian, and Jiangxi provinces. The terrain around the perimeter is high and steep, gradually sloping towards the central and southwestern parts of the basin. Geomorphologically, the basin is characterized by rounded mountaintops resembling steamed buns, and the Danxia landscape is prominent on the surface, attributable to the alternating soft and hard layers of the red beds. The basin features well-developed Quaternary Holocene alluvial strata, predominantly consisting of the river's first-order terraces. These terraces, rising 2 to 5 meters above the river level, are flat and expansive, largely occupied by paddy fields.
The study area exhibits relatively complete strata from the Precambrian to the Cretaceous periods, with the Cambrian and Precambrian formations comprising the folded basement in both the northern and southern regions of the basin. Lithologically, the predominant formations consist of metamorphic sandstone and slate, with some affected by later magmatic activity, resulting in the formation of granitic migmatite along contact zones. Magmatic activity in the area is pronounced, particularly evident in the extensive exposure of Yanshanian granites, which are fine-grained biotite granites occurring on the northern and southern peripheries of the basin. These granites, originating from the Late Cretaceous period, intrude into overlying strata and are closely associated with tectonic movements. The orientation of most rock masses aligns with the primary tectonic line of the region, typically trending northeastward. Cretaceous clastic rocks are unconformably overlain by metamorphic clastic rocks and granites. These strata are well-consolidated, with approximately 200 meters of mudstone serving as an effective water-impermeable layer. A structural fracture zone, measuring 10-100 meters wide, separates the Cretaceous clastic rocks from the underlying bedrock. This fracture zone has undergone multiple stages of tectonic activity, resulting in faulting, jointing, and fissuring, which provide conduits for the migration and storage of hot water. These geological features facilitate the formation of vein and layered heat reservoirs.
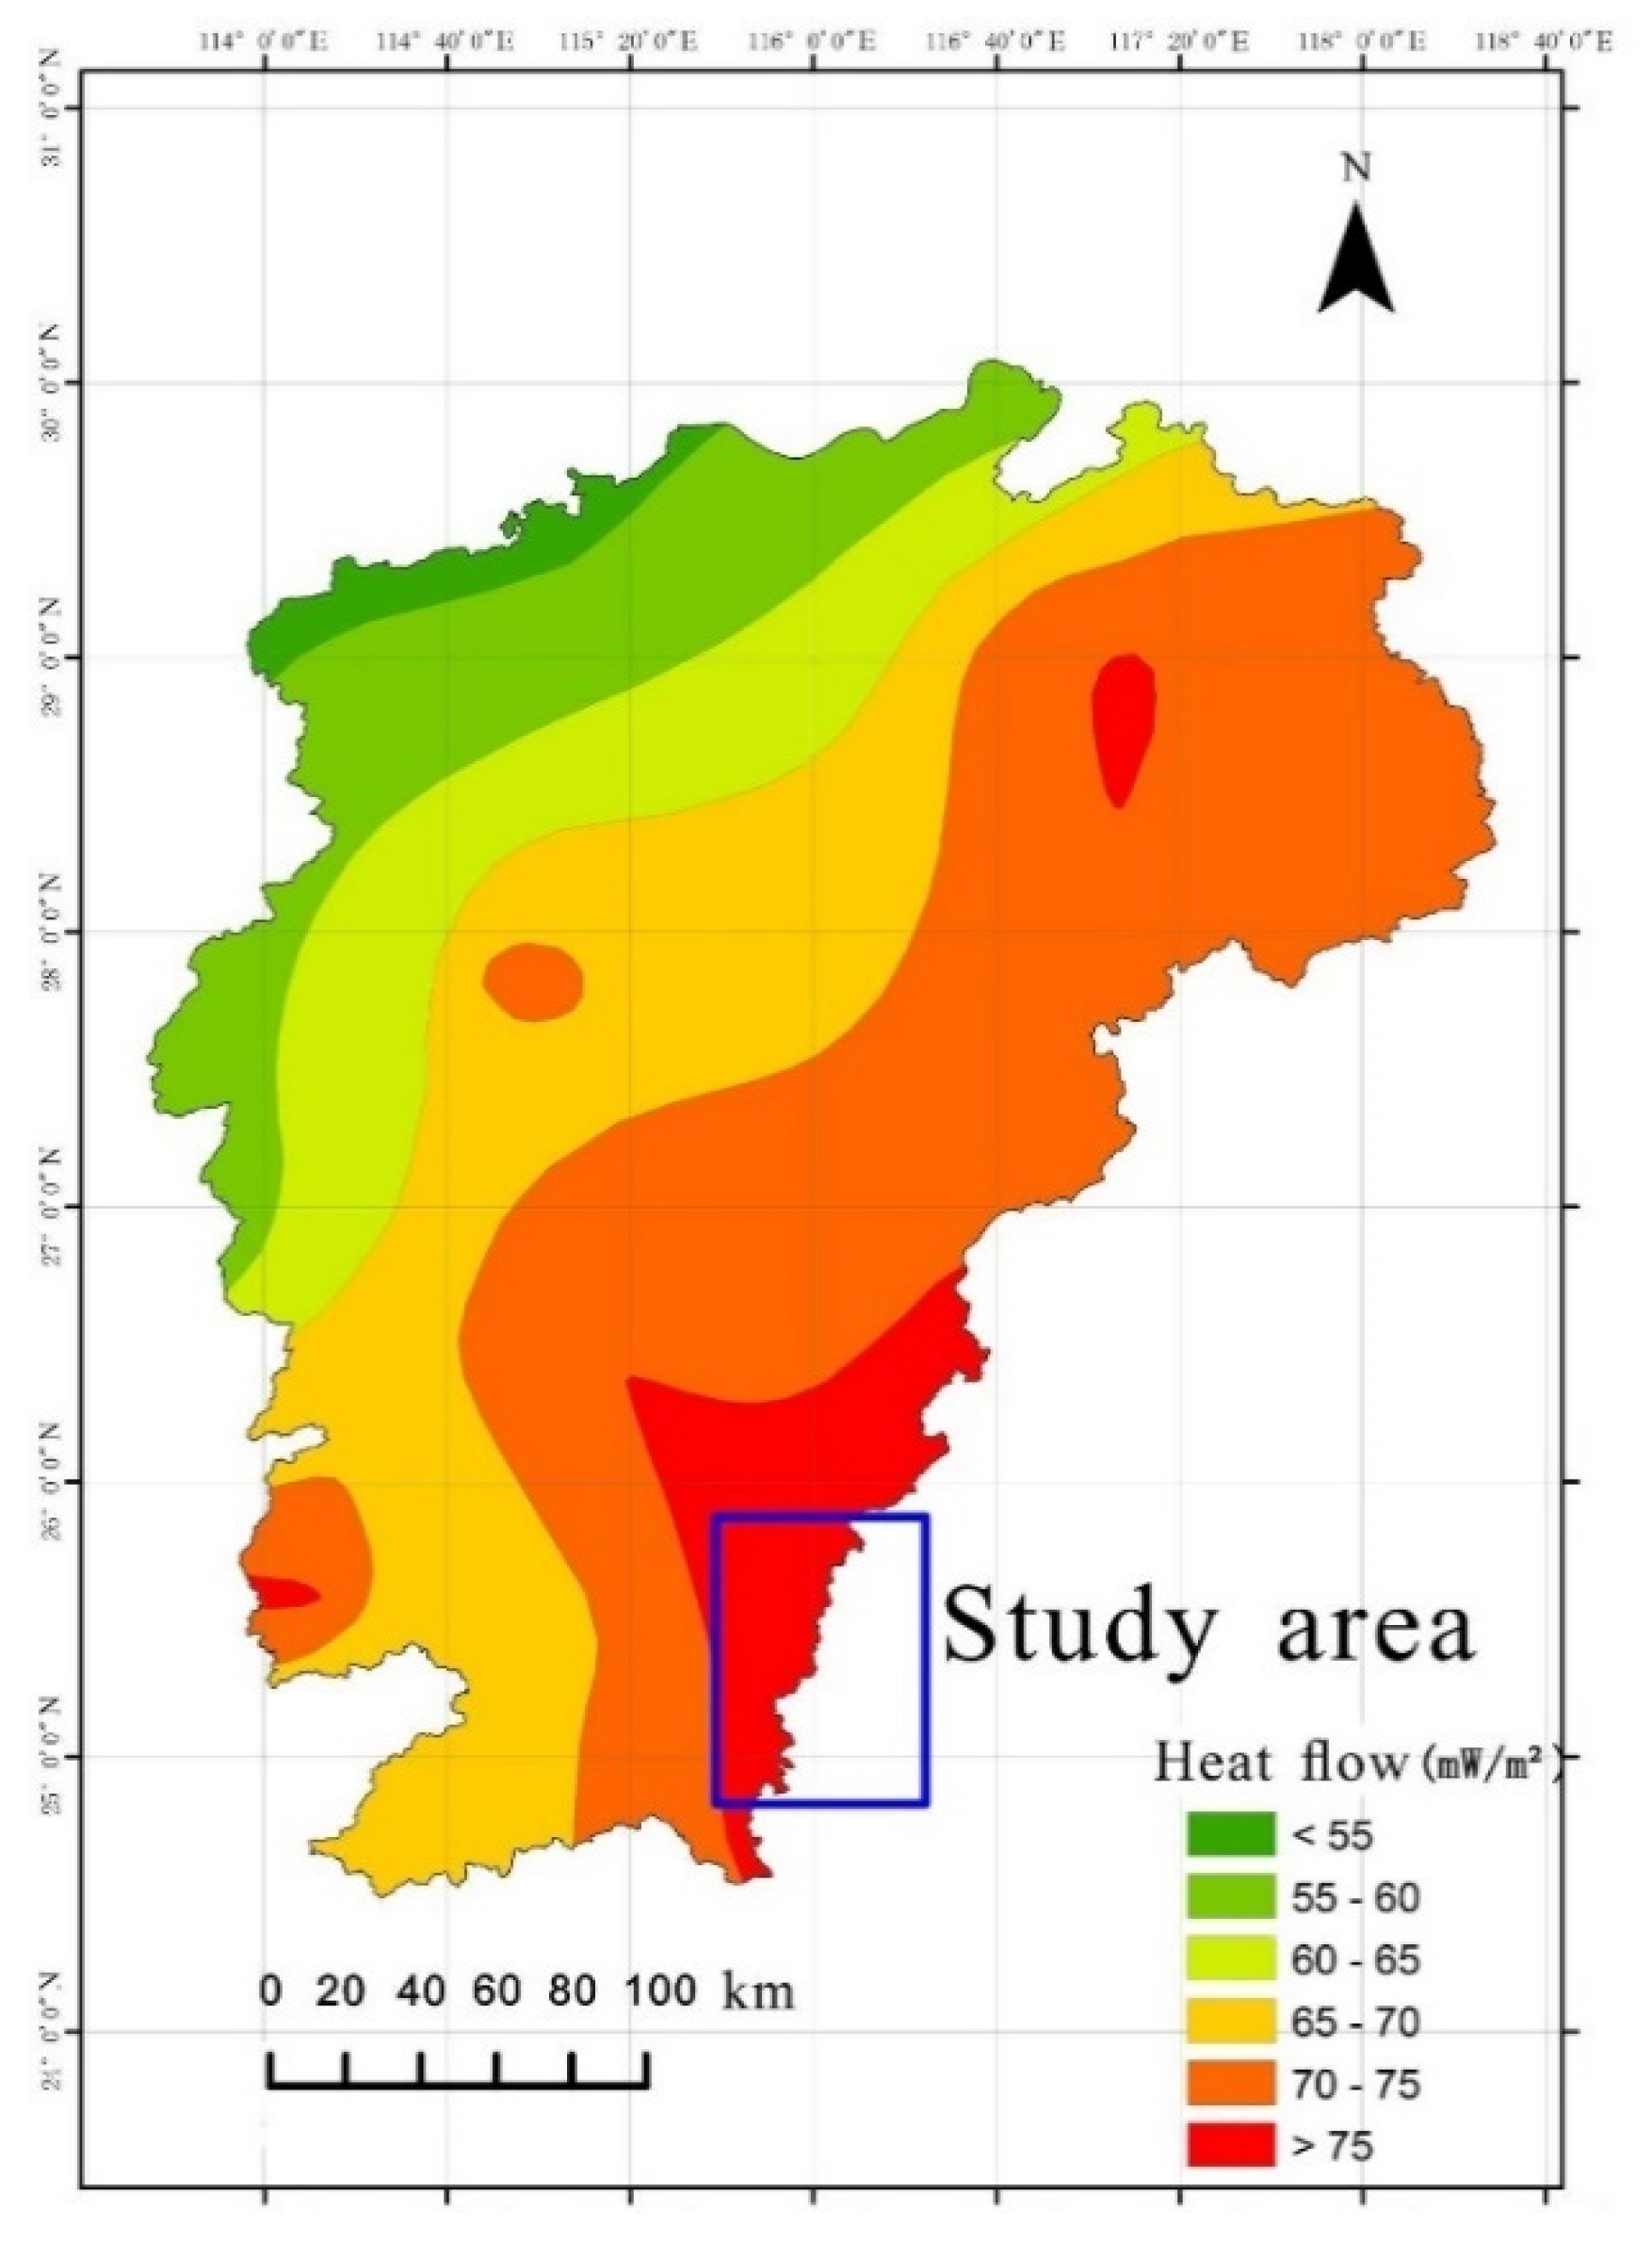
The Huichang shallow hot rise extensional structure centrally located within the tectonic belt envelops the Huichang Basin entirely, exerting control over all geothermal fields in Ruijin City, Huichang County, and the Shangjin geothermal field in northern Xunwu County. The Huichang Basin represents a significant relative uplift of the Moho discontinuity in Jiangxi Province. Within this uplifted region and its periphery, intense heat source material activity and robust tectonic and magmatic activities are observed, culminating in the highest ground heat flow observed in the province within the study area. This scenario ensures an adequate heat source for the groundwater, as depicted in
Figure 1. The Moho discontinuity's depth within the study area is relatively shallow, typically not exceeding 34 km. The transitional zone between mantle uplift and depression constitutes the crust's most fragile and variable segment, particularly the strip mantle slope, which is a critical site for deep crust fault development. The primary thermal control structure in the area aligns with the regional trend, facilitating magma upwelling, subterranean hot water flow, and volcanic activity, while also providing pathways for the migration and accumulation of both deep and shallow source materials. Structurally, under the influence of the main heat-controlling structures on the basin's western margin, fractures in the silicified fracture zone, resulting from several structural failures surrounding the geothermal field, proliferate. The hot water, present in a vein-like form, ascends to the surface via secondary faults. These secondary faults link with the primary fault, enabling atmospheric precipitation to percolate downwards and penetrate deeply into the thermal reservoir. Variations in specific gravity temperatures across different underground regions induce pressure changes, instigating a heat convection cycle. The hot water, having lower specific gravity, ascends and is expelled as hot springs [
11].
3. Materials and Methods
3.1. Water Sample Collection and Testing
In this study, water samples were collected from two geothermal fields in Ruijin City, located on the northern margin of the basin: Anzishan (AZS) and Xiefang (XF). A total of 28 water samples from five representative geothermal fields were obtained, comprising 24 hot water samples and four cold spring samples. These samples were sourced from two geothermal fields in Huichang (BB) and Junmenling (JML), and one in Xunwu (SJ) in the southern part of the basin. Additionally, five water samples for hydrogen and oxygen isotope analysis (including geothermal, surface, rain, and cold spring water) were collected from the Junmenling and Babei geothermal fields, centrally located within the basin. From the Junmenling geothermal field, which has the highest water temperatures, one sample was taken for
14C,
13C, and Sr isotope analysis. Furthermore, two radioactive water samples were collected and analyzed from the Anzishan and Xiefang geothermal fields on the northern edge of the basin. The results are summarized in
Table 1,
Table 2 and
Table 3.
Geothermal water is sourced either from self-emerging springs or geothermal wellheads, while cold spring samples are collected from natural springs that emerge along the silicified fracture zones. Samples are stored in high-density polyethylene bottles with sealed plastic screw caps. The collection and processing of water samples adhere to the Geological Exploration Code for Geothermal Resources of China (GB/T 11615-2010). Comprehensive analyses and trace element samples are sent to the Nanchang Mineral Resources Supervision and Testing Center, under the Ministry of Land and Resources, for testing according to the Inspection Methods for Drinking Natural Mineral Water (GB 8538-2016). Cations (K⁺, Na⁺, Ca²⁺, Mg²⁺, etc.) are analyzed using an inductively coupled plasma emission spectrometer (ICP-OES, Agilent 5110 model). Fluoride and metasilicic acid (H₂SiO₃) concentrations are determined by colorimetric methods, bicarbonate (HCO₃⁻) and chloride (Cl⁻) via titration, and sulfate (SO₄²⁻) through gravimetric analysis. Isotopic and radioactive elements are measured using a liquid scintillation analyzer (PE 1220 QUANTULUS) at the Test Research Center of the Jiangxi Provincial Bureau of Nuclear Industry Geology.
3.2. Geothermometry and Multi-Mineral Equilibrium Graphical Method
Geothermometers and multimineral equilibrium diagrams are commonly employed to assess the thermal storage temperature of deep geothermal waters. The prevalent geothermometers include the cationic and silica temperature scales. The cationic temperature scale calculates the thermal storage temperature by leveraging the relationship between cation ratios in hydrothermal compositions and temperature, serving as an empirical approximation method [
12,
13]. Conversely, the silica temperature scale is particularly apt for the low geothermal temperature background of the study area due to silica's three distinctive characteristics [
14]: (1) widespread distribution, (2) stable physical and chemical properties with minimal susceptibility to interference, and (3) the ability to maintain a supersaturated state for an extended period upon temperature reduction, especially in geothermal systems below 180°C [
15]. Given the typical behavior of silica in conditions of water and steam loss, it can be differentiated further into quartz temperature scales with and without steam loss, and chalcedony temperature scales. Currently, the formulas for these temperature scales, as utilized by researchers domestically and internationally, are detailed in
Table 4.
The multi-mineral equilibrium diagram method was introduced by Reed and Spycher in 1984. This approach involves selecting common minerals present in geothermal waters and using PHREEQC Version 3 to calculate their saturation indices at various temperatures [
16]. The equilibrium states of these minerals are then determined to estimate geothermal reservoir temperature [
17]. When the saturation indices (SI) of multiple mineral groups simultaneously approximate zero, this temperature corresponds to geothermal reservoir temperature [
18,
19].
3.3. Thermal Cycle Depth
The circulation depth of geothermal water can be estimated using geothermal reservoir temperature and geothermal warming rate, as described by Equation 7 [
25]. In this equation, H represents the circulation depth in meters (m); T denotes geothermal reservoir temperature in degrees Celsius (°C); T0 is the temperature of the thermostatic layer in the study area, calculated by adding 2°C to the annual average temperature of the study area (19.3°C). The geothermal gradient (g), determined from data sourced from China's terrestrial heat flow database and temperature measurements from individual boreholes, is approximately 3.59°C per 100 meters in the study area. The term h represents the depth at normal room temperature, set at 20 meters.
3.4. Isotope Analysis
According to Formulas 10-11, the groundwater recharge elevation can be calculated based on the elevation effect of hydrogen and oxygen isotopes [
26]. The apparent age of geothermal water is determined from the 14C dating results of water samples. By applying thermodynamic equilibrium calculations, the δ13C value of CO₂ in HCO₃⁻ equilibrium within geothermal water can be determined. This analysis allows for the quantitative determination of the CO₂ source in geothermal water, facilitating the evaluation of the geothermal water's depth circulation process [
27]. When equilibrium is reached, the relationship between the δ13C values of HCO₃⁻ and CO₂ at a specified temperature is given by Equation 12, where the first term represents the δ13C value of HCO₃⁻ in geothermal water, the second term represents the δ13C value of CO₂ in equilibrium with HCO₃⁻ in geothermal water, and T denotes the temperature of the geothermal water. Using the isotope mass conservation theorem, the proportions of biogenic contributions and contributions from mid- and deep-mantle sources can be calculated as shown in Equation 13. Here, p represents the proportion of biogenic CO₂ (%); the accepted δ13C values for mantle-derived carbon range between -4% and -8%, with a median value of -6.35%. The δ13C value for pure biogenic CO₂ gas is -25%.
4. Results
4.1. Hydrochemical Characteristics
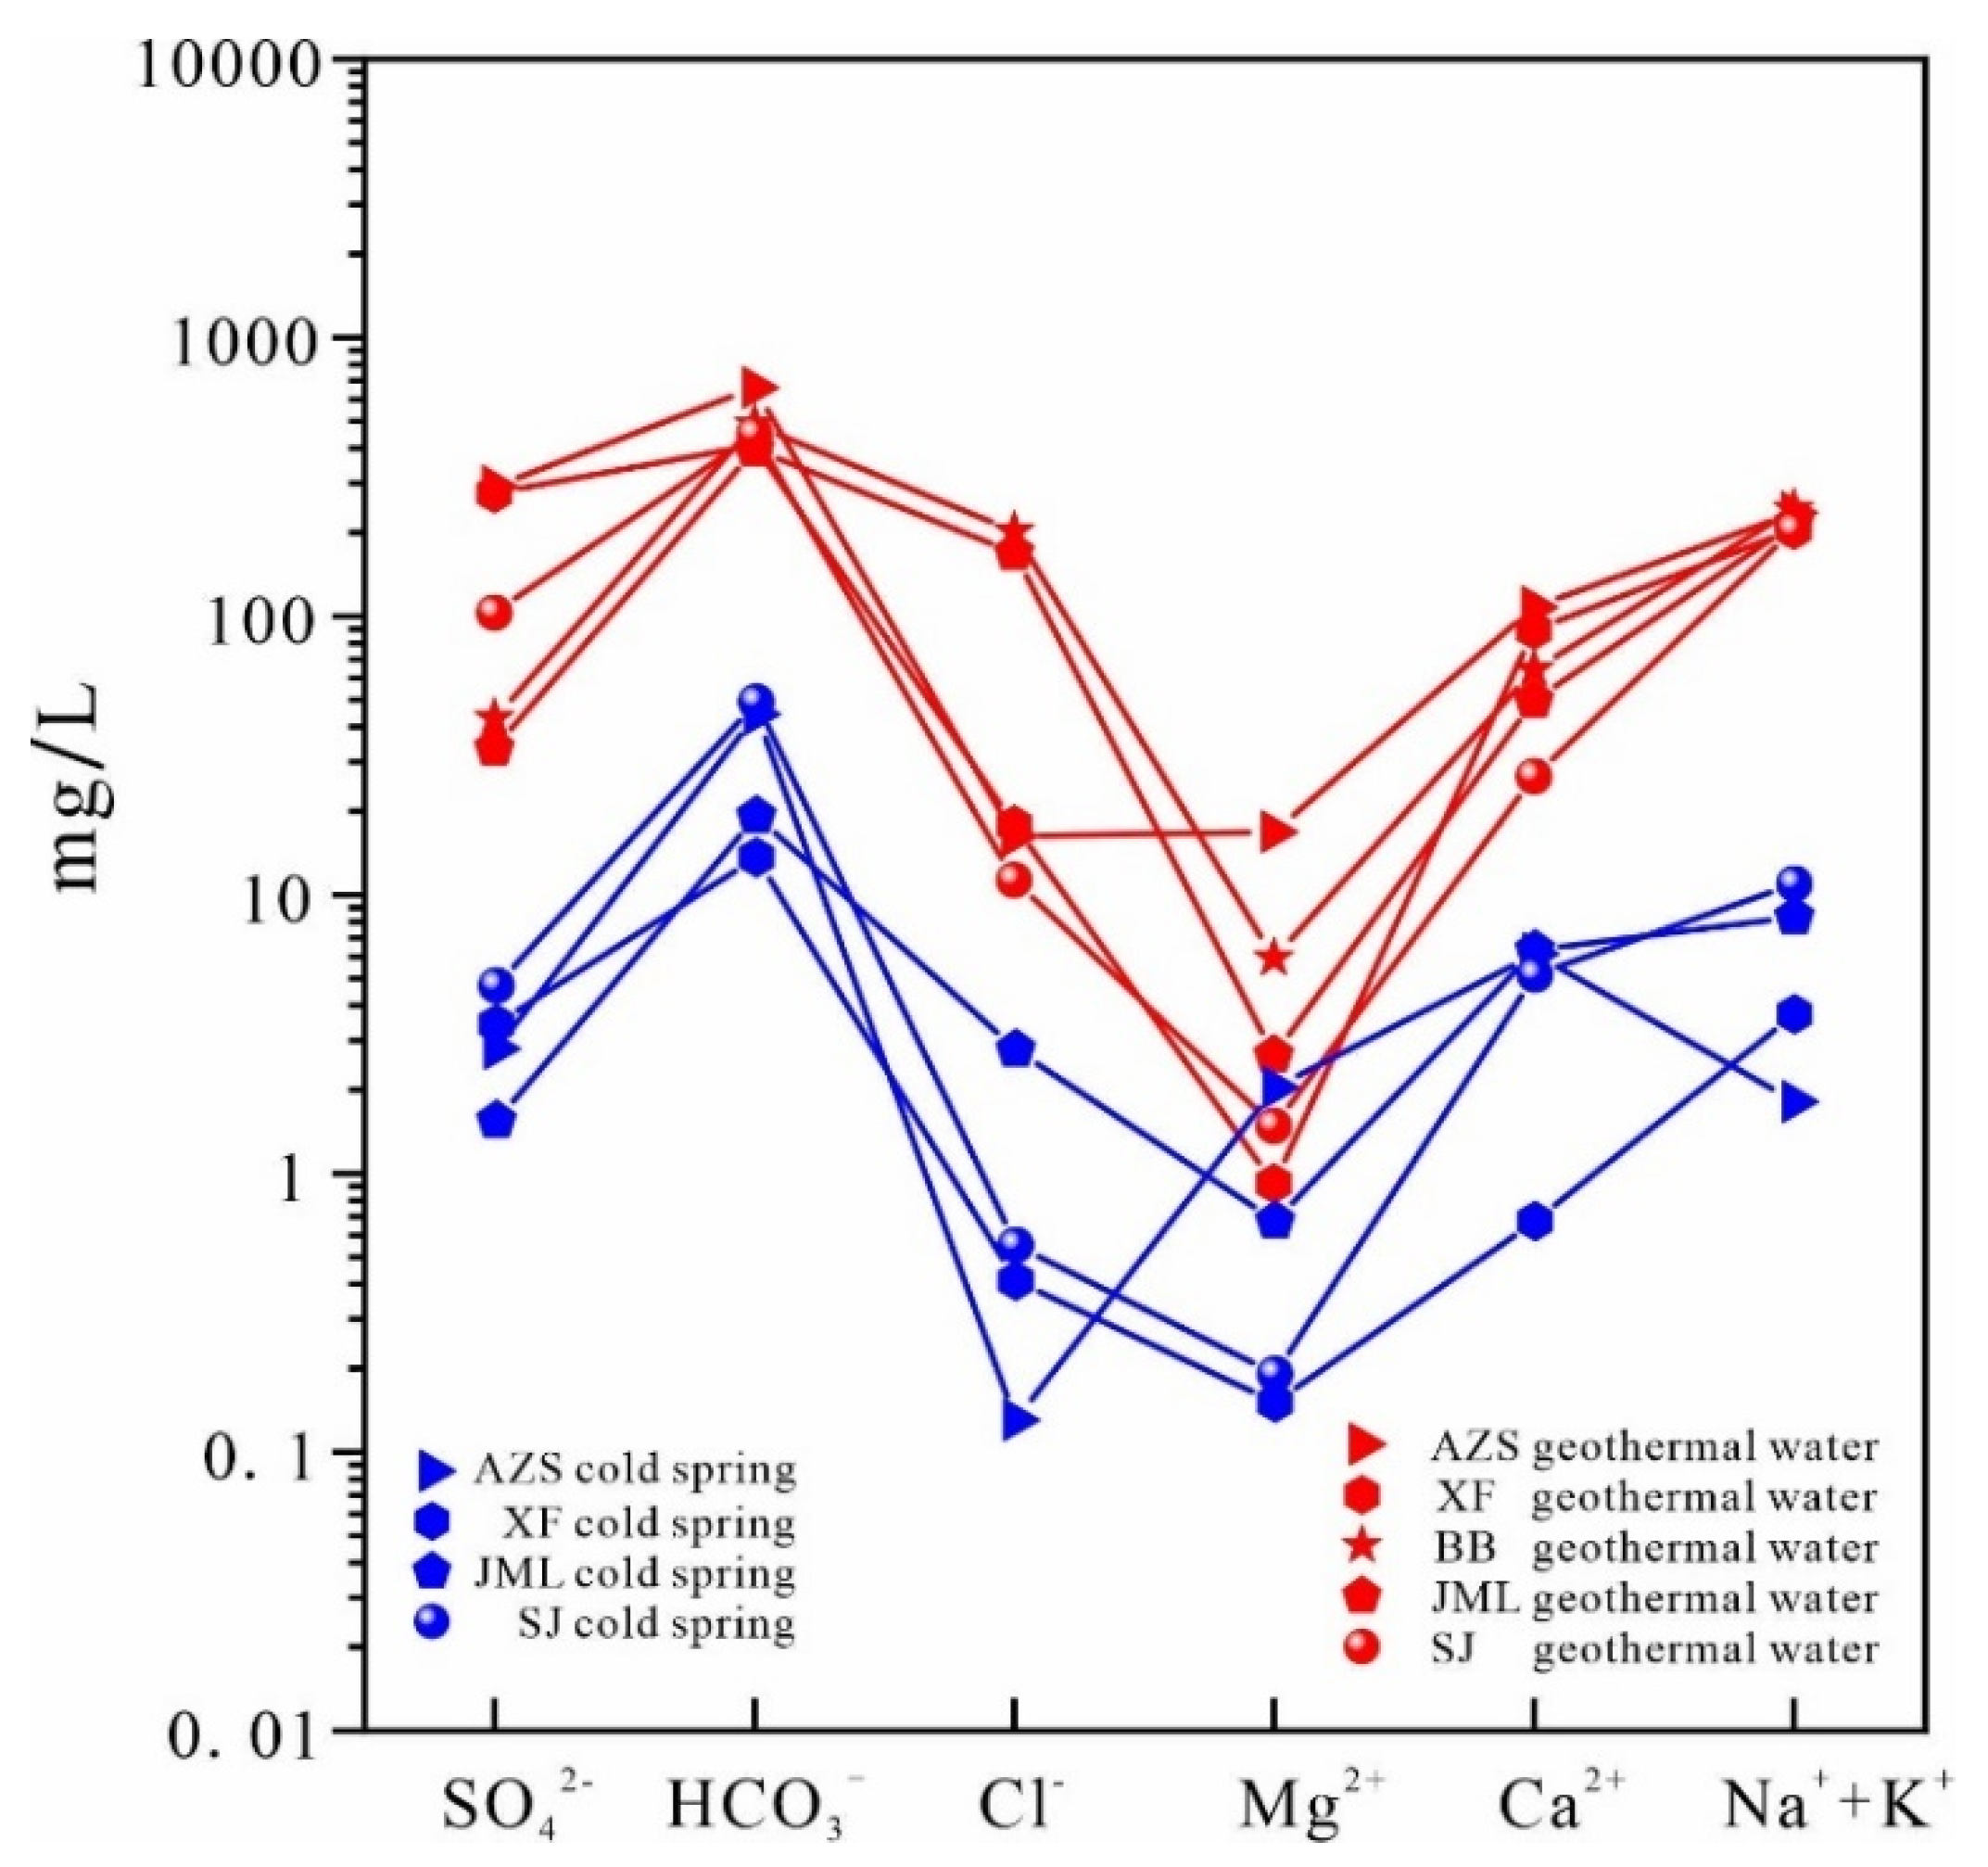
The geothermal water in the study area is enriched with lithium, strontium, metasilicic acid, fluorine, and other trace elements, achieving concentrations typical of physiologically beneficial mineral waters. The ion concentration in geothermal water is significantly higher than in cold springs. In Ruijin Xifang and Anzishan, the dominant cations in the hot water are Na⁺ and Ca²⁺, with Mg²⁺ and K⁺ also present; notably, Mg²⁺ concentrations are higher in Anzishan. The main anions are SO₄²⁻ and HCO₃⁻, with Cl⁻ also detected. In Babei and Junmenling geothermal waters, the prevalent cations are Na⁺, with lower concentrations of Ca²⁺ and K⁺, and even lesser Mg²⁺. HCO₃⁻ is the predominant anion, followed by SO₄²⁻. In contrast, the cationic composition of the cold spring in Anzishan primarily includes Ca²⁺, with lesser amounts of Mg²⁺ and Na⁺, and negligible K⁺. The main anions are HCO₃⁻, followed by Cl⁻ and SO₄²⁻. In Xiefang's cold spring, Na⁺ leads, followed by Ca²⁺ and K⁺ (
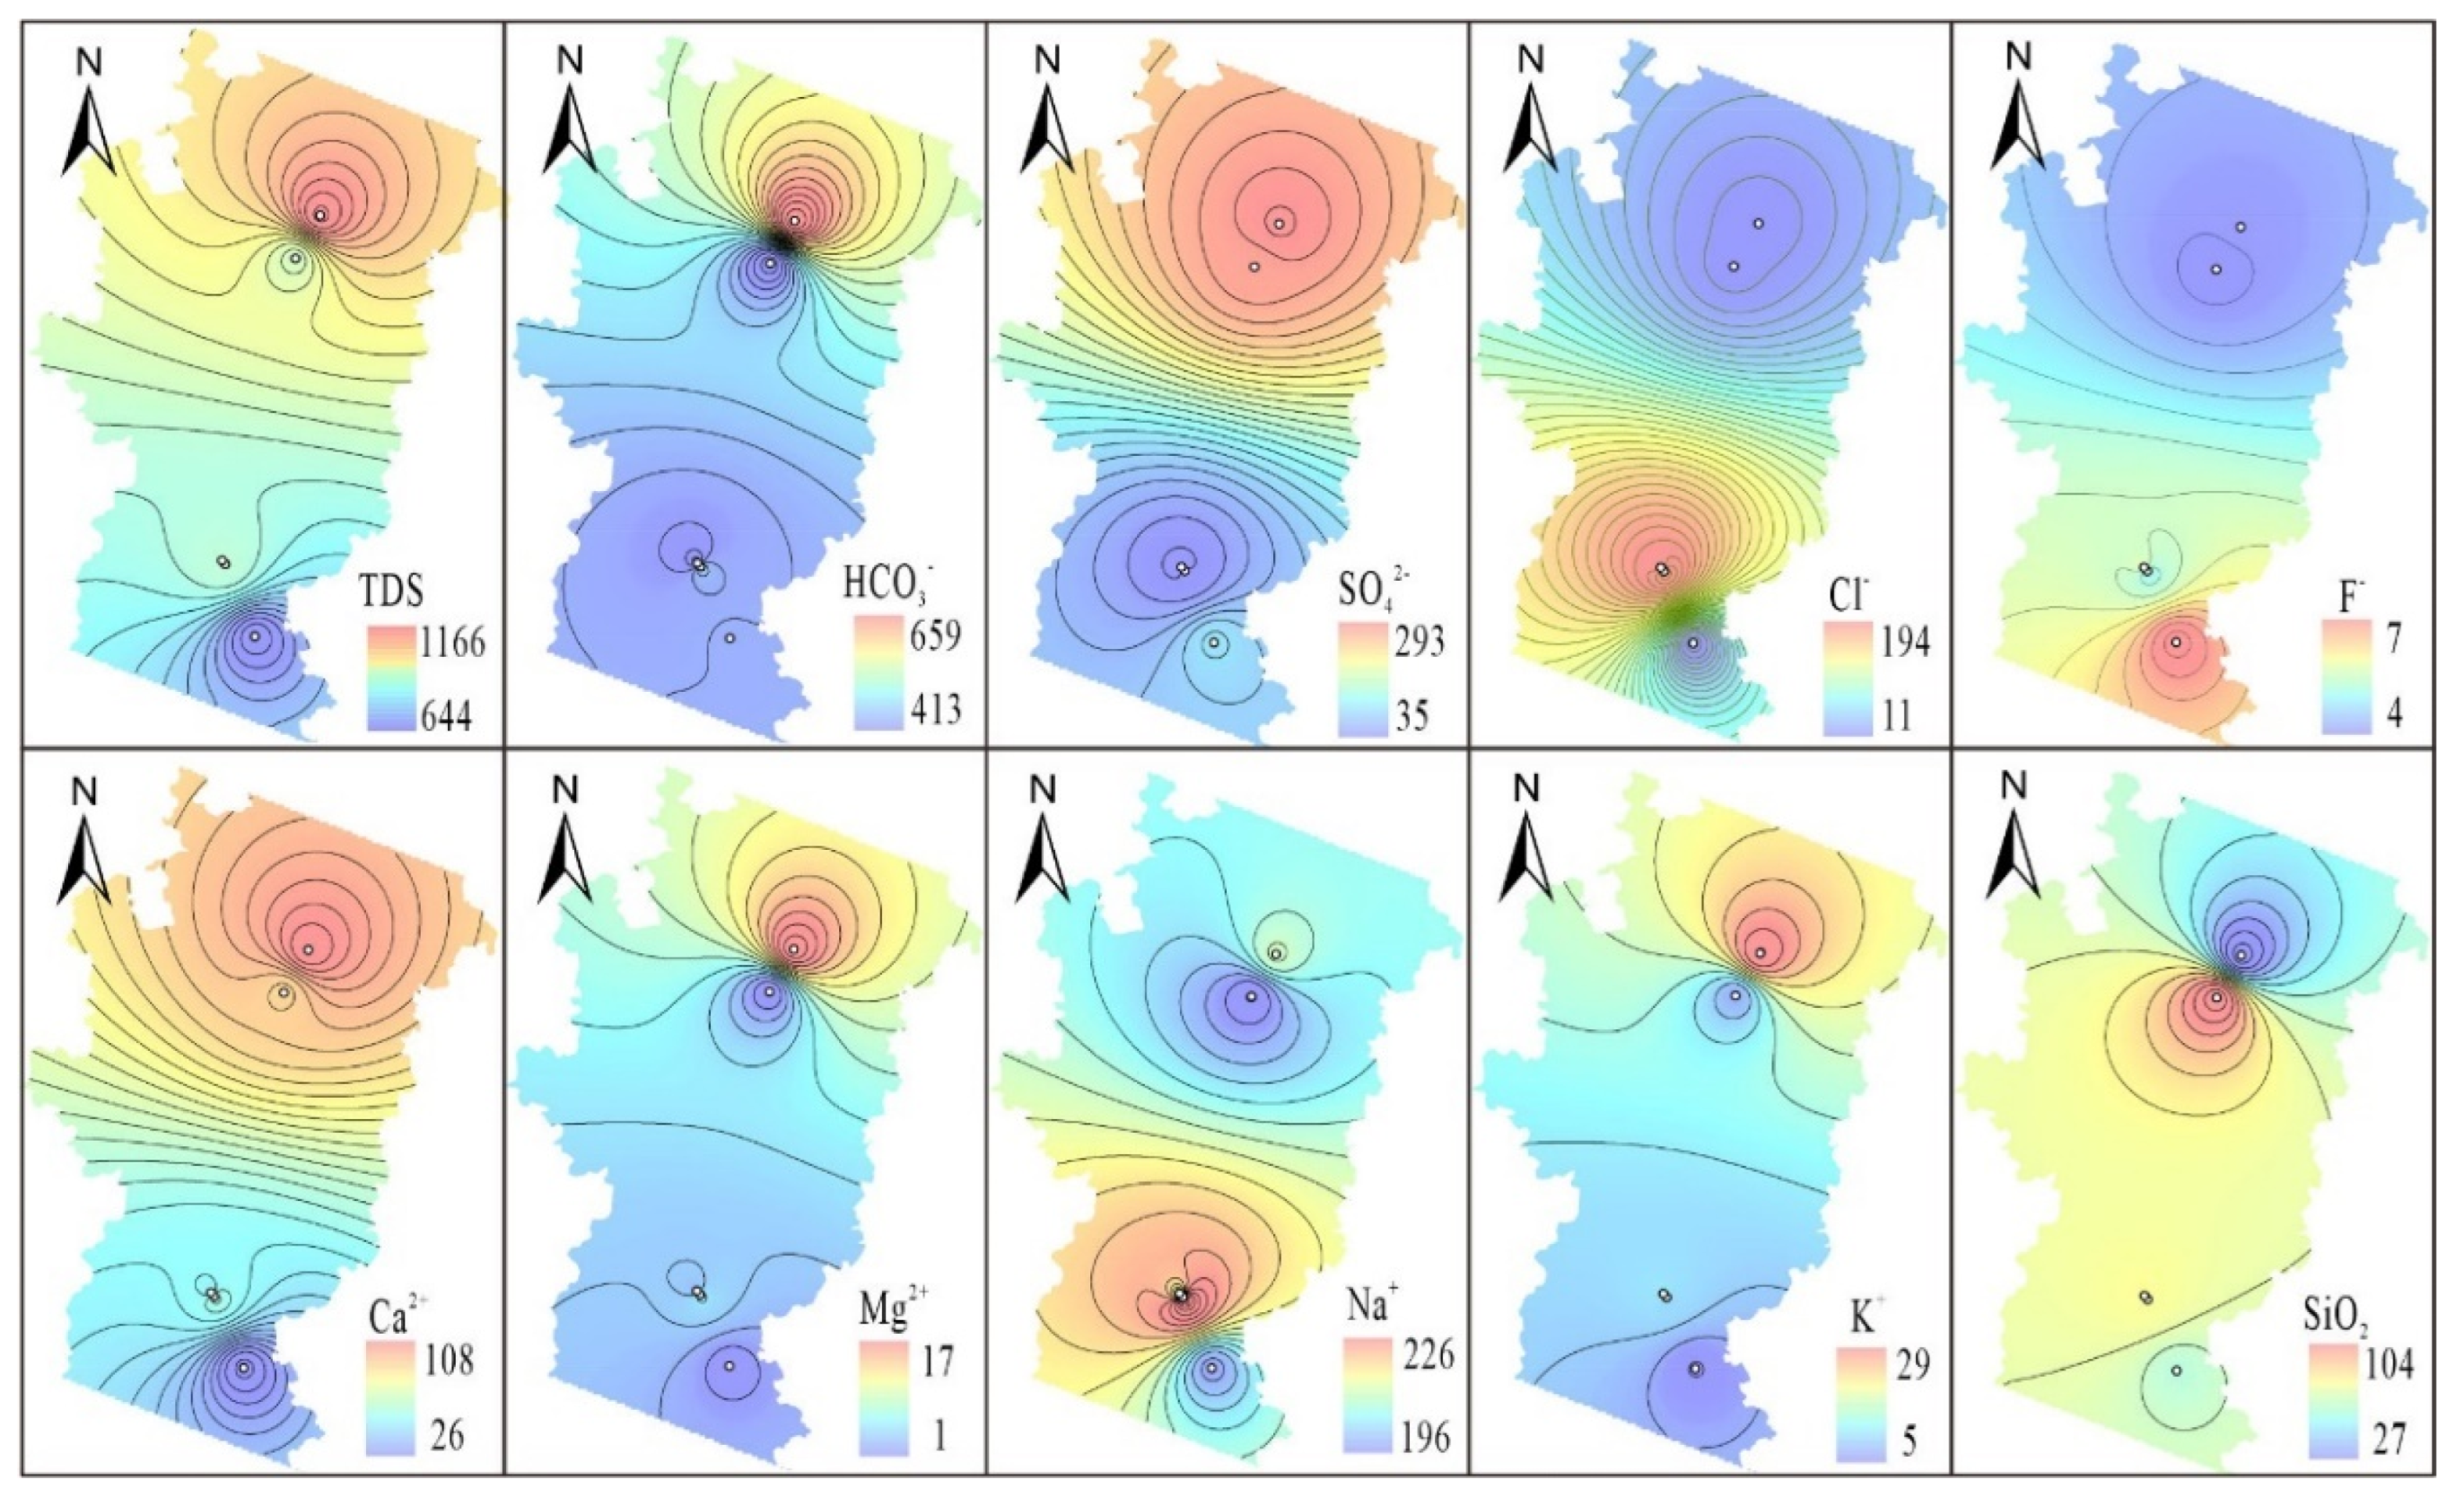
Figure 3). The spatial ion concentration distribution in the Huichang Basin exhibits two patterns: a decrease from north to south and a high concentration core in the basin center that diffuses outward (
Figure 4). The distribution of total dissolved solids (TDS), HCO₃⁻, SO₄²⁻, Ca²⁺, Mg²⁺, and K⁺ diminishes from north to south. The concentrations of Cl⁻ and Na⁺ are highest in the Babei and Junmenling geothermal fields. This suggests that rainwater and cold springs at the basin's edge continually leach rock salt from the Cretaceous conglomerate, culminating in discharge within the basin.
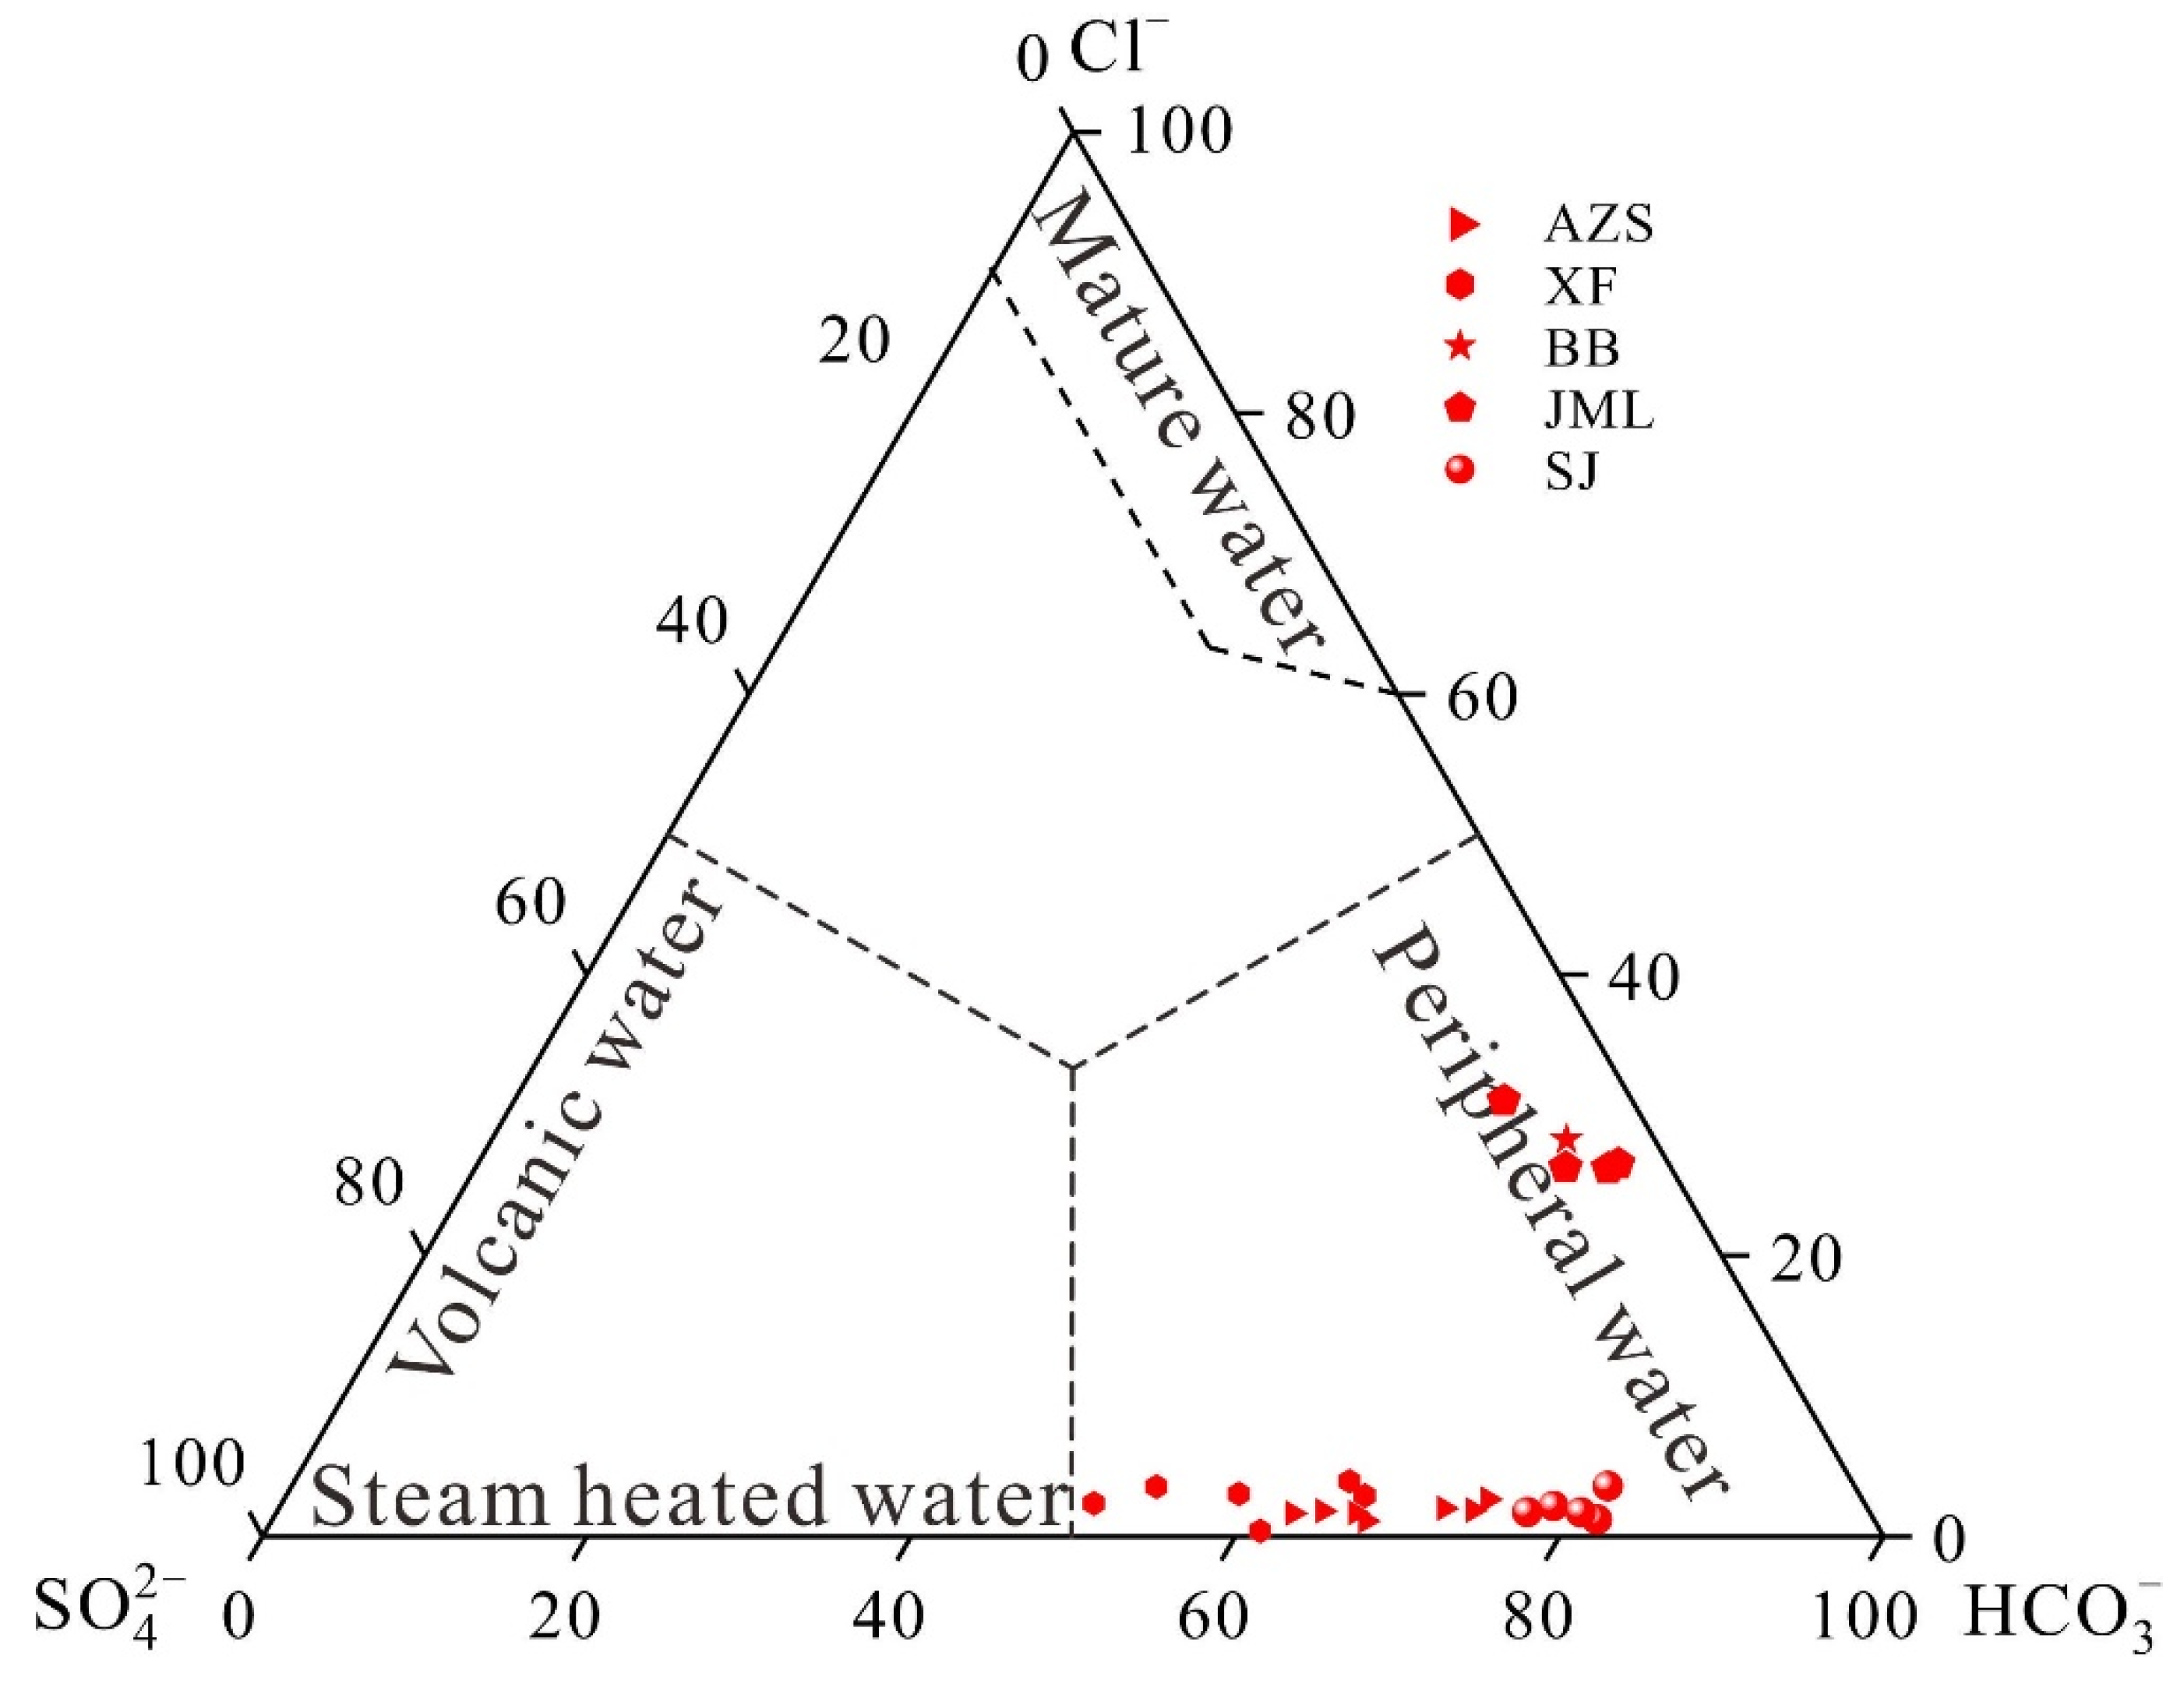
The classical Piper diagram, proposed by Giggenbach in 1988 (
Figure 5), facilitates the rapid and intuitive processing of extensive water chemical data to determine water chemistry types [
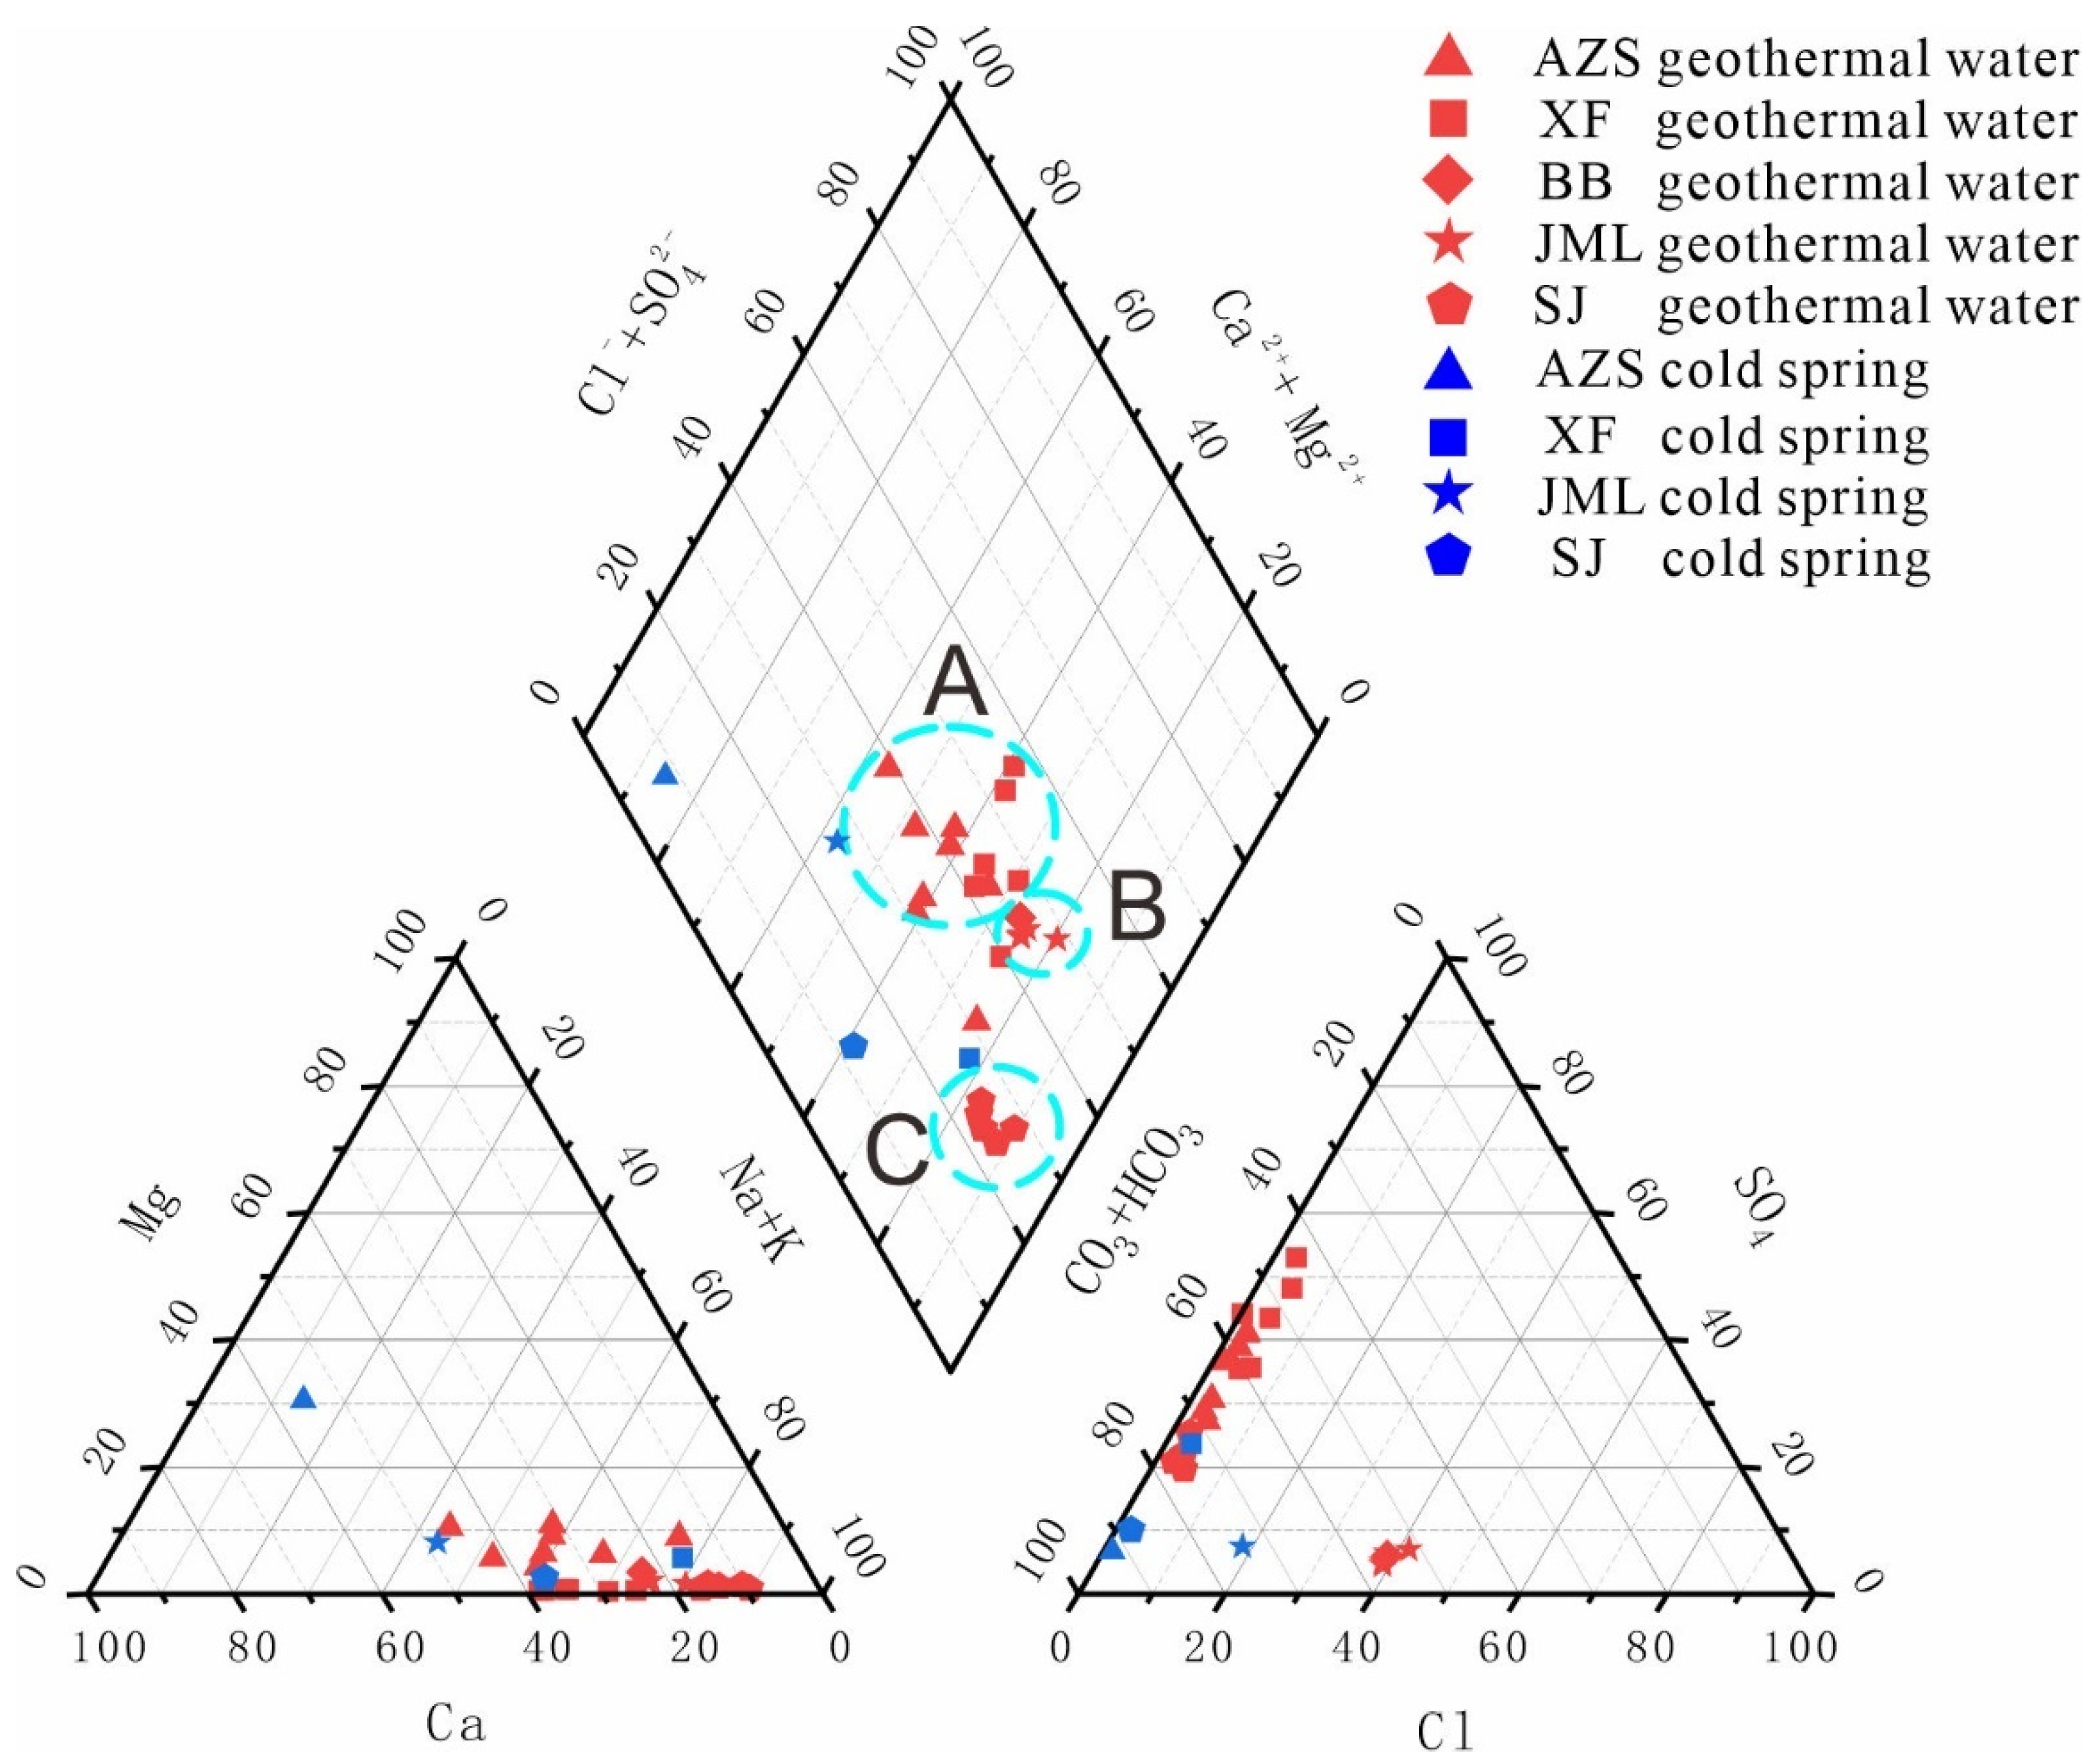
20]. In the geothermal field, all cold spring samples are categorized as either bicarbonate-calcium type or bicarbonate-sodium-calcium type. The hot water samples are classified into three groups: Group A consists of Ruijin Anzishan and Xiefang geothermal fields, noted for being at the uppermost position within the point group and exhibiting the greatest dispersion between points; Group B includes Huichang Babei and Junmenling geothermal fields, located centrally with densely packed points; Group C, the Xunwu Shangjin geothermal field, is positioned at the lower end of the point group and at the southern edge of the basin. The hot water samples across the geothermal fields demonstrate a transitional trend from bicarbonate-sulphate-sodium-calcium type water to bicarbonate-sodium type water [
28]. This shift indicates a progressively increasing proportion of sodium ions, reflecting an intensifying ion exchange from north to south within the basin.
4.2. Geothermal Reservoir Temperature and Cycle Depth
The calculated heat storage temperatures in the study area are presented in
Table 5. Notably, except for the K−Mg temperature scale, the cationic temperature scale generally registers above 150°C, which is significantly higher than the silica temperature scale (42-142°C). The circulation depths determined by the cationic temperature scale range from 2.8 to 7.8 km, indicating substantial variability. Within the silica temperature scale, the quartz temperature scale records the highest heat storage temperatures (80 to 145°C), whereas the chalcedonic temperature scale shows the lowest (30 to 116°C), correlating with circulation depths between 0.46 and 3.49 km.
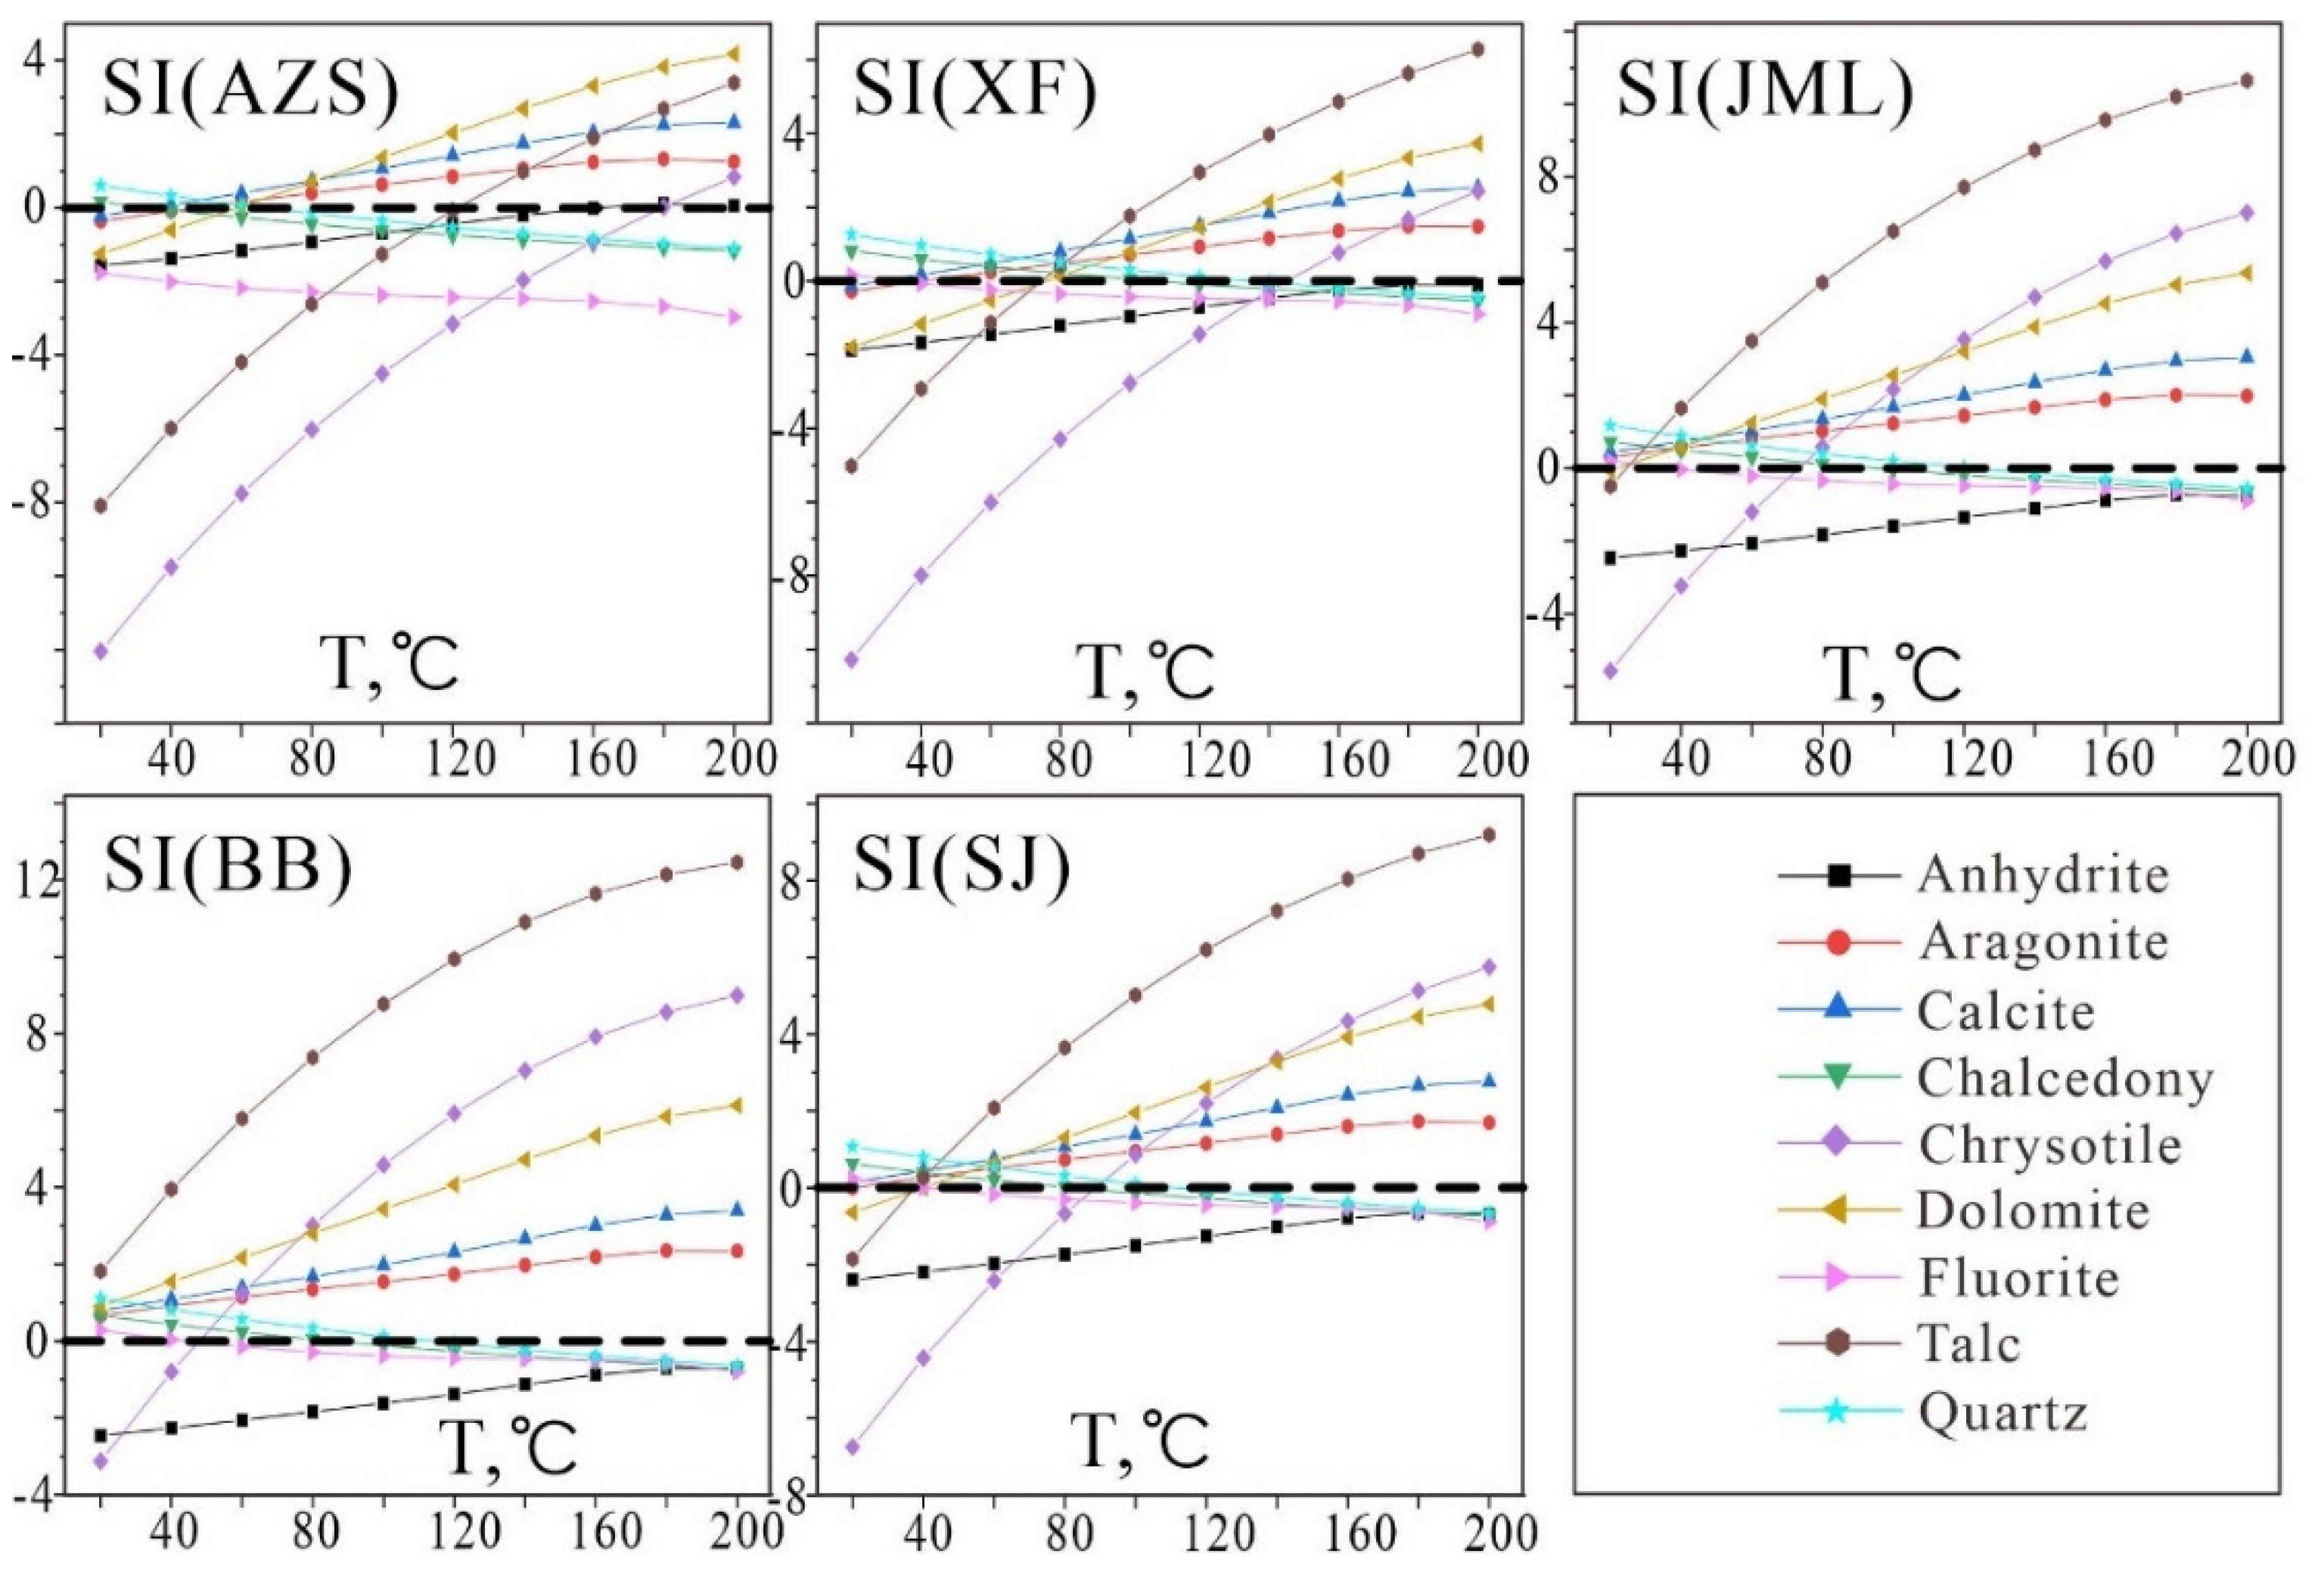
The multi-mineral balance diagram (
Figure 6) reveals that, with the exception of quartz, chalcedony, and fluorite, no multiple minerals in the geothermal field of the study area reach equilibrium simultaneously. This indicates that the application of the multi-mineral equilibrium temperature scale under the current water chemistry data is not optimal and requires adjustment.
4.3. Isotopic Results
The isotopic analyses of hydrogen, oxygen, and carbon indicate that the recharge elevation of geothermal water in the central basin ranges from 448.94 to 828.13 m. After adjusting for the dissolved CO₂ in water, the δ¹³C value of CO₂ (PDB, %) is -9.33, of which 15.97% is attributed to biological carbon and 84.03% to mantle-derived carbon.
Table 6.
The recharge elevation of geothermal field in the center of basin.
Table 6.
The recharge elevation of geothermal field in the center of basin.
| Geothermal field |
Sampling point elevation / m |
Formula 9 / m |
Formula 10 / m |
| JML |
220 |
448.94 |
828.13 |
| BB |
550 |
595.53 |
803.13 |
Table 7.
The calculation results of δ13CCO2 in the center of the basin.
Table 7.
The calculation results of δ13CCO2 in the center of the basin.
| Geothermal field |
Temperature (K) |
δ13CCO2(PDB, %) |
δ13CCO2Biological (PDB,%) |
δ13CCO2Deep parts (PDB,%) |
| JML |
327.15 |
−9.33 |
15.97 |
84.03 |
5. Discussion
5.1. Reliable value of Geothermal Reservoir Temperature and Cycle Depth
The results indicate that the multi-mineral equilibrium diagram method may not accurately determine geothermal reservoir temperature because the deep geothermal water likely cools and precipitates minerals or gases as it ascends through fractures and other geological structures. To address this, it is essential to mitigate the effects of these factors to accurately restore the actual heat storage temperature [
29]. Notably, aluminum, which is typically found in low concentrations within the geothermal system, poses a challenge in terms of precise quantification. Given the constraints of research duration and conditions, hydrochemical analyses of geothermal water often exhibit either absent or inaccurate aluminum data. The presence of numerous aluminosilicate minerals in the study area, such as Albite, K-feldspar, K-mica, and Chlorite, means that the absence of aluminum data significantly affects the formation of these minerals, complicating the establishment of an accurate log (Q/K) and temperature diagram.
This study employs the FixAl method to reestablish the thermal equilibrium state of medium-low temperature geothermal systems [
30]. The FixAl method posits that within a certain temperature range, the activity of aluminum in hot water is governed by an aluminum-containing mineral. The activity coefficient (k) of such a mineral is calculated as follows:
Let Qk=Kk, and take the logarithm of left and right, then:
In the equation, Qk is the activity product of the k-th mineral; ai, k is the activity of the i-th ion component; vm, k is the molar proportion of the i-th ion participating in the reaction; aAl, vAl, and k represent the activity of aluminum, the molar ratio of aluminum in k-th minerals, respectively. From this formulation, it is evident that given the temperature, pH, and hydrochemical analysis results, one can calculate the relationship diagram between the saturation index of water phase components and temperature under various conditions. The diagram produced, termed the FixAl diagram, serves to differentiate it from the conventional log (Q/K) and temperature diagram. In this study, the aluminum concentration value was adjusted for equilibrium between hot water and microcline within a specific temperature range and was utilized in calculating the mineral saturation index.
In addition to aluminum, degassing of geothermal water occurs as it ascends from deep heat storage to surface exposure due to changes in pressure and temperature [
31]. This process releases a significant amount of dissolved CO₂ at the surface, which plays a crucial role in water-rock interactions. To minimize the effects of CO₂ loss, the CO₂ content was measured immediately at the initial sampling in this study. This approach allows for a scientific evaluation of the chemical evolution of deep geothermal fluids as they rise to the surface. The results of the reduction in aluminum concentration and the correction of CO₂ content are presented in
Table 8.
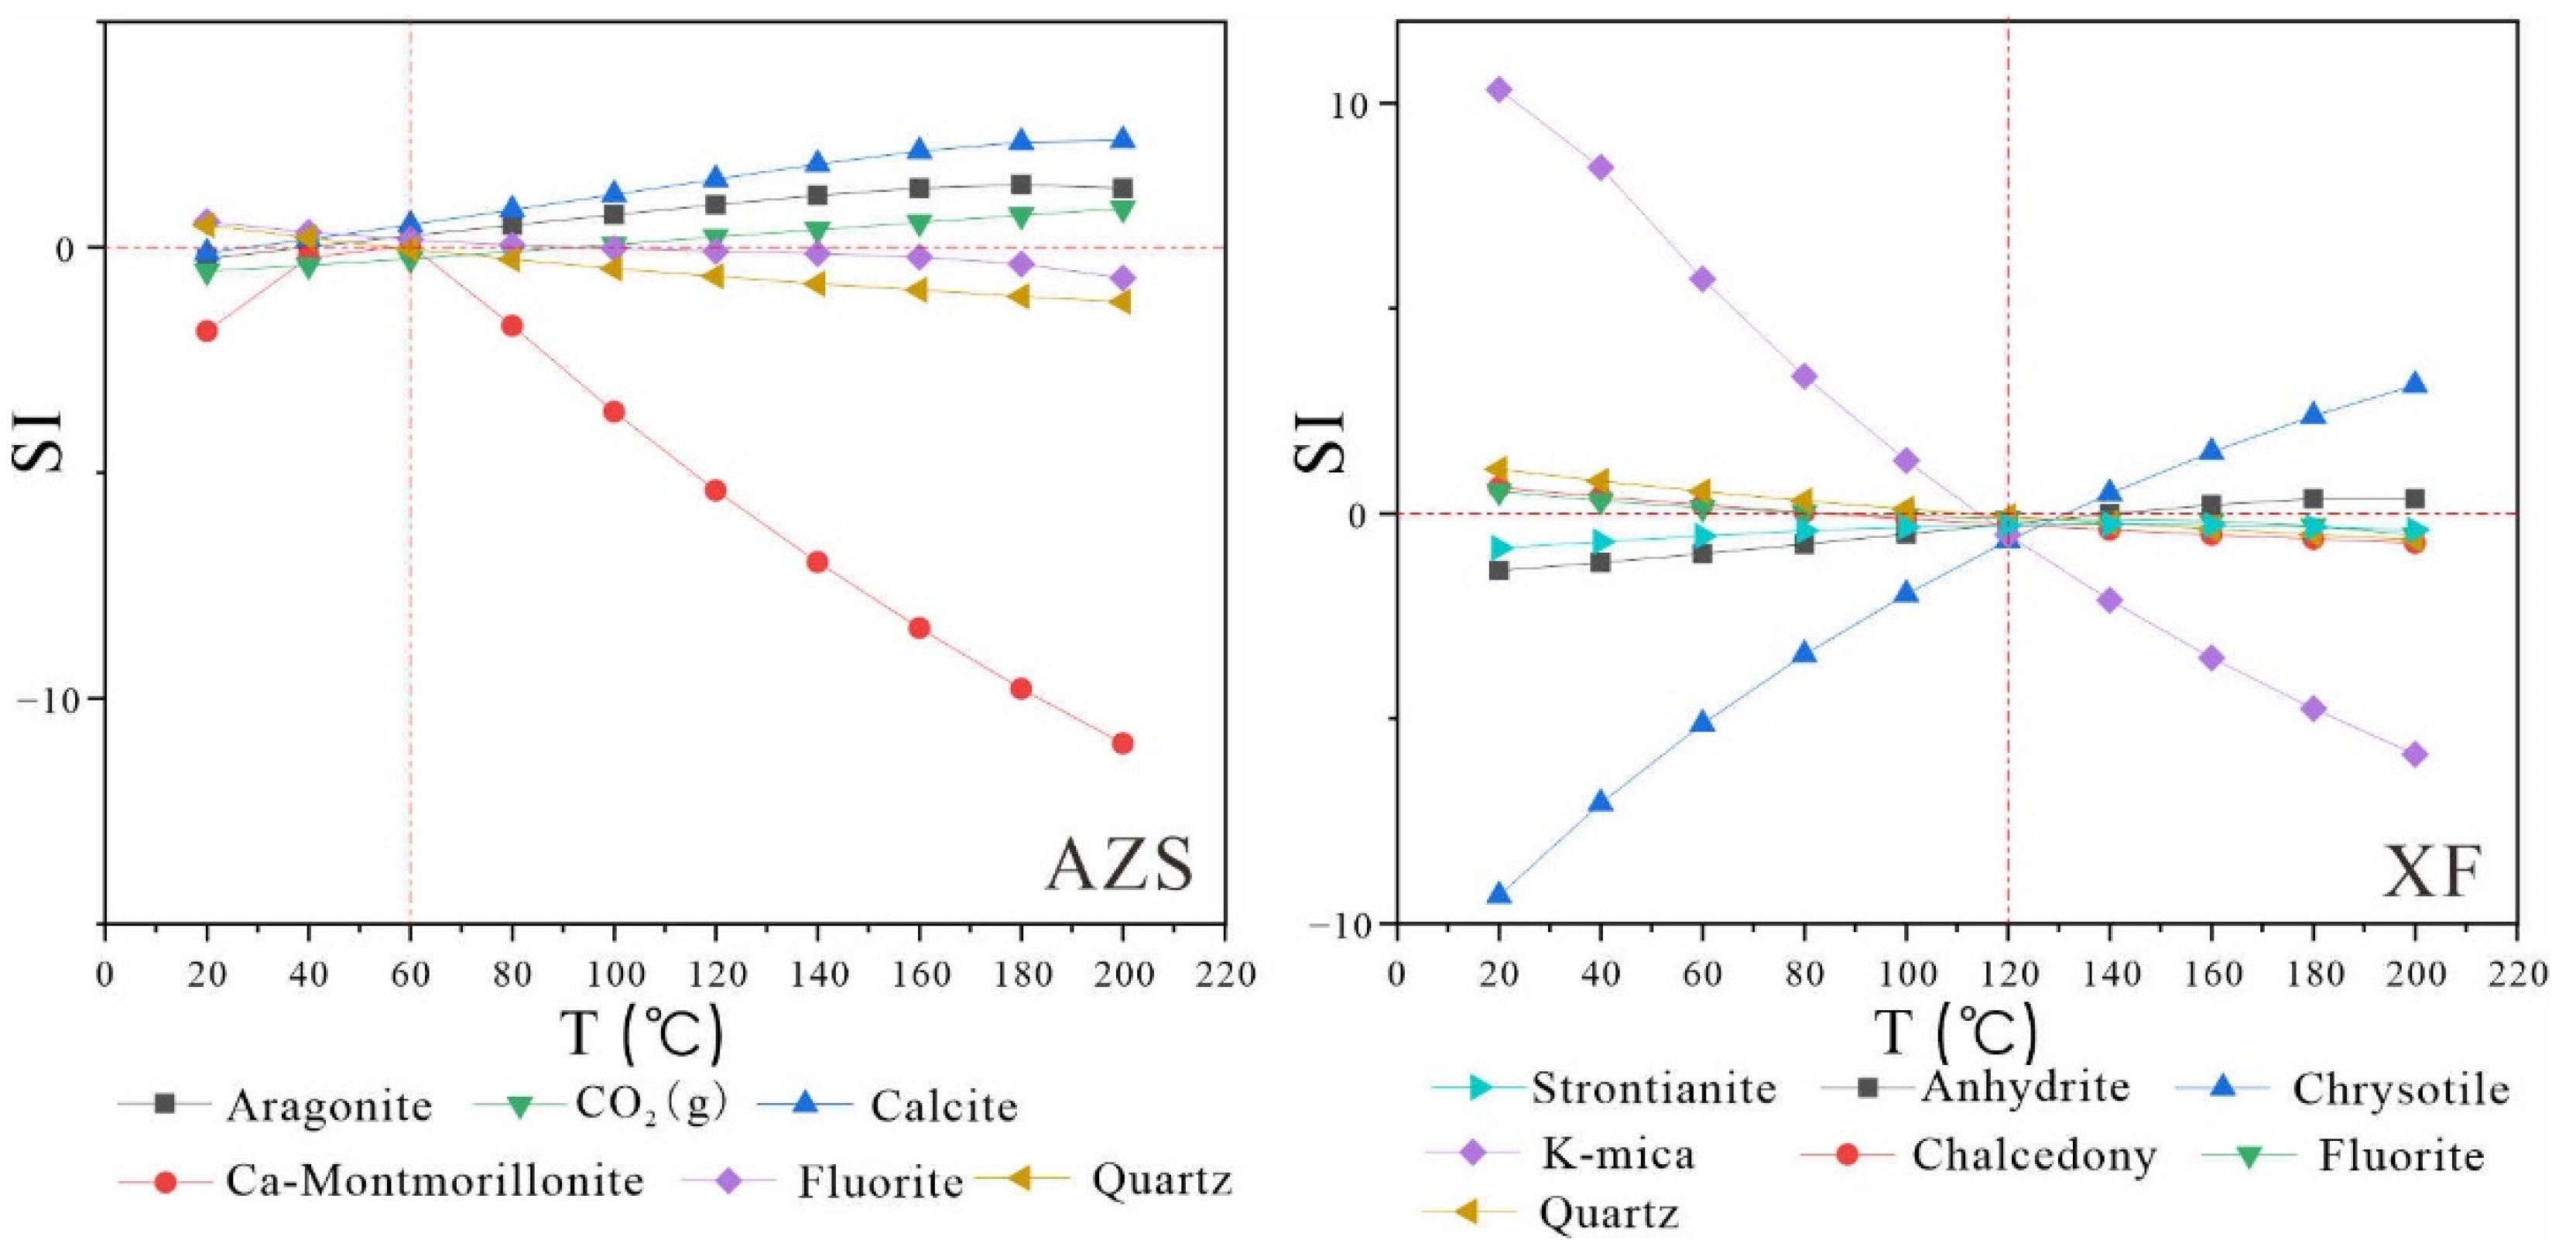
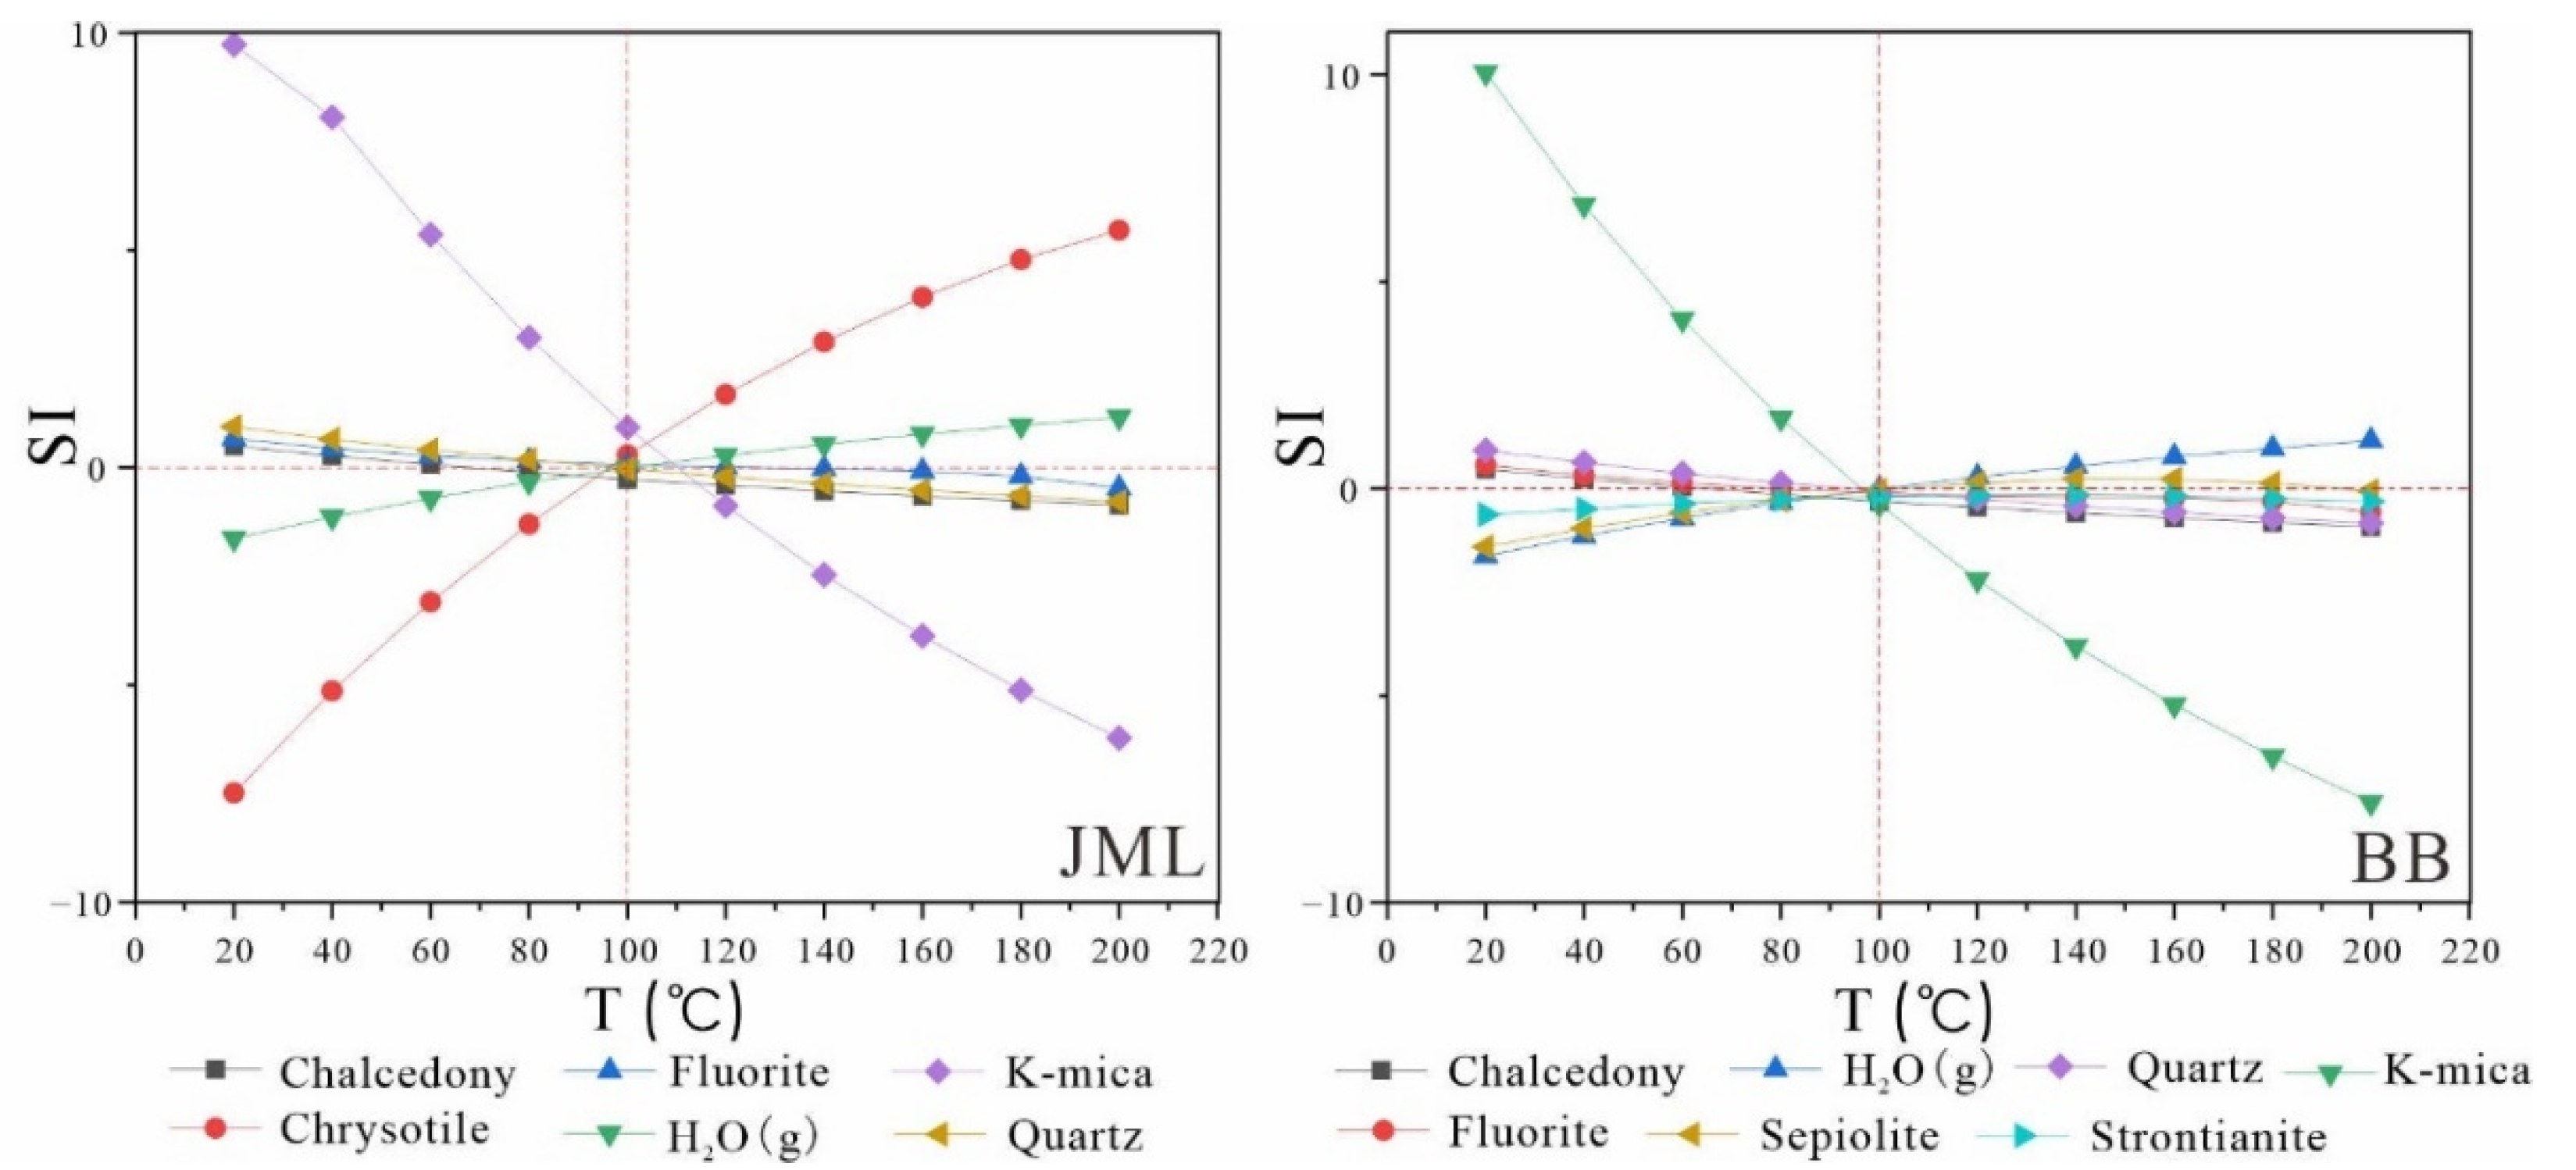
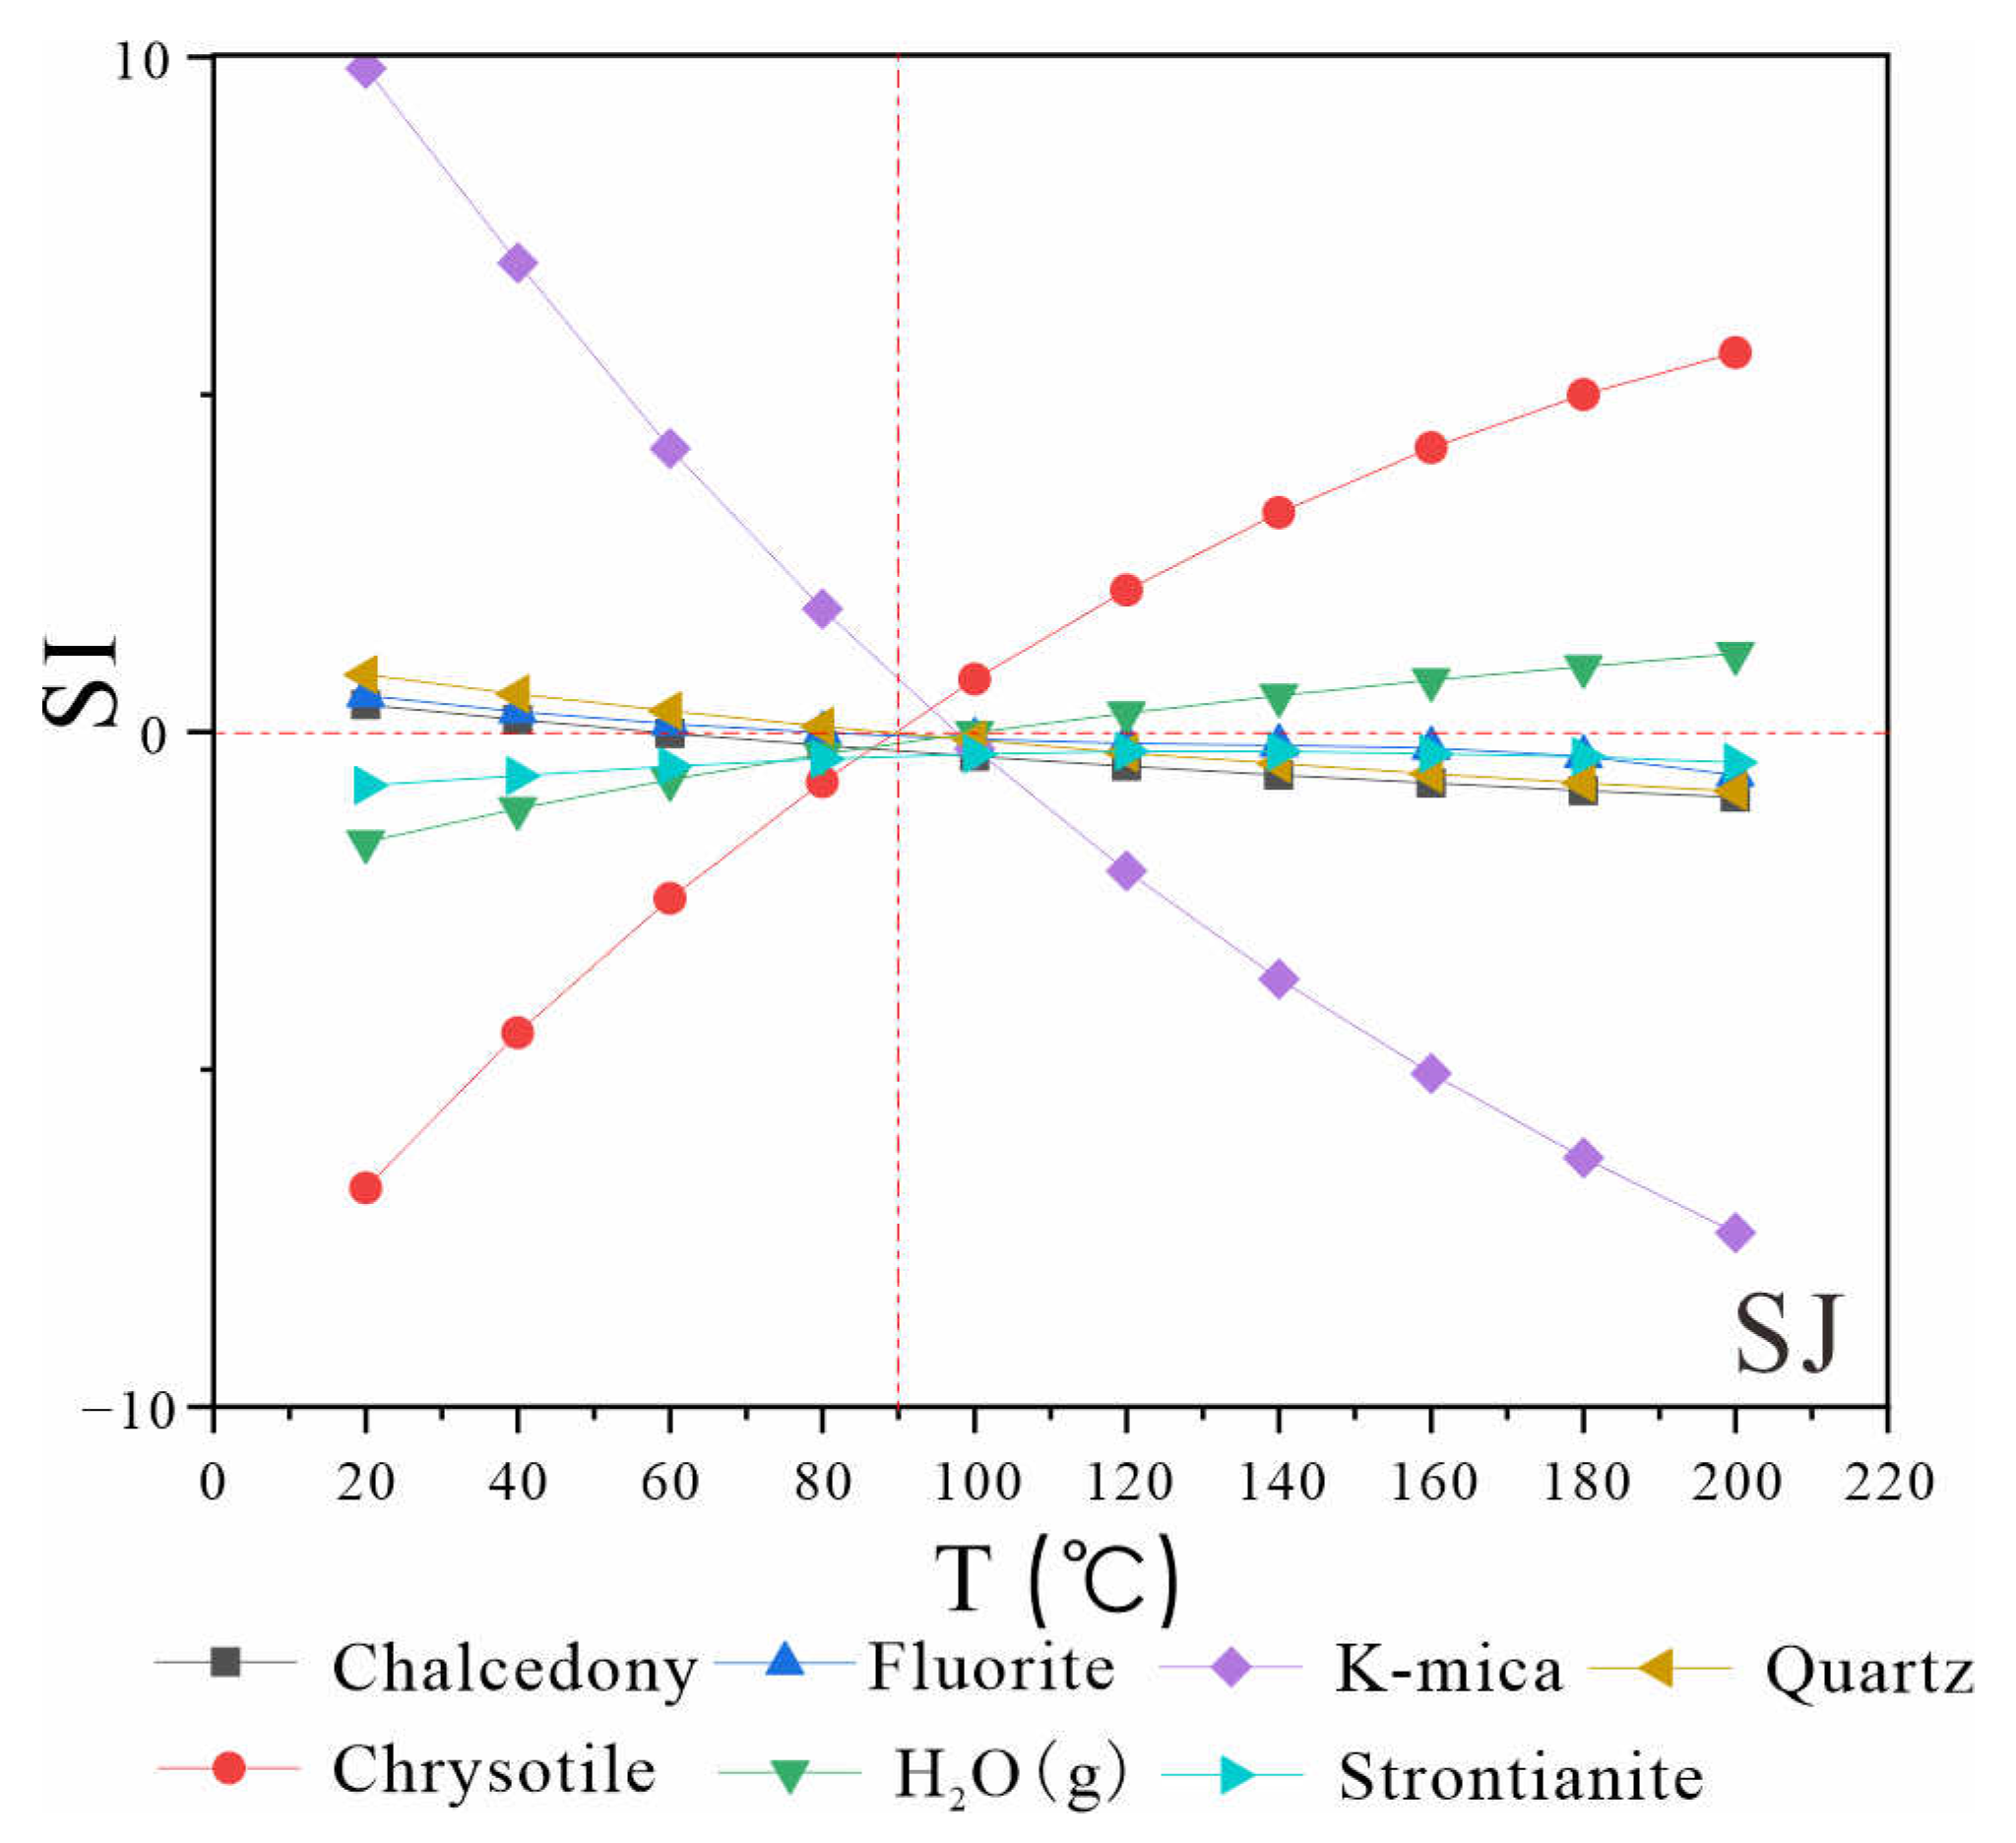
Using the corrected geochemical data of geothermal water, the mineral saturation index was recalculated in PHREEQC based on the "multi-mineral equilibrium temperature scale" method previously described. Subsequently, the saturation index-temperature (SI-T) diagrams were constructed (
Figure 7,
Figure 8 and
Figure 9). The revised mineral saturation index diagrams are noticeably clearer than the original uncorrected versions, providing valuable insights into geothermal reservoir temperature. The outcomes of these recalculations following the correction are summarized in
Table 9.
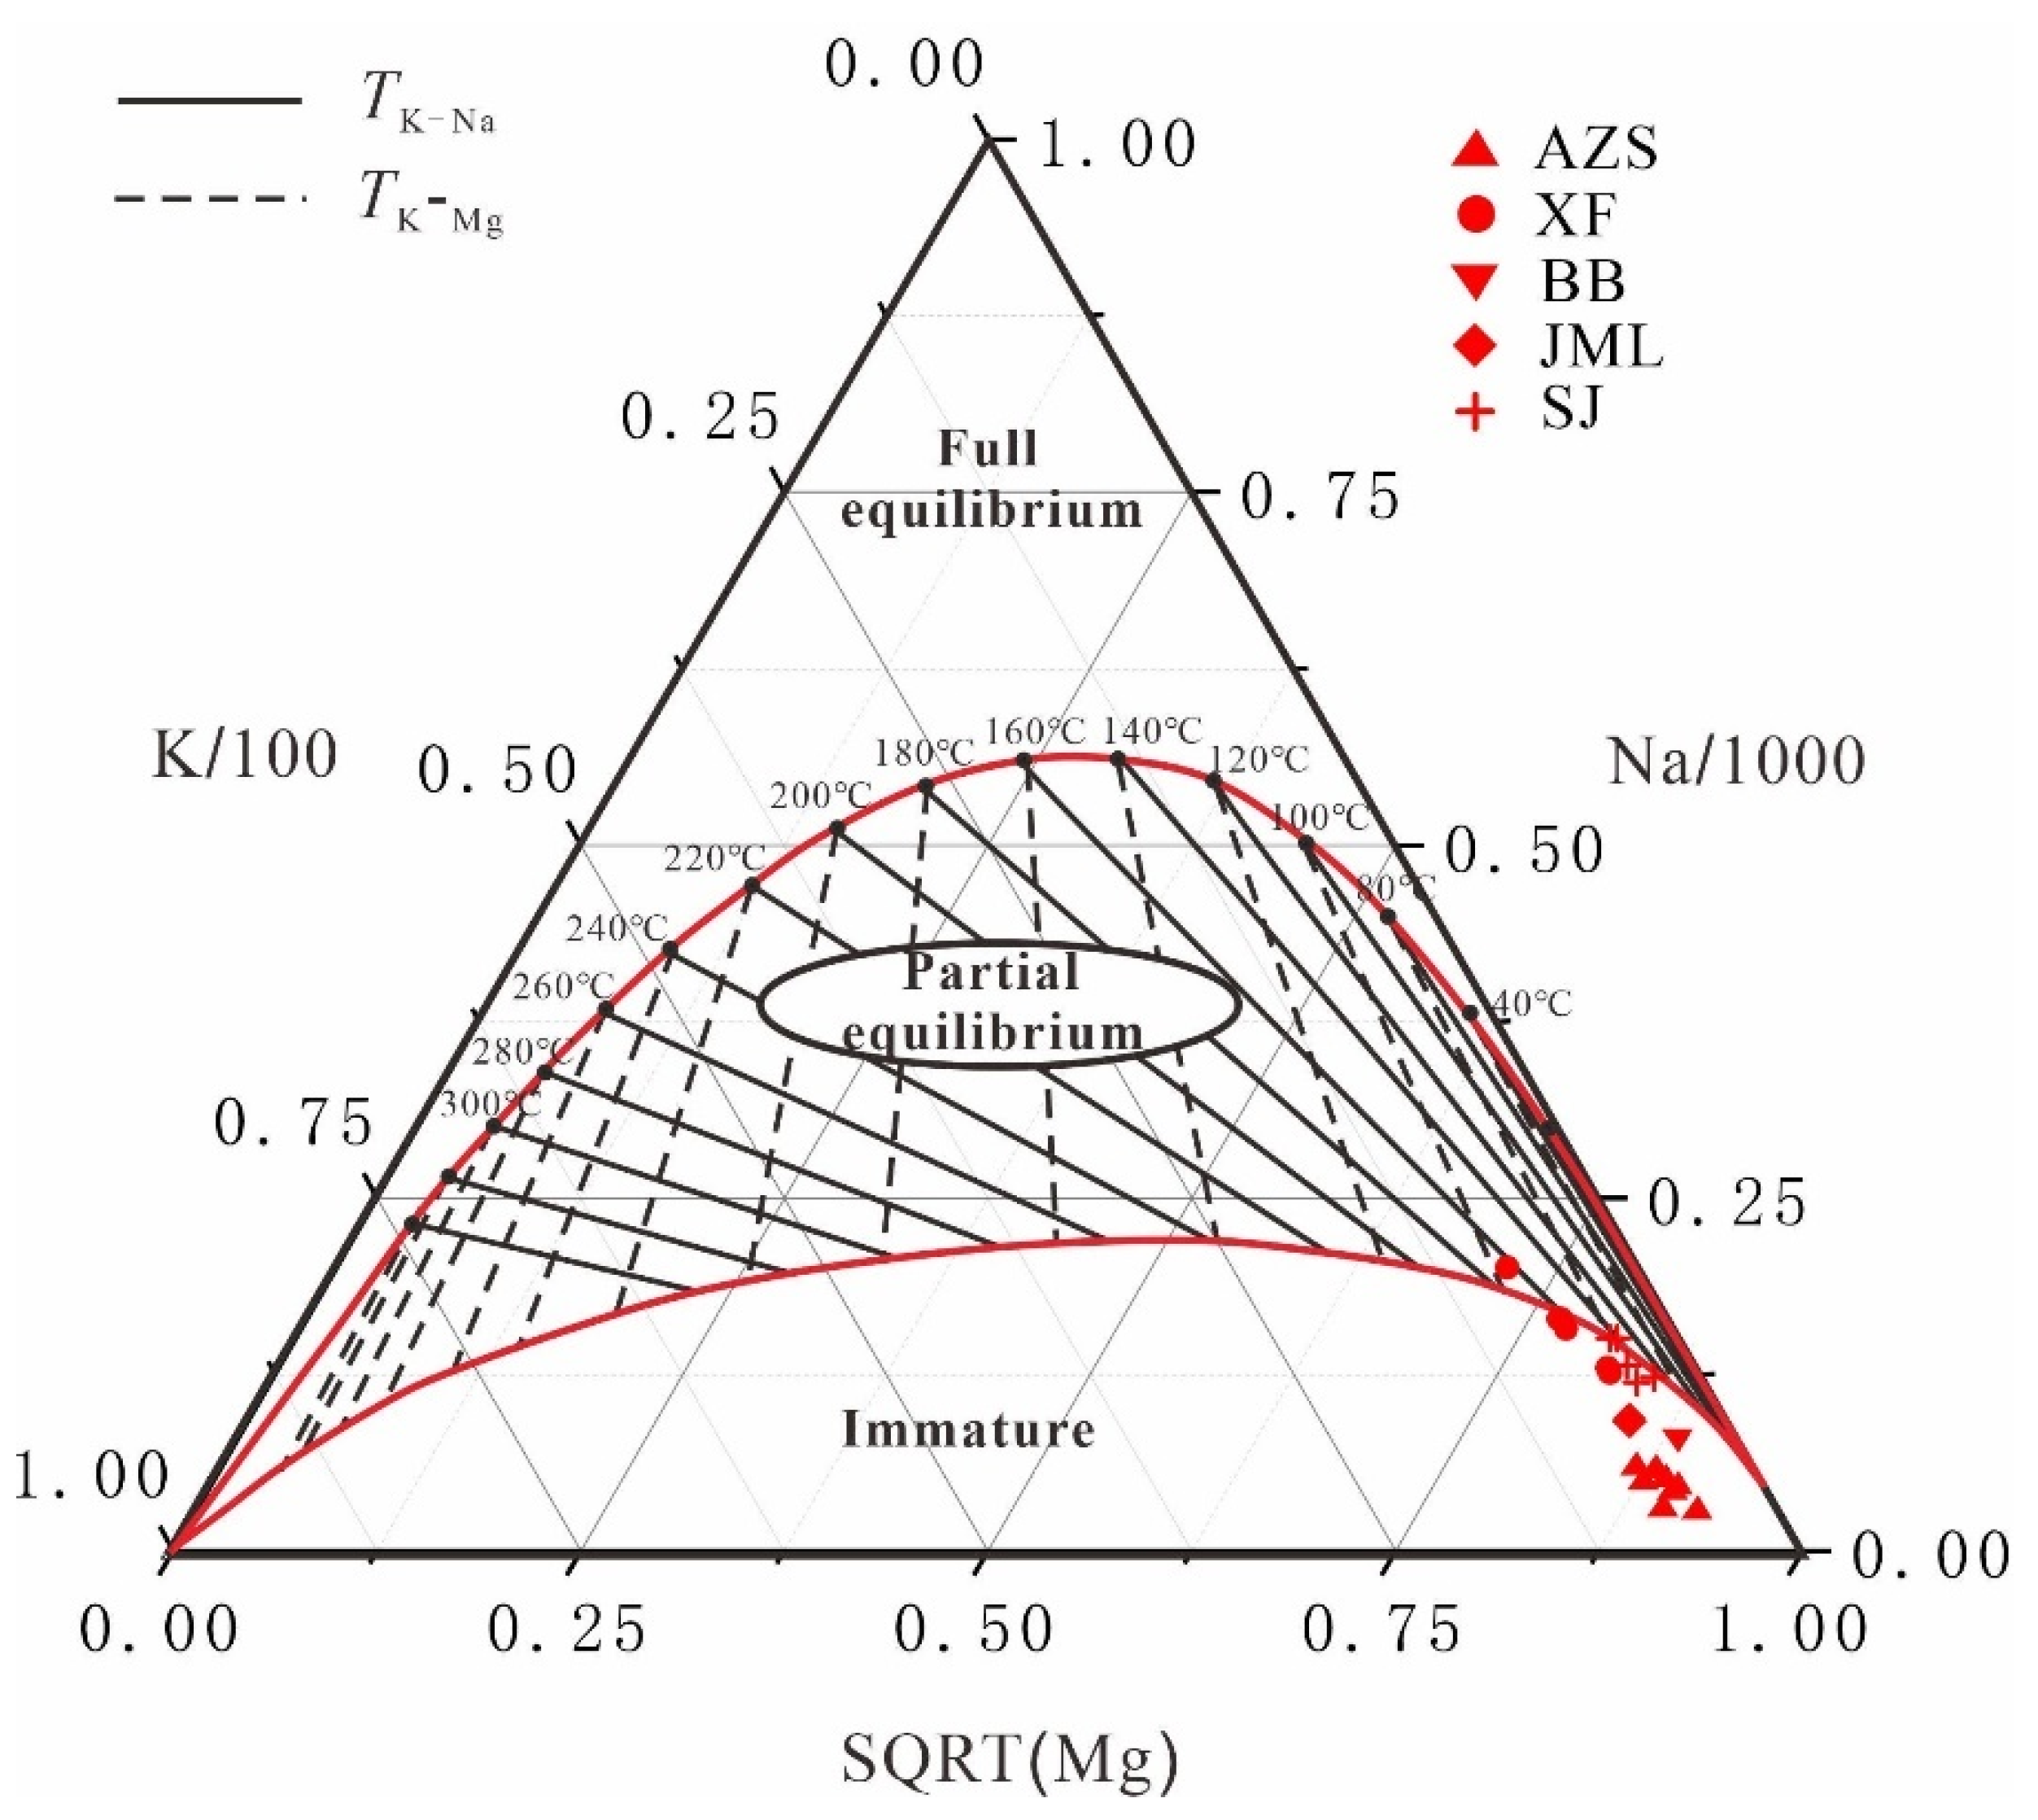
The cationic temperature scale is typically suited for geothermal fields where water-rock interaction is relatively extensive and should be employed after confirming the state of water-rock equilibrium. Most hot water samples are classified in the "immature water" category (
Figure 10) [
32], suggesting that water-rock interactions in many geothermal fields have not yet reached equilibrium. Consequently, the reservoir temperatures derived from the cationic temperature scale may not accurately represent these conditions. During water-rock interaction, potassium and magnesium reach equilibrium more rapidly than other elements, providing a more reliable indication of the temperature for relatively shallow geothermal waters during ascent. Therefore, the temperature scale based on potassium and magnesium is considered more dependable than other cationic temperature scales [
33].
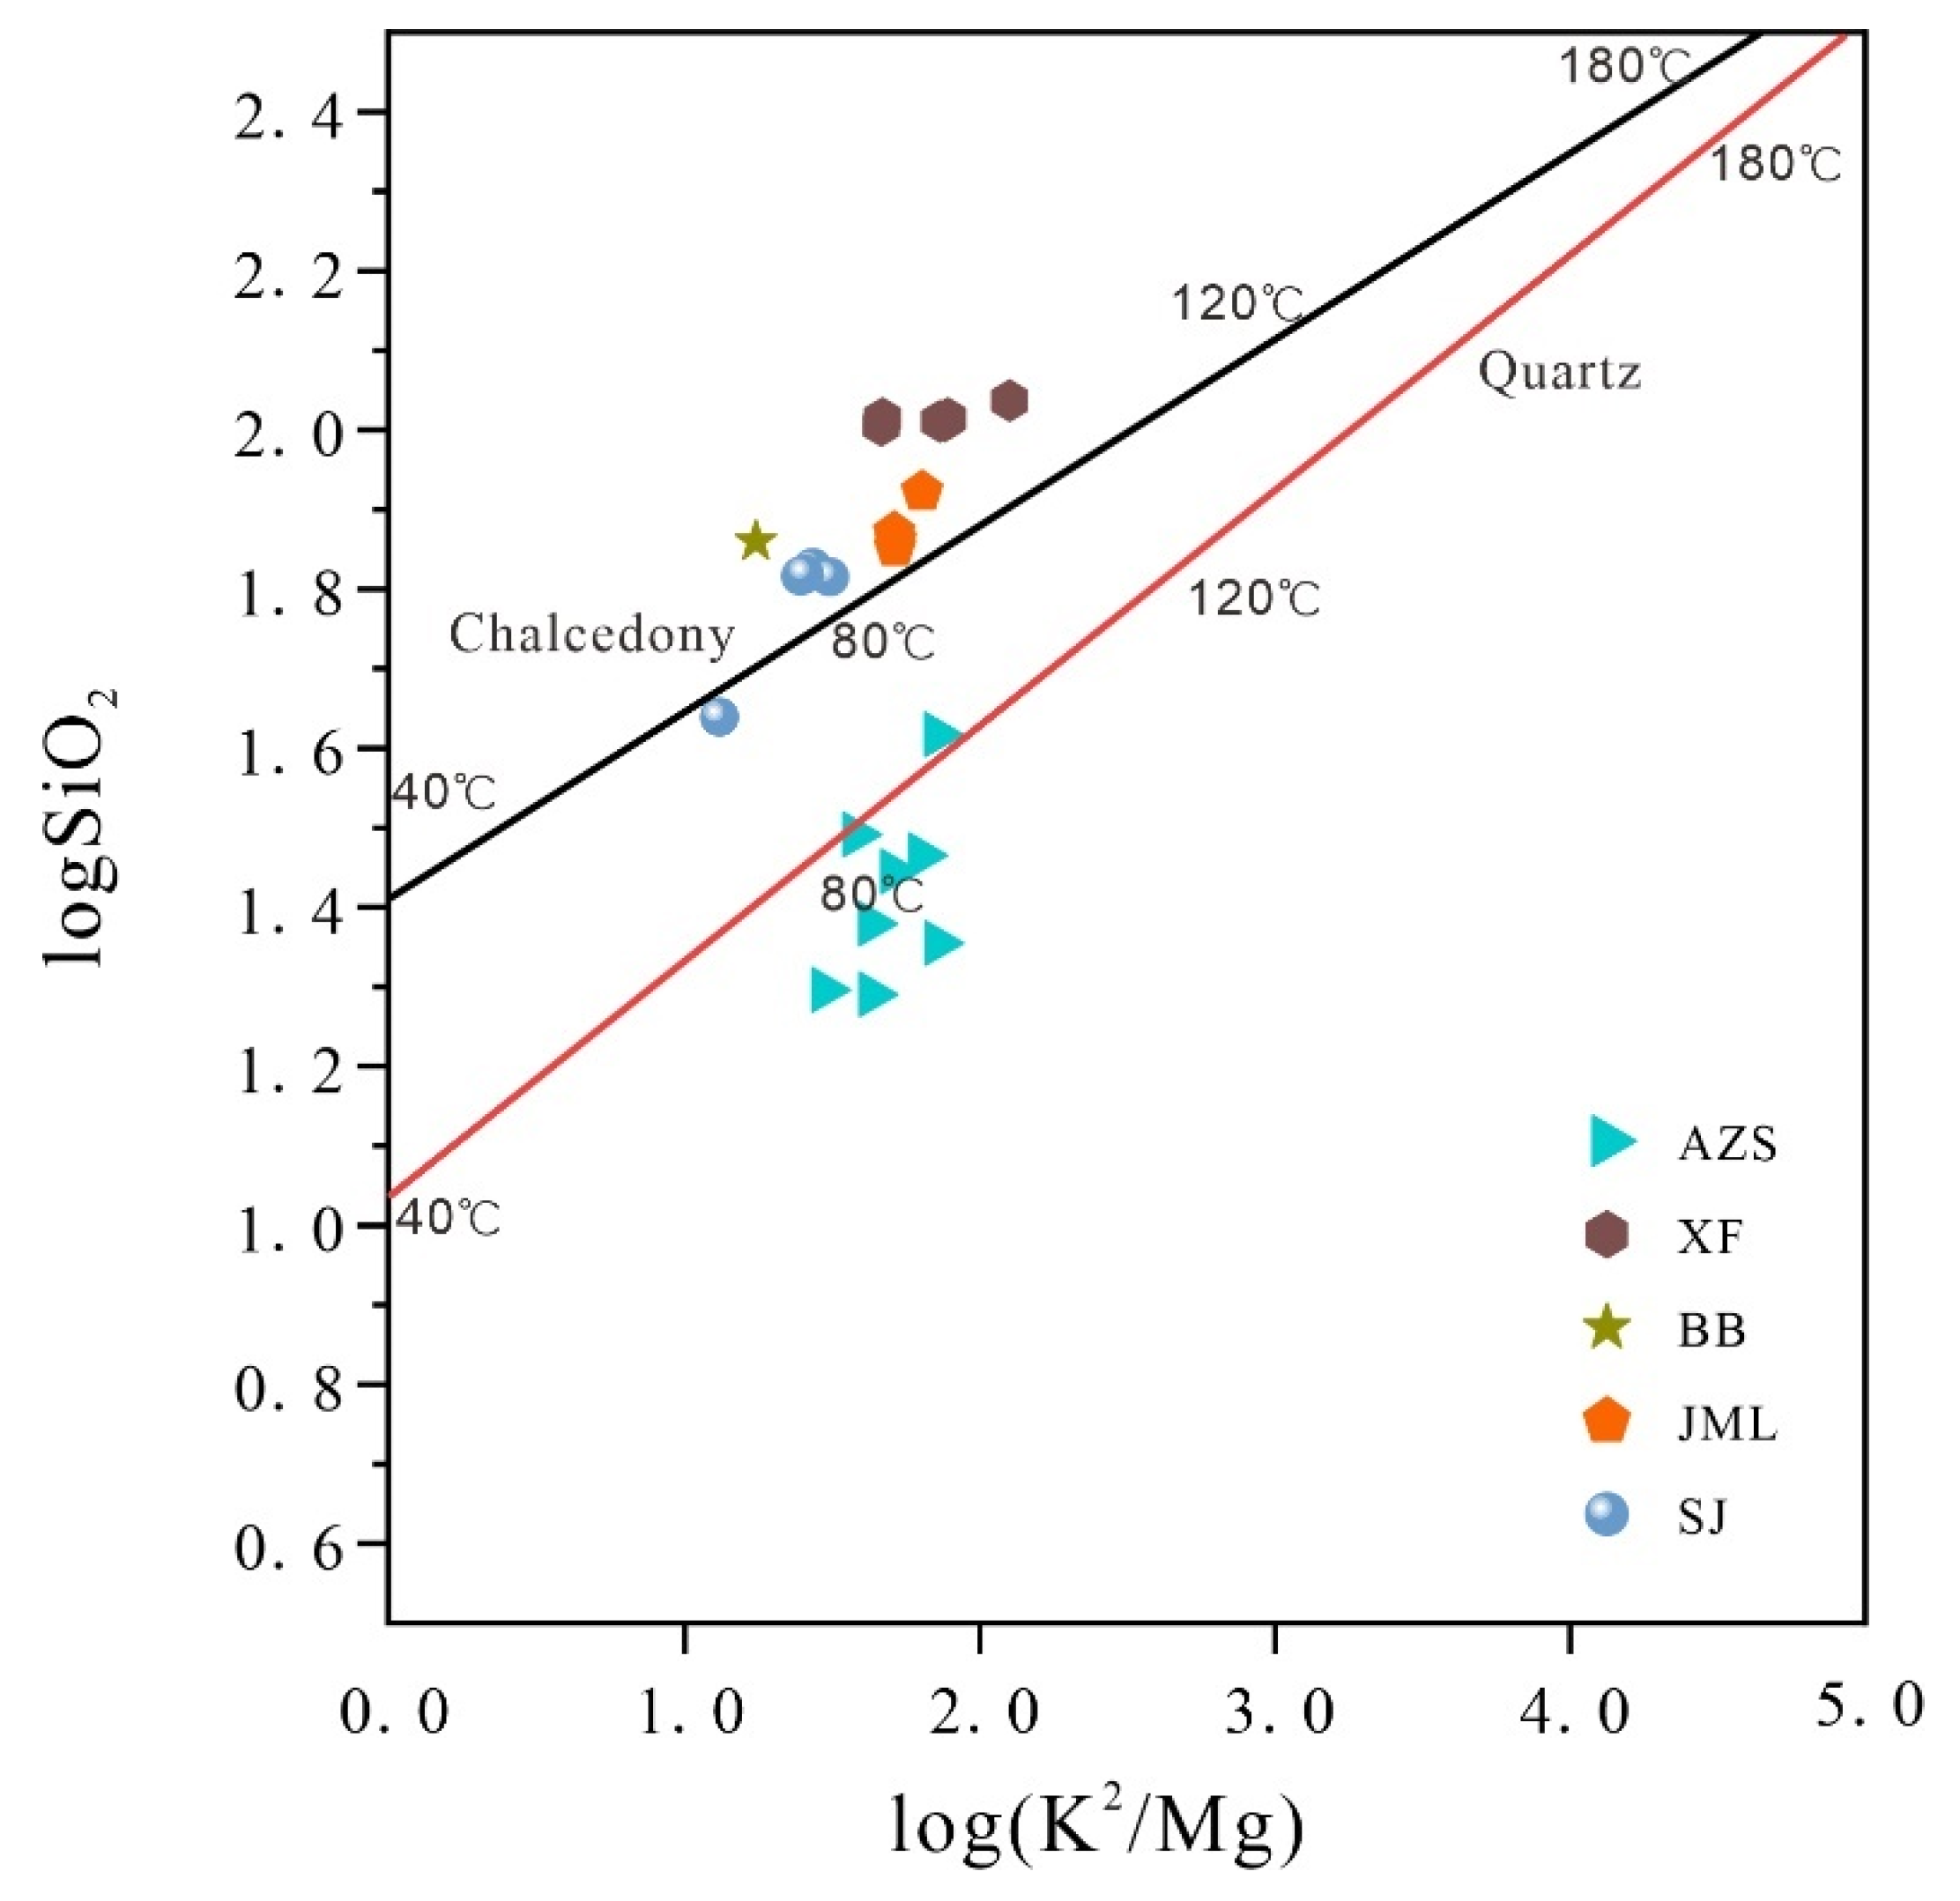
The log (SiO₂) - log (K²/Mg) graph (
Figure 11) indicates the presence of SiO₂ in various forms within the geothermal waters of the study area. Specifically, in Anzishan where water temperatures are lower, silica predominantly exists as quartz. In contrast, chalcedony is the main form of silica in other geothermal fields. Field observations confirm the absence of steam loss at the ground hot spots, suggesting that the quartz temperature scale without steam loss is appropriate for estimating the reservoir temperature in Anzishan. Conversely, the chalcedonic temperature scale is better suited for the remaining geothermal fields. The calculated results align well with the corrected multi-mineral equilibrium diagram method, affirming their reliability as accurate measures of the reservoir temperature (
Table 10).
The reservoir temperatures in the study area range from 74 to 113°C. The Anzishan and Shangjin geothermal fields, located at the northern and southern edges of the basin, respectively, record the lowest temperatures. In contrast, geothermal fields in the center of the basin exhibit higher reservoir temperatures, indicating a warming trend toward the basin's interior. The circulation depth of the geothermal water varies between 1.5 and 2.5 km, being shallower at the basin's edges and progressively deepening towards the center.
5.2. Conditions of Recharge, Runoff and Discharge of Geothermal Water
5.2.1. Source Recharge and Recharge Elevation
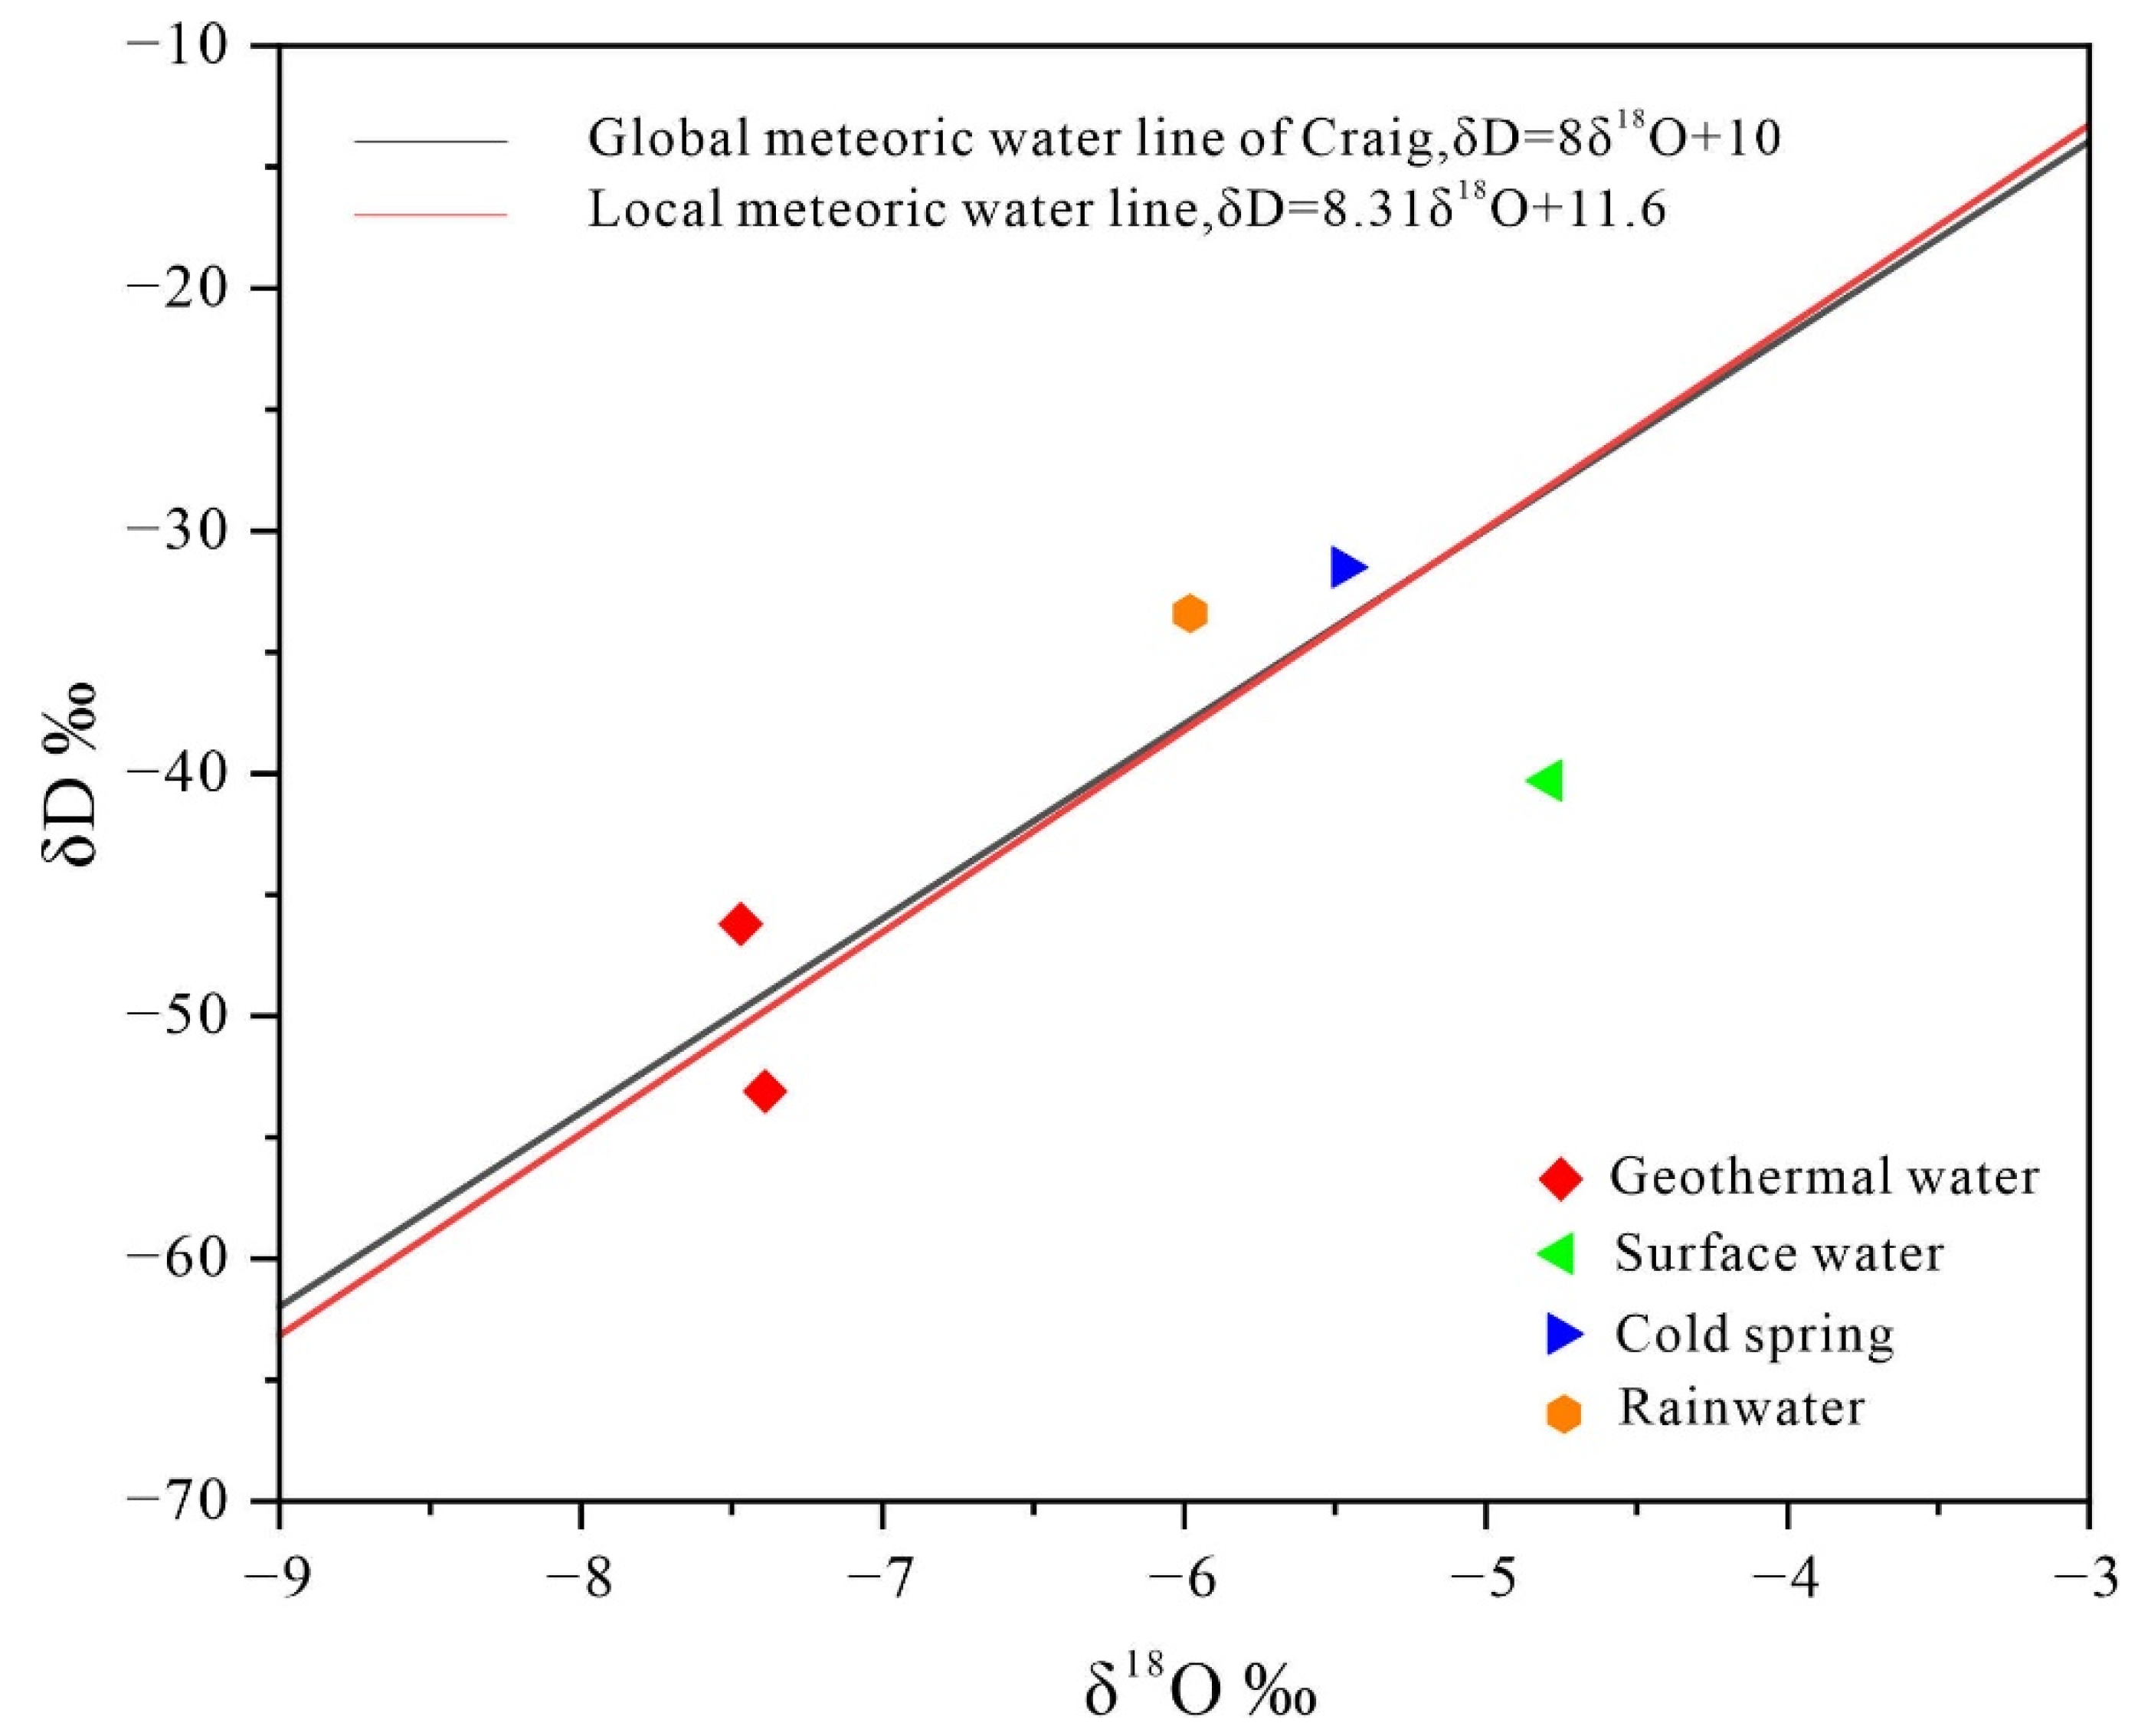
Using the elevation effects of hydrogen and oxygen isotopes, the source and elevation of groundwater recharge can be calculated. For this analysis, the global atmospheric precipitation line and the atmospheric precipitation process line specific to Jiangxi were selected (
Figure 12). The proximity of all water samples to these precipitation lines, particularly near the local rain point, indicates that recharge is predominantly from atmospheric precipitation [
34]. As calculated in
Section 4.3, the recharge elevation of geothermal water in the center of the basin ranges from 448.94 to 828.13 m, suggesting that the rainwater originates from nearby mountainous recharge areas. In comparison, the hydrogen and oxygen isotope values of geothermal water are significantly more negative than those of cold springs, rainwater, and surface water, indicating that the geothermal water undergoes a relatively deep and prolonged runoff process post-recharge.
5.2.2. Residence Time and Deep Cycle Evidence
Carbon isotope studies of Junmenling geothermal water in the central basin (
Table 7) reveal that the apparent age of this geothermal water is approximately 26,000 years, dating back to the last glacial period of the Quaternary. This duration has allowed sufficient time for the accumulation of heat energy. The δ¹³C value of CO₂ in the central basin's hot water is -9.33‰ (PDB), suggesting that the carbon predominantly originates from deep mantle sources, with a minor contribution from biological carbon. Specifically, mantle-derived carbon, which typically ranges from -4% to -8% in δ¹³C values, constitutes 84.03% of the carbon in the geothermal water, whereas biological carbon, with δ¹³C values ranging from -10‰ to -35‰, accounts for 15.97%. This composition supports the involvement of geothermal water in deep circulatory processes.
5.2.3. Evaluation of Geothermal Reservoir Opening Degree
Most geothermal water samples in the study area are classified within the diluted water category, indicating that the geothermal fluids have been mixed with varying proportions of cold water (
Figure 13). The mixing characteristics of the geothermal system can be analyzed using characteristic coefficients.
In geothermal water cycling, Na⁺ typically originates from leaching and ion exchange, while Ca²⁺ is indicative of low salinity water. Cl⁻ tends to accumulate in thermal reservoirs under weak hydrodynamic conditions, whereas SO₄²⁻ results from the evaporative decomposition and oxidation of sulfur-containing minerals. Thus, the proportional coefficients of these four key ions are useful for evaluating the characteristics of geothermal water. The sodium chloride coefficient, γ(Na⁺)/γ(Cl⁻), assesses the degree of groundwater concentration metamorphism and the sealing properties of the formation: a high ratio suggests significant influence from infiltrating water, whereas a low ratio indicates effective sealing and deep metamorphism. A value close to 1 suggests that groundwater has been substantially influenced by leaching from rock salt formations. The ratio γ(Cl⁻)/γ(Ca²⁺) reflects the strength of the hydrodynamic drive in the thermal reservoir; a higher value indicates poorer hydrodynamic conditions. The desulfurization coefficient, 100×γ(SO₄²⁻)/γ(Cl⁻), serves as an important indicator of the oxidation state of the formation water. Values less than 1 suggest effective sealing, while values greater than 1 indicate significant influence from shallow surface oxidation and poor sealing [
35]. The characteristic coefficients calculated for geothermal water in the study area are presented in
Table 11.
In the Huichang geothermal fields, the sodium-chloride coefficient is close to 1, suggesting that Huichang hot water exhibits significant sealing and leaching effects. The chloro-calcium coefficient for Huichang geothermal water, ranging from 3.5 to 3.6, is the highest recorded, indicating that the hydrodynamic conditions in the Huichang reservoir are relatively weak and enclosed. In contrast, the sodium-chloride coefficients for other geothermal fields in the study area significantly exceed 1, and their chloro-calcium coefficients are below 1, indicating generally favorable hydrodynamic conditions. The desulfurization coefficient for geothermal water across the study area, including Huichang, is notably higher than 1, which suggests that the reservoirs are generally open and significantly influenced by oxidation. This analysis indicates that, except for the two geothermal fields in Huichang, which are relatively enclosed within the center of the Cretaceous red bed basin, the thermal reservoirs in the study area tend to be less closed, with active water cycles.
5.3. Water-Rock Interaction Mode of Geothermal Water
5.3.1. Correlation Analysis
Correlation analysis aids in assessing the similarity and ionic relationships among geothermal fields [
36]. For this purpose, IBM SPSS Statistics 26.0 software was employed to analyze the water quality data [
37], with the findings presented in
Table 12.
The data in the table indicate that K⁺, Na⁺, Cl⁻, SO₄²⁻, and HCO₃⁻ are positively correlated with TDS, with correlation coefficients ranging from 0.63 to 0.92. This suggests that these ions are the primary contributors to TDS levels. In contrast, the fluorine ion exhibits negative correlations with all other ions. Based on the multi-mineral equilibrium diagram, it can be inferred that the fluorine ion has reached equilibrium at the corresponding hot spring temperature [
38]. Currently, two sources of fluoride ions in the geothermal waters of the study area have been identified: one is from the leaching of deep-seated granite during the deep geothermal cycle, and the other is from the dissolution of fluorite deposits during the upwelling of high-temperature geothermal water [
39]. Given that fluorite deposits are localized in the Xiefang area of the Huichang Basin and are unlikely to influence distant geothermal fields significantly, the fluorine ions in the geothermal waters of the study area are primarily derived from deep granite. The geothermal waters in the basin are likely to interact with granite via fault structures, facilitating local deep circulation that acquires thermal energy. During the process of atmospheric precipitation infiltration and deep cycle heating to generate geothermal water, the granite bedrock leaches and extracts F⁻, Ca²⁺, and other mineral-forming components, thus establishing a natural geothermal water convective system [
40].
5.3.2. Ion Source Mechanism
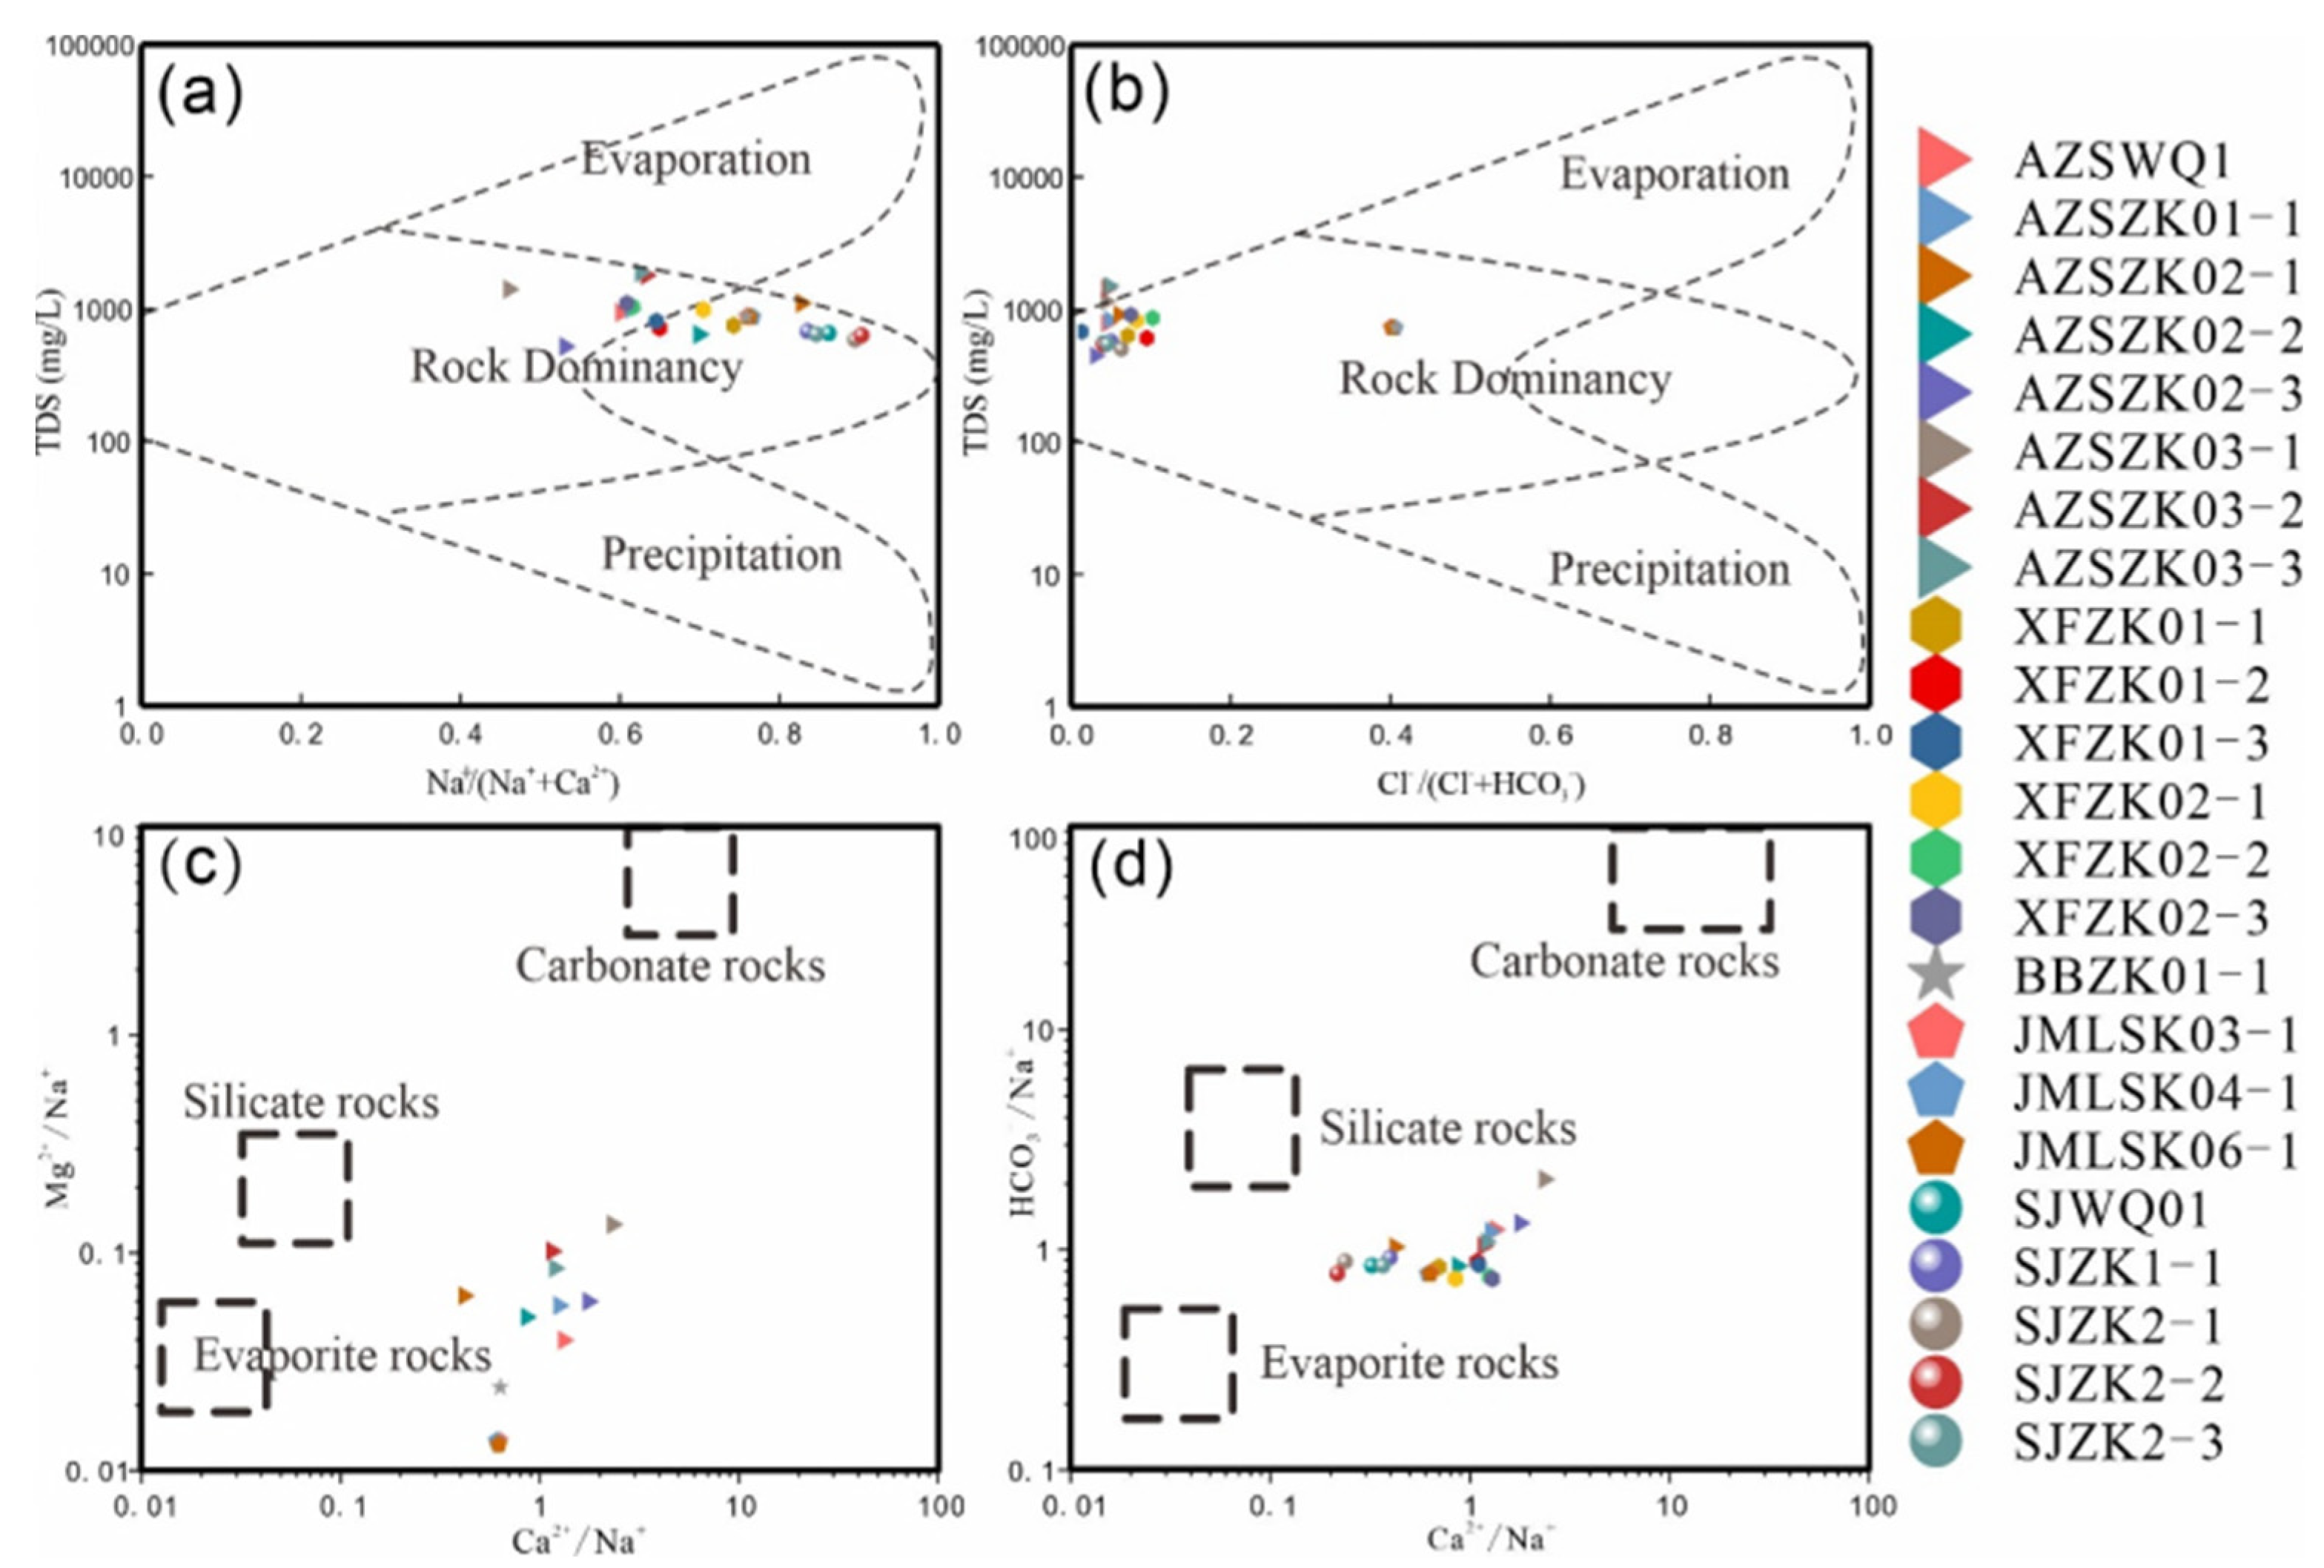
Utilizing the Gibbs diagram to qualitatively identify the sources of geochemical components in geothermal water [
41,
42], the ratios (Ca²⁺/Na⁺, Mg²⁺/Na⁺, and HCO₃⁻/Na⁺) and ion proportion relationship method are applied to assess the contributions of the three primary weathering mechanisms—silicate, carbonate, and evaporite dissolution—to the formation of groundwater solutes. This approach also helps to pinpoint the specific potential sources of chemical substances in the water (
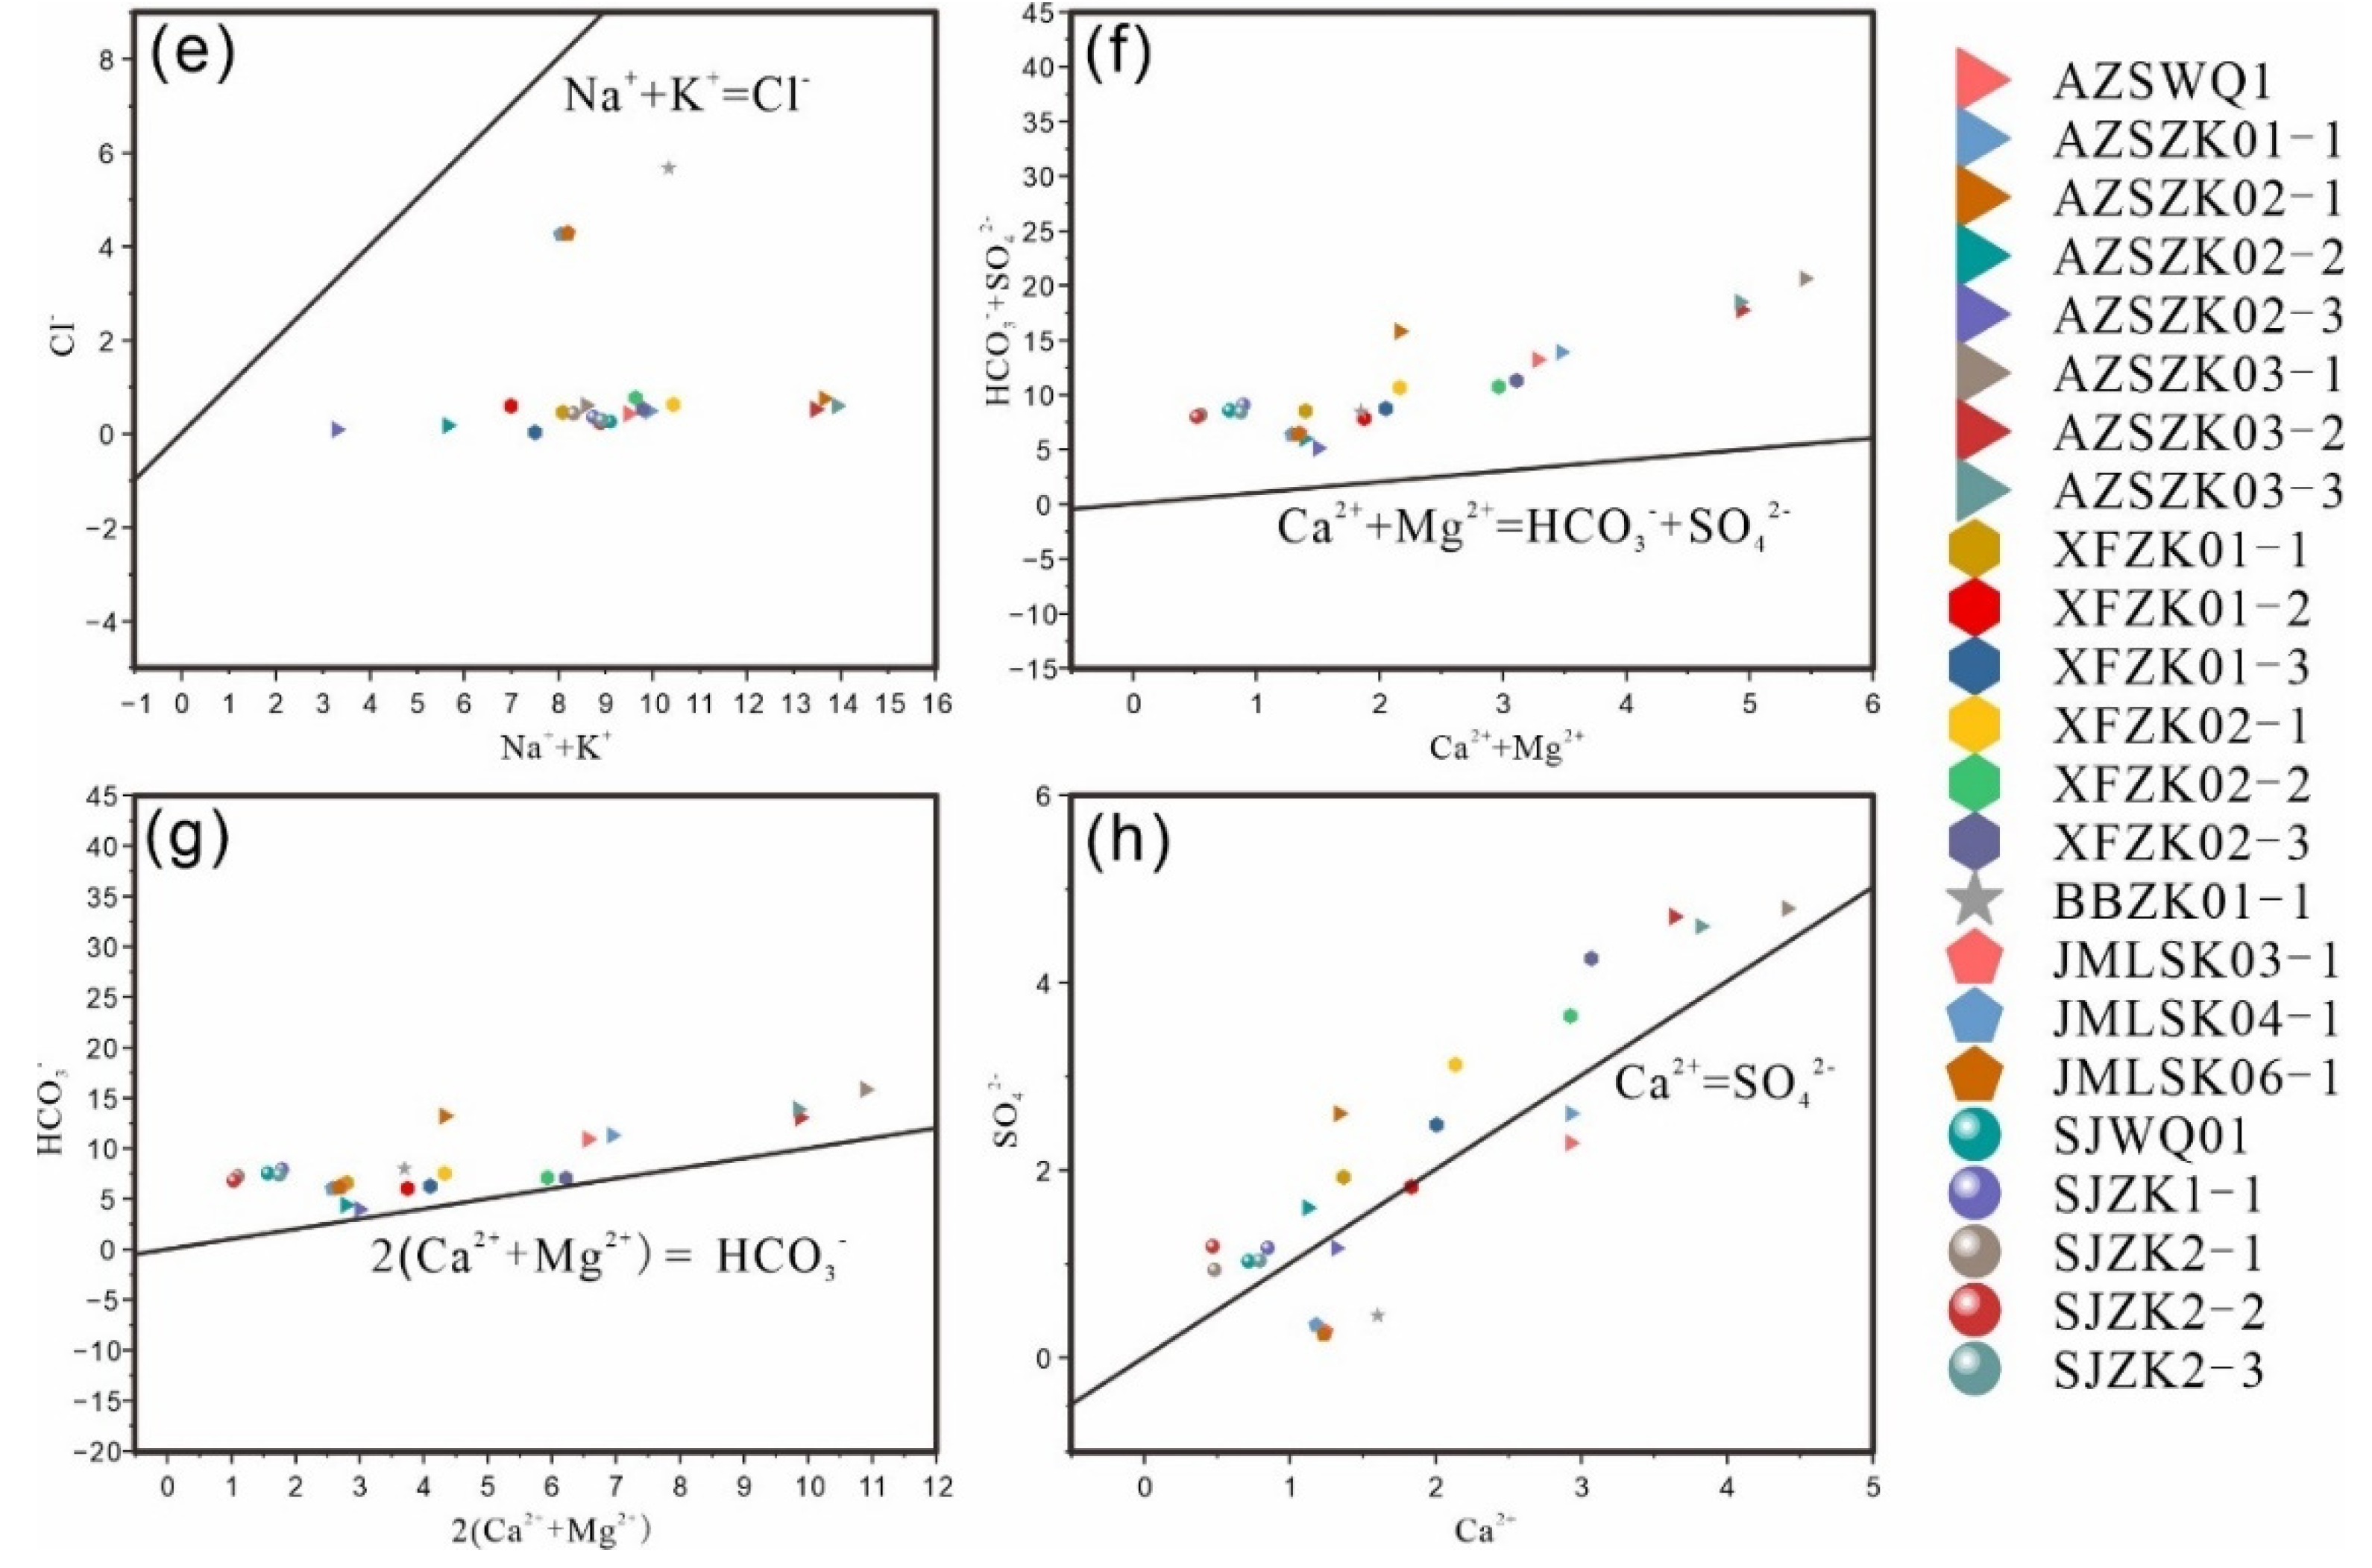
Figure 14 and
Figure 15) [
43,
44]. All diagrams were created using Origin 2024.
Geothermal water samples are primarily located around the water-rock interaction zone, proximal to the global average weathering areas of evaporites and silicate rocks. This distribution confirms that the chemical components of geothermal water predominantly originate from water-rock interactions, with evaporites and silicate rocks serving as the principal ion sources (
Figure 14). In the study area, evaporites are extensively found in the Cretaceous strata, which are rich in chloride (e.g., halite, potassium salts) and sulfate (e.g., anhydrite, gypsum) [
45], acting as the primary source of strong acid anions [
46]. Additionally, during the runoff process, the geothermal water hydrolyzes and acidifies the surrounding rock, which is rich in silicate minerals (such as granite and metamorphic rocks). This process facilitates the release of sodium and potassium ions and their exchange with calcium ions. It is evident that silicates, as the most significant rock-forming minerals in the study area, are crucial sources of Na⁺, K⁺, and SiO₂ in geothermal water.
Ion concentration relationships in geothermal water are depicted in
Figure 15. All hot water samples from the fault zone fall below the line [Na⁺ + K⁺] = [Cl⁻], and above the dolomite dissolution line [Ca²⁺ + Mg²⁺] = [HCO₃⁻ + SO₄²⁻], clustering along the gypsum dissolution line [Ca²⁺] = [SO₄²⁻]. This distribution suggests that Na⁺ and K⁺ primarily originate from the weathering dissolution of Albite and plagioclase in silicate rocks, in addition to salt rock dissolution. The geothermal fields in Huichang Babei and Junmenling have the most consistent sample data, confirming the prevalence of rock salt in the Huichang Cretaceous red layer basin [
47]. The diagram [Ca²⁺ + Mg²⁺] vs. [HCO₃⁻ + SO₄²⁻] indicates that calcium and magnesium ions predominantly derive from the dissolution of calcium and magnesium-containing aluminosilicate minerals. The ion distribution aligns closely with the dolomite hydrolysis curve and shows a slight upward shift (
Figure 15g), suggesting that Ca²⁺ and Mg²⁺ may also result from dolomite dissolution and interactions between carbon dioxide and aluminosilicate minerals. In the study area, bio-sedimentary dolomite strata are extensive, and many sandy rocks near the tectonic zone contain carbonate rock and pyrite cements. The geothermal water likely leaches and dissolves these ancient sedimentary strata, acquiring dolomite and other components. The sulfate content in geothermal water is slightly higher than that of calcium ions (
Figure 15h), indicating that the sulfate originates not only from the dissolution within the red layer basin but also from the weathering of pyrite or the oxidation of hydrogen sulfide gas.
Sr isotopes are extensively utilized to ascertain the deep retention environment of hot water and the extent of water-rock interaction. Current research indicates that the global silicate rock weathering source of
87Sr/
86Sr ratios ranges from 0.716 to 0.720, while the carbonate weathering source typically exhibits
87Sr/
86Sr ratios between 0.708 and 0.709 [
48]. In the basin interior, geothermal water samples typically show
87Sr/
86Sr ratios around 0.715185, aligning more closely with the weathering characteristics of silicate rocks. In comparison, most geothermal water samples in the study area display lower 87Sr/86Sr ratios (0.721 to 0.735 [
49]) than both surface water and underground cold water. These ratios are also relatively close to the
87Sr/
86Sr ratios found in the granite of the Gannan Yanshan period (0.711 to 0.716) and the Zixi duplex granite mass within the study area (0.712675 to 0.725896 [
50]), further substantiating the significant water-rock interaction between the hot water and the surrounding granite.
5.3.3. Simulation of Water-Rock Interaction
The chemical composition of groundwater results from its interactions with surrounding rocks during runoff. As hydro-rock reactions progress, the hydrochemical composition evolves. Reverse hydrogeochemical simulations [
51] rely on the principle of mass conservation to invert the ion concentration changes that occur during groundwater migration. On a given flow path, the hydrochemical composition at the starting point, combined with the transfer of hydrochemical components due to interactions along the path, equals the hydrochemical composition at the endpoint. Based on the basin's geomorphology, hydrogeological conditions, and groundwater flow dynamics, the basin's edge is identified as the hot water recharge area, while the central depression serves as the geothermal hot water discharge area [
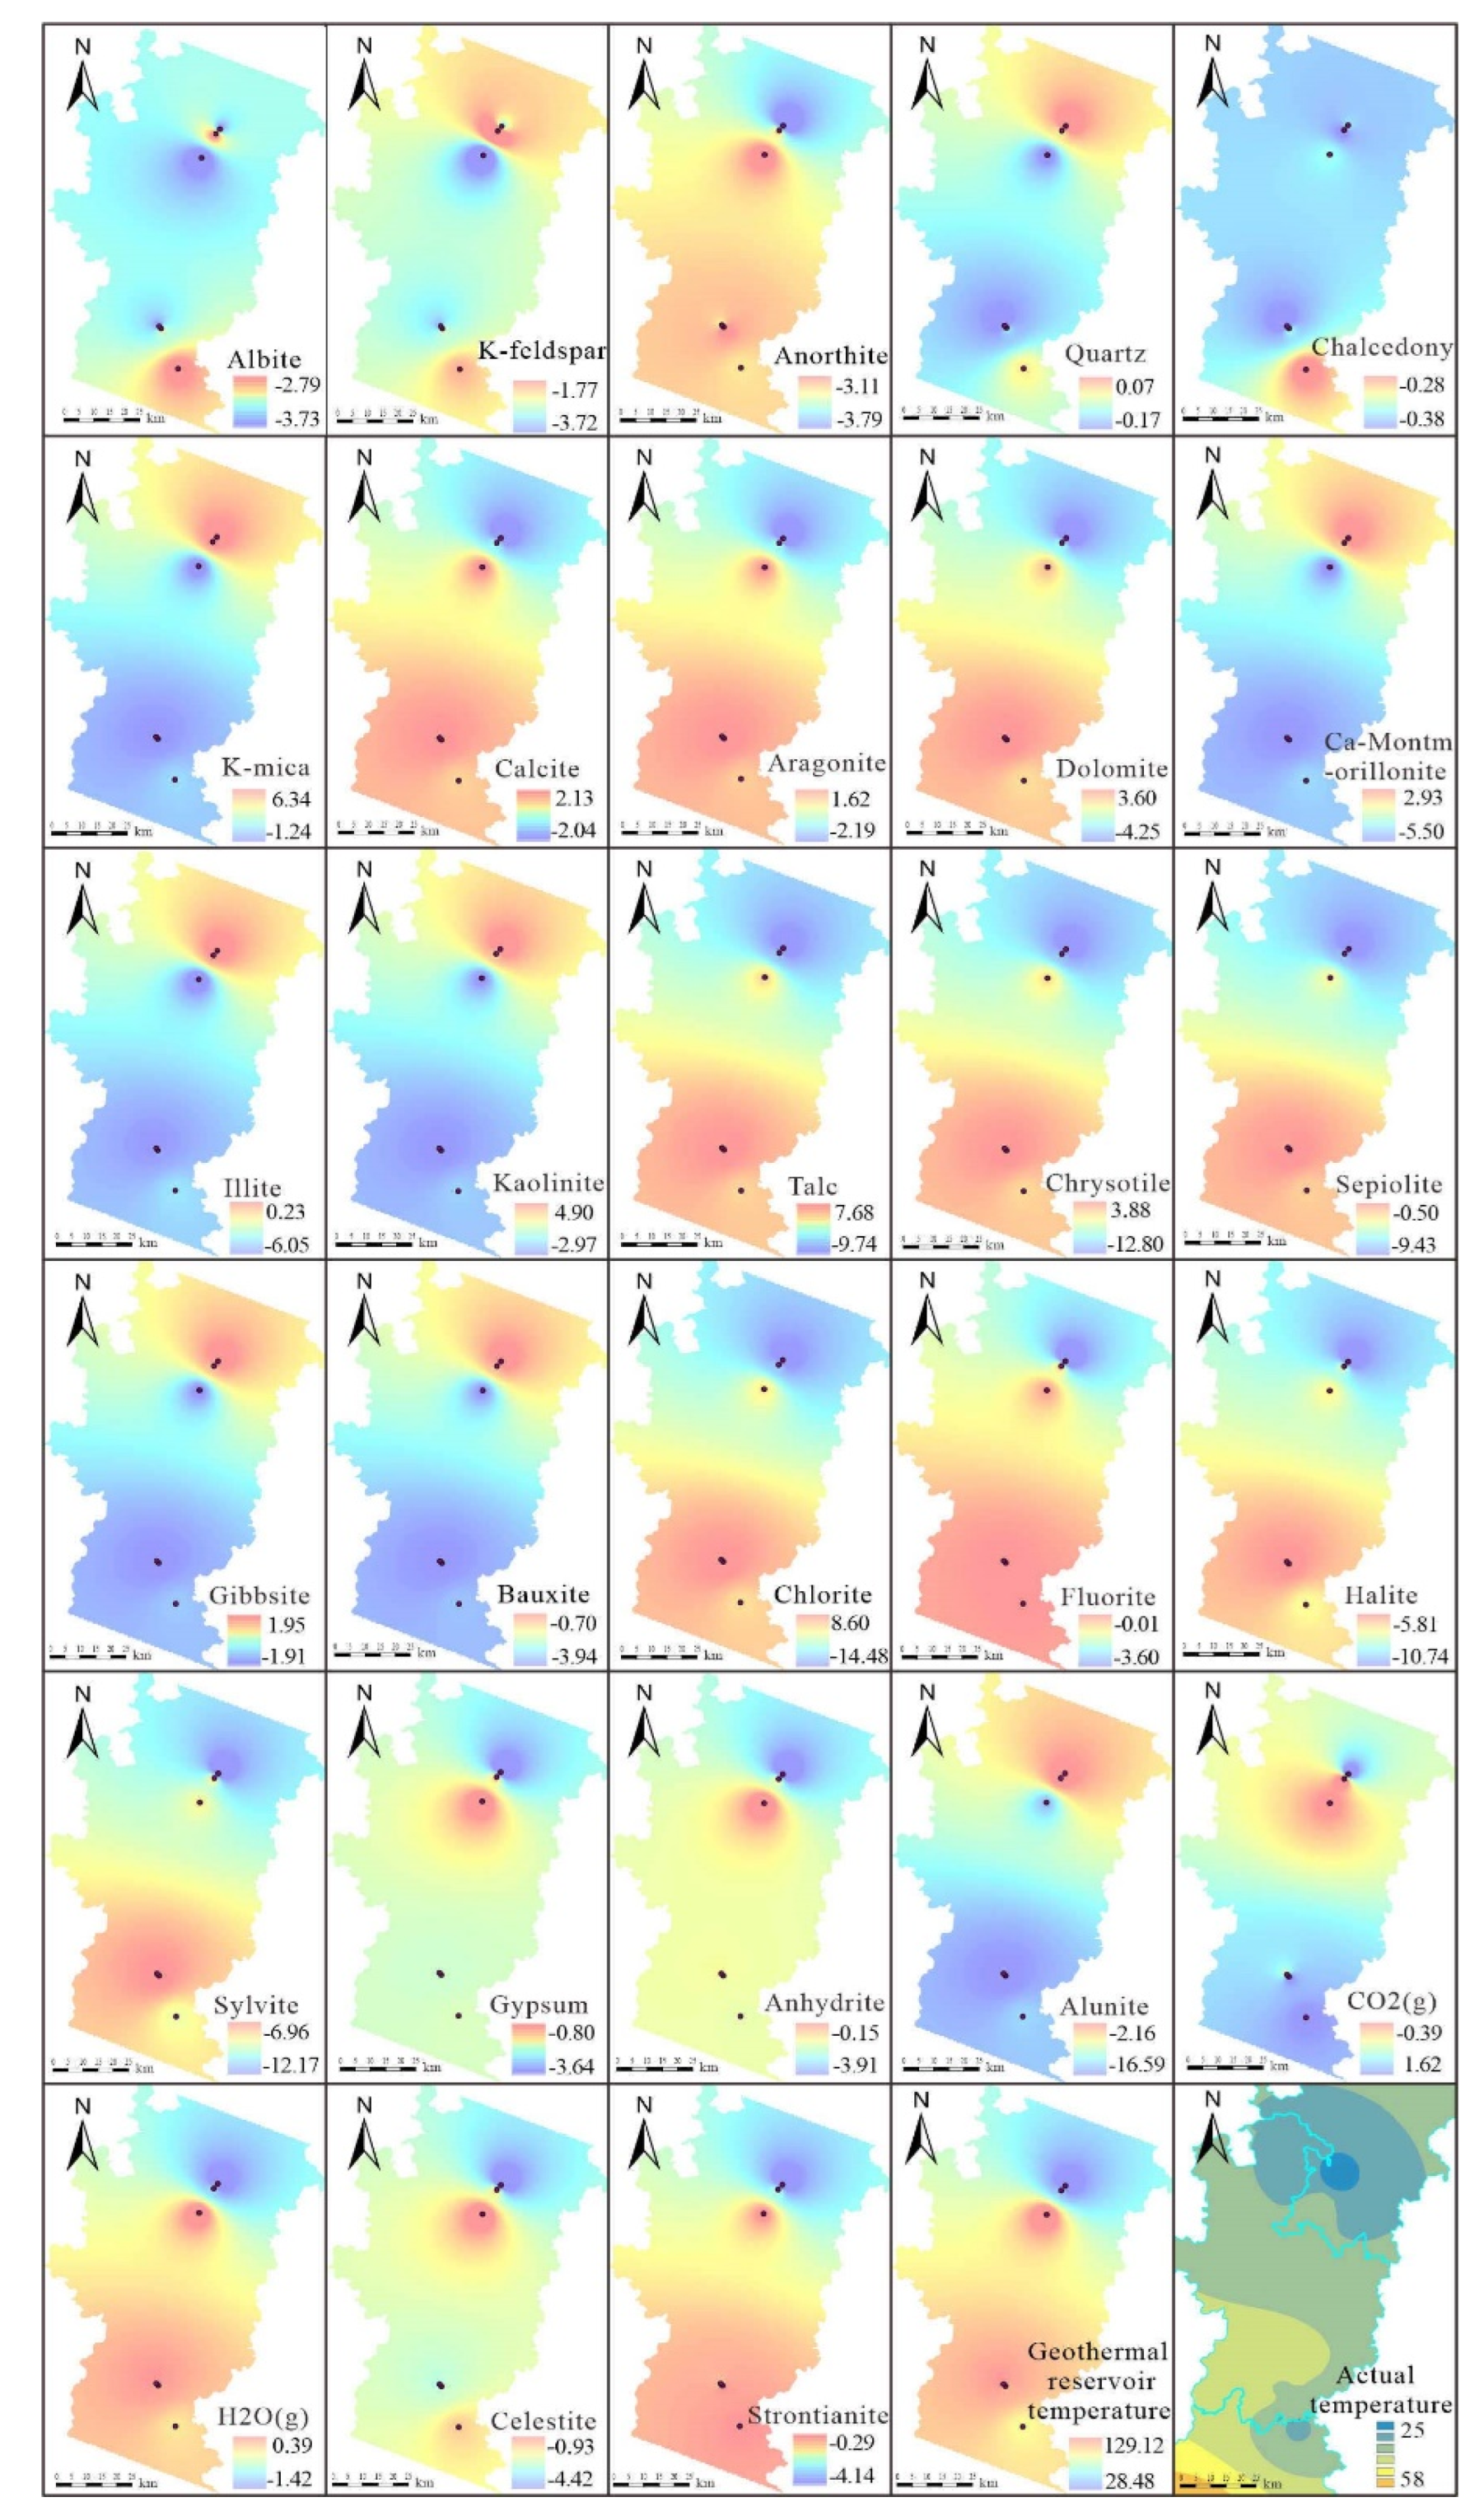
52]. For the simulations, chemical data for aluminum and carbon dioxide were chosen, and reverse hydrogeochemical modeling was performed using PHREEQC Version 3. The saturation index distribution for each mineral is depicted in
Figure 16.
Based on the simulation outcomes, the 28 minerals associated with the dissolution-equilibrium processes in the tectonic zone can be classified into 11 categories. The first category includes feldspar minerals such as Albite, K-feldspar, and Anorthite. The second category comprises silica minerals, specifically Quartz and Chalcedony. The third category features mica minerals, exemplified by K-mica. The fourth category contains carbonate rock minerals such as Calcite, Aragonite, and Dolomite. The fifth category encompasses layered aluminosilicate minerals, including Ca-Montmorillonite, Illite, and Kaolinite. The sixth category covers hydrothermal alteration silicate minerals with magnesium as the main component, such as Talc, Chrysotile, and Sepiolite. The seventh category includes trihydrate aluminum minerals, namely Gibbsite and Bauxite. The eighth category consists of reductive alteration minerals, including Chlorite and Fluorite. The ninth category features evaporite minerals such as Halite, Sylvite, Gypsum, Anhydrite, and Alunite. The tenth category represents hydrothermal gases like carbon dioxide and water vapor. The eleventh category includes trace element representatives such as Celestite and Strontianite. The following discussion will address:
Feldspar minerals exhibit a precipitation trend from the basin edges toward the center, indicating an enrichment of feldspar from the periphery to the center of the basin. Quartz, layered aluminosilicate minerals (such as Ca-Montmorillonite, Illite, and Kaolinite), white mica, and alumina minerals (including Gibbsite, Bauxite, and Alunite) predominantly dissolve from north to south, while carbonate rock minerals (such as Calcite, Aragonite, and Dolomite), magnesium-rich hydrothermal alteration silicate minerals (such as Talc, Chrysotile, and Sepiolite), reductive alteration minerals (such as Chlorite and Fluorite), most evaporite minerals (including Halite, Sylvite, Gypsum, and Anhydrite), and trace elements (such as Celestite and Strontianite) generally precipitate from north to south. The precipitation or dissolution characteristics of different minerals can be explained through their chemical compositions and structural properties:
(1) Mechanism analysis of dissolving minerals:
Silica minerals (e.g., Quartz, Chalcedony) typically have low solubility. However, their solubility increases in the presence of dissolved carbon dioxide, particularly at the contact zones between tectonic belts and acidic magmas. The decrease in the carbon dioxide saturation index from south to north suggests that as the thermal tectonic structures extend southward, carbon dioxide increasingly dissolves, facilitating the dissolution of Quartz and Chalcedony. Moreover, layered aluminosilicate minerals (such as Ca-Montmorillonite, Illite, and Kaolinite) are more prone to dissolution/hydrolysis under carbon dioxide-rich conditions, where aluminum and silicon are more likely to form soluble compounds with other ions in geothermal fluids [
53].
(2) Mechanism analysis of precipitating minerals:
As discussed earlier, the dissolution of common silicate minerals in silicate rock strata, such as Ca-Montmorillonite and Anorthite, leads to increased calcium ion concentrations; due to the common ion effect, this inversely promotes the precipitation of southern carbonate minerals like Aragonite, Calcite, Dolomite, and Strontianite. The dissolution of Quartz and Chalcedony similarly facilitates the precipitation of magnesium-rich hydrothermal alteration silicate minerals. The previous section on ionic components mentioned that the concentration of sulfate ions decreases from north to south, while chloride ion concentration increases from the basin edge toward the center, causing the more sulfate-sensitive minerals like Celestite and Gypsum to dissolve in the north and precipitate Halite and Sylvite in the south.
(3) Mechanism analysis of the precipitation-dissolution processes of reductive alteration minerals (Fluorite, Chlorite):
The hydrothermal alteration characteristics of other minerals closely associated with Fluorite mineralization and the alteration features of the surrounding granitic rocks in geothermal fields are similar. For example, Chloritization, a common type of reductive alteration, occurs when geothermal fluids react with granitic rocks. The increasing saturation index of Fluorite and Chlorite from north to south indicates that the study area's geothermal fields are extensively involved in reductive alterations closely linked to granitic rocks and are associated with ancient geothermal waters in enclosed basins [
54,
55].
The correlation analysis previously discussed indicates that the main source of fluoride ions in the geothermal waters of the study area is the deep circulation of geothermal fluids leaching underlying concealed granite. Exposed magmatic rocks are primarily represented by Late Yanshanian granite, with the Xiefang geothermal field as a typical example, where direct contact with granite results in the highest reservoir and measured temperatures within the basin; whereas, the measured temperatures of hot springs in exposed sandstone and metamorphic rock areas (except for the thick cover of the basin center in Babei and Junmenling geothermal fields) are generally lower. Comparisons of the radioactive element content in springs also show (
Table 3) that geothermal waters in areas with extensive exposure or concealed granite (such as Xiefang) have significantly higher radioactive contents than other springs (such as Anzishan), indicating that the geothermal waters are continuously drawing heat while interacting with granite, and the water temperature is closely related to the radioactive element decay heat or conductive heat of the granite body. Extensive research on granite in the southeastern coastal areas [
56,
57,
58,
59] has shown that Late Yanshanian granite has the highest average unit volume heat generation rate, indicating that the newer the granite formation, the better the conditions for geothermal water storage, the stronger the water-rock interaction in the exposed hot water, and confirming the high correlation between the basin heat source and the deeply concealed granite.
5.4. Genetic Model of Geothermal Water
The results indicate that the geothermal water in the Huichang Basin is primarily heated by fault conduction or radioactive decay of granite, characterizing it as a medium-low temperature convective geothermal system [
5,
60]. Structurally, the shallow sub-thermal long-extended structure forms the western boundary of the southeast coastal seismic subregion, with focal depths increasing from inland toward the southeast coast. Analyzing the spatial distribution of seismic activity reveals a high frequency of seismic events in the Huichang Basin. The location of epicenters is closely associated with the principal heat-controlling fault, and the structure remains active. This suggests a strong correlation between geothermal water and ground stress, highlighting promising prospects for geothermal development.
From the perspective of the geochemical mechanisms of geothermal waters, the study area's geothermal waters can be classified into bicarbonate-sulfate sodium-calcium type waters (in the central and northern parts of the basin) and bicarbonate sodium type waters (in the southern part of the basin). Apart from the central basin's Babei and Junmenling geothermal waters, which are completely exposed in the red bed basins, the remaining geothermal fields are distributed along the basin edges where they intersect with the main controlling thermal structures. These areas harbor underlying Sinian metamorphic rocks or granites intruded in multiple phases, resulting in chemical differences among the various geothermal fields. The Cretaceous red bed basins, enriched with evaporite minerals, and the boreholes revealing intensively dissolved granites and metamorphic rocks serve as the primary sources of ions for the geothermal waters.
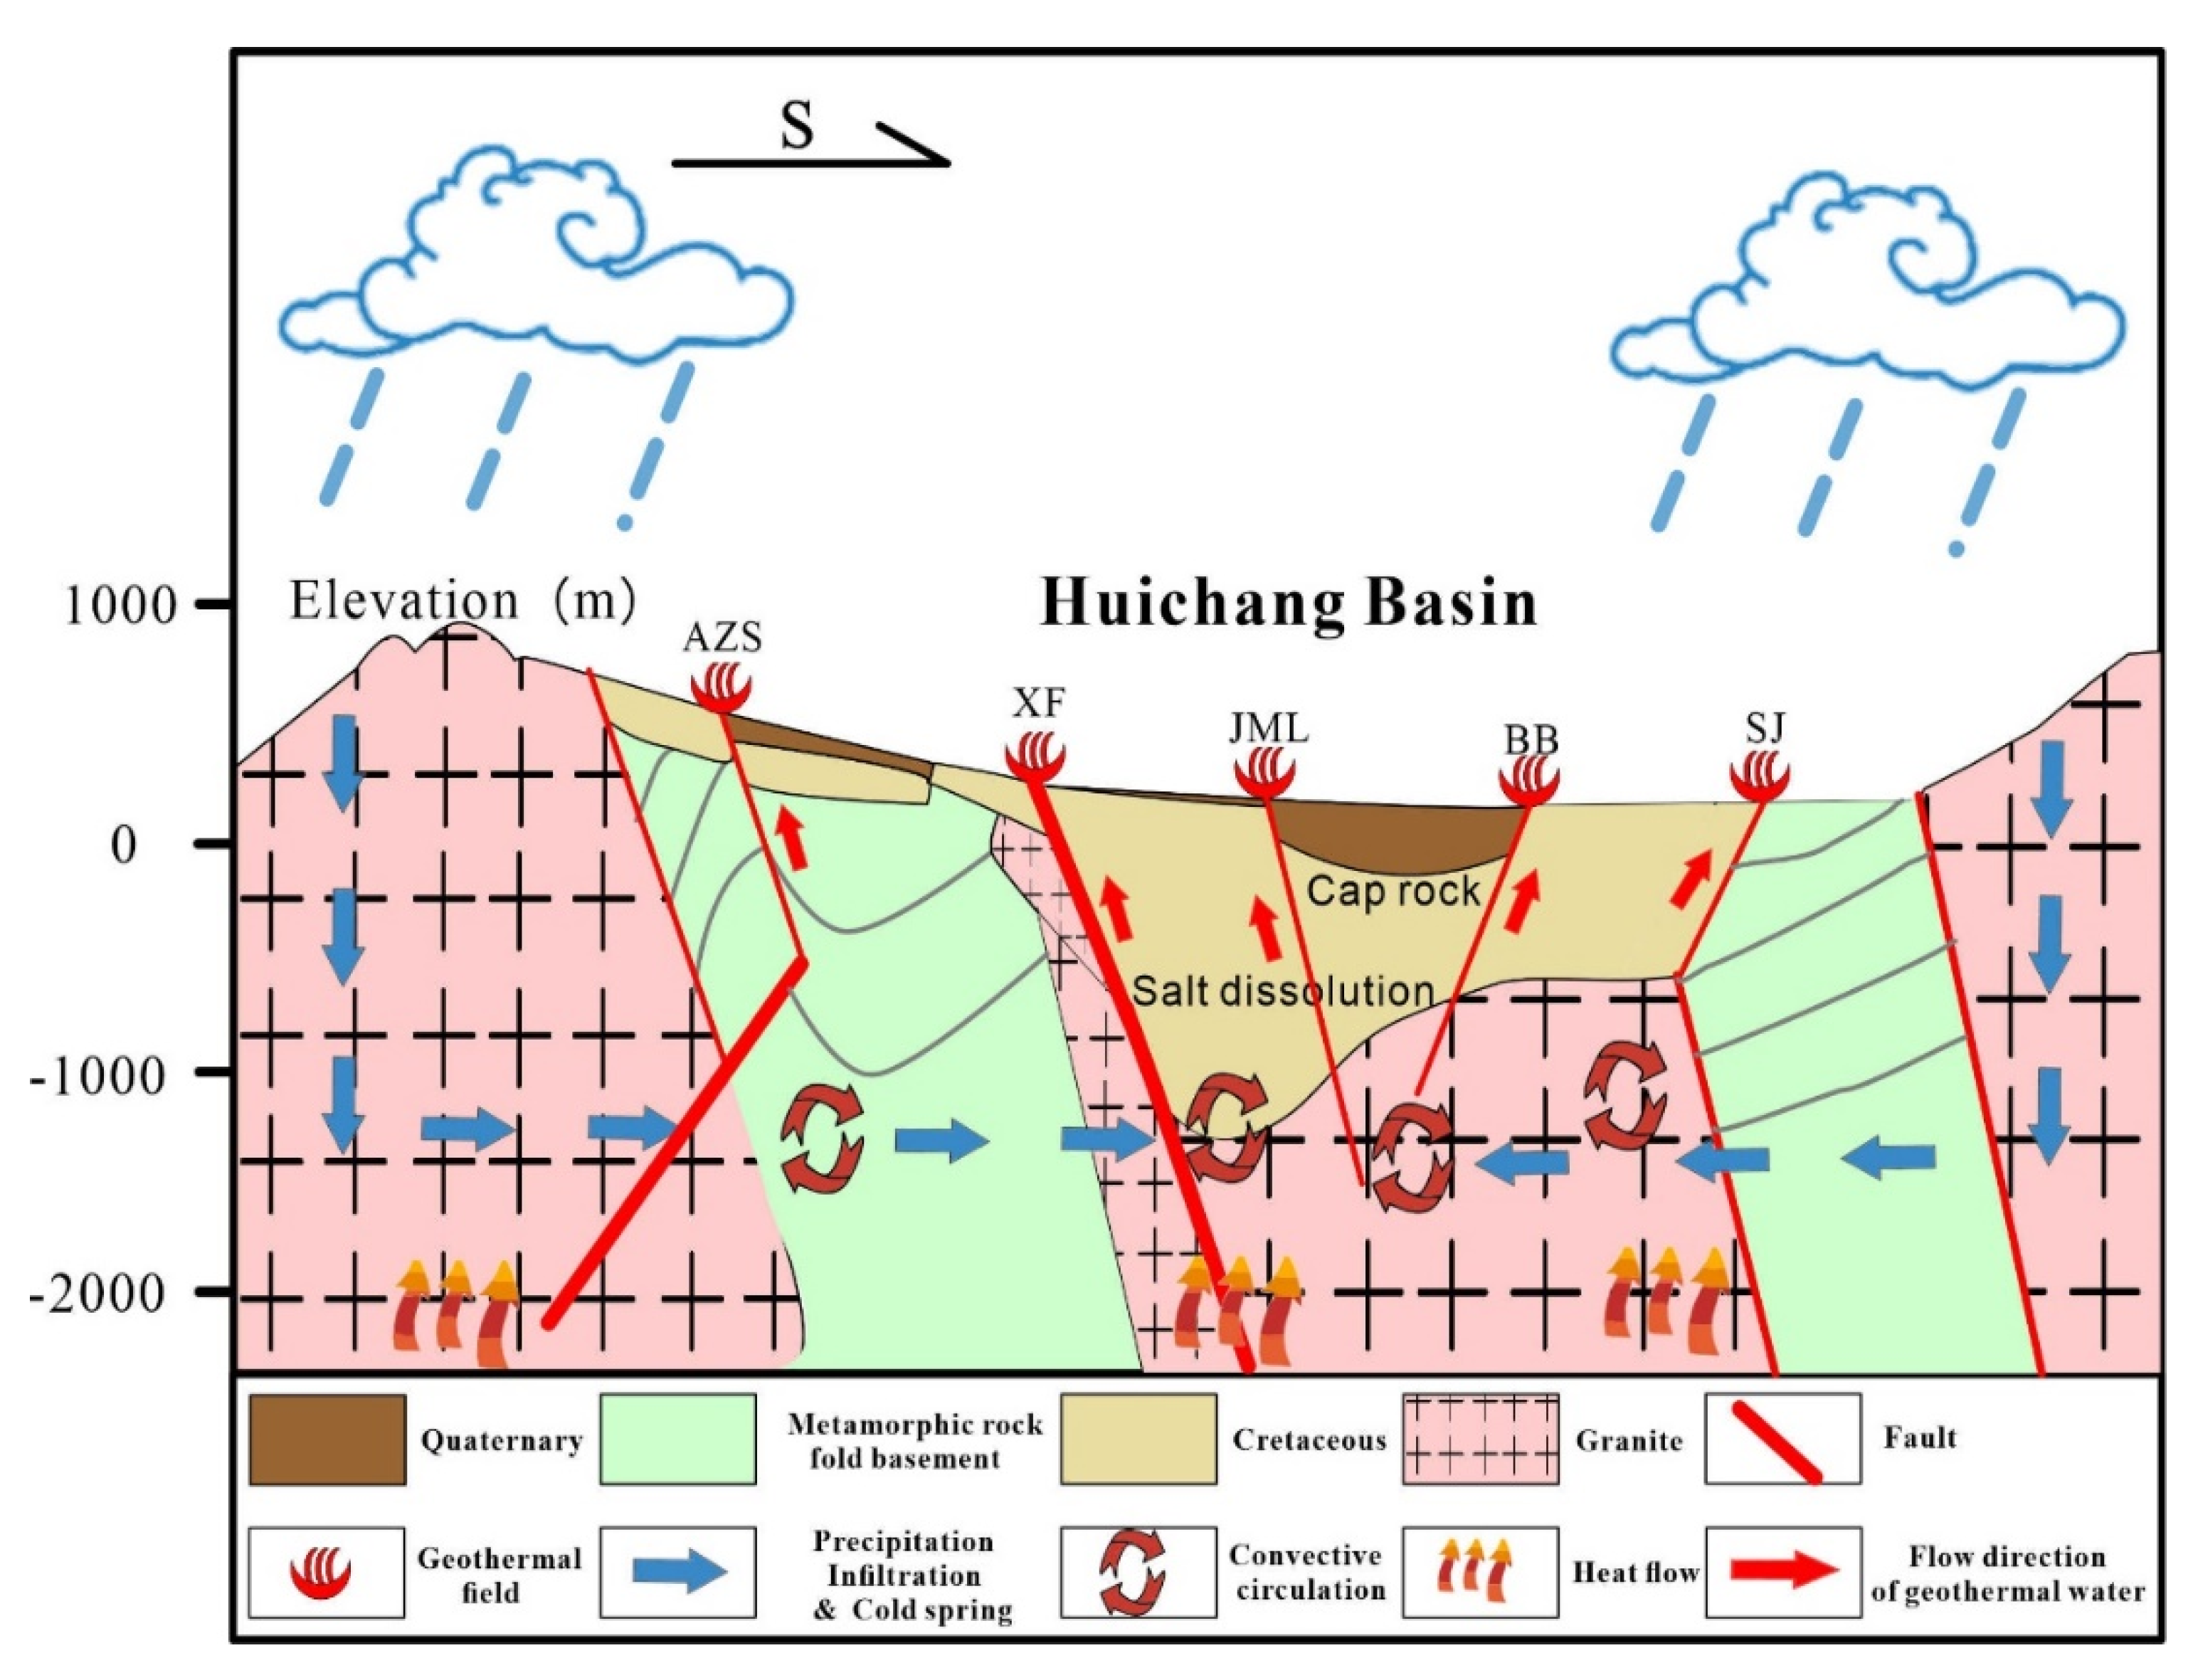
Based on analyses of multiple geothermal fields within a tectonic zone, it has been established that the type of geothermal water in the area of study is primarily convective, associated with medium- and low-temperature fractured systems. The formation of this geothermal type is closely linked to the geological strata and structures. Essential elements influencing convective geothermal water include the source area and the depth of water-resistant/conductive fractures. Granite envelops the basin, providing the necessary thermal energy for the geothermal water. Driven by gravity and other forces, surface water from the recharge zone infiltrates downward through the rock mass fissures. This water then moves deeper into the vertical fractures under the combined influence of gravity and pressure. Within the flow field of the regional structural zone, deep groundwater travels through conduits such as fissure zones and aquifers, with the water temperature rising due to heat transfer. Ultimately, the structural band guides the formation of a geothermal field (
Figure 17).
5. Conclusions
(1) The hydrogeological context and spatial differentiation of hydrochemical types in the Huichang fault depression basin are distinctly evident. On the northern edge of the basin, the Anzishan and Xiefang geothermal fields are characterized by bicarbonate-sulfate sodium-calcium type waters; while on the southern edge, the Shangjin geothermal field features bicarbonate sodium type waters. Within the basin, exemplified by the Babei and Junmenling geothermal fields, the overall Huichang basin geothermal water system predominantly aligns with the bicarbonate-sulfate sodium-calcium type, but with a higher concentration of rock salt, fulfilling the most typical characteristics of basin geothermal waters. Additionally, as the main fault extends southward, there is a transition in the hydrochemical types from bicarbonate-sulfate sodium-calcium to bicarbonate sodium type waters. Correlation analysis indicates that the geothermal waters participate in a deep circulation process via fault structures, with fluoride ions primarily derived from the interaction between the geothermal waters and the underlying concealed granitic rocks.
(2) The primary sources of the chemical components in the geothermal waters of the study area are evaporitic salt rocks and siliciclastic rock formations. The evaporitic salt rocks, exemplified by the Cretaceous sandstone and gravel caprock within the basin, are the main contributors of calcium, sulfate, and chloride ions to the geothermal waters. Siliciclastic rocks have two sources: one being the folded metamorphic rock base of the Sinian-Cambrian series at the northern and southern edges of the basin, and the other being the extensively concealed granitic rocks in the area. The feldspar minerals in the metamorphic and granitic rocks undergo extensive hydrolysis and cation exchange reactions with the geothermal waters, leading to the release of sodium and potassium ions, making these the primary sources of alkali metal cations.
(3) The distribution of hydrogen and oxygen isotopes in the basin's geothermal waters aligns closely with the global and Jiangxi meteoric water lines, indicating recharge elevations near 1 km, which match the DEM elevations of the southeastern coastal hills in the study area. This suggests that the geothermal waters are primarily recharged by nearby hills. Carbon isotope data reveal that the central basin geothermal waters have an apparent age of approximately 26,000 years and predominantly originate from deep mantle sources, with potential minor contributions from biogenic carbon, indicating participation in deep geothermal circulation. Comparative analysis of characteristic coefficients of geothermal waters suggests a transition from open, oxidizing conditions to the closed, reducing conditions typical of high-temperature geothermal reservoirs within the basin, highlighting significant geothermal potential in the interior of the basin.
(4) Geothermal waters in the fault zone generally exhibit mixing. In the Anzishan geothermal field, where water temperatures are lower, silicon dioxide primarily exists in the form of quartz. In contrast, in other geothermal fields, silicon dioxide predominantly exists in the form of chalcedony. For the Anzishan geothermal field, the quartz geothermometer, which involves no steam loss, is appropriate for assessing the reservoir temperature. For the remaining fields, the chalcedony geothermometer is suitable. The results calculated align well with those derived from the corrected multi-mineral equilibrium diagram method, and thus can be considered reliable indicators of the reservoir temperatures. Reservoir temperatures in the study area range between 74−113°C. The lowest temperatures are found in the Anzishan and Shangjin geothermal fields along the basin's edge, while temperatures are higher in the central basin fields, showing a trend of increasing temperature towards the basin's interior. The corresponding circulation depths of the geothermal waters are between 1.5−2.5 km, also displaying a trend of increasing depth towards the interior of the basin.
(5) Simulation results of reverse water-rock interactions indicate a trend of feldspar minerals precipitating from the basin's periphery toward the center, suggesting an enrichment of these minerals in the central region of the basin. Conversely, quartz and layered aluminosilicate minerals (calcium montmorillonite, illite, kaolinite), biotite, and aluminum minerals (gibbsite, bauxite, alunite) predominantly dissolve from north to south. In contrast, carbonate rocks (calcite, aragonite, dolomite), magnesium-rich hydrothermal alteration silicate minerals (talc, chrysotile, sepiolite), reductive alteration minerals (chlorite, fluorite), most evaporite minerals (halite, sylvite, gypsum, anhydrite), and trace elements (celestite, strontianite) generally precipitate from north to south. Geothermal fields commonly exhibit reductive alteration closely associated with granite, significantly linked to the ancient geothermal waters of enclosed basins. The content of radionuclides in hot springs indicates that the formation of geothermal fields is closely related to the decay heat or conductive heat from the radioactive elements in granite. The study area is encompassed by the western Wuyi Mountains and the northern foothills of the Nanling range, with geothermal water sourced extensively from atmospheric precipitation replenishing surrounding mountains and surface water bodies. Precipitation and surface water slowly percolate through fractures, gradually accumulating in secondary fault structures and densely fractured zones. This water then percolates downward along fault zone fractures, enriching geothermal fluids at fault intersections. The overlying Cretaceous sandstone serves as a caprock, while Sinian metamorphic rocks and granite form aquicludes, creating artesian conditions. Deep-seated geothermal fluids, heated by geothermal heat flow, undergo convective circulation. Higher temperature fluids gradually upwell along structural fractures and fault zones, mixing with cooler springs to progressively decrease in temperature, emerging at surface depressions guided by aquicludes or shallow fractures.
Author Contributions
Writing—original draft, J.H. and C.H.; conceptualization, J.H. and L.C.;methodology, P.H. and Y.W.; software, L.C., Y.W., A.; formal analysis, J.H.;investigation, C.H. and J.H.; resources, C.H.; data curation, C.H.; review andediting: J.H. and C.H.; visualization, J.H., L.C.,J.Z.,C.R. and Y.W.; supervision, C.H. and J.H. All authors have read and agreed to the published version of the manuscript.
Funding
This research was funded by the research on the genetic mechanism of geothermal water in Jiangxi Province and the optimization of medium-high temperature geothermal exploration target area ( No.20160007 ), the monitoring of geothermal water movement in central and southern Jiangxi ( No.20190006 ) and the key laboratory fund project of hydrogeology and high-quality groundwater resources development and utilization in Nanchang ( No.20232B21 )
Data Availability Statement
The data presented in this study are available on request from the firstor corresponding authors.
Conflicts of Interest
The authors declare that they have no conflict of interest. The contents of thismanuscript will NOT be copyrighted, submitted, or published elsewhere while acceptance by thelournal is under consideration. There are NO directly related manuscripts or abstracts, published orunpublished, by any authors of this paper.
References
- Yan, J.; Zeng, Z.; Zhou, S.; Ming, Y.; Ren, Z.; Wang, L.; An, B.; Tan, H.; Zhao, J. Study on the resistivity structure and geothermal genesis mechanism of Gudui geothermal field in Tibet, China. Geothermics 2024, 119, 102929. [Google Scholar] [CrossRef]
- Yu, M.; Zhu, A.M.; Huang, X.B.; Wang, B.; Zhou, Z.W.; Yuan, W.; Chen, P.Y.; Liu, Y.; Gao, Z. Evaluation on geothermal resources potential of hot dry rocks in Jiangxi. Miner. Resour. Geol. 2015, 29, 766–770. [Google Scholar] [CrossRef]
- Bo, H.; Song, L.S.; Wang, Y.; Xia, W.P.; Wang, T.T.; Wang, H.; Zhou, S. Preferably Favorable Areas of HDR Resources in Jiangxi Province. J. East China Inst. Technol. 2015, 38, 407–411. [Google Scholar] [CrossRef]
- Yang, H.Z.; Guo, L.; Li, Z.M.; Ma, C.; Chen, Z.R. Analysis on geothermal resource prospect of Shicheng Xunwu dry hot rock in Jiangxi Province. Energ. Environ. 2018, 1, 97–98. [Google Scholar] [CrossRef]
- Liu, Q.J.; Huang, X.; Dong, Y.; Wang, P.X. Study on the thermal control mechanism of Huichang fault in Shaowu-Heyuan fault zone. North China Geol. 2019, 42, 154–160. [Google Scholar] [CrossRef]
- Sun, Z.X.; Li, X.L.; Shi, W.J. Isotopic hydrogeochemistry of mid-low temperature geothermal water in jiangxi province. J. East China Univ. Technol. (in Chinese). 1992, 3, 243–248. [Google Scholar]
- Zou, G.Y.; Yang, Q. Genetic analysis of geothermal water in Shangwenliao, Shicheng County, Jiangxi Province. Nonferr. Metals Abst. 2019, 34, 28–30. (in Chinese). [Google Scholar] [CrossRef]
- Chu, X.D. Genetic Mechanism and Prospecting Prediction of Shicheng Geothermal Field in Jiangxi Province. MA Thesis, Nanjing University, Nanjing, 2016. (in Chinese). [Google Scholar]
- Wang, J.; Xiao, Z.Y.; Hou, H.M. Characteristics and genesis of convective geothermal system in the fault-fold mountains of Southern Jiangxi: A case study of Zhashanli geothermal system in Shicheng County. Resour. Surv. Environ. 2020, 41, 381–386. [Google Scholar] [CrossRef]
- Chen, S.B.; Zhang, H.H.; Chen, C.; Ye, Y.F.; Dong, X. Geothermal Features in Babei Area, Huichang County, Ganzhou. Coal Geol. China 2018, 30, 43–48. [Google Scholar] [CrossRef]
- Yan, X.X.; Lin, W.J.; Gan, H.N.; Yue, G.F.; Wang, G.L. Hydrogeochemical characteristics of Huangshadong geothermal Filed in Guangdong. Earth Environ. Sci. 2019, 237, 032128. [Google Scholar] [CrossRef]
- Fournier, R. Chemical geothermometers and mixing models for geothermal systems. Geothermics 1977, 5, 41–50. [Google Scholar] [CrossRef]
- Wang, J.Y. 7th International Symposium on Water-Rock Interactions. Adv. Earth Sci. 1993, 5, 101–102. (in Chinese). [Google Scholar]
- Zhang, W.M. The Application of SiO2 Geothermometer to Estimating Temperature of the Geothermal Reservoir: Exemplified by some Thermal Springs in Henging Area, South Jiangxi. Acta Geoscientia Sin. 2001, 22, 185–188. [Google Scholar] [CrossRef]
- Hai, K. Estimation of Deep heat storage temperature using multiple methods. MA Thesis, China University of Geosciences (Beijing), Beijing, 2019. (in Chinese). [Google Scholar]
- Chai, R.; Wang, H.; Liu, Y. Application of Multi Mineral Balance Method to Estimation of Geothermal Temperature. Coal Sci. Technol. 2010, 38, 100–103. [Google Scholar] [CrossRef]
- Reed, M.; Spycher, N. Calculation of pH and mineral equilibria in hydrothermal waters with application to geothermometry and studies of boiling and dilution. Geochim. Cosmochim. Acta 1984, 48, 1479–1492. [Google Scholar] [CrossRef]
- Sun, Z.X.; Wu, H.M. Determination of mineral-fluid chemical equilibrium and estimation of heat storage temperature in geothermal systems. In The fourth National Symposium of young Geologists, Beijing, 1999; pp. 595–598. (in Chinese).
- Wu, H.M.; Sun, Z.X. Calculation of the Fluid-rock Equilibrium State in the Geothermal System. J. East China Inst. Technol. 2000, 23, 39–42. [Google Scholar] [CrossRef]
- Giggenbach, W.F. Geothermal solute equilibria. derivation of Na-K-Mg-Ca geoindicators. Geochim. Cosmochim. Acta 1988, 52, 2749–2765. [Google Scholar] [CrossRef]
- Fournier, R.; Truesdell, A. An empirical Na K Ca geothermometer for natural waters. Geochim. Cosmochim. Acta 1973, 37, 1255–1275. [Google Scholar] [CrossRef]
- Giggenbach, W.; Gonfiantini, R.; Jangi, B.; Truesdell, A. Isotopic and chemical composition of Parbati valley geothermal discharges, north-west Himalaya, India. Geothermics 1983, 12, 199–222. [Google Scholar] [CrossRef]
- Fouillac, C.; Michard, G. Sodium/lithium ratio in water applied to geothermometry of geothermal reservoirs. Geothermics 1981, 10, 55–70. [Google Scholar] [CrossRef]
- Verma, S.P.; Santoyo, E. New improved equations for NaK, NaLi and SiO2 geothermometers by outlier detection and rejection. J. Volcanol. Geoth. Res. 1997, 79, 9–23. [Google Scholar] [CrossRef]
- Zhang, M.Z.; Guo, Q.H.; Liu, M.L.; Liu, Q. Geochemical Characteristics and Formation Mechanisms of the Geothermal Waters in the Xinzhou Basin,Shanxi Province. J. China Univ. Geosci. 2023, 48, 973–987. (in Chinese). [Google Scholar]
- Li, J.; Gao, B.; Dong, Y.; Chen, G.; Sun, Z. Sources of geothermal water in Jiangxi Province, SE-China: evidences from hydrochemistry and isotopic composition. Procedia Earth Planet. Sci. 2017, 17, 837–840. [Google Scholar] [CrossRef]
- Wang, X. Formation conditions and Hydrogeochemical Characteristics of geothermal water systems in typical Deep and large fault zones along the coast of Guangdong Province. PhD Dissertation, (in Chinese). China University of Geosciences, Wuhan, 2018. [Google Scholar]
- Yan, X.X.; Gan, H.N.; Yue, G.F. Hydrogeochemical characteristics and genesis of typical geothermal fileds from Huangshadong to Conghua in Guangdong. Geol. Rev. 2019, 65, 743–754. [Google Scholar] [CrossRef]
- Sonney, R.; Mountain, B. Experimental simulation of greywacke–fluid interaction under geothermal conditions. Geothermics 2013, 47, 27–39. [Google Scholar] [CrossRef]
- Pang, Z.H.; Reed, M. Theoretical chemical thermometry on geothermal waters: problems and methods. Geochim. Cosmochim. Acta 1998, 62, 1083–1091. [Google Scholar] [CrossRef]
- Duffield, W.A.; Guffanti, M. The Geothermal Research Program for the US Geological Survey; US Geological Survey: Washington, 1981. [Google Scholar]
- Zheng, M. Hydrochemical characteristics and evolution of hot fluids in the Gudui geothermal field in Comei County, Himalayas. Geothermics 2019, 81, 243–258. [Google Scholar] [CrossRef]
- Steiner, A. Genesis of hydrothermal K-feldspar (adularia) in an active geothermal environment at Wairakei, New Zealand. Mineral. Mag. 1970, 37, 916–922. [Google Scholar] [CrossRef]
- Tao, S.Z.; Liu, D.L. Gerothermal Field Characteristics of Tanlu Fault Zone and Its Neighbouring Regions,Thermal Spring Genesis and Its Gas Composition. Nat. Gas Industry 2000, 20, 42–47. [Google Scholar]
- Zhu, Z.Y. Hydrogeochemical characteristics of middle-deep geothermal water in central and western Jilin Province. MA Thesis, Jilin University, Changchun, 2022. (in Chinese). [Google Scholar]
- Lindsey, C.R.; Neupane, G.; Spycher, N.; Fairley, J.P.; Dobson, P.; Wood, T.; McLing, T.; Conrad, M. Cluster analysis as a tool for evaluating the exploration potential of Known Geothermal Resource Areas. Geothermics 2018, 72, 358–370. [Google Scholar] [CrossRef]
- Zhang, L.P.; Ma, B.Q.; Fan, B.; Meng, H. Hydrochemical origin and indicative significance of deep geothermal water in Lanzhou City. Water Resour. Hydrop. Eng. 2020, 51, 129–139. [Google Scholar] [CrossRef]
- Duan, R. Chemical characteristics and exploitation potential evaluation of geothermal water in Lanzhou urban area. MA Thesis, Chang 'an University, Xi'an, 2022. (in Chinese). [Google Scholar]
- Ye, H.L.; Fan, B.H.; Bai, X.M.; Chen, Q.; Chen, X.Y.; Feng, Z.J.; Cao, J. Analysis of hydrogeochemical characteristics and origin in the Shicheng geothermal belt. Acta Geol. Sin. 2023, 97, 238–249. [Google Scholar] [CrossRef]
- Li, C.J.; Jiang, X.L. The minerogenetic model of two types of fluorite deposits in Southeastern China. Acta Geol. Sin. 1991, 3, 263–274. [Google Scholar] [CrossRef]
- Gibbs, R.J. Mechanisms controlling world water chemistry. Science 1970, 170, 1088–1090. [Google Scholar] [CrossRef]
- Edet, A.; Ekpo, B. Hydrogeochemistry of a fractured aquifer in the Ogoja/Obudu area of SE Nigeria. In Applied groundwater studies in Africa; Adelana, A., MacDonald, A., Eds.; CRC Press: London, 2008; pp. 401–414. [Google Scholar]
- Sheppard, D. Fluid chemistry of the Waimangu geothermal system. Geothermics 1986, 15, 309–328. [Google Scholar] [CrossRef]
- Li, J.; Gao, B.; Dong, Y.; Chen, G.; Sun, Z. Sources of geothermal water in Jiangxi Province, SE-China: evidences from hydrochemistry and isotopic composition. Procedia Earth Planet. Sci. 2017, 17, 837–840. [Google Scholar] [CrossRef]
- Zhang, H.H.; Ye, Y.F.; Dong, X.; Peng, H. Geothermal Water Genesis and Hydrochemical Features in Babei Area, Huichang County, Ganzhou City. Coal Geol. China 2018, 30, 69–71. [Google Scholar] [CrossRef]
- Liu, R.; Li, H.; Zhao, Z.; Zhang, Z. Analysis of geothermal fluid chemical characteristics and genetic model—A case study from the urban area of Jingmen China. Front. Earth Sci. 2023, 10, 1081781. [Google Scholar] [CrossRef]
- Mei, H.C. Characteristics and evaluation of Chexin geothermal resources in Huichang County, Jiangxi Province. Nonferr. Metals Abstr. 2018, 33, 31–32. [Google Scholar] [CrossRef]
- Shand, P.; Darbyshire, D.F.; Love, A.J.; Edmunds, W.M. Sr isotopes in natural waters: Applications to source characterisation and water–rock interaction in contrasting landscapes. Appl. Geochem. 2009, 24, 574–586. [Google Scholar] [CrossRef]
- Gao, S.Q.; Liu, K.; Sun, W.J.; Guo, Z.B. Water chemistry and strontium isotope geochemistry characteristic of granitic banded thermal reservoirs. Yangtze River 2022, 53, 36–42. [Google Scholar] [CrossRef]
- Chen, M.T. Early Mesozoic magmatic activity and gold mineralization in Shicheng - Chong'an fault zone, northern Fujian Province. PhD Thesis, China University of Geosciences, Wuhan, 2020. (in Chinese). [Google Scholar]
- Cui, X.S.; Zheng, Z.X.; Cheng, Z.S.; Su, C.; Chen, Z.Y. Evolution of Unconfined Groundwater in the Northern Tacheng Basin Based on Inverse Modeling. China Rural Water Hydrop. 2022, 11, 20–25. [Google Scholar] [CrossRef]
- Gao, C.R.; Li, Z.X.; Zhou, X.H.; Liu, B.; Liu, W.B.; Li, C.; Feng, D.Y. Occurrence and hydrochemical characteristics of As-rich groundwater in the Linhe district of the Hetao Plain. Hydrogeol. Eng. Geol. 2008, 35, 22–28. [Google Scholar]
- Sun, Z.X.; Wang, X.Y. The effect of silicate hydrolysis on the origin of CO2 in sedimentary basins. J. East China Univ. Technol. (Nat. Sci.) 1990, 13, 31–34. (in Chinese). [Google Scholar]
- Xu, S.K.; Yin, Y.D. Geological outline of single fluorite ore deposit in China. Geol. Chem. Miner. 2001, 23, 134–140. [Google Scholar] [CrossRef]
- Wang, J.P.; Shang, P.Q.; Xiong, X.X.; Yang, H.Y.; Tang, Y. Metallogenic regularities of fluorite deposits in China. Geol. China 2015, 42, 18–32. [Google Scholar]
- Zhao, P.; Wang, J.Y.; Wang, J.A. Preliminary study on the relationship between heat flow and heat generation rate in southeast China. In 9th Annual Conference of the Chinese Geophysical Society, Changsha, China, 1993; p. 149. (in Chinese).
- Xiong, L.P.; Hu, S.B.; Wang, J.A. Analysis of Thermal Conductivity Values of Rocks in Southeast China. Acta Petrol. Sin. 1994, 10, 323–329. (in Chinese). [Google Scholar]
- Zhou, Z.M. Late Mesozoic multi-cycle tectonic-magmatic evolution and geothermal genetic mechanism in South China: constraints from typical pluton in Guangdong. PhD Thesis, China University of Geosciences, Wuhan, 2015. (in Chinese). [Google Scholar]
- Kuang, J.; Qi, S.H.; Wang, S.; Xiao, Z.C.; Zhang, M.; Zhao, X.; Gan, H.N. Huizhou Granite Body in Guangdong and Its Geothermal Significance. Earth Sci. 2020, 45, 1446–1480. (in Chinese). [Google Scholar]
- Rybach, L.; Muffler, L.J.P. Geothermal systems: principles and case histories; Chichester: New York, 1981. [Google Scholar]
- Mendrinos, D.; Choropanitis, I.; Polyzou, O.; Karytsas, C. Exploring for geothermal resources in Greece. Geothermics 2010, 39, 124–137. [Google Scholar] [CrossRef]
Figure 1.
The background of heat flow in the study area.
Figure 1.
The background of heat flow in the study area.
Figure 2.
Geological map (a) and and Terrain, main heat control structures in the study area (b) 1: Anzishan, Ruijin; 2: Xie Fang, Ruijin; 3: Junmenling, Huichang; 4: Babei,Huichang; 5: Shangjin,Xunwu.
Figure 2.
Geological map (a) and and Terrain, main heat control structures in the study area (b) 1: Anzishan, Ruijin; 2: Xie Fang, Ruijin; 3: Junmenling, Huichang; 4: Babei,Huichang; 5: Shangjin,Xunwu.
Figure 3.
The Schoeller diagram of water samples.
Figure 3.
The Schoeller diagram of water samples.
Figure 4.
The contour map of the main ion concentration of geothermal water (unit: mg/L).
Figure 4.
The contour map of the main ion concentration of geothermal water (unit: mg/L).
Figure 5.
The Piper triangular diagram of water samples.
Figure 5.
The Piper triangular diagram of water samples.
Figure 6.
Multi-mineral equilibrium diagram of geothermal water.
Figure 6.
Multi-mineral equilibrium diagram of geothermal water.
Figure 7.
Multi-mineral equilibrium diagrams of Anzishan and Xiefang.
Figure 7.
Multi-mineral equilibrium diagrams of Anzishan and Xiefang.
Figure 8.
Multi-mineral equilibrium diagrams of Junmenling and Babei.
Figure 8.
Multi-mineral equilibrium diagrams of Junmenling and Babei.
Figure 9.
Multi-mineral equilibrium diagrams of Shangjin.
Figure 9.
Multi-mineral equilibrium diagrams of Shangjin.
Figure 10.
The Na-K-Mg triangular diagram of geothermal water samples.
Figure 10.
The Na-K-Mg triangular diagram of geothermal water samples.
Figure 11.
The decision graph of the existence form of quartz and chalcedony.
Figure 11.
The decision graph of the existence form of quartz and chalcedony.
Figure 12.
δD-δ18O plot for water samples.
Figure 12.
δD-δ18O plot for water samples.
Figure 13.
Cl−, SO42−, HCO3− plot for water samples.
Figure 13.
Cl−, SO42−, HCO3− plot for water samples.
Figure 14.
Determination of water-rock interaction mode.
Figure 14.
Determination of water-rock interaction mode.
Figure 15.
Relationship between geothermal water ions.
Figure 15.
Relationship between geothermal water ions.
Figure 16.
Simulation results of mineral saturation index.
Figure 16.
Simulation results of mineral saturation index.
Figure 17.
Genetic model for the geothermal water in the study area.
Figure 17.
Genetic model for the geothermal water in the study area.
Table 1.
Main ion concentration (mg/L) of water samples.
Table 1.
Main ion concentration (mg/L) of water samples.
| ID |
pH |
T(℃) |
Ca2+
|
Mg2+
|
K+
|
Na+
|
Cl-
|
SO42-
|
HCO3-
|
F-
|
SiO2
|
H2SiO3
|
TDS |
Li |
Sr |
HBO2 |
| AZSWQ1 |
6.5 |
28 |
117.28 |
8.55 |
24.86 |
203.48 |
15.14 |
220 |
666.08 |
0.36 |
22.63 |
29.42 |
946.09 |
0.612 |
0.743 |
0.19 |
| AZSZK01-1 |
6.18 |
28 |
117.37 |
13.01 |
23.65 |
214.48 |
17.35 |
250 |
689.16 |
1.76 |
23.94 |
31.12 |
1006.88 |
0.693 |
0.905 |
0.24 |
| AZSZK02-1 |
6.56 |
30 |
53.6 |
19.82 |
31.84 |
294.97 |
26.59 |
250 |
805.53 |
3.7 |
27.84 |
36.2 |
1111.69 |
1.138 |
1.201 |
0.313 |
| AZSZK02-2 |
6.22 |
30 |
44.96 |
6.44 |
16.67 |
120.03 |
6.37 |
153.6 |
268.14 |
5.68 |
19.5 |
25.34 |
644.26 |
0.53 |
0.38 |
0.13 |
| AZSZK02-3 |
6.45 |
30 |
52.8 |
4.36 |
11.41 |
68.87 |
3.27 |
112.25 |
241.61 |
6.07 |
19.77 |
25.71 |
523 |
0.27 |
0.25 |
0.084 |
| AZSZK03-1 |
6.42 |
39 |
176.84 |
24.85 |
39.75 |
173.99 |
21.46 |
459.88 |
966.28 |
5.63 |
29.17 |
37.92 |
1419.42 |
0.8 |
0.96 |
0.27 |
| AZSZK03-2 |
6.58 |
39 |
145.88 |
31.14 |
34.44 |
289.11 |
18.57 |
451.65 |
796.26 |
4.82 |
30.98 |
40.28 |
1805.39 |
1.05 |
1.15 |
0.016 |
| AZSZK03-3 |
6.95 |
39 |
153.1 |
26.49 |
43.62 |
294.25 |
21.21 |
441.7 |
846.89 |
5.72 |
41.4 |
25.71 |
1882 |
1.14 |
1.3 |
0.37 |
| XFZK01-1 |
7.08 |
38 |
54.84 |
0.77 |
7.65 |
181.6 |
16.33 |
185 |
402.01 |
4.5 |
102.72 |
133.53 |
754.92 |
0.538 |
1.508 |
0.16 |
| XFZK01-2 |
6.97 |
38 |
73.5 |
0.99 |
6.77 |
156.8 |
21.13 |
175 |
366.9 |
3.76 |
101.28 |
141.54 |
995.64 |
0.663 |
0.57 |
0.205 |
| XFZK01-3 |
7.57 |
38 |
80.39 |
1.08 |
7.11 |
168.4 |
1.13 |
238.46 |
381.69 |
4.5 |
103.28 |
131.66 |
723.2 |
0.445 |
1.451 |
0.112 |
| XFZK02-1 |
7.16 |
43 |
85.61 |
0.68 |
9.26 |
234.57 |
22.22 |
300 |
459.44 |
4.2 |
108.88 |
134.28 |
1044.49 |
0.589 |
2.83 |
0.156 |
| XFZK02-2 |
7.15 |
43 |
117.3 |
0.98 |
8.74 |
216.45 |
27.23 |
350 |
432.76 |
3.6 |
103.29 |
134.26 |
812.11 |
0.414 |
1.497 |
0.115 |
| XFZK02-3 |
7.48 |
43 |
123 |
1.02 |
8.64 |
220.1 |
18.62 |
408.8 |
430.07 |
4.24 |
102.48 |
133.22 |
1106.14 |
0.529 |
2.609 |
0.166 |
| BBZK01-1 |
7.87 |
34.8 |
64.26 |
5.93 |
10.17 |
231.85 |
201.22 |
42.99 |
487.86 |
4.78 |
72.44 |
94.16 |
881.35 |
0.287 |
0.499 |
0.047 |
| JMLWQ01 |
7.6 |
52 |
52.86 |
2.86 |
13.5 |
267.5 |
219.57 |
50 |
468.02 |
4.8 |
83.68 |
108.78 |
929.03 |
0.302 |
0.3 |
0.041 |
| JMLSK03-1 |
7.22 |
50 |
49.91 |
2.64 |
11.63 |
181.63 |
152.3 |
26.62 |
377.98 |
6.12 |
74.34 |
96.65 |
883.82 |
0.29 |
0.28 |
0.048 |
| JMLSK04-1 |
7.24 |
52 |
47.32 |
2.59 |
11.58 |
178.3 |
151.2 |
33.55 |
367.4 |
6.13 |
72.73 |
94.56 |
871.66 |
0.29 |
0.28 |
0.047 |
| JMLSK06-1 |
7.22 |
52 |
49.37 |
2.54 |
11.46 |
181.63 |
151.5 |
24.09 |
374.87 |
6.13 |
71.17 |
92.52 |
873.29 |
0.29 |
0.28 |
0.049 |
| SJWQ01 |
7.56 |
35 |
28.67 |
1.61 |
6.61 |
205.18 |
9.28 |
98.68 |
460.41 |
6.58 |
67.1 |
87.23 |
660.28 |
0.587 |
0.623 |
0.044 |
| SJZK1-1 |
7.26 |
29 |
34 |
1.11 |
5.24 |
197.9 |
12.78 |
112.5 |
483.62 |
9.4 |
65.46 |
85.1 |
680.75 |
0.673 |
0.893 |
0.066 |
| SJZK2-1 |
7.79 |
40 |
19.36 |
1.62 |
4.61 |
188.65 |
15.49 |
90 |
442.16 |
4.9 |
43.56 |
56.62 |
590.29 |
0.559 |
0.661 |
0.059 |
| SJZK2-2 |
7.82 |
40 |
18.83 |
1.13 |
5.92 |
200.94 |
8.34 |
114.05 |
414.93 |
7.08 |
65.36 |
84.97 |
635.16 |
0.534 |
0.485 |
0.043 |
| SJZK2-3 |
7.62 |
40 |
31.81 |
1.93 |
7.01 |
200.81 |
10.53 |
99.6 |
450.77 |
6.48 |
65.8 |
86.42 |
649.36 |
0.588 |
0.562 |
0.043 |
| ASZ-Cold |
6.5 |
25 |
6.08 |
2.02 |
<0.07 |
1.8 |
0.13 |
2.79 |
44 |
0.091 |
16.7 |
21.8 |
51.6 |
0.001 |
0.017 |
0 |
| XF-Cold |
6.43 |
26 |
0.673 |
0.148 |
0.083 |
3.62 |
0.412 |
3.41 |
13.5 |
0.756 |
21.4 |
27.8 |
37.3 |
0 |
0.003 |
0 |
| JML-Cold |
5.95 |
25 |
6.29 |
0.668 |
4.2 |
4.07 |
2.76 |
1.54 |
19 |
0.145 |
13.1 |
17 |
42.3 |
0.001 |
0.041 |
0.0011 |
| SJ-Cold |
6.42 |
25 |
5.12 |
0.189 |
2.58 |
8.28 |
0.553 |
4.68 |
48.8 |
0.664 |
24.9 |
32.4 |
71.4 |
0.017 |
0.029 |
0.0011 |
Table 2.
Typical geothermal water isotope data in the center of the basin.
Table 2.
Typical geothermal water isotope data in the center of the basin.
| Water type |
14C(pMC) |
Apparent age (a) |
δ13C(PDB, %) |
Ca2+(mg/L) |
Sr2+(ug/L) |
87Sr/86Sr |
δ18O‰ |
δD‰ |
| JML-Geothermal water |
3.69 +/− 0.04 |
25933.78 |
−3.6 |
36.9 |
304 |
0.715185 |
−7.47 |
−46.21 |
| JML-Surface water |
/ |
/ |
/ |
/ |
/ |
/ |
−4.79 |
−40.3 |
| JML-Cold spring |
/ |
/ |
/ |
/ |
/ |
/ |
−5.47 |
−31.5 |
| JML-rainwater |
/ |
/ |
/ |
/ |
/ |
/ |
−5.98 |
−33.4 |
| BB-Geothermal water |
/ |
/ |
/ |
/ |
/ |
/ |
−7.39 |
−53.1 |
Table 3.
Radioactive data of geothermal water in the north margin of the basin.
Table 3.
Radioactive data of geothermal water in the north margin of the basin.
| Geothermal water |
stratum |
T(℃) |
U(g/L) |
Ra(g/L) |
Rn(em/L) |
| AZS |
metamorphic rocks |
28 |
5.2×10⁻⁸
|
0.9×10⁻¹¹
|
0.824 |
| XF |
granite |
38 |
1.56×10⁻⁶
|
4.95×10⁻¹¹
|
36.03 |
Table 4.
Geothermal temperature scale formula.
Table 4.
Geothermal temperature scale formula.
| Formula number |
Geothermometry |
Emprical formula |
Calculation instructions |
| 1 |
Na−K ,°C |
|
Giggenbach ,
1988 [20] |
| 2 |
Na−K−Ca ,°C |
|
Fournier and
Truesdell,1973 [21] |
| 3 |
K−Mg,℃ |
|
Giggenbach
et al.,1983 [22] |
| 4 |
Na−Li,℃ |
|
Fouillac and
Michard,1981 [23] |
| 5 |
Quartz,no steam loss, ℃ |
|
Foumnier,1977 [12] |
| 6 |
Quartz, ℃ |
+79.305*lg(SiO2) |
Verma and Santoyo,1997 [24] |
| 7 |
Chalcedony, ℃ |
|
Foumnier,1977 [12] |
Table 5.
Results of geothermometer method(mean value), ℃.
Table 5.
Results of geothermometer method(mean value), ℃.
| Geothermal field |
Quartz,no steam loss |
Quartz |
Chalcedony |
Na−K |
Na−K−Ca |
K−Mg |
Na−Li |
| AZS |
74 |
85 |
42 |
261 |
148 |
87 |
224 |
| XF |
139 |
142 |
113 |
170 |
100 |
91 |
202 |
| JML |
122 |
128 |
94 |
195 |
124 |
88 |
167 |
| BB |
120 |
126 |
92 |
174 |
112 |
74 |
158 |
| SJ |
111 |
118 |
82 |
150 |
105 |
77 |
207 |
Table 8.
Correction results of aluminum and CO2 concentration.
Table 8.
Correction results of aluminum and CO2 concentration.
| Geothermal field |
Al(mg/L) |
CO2(mg/L) |
| AZS |
0.061 |
40.26 |
| XF |
0.034 |
20.24 |
| JML |
0.089 |
36.52 |
| BB |
0.198 |
42.46 |
| SJ |
0.049 |
32.56 |
Table 9.
Table 9. The corrected results of multi-mineral equilibrium graphic method
Table 9.
Table 9. The corrected results of multi-mineral equilibrium graphic method
| Geothermal field |
Minerals(near -equilibrium) |
Geothermal Reservoir Temperature (interval)/℃ |
| AZS |
6 (Aragonite, Calcite, Fluorite,
Ca-Montmorillonite, carbon dioxide, Quartz) |
60 |
| XF |
7 (Anhydrite, Chalcedony, Chrysotile,
Fluorite, Quartz, K-mica, Strontianite) |
120 |
| BB |
7 (Chalcedony, Fluorite, Quartz,
Water vapor, K-mica, Sepiolite, Strontianite) |
100 |
| JML |
6 (Chalcedony, Fluorite, Quartz,
K-mica, Chrysotile, Water vapor) |
100 |
| SJ |
7 (Chalcedony, Fluorite, Quartz, Chrysotile,
Water vapor, K-mica, Strontianite) |
90 |
Table 10.
The credible value of geothermal reservoir temperature and circulation depth.
Table 10.
The credible value of geothermal reservoir temperature and circulation depth.
| Geothermal field |
Wellhead temperature/℃ |
Geothermal temperature scale |
Geothermal reservoir temperature /℃ |
Cycle depth/km |
| AZS |
32.88 |
Quartz ,no steam loss |
74 |
1.488 |
| XF |
40.5 |
Chalcedony |
113 |
2.574 |
| JML |
51.5 |
Chalcedony |
94 |
2.045 |
| BB |
34.8 |
Chalcedony |
92 |
1.989 |
| SJ |
36.8 |
Chalcedony |
82 |
1.711 |
Table 11.
Geothermal water characteristic coefficients (mean value).
Table 11.
Geothermal water characteristic coefficients (mean value).
| Geothermal field |
γ (Na+)/γ (Cl-) |
γ (Cl-)/γ (Ca2+) |
100×γ (SO42-)/
γ (Cl-) |
| AZS |
22.04 |
0.19 |
753.57 |
| XF |
15.07 |
0.28 |
501.31 |
| BB |
1.78 |
3.54 |
7.88 |
| JML |
1.84 |
3.51 |
6.84 |
| SJ |
28.66 |
0.51 |
357.09 |
Table 12.
Correlation coefficients of geothermal water chemistry indexes.
Table 12.
Correlation coefficients of geothermal water chemistry indexes.
| |
Ca |
Mg |
K |
Na |
Cl |
SO4 |
HCO3 |
F |
TDS |
| Ca |
1 |
|
|
|
|
|
|
|
|
| Mg |
0.974 |
1 |
|
|
|
|
|
|
|
| K |
-0.492 |
-0.644 |
1 |
|
|
|
|
|
|
| Na |
0.563 |
0.405 |
0.434 |
1 |
|
|
|
|
|
| Cl |
0.656 |
0.514 |
0.322 |
0.992 |
1 |
|
|
|
|
| SO4 |
0.550 |
0.455 |
0.350 |
0.935 |
0.946 |
1 |
|
|
|
| HCO3 |
0.863 |
0.757 |
0.007 |
0.903 |
0.947 |
0.867 |
1 |
|
|
| F |
-0.795 |
-0.680 |
-0.119 |
-0.945 |
-0.978 |
-0.918 |
-0.992 |
1 |
|
| TDS |
0.123 |
-0.072 |
0.800 |
0.866 |
0.802 |
0.757 |
0.589 |
-0.666 |
1 |
|
Disclaimer/Publisher’s Note: The statements, opinions and data contained in all publications are solely those of the individual author(s) and contributor(s) and not of MDPI and/or the editor(s). MDPI and/or the editor(s) disclaim responsibility for any injury to people or property resulting from any ideas, methods, instructions or products referred to in the content. |
© 2024 by the authors. Licensee MDPI, Basel, Switzerland. This article is an open access article distributed under the terms and conditions of the Creative Commons Attribution (CC BY) license (http://creativecommons.org/licenses/by/4.0/).
