Submitted:
06 May 2024
Posted:
06 May 2024
You are already at the latest version
Abstract
Keywords:
1. Introduction
2. Samples and Experimental Methods
2.1. Samples
2.1.1. Shale Samples
2.1.2. Crude Oil Samples
2.2. Experimental Setup and Procedure
2.2.1. Temperature and Thermal Simulation Hydrocarbon Production Experiment
2.2.2. Fluid Pressure and Thermal Simulation Hydrocarbon Production Experiment
2.2.3. Crude Oil In-Situ Conversion Thermal Simulation Hydrocarbon Production Experiment
3. Results and Discussion
3.1. Relationship between Temperature and Ro in Thermal Simulation Experiment
3.2. Method of Evaluating Hydrocarbon Production via In-Situ Conversion of Solid Organic Matter in Shale
3.2.1. Basic Model for Evaluating Hydrocarbon Production via In-Situ Conversion of Solid Organic Matter
3.2.2. Method of Correcting Fluid Pressure on the Hydrocarbon Production via In-Situ Conversion
3.2.3. Method of Correcting Hydrocarbon Generation Potential of Shale
3.2.4. Corrected Model for Evaluating Hydrocarbon Production via In-Situ Conversion of Solid Organic Matter
3.3. Method of Evaluating the Contribution of the Residual Hydrocarbons to the Hydrocarbon Production via In-Situ Conversion
3.3.1. Method of Evaluating the Residual Hydrocarbon Reserves
3.3.2. Method of Evaluating the Contribution of the Residual Hydrocarbons to the Hydrocarbon Production via In-Situ Conversion
3.4. Method of Evaluating Recoverable Hydrocarbon Reserves via In-Situ Conversion of Immature to Low-Moderate Maturity Shale
3.4.1. Model for Evaluating the In-Situ Converted Recoverable Hydrocarbons per Unit Mass of Shale
3.4.2. Model for Evaluating the Abundance of In-Situ Converted Recoverable Hydrocarbons
3.4.3. Method of Determining the Lower Limits of the Recoverable Oil Reserves for In-Situ Conversion
- (1)
- Method for determining the lower limit of the recoverable oil reserves
- Method for determining the lower limit of the recoverable oil reserves per unit mass of rock
3.4.4. Method of Determining Favorable Layers for In-Situ Conversion
3.4.5. Method of Determining Favorable Areas for In-Situ Conversion
3.5. Evaluation of Recoverable Hydrocarbon Reserves in the Nenjiang Formation in the Songliao Basin
3.5.1. Geologic Background
3.5.2. Key Parameters for In-Situ Conversion
- (1)
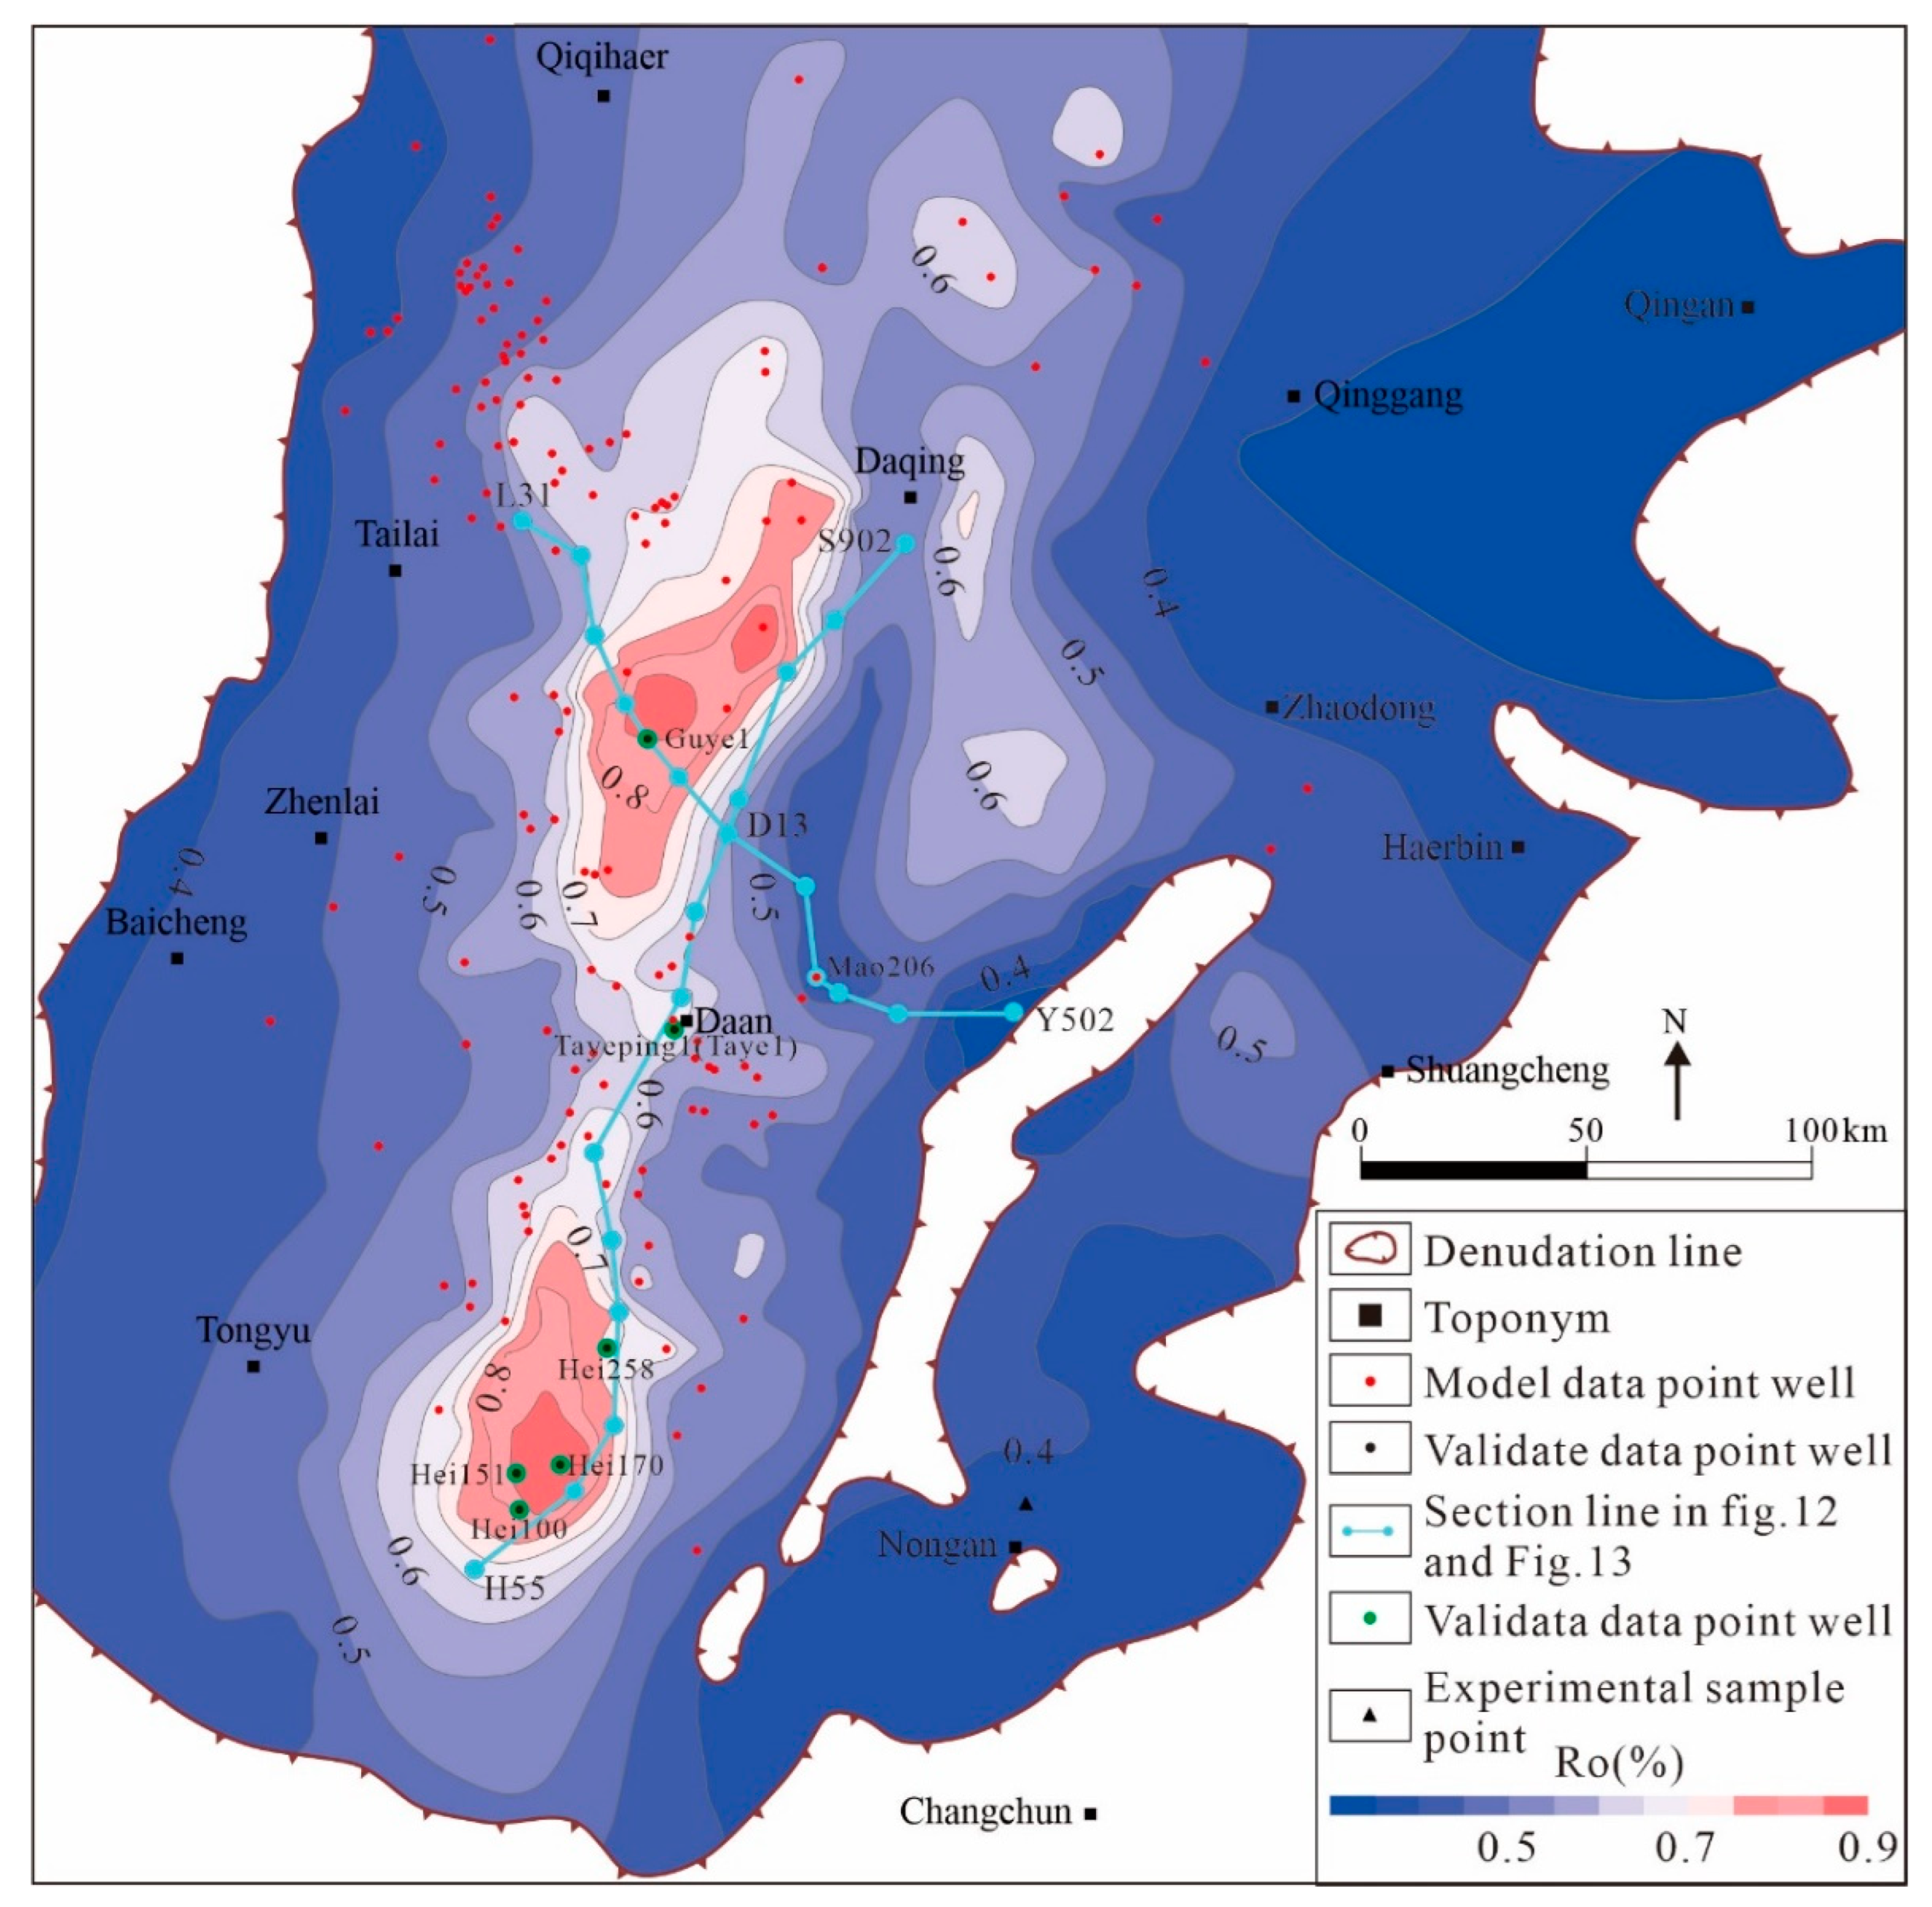
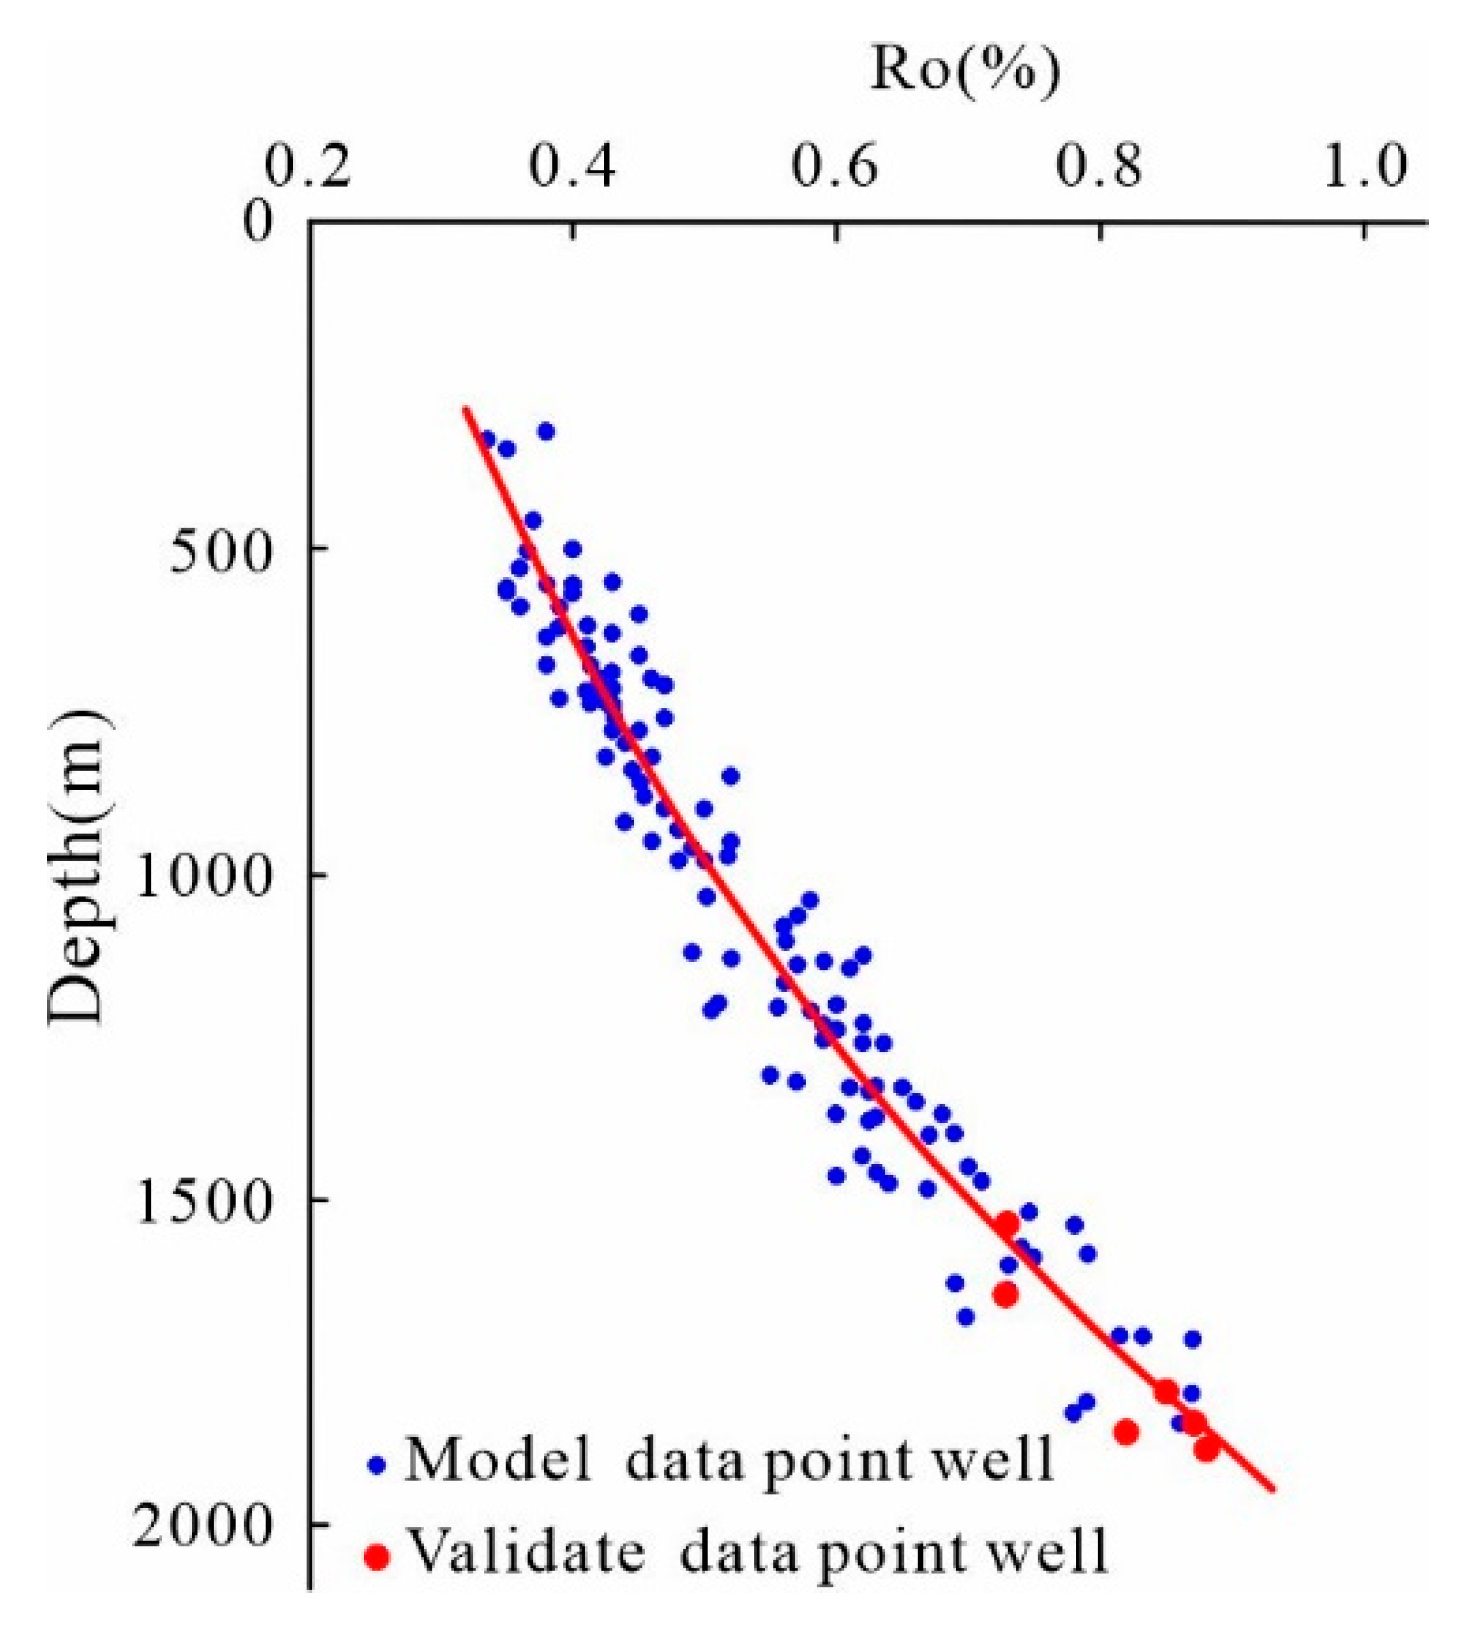
- Maturity of organic matter
- (2)
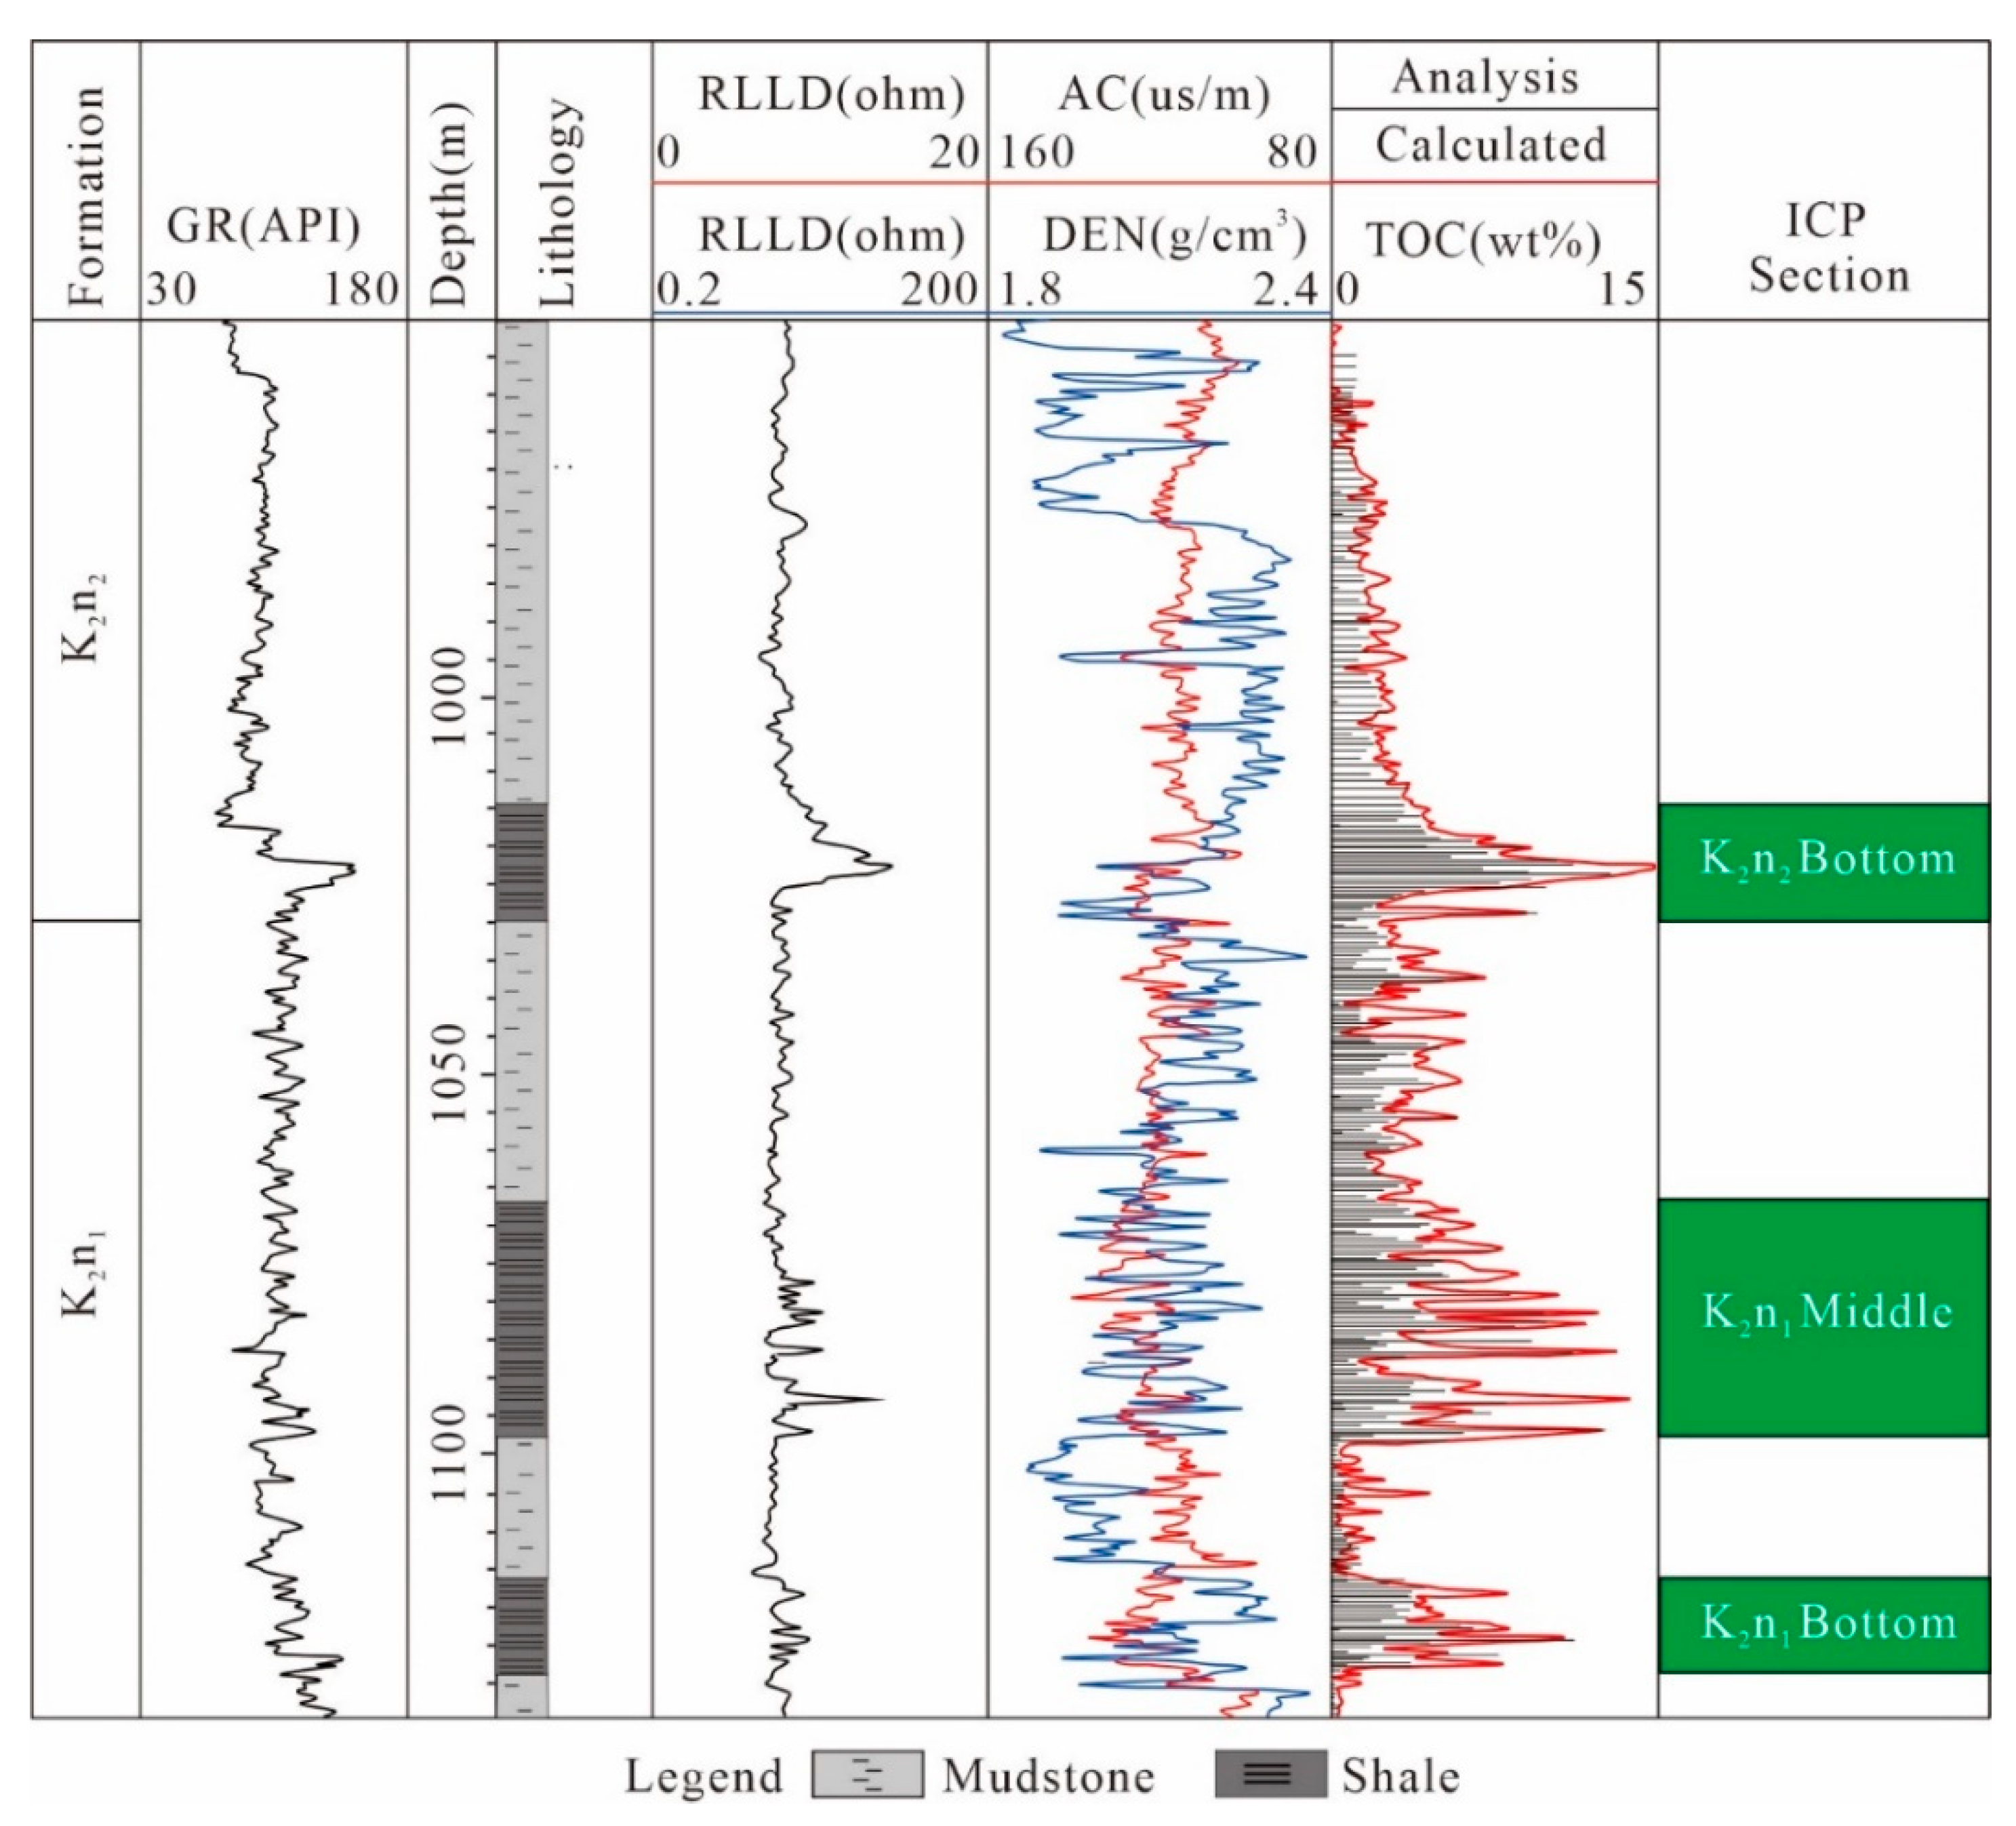
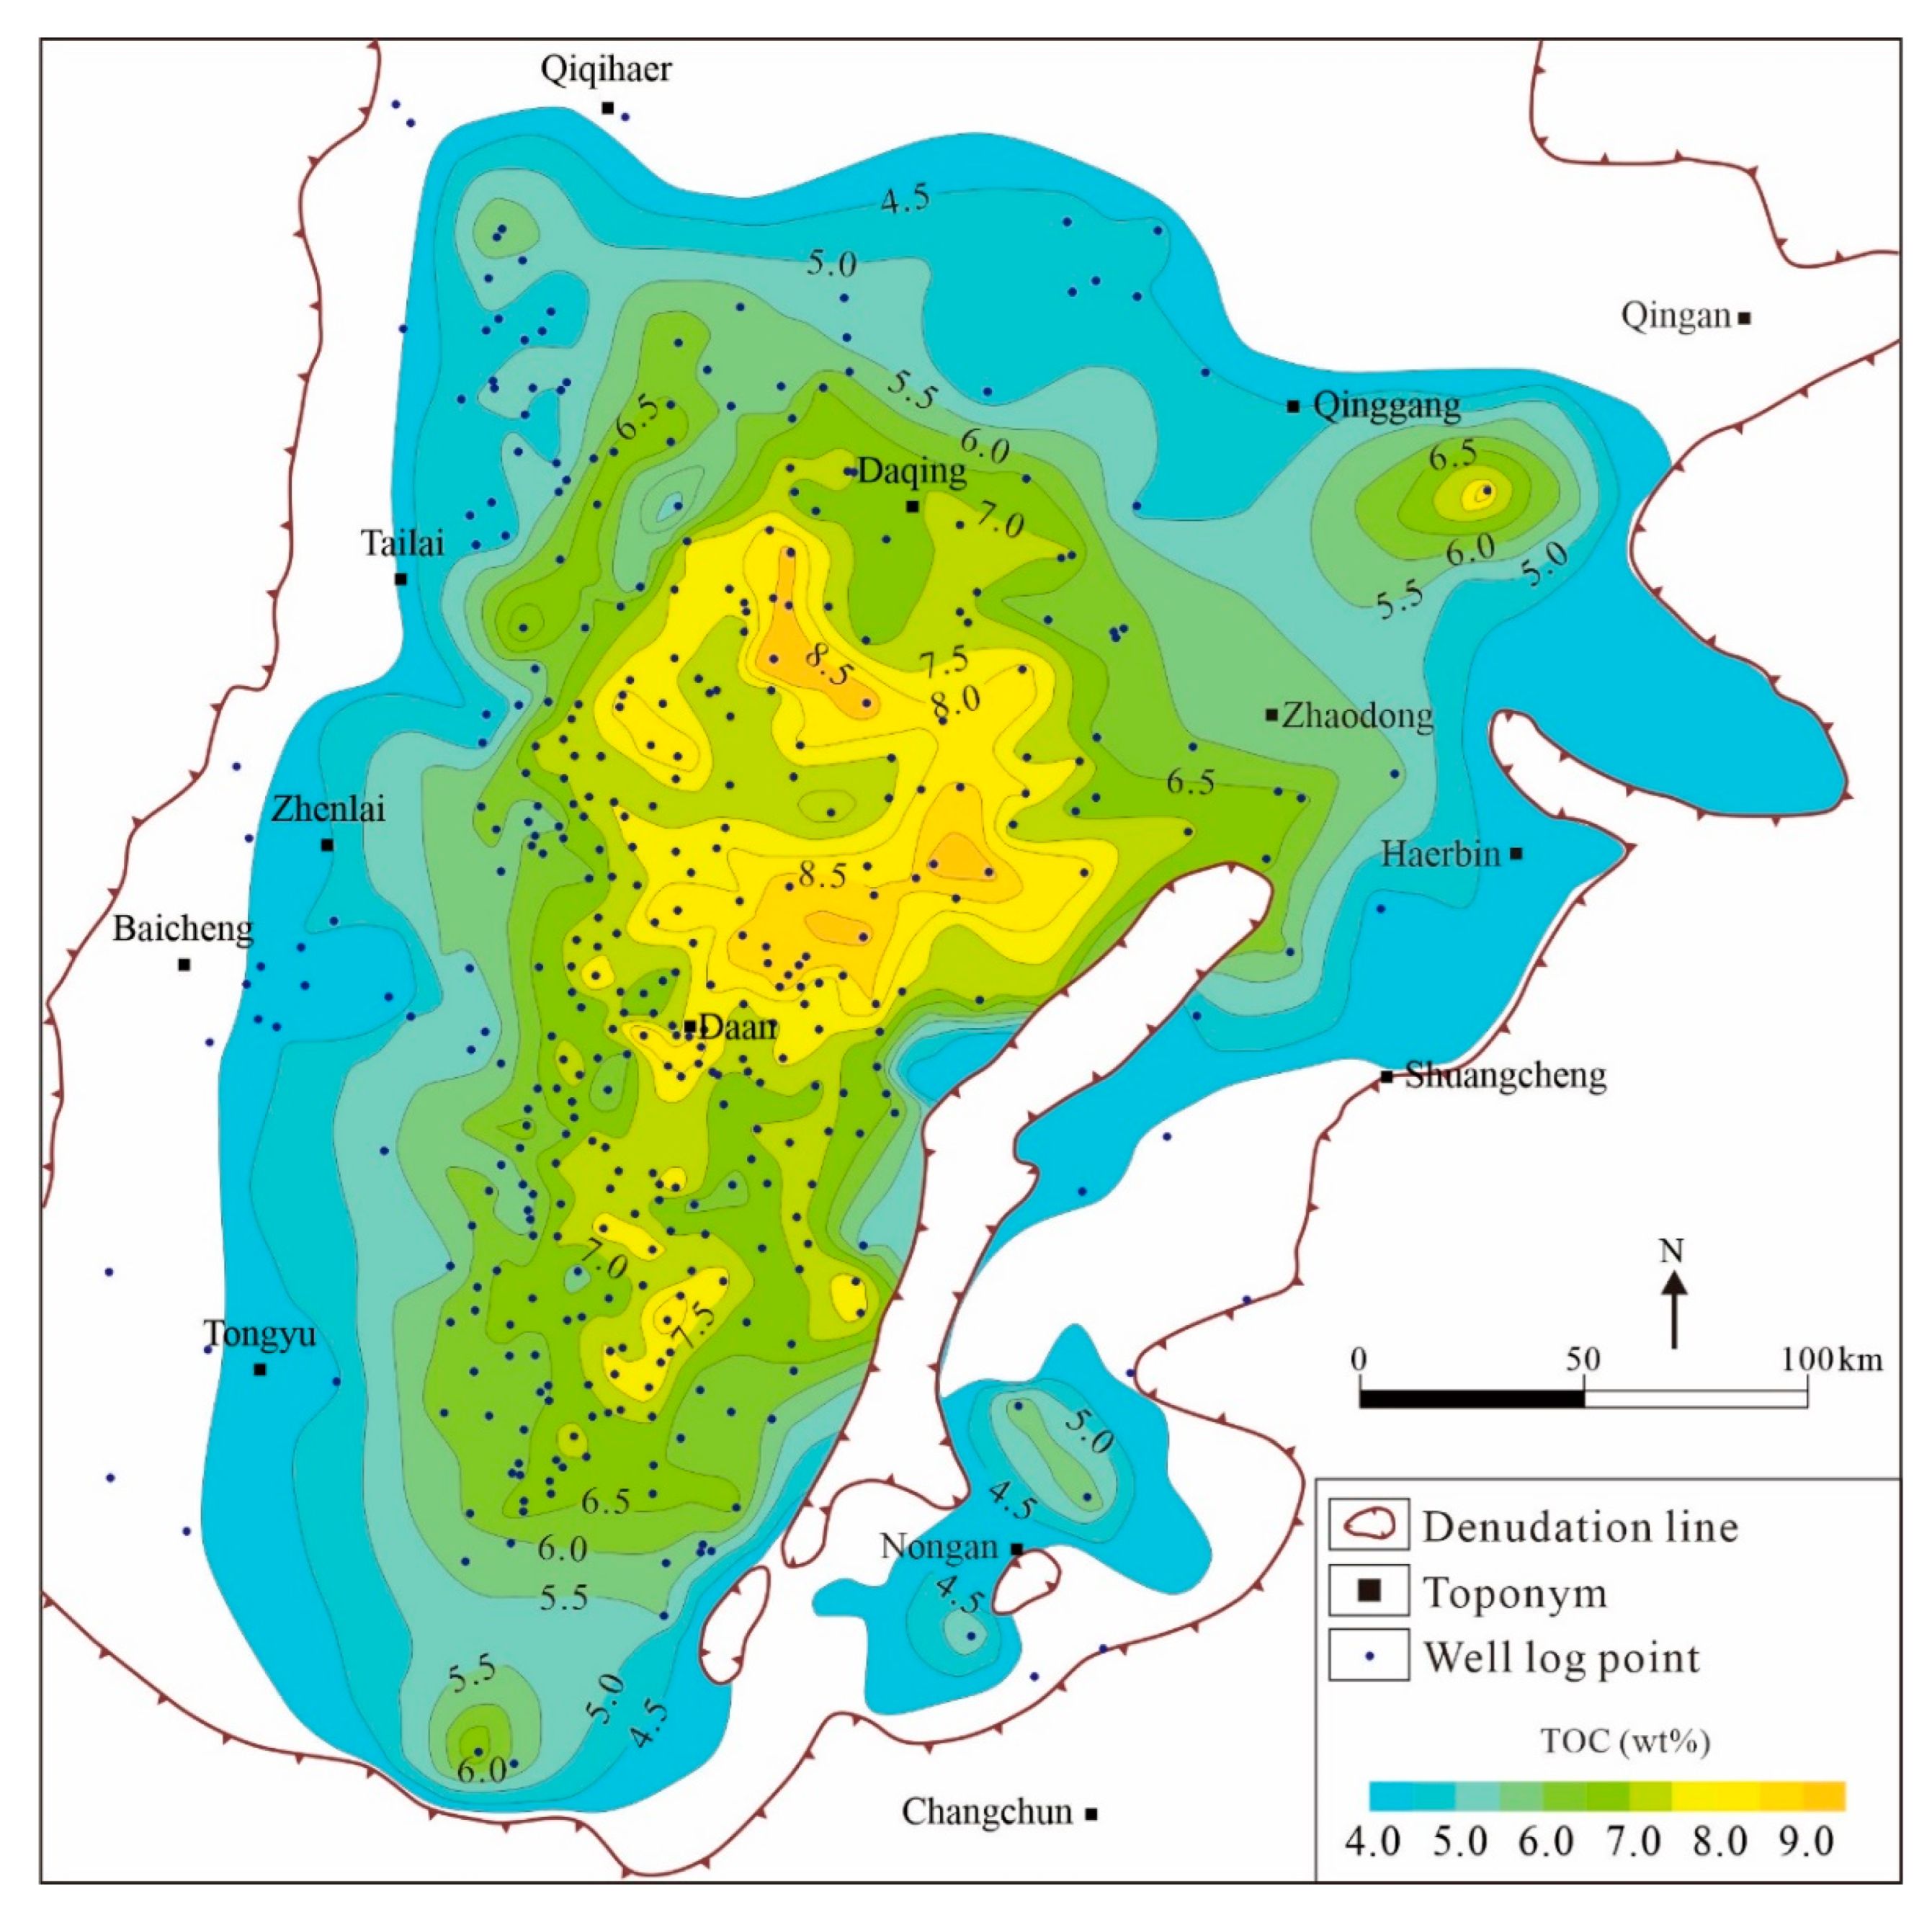
- Total organic carbon content
- (3)
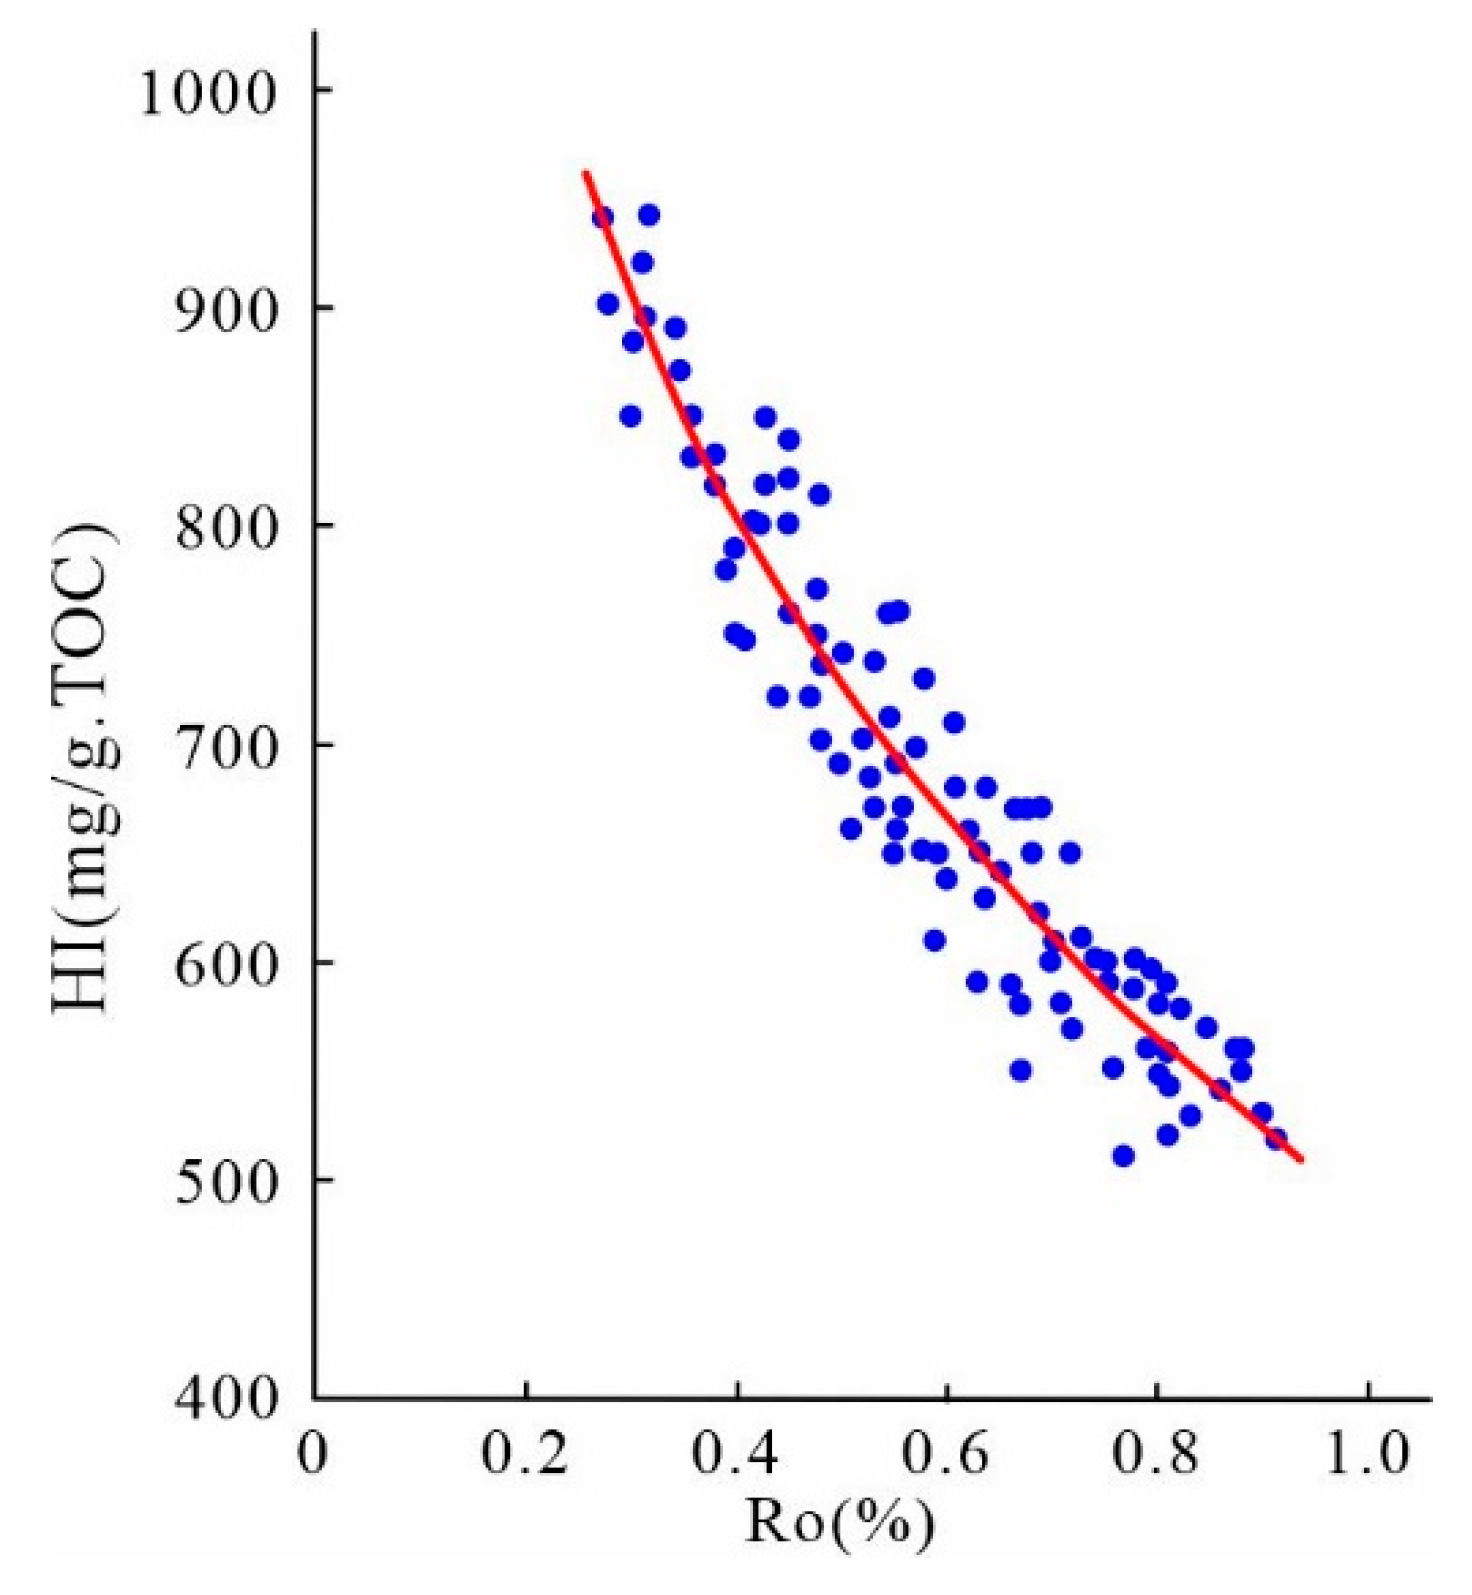
- Hydrocarbon generation potential of shale
- (4)
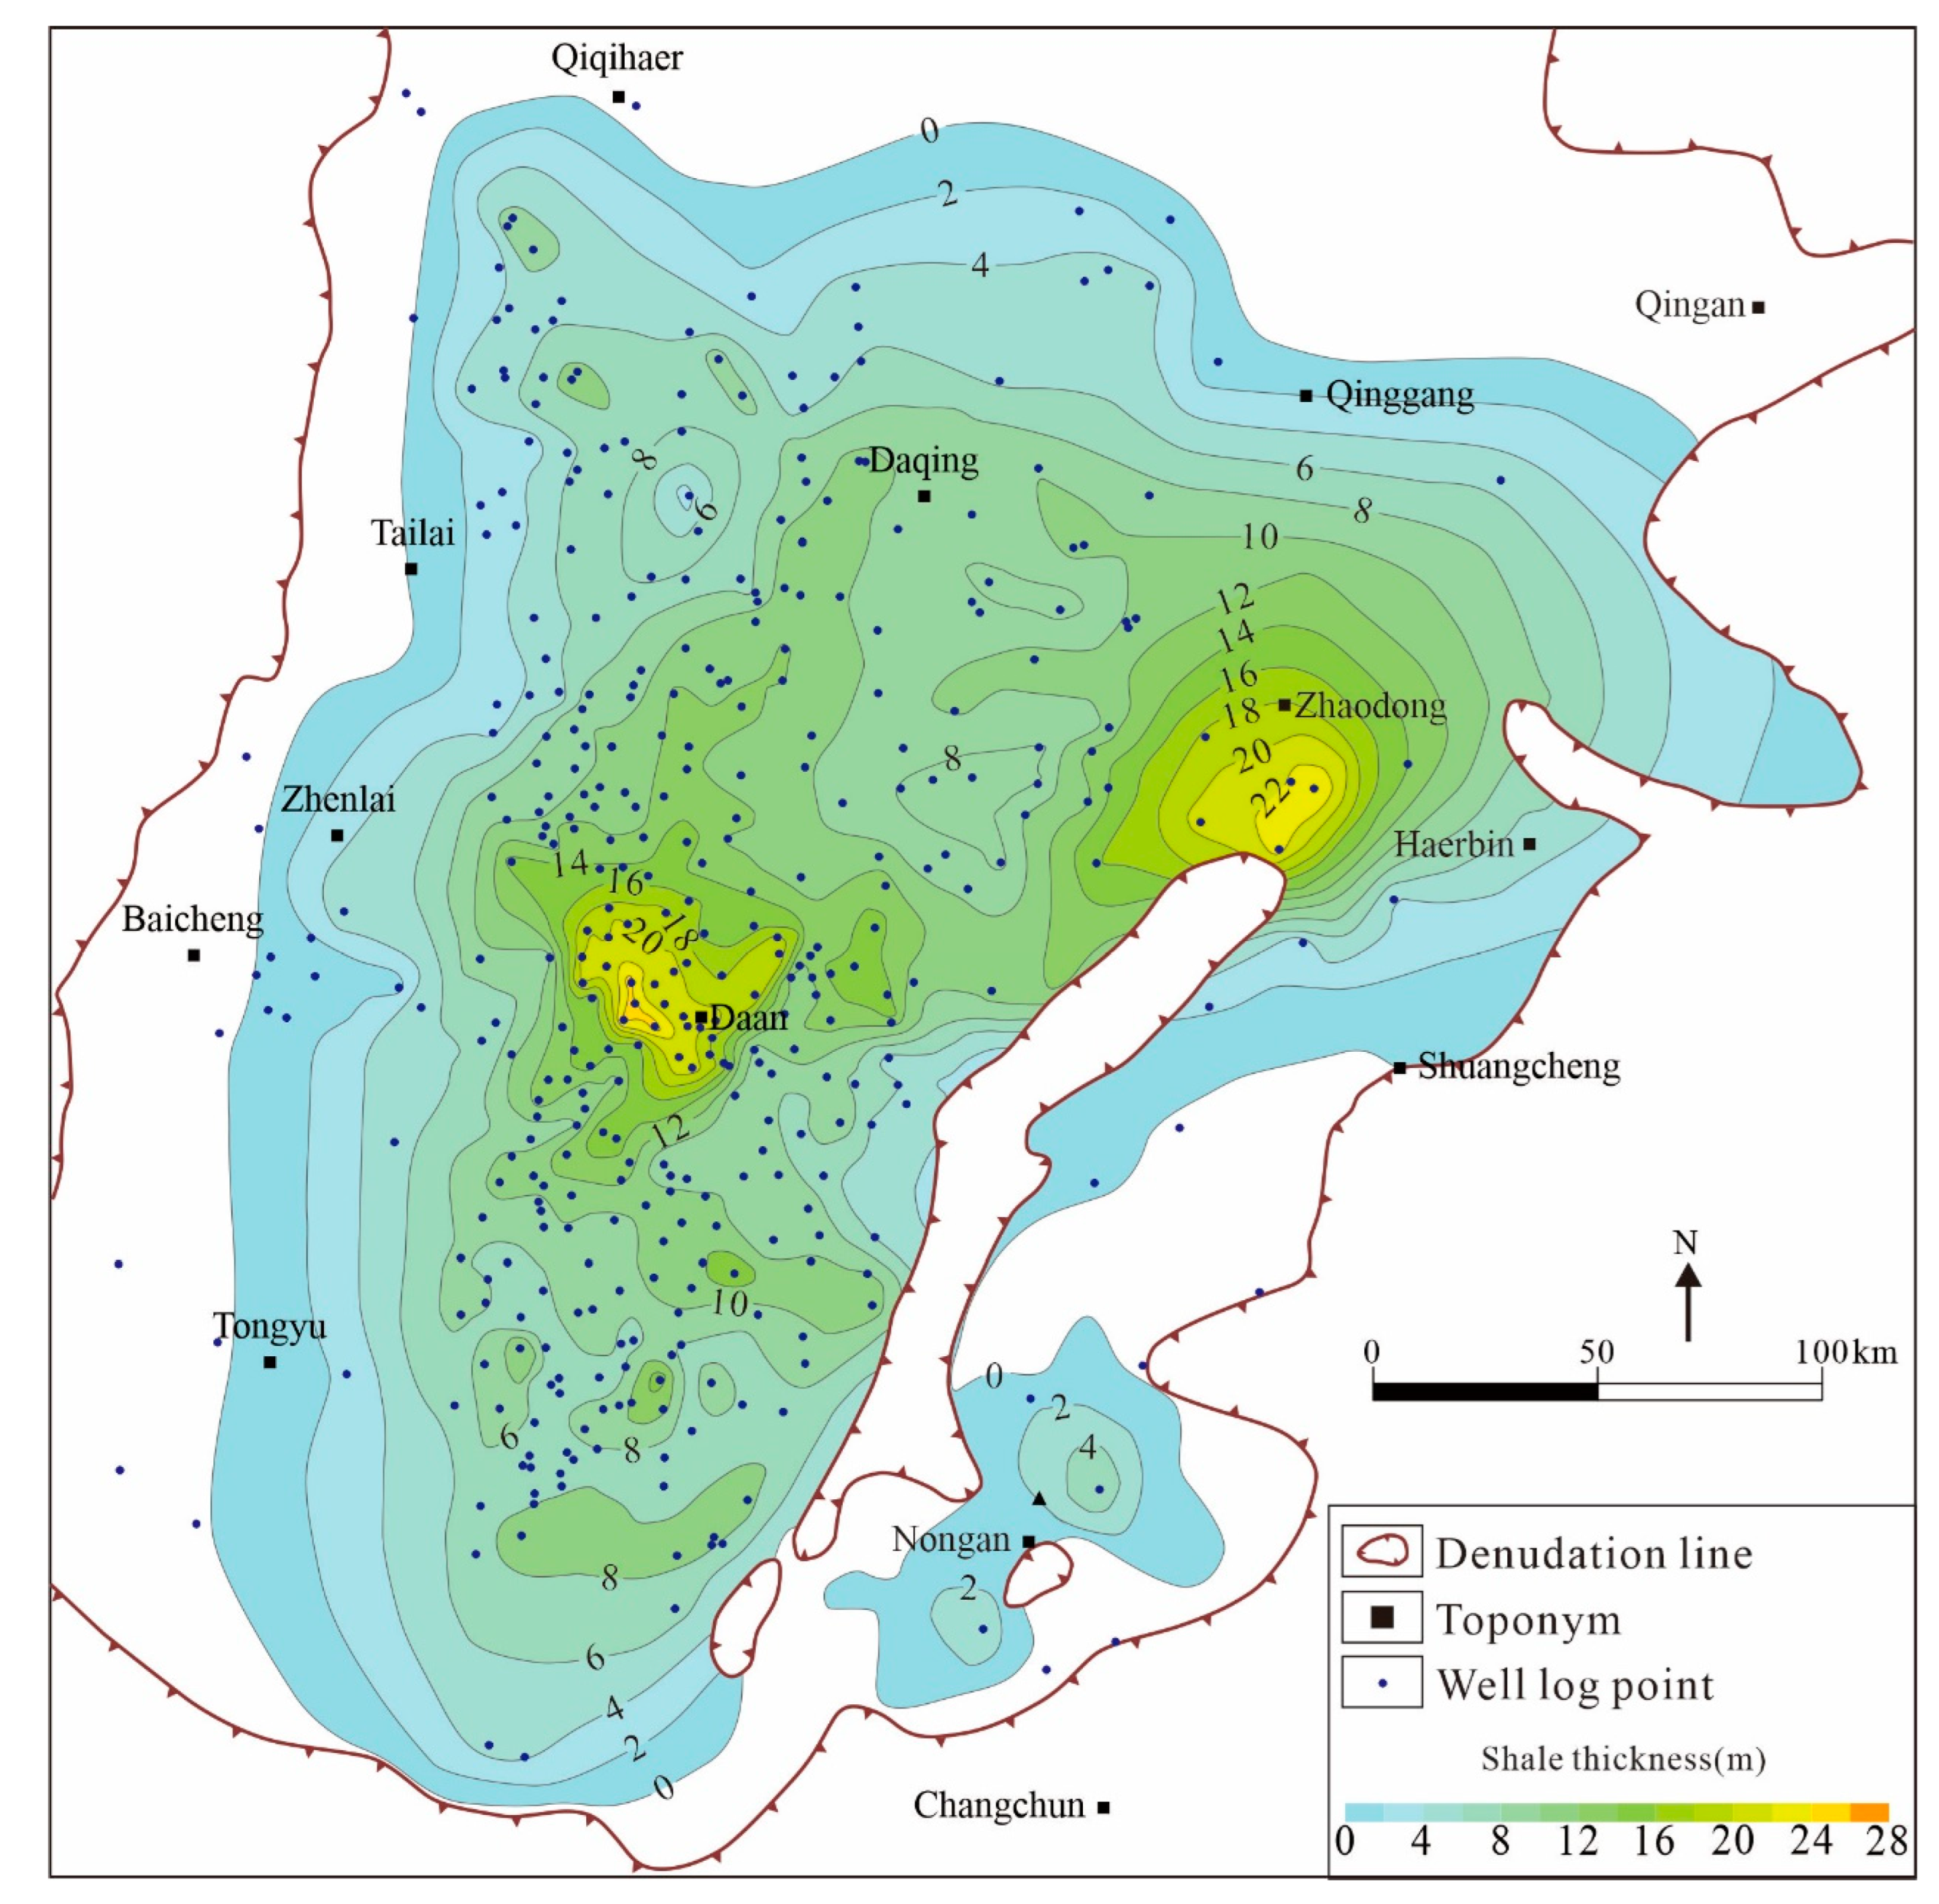
- In-situ conversion of shale layer and thickness
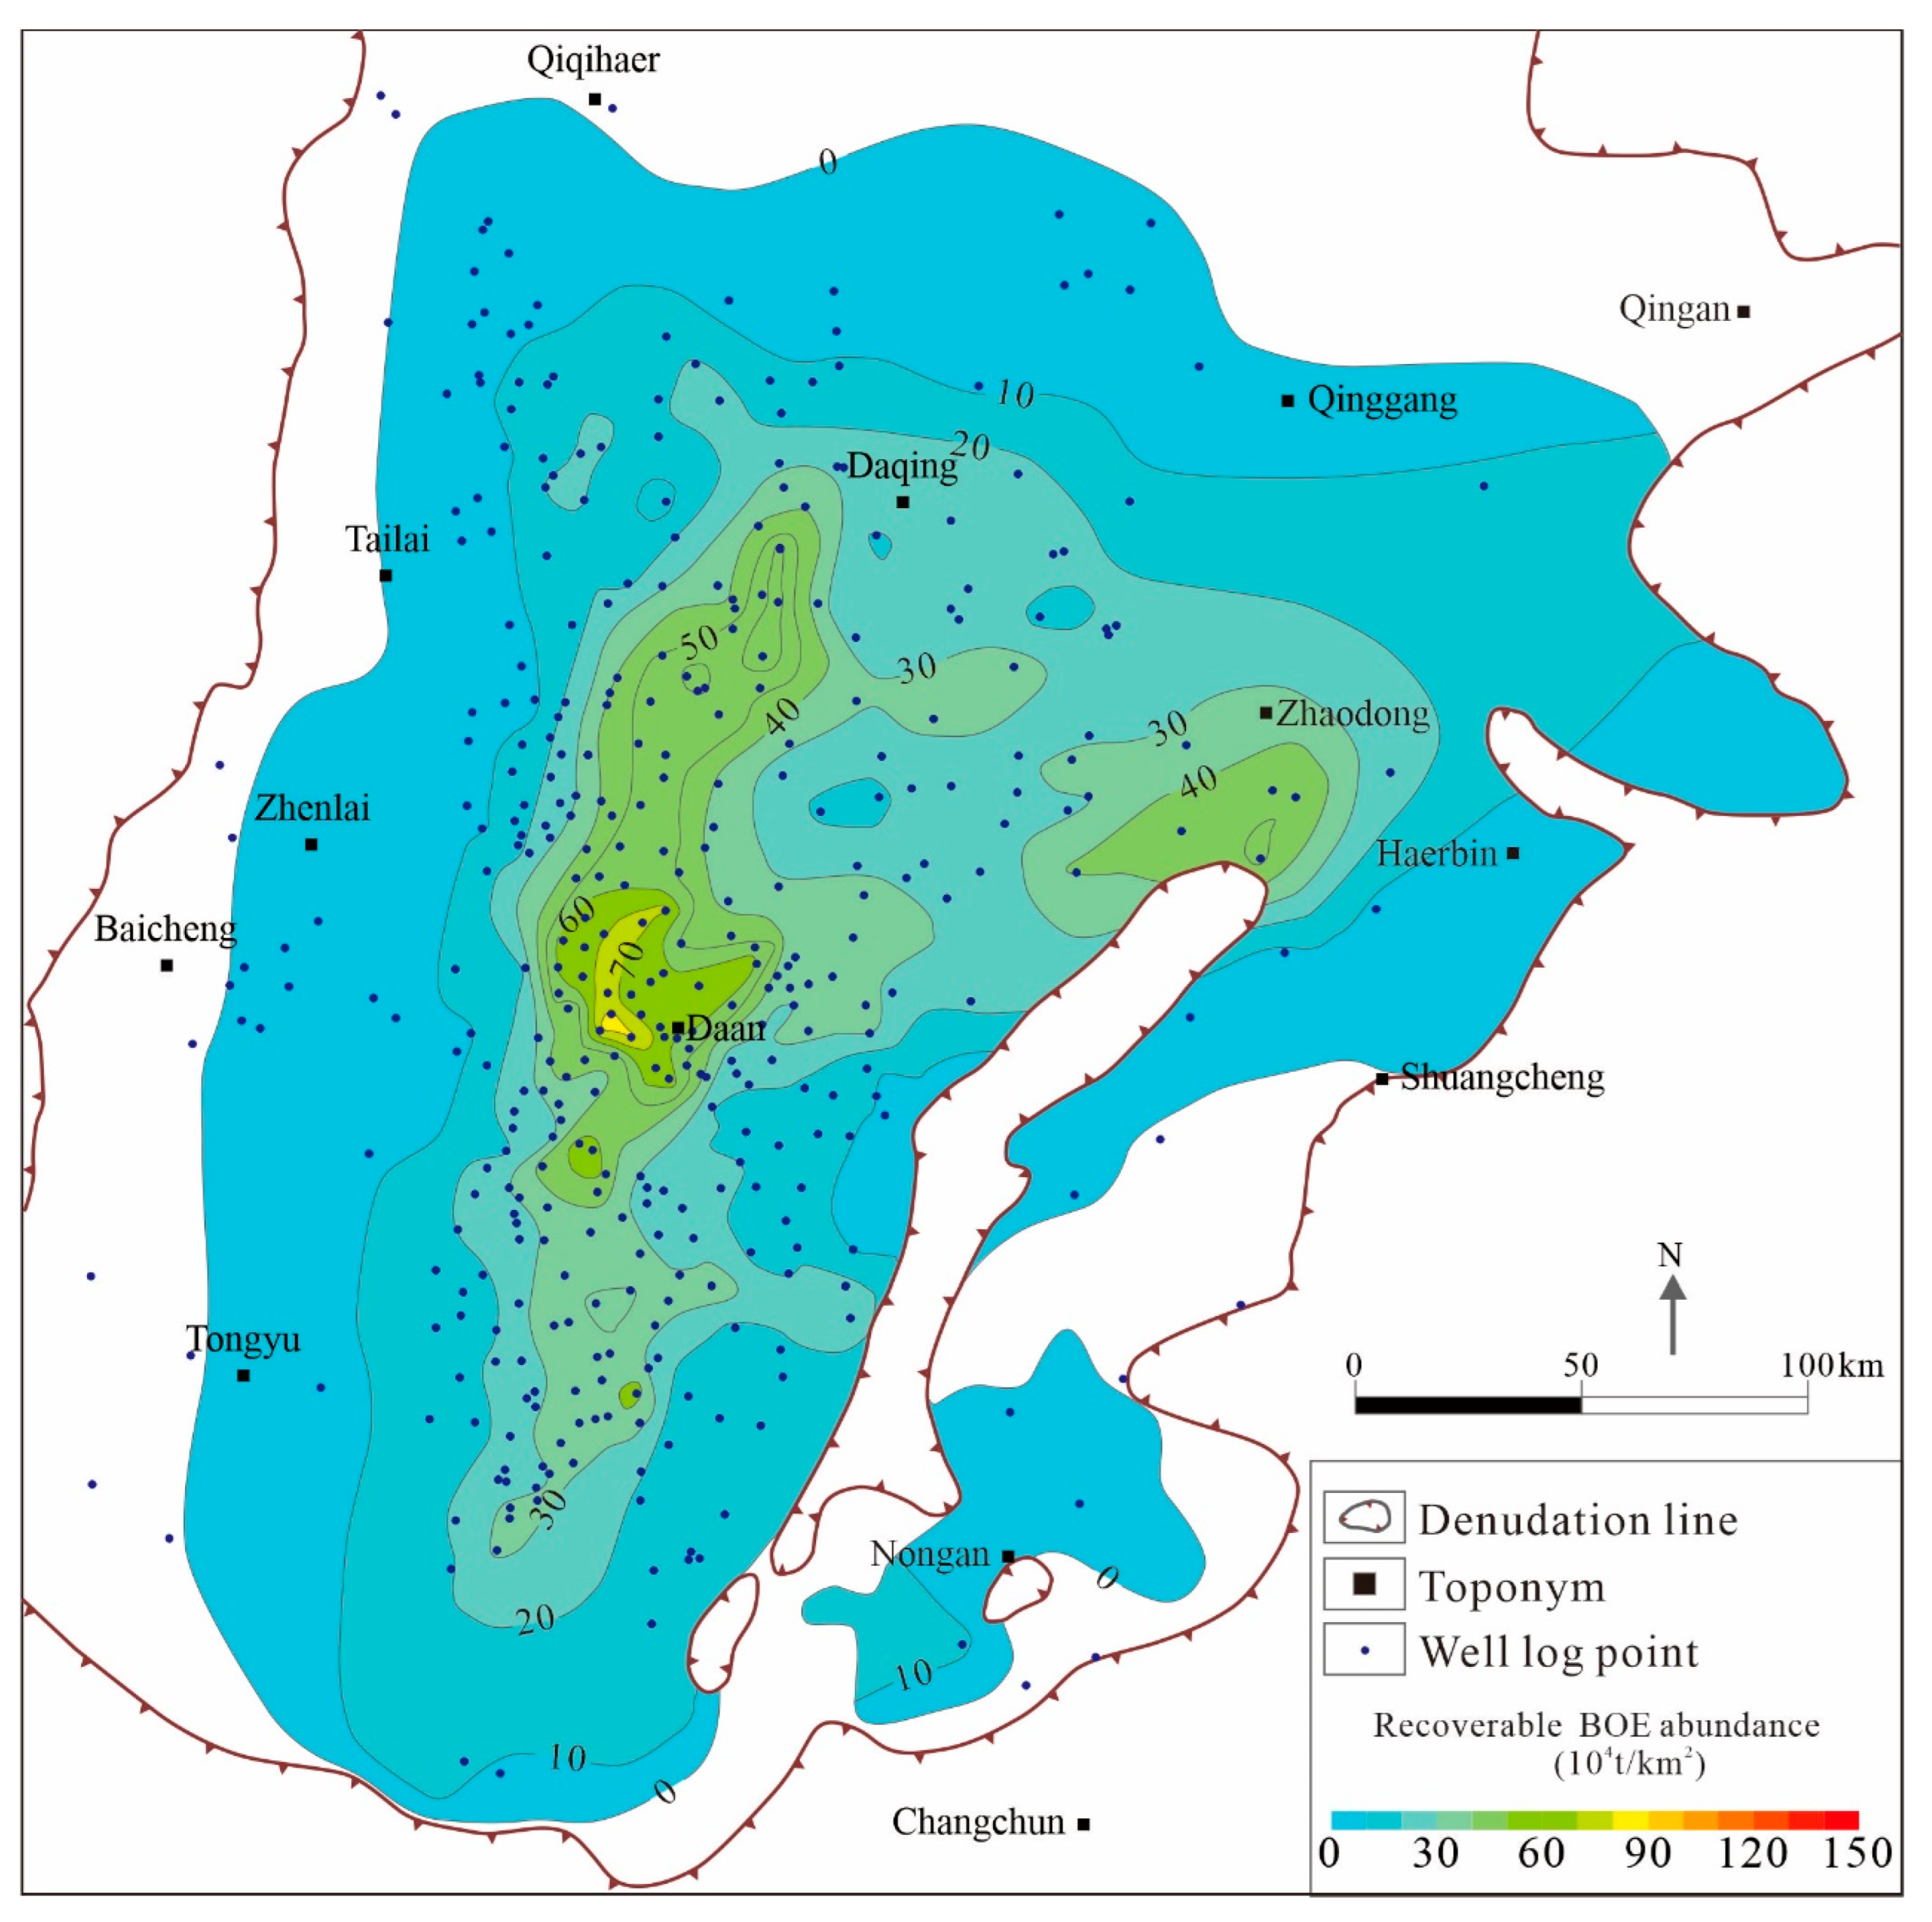
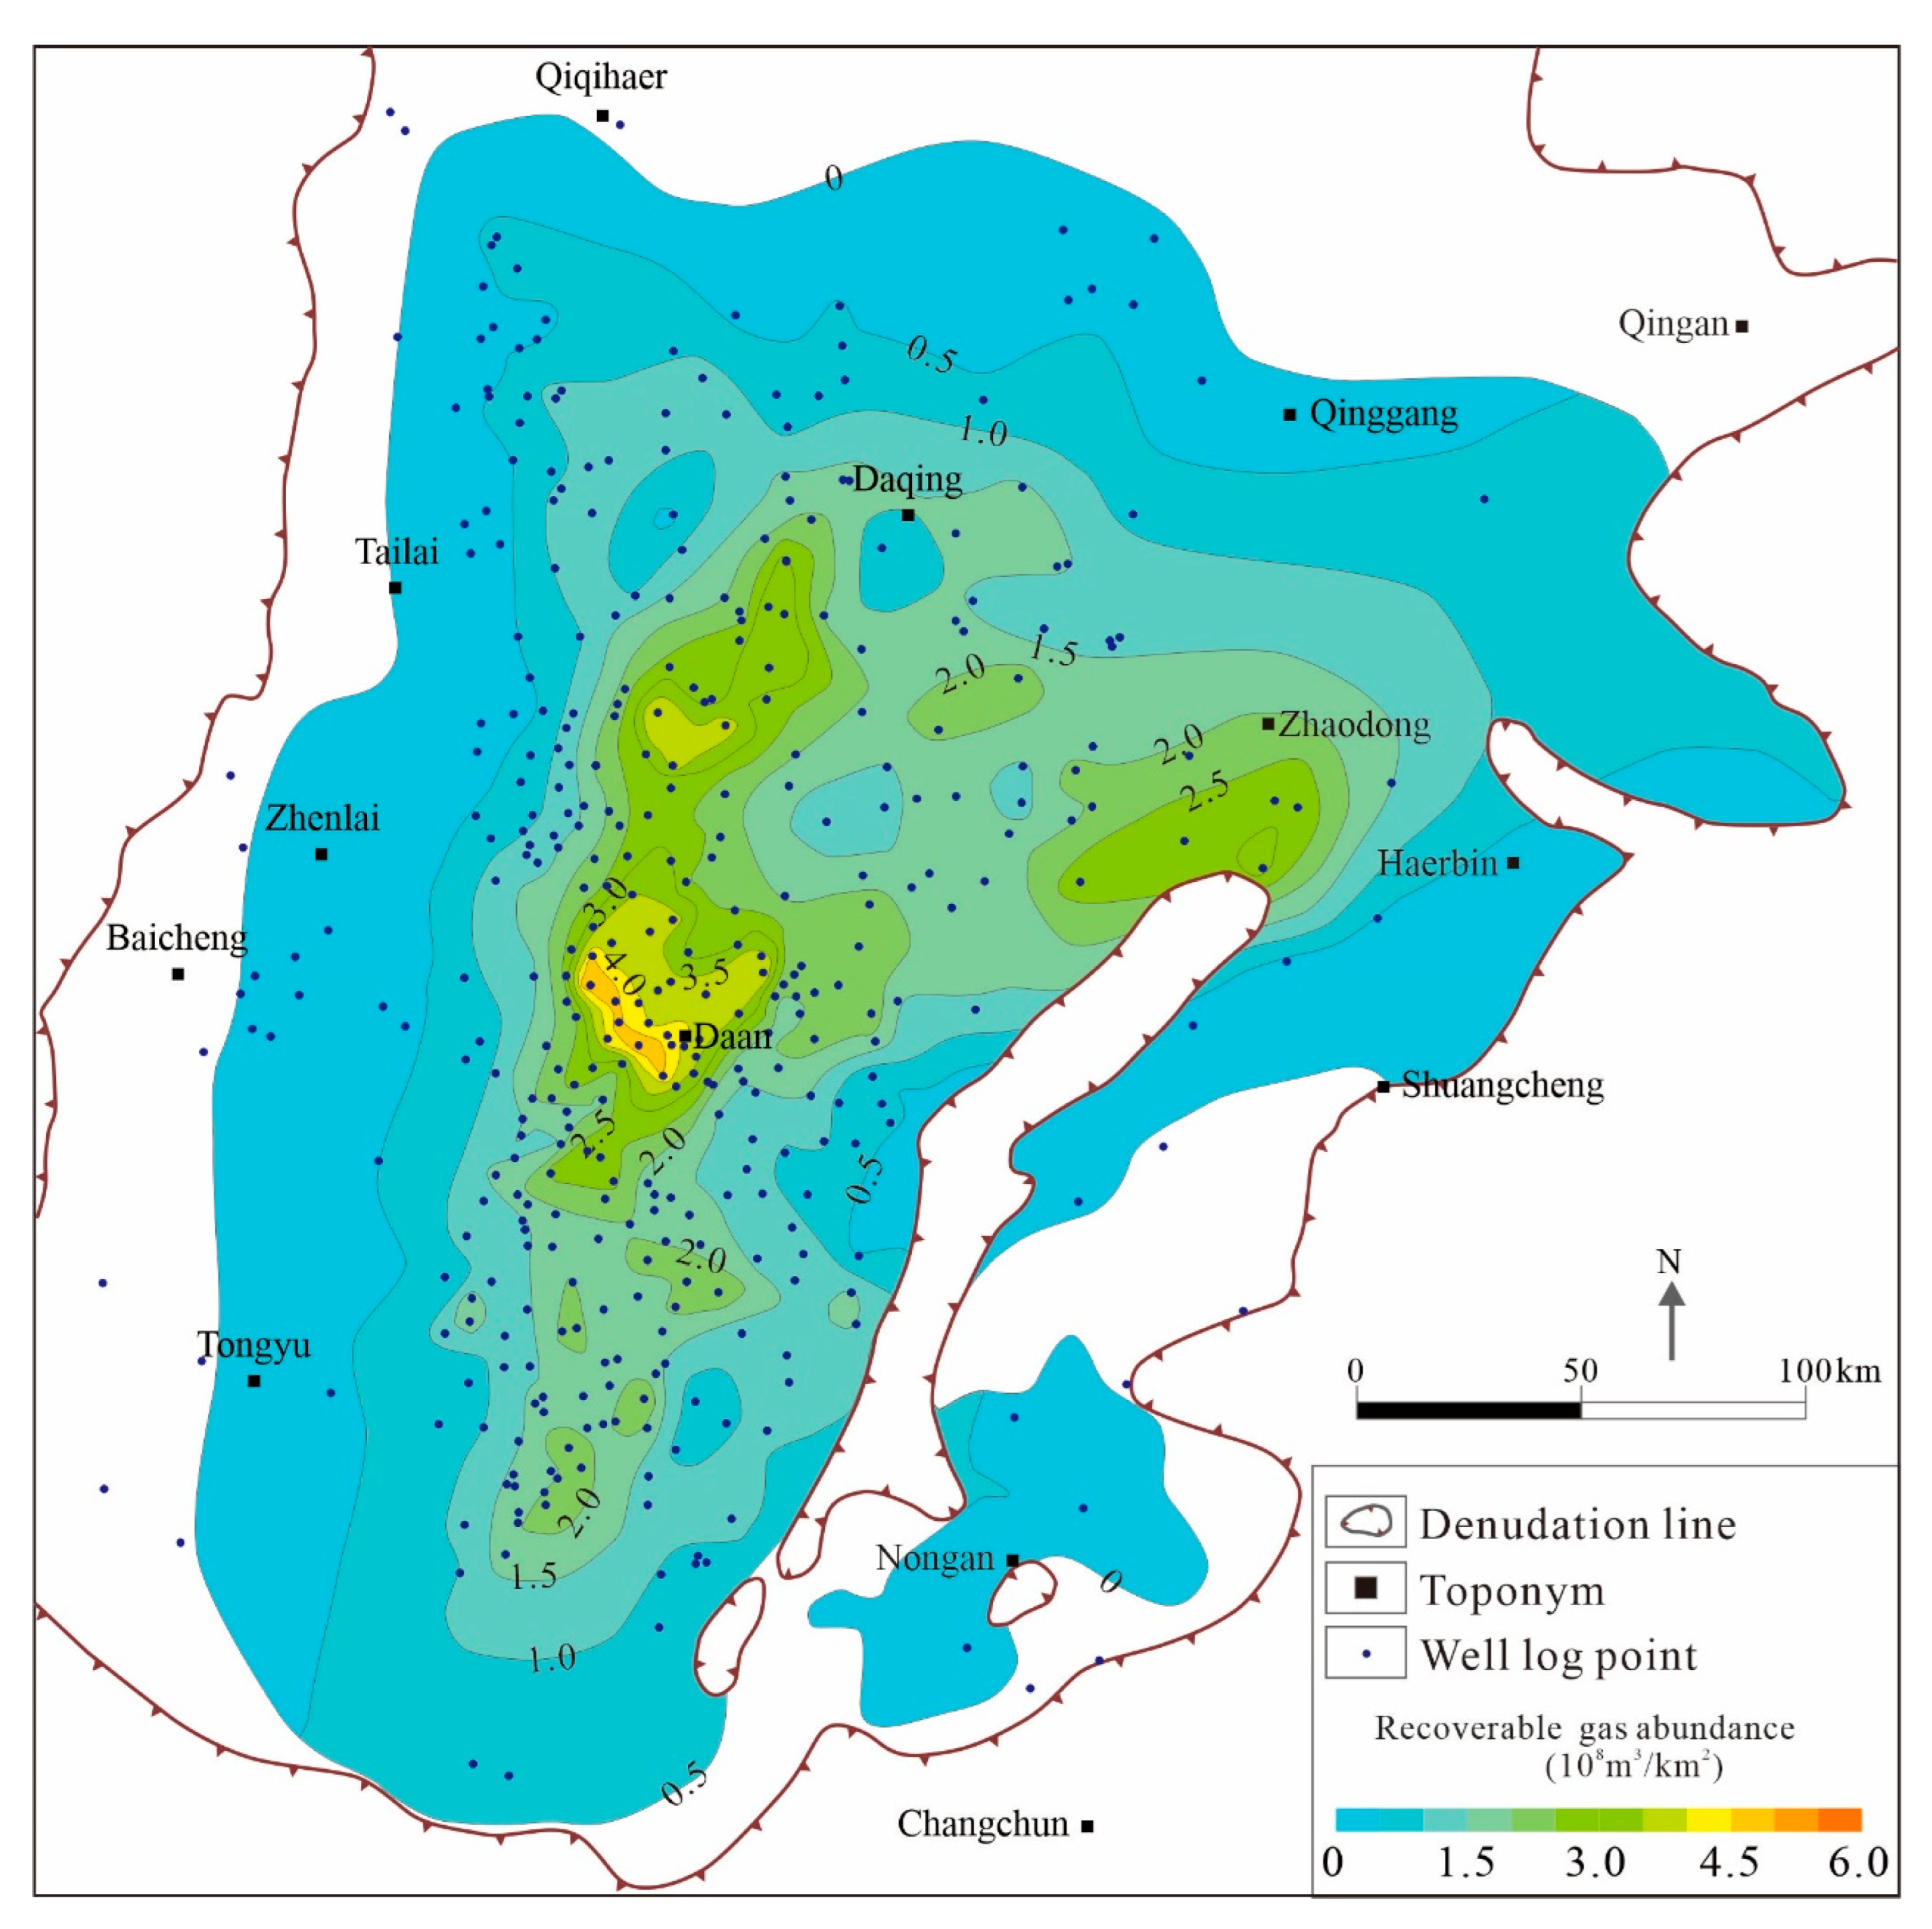
3.5.3. Evaluation of Recoverable Hydrocarbon Reserves
4. Conclusions
Acknowledgments
References
- US Energy Information Administration. Short-term energy outlook. Washington: US Energy Information Administration, 2023.
- Wang, X.; Zhang, G.; Tang, W.; Wang, D.; Wang, K.; Liu, J.; Du, D. A review of commercial development of continental shale oil in China. Energy Geoscience 2022, 3, 282–289. [Google Scholar] [CrossRef]
- Hu, T.; Pang, X.; Xu, T.; Li, C.; Jiang, S.; Wang, Q.; Chen, Y.; Zhang, H.; Huang, C.; Gong, S.; et al. Identifying the key source rocks in heterogeneous saline lacustrine shales: Paleogene shales in the Dongpu depression, Bohai Bay Basin, eastern China. AAPG Bulletin 2022, 106, 1325–1356. [Google Scholar] [CrossRef]
- Hou, L.; Luo, X.; Mi, J.; Zhang, Y.; Lin, S.; Liao, F.; Pang, Z. Characteristics of Oil and Gas Produced by In Situ Heating of Shale: A Case Study of the Chang 7 Member, Ordos Basin, China. Energy Fuels 2022, 36, 1429–1440. [Google Scholar] [CrossRef]
- Zhao, W.; Hu, S.; Hou, L.; Yang, T.; Li, X.; Guo, B.; Yang, Z. Types and resource potential of continental shale oil in China and its boundary with tight oil. Petroleum Exploration and Development 2020, 47, 1–11. [Google Scholar] [CrossRef]
- Han, Z.; Wang, G.; Wu, H.; Feng, Z.; Tian, H.; Xie, Y.; Wu, H. Lithofacies Characteristics of Gulong Shale and Its Influence on Reservoir Physical Properties. Energies 2024, 17, 779. [Google Scholar] [CrossRef]
- Hu, T.; Pang, X.; Jiang, S.; Wang, Q.; Zheng, X.; Ding, X.; Zhao, Y.; Zhu, C.; Li, H. Oil content evaluation of lacustrine organic-rich shale with strong heterogeneity: A case study of the Middle Permian Lucaogou Formation in Jimusaer Sag, Junggar Basin, NW China. Fuel 2018, 221, 196–205. [Google Scholar] [CrossRef]
- Hou, L.; He, K.; Zhai, J.; Mi, J.; Weng, N. Compositional kinetics for hydrocarbon evolution in the pyrolysis of the Chang 7 organic matter: Implications for in-situ conversion of oil shale. Journal of Analytical and Applied Pyrolysis 2022, 162, 105434. [Google Scholar] [CrossRef]
- Liu, S.; Gai, H.; Cheng, P. Technical Scheme and Application Prospects of Oil Shale In Situ Conversion: A Review of Current Status. Energies 2023, 16, 4386. [Google Scholar] [CrossRef]
- Hou, L.; Ma, W.; Luo, X.; Liu, J. Characteristics and quantitative models for hydrocarbon generation-retention-production of shale under ICP conditions: example from the Chang 7 member in the Ordos Basin. Fuel 2020, 279, 118497. [Google Scholar] [CrossRef]
- Hu, T.; Liu, Y.; Jiang, F.; Pang, X.; Wang, Q.; Zhou, K.; Wu, G.; Jiang, Z.; Huang, L.; Jiang, S.; et al. A novel method for quantifying hydrocarbon micromigration in heterogeneous shale and the controlling mechanism. Energy 2024, 288, 129712. [Google Scholar] [CrossRef]
- Hou, L.; Luo, X.; Zhao, Z.; Zhang, L. Identification of Oil Produced from Shale and Tight Reservoirs in the Permian Lucaogou Shale Sequence, Jimsar Sag, Junggar Basin, NW China. ACS Omega 2021, 6, 2127–2142. [Google Scholar] [CrossRef]
- Ma, S.; Li, S.; Zhang, Z.; Xu, T.; Zheng, B.; Hu, Y.; Li, G.; Li, X. The Feasibility Study of In Situ Conversion of Oil Shale Based on Calcium-Oxide-Based Composite Materia Hydration Exothermic Reaction. Energies 2024, 17, 1798. [Google Scholar] [CrossRef]
- Zhao, Z.; Hou, L.; Luo, X.; Chi, Y.; Pang, Z.; Lin, S.; Zhang, L.; Liu, B. Heat-Induced Pore Structure Evolution in the Triassic Chang 7 Shale, Ordos Basin, China: Experimental Simulation of In Situ Conversion Process. Journal of Marine Science and Engineering 2023, 11, 1363. [Google Scholar] [CrossRef]
- Kang, Z.; Zhao, Y.; Yang, D. Review of oil shale in-situ conversion technology. Appl Energy 2020, 269, 115121. [Google Scholar] [CrossRef]
- Ma, W.; Hou, L.; Luo, X.; Liu, J.; Tao, S.; Guan, P.; Cai, Y. Generation and expulsion process of the Chang 7 oil shale in the Ordos Basin based on temperature-based semi-open pyrolysis: Implications for in-situ conversion process. Journal of Petroleum Science and Engineering 2020, 190, 107035. [Google Scholar] [CrossRef]
- Hou, L.; Cui, J.; Zhang, Y. Evolution mechanism of dynamic thermal parameters of shale. Marine and Petroleum Geology 2022, 138, 105423. [Google Scholar] [CrossRef]
- Hubbert, M.K. Degree of advancement of petroleum exploration in the United States. AAPG Bulletin 1967, 51, 2207–2227. [Google Scholar] [CrossRef]
- Burnham, A.K.; Mcconaghy, J.R. Comparison of the acceptability of various oil shale processes. In Proceedings of the 26th Oil Shale Symposium, Golden, CO, USA, 16–18 October 2006. [Google Scholar]
- Fowler, T.D.; Vinegar, H.J. Oil shale ICP-Colorado Field Pilots. In Proceedings of the SPE Western Regional Meeting, San Jose, CA, USA, 24–26 March 2009; pp. 1–15. [Google Scholar]
- Hou, L.; Luo, X.; Lin, S.; Li, Y.; Zhang, L.; Ma, W. Assessment of recoverable oil and gas resources by in-situ conversion of shale--Case study of extracting the Chang 73 shale in the Ordos Basin. Petroleum Science 2022, 19, 441–458. [Google Scholar] [CrossRef]
- Shen, Z.; Yu, Z.; Ye, H.; Deng, C.; He, H. Magnetostratigraphy of the Upper Cretaceous Nenjiang Formation in the Songliao Basin, northeast China: Implications for age constraints on terminating the Cretaceous Normal Superchron. Cretaceous Research 2022, 135, 105213. [Google Scholar] [CrossRef]
- Liu, B.; Wang, Y.; Tian, S.; Guo, Y.; Wang, L.; Yasin, Q.; Yang, J. Impact of thermal maturity on the diagenesis and porosity of lacustrine oil-prone shales: Insights from natural shale samples with thermal maturation in the oil generation window. International Journal of Coal Geology 2022, 261, 104079. [Google Scholar] [CrossRef]
- Wang, M.; Yang, J.; Wang, Z.; Lu, S. Nanometer-Scale Pore Characteristics of Lacustrine Shale, Songliao Basin, NE China. PLoS One 2015, 10, 0135252. [Google Scholar] [CrossRef] [PubMed]
- Wang, L.; Song, Z.; Yin, Q.; George, S.C. Paleosalinity significance of occurrence and distribution of methyltrimethyltridecyl chromans in the Upper Cretaceous Nenjiang Formation, Songliao Basin, China. Organic Geochemistry 2011, 42, 1411–1419. [Google Scholar] [CrossRef]
- Xu, J.; Liu, Z.; Bechtel, A.; Sachsenhofer, R.F.; Jia, J.; Meng, Q.; Sun, P. Organic matter accumulation in the Upper Cretaceous Qingshankou and Nenjiang Formations, Songliao Basin (NE China): Implications from high-resolution geochemical analysis. Marine and Petroleum Geology 2019, 102, 187–201. [Google Scholar] [CrossRef]
- Xu, Y.; Li, D.; Gao, Y.; Li, M.; Sun, L.; Zhang, X.; Wang, C.; Shen, Y. Multiple S-isotopic evidence for seawater incursions during the deposition of the upper Cretaceous source rocks in the Songliao Basin, northeastern China. Chemical Geology 2023, 642, 121790. [Google Scholar] [CrossRef]
- Chen, R.; Shang, F.; Cao, Y.; Song, L.; Li, Z. A comparative study of oil shale deposition in the Upper Cretaceous Nenjiang Formation, NE China: Evidence from petrographic and geochemical analyses. Journal of Petroleum Science and Engineering 2022, 219, 111130. [Google Scholar] [CrossRef]
- Shen, Z.; Yu, Z.; Ye, H.; Deng, C.; He, H. Magnetostratigraphy of the Upper Cretaceous Nenjiang Formation in the Songliao Basin, northeast China: Implications for age constraints on terminating the Cretaceous Normal Superchron. Cretaceous Research 2022, 135, 105213. [Google Scholar] [CrossRef]
- He, W.; Wang, M.; Wang, X.; Meng, Q.; Wu, Y.; Lin, T.; Li, J.; Zhang, J. Pore Structure Characteristics and Affecting Factors of Shale in the First Member of the Qingshankou Formation in the Gulong Sag, Songliao Basin. ACS Omega 2022, 7, 35755–35773. [Google Scholar] [CrossRef] [PubMed]
- Jia, J.; Bechtel, A.; Liu, Z.; Strobl, S.A.; Sun, P.; Sachsenhofer, R.F. Oil shale formation in the Upper Cretaceous Nenjiang Formation of the Songliao Basin (NE China): Implications from organic and inorganic geochemical analyses. International Journal of Coal Geology 2013, 113, 11–26. [Google Scholar] [CrossRef]
- Liu, B.; Liu, L.; Fu, J.; Lin, T.; He, J.; Liu, X.; Liu, Y.; Fu, X. The Songliao Super Basin in northeastern China. AAPG Bulletin 2023, 107, 1257–1297. [Google Scholar] [CrossRef]
- He, W.; Meng, Q.; Lin, T.; Wang, R.; Liu, X.; Ma, S.; Li, X.; Yang, F.; Sun, G. Evolution features of in-situ permeability of low-maturity shale with the increasing temperature, Cretaceous Nenjiang Formation, northern Songliao Basin, NE China. Petroleum Exploration and Development 2022, 49, 516–529. [Google Scholar] [CrossRef]
- Liu, W.; Liu, M.; Yang, T.; Liu, X.; Them, T.R.; Wang, K.; Bian, C.; Meng, Q.; Li, Y.; Zeng, X.; et al. Organic matter accumulations in the Santonian-Campanian (Upper Cretaceous) lacustrine Nenjiang shale (K2n) in the Songliao Basin, NE China: Terrestrial responses to OAE3? , International Journal of Coal Geology 2022, 260, 104069. [Google Scholar] [CrossRef]
- Zhang, M.; Xie, R.; Yin, S.; Deng, M.; Chen, J.; Feng, S.; Luo, Z.; Chen, J. Logging identification of complex lithology of the Lower Jurassic Da'anzhai Member in the eastern slope of the western Sichuan Depression. Unconventional Resources 2023, 3, 7–19. [Google Scholar] [CrossRef]





| Samples Number | No.1 | No.2 | No.3 | No.4 | No.5 | No.6 | No.7 | No.8 | No.9 |
|---|---|---|---|---|---|---|---|---|---|
| TOC, wt.% | 0.51 | 2.03 | 3.50 | 5.03 | 6.44 | 8.51 | 13.34 | 20.67 | 25.99 |
| S2, mg/g rock | 1.99 | 8.60 | 17.28 | 24.53 | 32.06 | 42.42 | 67.17 | 111.95 | 138.20 |
| Tmax, ºC | 435 | 433 | 429 | 432 | 431 | 433 | 429 | 428 | 427 |
| HI, mg/g TOC | 388.1 | 423.0 | 494.5 | 487.9 | 498.2 | 498.6 | 503.5 | 541.5 | 531.8 |
| Ro, % | 0.43 | 0.46 | 0.47 | 0.47 | 0.47 | 0.47 | 0.48 | 0.47 | 0.48 |
| QFAOT, mg/g TOC | 1.398 | 2.02 | 3.34 | 3.08 | 3.42 | 3.54 | 3.68 | 4.22 | 4.15 |
| QFAGT, mL/g TOC | 0.92 | 1.19 | 1.78 | 1.77 | 1.81 | 1.85 | 1.91 | 2.08 | 2.07 |
| Samples Number | No.1 | No.2 | No.3 | No.4 | No.5 |
|---|---|---|---|---|---|
| TOC, wt.% | 3.57 | 6.03 | 7.69 | 8.76 | 11.41 |
| S2, mg/g rock | 30.04 | 51.16 | 65.68 | 74.39 | 97.95 |
| Tmax, ℃ | 426 | 426 | 425 | 425 | 424 |
| HI, mg/g TOC | 841.34 | 848.39 | 854.15 | 849.25 | 858.45 |
| Ro, % | 0.37 | 0.37 | 0.37 | 0.38 | 0.38 |
| QFAOT, mg/g TOC | 8.11 | 8.13 | 8.14 | 8.13 | 8.15 |
| QFAGT, ml/g TOC | 1.93 | 1.95 | 1.96 | 1.95 | 1.97 |
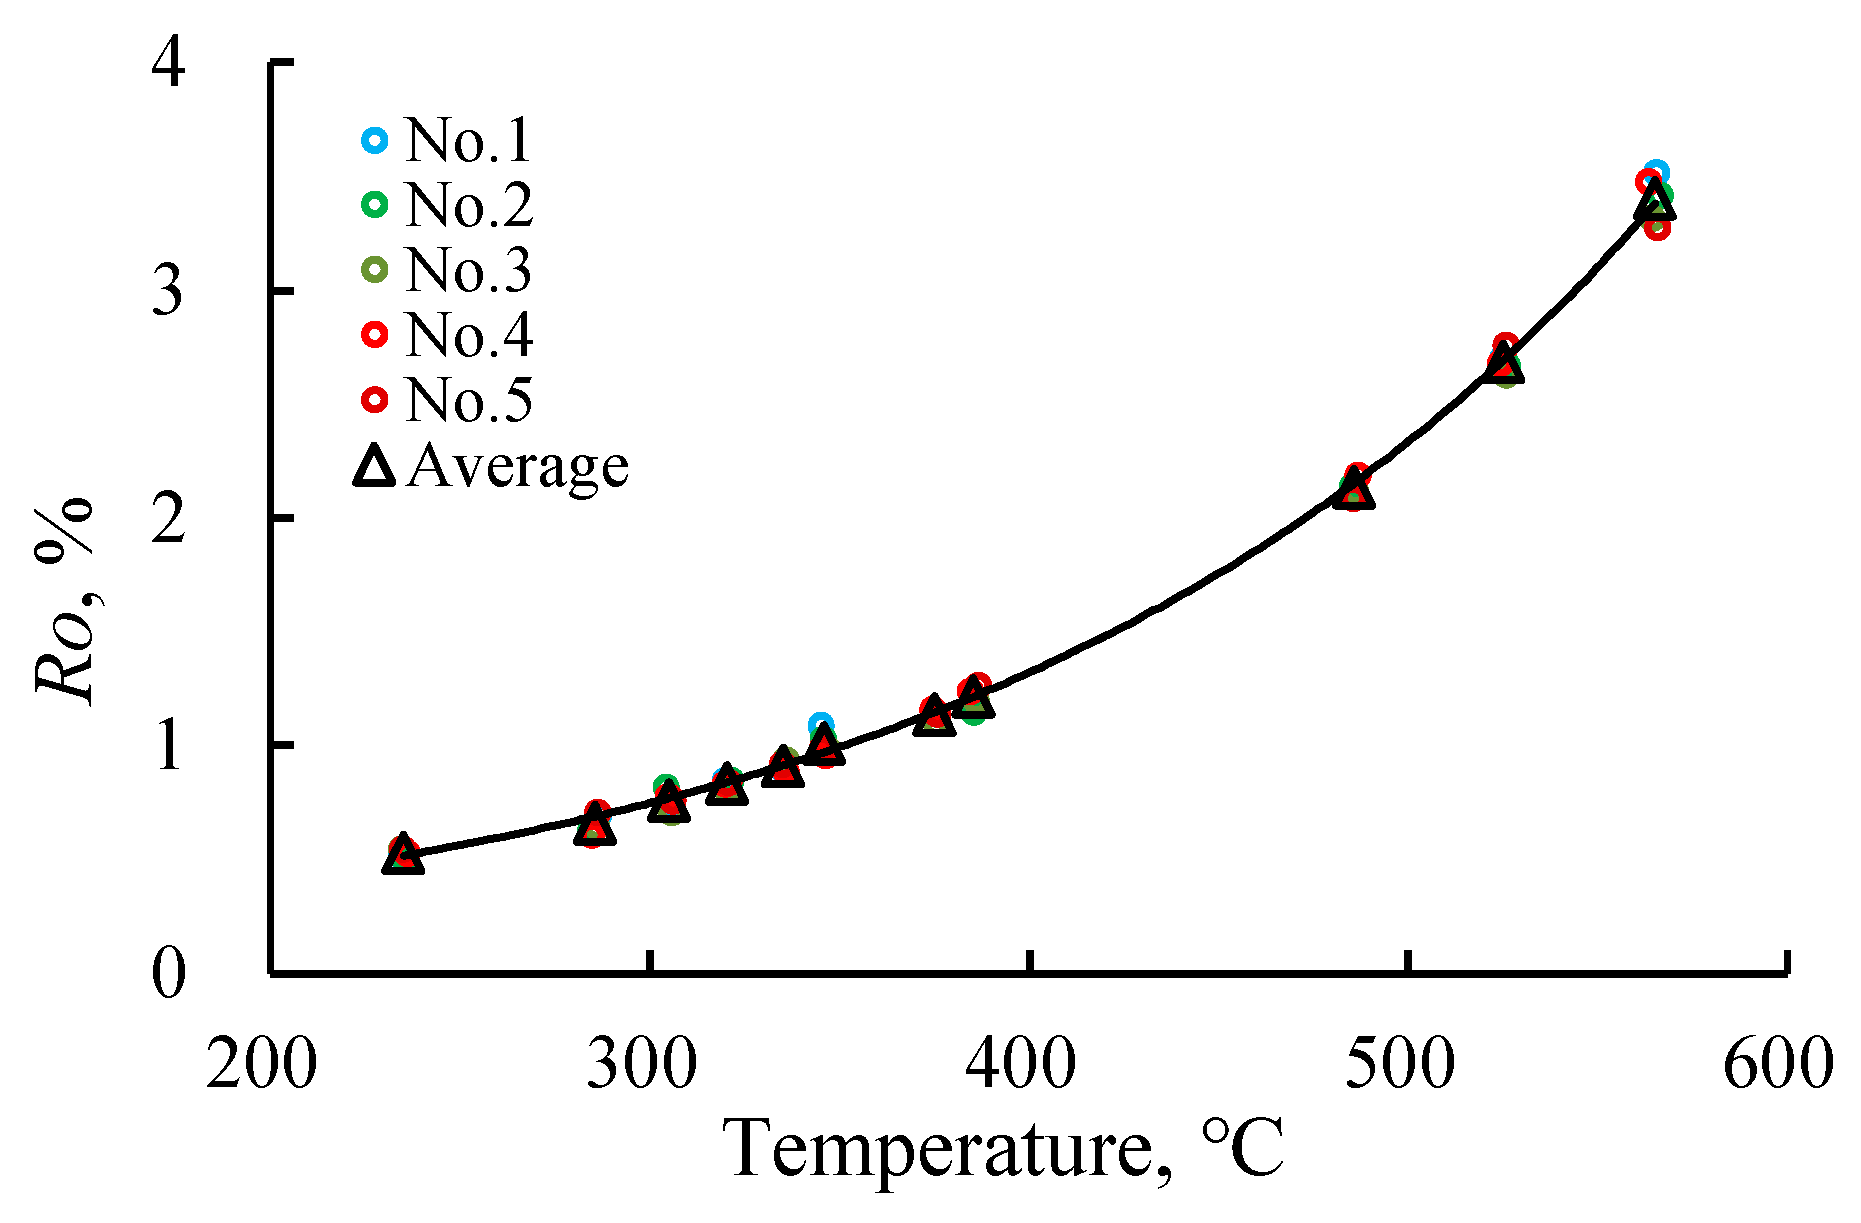
| Pyrolysis Temperature,℃ | Sample number | Average T, ℃ | Average Ro, % | ||||||||||||||||||||||||
| No.1 | No.2 | No.3 | No.4 | No.5 | |||||||||||||||||||||||
| T,℃ | Ro, % | Qoil | Qgas | T,℃ | Ro, % | Qoil | Qgas | T,℃ | Ro, % | Qoil | Qgas | T,℃ | Ro, % | Qoil | Qgas | T,℃ | Ro, % | Qoil | Qgas | ||||||||
| 25 | 25.06 | 0.37 | 0.00 | 0.00 | 24.8 | 0.37 | 0.00 | 0.00 | 25.6 | 0.37 | 0.00 | 0.01 | 24.6 | 0.38 | 0.00 | 0.01 | 25.5 | 0.38 | 0.00 | 0.02 | 25.1 | 0.37 | |||||
| 215 | 214.3 | 0.47 | 0.08 | 0.00 | 214.9 | 0.48 | 0.19 | 0.00 | 216.4 | 0.44 | 0.18 | 0.01 | 214.8 | 0.46 | 0.11 | 0.01 | 213.9 | 0.46 | 0.13 | 0.02 | 214.9 | 0.46 | |||||
| 235 | 234.5 | 0.52 | 0.45 | 0.01 | 235.5 | 0.50 | 1.15 | 0.00 | 234.3 | 0.55 | 1.41 | 0.06 | 235.8 | 0.53 | 1.02 | 0.03 | 234.6 | 0.55 | 1.61 | 0.04 | 234.9 | 0.53 | |||||
| 285 | 286.4 | 0.70 | 2.30 | 0.01 | 284.3 | 0.63 | 3.76 | 0.11 | 285.7 | 0.65 | 5.05 | 0.07 | 284.5 | 0.61 | 6.66 | 0.20 | 286.2 | 0.71 | 9.87 | 0.86 | 285.4 | 0.66 | |||||
| 305 | 304.8 | 0.74 | 3.88 | 0.01 | 304.1 | 0.82 | 6.49 | 0.23 | 305.6 | 0.71 | 8.66 | 0.33 | 304.8 | 0.78 | 11.02 | 0.45 | 306.1 | 0.76 | 15.34 | 1.34 | 305.1 | 0.76 | |||||
| 320 | 319.7 | 0.85 | 5.63 | 0.18 | 321.2 | 0.85 | 8.98 | 0.39 | 320.3 | 0.81 | 12.08 | 0.52 | 319.7 | 0.84 | 14.55 | 0.59 | 320.8 | 0.84 | 20.35 | 1.53 | 320.3 | 0.84 | |||||
| 335 | 335.5 | 0.89 | 7.66 | 1.11 | 334.7 | 0.92 | 12.23 | 0.88 | 335.7 | 0.94 | 16.82 | 1.36 | 335.8 | 0.89 | 19.29 | 1.91 | 334.7 | 0.92 | 25.91 | 2.56 | 335.3 | 0.91 | |||||
| 345 | 345.2 | 1.09 | 10.00 | 2.30 | 345.8 | 1.03 | 16.45 | 4.06 | 346.6 | 0.99 | 21.57 | 4.58 | 346.2 | 0.96 | 24.97 | 5.08 | 345.3 | 0.99 | 33.23 | 7.23 | 345.8 | 1.01 | |||||
| 375 | 374.9 | 1.15 | 12.86 | 4.02 | 375.4 | 1.14 | 21.91 | 7.15 | 375.4 | 1.10 | 28.16 | 8.42 | 374.6 | 1.16 | 31.89 | 9.32 | 375.6 | 1.14 | 42.01 | 12.87 | 375.2 | 1.14 | |||||
| 385 | 384.8 | 1.23 | 13.40 | 5.34 | 385.3 | 1.15 | 22.82 | 9.34 | 385.8 | 1.20 | 29.31 | 11.45 | 384.3 | 1.24 | 33.19 | 13.34 | 386.4 | 1.27 | 43.70 | 17.31 | 385.3 | 1.22 | |||||
| 485 | 485.6 | 2.13 | 13.43 | 6.20 | 485.2 | 2.14 | 22.87 | 10.54 | 485.9 | 2.12 | 29.36 | 12.74 | 486.5 | 2.19 | 33.26 | 14.64 | 485.3 | 2.09 | 43.79 | 18.81 | 485.7 | 2.13 | |||||
| 525 | 524.7 | 2.70 | 13.43 | 6.56 | 526.1 | 2.67 | 22.87 | 11.06 | 525.6 | 2.63 | 29.36 | 13.40 | 524.2 | 2.68 | 33.26 | 15.21 | 525.6 | 2.76 | 43.79 | 19.33 | 525.2 | 2.69 | |||||
| 565 | 565.3 | 3.52 | 13.43 | 6.99 | 566.4 | 3.42 | 22.87 | 11.68 | 564.3 | 3.32 | 29.36 | 14.02 | 563.3 | 3.48 | 33.26 | 15.84 | 565.7 | 3.28 | 43.79 | 20.07 | 565.0 | 3.40 | |||||
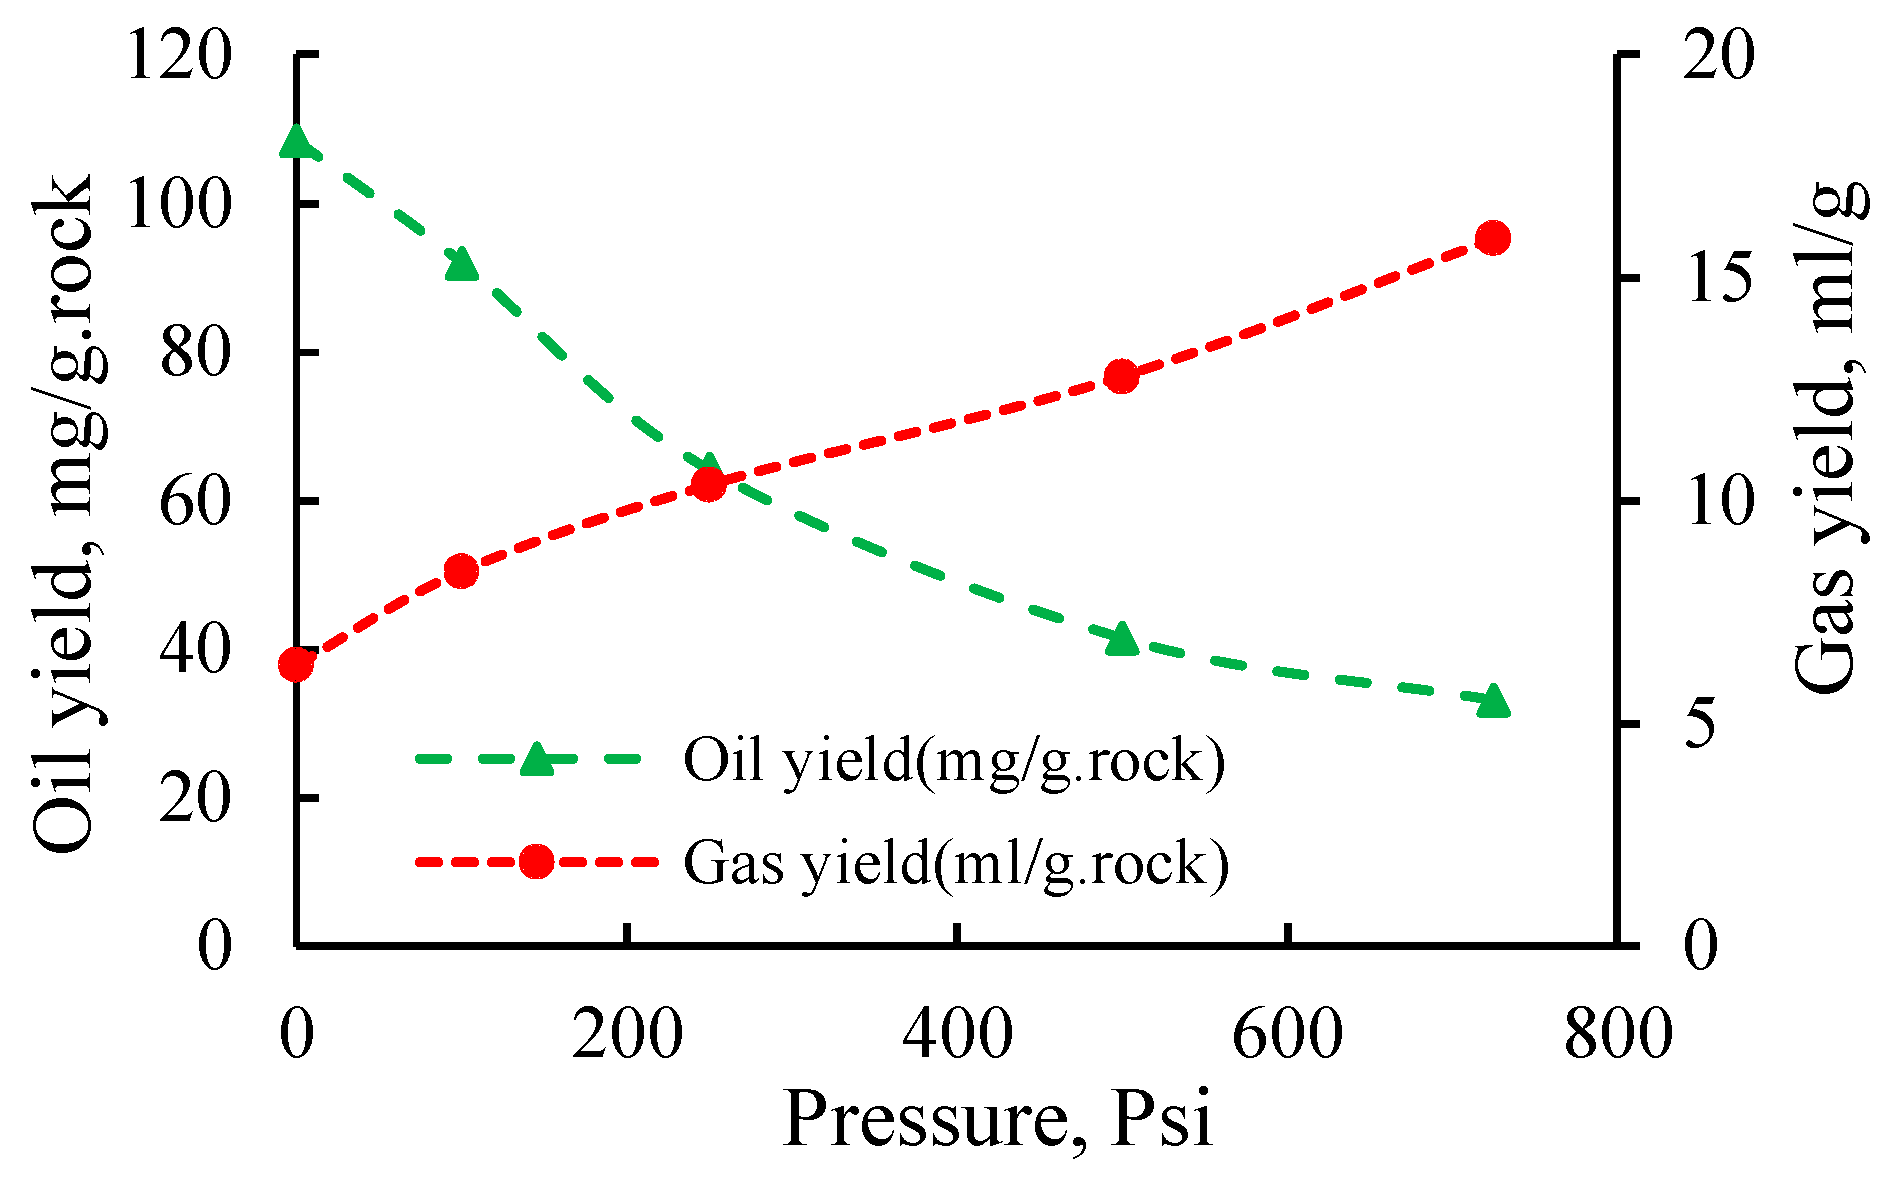
| Basic geochemical | Pressure, Psi/MPa | Oil yield, mg/g rock | Gas yield, mL/g rock | |
| TOC, wt.% | 7.82 | 0/0 | 108.34 | 6.30 |
| S2, mg/g rock | 66.77 | 100/0.7 | 91.97 | 8.40 |
| Tmax, ℃ | 425 | 250/1.7 | 64.16 | 10.34 |
| HI, mg/g TOC | 853.78 | 500/3.5 | 41.52 | 12.77 |
| Ro, % | 0.37 | 725/5 | 33.18 | 15.87 |
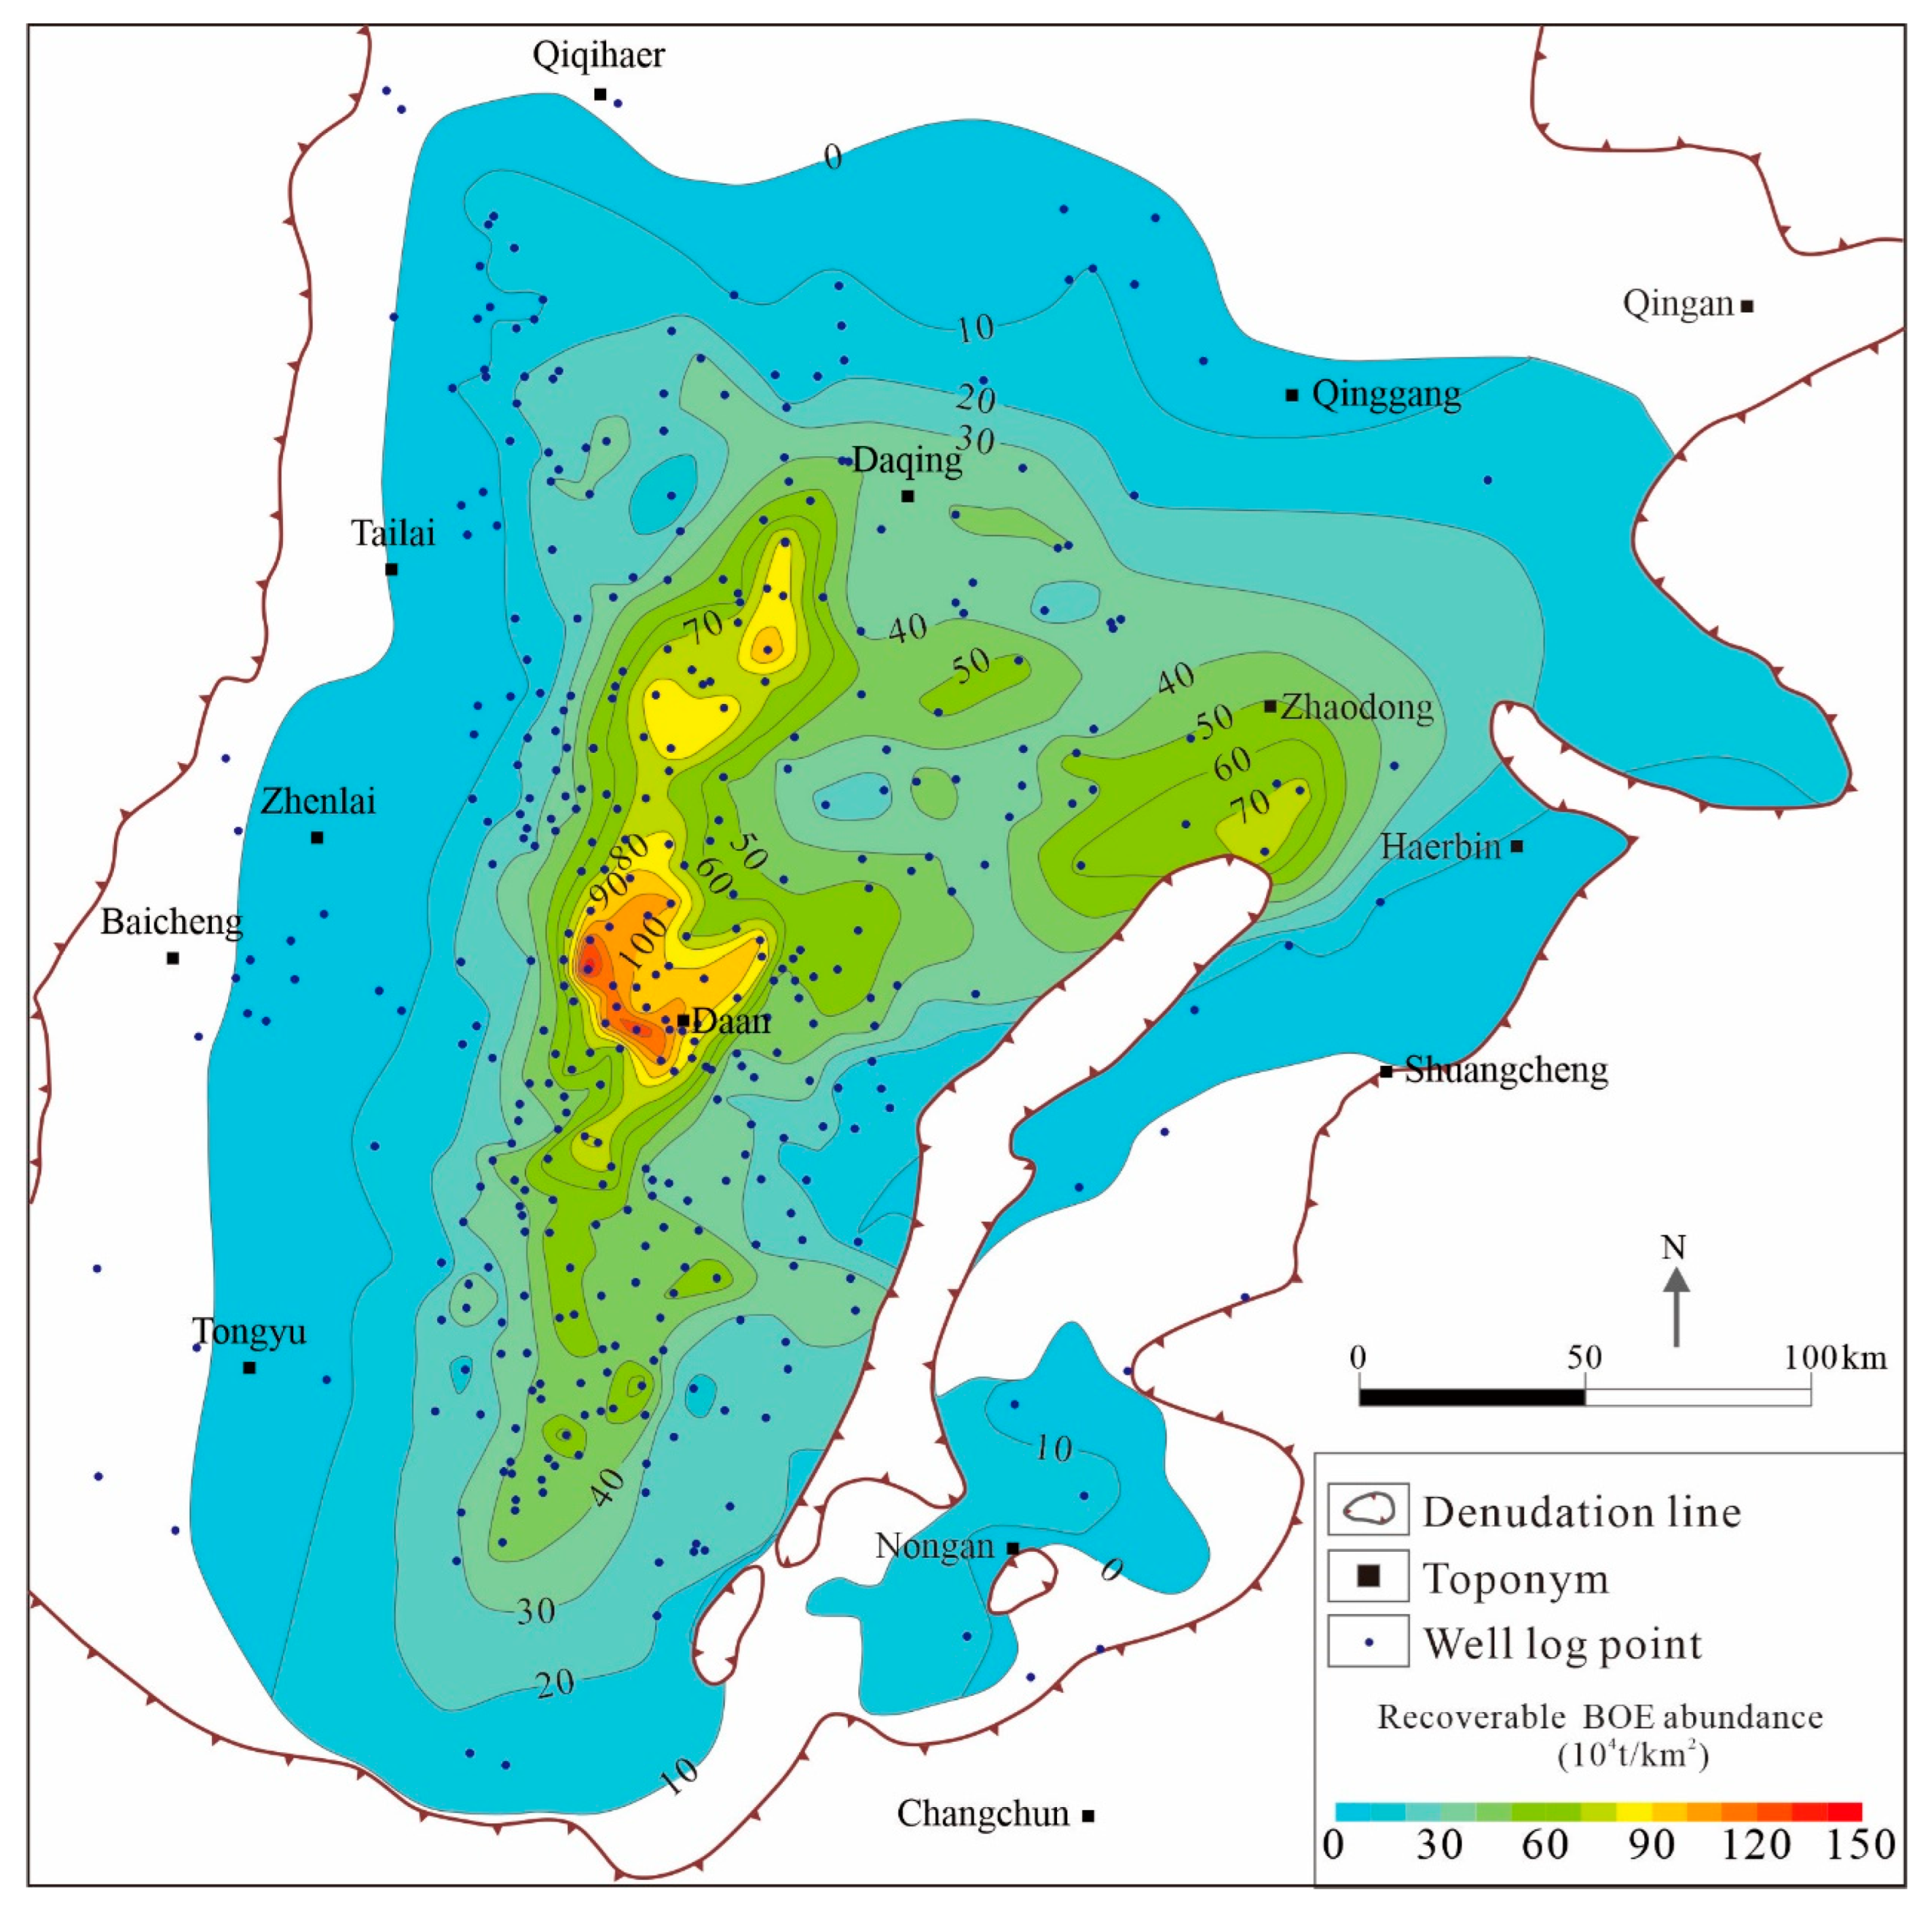
| Formation | Oil, 108t | Gas, 1012m3 | Area, km2 |
| the bottom of Nenjiang Formation II | 140.85 | 9.22 | 82214 |
| the middle of Nenjiang Formation I | 123.82 | 7.60 | 77407 |
| the bottom of Nenjiang Formation I | 27.35 | 1.76 | 44781 |
| Total | 292.02 | 18.58 | |
| Overlap area | 82214 |
Disclaimer/Publisher’s Note: The statements, opinions and data contained in all publications are solely those of the individual author(s) and contributor(s) and not of MDPI and/or the editor(s). MDPI and/or the editor(s) disclaim responsibility for any injury to people or property resulting from any ideas, methods, instructions or products referred to in the content. |
© 2024 by the authors. Licensee MDPI, Basel, Switzerland. This article is an open access article distributed under the terms and conditions of the Creative Commons Attribution (CC BY) license (http://creativecommons.org/licenses/by/4.0/).


