Preprint
Article

Numerical Simulation Of Nonlinear Advection-Diffusion-Fractional Equation of Pollutants in Porous Media

Altmetrics

Downloads

121

Views

43

Comments

0

This version is not peer-reviewed

Submitted:

05 May 2024

Posted:

07 May 2024

You are already at the latest version

Alerts
Abstract
The fractional advection-dispersion equation FADE plays an important role, especially in explaining the process of solute-transport in natural porous media with different degrees of heterogeneity. However, studies of the flow and transport of contaminants in the underground environment are based on the knowledge of many functional parameters of the subsoil. The delay factor caused by nonlinear absorption is one of these parameters inheriting significant ambiguities in its estimation in heterogeneous media. In the study, a fractional advection-dispersion FADE model was developed by the implicit Euler method, based on a Grunwald and Caputo-Liousville approximation to explicitly evaluate and simulate the transport mechanism of contaminants in media with unsaturated porous materials subjected to a nonlinear sorption model. Better solute mass retention was observed for fractional advection-dispersion FADE model. Moreover, the absorption parameter of the retardation coefficient has a better impact on the motion of the solute in a saturated porous medium. In other words, it has a significant effect on the dispersion of pollutants in aquifers. This study highlights the need to characterize the aquifer to predict solute transport in porous media.
Keywords: 
Subject: Environmental and Earth Sciences  -   Pollution

1. Introduction

The transport of dissolved contaminants through heterogeneous hydrogeology relies on the expression of their functional parameters. Non-linear uptake is a parameter that inherits significant ambiguities in its estimation when subjected to heterogeneous flow conditions [1]. The transport processes that govern the behavior of solutes in heterogeneous subsurface media are advection, dispersion, diffusion, sorption, and degradation. Among these processes, sorption and degradation play an important role in the infiltration and distribution of the solute in the heterogeneous porous medium [2]. The advection-dispersion equation (ADE) is the most commonly used method by researchers for the modeling of contaminant transport in subsurface environments. It describes contaminant transport processes in inhomogeneous porous media. However, it is less effective in describing this phenomenon in heterogeneous porous media [3,4,5]. EAD is based on the assumption of Fick's first law, whereas the solute transport process in heterogeneous porous media corresponds to a non-Fickian or anomalous mechanism [3]. Non-local transport models are alternative models proposed to explain the non-Fickian transport process. These non-local transport models include the spatial fractional advection-dispersion equation (s-FADE) and the temporal fractional advection-dispersion equation (t-FADE). The FADE equation is used to model the temporal and spatial variation of the concentration of one or more molecules of a substance. The fractional advection-dispersion-reaction model plays a key role in studying non-linear physical problems [6]. In groundwater hydrology, fractional advection-dispersion equations represent the passive transfer of tracers in the flow of a porous fluid [7] . Many physical models used in engineering and science are modeled using fractional derivatives. Over the last few decades, the use of fractional derivatives by researchers has increased dramatically in many important fields, including chemistry, signal theory, information systems, economics, viscoelasticity, finance, physics, and fluid mechanics [8]. Applications of fractional calculus have been successful in modeling various types of fractional differential equations, both linear and non-linear, Prashant Pandey et al [9,10]. Fractional derivatives are applied to many physical problems associated with dynamical systems involving differential equations [11]. Transport differential equations based on fractional derivatives are particularly well suited to describing anomalous dispersion processes, where a plume of particles propagates at a velocity incompatible with the classical Brownian motion model. When a fractional derivative replaces the second derivative in a diffusion or dispersion model, diffusion is improved [12]. In the groundwater flow model, the second spatial derivative in the traditional FADE is replaced by a fractional derivative of order α, where 1 < α < 2 [13]. FADEs have been successfully applied to simulate solute transport in homogeneous and heterogeneous, saturated and unsaturated soils on a laboratory scale [14], in a sand and gravel aquifer [5,15] and in a highly heterogeneous aquifer [15]. The approximate numerical solution of the reaction-diffusion-fraction equation remains a focus of important research today because of its nature and application to petroleum reservoir simulation modeling, fluid flow in porous media, global water production, power generation, and drinking water production [6] .
The use of fractional advection-dispersion models has been discussed by many researchers from different angles. Here are some examples. [8] used the energy method to show the unconditional stability and order of convergence obtained from the discrete-time scheme of the s-FADE in the finite domain, where the time and space derivatives are the fractional Caputo derivative. [16] studied the existence and uniqueness of the fractional advection-dispersion equation described by the generalised Caputo-Liouville fractional derivative. The method of Laplace transformations was developed to obtain approximate solutions of the fractional advection-dispersion equation. In [17], the combination of an advection-dispersion equation in fractional time and fractal space was studied using fractional fractal derivatives to model groundwater transport. In the same work, [17] showed that the fractal advection-dispersion equation shows that the fractional order in time controls the peak location of the breakthrough curve and the fractal dimension in space controls the drag in the simulated breakthrough curve. The researcher [18] developed a numerical and experimental method to solve the fractional advection-dispersion equation as a relation used in groundwater by exploring the applicability developed by the numerical method of homogeneous and heterogeneous solutions in subsurface media. The authors of the study [19] developed a fractional dispersion aversion model through experimental and numerical studies to evaluate the solute transport parameter of s-FADE in homogeneous and heterogeneous soils.
Non-linear fractional partial differential equations are not as easy to solve as linear equations. Furthermore, there is no exact solution to the fractional order differential equation by any method. Therefore, the fractional-order advection-dispersion fractional equation (FADE) makes research more important and practical [7] . It can more accurately describe the transport of contaminants in unsaturated porous media.
A mathematical model with four types of input conditions was developed by [1] to evaluate the variability of the dispersion coefficient at temporal and spatial scales on the contaminant transport mechanism in unsaturated porous media subjected to a non-linear sorption model. The variability of the sorption parameters of the Freundlich model on contaminant dispersion in aquifers was not considered by these authors.
In our recent work [20,21,22], the numerical solution of the classical dispersion and advection equation has been developed taking into account the time and space dependent dispersion coefficient to describe the contaminant transport mechanism in subsurface media. The latter does not consider the fractional advection-dispersion equation (FADE) model, which is now very effective in adequately capturing contaminants in heterogeneous porous media [4].
[23] Rashmi Radha et al (2023) numerically solved a two-dimensional contaminant transport model with time-varying axial input sources subject to nonlinear sorption, decay and production. They highlighted the influence of hydrogeological parameters such as medium porosity, density, sorption conditions and dispersion coefficients, but failed to highlight the influence of the adsorption coefficient (Kd) on the spatio-temporal variation of contaminant concentration in subsurface media. Furthermore, these studies did not consider the fractional advection-dispersion equation (FADE) model, which remains essential for describing the level of contamination in non-linear porous media.
This paper proposes a numerical solution of the fractional advection-dispersion equation (FADE) model to explicitly evaluate and simulate the contaminant transport mechanism in unsaturated porous media subjected to a non-linear sorption model.
We aim to evaluate the influence of parameters n (sorption intensity or Freundlich parameter) and adsorption coefficient (Kd) on the spatiotemporal variation of contaminant concentration in the underground environment. This work will also make it possible to select the values of n (sorption intensity) and the adsorption coefficient (Kd) at the aquifer outlet to optimize the retention of pollutants in the underground environment.

2. Materials and Methods

2.1. Physical Model of System

Water containing pollutants, such as sewage and radioactive waste, seeps into the soil matrix as does direct runoff from surfaces resulting from runoff. This water eventually enters the aquifer and is influenced by distance and subsoil parameters, and becomes a source of drinking water. As water passes through the soil, pollutants are mixed, adsorbed, dispersed, and diffused in the flow. The classic porous domain considered for the present study is shown in Figure 1 below.

2.2. Mathematical Reformulation

Pollutants infiltrating groundwater can be studied by integrating zero-order and first-order adsorption and decay coefficients. The movement of solute in the flow region occurs due to advection and dispersion. One-dimensional solute motion in a heterogeneous porous medium can be studied numerically using the spatial fractional advection-dispersion equation for a one-dimensional unsteady-state velocity field with a first-order decay function, and an absorption coefficient non-linear. s-FADE is a spatially nonlocal model capable of describing solute particle motions encompassing a very large transition due to high heterogeneity to preferential high-velocity flow paths. The influence of heterogeneity leads to the variability of some coefficients of the FADE model hence the fractional-order α in this work is allowed to be variable in the porous medium, a fraction instead of the integer constant of 2. The one-dimensional advection-dispersion space-fractional equation for a conservative contaminant can be written as follows [1,18]:
R d c ( x , t ) t = D f α c ( x , t ) x α v 0 x c ( x , t ) x λ c ( x , t )
Where c is the concentration of the contaminant, D f is the fractional dispersion coefficient, t is the time, and x is the distances traveled by the fluid in the porous medium. λ is the first-order decay coefficient and R d is the delay factor generated by the nonlinear sorption of the pollutant. The temporal fractional advection-diffusion model can be written in the form of the following equation (3) [1,17]:
γ c ( x , t ) t γ = 1 R d D f c ( x , t ) x v 0 x c ( x , t ) x λ c ( x , t )

2.3. Description of the Coefficient of the First Order Decay Coefficient

A first-order equation is used to represent the kinetics of simple reactions such as certain microbial degradation reactions. The equation 3 is written as:
c t = λ c
Where c is the concentration in the liquid phase, λ is the degradation coefficient which is expressed as a function of the half-life of the compound:
λ = ln ( 2 ) T 1 / 2
Where T 1 / 2 is the half-life time. The degradation kinetics of organic pollutants strongly depend on the properties of the medium (presence of an electron sensor, such as oxygen). Moreover, the kinetics observed for certain conditions is not necessarily transposable to other conditions, [24].

2.4. Description of the Model of the Delay Factor Generated by the Sorption of the Pollutant (Rd)

There are two types of sorption isotherm: linear and non-linear. The linear sorption isotherm applies to low concentrations of contaminants and to absorption. If the sorption isotherm is linear, there is no upper limit to contaminant sorption to soil particles. However, solute transport is more realistic for the non-linear sorption model [23] . The Freundlich transport model has shown that below a threshold concentration, the retardation factor increases with the Freundlich isotherm exponent n, whereas the trend is reversed and the retardation factor decreases as n increases above this specific concentration. Due to hydrodynamic dispersion, the concentrations in the plume decrease towards the edges of the plume. The model for the non-linear absorption dependent retardation factor is given by the relationship:
R d = 1 + ρ b θ k d n c n 1
Kd is the adsorption coefficient and n is the sorption intensity. ( ρ b ) is the specific weight of the solid particle in the matrix, θ is the porosity of the porous medium (The porosity is the ratio between the volume of all the pores of a sample of the soil representative of the medium considered, and the total volume of the same sample). k d expresses the ratio between the amount of solute concentration absorbed per unit area and the amount of concentration in solution. It eventually causes a delay of solute relative to mobile fluid in the fracture. The delay factor increases with the Freundlich isothermal exponent n. The retardation coefficient increases non-linearly with decreasing concentration. The effect of the isothermal exponent on the lag coefficient depends on the order of magnitude of the concentration [9].

2.5. Initial and Boundary Conditions

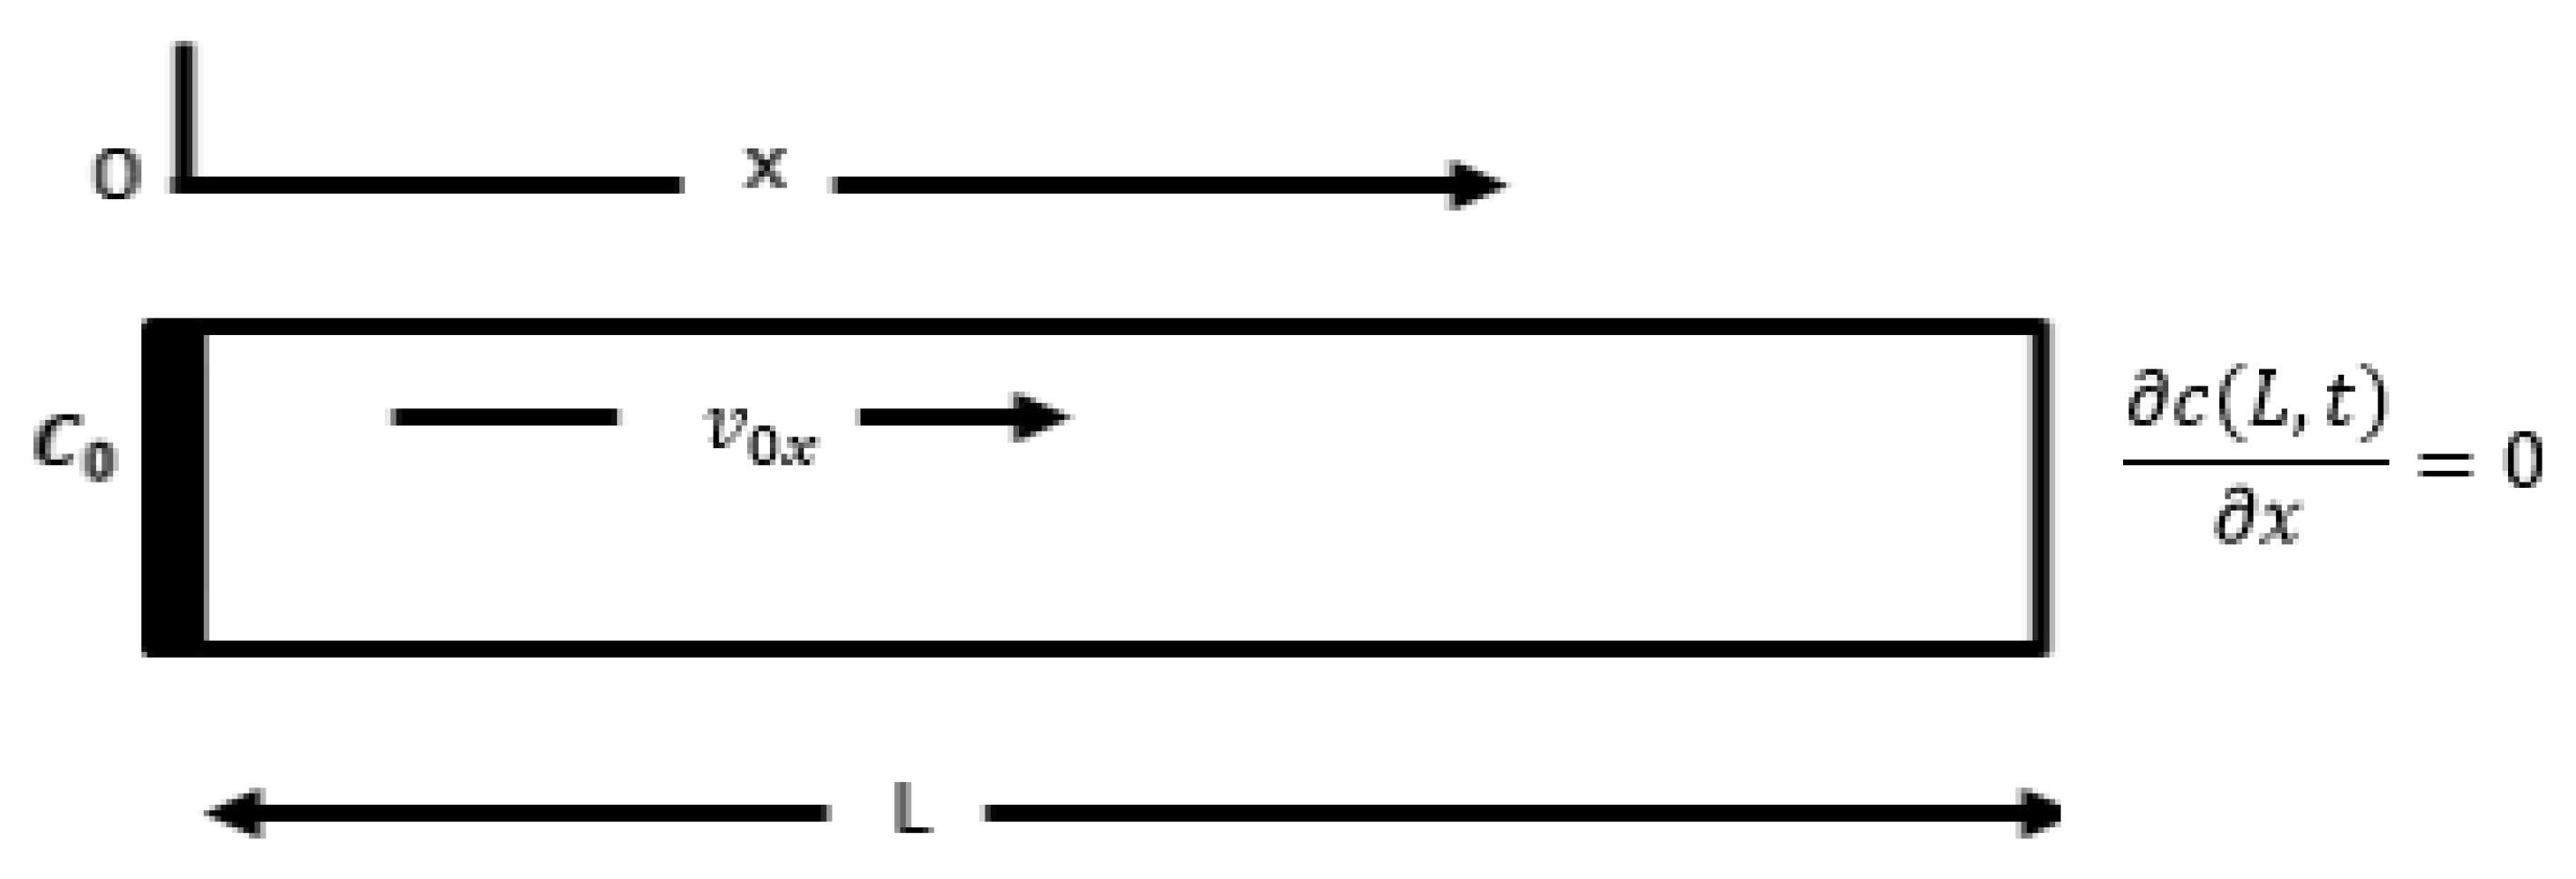
From the source of the pollutants, the concentration disperses further into the porous medium in the direction of flow (x) Figure 1. A one-way horizontal flow of water through an aquifer of finite length L is considered [21]. The problem can be mathematically defined by equations 1 and 2 with the initial and boundary conditions given successively in equations (3) and (4) as follows:
c ( x , 0 ) = 0 , 0 x L ,
c ( 0 , t ) = c 0 , t 0 c ( L , t ) x = 0 , t 0 ,

2.6. Numerical Solution of the Mathematical Model

The one-dimensional solute transport equation is a parabolic type partial differential equation in which, the finite difference technique is commonly used to obtain the numerical solution. An explicit finite difference technique is generally used and eventually gives rise to the restrictive stability criteria [10,20].

2.7. Spatial Fractional-Order Derivative

In this part, the basic theory of the numerical solution of the fractional space of equation 1 in an infinite domain is [18]. The discrete approximation of the fractional derivative term can be defined from the Grunwald norm, as follows.
α c x α = 1 Γ ( α ) lim n 1 h α k = 0 i Γ ( k α ) Γ ( k + 1 ) c ( x k h , t ) ,
Where i is a positive index, Γ ( α ) is the gamma function. The value of the fractional derivative at a point x depends on the values ​​of the function at that point and all points to the left of that point of interest x. The explicit Euler method associated with the Grunwald approximation on fractional derivatives will be used in this part, which is as follows:
c i j + 1 c i j Δ t = c i j + 1 ( R d ) i j v 0 x c i j c i 1 j h + D f h α Γ ( α ) k = 0 i Γ ( k α ) Γ ( k + 1 ) c i k j
were (i= 1,2,..., N x ), (k=0, 1,2, ...,) et (j=0, 1,2, ..., N t ) x = i h , t = j Δ t . Normalized Grunwald weights are defined by:
f k = Γ ( k α ) Γ ( α ) Γ ( k + 1 )
These normalized weights only depend on the order α and the index k. (For example, the first four terms of this sequence are given by : f 0 =1, f 1 = α , f 2 = α ( α -1)/2!, f 3 = α ( α -1) ( α -2)/3!, the resulting equation to be solved explicitly is reduced by:
c i j + 1 = 1 ( R d ) i j ( R d ) i j + λ Δ t h v 0 x + Δ t h α D f c i j + v 0 x h + α h α D f Δ t c i 1 j + D f h α k = 2 i f k c i k j

2.8. Temporal Fractional-Order Derivative

In this section, the solution of the temporal fractional numerical equation (2) in an infinite domain is developed. The Caputo-Liousville fractional derivative is exploited with the following equation Lui et al, (2012):
γ c t γ = 1 Δ t γ Γ ( 2 γ ) k = 0 j w k γ c ( x , t j + 1 k ) c ( x , t j k ) ,
were w k γ = ( k + 1 ) 1 γ k 1 γ , k = 1 , 2 , ... , n  ,(i=0, 1,2,..., Nx) et (j= 1,2, ..., Nt) x = i h , t = j Δ t . The explicit Euler method associated with the Caputo-Liousville approximation on the fractional derivatives of equation (2) is used in this part, which is presented by the following equation (13):
( R d ) i j Δ t γ Γ ( 2 γ ) k = 0 j w k γ c ( x , t j + 1 k ) c ( x , t j k ) = v 0 x h c i j + 1 c i 1 j + D f h 2 c i + 1 j 2 c i j + c i 1 j + λ c i j
By simplifying equation (13) we obtain the following equation (14) to be solved explicitly:
c i j + 1 = c i j a 1 k = 1 j w k γ C ( x , t j + 1 k ) c ( x , t j k ) a 2 c i j c i 1 j + a 3 c i + 1 j 2 c i j + c i 1 j
Avec a 1 = w 0 γ , a 2 = w 0 γ v 0 x b Δ t , b = ( R d ) i j Δ t γ Γ ( 2 γ ) , a 3 = D i w 0 γ h 2 b , ( R d ) i j = 1 + ρ b θ m k d n ( c n 1 ) i j
The discretization of the initial conditions and limit associated with the equation (6) and (7) to apply to this method is given successively to the following equation (15) and (16):
c i 0 = 0 , 0 i k 1 ,
c 0 j = c 0 , j 0 c N x j x = 0 , j 0 ,

2.9. Stability Condition for the Spatial Fractional Order Derivative

Suppose that c i 0 is the only term that has an error, so the perturbed value is c i 0 ¯ = c i 0 + δ i 0 , this perturbation produces a perturbed value for given c i 1 ¯ = c i 1 + δ i 1 , equation (11) becomes:
c i 1 ¯ = β i c i 0 + 1 ( R d ) i 0 v 0 x h + α h α D f Δ t c i 1 j + D f h α k = 2 i f k c i k j = β i δ i 0 + c i 1
where the factor
β i = 1 ( R d ) i 0 ( R d ) i 0 + λ Δ t h v 0 x + α h α D f
So we have δ i 1 = β i δ i 0 . That is, the error is magnified by the factor β i when the finite difference equation is advanced one time step. After j no time, we can write δ i j = β i j δ i 0 which is the amplification factor. For the explicit Euler method to be stable, | β i |   1 or
Δ t v 0 x h ( λ + 1 + R d i ) α D f h α Δ t v 0 x h ( λ + 1 R d i )

2.10. Stability Condition for the Temporal Fractional Order Derivative
In this part the equation (14) can still be written in the form:
c i + 1 j = 2 + λ 1 a 3 + a 2 a 3 c i j 1 + a 2 a 3 c i 1 j + 1 a 3 c i j + 1 + a 1 a 3 k = 1 j w k γ c ( x , t j + 1 k ) c ( x , t j k )
Suppose that C 0 j is the only term that contains the error, so the perturbed value is c 0 j ¯ = c 0 j + δ 0 j This perturbation gives rise to another perturbed value C 1 j which is c 1 j ¯ = c 1 j + δ 1 j , then Equation (20) becomes:
c 1 j ¯ = m i c 0 j + 1 a 3 c i j + 1 1 + a 2 a 3 c i 1 j + a 1 a 3 k = 1 j w k γ c i j + 1 k c i j k = m i δ 0 j + c 0 j
Where the factor m i = 2 + λ 1 a 4 + a 2 a 4 is the amplification factor associated with the error with δ 1 j = m i δ 0 j when the finite difference of the equation is advanced by a spatial step, for i spatial step , we have δ i j = m i j δ 0 j . For Euler's method to explain is stable, | m i |   1 which boils down to the following relationship (22):
Γ ( 2 γ ) D f Δ t v 0 x h 2 ( R d ) 0 j w 0 γ h 2 Δ t 1 + γ Γ ( 2 γ ) 3 D f Δ t v 0 x h 2 ( R d ) 0 j w 0 γ
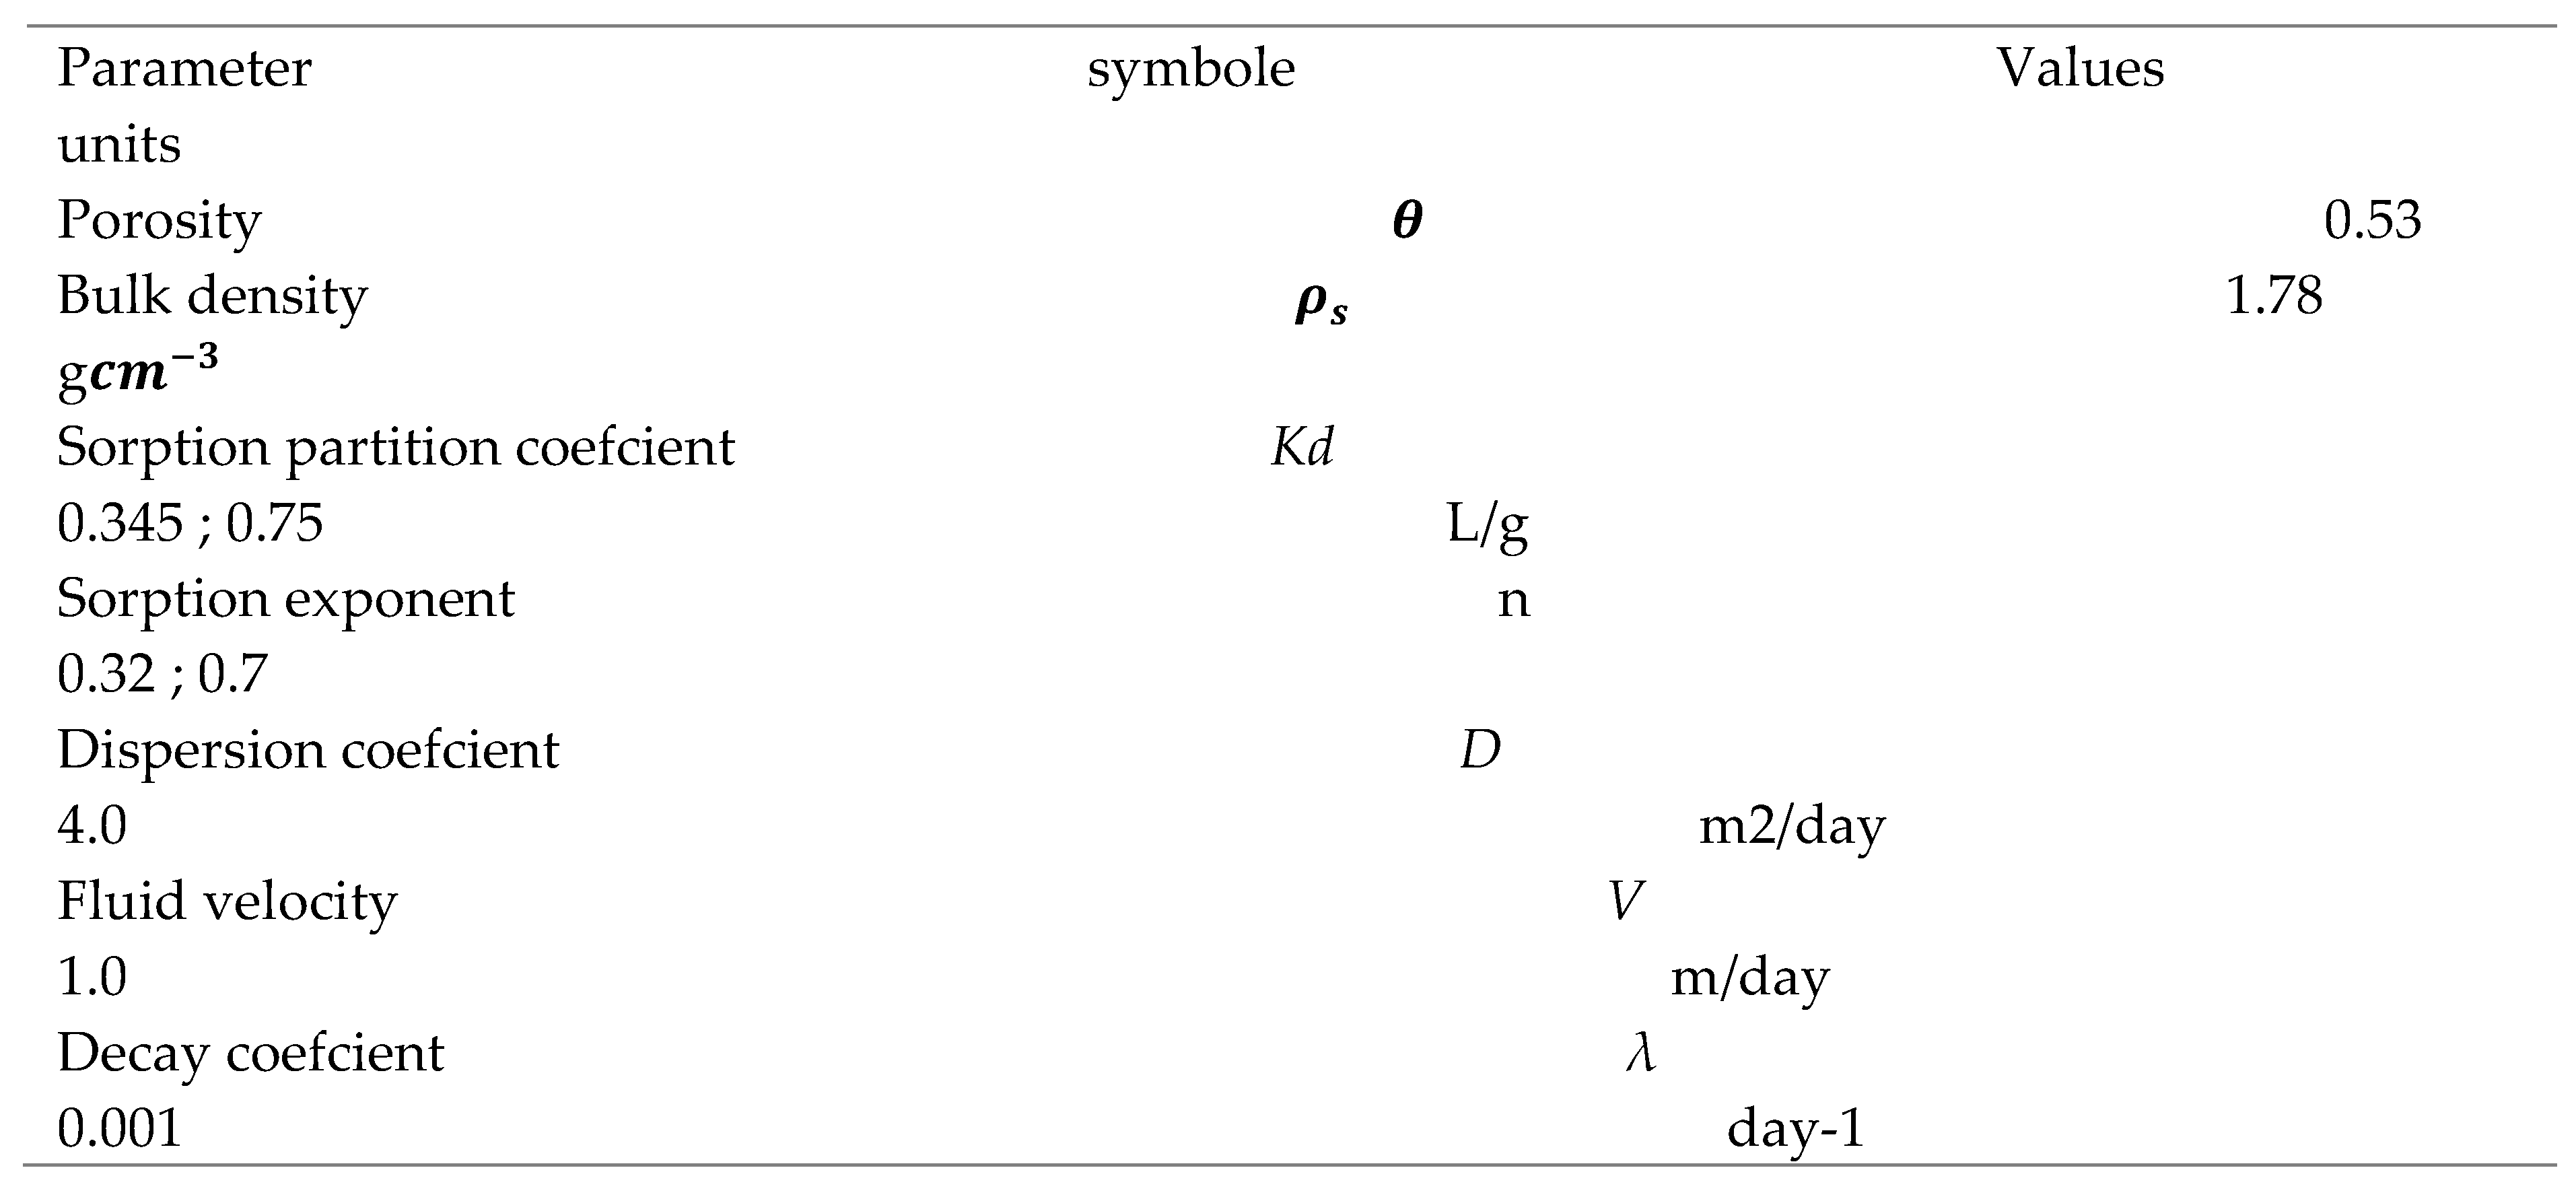
The experimental values of the delay factor parameters generated by the non-linear sorption have been exploited in the work of [2], the same data adding to the data used in the work of [1] will be exploited in this work, see Table 1 below
Table 1. Parameter data of delay factor R parameters.
Preprints 105666 i001

3. Results:

3.1. Effect of Spatial Fractional Order on the Concentration of Pollutants in a Porous Medium
In this section, the discrete numerical solution of the equation (11) associated with the initial conditions and the discrete limits of the equations (15) and (16) is simulated to obtain a certain number of results.
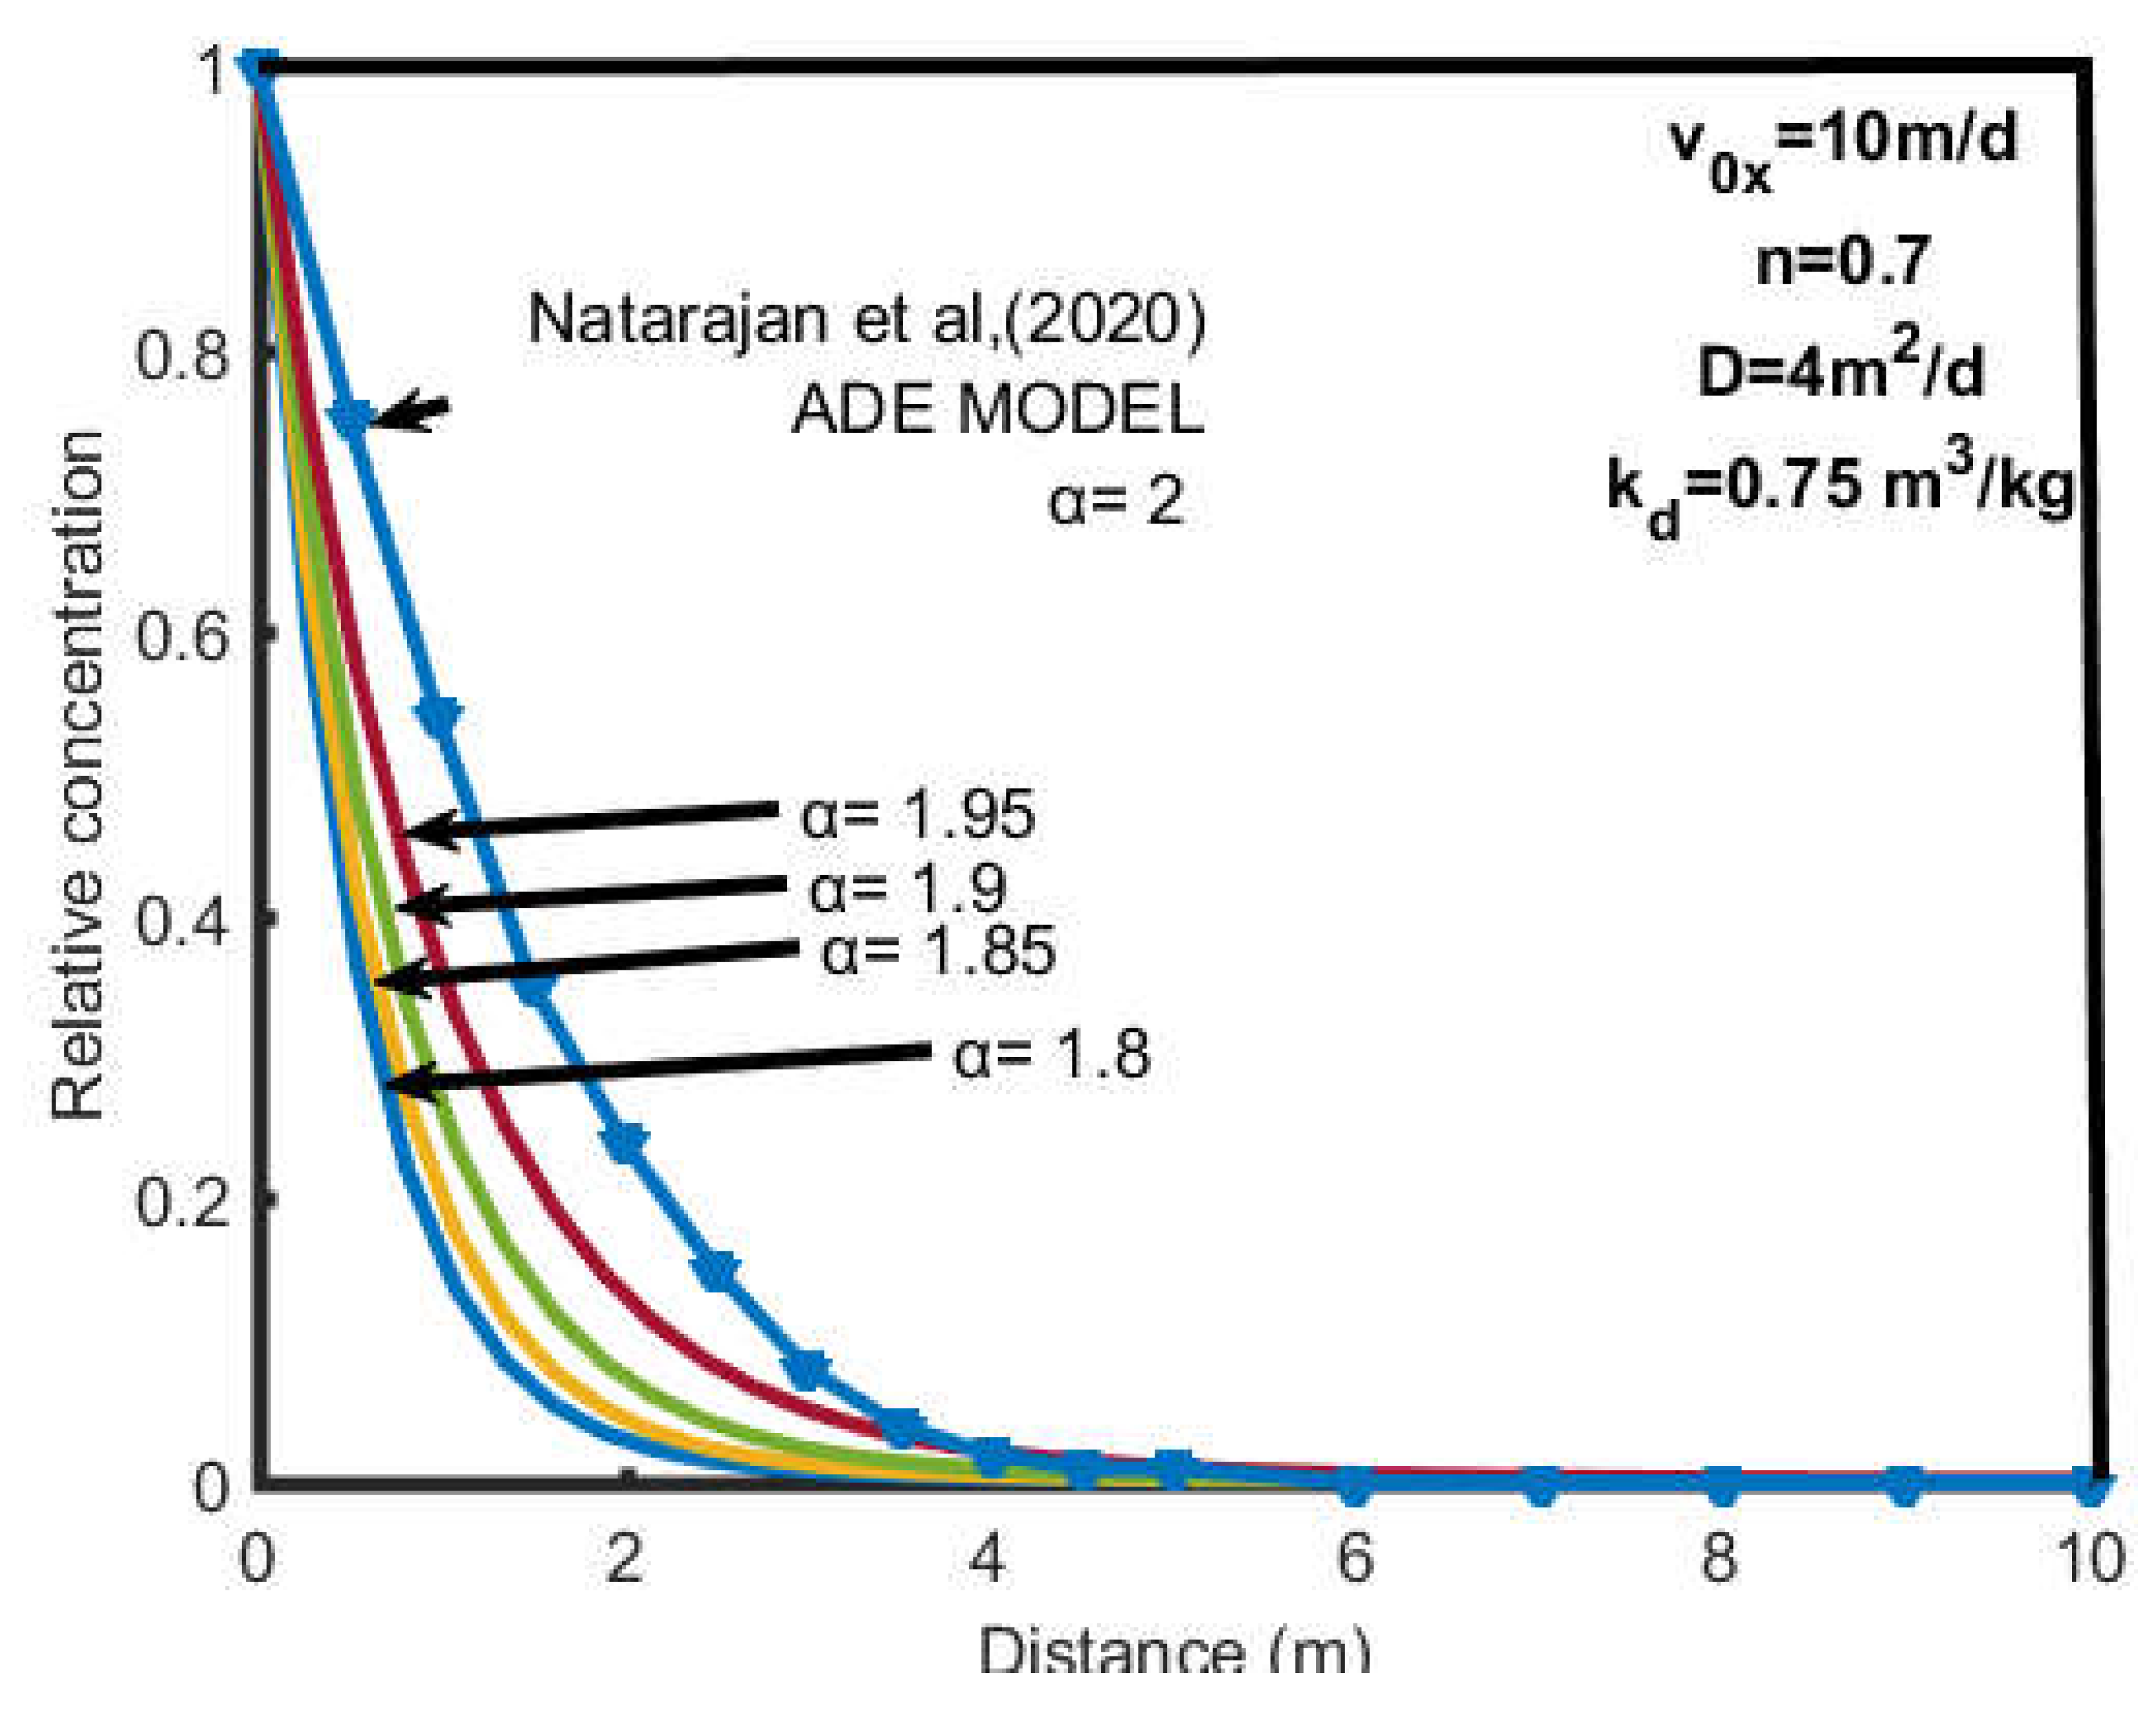
Euler's explicit method associated with Grunwald's fractional derivative approximation was used to simulate the numerical solution of equation (8) as a function of aquifer length, time, constant dispersion coefficient, and the flow rate of fluids in the aquifer. For this purpose, the parameters of the model used were selected in previous studies [1,2,14,19,20]. Figure 3 presents the Spatial variation of the concentration of pollutants in the porous medium for different spatial fractional-order values ​​α (α =1.8, 1.85, 1.9, 1.95.2) for the absorption coefficient Kd=0.75 L/g and n=0.7. Figure 3 shows that the mass of solute retained in the underground medium increases with (α). The concentration profiles follow an exponential decrease in the aquifer independently of the spatial fractional order (α). This result is similar to those of [1] for the case of the classic ADE model where α=2. These authors numerically simulated a mathematical model with four types of input conditions, to assess the variability of the dispersion coefficient on temporal and spatial scales on the contaminant transport mechanism ants in saturated porous media. They did not take into account the spatial fractional advection-dispersion equation (s-FADE) model, which remains today the most complex model to assess the level of a contaminant in underground environments, which is the object of our work. It is also observed that the slope of the concentration profile becomes closer and closer with a decrease in the value of α.
Figure 2. Geometry of the problem.
Preprints 105666 g002
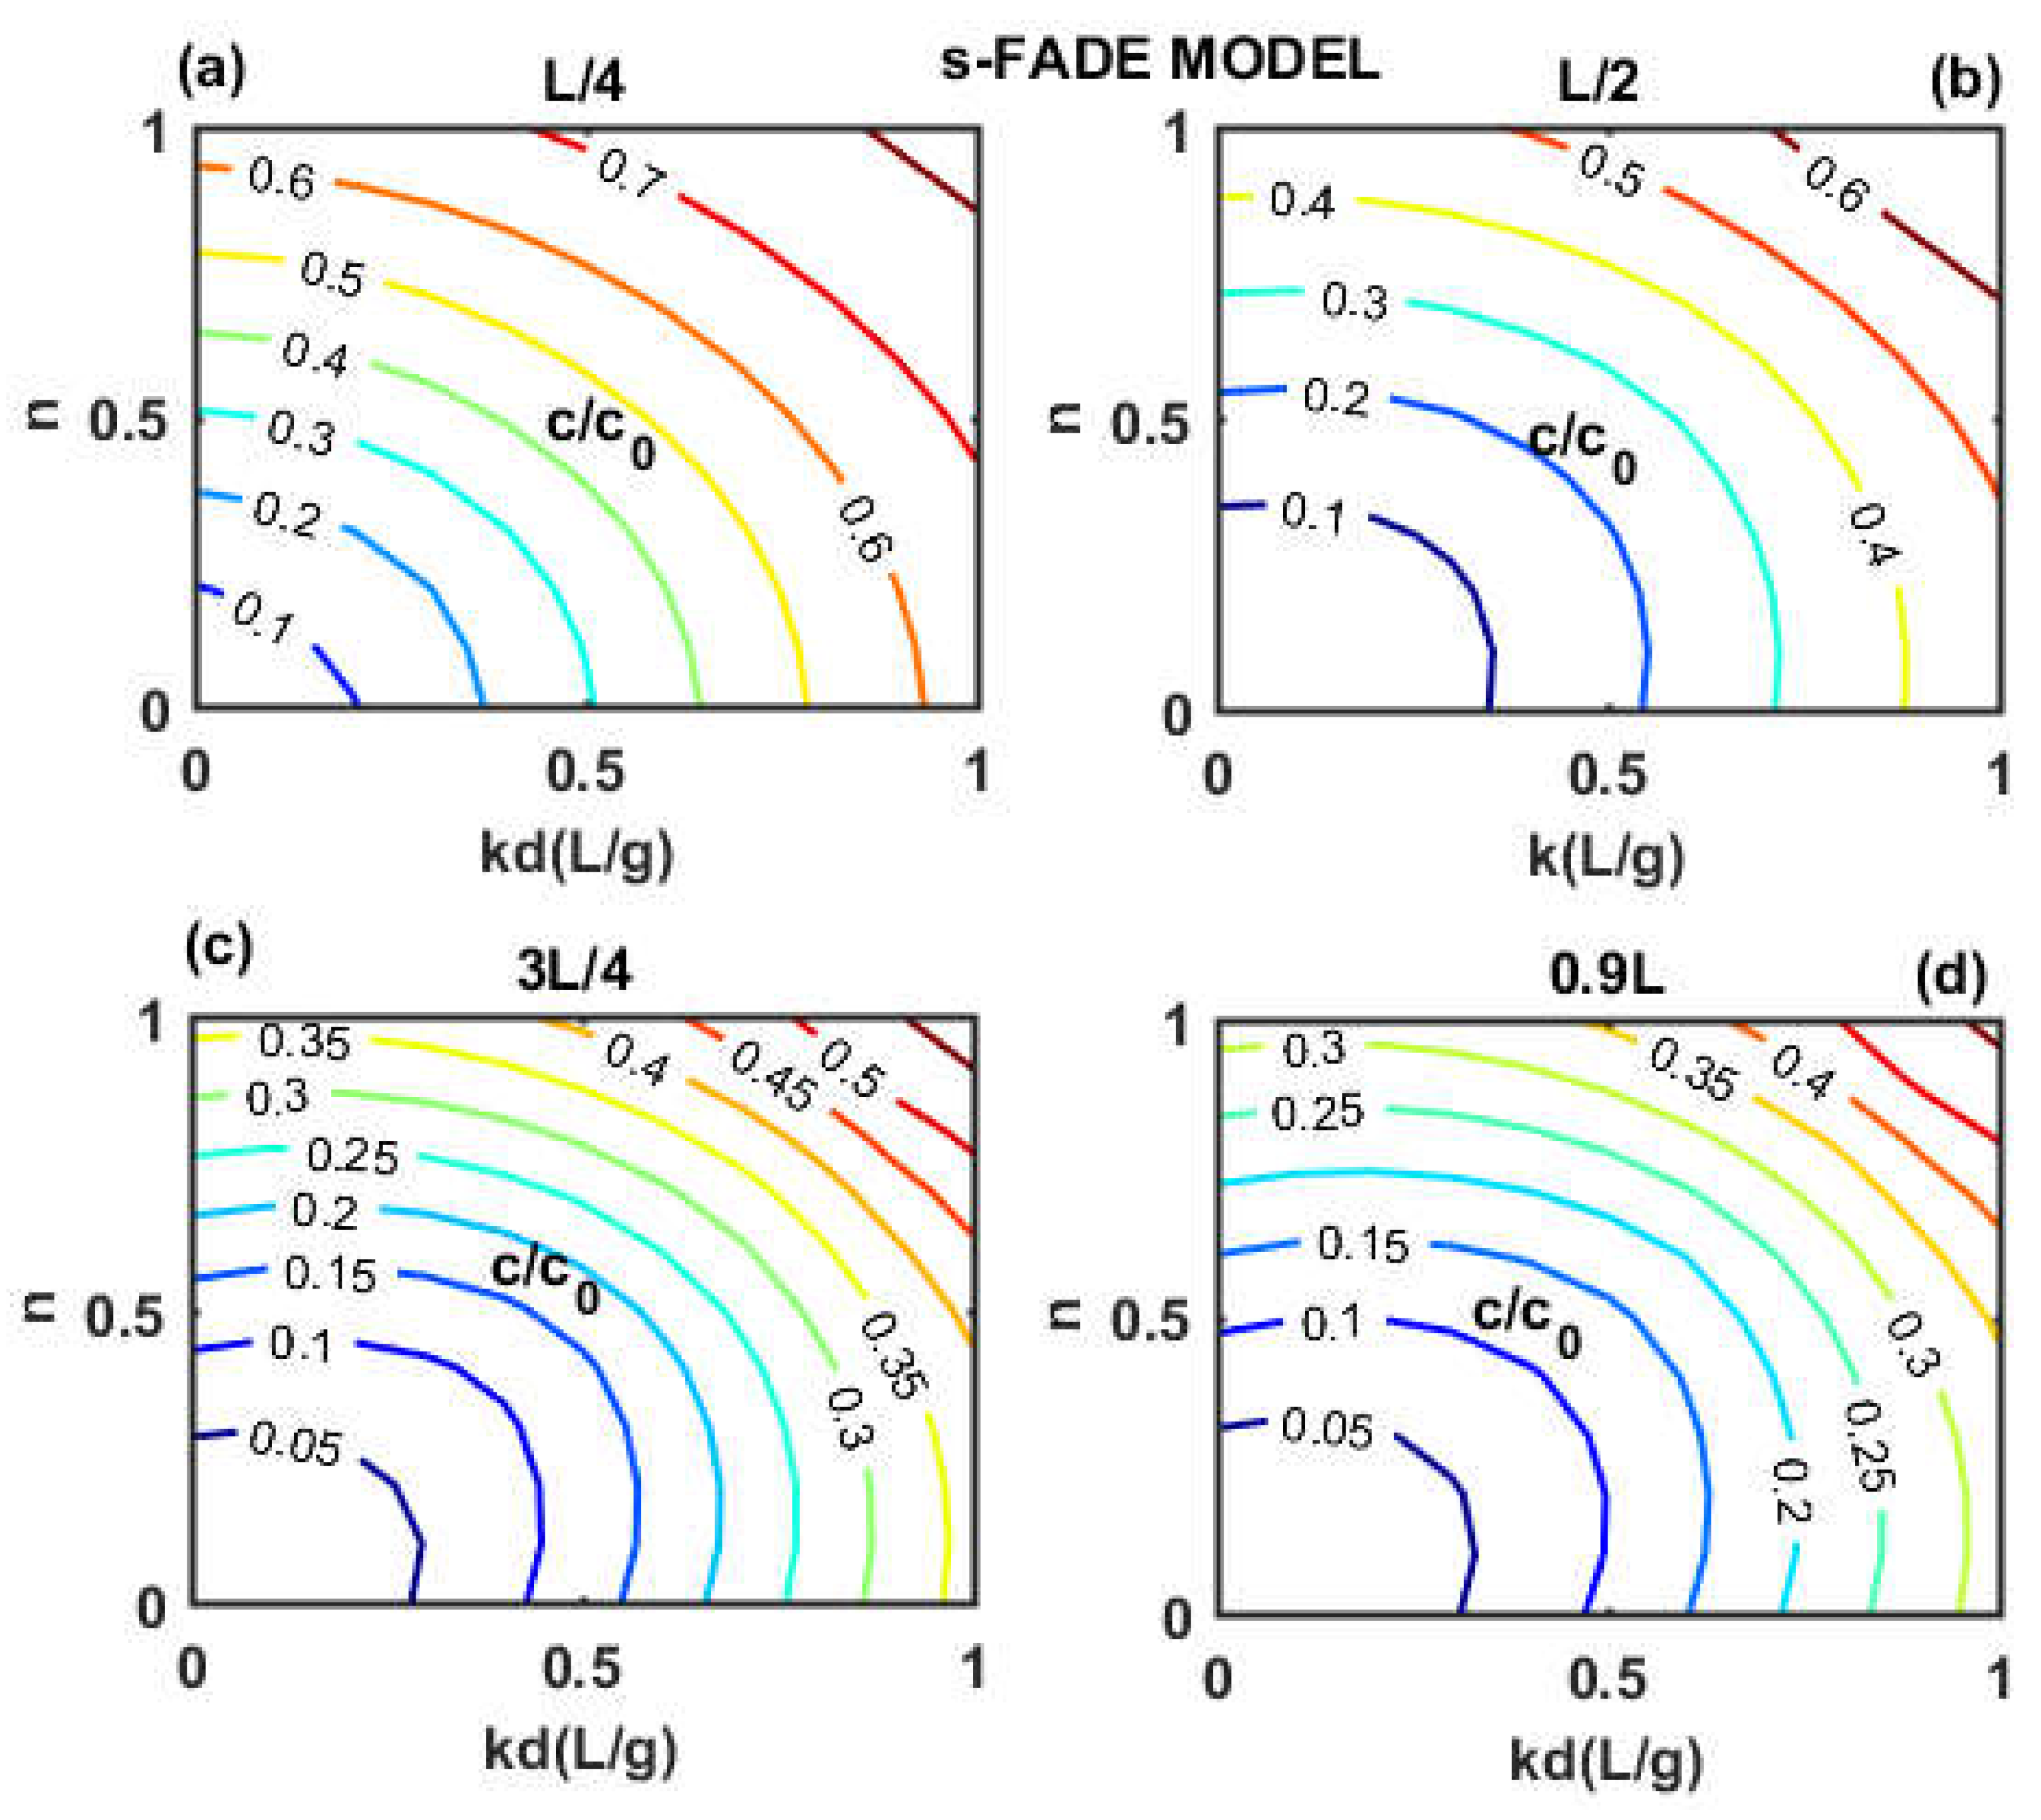
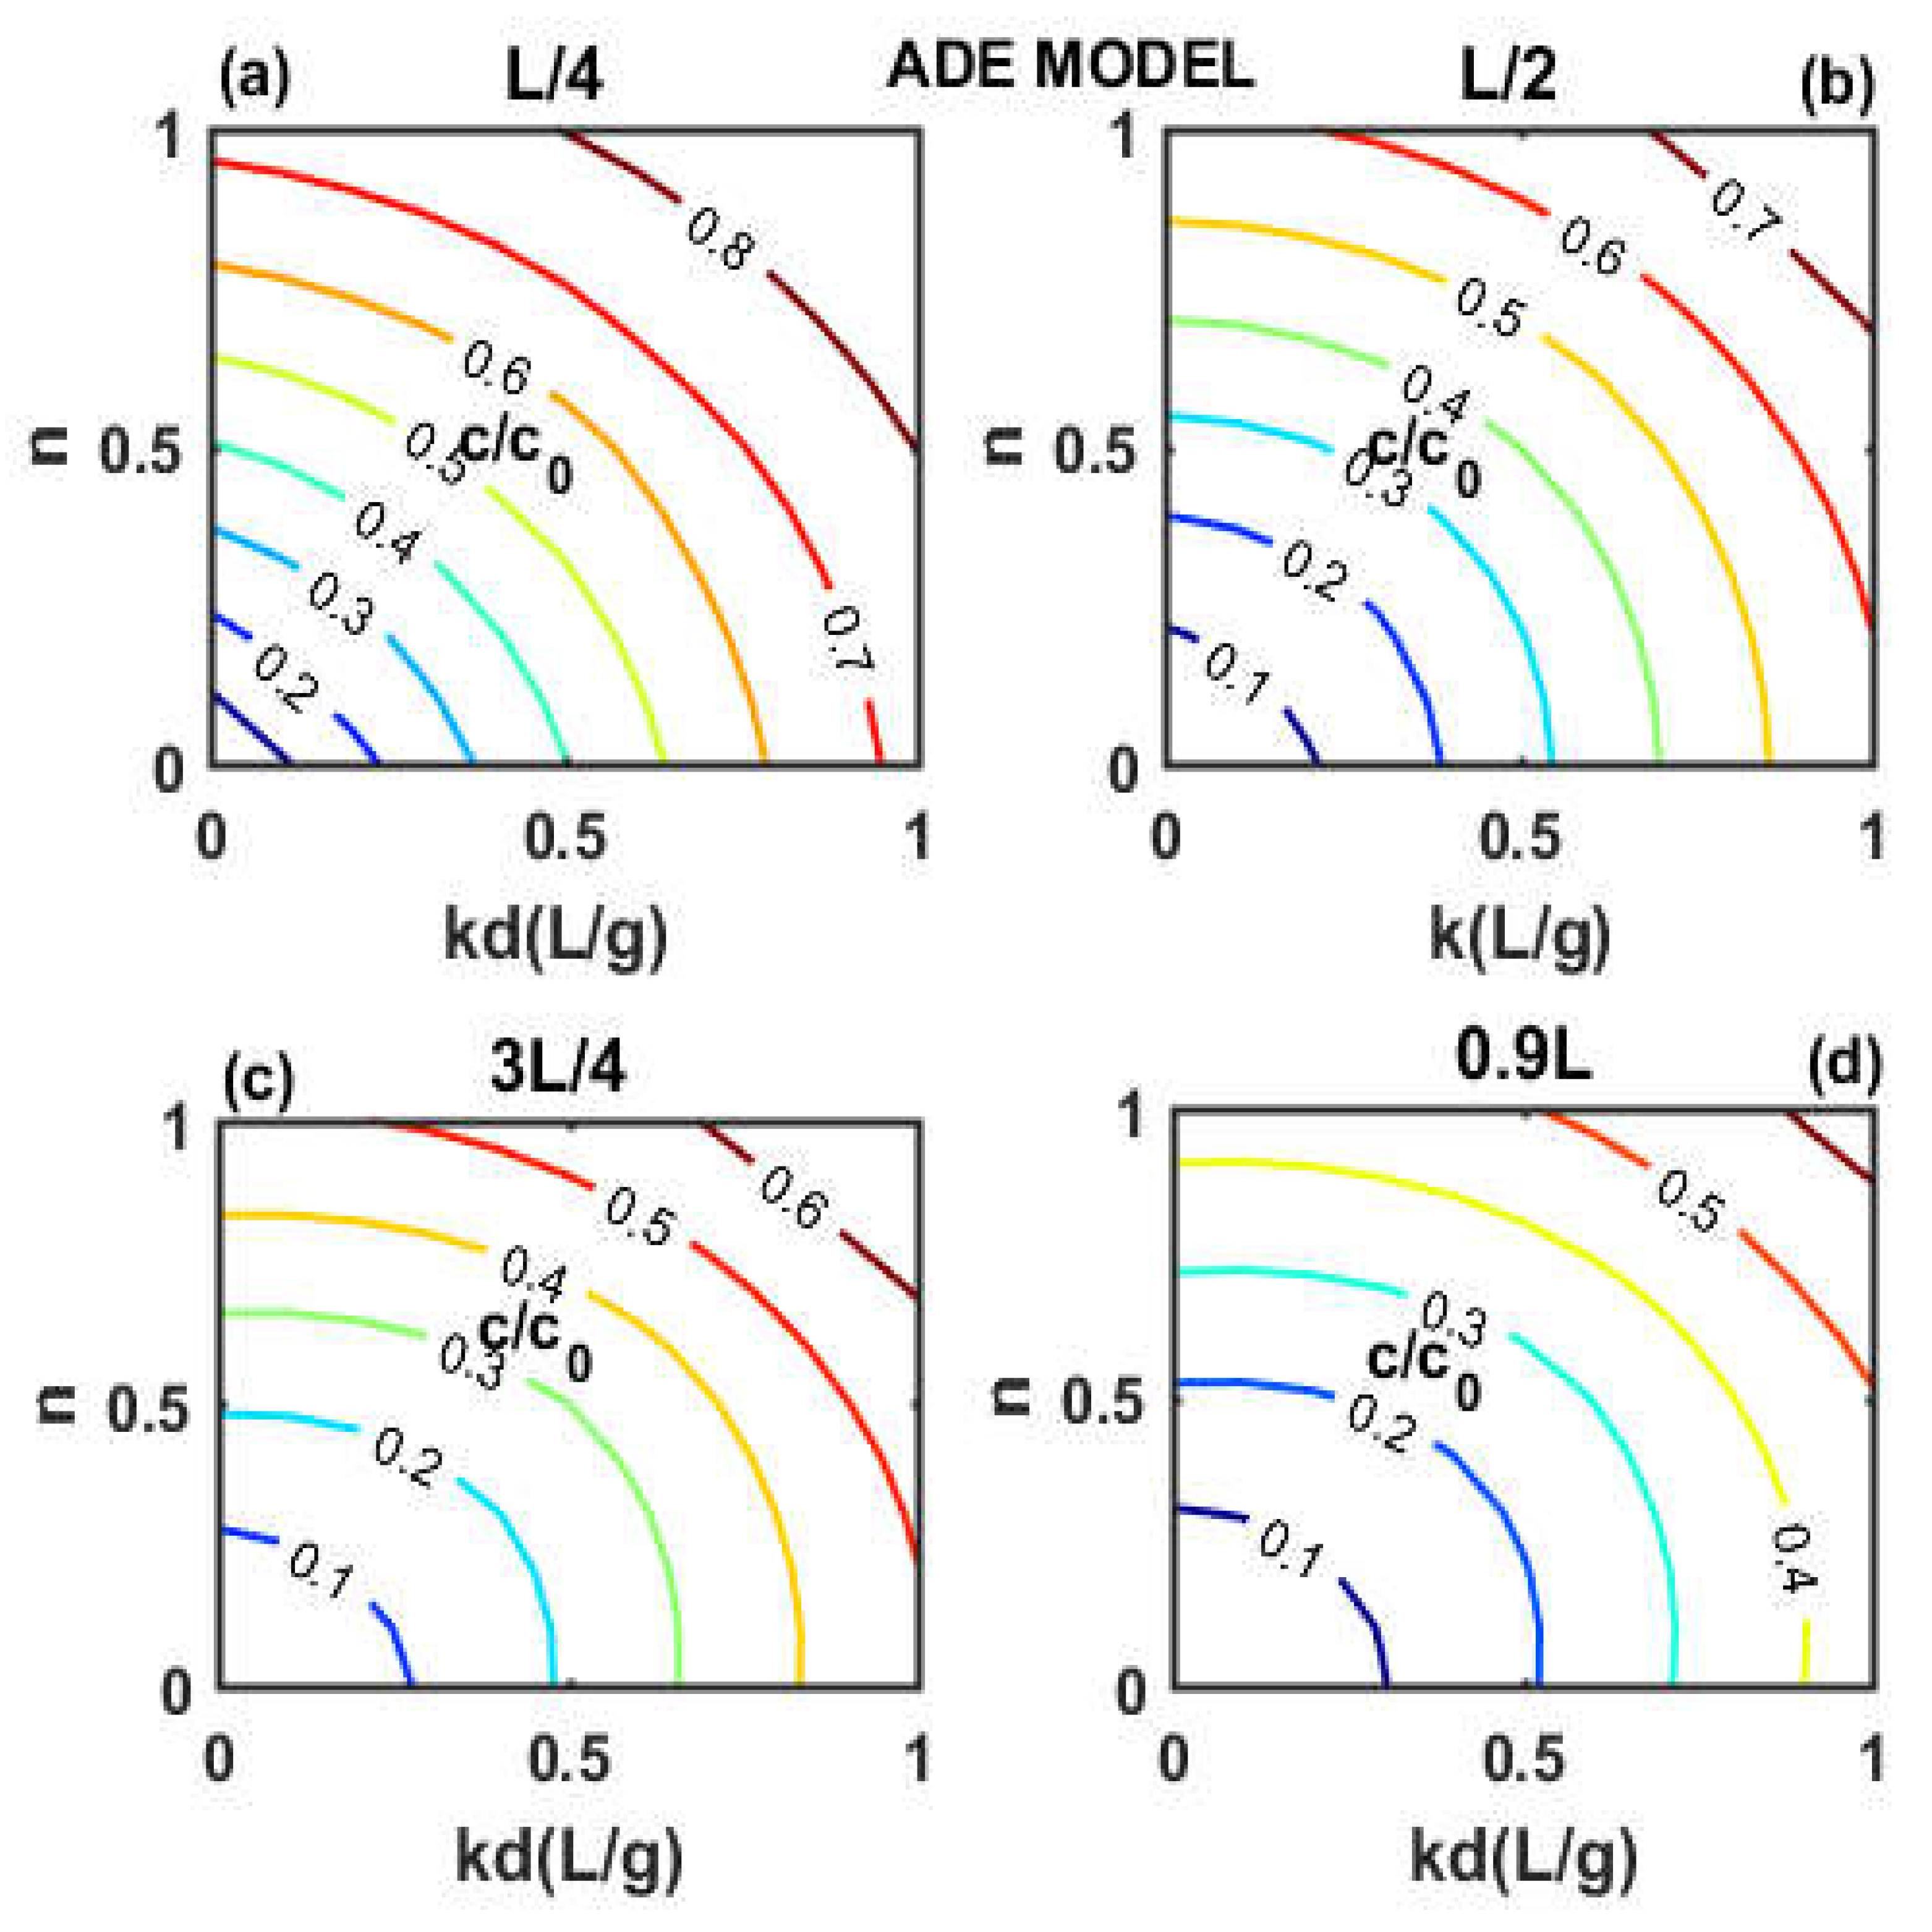
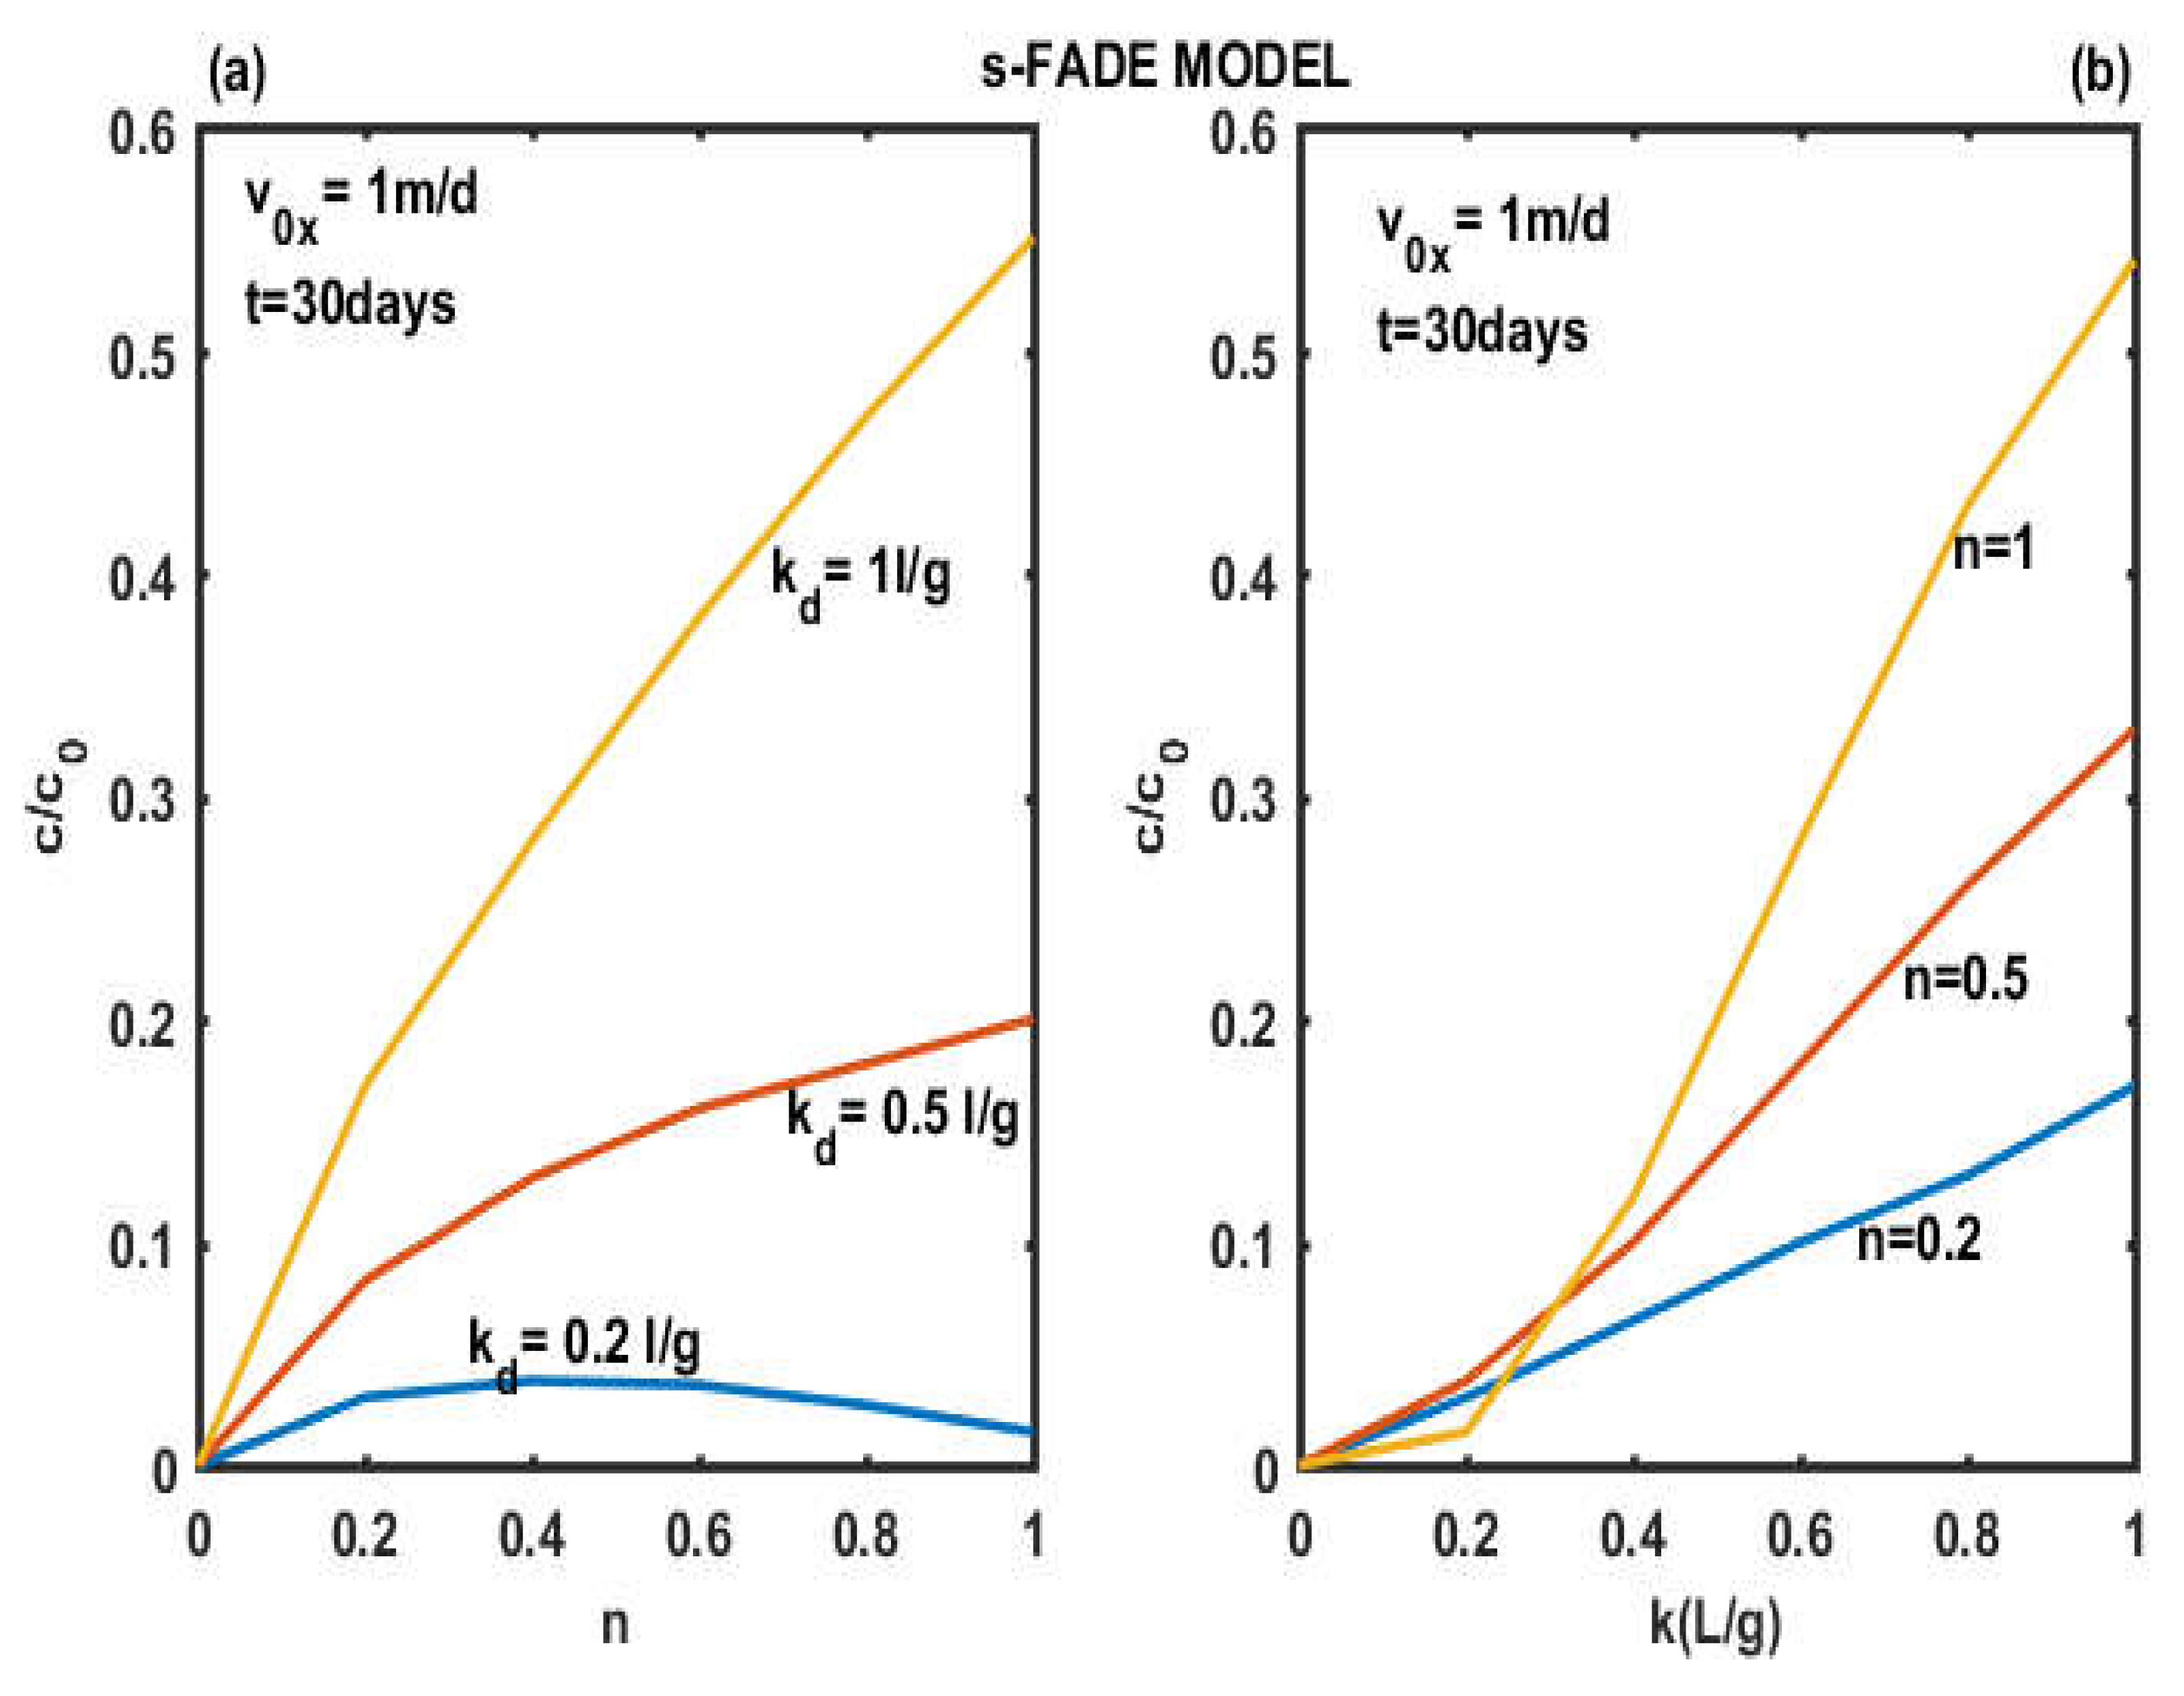
Four points were selected in the aquifer (L/4, L/2, 3L/4, 0.9L) to assess the dispersion behavior of pollutants in the system. Figure 4 and Figure 5 show the relationship between the evolution of the concentration of pollutants at different points as a function of the absorption coefficients (Kd) and the absorption intensity (n) by successively using the equation model of fractional advection-dispersion (FADE) and the classical advection-dispersion equation (ADE) model. The highest values ​​of pollutant concentrations are obtained near the source (x = L / 4) while the low values ​​were found near the outlet of the system (x = 0.9 L). These results show that the dispersion of pollutants increases with the transport distance. The results also suggest that absorption coefficients (Kd) have a strong effect on pollutant dispersion rather than absorption intensity (n). We observe in Figure 5 a better retention of the concentration of pollutants due to the different degrees of heterogeneity generated by the model (FADE) to explain the process of solute transport in natural porous media. Figure 4 and Figure 5 give us information on the zones that were exploited by [2] from the entrance to the exit of the aquifer because in their work they took the value Kd=0.345 L/g and n=0.32. [1] meanwhile, he rather set the value Kd=0.75 L/g and n=0.7 which remains localized according to our study in the areas of average concentrations. In the light of Figure 4 and Figure 5, it emerges that the data of the absorption coefficients Kd and the intensity of absorption n exploited by their work are well located in a precise zone in the aquifer according to the selected points. For proper environmental modeling of solute transport in porous media, experimental studies should be performed. By specifying which point of the aquifer is exploited in relation to the source of the pollutant, to find the values ​​of absorption Kd and the intensity of absorption n, rather than fixing them as is done in the Natarajan literature [1]. It is also possible to find the range of these parameters that could improve system performance.
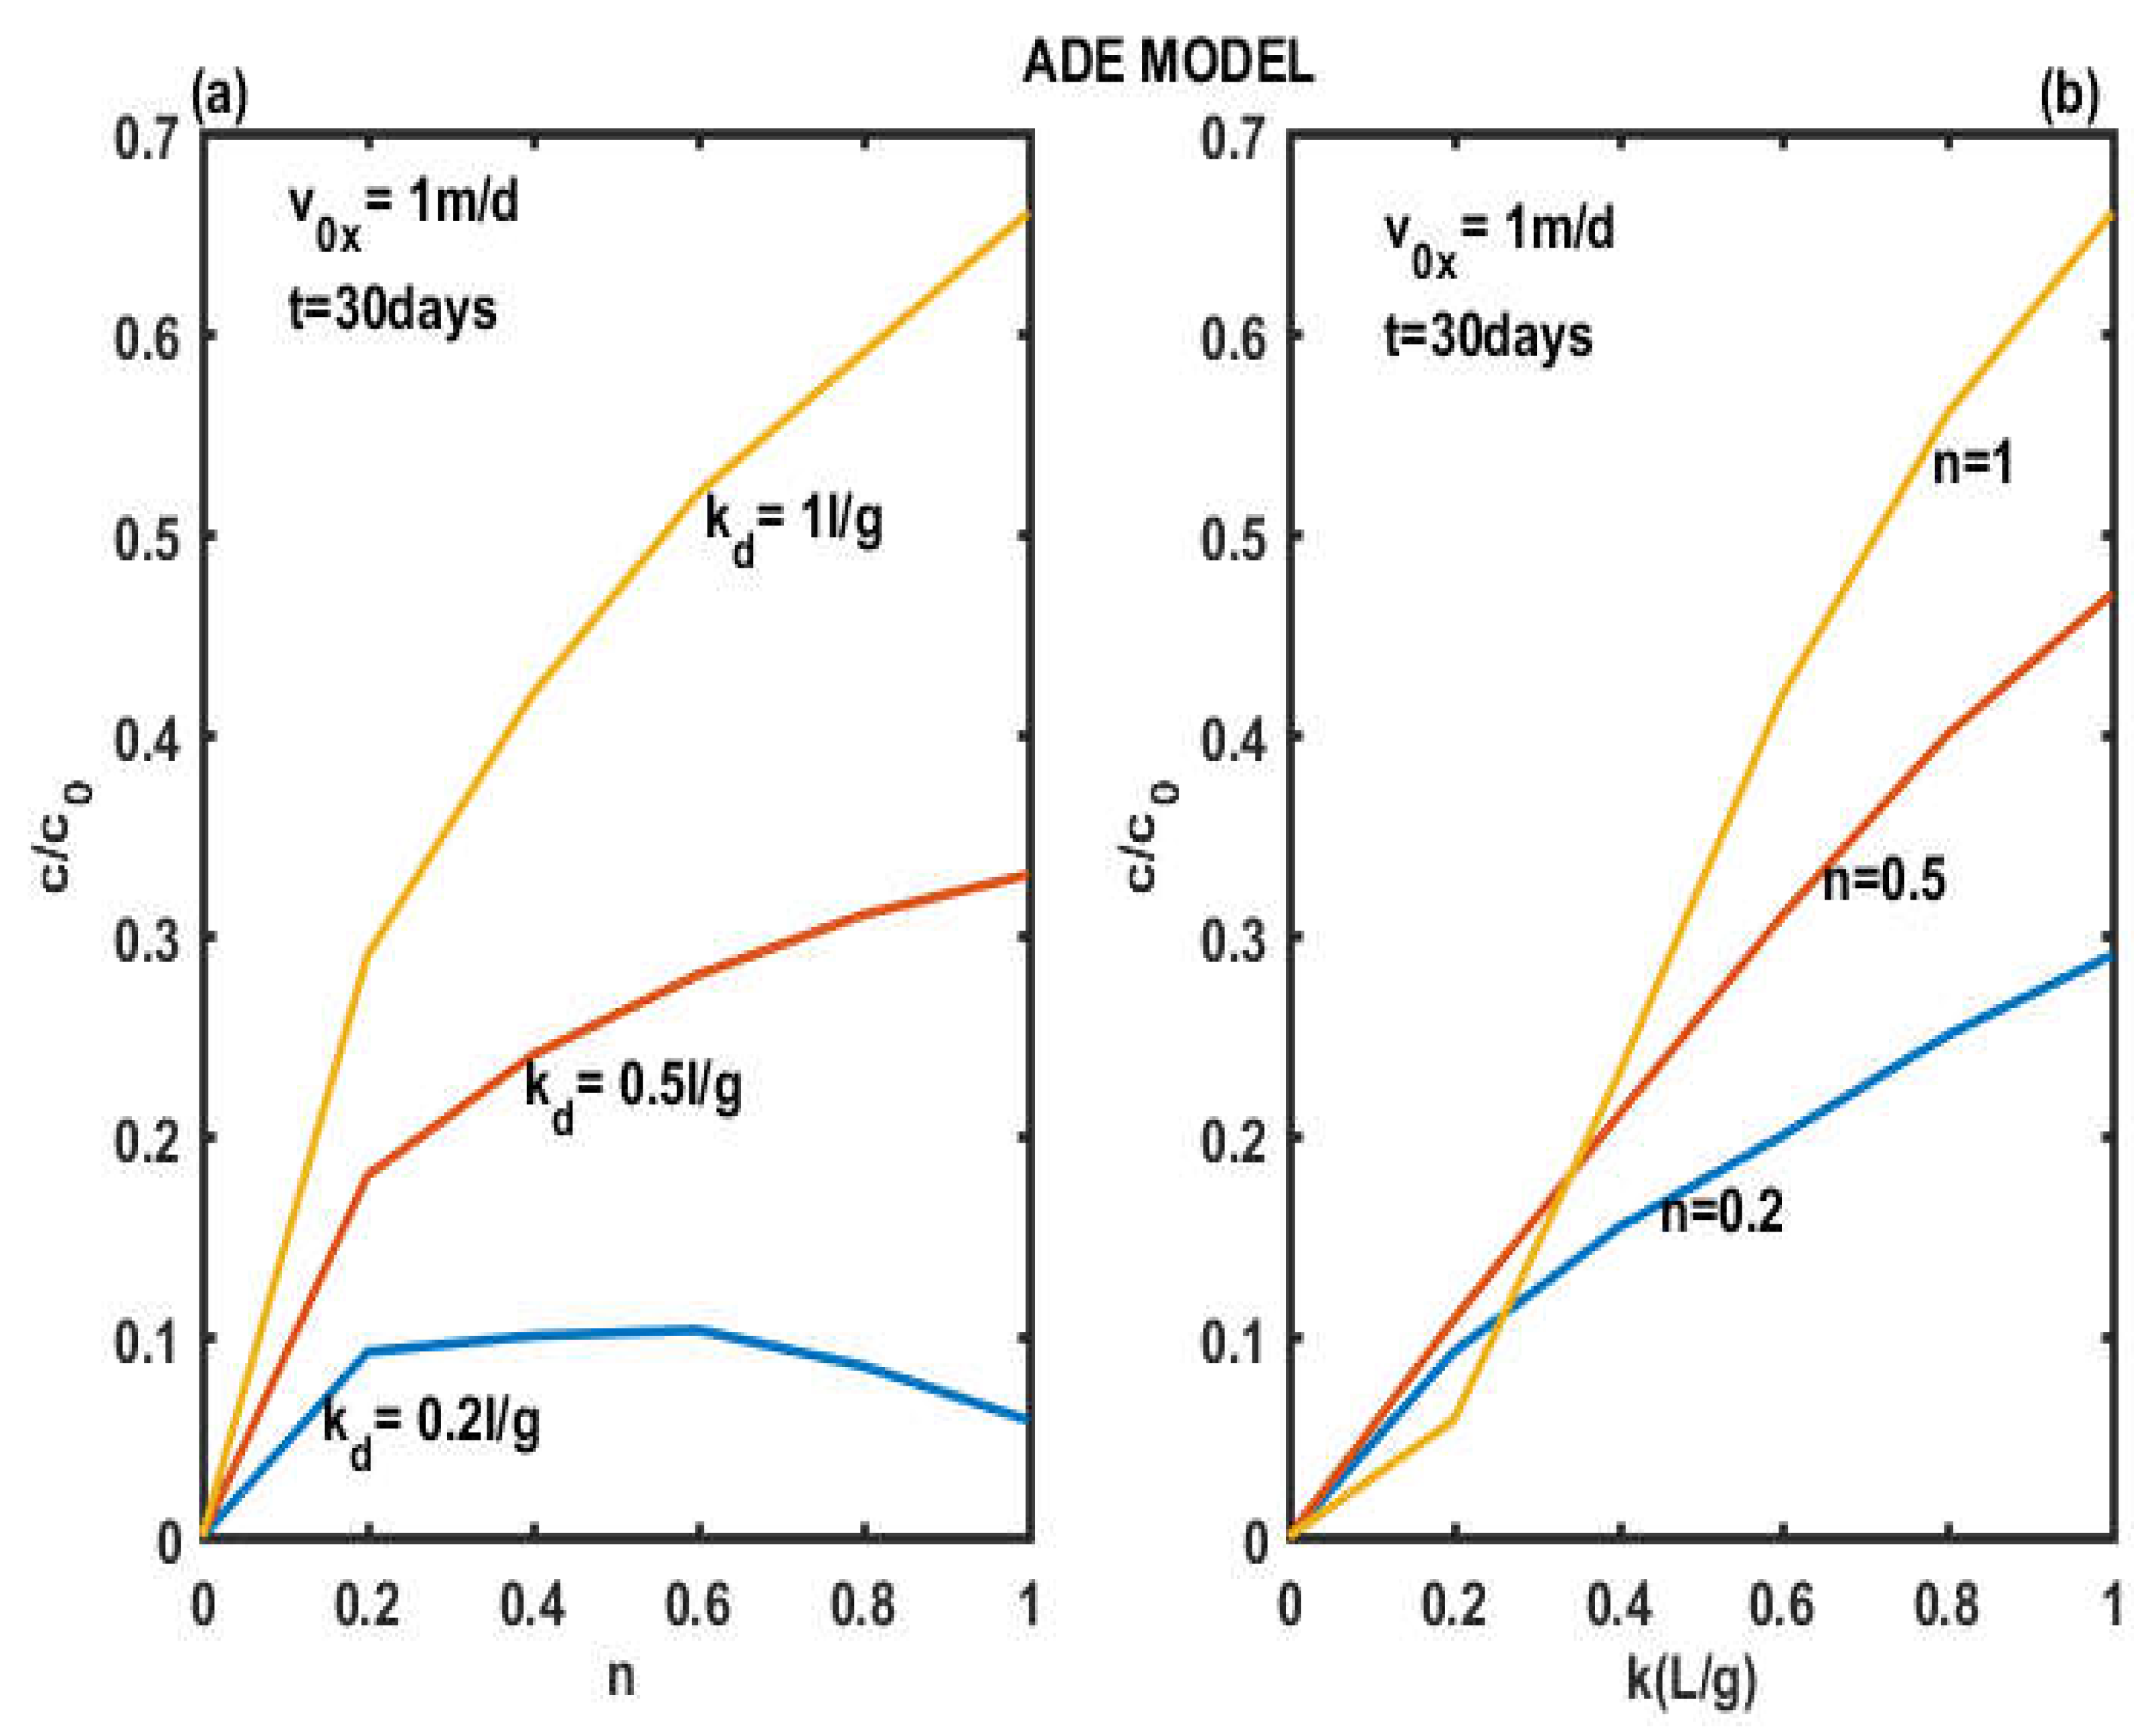
Figure 6 and Figure 7 show the evolution of pollutant concentrations as a function of different absorption constants (Kd) and absorption intensity (n) near the aquifer outlet (0.9L) for the two models s-FADE and ADE. These two figures allow us to find the range of these parameters Kd and n which can improve the performance of the system. It has been noted in Figure 6 that, for Kd equal to 0.2 L/g and all the values of n ∈R + in the aquifer, the lowest concentration values are observed with a range between 0 and 3% of the initial concentration, it has also been noted in Figure6 that, for Kd equal to 1 L/g and all the values of n ∈R +, the highest concentration values are observed with a range between 0 and 0.68 of the initial concentration. When analyzing the absorption constants (Kd) and the absorption intensity (n) for the model concentration profiles FADE, it appears that the appropriate values of Kd are less than or equal to 0.2L/ g for all values of n ∈R+. The high concentration values are obtained for Kd greater than or equal to 1L/g. Figure 6 shows that, for (Kd) equal to 1 L/g, the same trend is observed as in Figure 6 for the FADE model. However, for Kd equal to 0.2 L/g and all the values of n ∈R + in figure 7 for the ADE model, the lowest concentration values are observed with a range between 0 and 10% Co rather than 0 and 3% Co as observed in Figure 6. These values of Kd found are used at different points of the aquifer in this work to analyze the effect of the nonlinear absorption coefficient on the transport of contaminants in porous media.
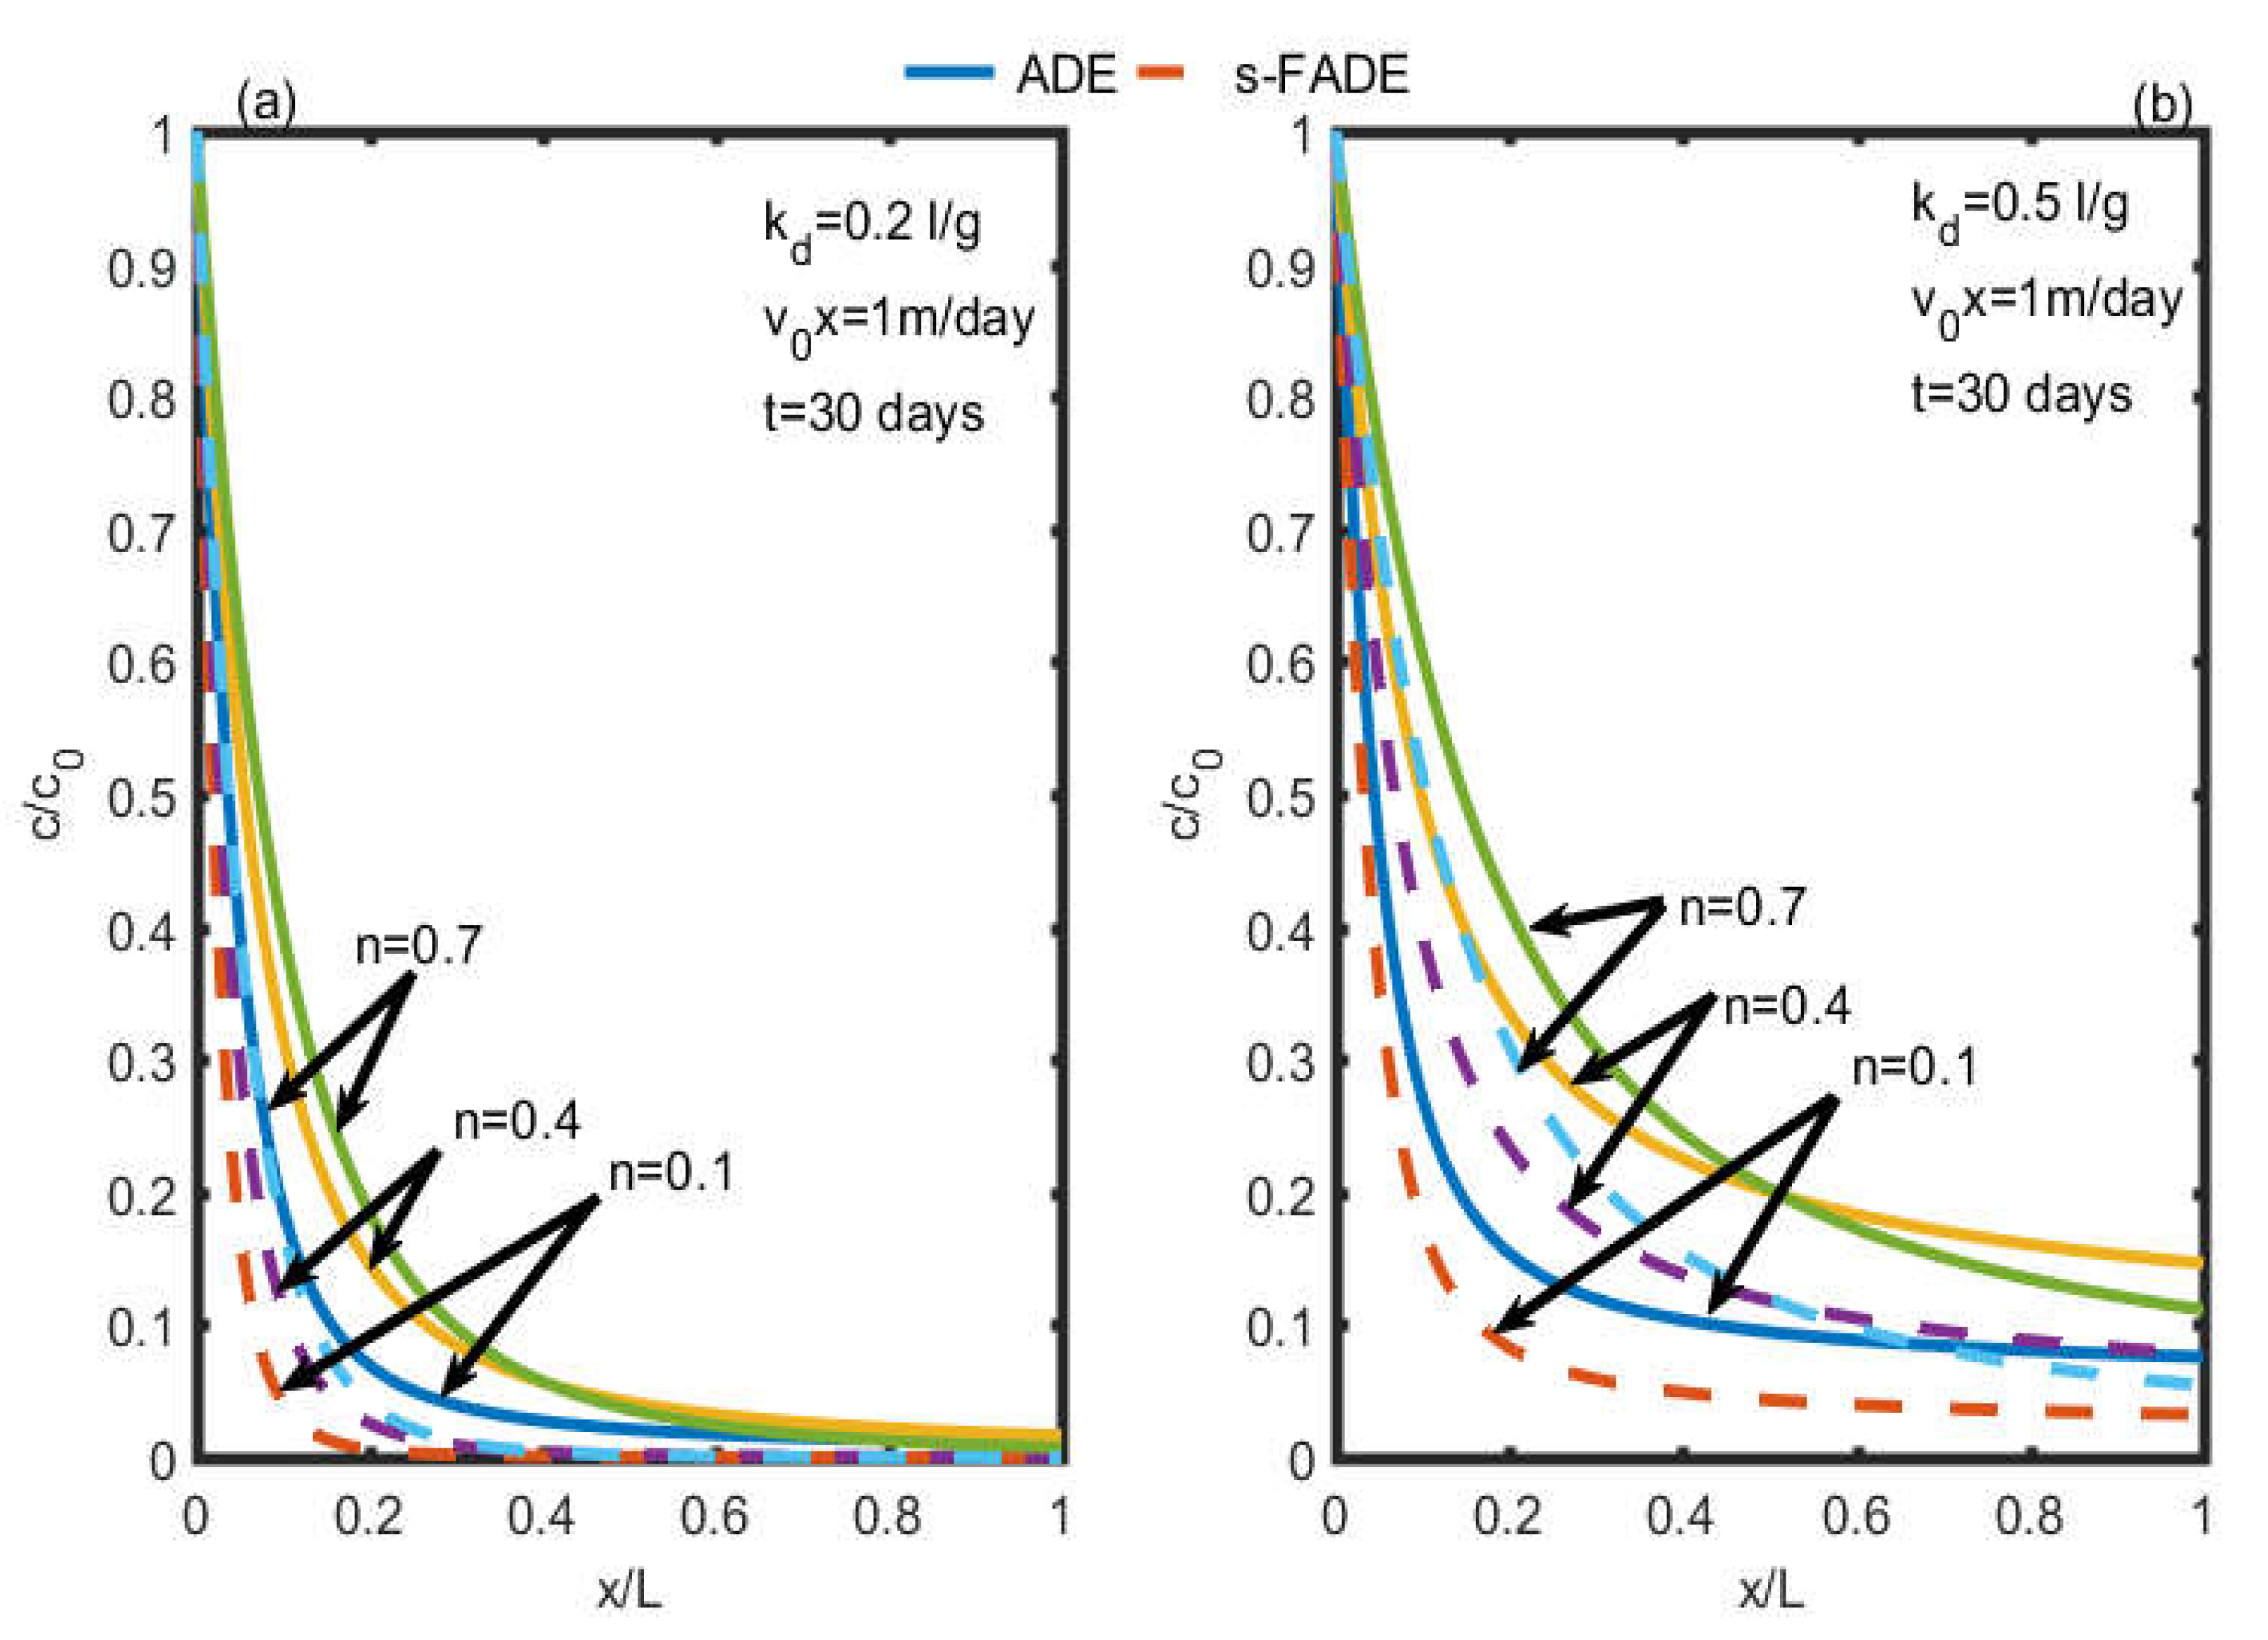
Figure 8a,b successively illustrate the spatial distribution of the concentration of pollutants with selected constants of the absorption coefficient Kd = 0.2 L/g and Kd=0.5L/g. The concentration profiles according to space decrease exponentially in the aquifer for the values ​​of n (0.1, 0.4, 0.7) for the two models s-FAED and AED whatever the value of kd. This profile decreases rapidly for the model FAED, reflecting greater retention of the mass of solute in the medium. These results are similar and more complex to those obtained by [14] because they did not take into account the influence of absorption coefficients (Kd) and absorption intensity (n) in their work. These authors have even an experimental study associated with the model s-FADE to model the conservative solutes, in the end, their results indicate that the best simulation was obtained from the s-FADE model compared to the ADE model. The different concentrations all decrease together from the inlet of the aquifer independently of the model, to reach zero horizontal asymptotes for low absorption coefficients (Kd) figure 8a. And horizontal asymptotes at the different positions X = 0.29, 0.6, 0.8 respectively for three values ​​of n (0.2, 0.5, 0.7) for the s-FADE model when kd=0.5l/g figure 8a. The residual concentration percentage associated with these positions is X = 0.05; 0.08; 0.1. On the other hand, the different horizontal asymptotes are obtained rather at the different positions X = 0.5, 0.65, 0.9 for the ADE model respectively for the same values ​​of n (0.2, 0.5, 0.7). The associated residual concentration percentage is 0.1; 0.14; 0.16. These positions increase with the increase of n. The residual solute concentration percentage remains low for the s-FADE model. These results confirm that the increase in n assigned to the s-FADE models significantly reduces the mass of solute in the underground medium compared to the ADE models. This is hard to the different degrees of heterogeneity engendered by the model FADE to explain the process of solute transport in natural porous media [19].

3.2. Effect of Temporal Fractional Order on the Concentration of Pollutants in a Porous Medium

In this section, the discrete numerical solution of the equation (14) associated with the initial conditions and the discrete limits of the equations (15) and (16) is simulated to obtain the results.
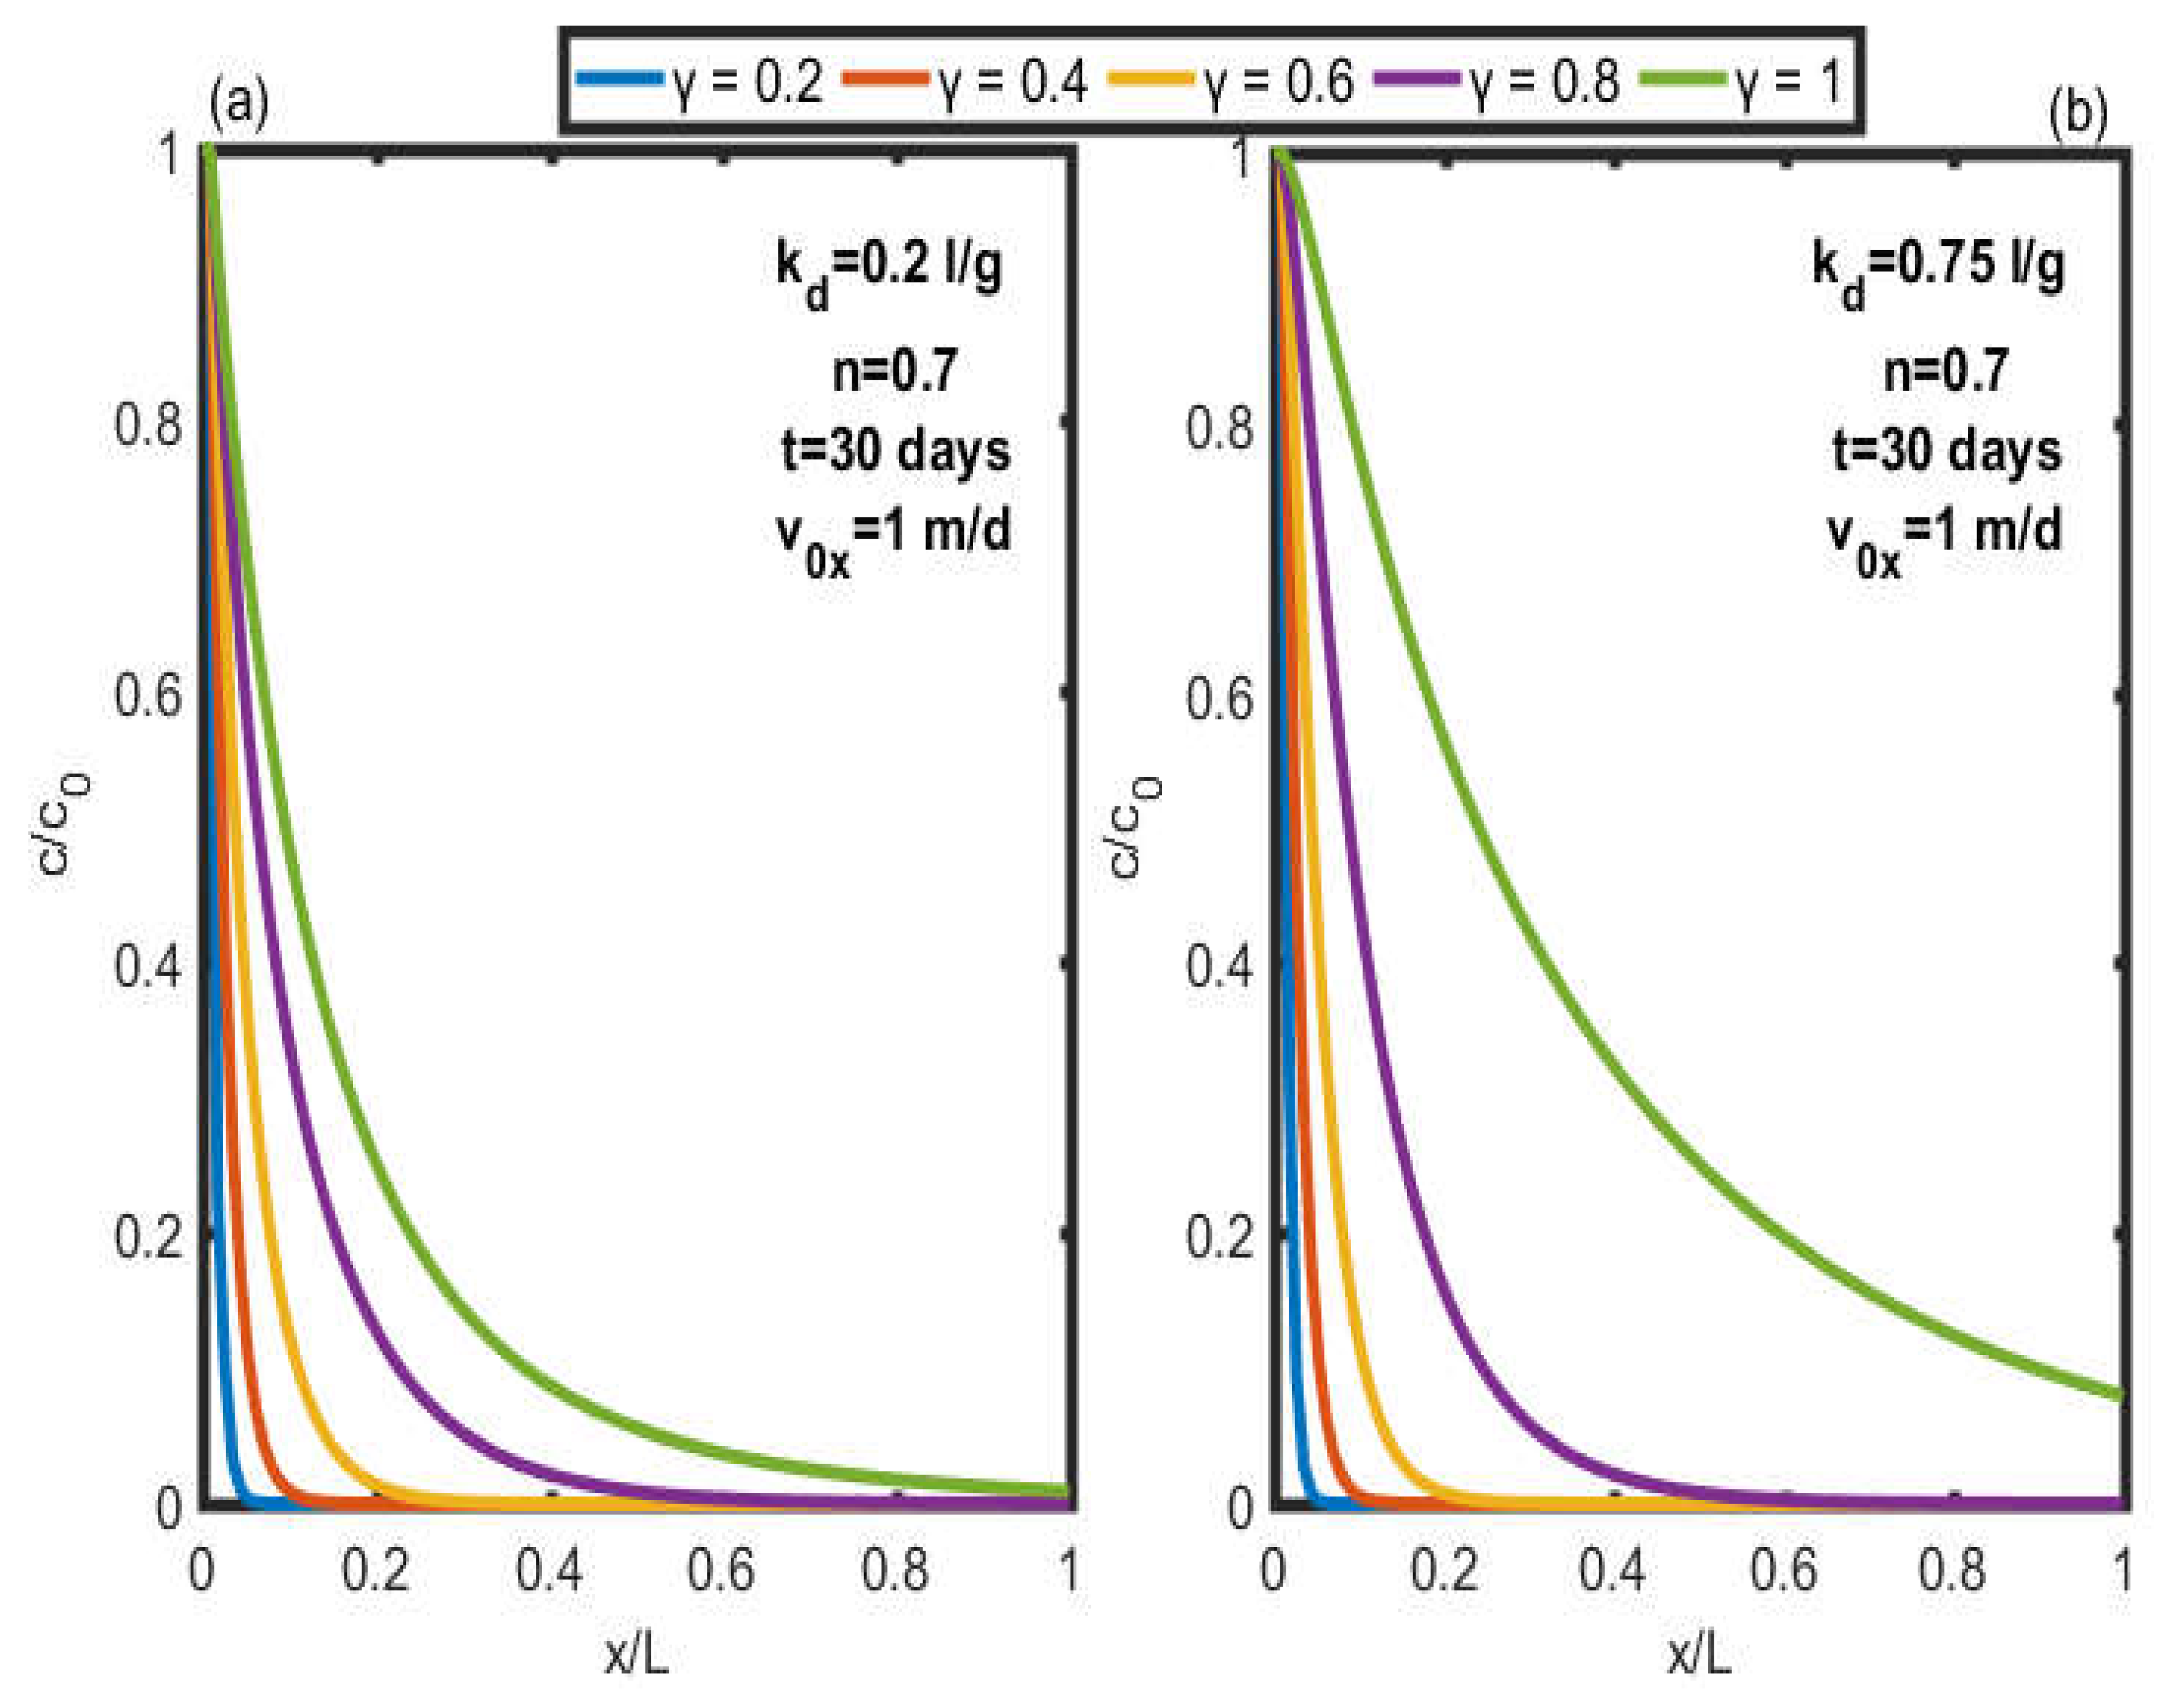
Figure 9 shows the influence of temporal fractional order (γ) on the distribution of solute concentrations in a subterranean medium. The values ​​of the temporal fractional order are chosen in the order γ (γ = 0.2, 0.4, 0.6, 0.8, 1). Figure 9 further shows the impact of the absorption coefficient Kd (Kd = 0.2 and 0.75 l/g) on ​​the dispersion of pollutants in the environment. We note that there is low retention of the mass of solute when the value of the time-fractional order (γ) increases in the porous medium and approaches the source of the pollutants when the value of the coefficient of Kd absorption is low in the same medium, which contradicts the work of [26,27]. These authors have developed through the method of boundary elements the solution of the two-dimensional anomalous diffusion equation, and show the ability and necessity of small-time steps to capture the large temporal gradients that arise in the solution of problems governed by ADEs containing the fractional derivative. In their work, they did not allude to the parameter of the absorption coefficient Kd which plays the role of possibly causing a solute delay with respect to the mobile fluid in the underground medium. By analyzing these results, it appears that the retention of the mass of solute increases with absorption coefficient Kd. The advection dispersion model becomes classic when γ=1.

3.3. Validation Model

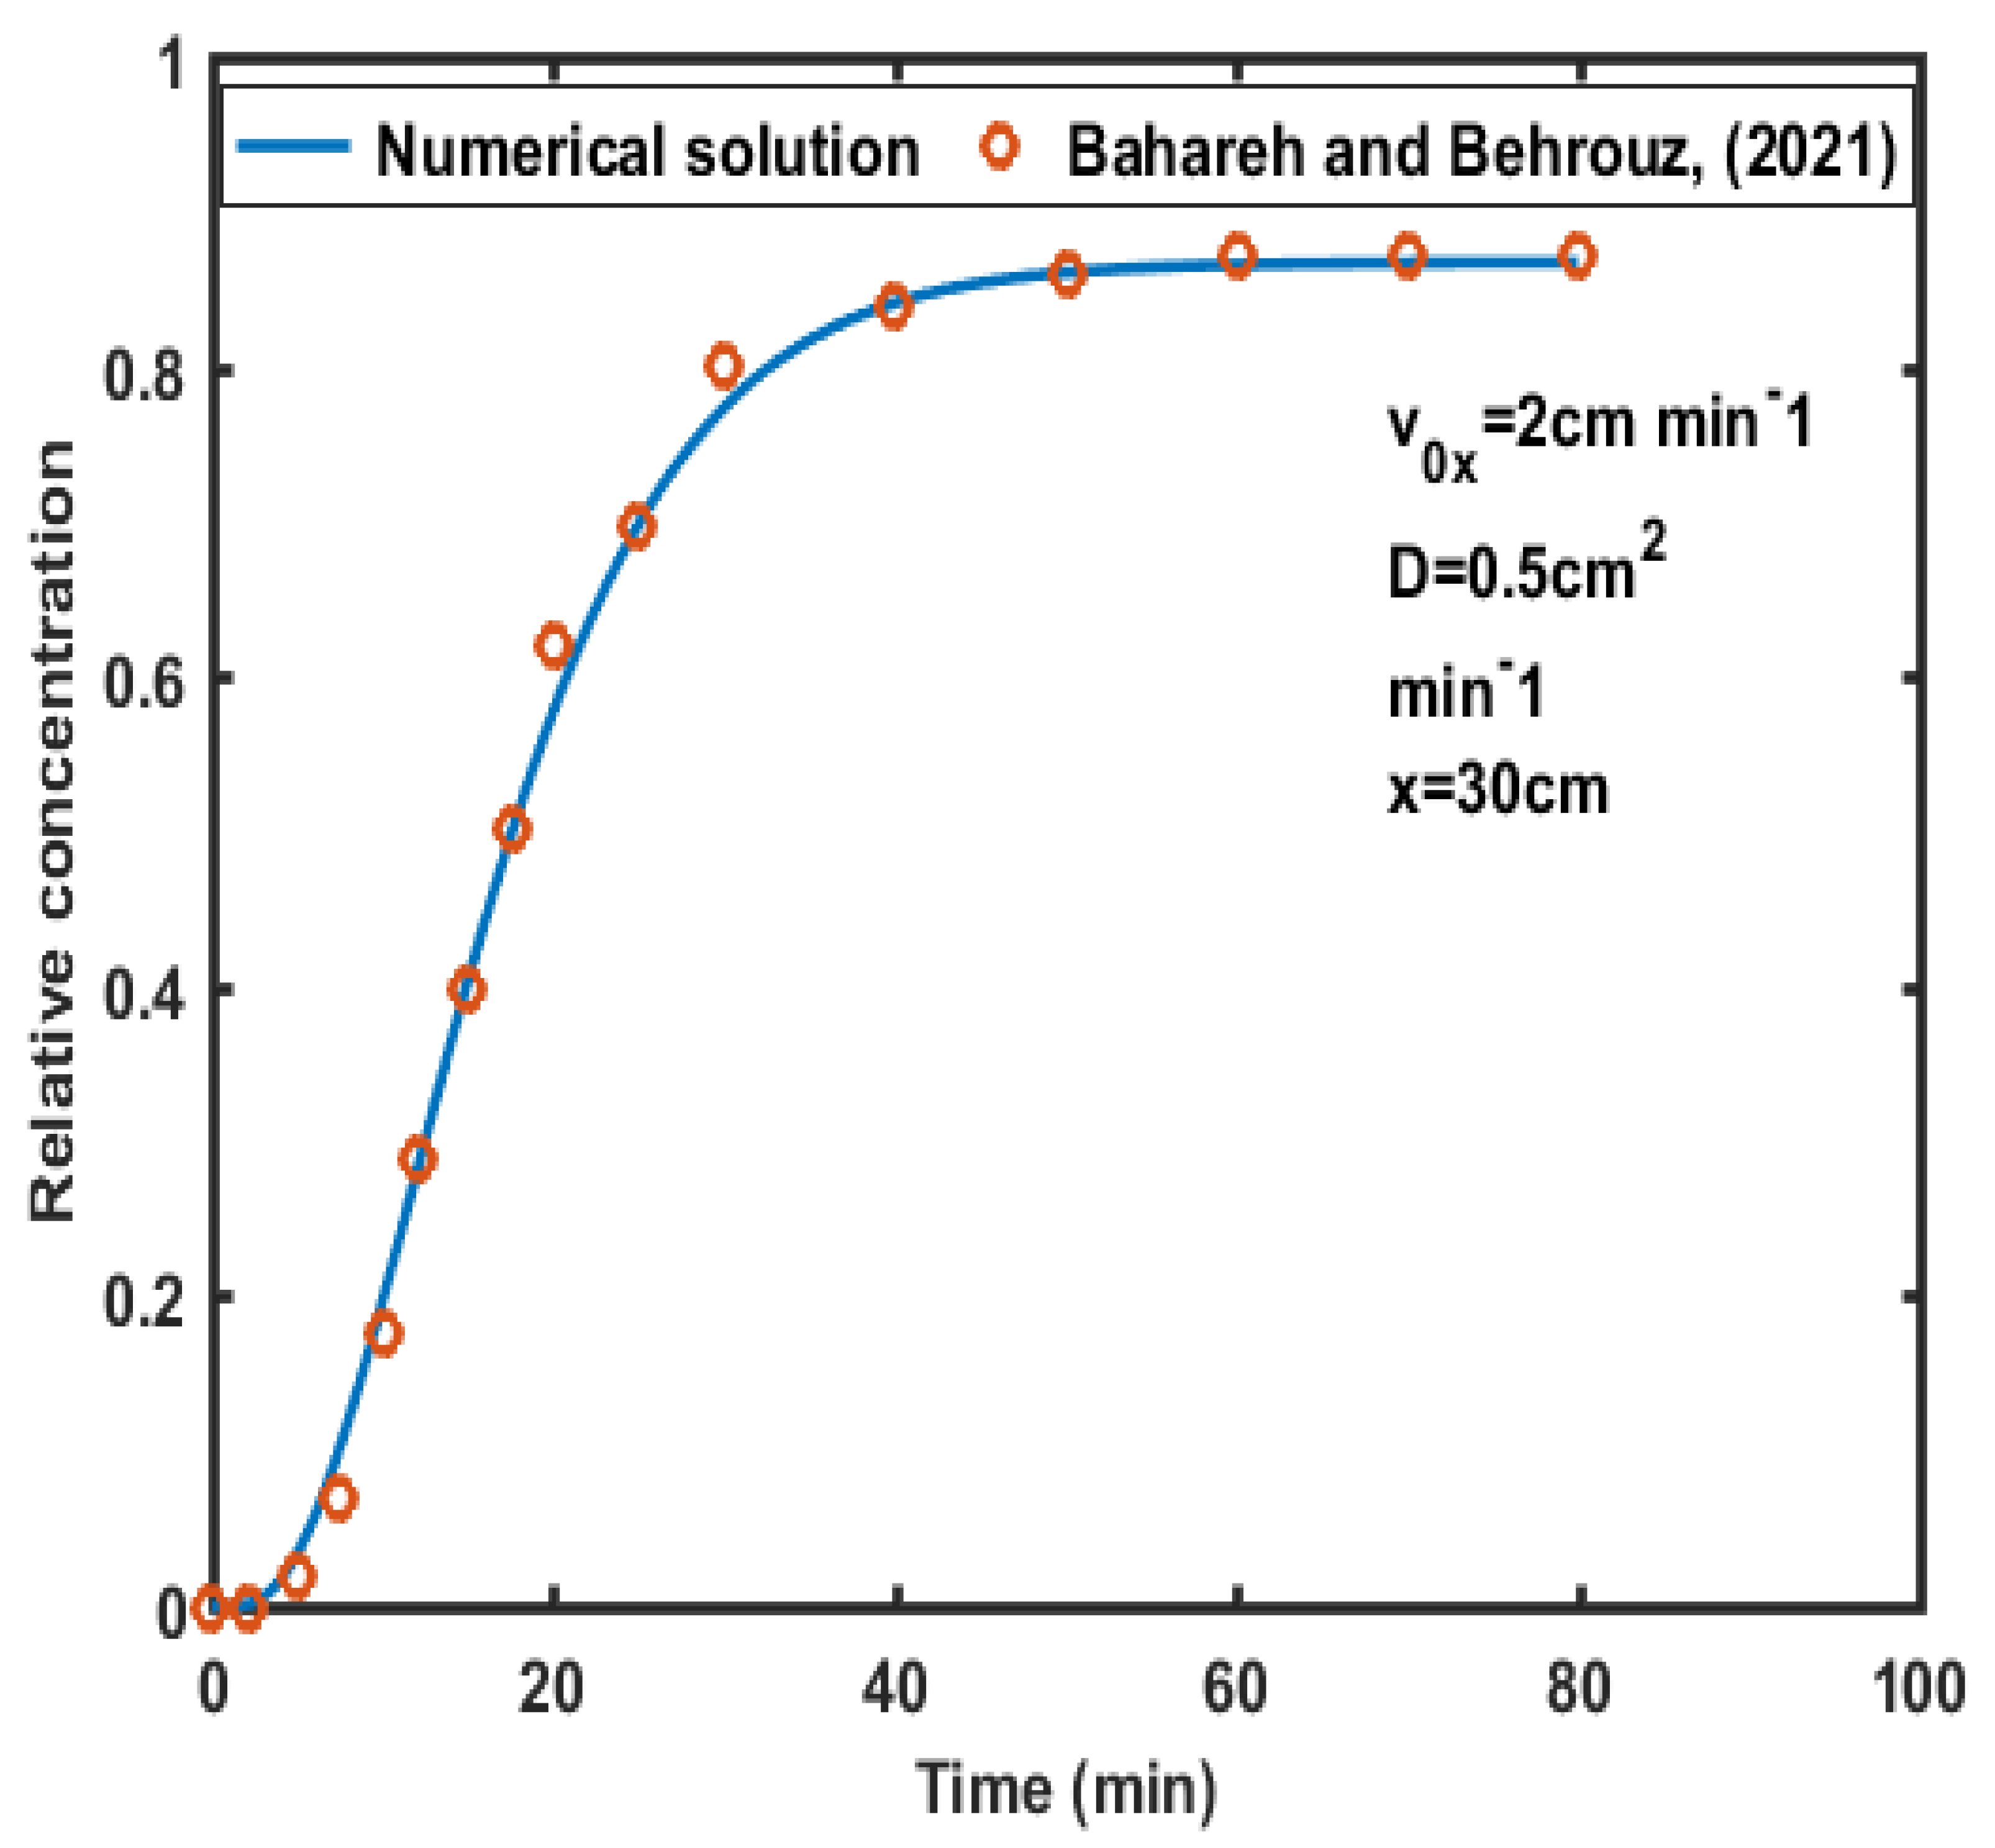
An Experimental solution on the contaminant transport equation in an underground environment with a constant source of contaminant provided by [18] is used as shown in the Figure 10 below. It is observed from Figure 10 that there is a good agreement between the numerical solution and the experimental solution from the model presented. The latter highlights the use of our model to describe and understand the level of contaminants in porous media.

4. Conclusion

In this study, the effect of the nonlinear absorption-dependent delay factor on solute transport in porous media was analyzed using two dispersion models ADE and FADE. The explicit Euler method associated with the Grunwald and Caputo-Liousville approximation on fractional derivatives was used to model the solute transport. When analyzing the results obtained, the following conclusions were drawn from this study:
  • The amplitude of the initial concentration of pollutants is influenced by the different points taken in the aquifer for two dispersion models ADE and FADE used in the aquifer, and thus, the present models project that the resulting mobility of the contaminant from the groundwater is very sensitive to the boundary of the aquifer with which it is associated.
  • A better solute mass retention is observed when the model is FADE due to the different degrees of heterogeneity generated by this model to explain the process of solute transport in natural porous media
  • The sorption partition coefficient (Kd) plays a very significant role in the dispersion of contaminants in underground environments, regardless of the model used.
  • The behavior of the concentration profiles remains the same for the different magnitudes of the absorption intensity (n) in the whole aquifer for the two dispersion models.

Acknowledgments

The authors would like to thank Professor WOAFO PAUL of the University of Yaoundé 1, for his careful reading of the article and his constructive suggestions, which helped to improve this work.

References

  1. [1] Natarajan N, Foresti O, Wendrich K, Stein A & Carvalho P. Quality control of protein complex assembly by a transmembrane recognition factor. Molecular cell 2020, 77(1), 108–119.
  2. Williams L E, Barnett M O, Kramer T A , Melville J G. Adsorption and Transport of Arsenic (V) in Experimental Subsurface Systems. Journal of Environment Quality 2003, 32, 841–850. [CrossRef] [PubMed]
  3. [3] Zhang Y, Meerschaert M M, Neupauer RM. Backward fractional advection dispersion model for contaminant source prediction. Water Resour Res 2016, 52, 2462–2473. [CrossRef]
  4. [4] Khafagy M M, Abd-Elmegeed MA, Hassan AE. Simulation of reactive transport in fractured geologic media using random-walk particle tracking method. Arab J Geosci 2020, 13.
  5. [5] Mouassom L F, Nkomom T N, Mvogo A and Mbane C B. Effects of viscosity and surface tension on soliton dynamics in the generalized KdV equation for shallow water waves. Communications in Nonlinear Science and Numerical Simulation 2021, 102, 105942. [CrossRef]
  6. [6] Pandey P, Kumar S & Gómez-Aguilar J F. Numerical solution of the time fractional reaction-advection-diffusion equation in porous media. Journal of Applied and Computational Mechanics 2022, 8(1), 84–96.
  7. [7] Maisuria, M. A., Tandel, P. V., & Patel, T. Solution of Two-Dimensional Solute Transport Model for Heterogeneous Porous Medium Using Fractional Reduced Differential Transform Method. Axioms 2023, 12(11), 1039.
  8. [8] Aghdam Y E, Mesgarani, H, Moremedi, G M and Khoshkhahtinat M. High- accuracy numerical scheme for solving the space-time fractional advection-diffusion equation with convergence analysis. Alexandria Engineering Journal 2021, 61(1), 217–225.
  9. 9. [9] Sekhar M, Suresh Kumar G, Mishra D 2006 Numerical modeling and analysis of solute velocity and macrodispersion for linearly and nonlinearly sorbing solutes in a single fracture with matrix difusion. J Hydrol Eng.
  10. 10. [10] Das P, Begam S, Singh M K. Mathematical modeling of groundwater contamination with varying velocity field. Journal of Hydrology and Hydromechanics 2017, 65(2), 192–204. [CrossRef]
  11. [11] Meerschaert M M and Tadjeran C. Finite difference approximations for fractional advection–dispersion flow equations. Journal of computational and applied mathematics 2004, 172(1), 65–77. [CrossRef]
  12. [12] Deng, Z Q, Singh, V P, and Bengtsson L. “Numerical solution of fractional advection-dispersion equation.”. 2004, 130(5), 422–431.
  13. [13] Benson D A, Schumer R, Meerschaert MM. Fractional dispersion, Lévy motion, and the tracer tests. Transp Porous Med 2001, 42, 211–240. [CrossRef]
  14. [14] Sharma, P K, P Agarwal and B Mehdinejadiani. Study on non-Fickian behavior for solute transport through porous media. ISH Journal of Hydraulic Engineering 2020, 28 (sup1), 171–179.
  15. 15. [15] Benson D A, Wheatcraft S W, Meerschaert M M. The fractionalorder governing equation of Lévy motion. Water Resour Res 2000, 36(6), 1413–1423.
  16. [16] Ndolane Sene (2021), Fractional advection-dispersion equation described by the Caputo left generalized fractional derivative. Palestine Journal of Mathematics. Vol. 10(2), 562 579.
  17. [17] Amy A and Abdon A 2021 Fractional and fractal advection-dispersion model. Discrete & Continuous Dynamical Systems-Series S, 14(7).
  18. [18] Bahareh M and Behrouz M 2021 Numerical simulation of solute transport in saturated porous media with bounded domains. Groundwater, 59(6), 892-904.
  19. [19] Ghazal M & Behrouz M (2020) An experimental study on scale dependency of fractional dispersion coefficient. Arabian Journal of Geosciences ,13: 409.
  20. [20] Madie Y C, Togue K F, and Woafo P 2022a Analysis of the importance of the dispersion coefficient depending on the distance for the transport of solute in porous media . Sådhanå, 47(2),1-9.
  21. [21] Madie Y C, Togue K F, and Woafo P 2022b " Numerical solution of the Burgers equation associated with the phenomena of longitudinal dispersion depending on time ". Heliyon, e09776.
  22. [22] Madie Y C, Togue K F, and Woafo P 2022c Dispersion of pollutants in a porous medium with finite thickness and variable dispersion coefficients. Heliyon, e10083.
  23. [23] Radha R & Singh M K. Axial groundwater contaminant dispersion modeling for a finite heterogeneous porous medium. Water 2023, 15(14), 2676.
  24. [24] Gillham R W, and Stephanie F O 1994 Enhanced degradation of halogenated aliphatics by zero-valent iron. groundwater ,32(6),958-967.
  25. [25] Abulaban A, Nieber J L and Misra, D 1998 “Modeling plume behavior for nonlinearly sorbing solutes in saturated homogeneous porous media.” Adv. Water Resour., 21, 487–498.
  26. [26] F Liu, P Zhuang, K Burrage 2012 Numerical methods and analysis for a class of fractional advection–dispersion models. Computers and Mathematics with Applications 64 2990-3007.
  27. [27] Carrer J A M, Seaid M, Trevelyan J and Dos S S B 2019 The boundary element method applied to the solution of the anomalous diffusion problem. Engineering Analysis with Boundary Elements, 109, pp.129-142.
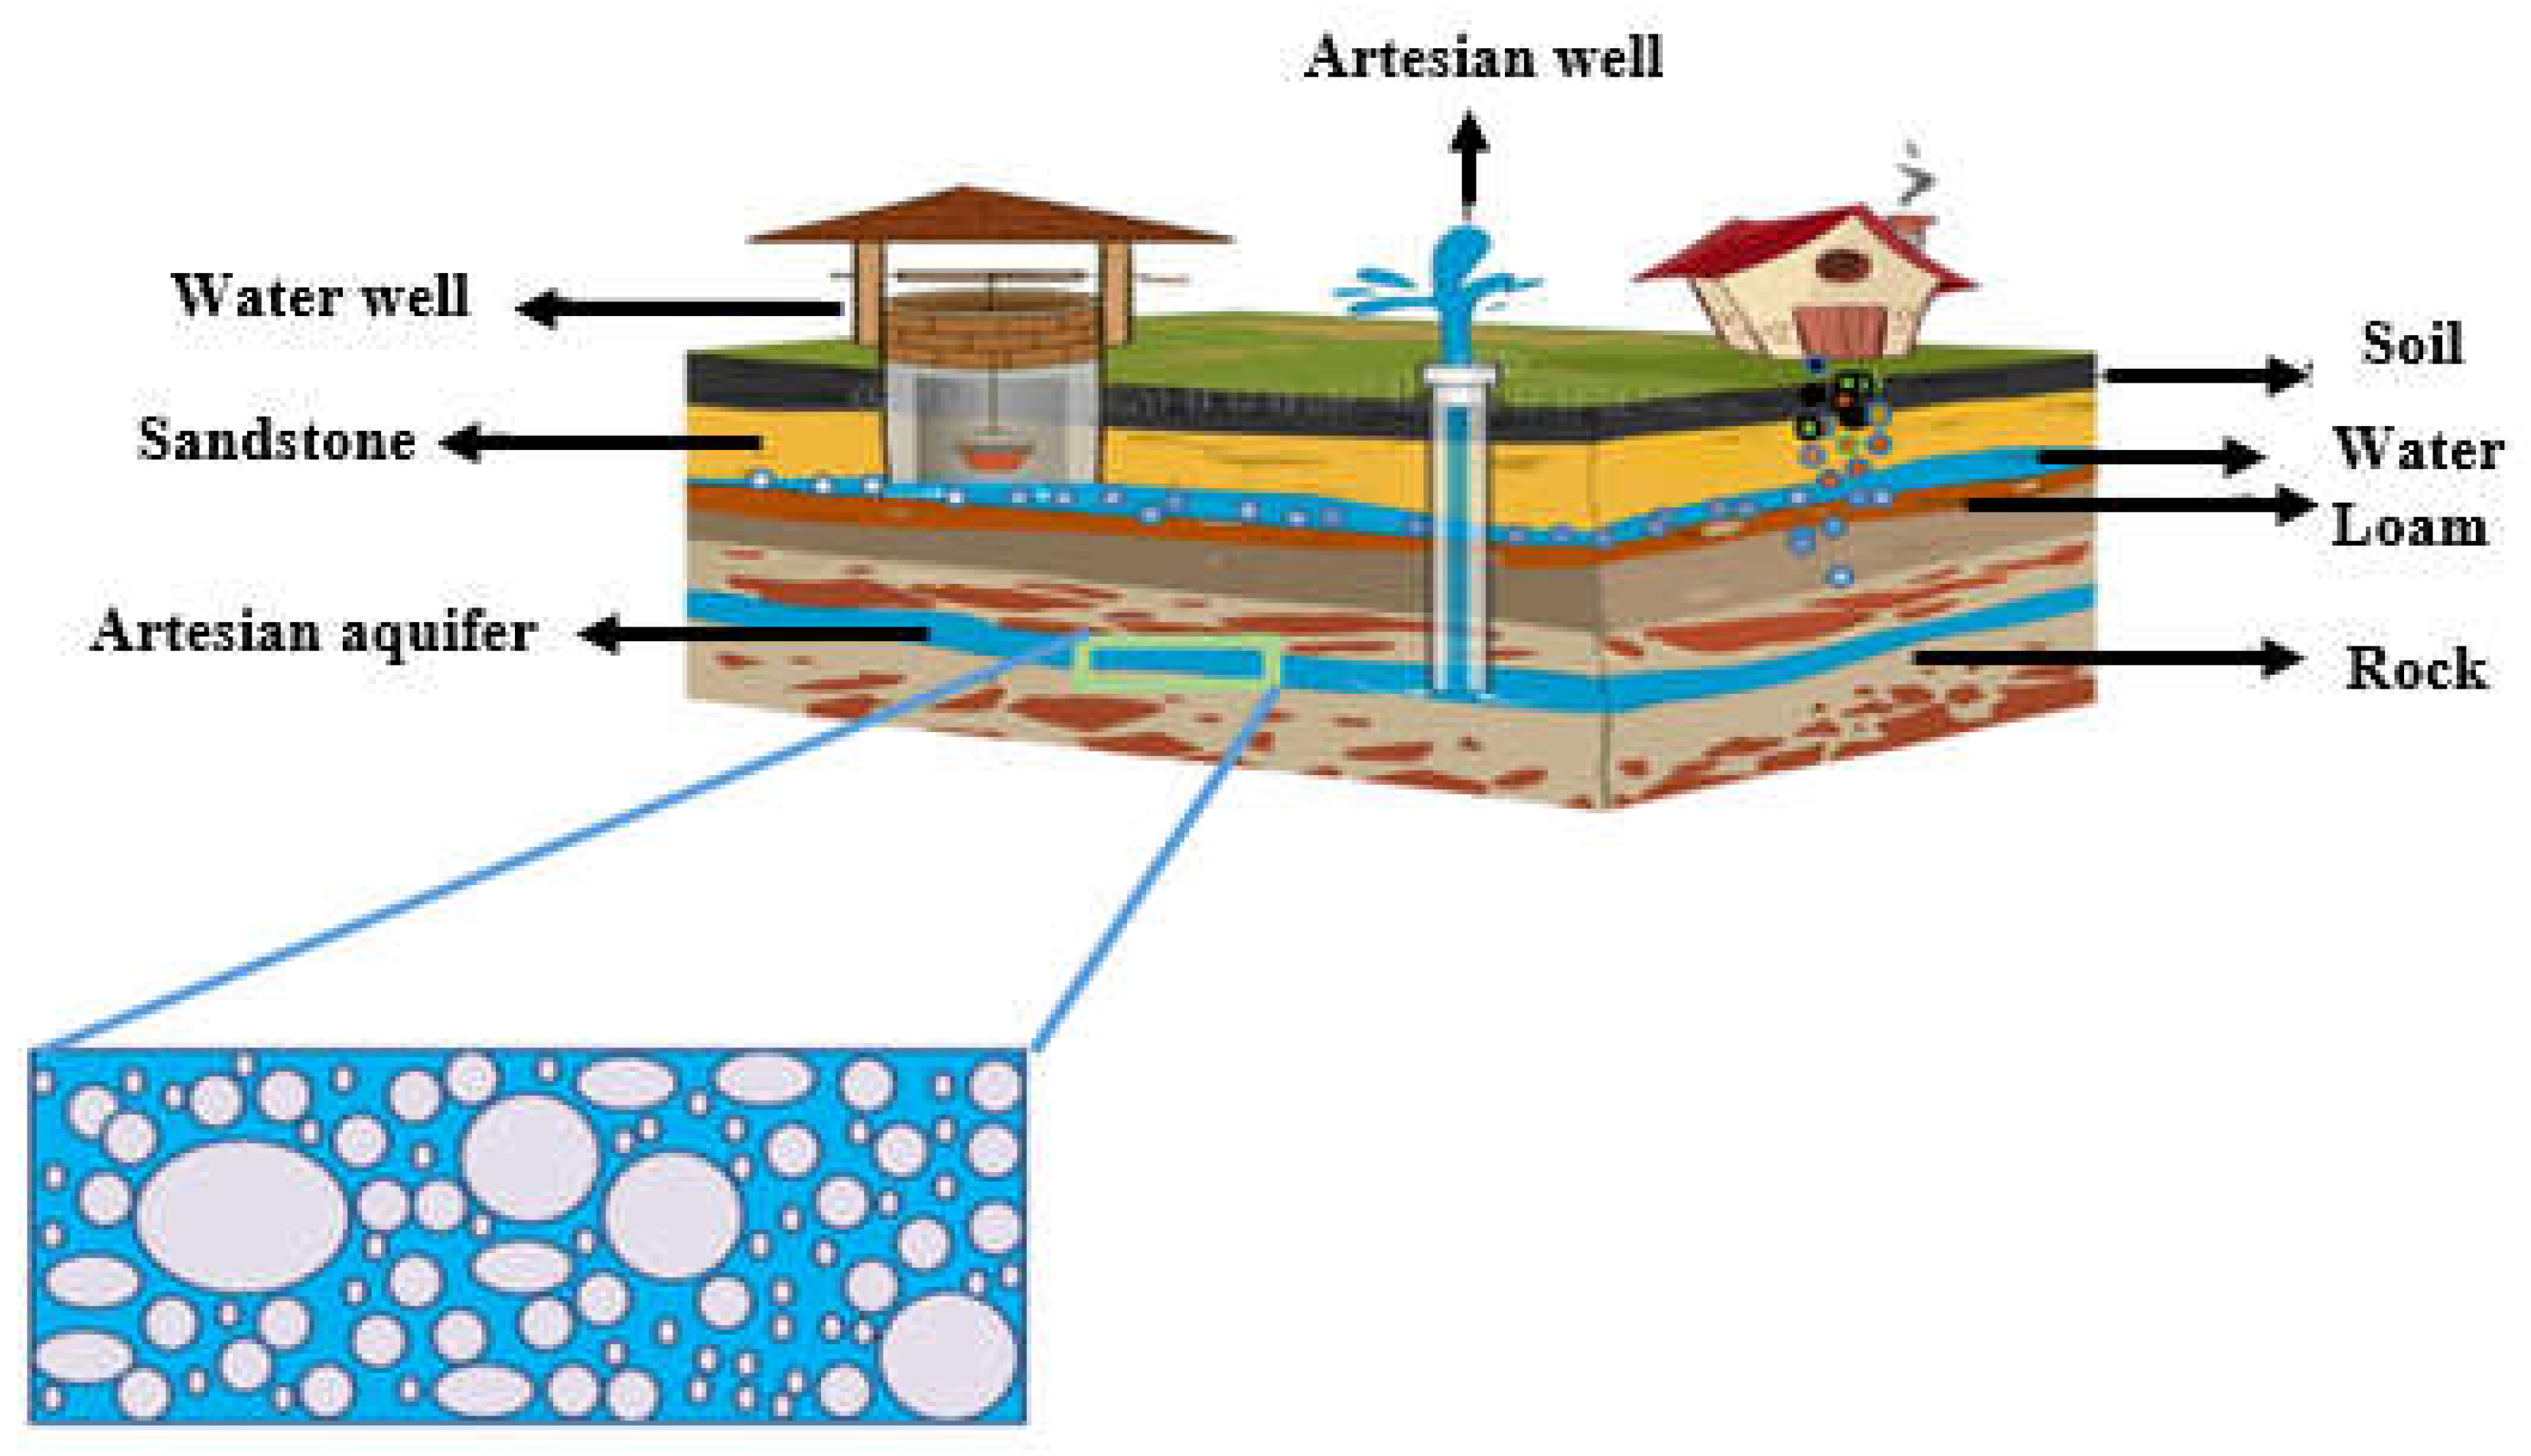
Figure 1. Representation of porous media with each bubble representing the pore spaces.
Preprints 105666 g001
Figure 3. The influence of the spatial-fractional order (α) on the spatial distribution of the concentration of pollutants in a porous medium is comparable to the result produced numerically by Natarajan et al, (2021) through a classic ADE model from which α =2.
Preprints 105666 g003
Figure 4. Variation of pollutant concentrations in the aquifer system as a function of Kd and n in the porous medium for considering a FADE model at t = 30 days and v 0 x = 1 m / day.
Preprints 105666 g004
Figure 5.  
Figure 5.  
Preprints 105666 g005
Figure 6. behavior of pollutants at the outlet of the aquifer (0.9L) considering the FADE model at t = 30 days and v 0 x = 1 m / day
Preprints 105666 g006
Figure 7. behavior of pollutants at the outlet of the aquifer (0.9L) for a classic advection dispersion equation model at t = 30 days and v 0 x = 1 m / day
Preprints 105666 g007
Figure 8. Comparison of the pollutant concentration profiles between the s-FADE and ADE model with the values of the n and selected parameters at the exit of the aquifer at t = 30 days and v 0 x = 1 m / day
Preprints 105666 g008
Figure 9. Influence of temporal fractional order on the spatial distribution of pollutant concentration in a porous medium.
Preprints 105666 g009
Figure 10. Validation of the numerical solution with experimental solution of the contaminant transport equation in an underground environment by Bahareh and Behrouz, (2021). Parameters used: dispersion coefficient = 0.5 c m 2 / m i n , fractional order=1.5, total duration of the simulation = 80 min ; and domain length = 30 cm, flow velocity= 2 c m / m i n
Preprints 105666 g010
Disclaimer/Publisher’s Note: The statements, opinions and data contained in all publications are solely those of the individual author(s) and contributor(s) and not of MDPI and/or the editor(s). MDPI and/or the editor(s) disclaim responsibility for any injury to people or property resulting from any ideas, methods, instructions or products referred to in the content.
Copyright: This open access article is published under a Creative Commons CC BY 4.0 license, which permit the free download, distribution, and reuse, provided that the author and preprint are cited in any reuse.
Prerpints.org logo

Preprints.org is a free preprint server supported by MDPI in Basel, Switzerland.

Subscribe

© 2024 MDPI (Basel, Switzerland) unless otherwise stated