Submitted:
06 May 2024
Posted:
07 May 2024
You are already at the latest version
Abstract
Keywords:
1. Introduction
2. Results
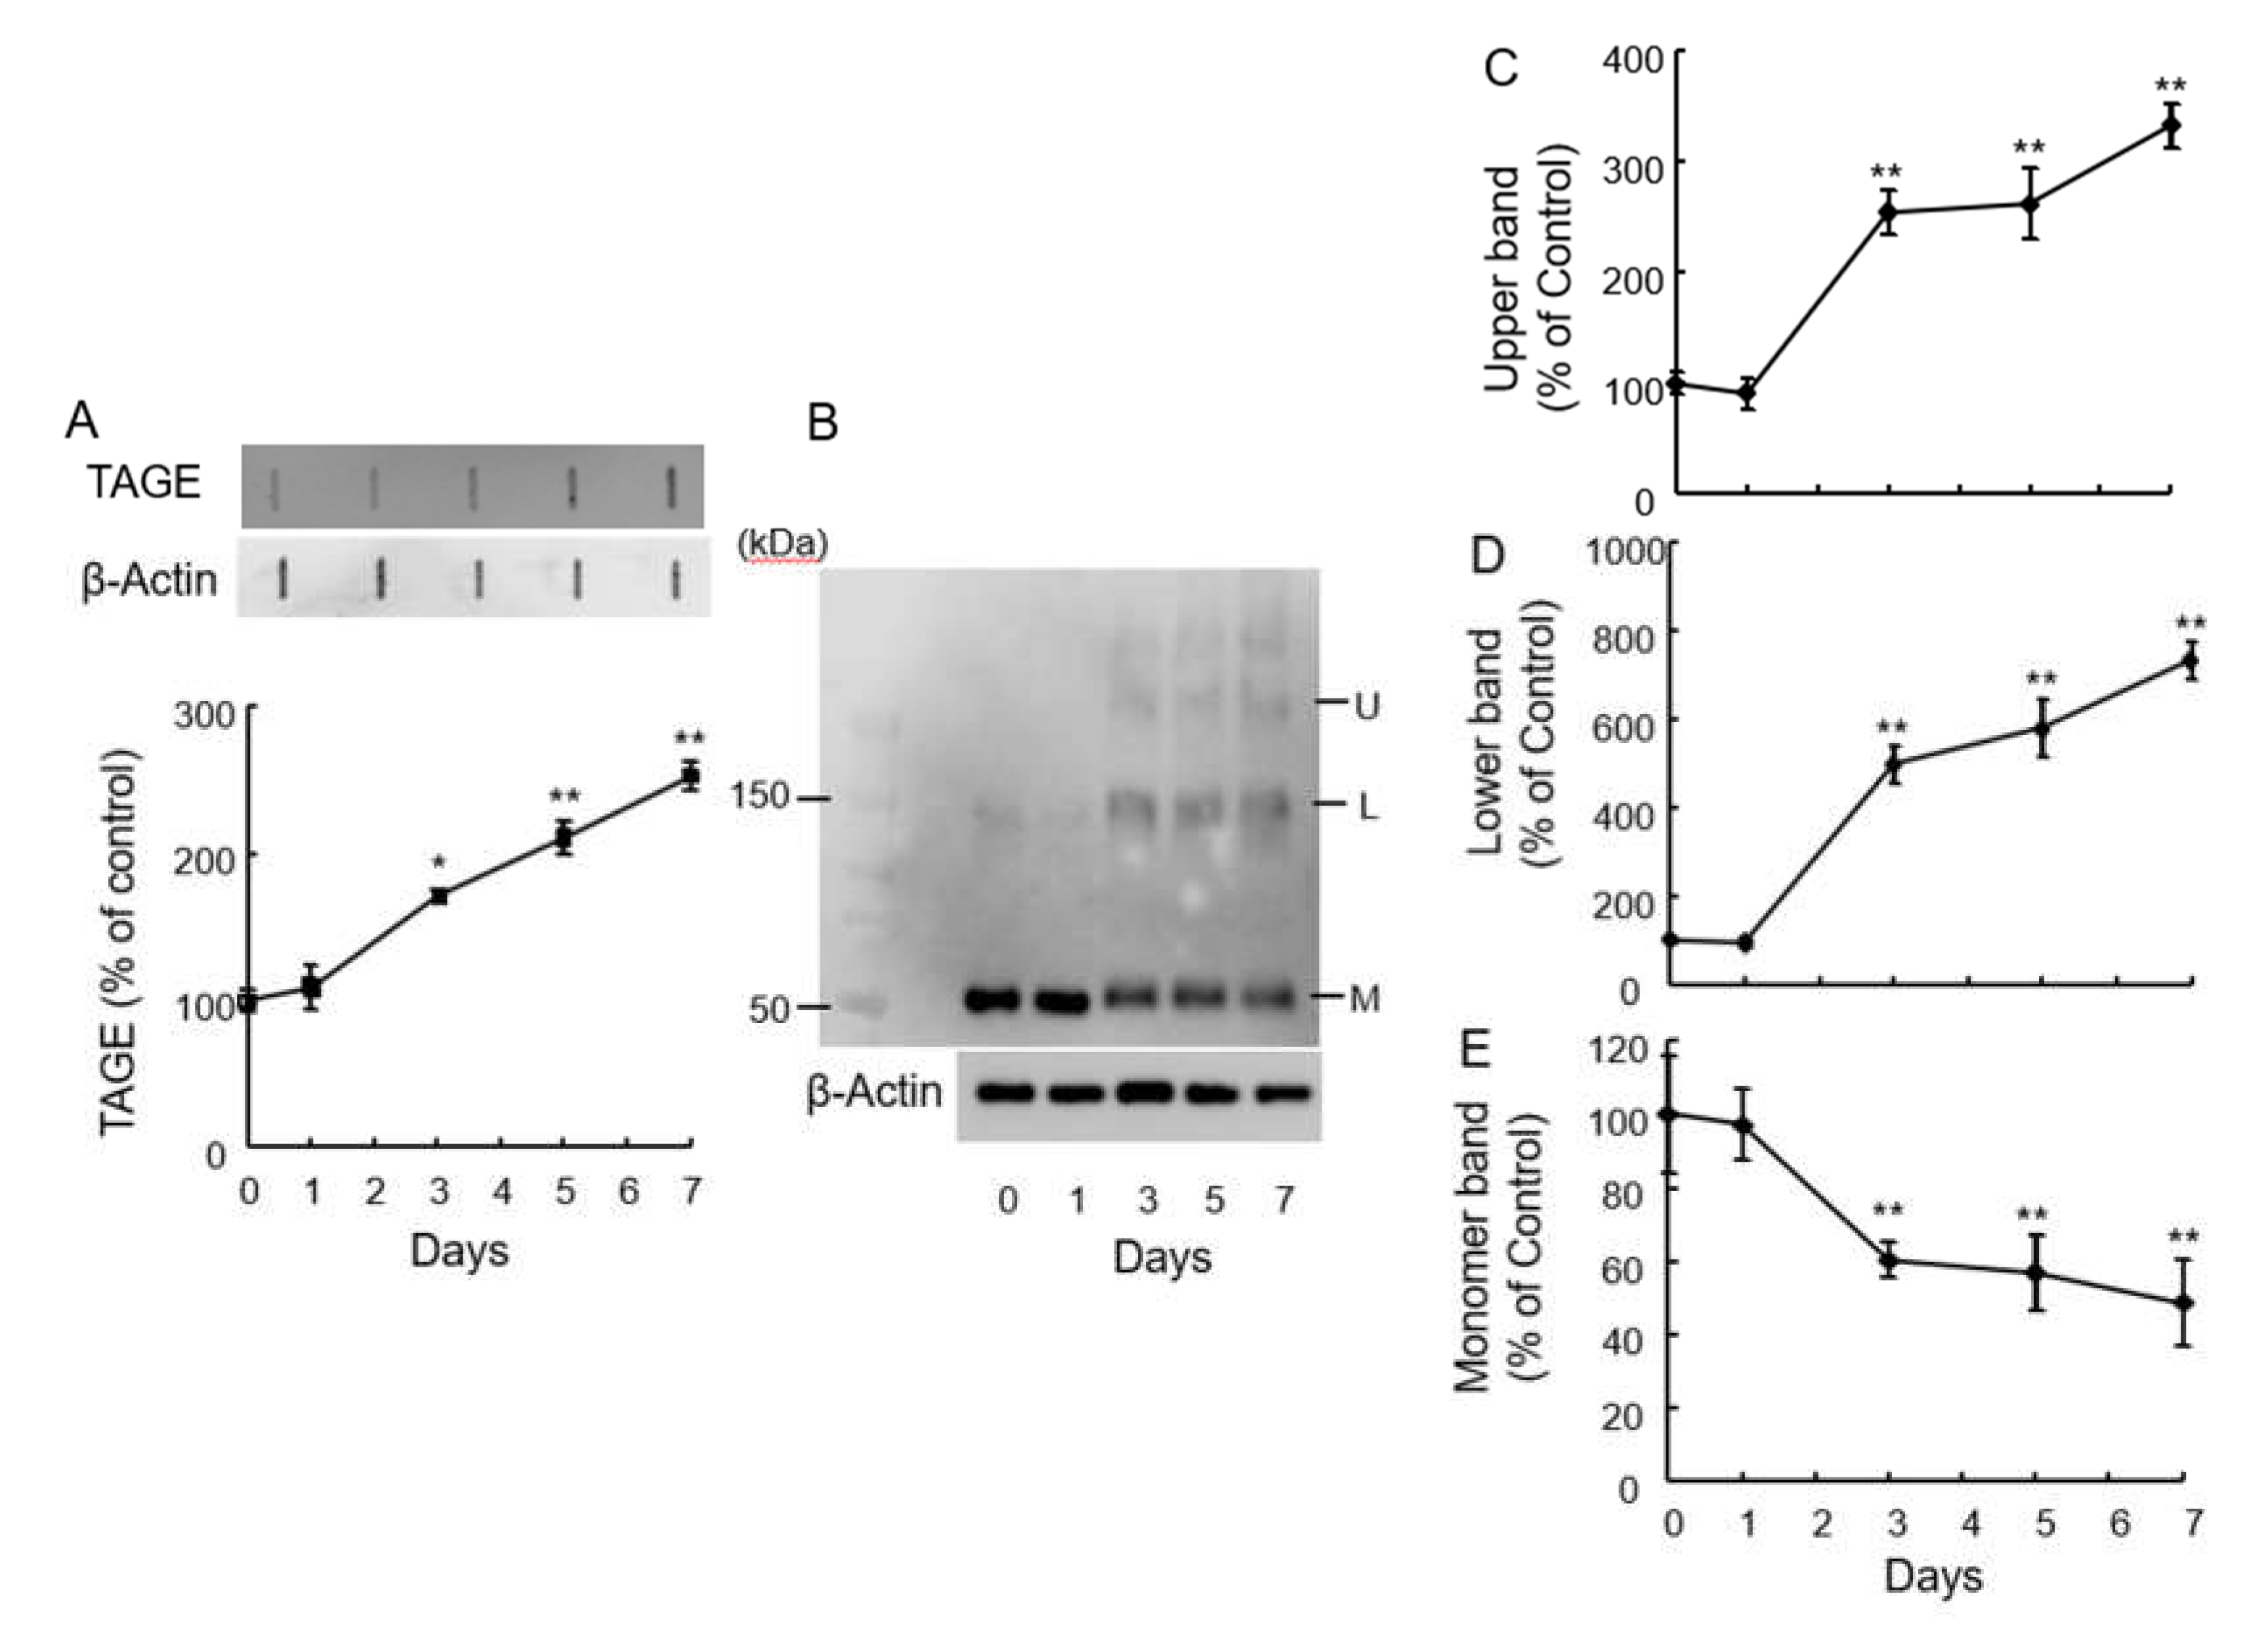
2.1. Detection of TAGE Proteins and Identification TAGE-β-Tubulin in Retina after GA Treatment
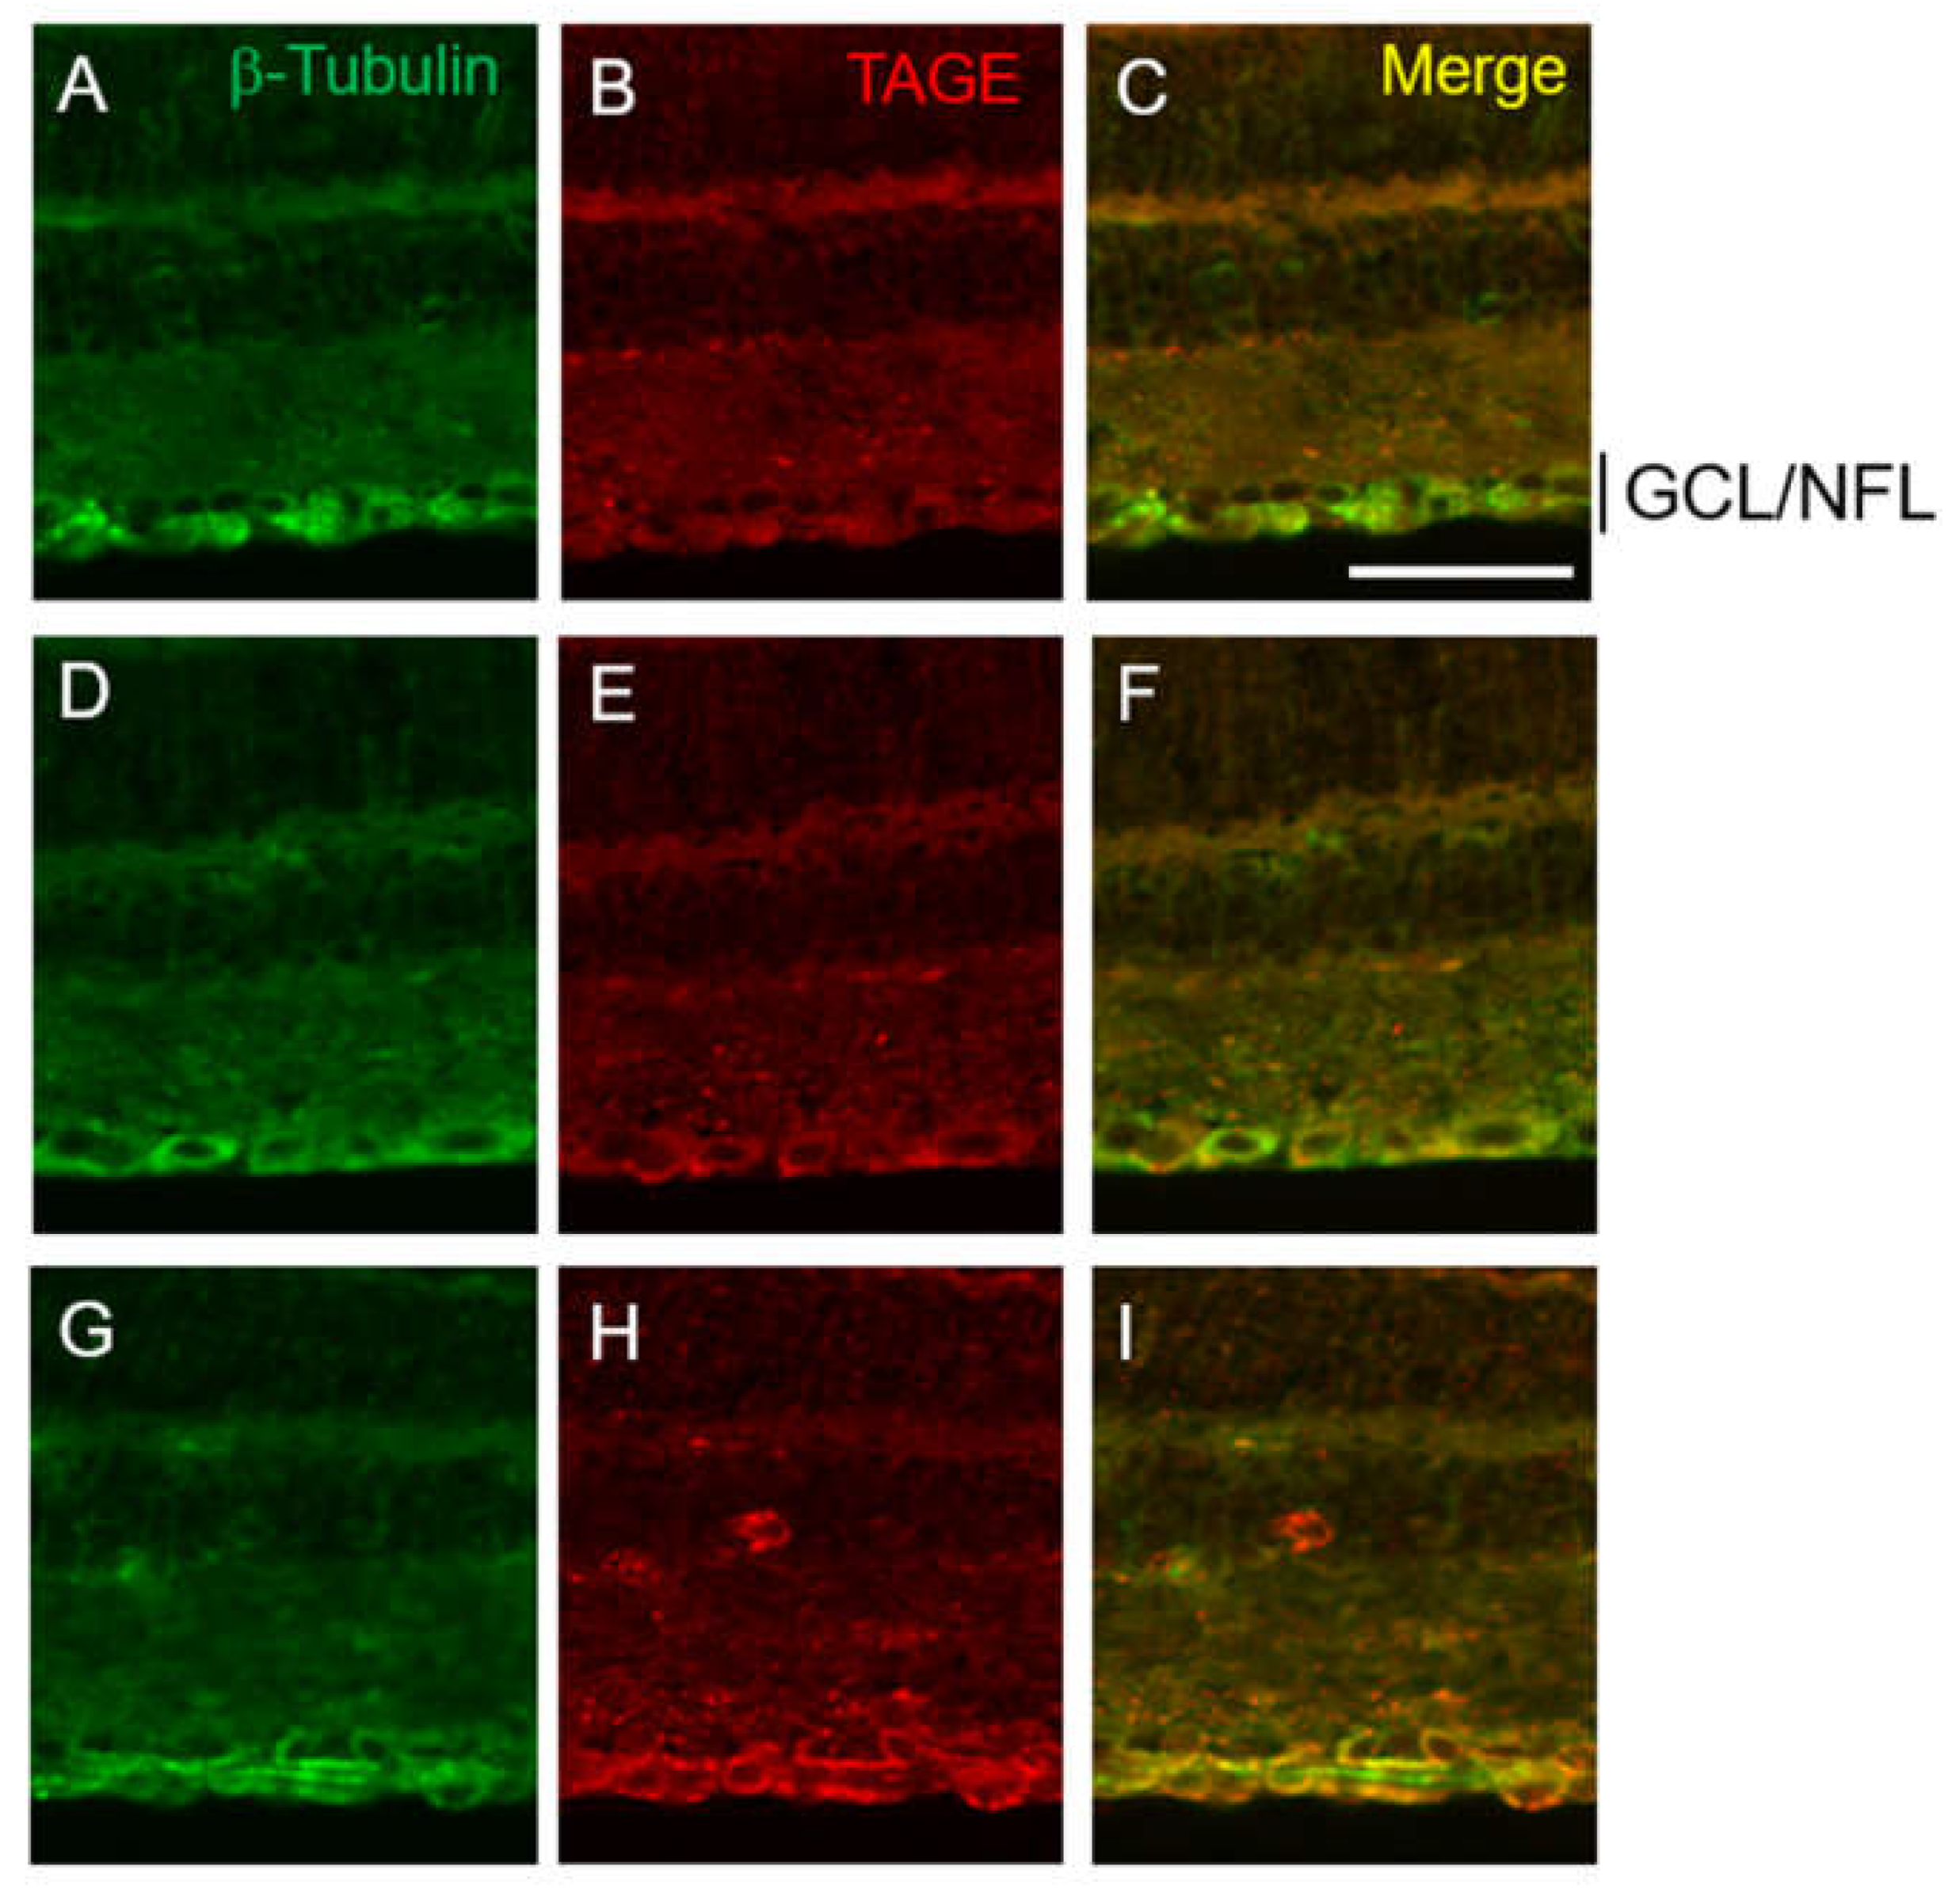
2.2. Colocalization of TAGE and β-Tubulin in Retina after GA Treatment
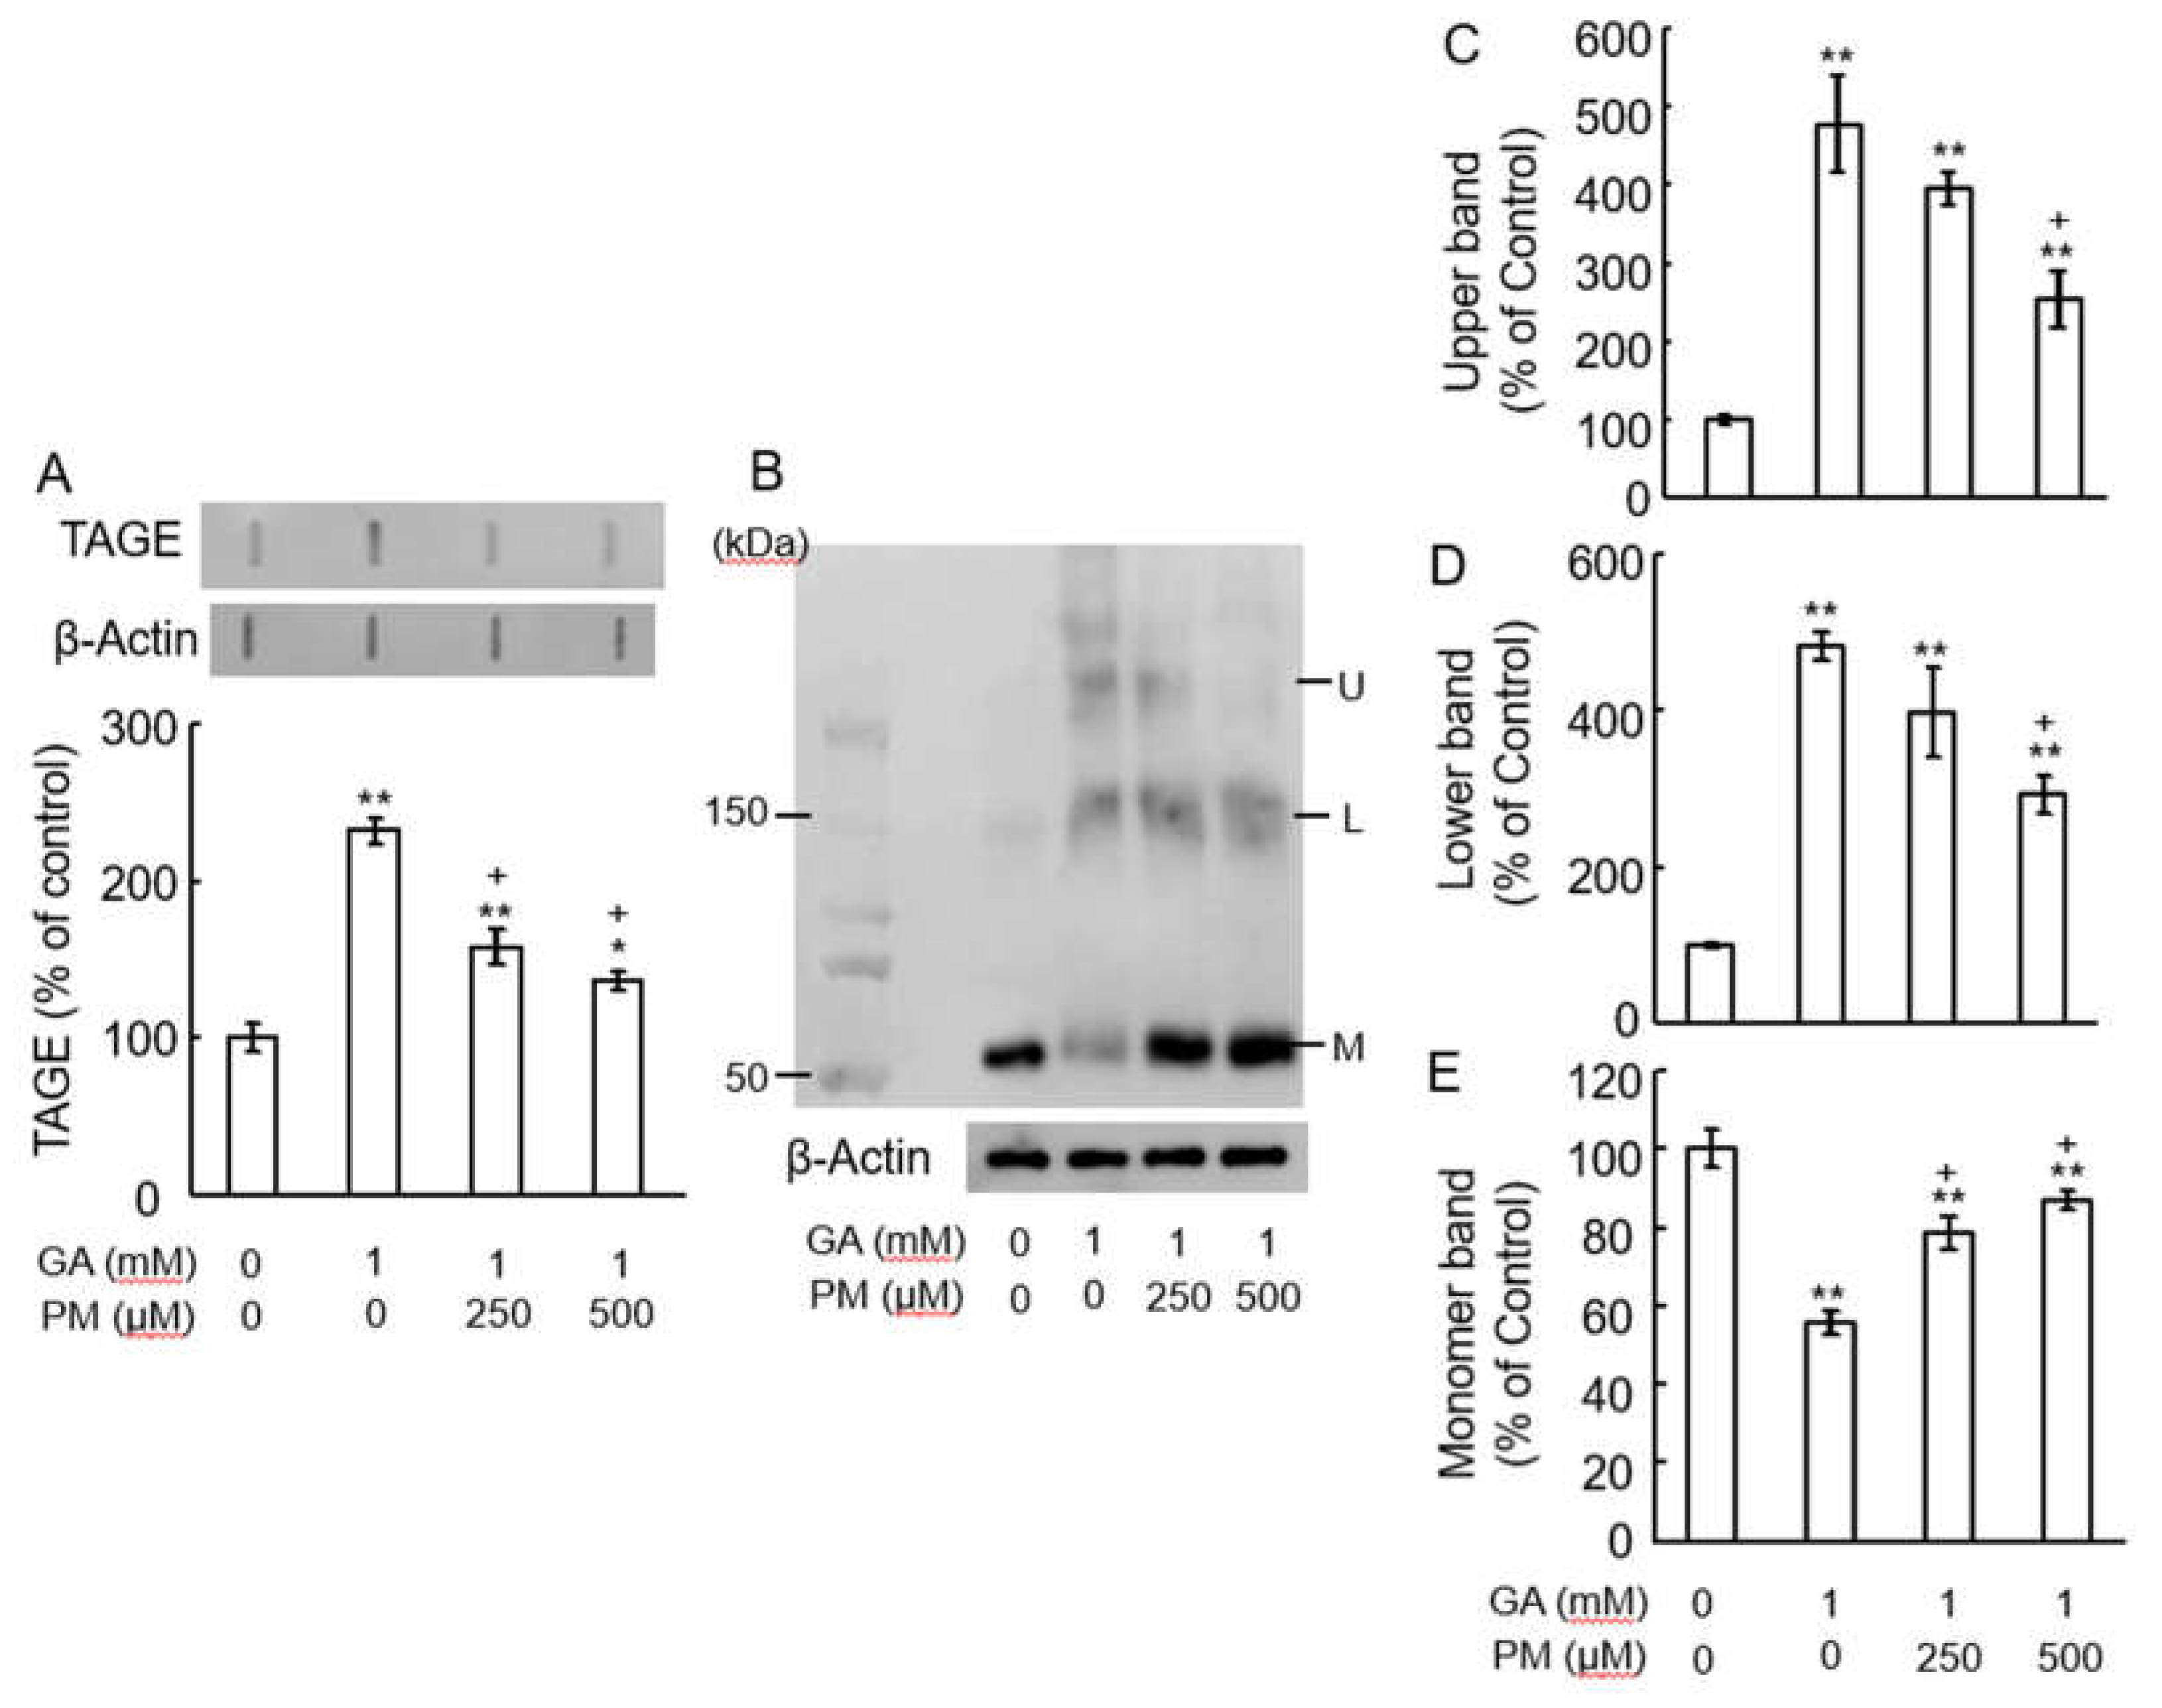
2.3. Pyridoxamine (PM) Dose-Dependently Inhibited TAGE Formation and TAGE-β-Tubulin Aggregation in Retina after GA Treatment
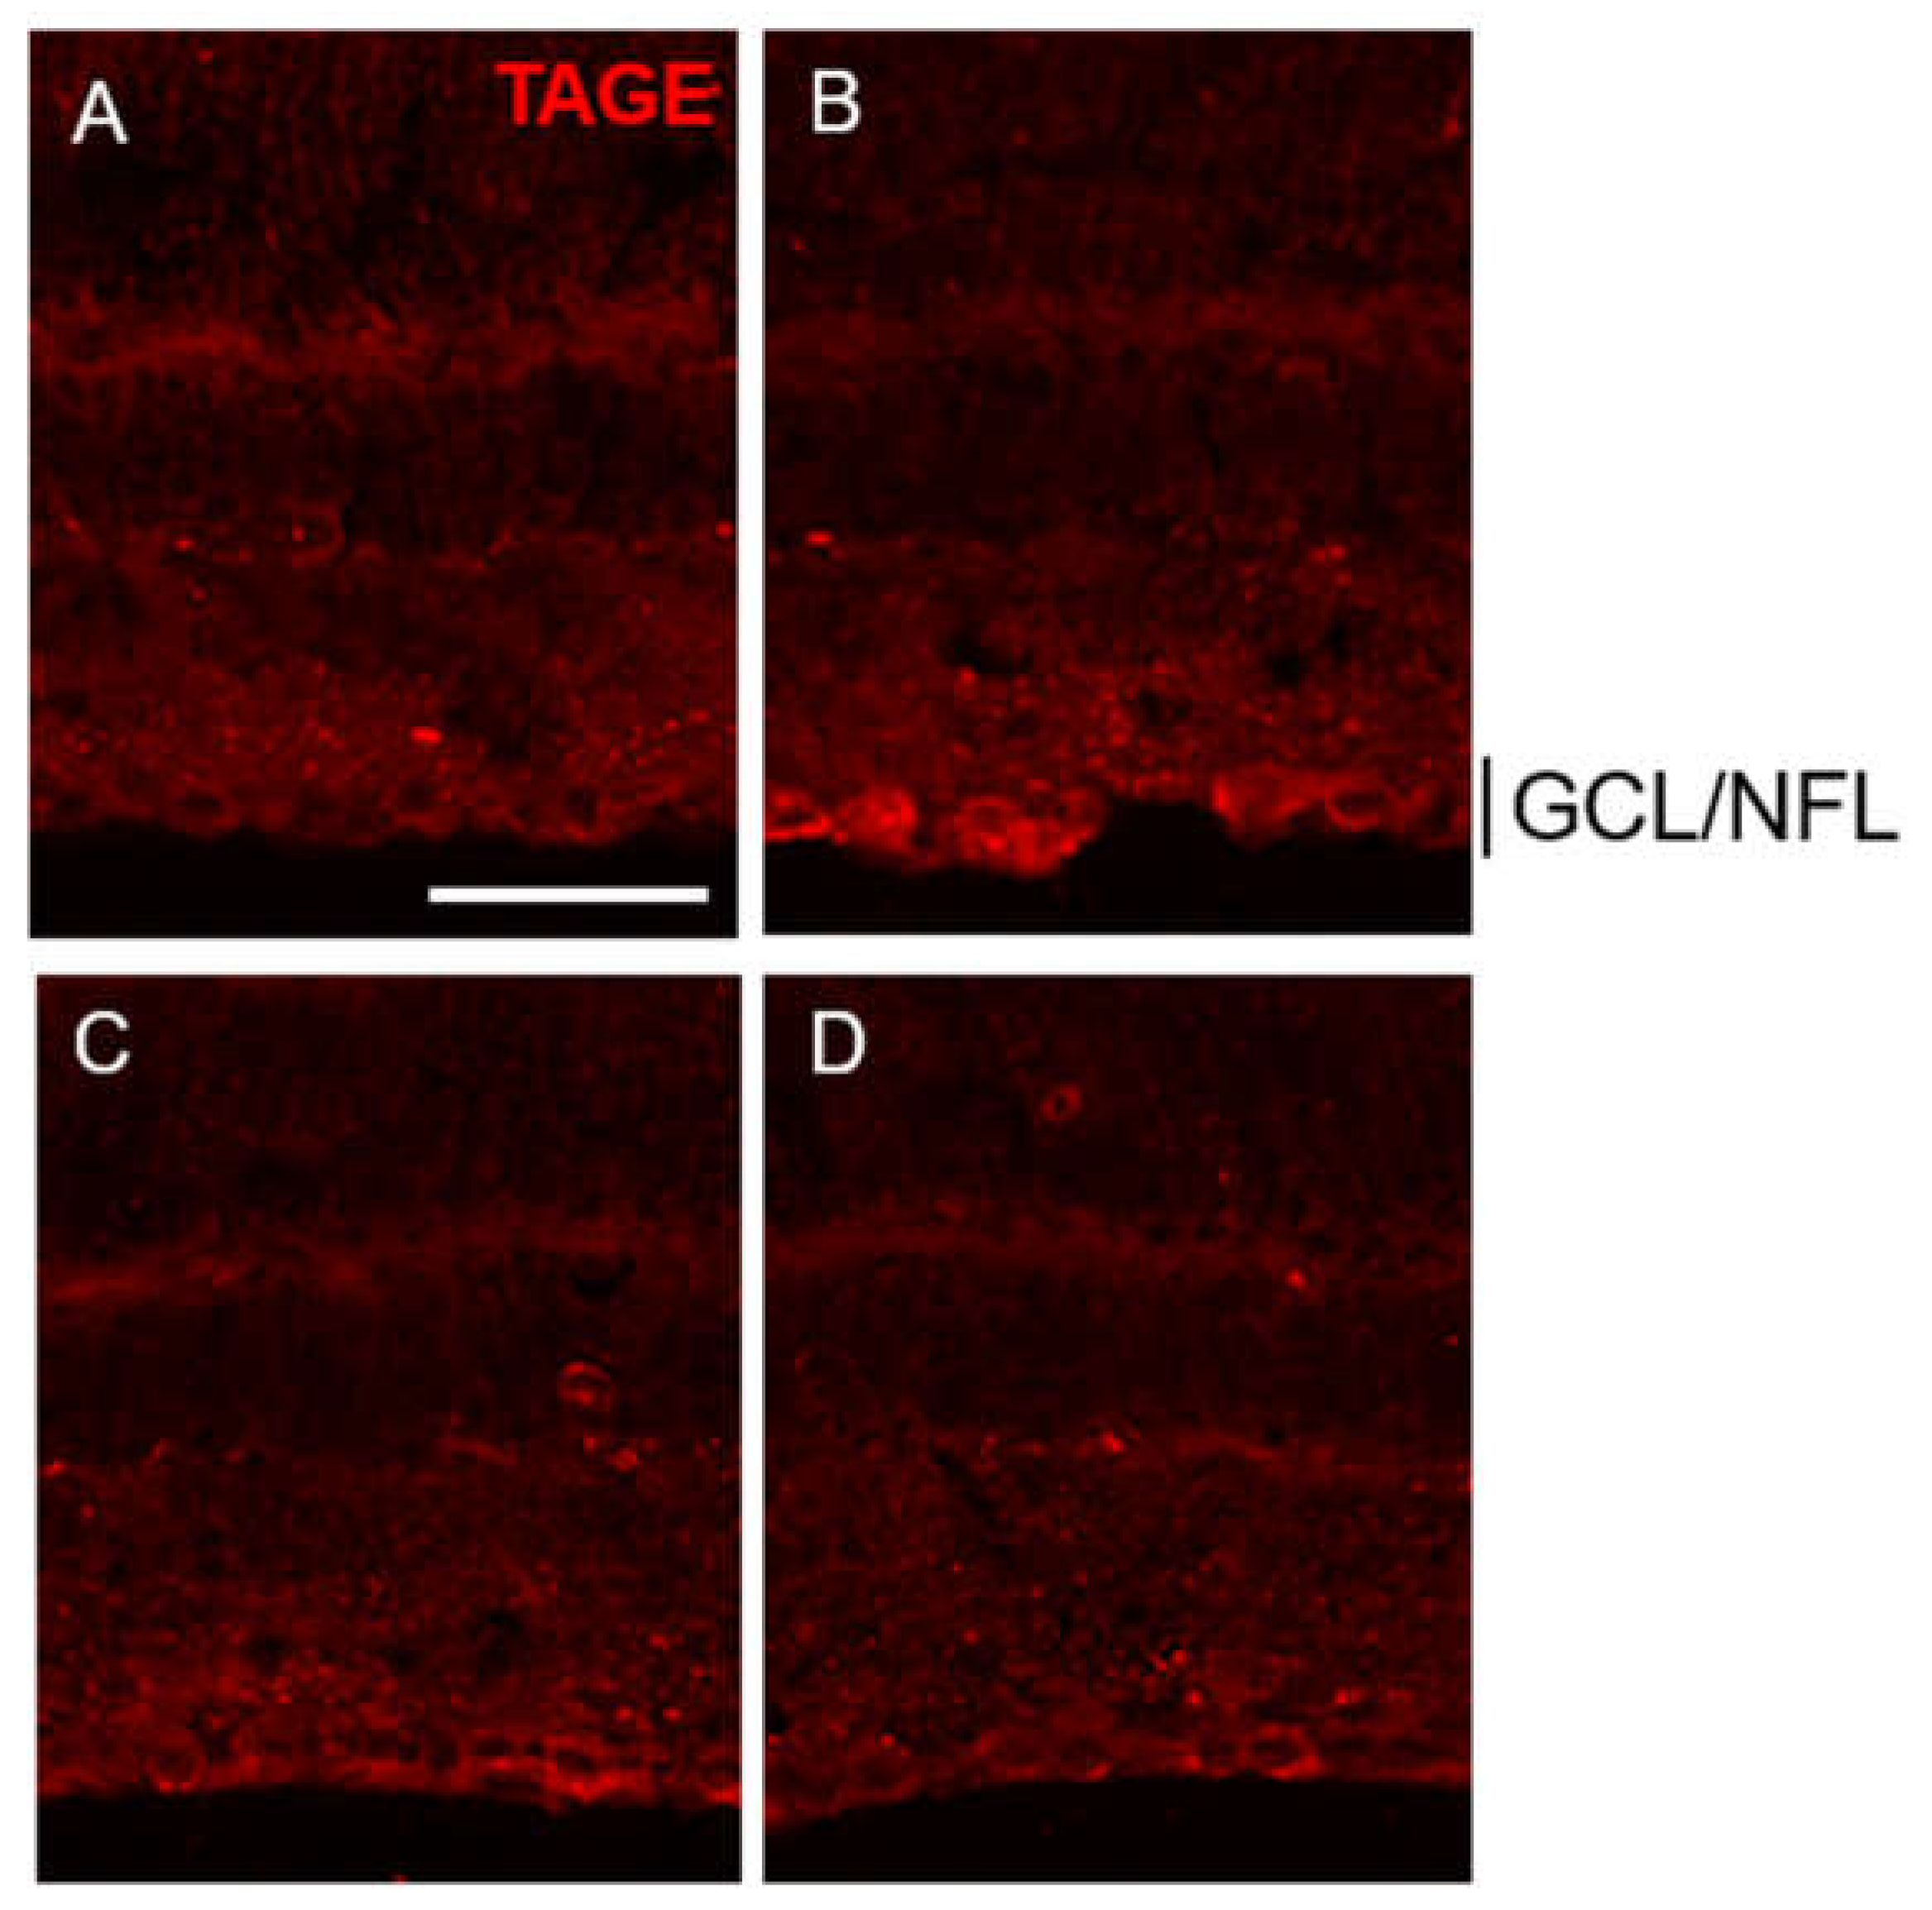
2.4. PM Dose-Dependently Inhibited TAGE Formation in GCL and NFL after GA Treatment
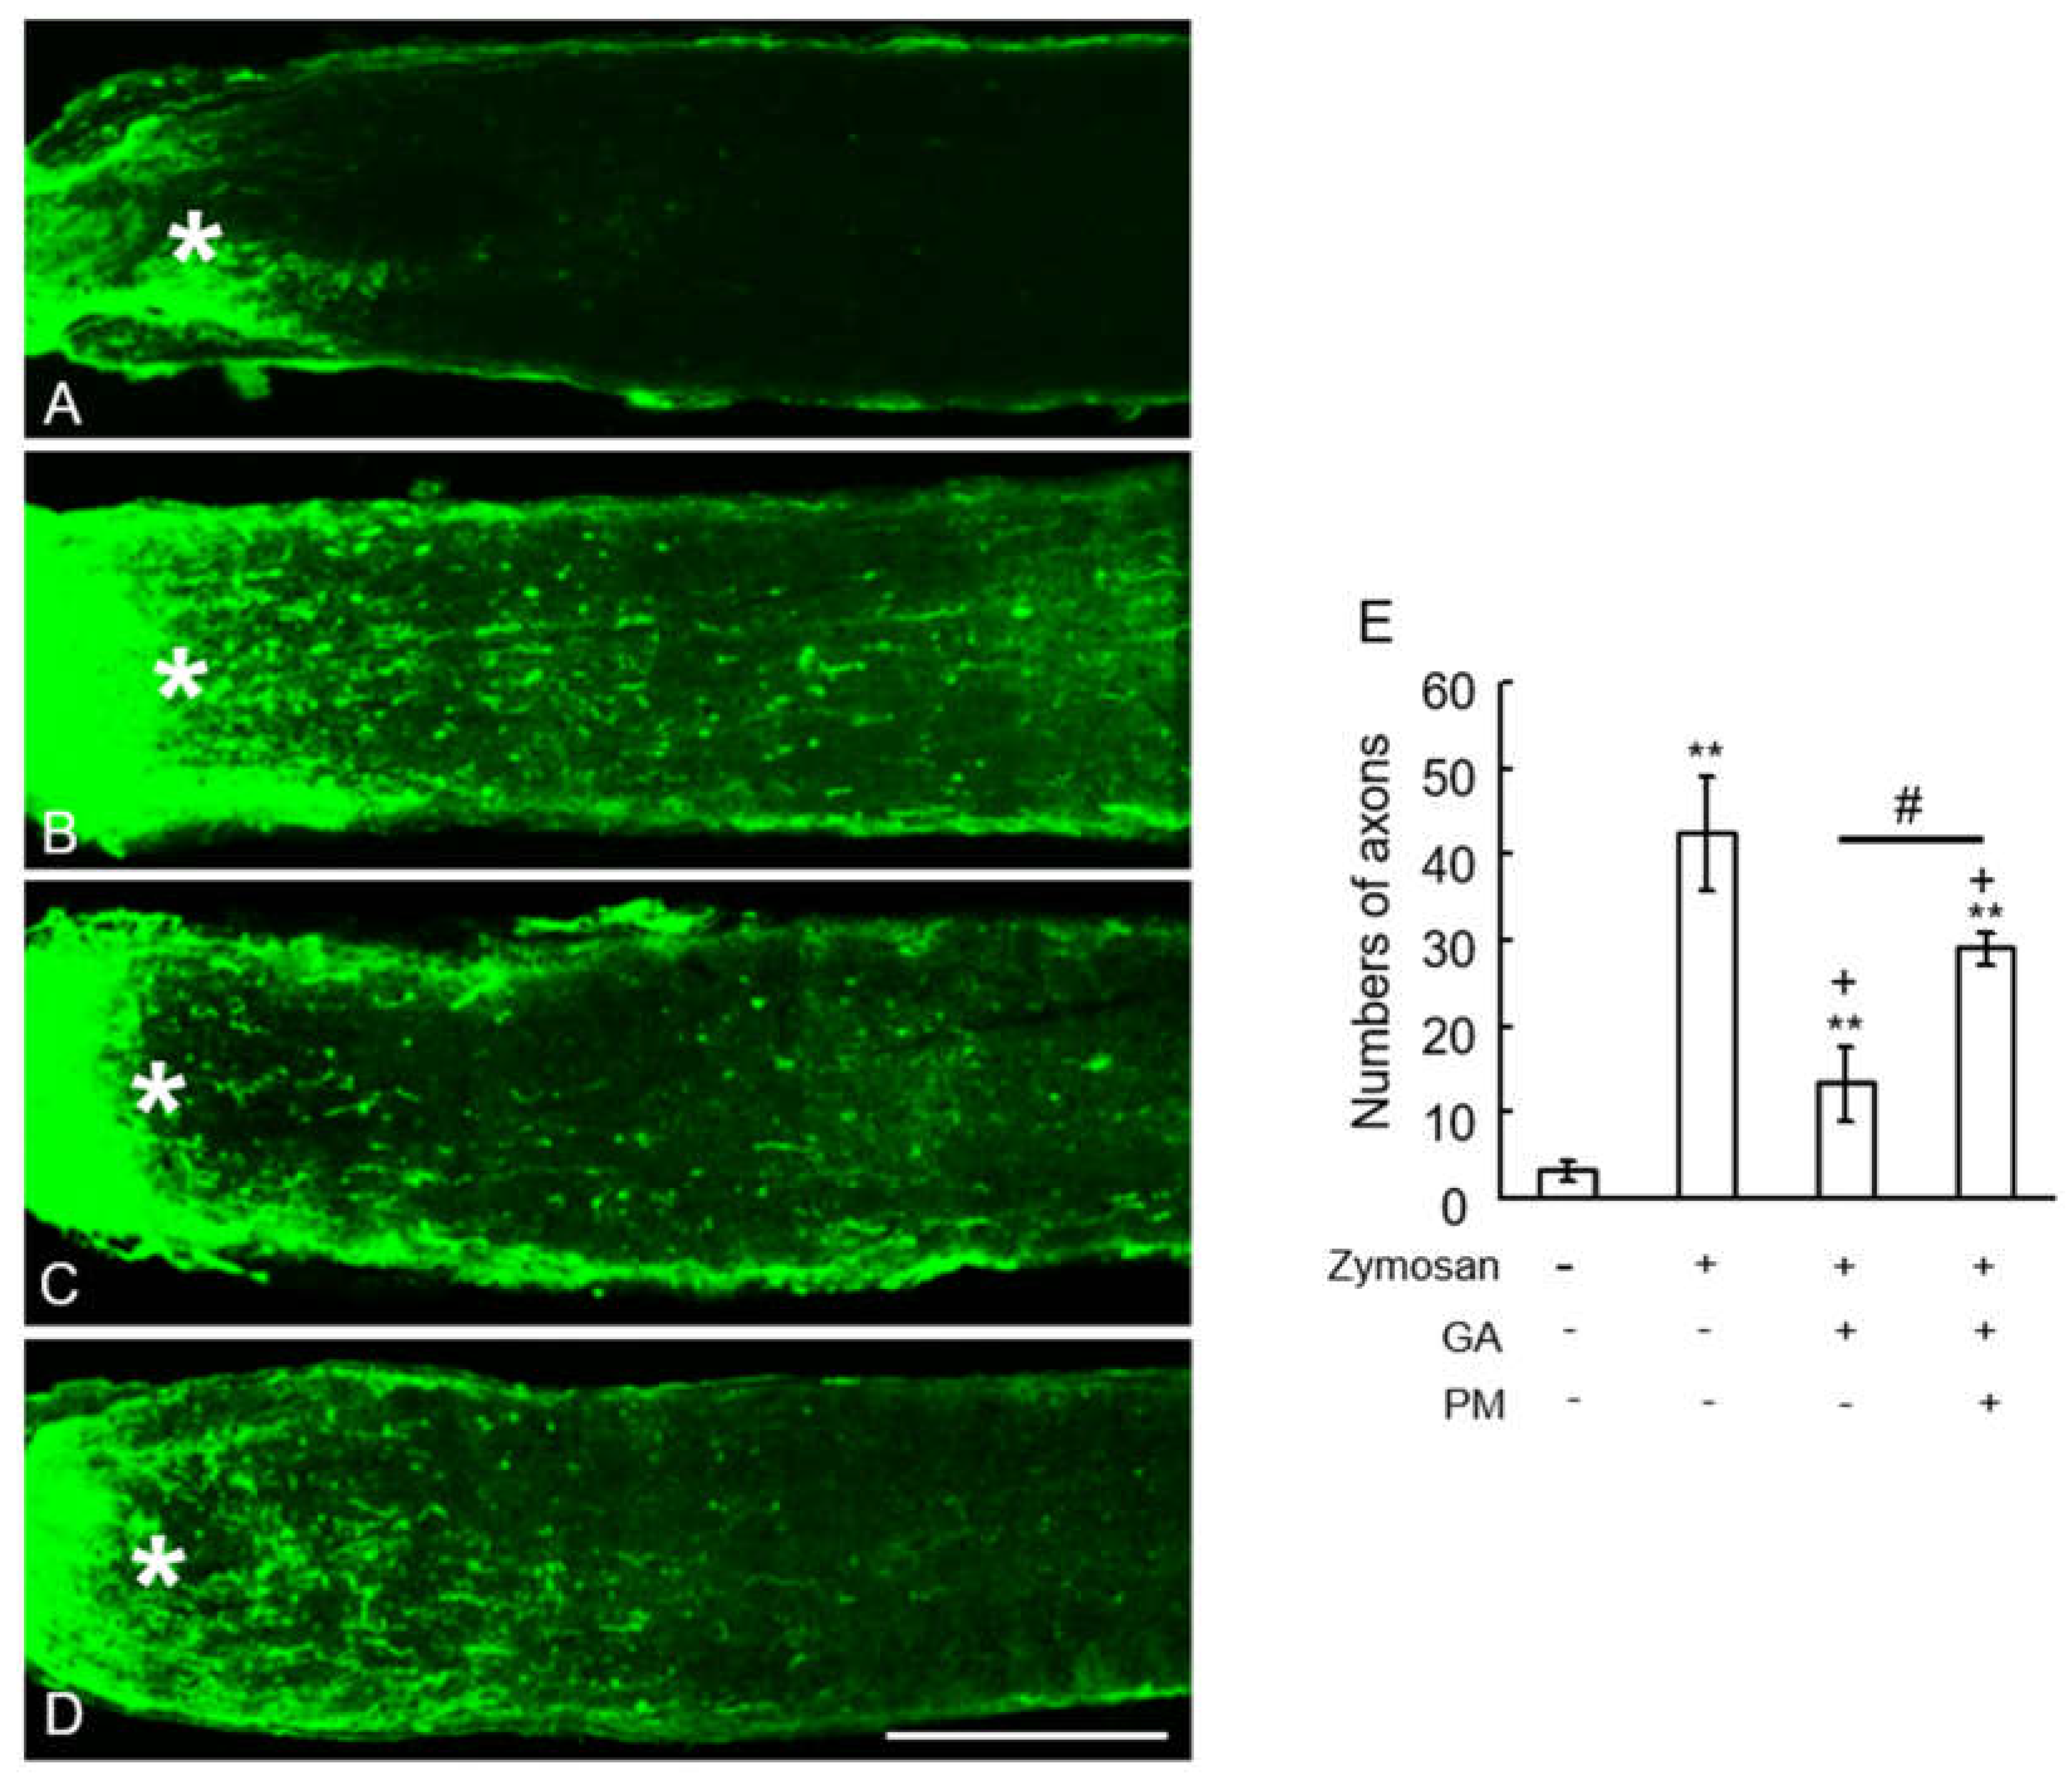
2.5. TAGE Inhibited Zymosan-Induced Axonal Elongation after Injury
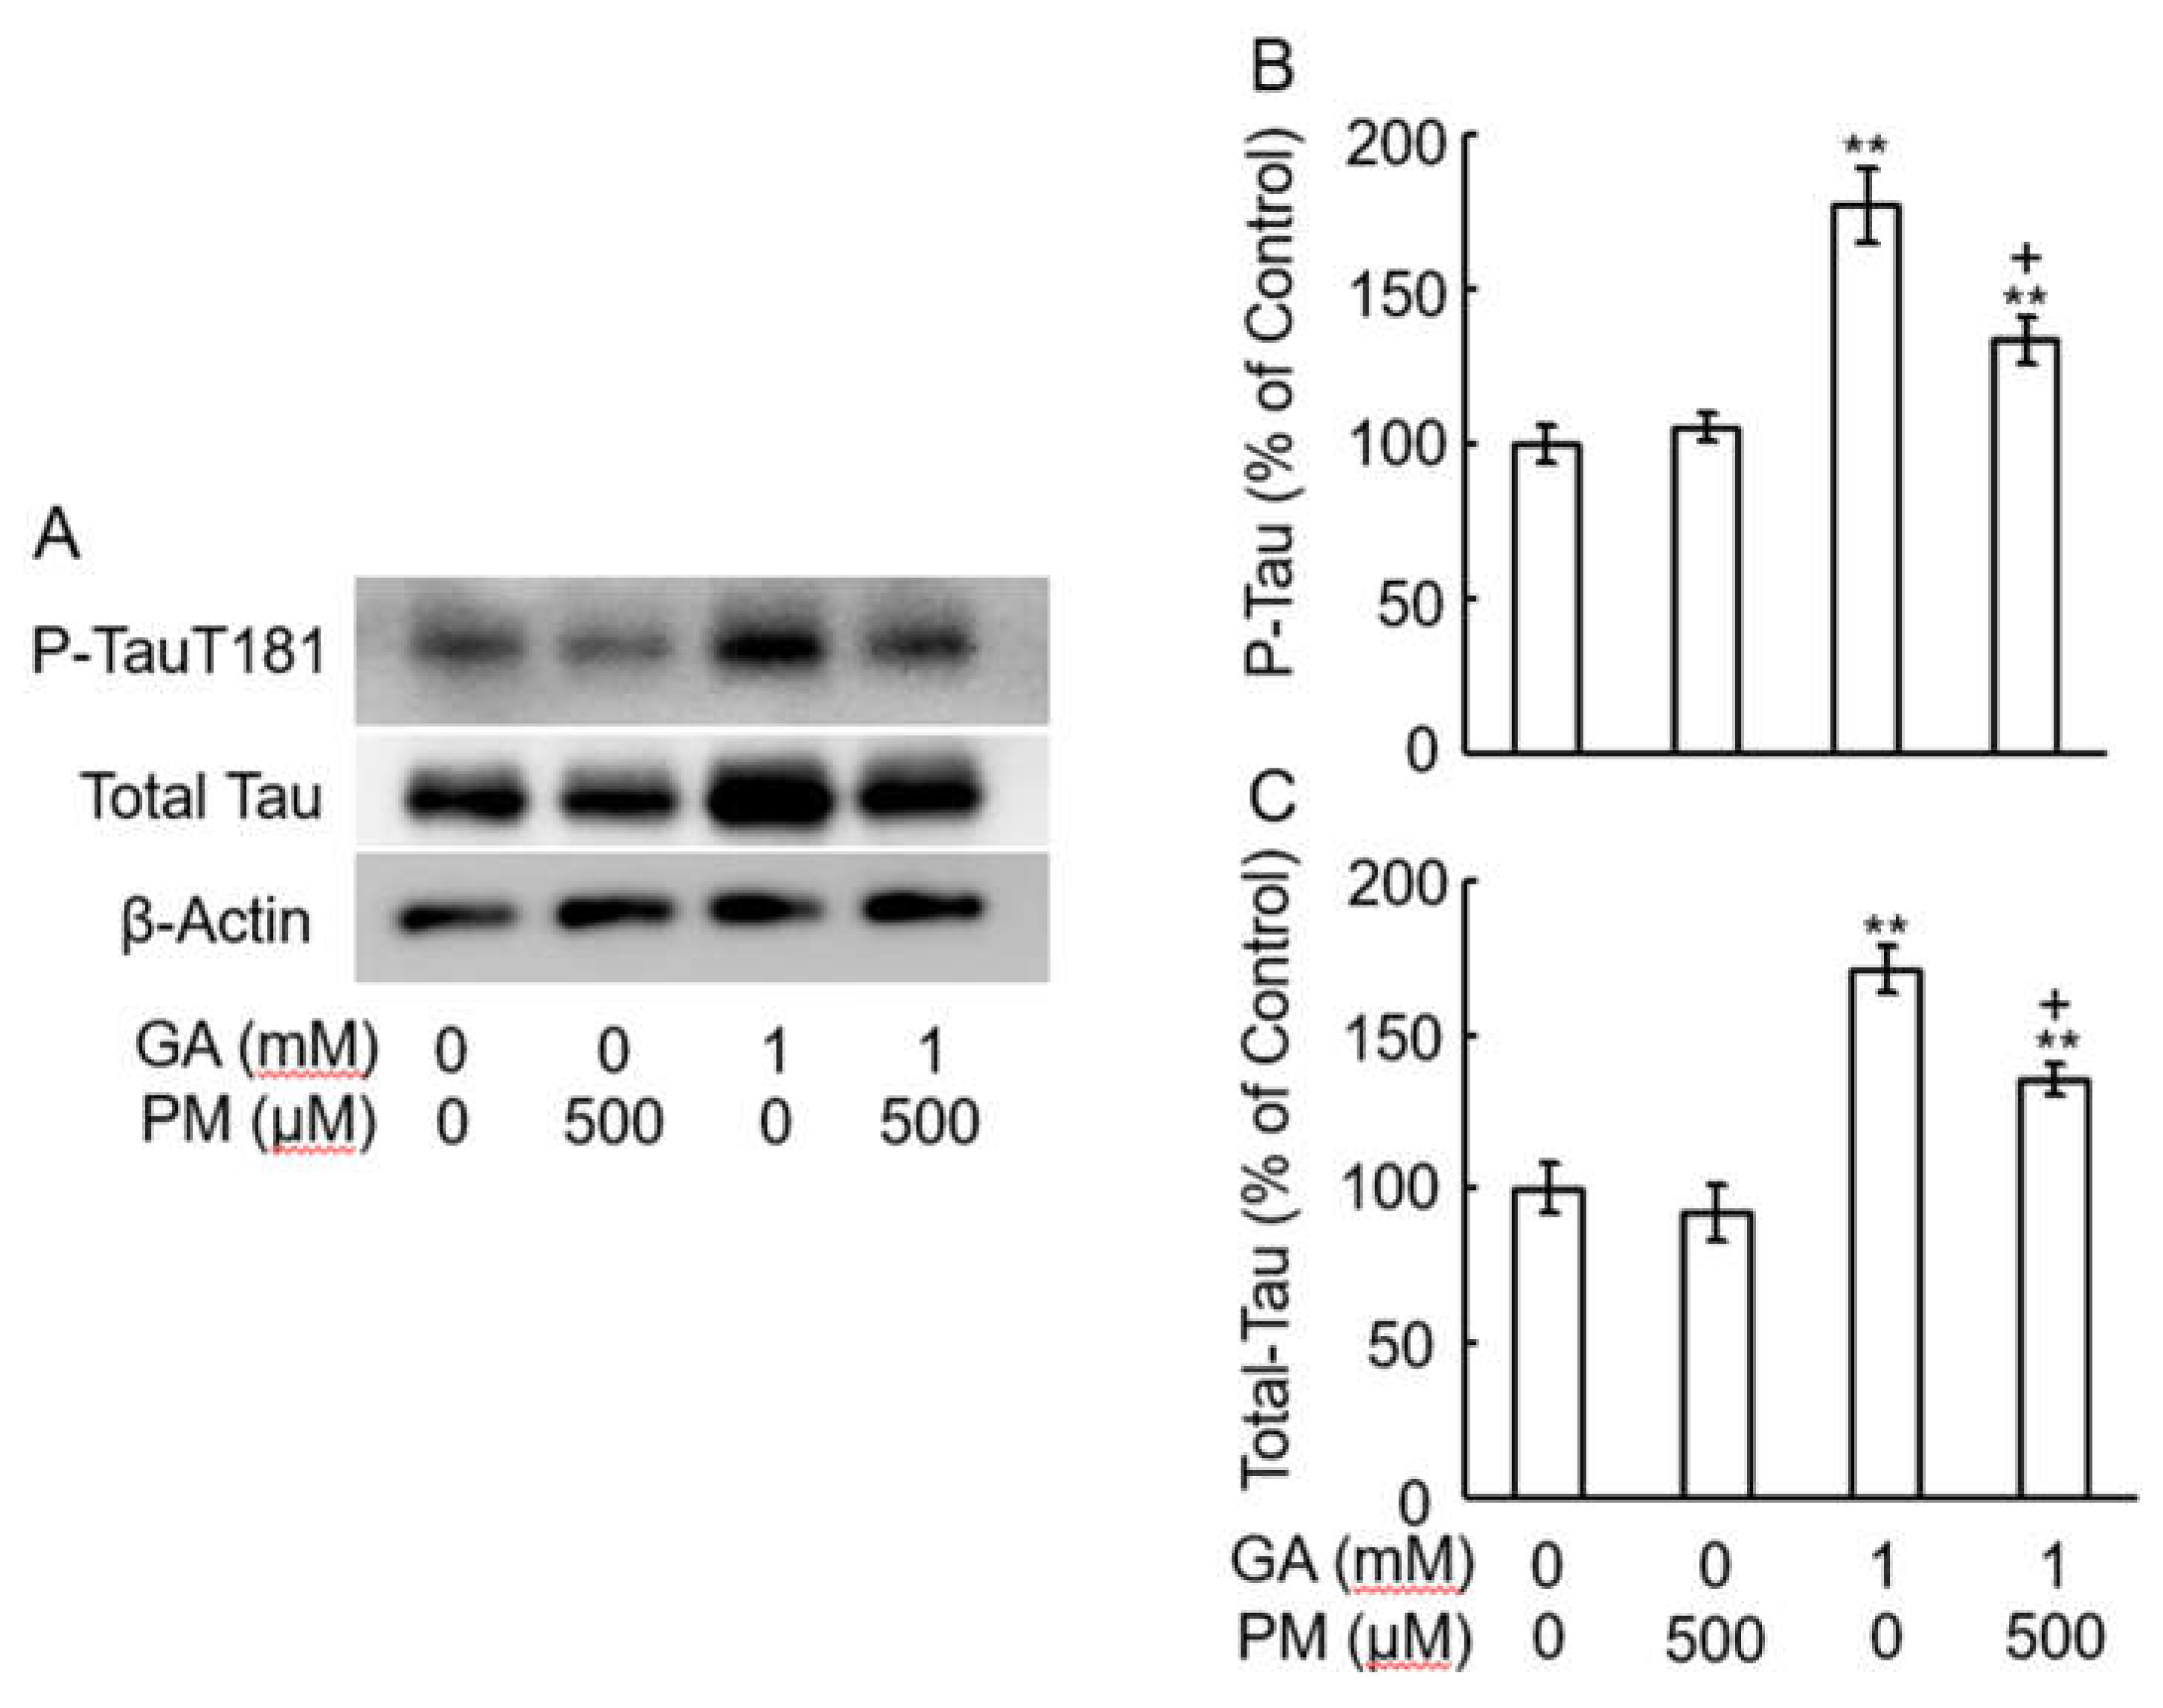
2.6. GA-Increased Total Tau and Tau Phosphorylation in AGEs Dependent Manner
3. Discussion
4. Materials and Methods
4.1. Ethics Statement
4.2. Chemicals
4.3. Preparation of Anti-TAGE Antibody
4.4. Animals and Surgery
4.5. Immunohistochemistry
4.6. Slot Blot Analysis
4.7. Western Blot Analysis
4.8. Quantitation of Axonal Elongation of Optic Nerve in Vivo
4.9. Statistics
5. Conclusions
Author Contributions
Funding
Institutional Review Board Statement
Informed Consent Statement
Data Availability Statement
Conflicts of Interest
References
- Takeuchi, M.; Sakasai-Sakai, A.; Takata, T.; Takino, JI.; Koriyama, Y. Effects of Toxic AGEs (TAGE) on Human Health. Cells. 2022, 11, 2178; [Google Scholar] [CrossRef]
- Sato, T.; Shimogaito, N.; Wu, X.; Kikuchi, S.; Yamagishi, S.; Takeuchi, M. Toxic advanced glycation end products (TAGE) theory in Alzheimer's disease. Am J Alzheimers Dis Other Demen. 2006, 21, 197–208; [Google Scholar] [CrossRef] [PubMed]
- Smith, M.A.; Taneda, S.; Richey, P.L.; Miyata, S.; Yan, S.D.; Stern, D.; Sayre, L.M.; Monnier, V.M.; Perry, G. Advanced Maillard reaction end products are associated with Alzheimer disease pathology. Proc Natl Acad Sci U S A. 1994, 91, 5710–5714; [Google Scholar] [CrossRef] [PubMed]
- Yan, S.D.; Yan, S.F.; Chen, X.; Fu, J.; Chen, M.; Kuppusamy, P.; Smith, M.A.; Perry, G.; Godman, G.C.; Nawroth, P.; et al. Non-enzymatically glycated tau in Alzheimer's disease induces neuronal oxidant stress resulting in cytokine gene expression and release of amyloid beta-peptide. Nat Med. 1995, 1, 693–699; [Google Scholar] [CrossRef]
- Oshitari, T. Advanced Glycation End-Products and Diabetic Neuropathy of the Retina. Int J Mol Sci. 2023, 24, 2927; [Google Scholar] [CrossRef]
- Oshitari, T. ; Roy, S: Diabetes: A potential enhancer of retinal injury in rat retinas. Neurosci letter. 2005, 390, 25–30; [Google Scholar] [CrossRef]
- Hinton, D.R.; Sadun, A.A.; Blanks, J.C.; Miller, C.A. Optic-nerve degeneration in Alzheimer's disease. N Engl J Med. 1986, 315, 485–487; [Google Scholar] [CrossRef] [PubMed]
- Sadun, A.A.; Bassi, C.J. Optic nerve damage in Alzheimer's disease. Ophthalmology. 1990, 97, 9–17; [Google Scholar] [CrossRef] [PubMed]
- Wang, M.Y.; Ross-Cisneros, F.N.; Aggarwal, D.; Liang, C.Y.; Sadun, A.A. Receptor for advanced glycation end products is upregulated in optic neuropathy of Alzheimer's disease. Acta Neuropathol. 2009, 118, 381–389; [Google Scholar] [CrossRef]
- Koriyama, Y.; Furukawa, A.; Muramatsu, M.; Takino, J.; Takeuchi, M. Glyceraldehyde caused Alzheimer's disease-like alterations in diagnostic marker levels in SH-SY5Y human neuroblastoma cells. Sci Rep. 2015, 5, 13313; [Google Scholar] [CrossRef]
- Takeuchi, M.; Bucala, R.; Suzuki, T.; Ohkubo, T.; Yamazaki, M.; Koike, T.; Kameda, Y.; Makita, Z. Neurotoxicity of advanced glycation end-products for cultured cortical neurons. J Neuropathol Exp Neurol. 2000, 59, 1094–1105; [Google Scholar] [CrossRef] [PubMed]
- Choei, H.; Sasaki, N.; Takeuchi, M.; Yoshida, T.; Ukai, W.; Yamagishi, S.; Kikuchi, S.; Saito, T. Glyceraldehyde-derived advanced glycation end products in Alzheimer's disease. Acta Neuropathol. 2004, 108, 189–193; [Google Scholar] [CrossRef] [PubMed]
- Nasu, R.; Furukawa, A.; Suzuki, K.; Takeuchi, M.; Koriyama, Y. The Effect of Glyceraldehyde-Derived Advanced Glycation End Products on β-Tubulin-Inhibited Neurite Outgrowth in SH-SY5Y Human Neuroblastoma Cells. Nutrients. 2020, 12, 2958; [Google Scholar] [CrossRef]
- Leon, S.; Yin, Y.; Nguyen, J.; Irwin, N.; Benowitz, L.I. Lens injury stimulates axon regeneration in the mature rat optic nerve. J Neurosci. 2000, 20, 4615–4626; [Google Scholar] [CrossRef] [PubMed]
- de, Lima, S. ; Koriyama, Y.; Kurimoto, T.; Oliveira, J.T.; Yin, Y.; Li, Y.; Gilbert, H.Y.; Fagiolini, M.; Martinez, A.M.; Benowitz, L. Full-length axon regeneration in the adult mouse optic nerve and partial recovery of simple visual behaviors. Proc Natl Acad Sci U S A. 2012, 109, 9149–9154; [Google Scholar] [CrossRef] [PubMed]
- Zhou, X.W.; Li, X.; Bjorkdahl, C.; Sjogren, M.J.; Alafuzoff, I.; Soininen, H.; Grundke-Iqbal, I.; Iqbal, K.; Winblad, B.; Pei, J.J. Assessments of the accumulation severities of amyloid beta-protein and hyperphosphorylated tau in the medial temporal cortex of control and Alzheimer's brains. Neurobiol Dis. 2006, 22, 657–668. [Google Scholar] [CrossRef] [PubMed]
- Davies, D.C.; McCoubrie, P.; McDonald, B.; Jobst, K.A. Myelinated axon number in the optic nerve is unaffected by Alzheimer's disease. Br J Ophthalmol. 1995, 79, 596–600; [Google Scholar] [CrossRef] [PubMed]
- Tsai, C.S.; Ritch, R.; Schwartz, B.; Lee, S.S.; Miller, N.R.; Chi, T.; Hsieh, F.Y. Optic nerve head and nerve fiber layer in Alzheimer's disease. Arch Ophthalmol. 1991, 109, 199–204; [Google Scholar] [CrossRef] [PubMed]
- Guo, L.; Duggan, J.; Cordeiro, M.F. Alzheimer's disease and retinal neurodegeneration. Curr Alzheimer Res. 2010, 7, 3–14; [Google Scholar] [CrossRef]
- Bao, Y.K.; Yan, Y.; Gordon, M.; McGill, J.B.; Kass, M.; Rajagopal, R. Visual Field Loss in Patients with Diabetes in the Absence of Clinically-Detectable Vascular Retinopathy in a Nationally Representative Survey. Invest Ophthalmol Vis Sci. 2019, 60, 4711–4716; [Google Scholar] [CrossRef]
- Garcia-Martin, E.; Cipres, M.; Melchor, I.; Gil-Arribas, L.; Vilades, E.; Polo, V.; Rodrigo, M.J.; Satue, M. Neurodegeneration in Patients with Type 2 Diabetes Mellitus without Diabetic Retinopathy. J Ophthalmol. 2019, 2019, 1825819; [Google Scholar] [CrossRef]
- Zong, H.; Ward, M.; Madden, A.; Yong, P.H.; Limb, G.A.; Curtis, T.M.; Stitt, A.W. Hyperglycaemia-induced pro-inflammatory responses by retinal Müller glia are regulated by the receptor for advanced glycation end-products (RAGE). Diabetologia. 2010, 53, 2656–2666; [Google Scholar] [CrossRef] [PubMed]
- Tezel, G.; Luo, C.; Yang, X. Accelerated aging in glaucoma: immunohistochemical assessment of advanced glycation end products in the human retina and optic nerve head. Invest Ophthalmol Vis Sci. 2007, 48, 1201–1211; [Google Scholar] [CrossRef] [PubMed]
- Bikbova, G.; Oshitari, T.; Baba, T.; Yamamoto, S. Altered Expression of NF- κ B and SP1 after Exposure to Advanced Glycation End-Products and Effects of Neurotrophic Factors in AGEs Exposed Rat Retinas. J Diabetes Res. 2015, 2015, 543818; [Google Scholar] [CrossRef]
- Bikbova, G.; Oshitari, T.; Yamamoto, S. Neuronal cell death and regeneration in diseases associated with advanced glycation end-products accumulation. Neural Regen Res. 2014, 9, 701–702; [Google Scholar] [CrossRef] [PubMed]
- Takeuchi, M.; Yamagishi, S. Involvement of toxic AGEs (TAGE) in the pathogenesis of diabetic vascular complications and Alzheimer's disease. J Alzheimers Dis. 2009, 16, 845–858; [Google Scholar] [CrossRef] [PubMed]
- Yamagishi, S.; Nakamura, K.; Inoue, H.; Kikuchi, S.; Takeuchi, M. Serum or cerebrospinal fluid levels of glyceraldehyde-derived advanced glycation end products (AGEs) may be a promising biomarker for early detection of Alzheimer's disease. Med Hypotheses. 2005, 64, 1205–1207; [Google Scholar] [CrossRef]
- Cullum, N.A.; Mahon, J.; Stringer, K.; McLean, W.G. Glycation of rat sciatic nerve tubulin in experimental diabetes mellitus. Diabetologia. 1991, 387–389. [Google Scholar] [CrossRef] [PubMed]
- Takeuchi, M.; Yamagishi, S. Possible involvement of advanced glycation end-products (AGEs) in the pathogenesis of Alzheimer's disease. Curr Pharm Des. 2008, 14, 973–978; [Google Scholar] [CrossRef]
- Oates, P.J. Polyol pathway and diabetic peripheral neuropathy. Int Rev Neurobiol. 2002, 50, 325–392; [Google Scholar] [CrossRef]
- Hallfrisch, J. Metabolic effects of dietary fructose. FASEB J. 1990, 4, 2652–2660; [Google Scholar] [CrossRef] [PubMed]
- Fujita, H.; Aoki, H.; Ajioka, I.; Yamazaki, M.; Abe, M.; Oh-Nishi, A.; Sakimura, K.; Sugihara, I. Detailed expression pattern of aldolase C (Aldoc) in the cerebellum, retina and other areas of the CNS studied in Aldoc-Venus knock-in mice. PLoS ONE. 2014, 9, e86679; [Google Scholar] [CrossRef] [PubMed]
- Huang, H.M.; Wu, C.W.; Chen, I.C.; Lee, Y.C.; Huang, Y.S.; Hung, C.Y.; Wu, K.L.H. Maternal high-fructose diet induced early-onset retinopathy via the suppression of synaptic plasticity mediated by mitochondrial dysfunction. Am J Physiol Endocrinol Metab. 2021, 320, E1173–E1182; [Google Scholar] [CrossRef] [PubMed]
- Trotta, M.C.; Gesualdo, C.; Petrillo, F.; Cavasso, G.; Corte, A.D.; D'Amico, G.; Hermenean, A.; Simonelli, F.; Rossi, S. ; Serum Iba-1, GLUT5, and TSPO in Patients With Diabetic Retinopathy: New Biomarkers for Early Retinal Neurovascular Alterations? A Pilot Study. Transl Vis Sci Technol. 2022, 11, 16; [Google Scholar] [CrossRef]
- Khalifah, R.G.; Baynes, J.W.; Hudson, B.G. Amadorins: Novel post-Amadori inhibitors of advanced glycation reactions. Biochem Biophys Res Commun. 1999, 257, 251–258; [Google Scholar] [CrossRef] [PubMed]
- Degenhardt, T.P.; Alderson, N.L.; Arrington, D.D.; Beattie, R.J.; Basgen, J.M.; Steffes, M.W.; Thorpe, S.R.; Baynes, J.W. Pyridoxamine inhibits early renal disease and dyslipidemia in the streptozotocin-diabetic rat. Kidney Int. 2002, 61, 939–950; [Google Scholar] [CrossRef]
- Metz, T.O.; Alderson, N.L.; Chachich, M.E.; Thorpe, S.R.; Baynes, J.W. Pyridoxamine traps intermediates in lipid peroxidation reactions in vivo: evidence on the role of lipids in chemical modification of protein and development of diabetic complications. J Biol Chem. 2003, 278, 42012–42019; [Google Scholar] [CrossRef] [PubMed]
- Metz, T.O.; Alderson, N.L.; Thorpe, S.R.; Baynes, J.W. Pyridoxamine, an inhibitor of advanced glycation and lipoxidation reactions: a novel therapy for treatment of diabetic complications. Arch Biochem Biophys. 2003, 419, 41–49; [Google Scholar] [CrossRef] [PubMed]
- Ellis, J.M.; Folkers, K.; Minadeo, M.; VanBuskirk, R.; Xia, L.J.; Tamagawa, H. A deficiency of vitamin B6 is a plausible molecular basis of the retinopathy of patients with diabetes mellitus. Biochem Biophys Res Commun. 1991, 179, 615–619; [Google Scholar] [CrossRef]
- Stitt, A.; Gardiner, T.A.; Alderson, N.L.; Canning, P.; Frizzell, N.; Duffy, N.; Boyle, C.; Januszewski, A.S.; Chachich, M.; Baynes, J.W.; Thorpe, S.R. The AGE inhibitor pyridoxamine inhibits development of retinopathy in experimental diabetes. Diabetes. 2002, 51, 2826–2832; [Google Scholar] [CrossRef]
- Kurimoto, T.; Yin, Y.; Omura, K.; Gilbert, H.Y.; Kim, D.; Cen, L.P.; Moko, L.; Kügler, S.; Benowitz, L.I. Long-distance axon regeneration in the mature optic nerve: contributions of oncomodulin, cAMP, and pten gene deletion. J Neurosci. 2010, 30, 15654–15663; [Google Scholar] [CrossRef] [PubMed]
- Yin, Y.; Cui, Q.; Li, Y.; Irwin, N.; Fischer, D.; Harvey, A.R.; Benowitz, L.I. Macrophage-derived factors stimulate optic nerve regeneration. J Neurosci. 2003, 23, 2284–2293; [Google Scholar] [CrossRef] [PubMed]
- Feng, Q.; Wong, K.A.; Benowitz, L.I. Full-length optic nerve regeneration in the absence of genetic manipulations. JCI Insight, 1: DOI, 1645. [Google Scholar]
- Takahashi, M.; Tsujioka, Y.; Yamada, T.; Tsuboi, Y.; Okada, H.; Yamamoto, T.; Liposits, Z. Glycosylation of microtubule-associated protein tau in Alzheimer's disease brain. Acta Neuropathol. 1999, 97, 635–641; [Google Scholar] [CrossRef] [PubMed]
- Ledesma, M.D.; Bonay, P.; Avila, J. ; Tau protein from Alzheimer's disease patients is glycated at its tubulin-binding domain. J Neurochem. 1995, 65, 1658–64. [Google Scholar] [CrossRef] [PubMed]
- Yao, H.; Uras, G.; Zhang, P.; Xu, S.; Yin, Y.; Liu, J.; Qin, S.; Li, X.; Allen, S.; Bai, R.; Gong, Q.; Zhang, H.; Zhu, Z.; Xu, J. Discovery of Novel Tacrine-Pyrimidone Hybrids as Potent Dual AChE/GSK-3 Inhibitors for the Treatment of Alzheimer's Disease. J Med Chem. 2021, 64, 7483–7506; [Google Scholar] [CrossRef] [PubMed]
- Bos, I.; Vos, S.; Verhey, F.; Scheltens, P.; Teunissen, C.; Engelborghs, S.; Sleegers, K.; Frisoni, G.; Blin, O.; Richardson, J.C.; Bordet, R.; Tsolaki, M.; Popp, J.; Peyratout, G.; Martinez-Lage, P.; Tainta, M.; Lleó, A.; Johannsen, P.; Freund-Levi, Y.; Frölich, L.; Vandenberghe, R.; Westwood, S.; Dobricic, V.; Barkhof, F.; Legido-Quigley, C.; Bertram, L.; Lovestone, S.; Streffer, J.; Andreasson, U.; Blennow, K.; Zetterberg, H.; Visser, P.J. Cerebrospinal fluid biomarkers of neurodegeneration, synaptic integrity, and astroglial activation across the clinical Alzheimer's disease spectrum. Alzheimers Dement. 2019, 15, 644–654; [Google Scholar] [CrossRef] [PubMed]
- Magi, S.; Preziuso, A.; Piccirillo, S.; Giampieri, F.; Cianciosi, D.; Orciani, M.; Amoroso, S. The Neuroprotective Effect of L-Carnitine against Glyceraldehyde-Induced Metabolic Impairment: Possible Implications in Alzheimer's Disease. Cells. 2021, 10, 2109; [Google Scholar] [CrossRef]
- Piccirillo, S.; Preziuso, A.; Amoroso, S.; Serfilippi, T.; Miceli, F.; Magi, S.; Lariccia, V. A new K+channel-independent mechanism is involved in the antioxidant effect of XE-991 in an in vitro model of glucose metabolism impairment: Implications for Alzheimer's disease. Cell Death Discov. 2022, 8, 391; [Google Scholar] [CrossRef]
- Uras, G.; Li, X.; Manca, A.; Pantaleo, A.; Bo, M.; Xu, J.; Allen, S.; Zhu, Z. Development of p-Tau Differentiated Cell Model of Alzheimer's Disease to Screen Novel Acetylcholinesterase Inhibitors. Int J Mol Sci. 2022, 23, 14794; [Google Scholar] [CrossRef]
- Suárez-Calvet, M.; Karikari, T.K.; Ashton, N.J.; Lantero, Rodríguez, J.; Milà-Alomà, M.; Gispert, J.D.; Salvadó, G.; Minguillon, C.; Fauria, K.; Shekari, M.; Grau-Rivera, O.; Arenaza-Urquijo, E.M.; Sala-Vila, A.; Sánchez-Benavides, G.; González-de-Echávarri, J.M.; Kollmorgen, G.; Stoops, E.; Vanmechelen, E.; Zetterberg, H.; Blennow, K.; Molinuevo, J.L. ALFA Study. Novel tau biomarkers phosphorylated at T181, T217 or T231 rise in the initial stages of the preclinical Alzheimer's continuum when only subtle changes in Aβ pathology are detected. EMBO Mol Med. 2020, 12, e12921; [Google Scholar] [CrossRef]
- Hirota, Y.; Sakakibara, Y.; Ibaraki, K.; Takei, K.; Iijima, K.M.; Sekiya, M. Distinct brain pathologies associated with Alzheimer's disease biomarker-related phospho-tau 181 and phospho-tau 217 in App knock-in mouse models of amyloid-β amyloidosis. Brain Commun. 2022, 4, fcac286; [Google Scholar] [CrossRef] [PubMed]
- Tahara, N.; Yamagishi, S.; Takeuchi, M.; Honda, A.; Tahara, A.; Nitta, Y.; Kodama, N.; Mizoguchi, M.; Kaida, H.; Ishibashi, M.; Hayabuchi, N.; Matsui, T.; Imaizumi, T. Positive association between serum level of glyceraldehyde-derived advanced glycation end products and vascular inflammation evaluated by [(18)F]fluorodeoxyglucose positron emission tomography. Diabetes Care. 2012, 35, 2618–2625; [Google Scholar] [CrossRef]
- Sakai-Sakasai, A.; Takeda, K.; Suzuki, H.; Takeuchi, M. Structures of Toxic Advanced Glycation End-Products Derived from Glyceraldehyde, A Sugar Metabolite. Biomolecules. 2024, 14, 202; [Google Scholar] [CrossRef]
- Koriyama, Y.; Takagi, Y.; Chiba, K.; Yamazaki, M.; Sugitani, K.; Arai, K.; Suzuki, H.; Kato, S. Requirement of retinoic acid receptor β for genipin derivative-induced optic nerve regeneration in adult rat retina. PLoS ONE. 2013, 8, e71252; [Google Scholar] [CrossRef] [PubMed]
- Koriyama, Y.; Sugitani, K.; Ogai, K.; Kato, S. ; Heat shock protein 70 induction by valproic acid delays photoreceptor cell death by N-methyl-N-nitrosourea in mice. J Neurochem. 2014, 130, 707–719; [Google Scholar] [CrossRef] [PubMed]
- Ooi, H.; Nasu, R.; Furukawa, A.; Takeuchi, M.; Koriyama, Y. Pyridoxamine and Aminoguanidine Attenuate the Abnormal Aggregation of β-Tubulin and Suppression of Neurite Outgrowth by Glyceraldehyde-Derived Toxic Advanced Glycation End-Products. Front Pharmacol. 2022, 13, 921611; [Google Scholar] [CrossRef]
- Koriyama, Y.; Takagi, Y.; Chiba, K.; Yamazaki, M.; Arai, K.; Matsukawa, T.; Suzuki, H.; Sugitani, K.; Kagechika, H.; Kato, S. Neuritogenic activity of a genipin derivative in retinal ganglion cells is mediated by retinoic acid receptor β expression through nitric oxide/S-nitrosylation signaling. J Neurochem. 2011, 119, 1232–1242; [Google Scholar] [CrossRef]
- Yin, Y.; Henzl, M.T.; Lorber, B.; Nakazawa, T.; Thomas, T.T.; Jiang, F.; Langer, R.; Benowitz, L.I. Oncomodulin is a macrophage-derived signal for axon regeneration in retinal ganglion cells. Nat Neurosci. 2006, 9, 843–852; [Google Scholar] [CrossRef]
Disclaimer/Publisher’s Note: The statements, opinions and data contained in all publications are solely those of the individual author(s) and contributor(s) and not of MDPI and/or the editor(s). MDPI and/or the editor(s) disclaim responsibility for any injury to people or property resulting from any ideas, methods, instructions or products referred to in the content. |
© 2024 by the authors. Licensee MDPI, Basel, Switzerland. This article is an open access article distributed under the terms and conditions of the Creative Commons Attribution (CC BY) license (http://creativecommons.org/licenses/by/4.0/).


