1. Introduction
PSC has a strong possibility for future commercialization owing to its high photoconversion efficiency. The current record for a single-junction perovskite solar cell has now reached 23.7% PCE surpassing the mainstream silicon solar cell. Nonetheless, structural defects such as dangling bonds and vacancies are formed at the GBs due to preparation via solution-based process and crystallization at low temperatures (<100 oC) (Han et al., 2018). Dangling bond provide highways for the migration of ionic and molecular species, and also act as charge recombination centres, leading to recombination, hindering charge mobility and extraction, decreasing photovoltaic performance (Shao et al., 2016). Perovskite films are liable to attack from moisture within GBs, leading to decomposition and poor device stability (Jiang et al., 2016). Because of this, many efforts have been sought to passivate GBs and interfaces to modify the efficiency of PSCs (Yang et al., 2018).
Reports have shown that self-passivation using excess PbI2 and CH3NH3I reduced recombination loss at GBs (Son et al., 2016). But then, these self-passivation methods are sensitive to the preparation conditions, resulting in difficulties associated with reproducibility (Yang et al., 2019). Other studies showed that excess PbI2 are detrimental to the overall PCE (Tumen-Ulzii et al., 2020). Many other passivation agents have been developed to improve the performance. Organic Lewis acids and bases such as buckminsterfullerene () (Wang et al., 2014), (6,6)-phenyl--butyric acid and methyl ester (PCBM) (Shao et al., 2014) have efficiently reduced the recombination centres in perovskite films leading to increased enhancement in photovoltaic performance. Also, inorganic transition oxide materials such as NiO, Cr2O4, ZrO2, Ag and MnO2 have a proven passivation capabilities owing to their astonishing structural modularity, straightforward application methods and versatile passivation influences (Gao et al., 2022). MnO2 has an attractive renewed interest as a promising material owing its high energy density, high theoretical capacitance and completely astonishing structural modularity (Markus et al., 2023). Here, combining graphite and MnO2 nanoparticle can improve the photovoltaic performance of PSCs
2. Theoretical Consideration
The band gap of perovskite film is calculated by Tauc’s plot (Awodugba
et al., 2011) which is expressed as:
The grain size of the perovskite was calculated using intercept technique, given as (Cheng
et al., 2018):
where a is the number of intersection, and b is the actual length of the line. However, actual length is the ratio of the measured length by the magnification
For the determination of interplanar distance Bragg’s law was used
Here is the one half of peak diffraction angle or Bragg’s angle, d is the interplanar distance, represents the Cu K(α) wavelength, which in our case is 1.5418 A and n is the mode of vibration.
The crystallite size (L) was determined from the Scherrer equation
where K is the Scherrer constant (0.9),
is the wavelength and
is the full width (in radians) of the peak at the half maximum (FWHM) intensity and
is the one half of peak diffraction angle or Bragg’s angle.
Lattice stain (ɛ) of the materials was calculated by the relation
is the one half of peak diffraction angle or Bragg’s angle and ɛ is the lattice strain.
The dislocation density δ was calculated using the relation
where δ is the dislocation density and L is the crystallite size
The number of reduced graphene oxide layer was calculated using the relation
where
is the d-spacing,
is the number of reduced graphene oxide layer and
is the crystallite size.
To measure the efficiency of a solar cell, the current density of a device is obtained as a function of applied voltage. Such a curve provides the parameters required to calculate efficiency (Walton, Wynne (2018))
where ƞ is efficiency,
Pout is the output power of a device,
Pin the input power of the incident light,
Jsc is the short-circuit current density.
Voc is the open-circuit voltage, and FF is a fill factor
where
Jmp, and
Vmp are the current density and voltage of the device at its maximum power point, where the value of
J ×
V is at its maximum in the
JV curve. Therefore, to design a high-efficiency solar cell, one may aim to improve the
Jsc,
Voc, or FF.
3. Materials and Methods
3.1. Materials
Lead (II) iodide (PbI2) 98% purity, titanium isopropoxide (C12H28O4Ti) 96% purity, methyl ammonium iodide (CH3NH3I) 98% purity, graphite, potassium per manganese (KMnO4) 96% purity, dimethyl formamide (DMF) 97% purity, isopropanol (CH3CH(OH)CH3) 99% purity, ethanol (CH3CH2OH) 99% purity, hydrochloric acid (HCl) 97% purity, hydrogen tetraoxosulphate (VI) acid (H2SO4) 97% purity indium doped tin oxide (ITO) glass and detergent were purchased from commercial suppliers (Fisher Scientific or Sigma-Aldrich).
3.2. Experimental Method
3.2.1. Synthesis of Methyl Ammonium Lead Triiodide (CH3NH3PbI3)
Lead (II) iodide (PbI
2) was preheated for 10 minutes at 100
oC to evaporate possible humidity within. First, in a process to dissolve PbI
2, 578 mg of it and 200 mg of methyl ammonium iodide (CH
3NH
3I) were mixed with 1 mL of DMF in a test tube and heated 250
oC. This temperature was maintained until PbI
2 completely dissolved. The solution was stirred to prevent crystallization of PbI
2. Face mask would be used as safety precaution to prevent the harmful hazard of lead. The perovskite solution was prepared prior to its used because CH
3NH
3I is extremely sensitive to moisture.
3.2.2. Synthesis of Titanium Dioxide (TiO2)Nanoparticles
0.4M of Titanium Isopropoxide was mixed with 1.4M of acetyl acetone and stirred manually for 5 minutes.0.2M of ethanol was then be added to the mixture, and stirred for another 5 minutes. Acetyl acetonate served as stabilizer.
3.2.3. Synthesis of RGO Nanoparticles
At first, the mixture of 5g of graphite and 15g of potassium per manganese was added slowly to 400mL of 0.5 M hydrogen tetraoxosulphate (VI) acid solution in a three neck flask. The mixture was simultaneously stirred and heated at 50 oC for 2 hours using a magnetic stirrer hot plate (modl 78-1). After complete mixing of the solution, 3mL of hydrogen peroxide and 200g of ice was added to the solution to stop the reaction. Thereafter, the mixture was filtered using a filter paper. The residue was then washed with 200mL of distilled water to neutralize the pH and 200mL of 3.2 M hydrochloric acid to remove metal ions. Afterward, 200 mL of ethanol was added to dry the RGO nanoparticles.
3.2.4. Synthesis of MnO2 Nanoparticles
12 mL of ethanol (CH3CH2OH) 99% purity, was added slowly to 12 mL of distilled water in a three neck flask, and the mixture was added to 6 mL of 0.5 M potassium permanganate (KmnO4) solution. The mixture was stirred for 5 minutes using a magnetic stirrer. Thereafter, 3mL of hydrogen peroxide was added as reducing agent and stirred for another 5 minutes to prevent agglomeration. Thereafter, the mixture was filtered using a filter paper. The residue was then washed with 100 mL of ethanol was added to dry the MnO2 nanoparticles.
3.2.5. Glass/ITO/RGO/TiO2/CH3NH3I3/Graphite- MnO2 Device Fabrication
The ITO glass slides was cleaned using standard glass cleaning agents in base bath (cleaning agents: deionized water, 1:20), followed by rinsing with deionized water, propanol and ethanol. The glass slides were then dried in an ovum. 2.00 M TiO2 solution was be prepared in ethanol. One layer of TiO2 was deposited on the ITO slide glass through spin-coating process (2000 rpm for 30 s) and annealed at 400oC for 1 hr.1.00 M of RGO was prepared in ethanol. One layer of TiO2 was spin-coated at 2000 rpm for 30 s and annealed at 400oC for 1 hr. A solution of 578 mg of PbI2 and 200 mg of CH3NH3I in 1 mL of DMF was prepared, heated at 250oC, and deposited via spin coating steps (2000 rpm for 20 s, 2000 rpm for 10 s). The CH3NH3I3 was allowed to dry for 1 hr. 1.00 M of MnO2 was prepared in ethanol and 1mL of it was mixed with 5 mL of a solution of 0.006g graphite in 0.04g of ethanol. Afterward enhanced graphite was deposited by spin coating (2000 rpm for 30 s).
3.2.6. Glass/ITO/RGO/TiO2/CH3NH3I3/Graphite Device Fabrication
The ITO glass slides was cleaned using standard glass cleaning agents in base bath (cleaning agents: deionized water, 1:20), followed by rinsing with deionized water, propanol and ethanol. The glass slides were then dried in an ovum. 2.00 M TiO2 solution was be prepared in ethanol. One layer of TiO2 was deposited on the ITO slide glass through spin-coating process (2000 rpm for 30 s) and annealed at 400oC for 1 hr.1.00 M of RGO was prepared in ethanol. One layer of TiO2 was spin-coated at 2000 rpm for 30 s and annealed at 400oC for 1 hr. A solution of 578 mg of PbI2 and 200 mg of CH3NH3I in 1 mL of DMF was prepared, heated at 250oC, and deposited via spin coating steps (2000 rpm for 20 s, 2000 rpm for 10 s). The CH3NH3I3 was allowed to dry for 1 hr. Afterward enhanced graphite was deposited by spin coating (2000 rpm for 30 s) from a solution of 0.006g graphite in 0.04g of ethanol.
3.3. Characterization of the Films
The Ultraviolet-visible spectrophotometer (Lambda 950) was used to study the optical properties such as intensity and wavelength of the absorption spectral of the formed films. X-ray diffraction patterns were obtained with Rigaku D/Max-lllC X-ray diffractometer developed by the Rigaku Int. Corp. Tokyo, Japan, and set to produce diffractions at scanning rate of 2 o/min in the 2 to 50o at room temperature with a CuKa radiation set at 40kV and 20mA. Scanning electron microscopy (SEM) images were acquired using a JEOL JSM-6010LV microscope at an accelerating voltage of 15 KV, and a working distance of 11 mm. All spectra were recorded from 4000 to 400 cm-1 using the Pelkin Elmer 3000 MX spectrometer. Scans were 32 per spectrum with a resolution of 4 cm1.The IR spectra were analysed using the spectroscopic software Win-IR Pro Version 3.0 with a peak sensitivity of 2 cm-1.
4. Results
4.1.1. Optical Characterization of CH3NH3PbI3
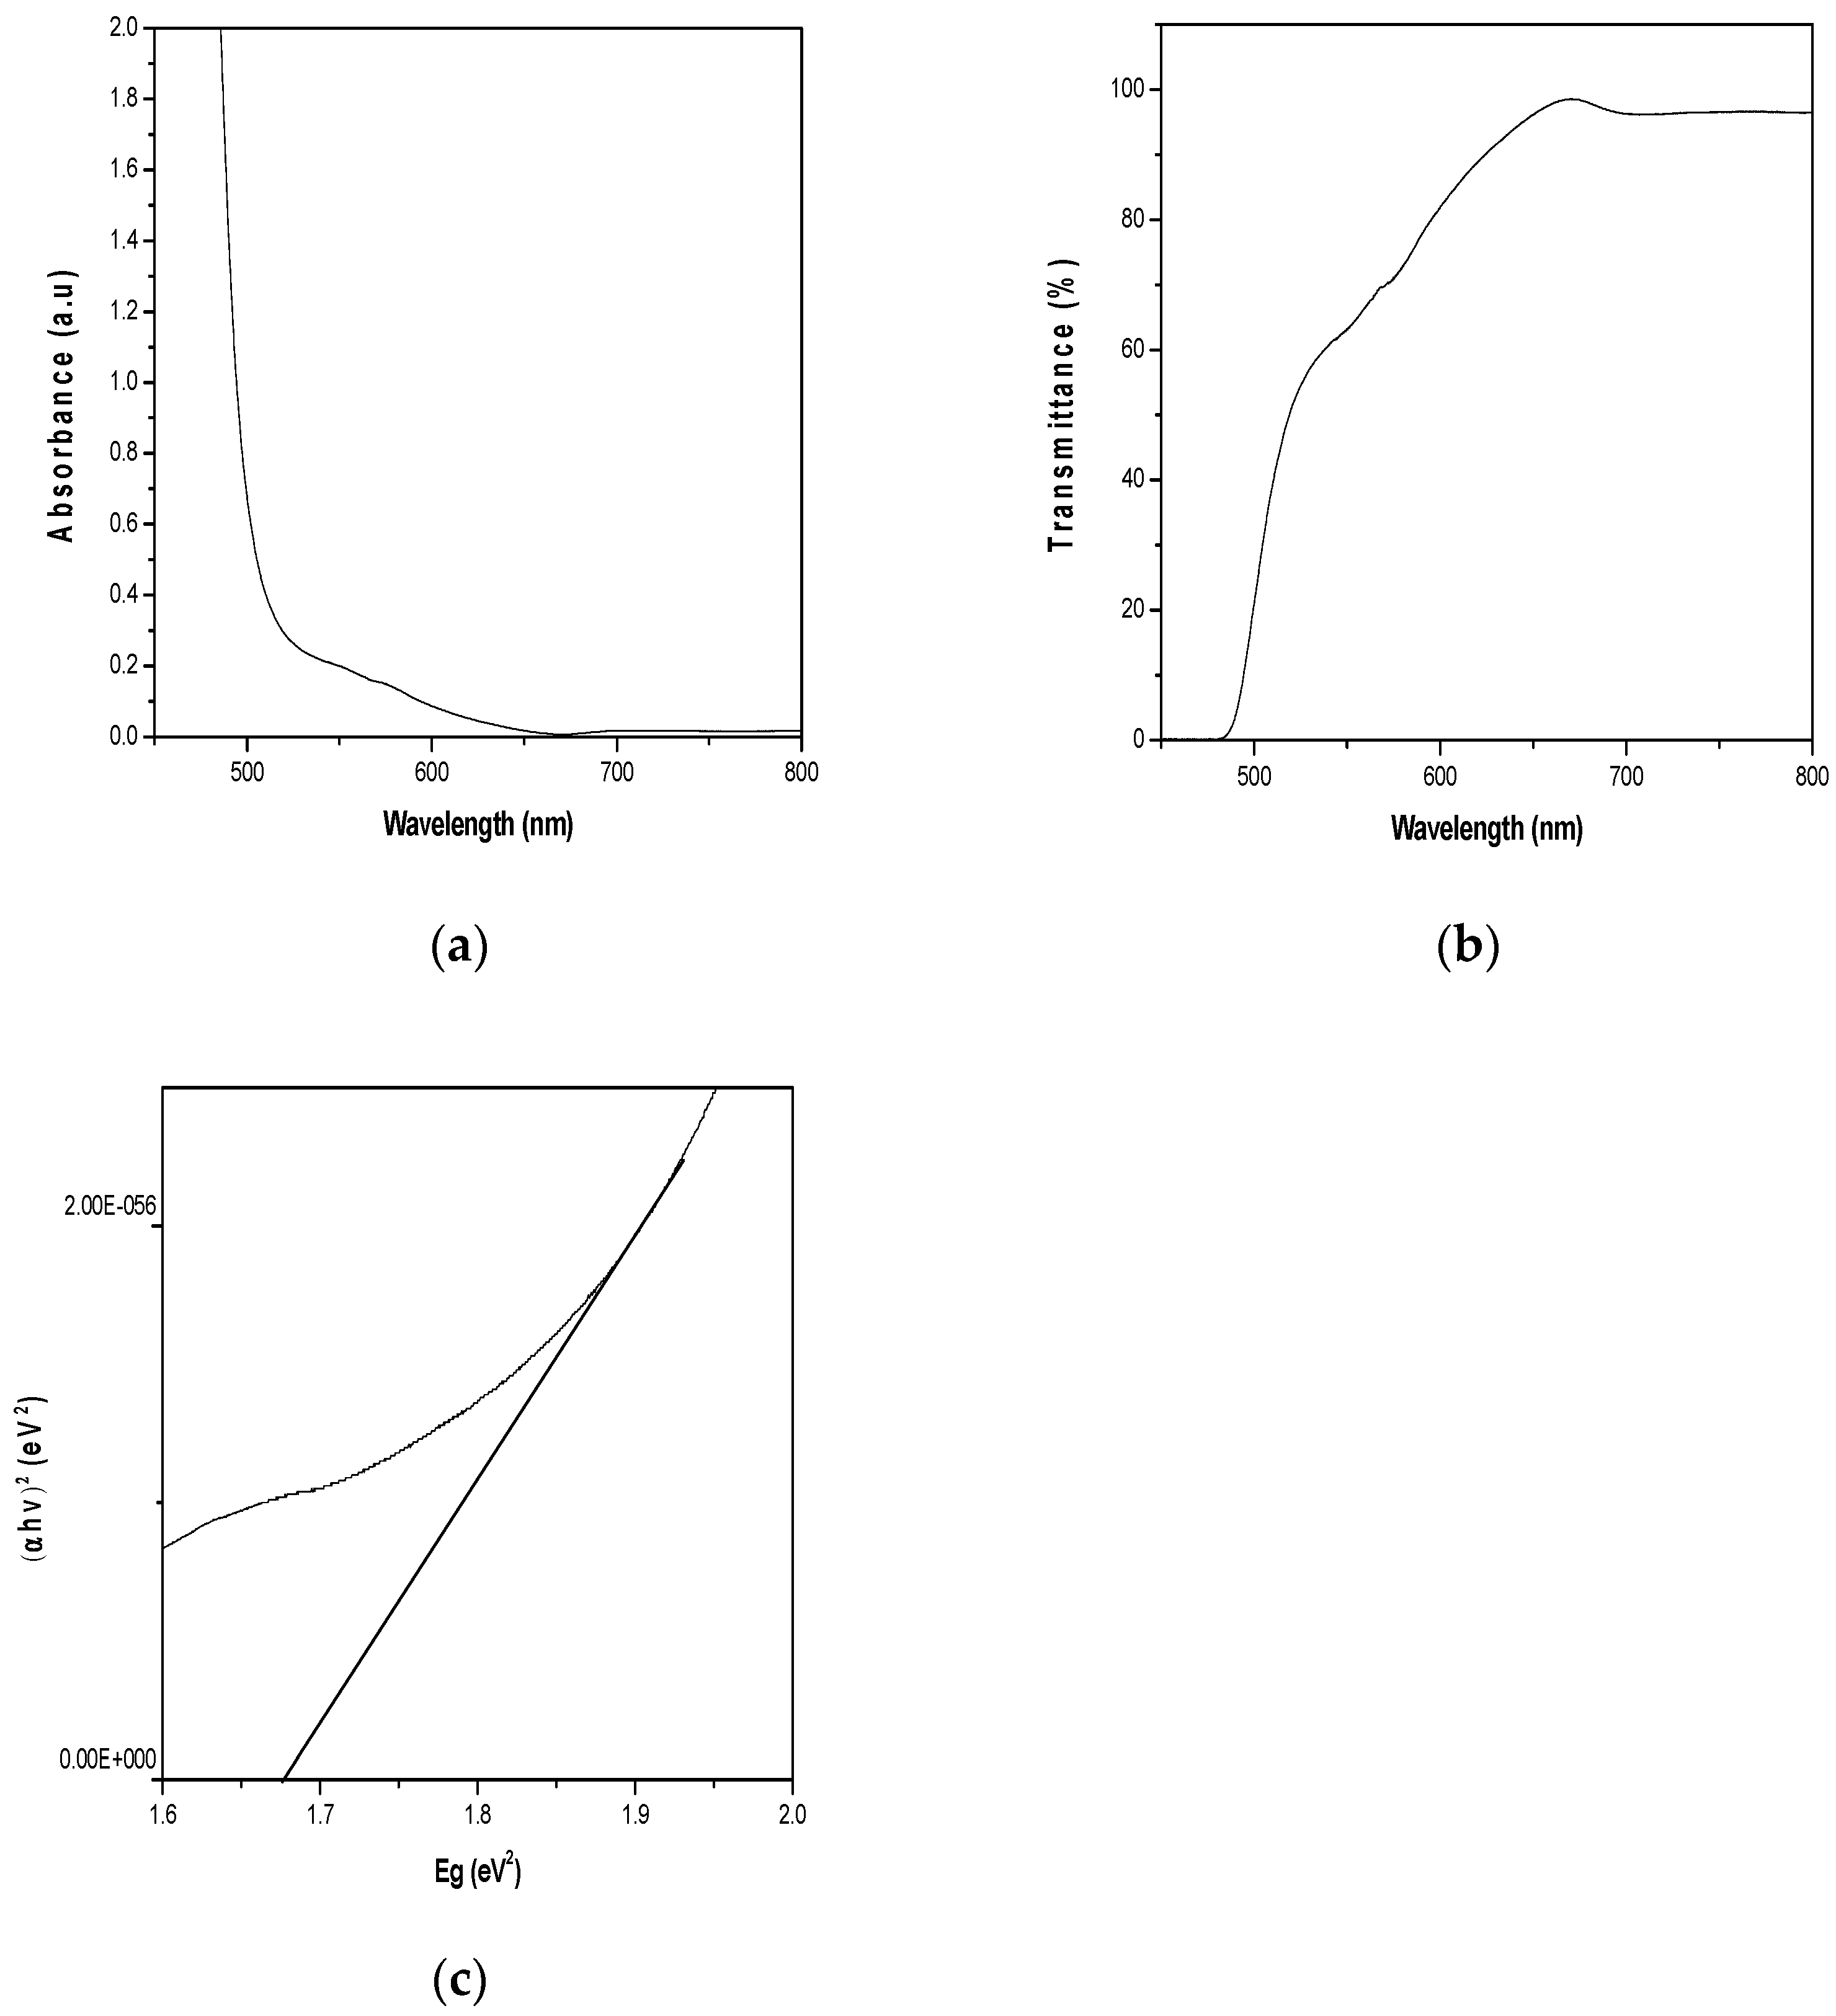
Figure 1a shows absorbance-wavelength plot of CH
3NH
3PbI
3 with its distinct absorption edges. It is clear that the absorption onset systemically located at 652 nm. Besides, the graph reveals another absorbance peaks corresponding to 722 nm. This shows that CH
3NH
3PbI
3 absorbs within the visible region with longer wavelength range of between 395-800 nm. Transmittance-wavelength plot in
Figure 1b clearly shows the transmittance onset at 485 nm. The plot shows gradual increase in transmittance between the wavelength range of 485 nm -650 nm, and transmits steadily within the visible region of solar spectrum with longer wavelength range between 500 - 800 nm. The bandgap of the synthesized CH
3NH
3PbI
3 film in
Figure 1c is 1.67 eV. The bandgap value of 1.67 eV for perovskite is within the acceptable range 1.6 - 1.9 eV (Masclocene et al., 2021)
Figure 1.
(a)Absorbance-wavelength plot of CH3NH3PbI3 (b) Transmittance-wavelength plot of CH3NH3PbI3 (c) (αhv)2-Eg plots of CH3NH3PbI3.
Figure 1.
(a)Absorbance-wavelength plot of CH3NH3PbI3 (b) Transmittance-wavelength plot of CH3NH3PbI3 (c) (αhv)2-Eg plots of CH3NH3PbI3.
4.1.2. FTIR Characterization of CH3NH3PbI3 Film
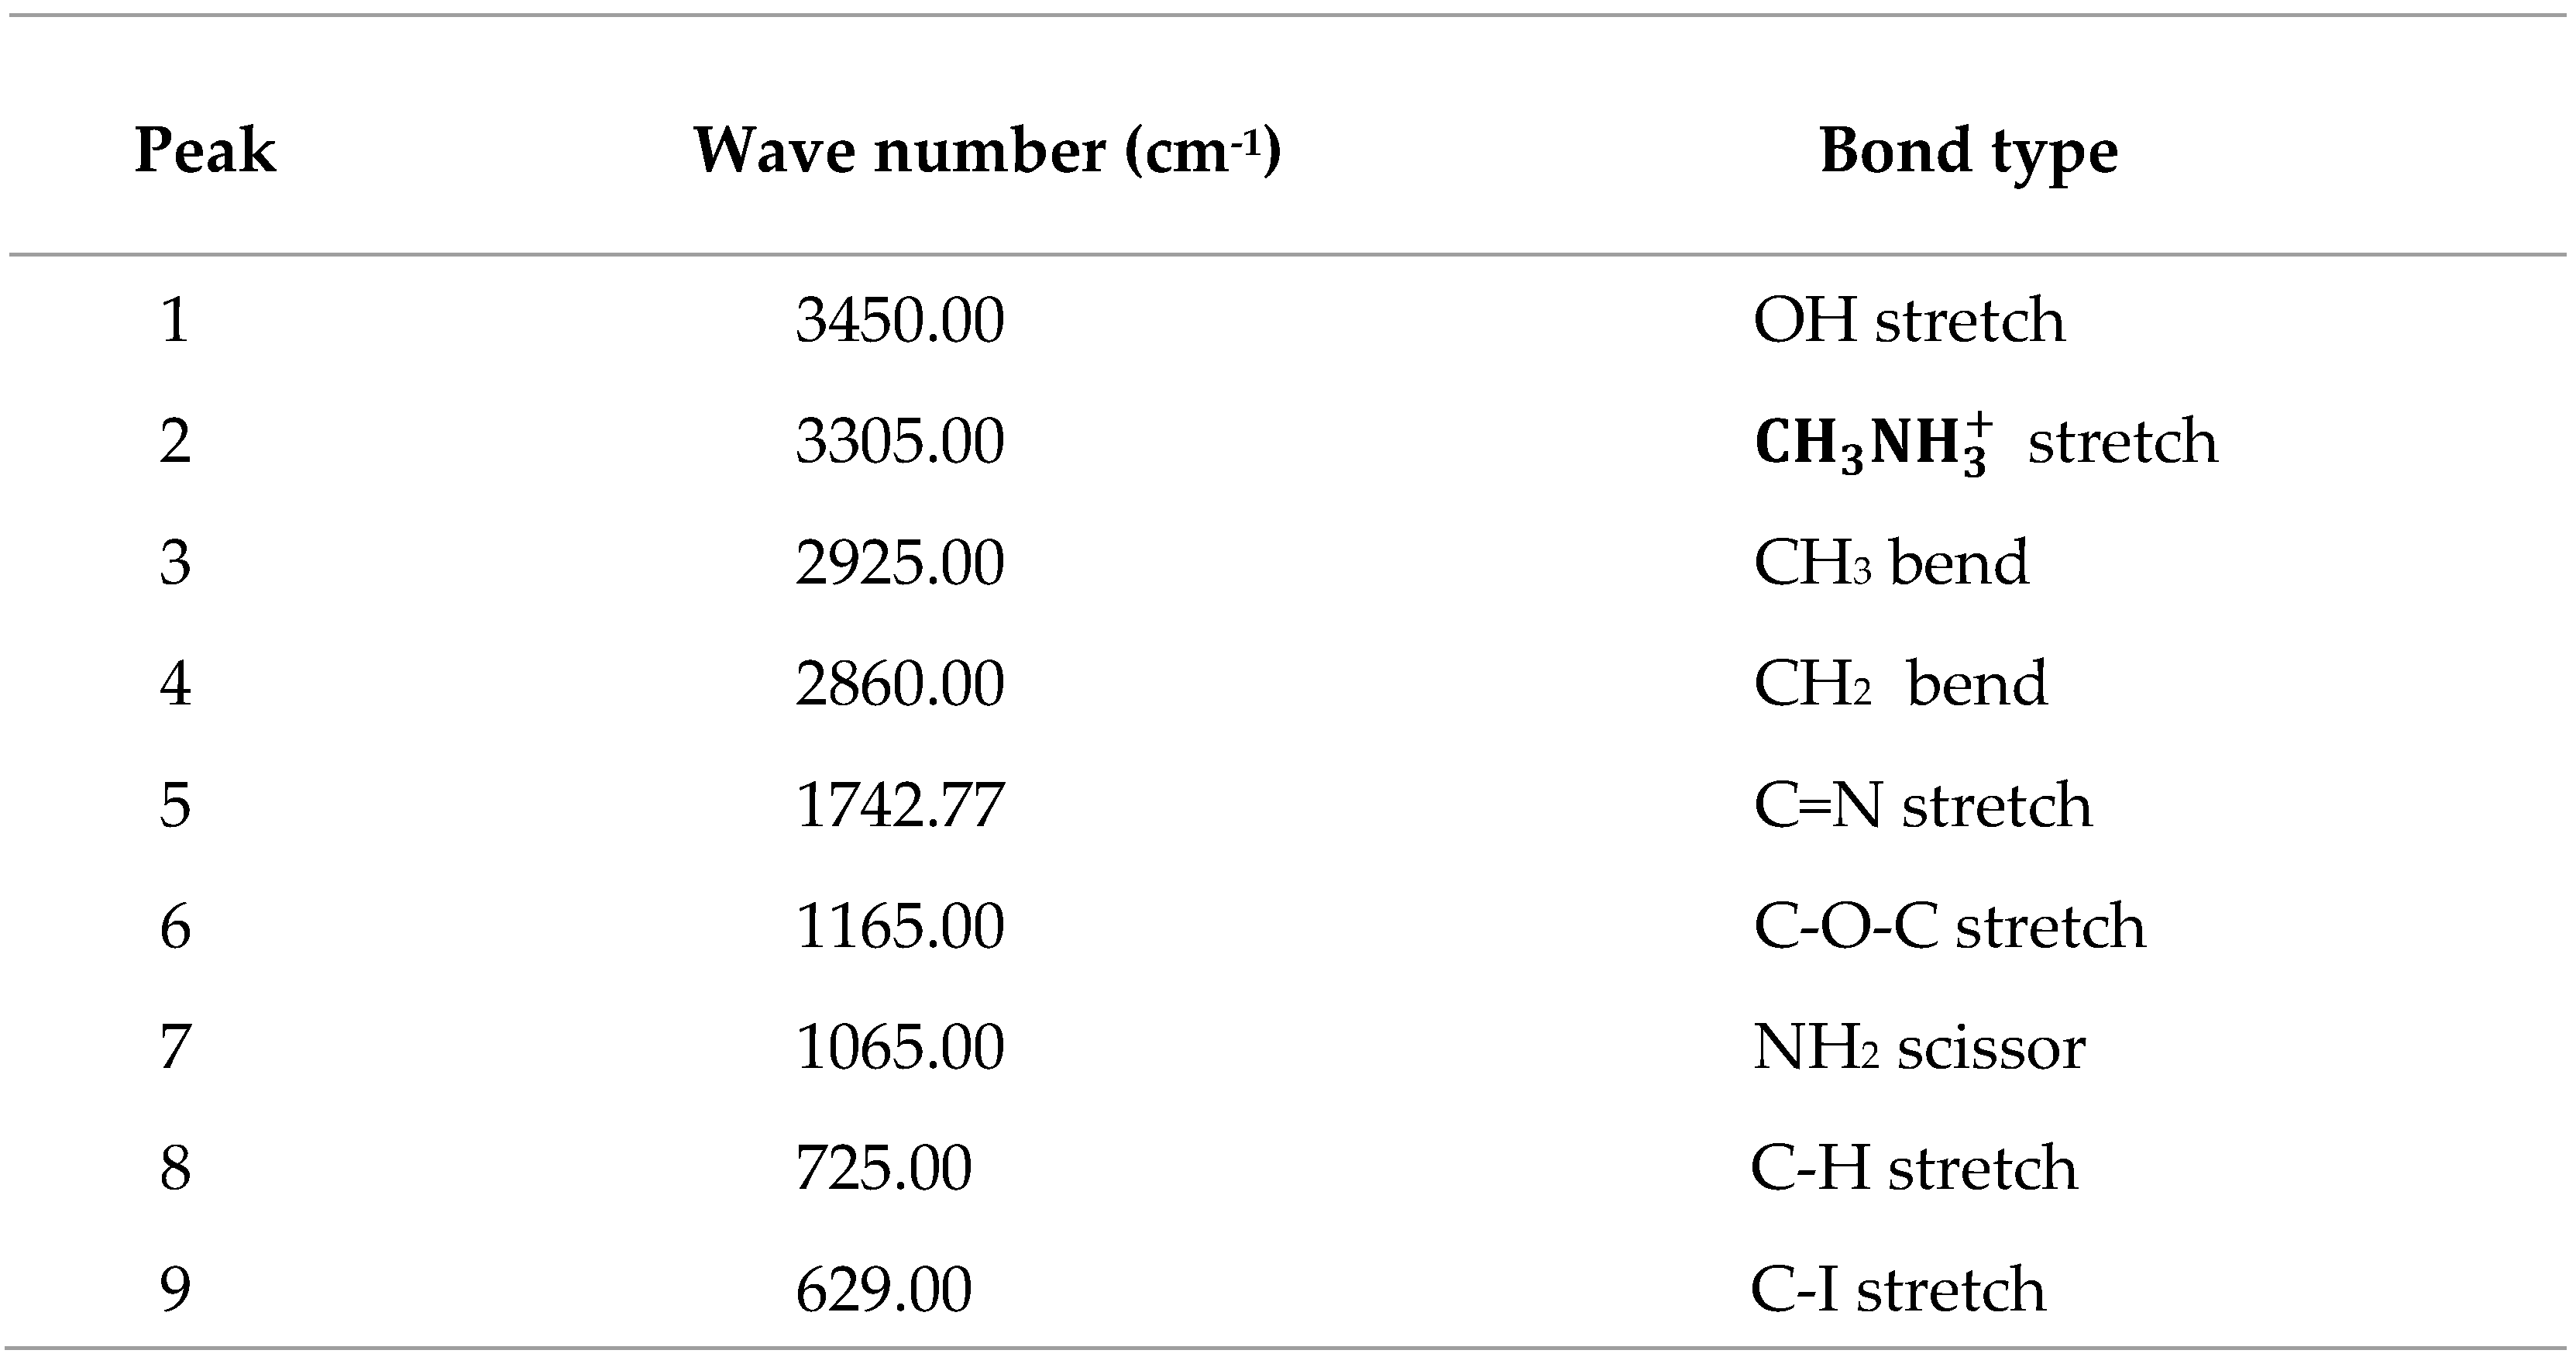
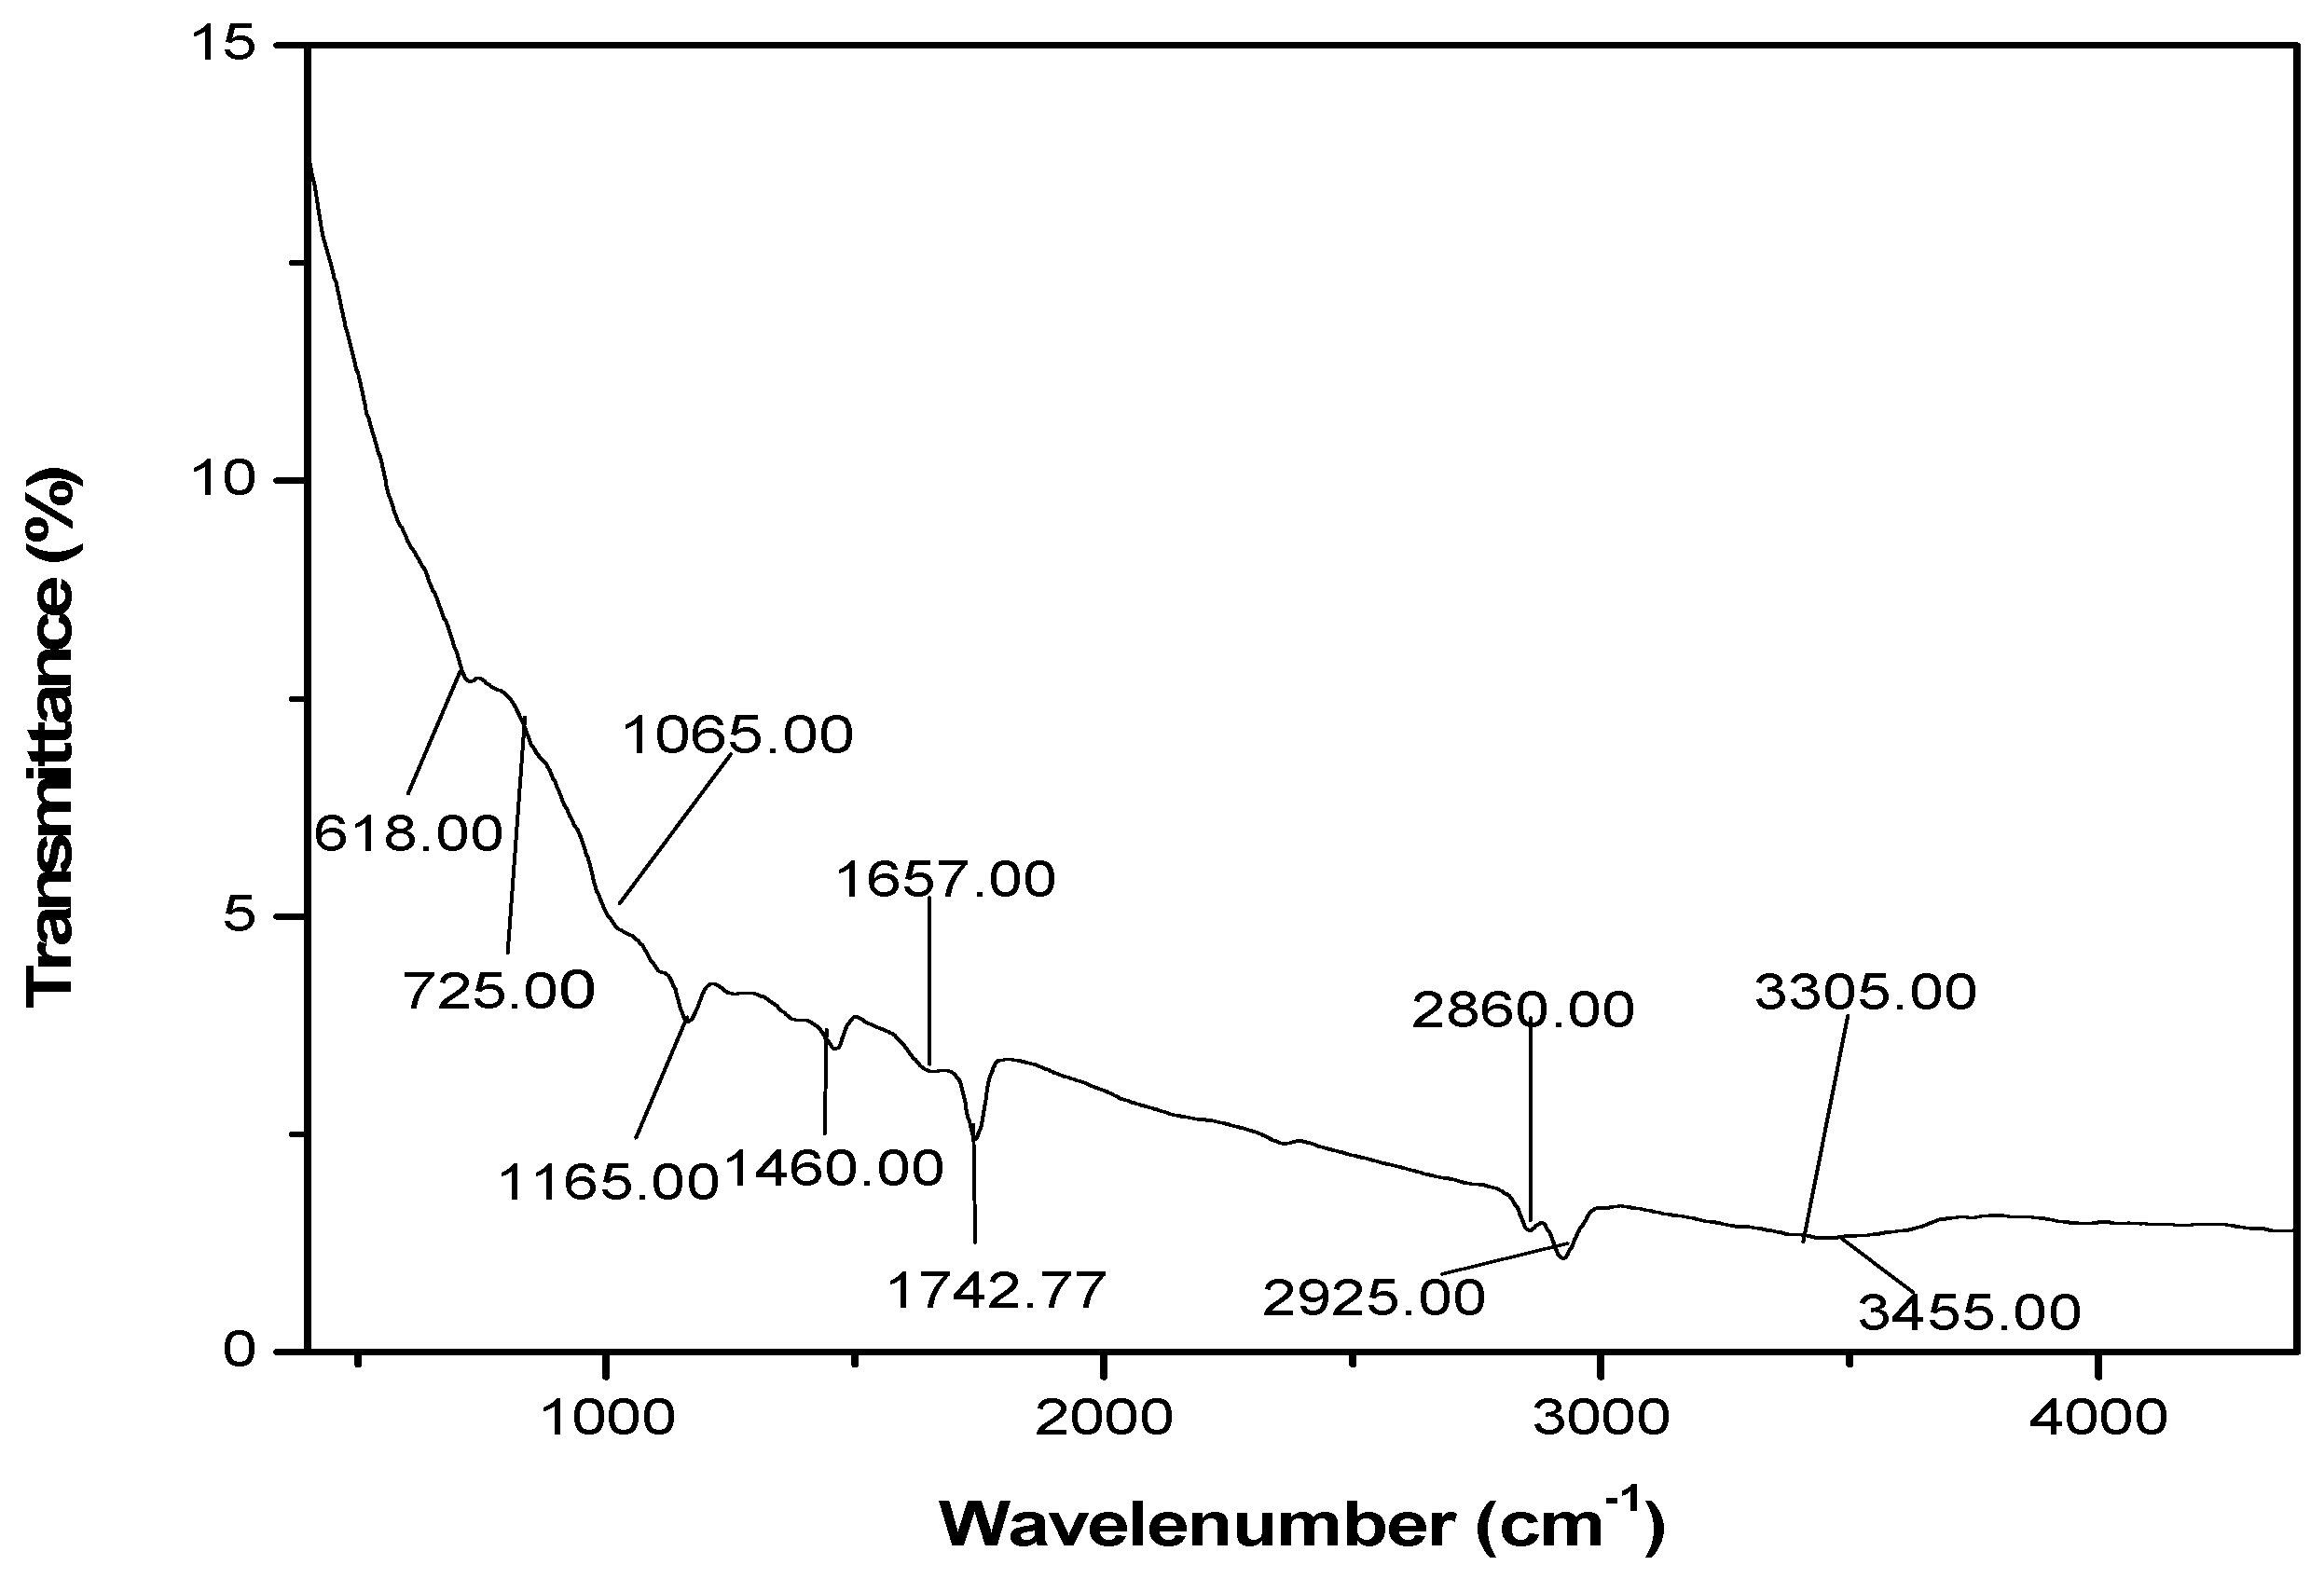
Several molecular vibration frequencies are identified which include (,1029.00 cm-1), C=N (VC=N, 1742.77 cm-1), C-C (VC-C, 726.26 cm-1), C-H (VC-H, 2924.00 and 2857.00 cm-1), C-O-C (VC-O-C, 1165.00 cm-1), NH2 ( cm-1) and O-H (VC-OH,3455.00 cm-1). These functional groups are in keeping with cubic phase of CH3NH3PbI3 halide perovskite.
Table 1.
Summary of bondtypes and wavenumbers in CH3NH3PbI3 FTIR spectrum.
Table 1.
Summary of bondtypes and wavenumbers in CH3NH3PbI3 FTIR spectrum.
Figure 2.
FTIR spectra of CH3NH3PbI3 film showing bond type and wavenumber.
Figure 2.
FTIR spectra of CH3NH3PbI3 film showing bond type and wavenumber.
4.1.3. XRD Characterization of CH3NH3PbI3 Halide Perovskite Film
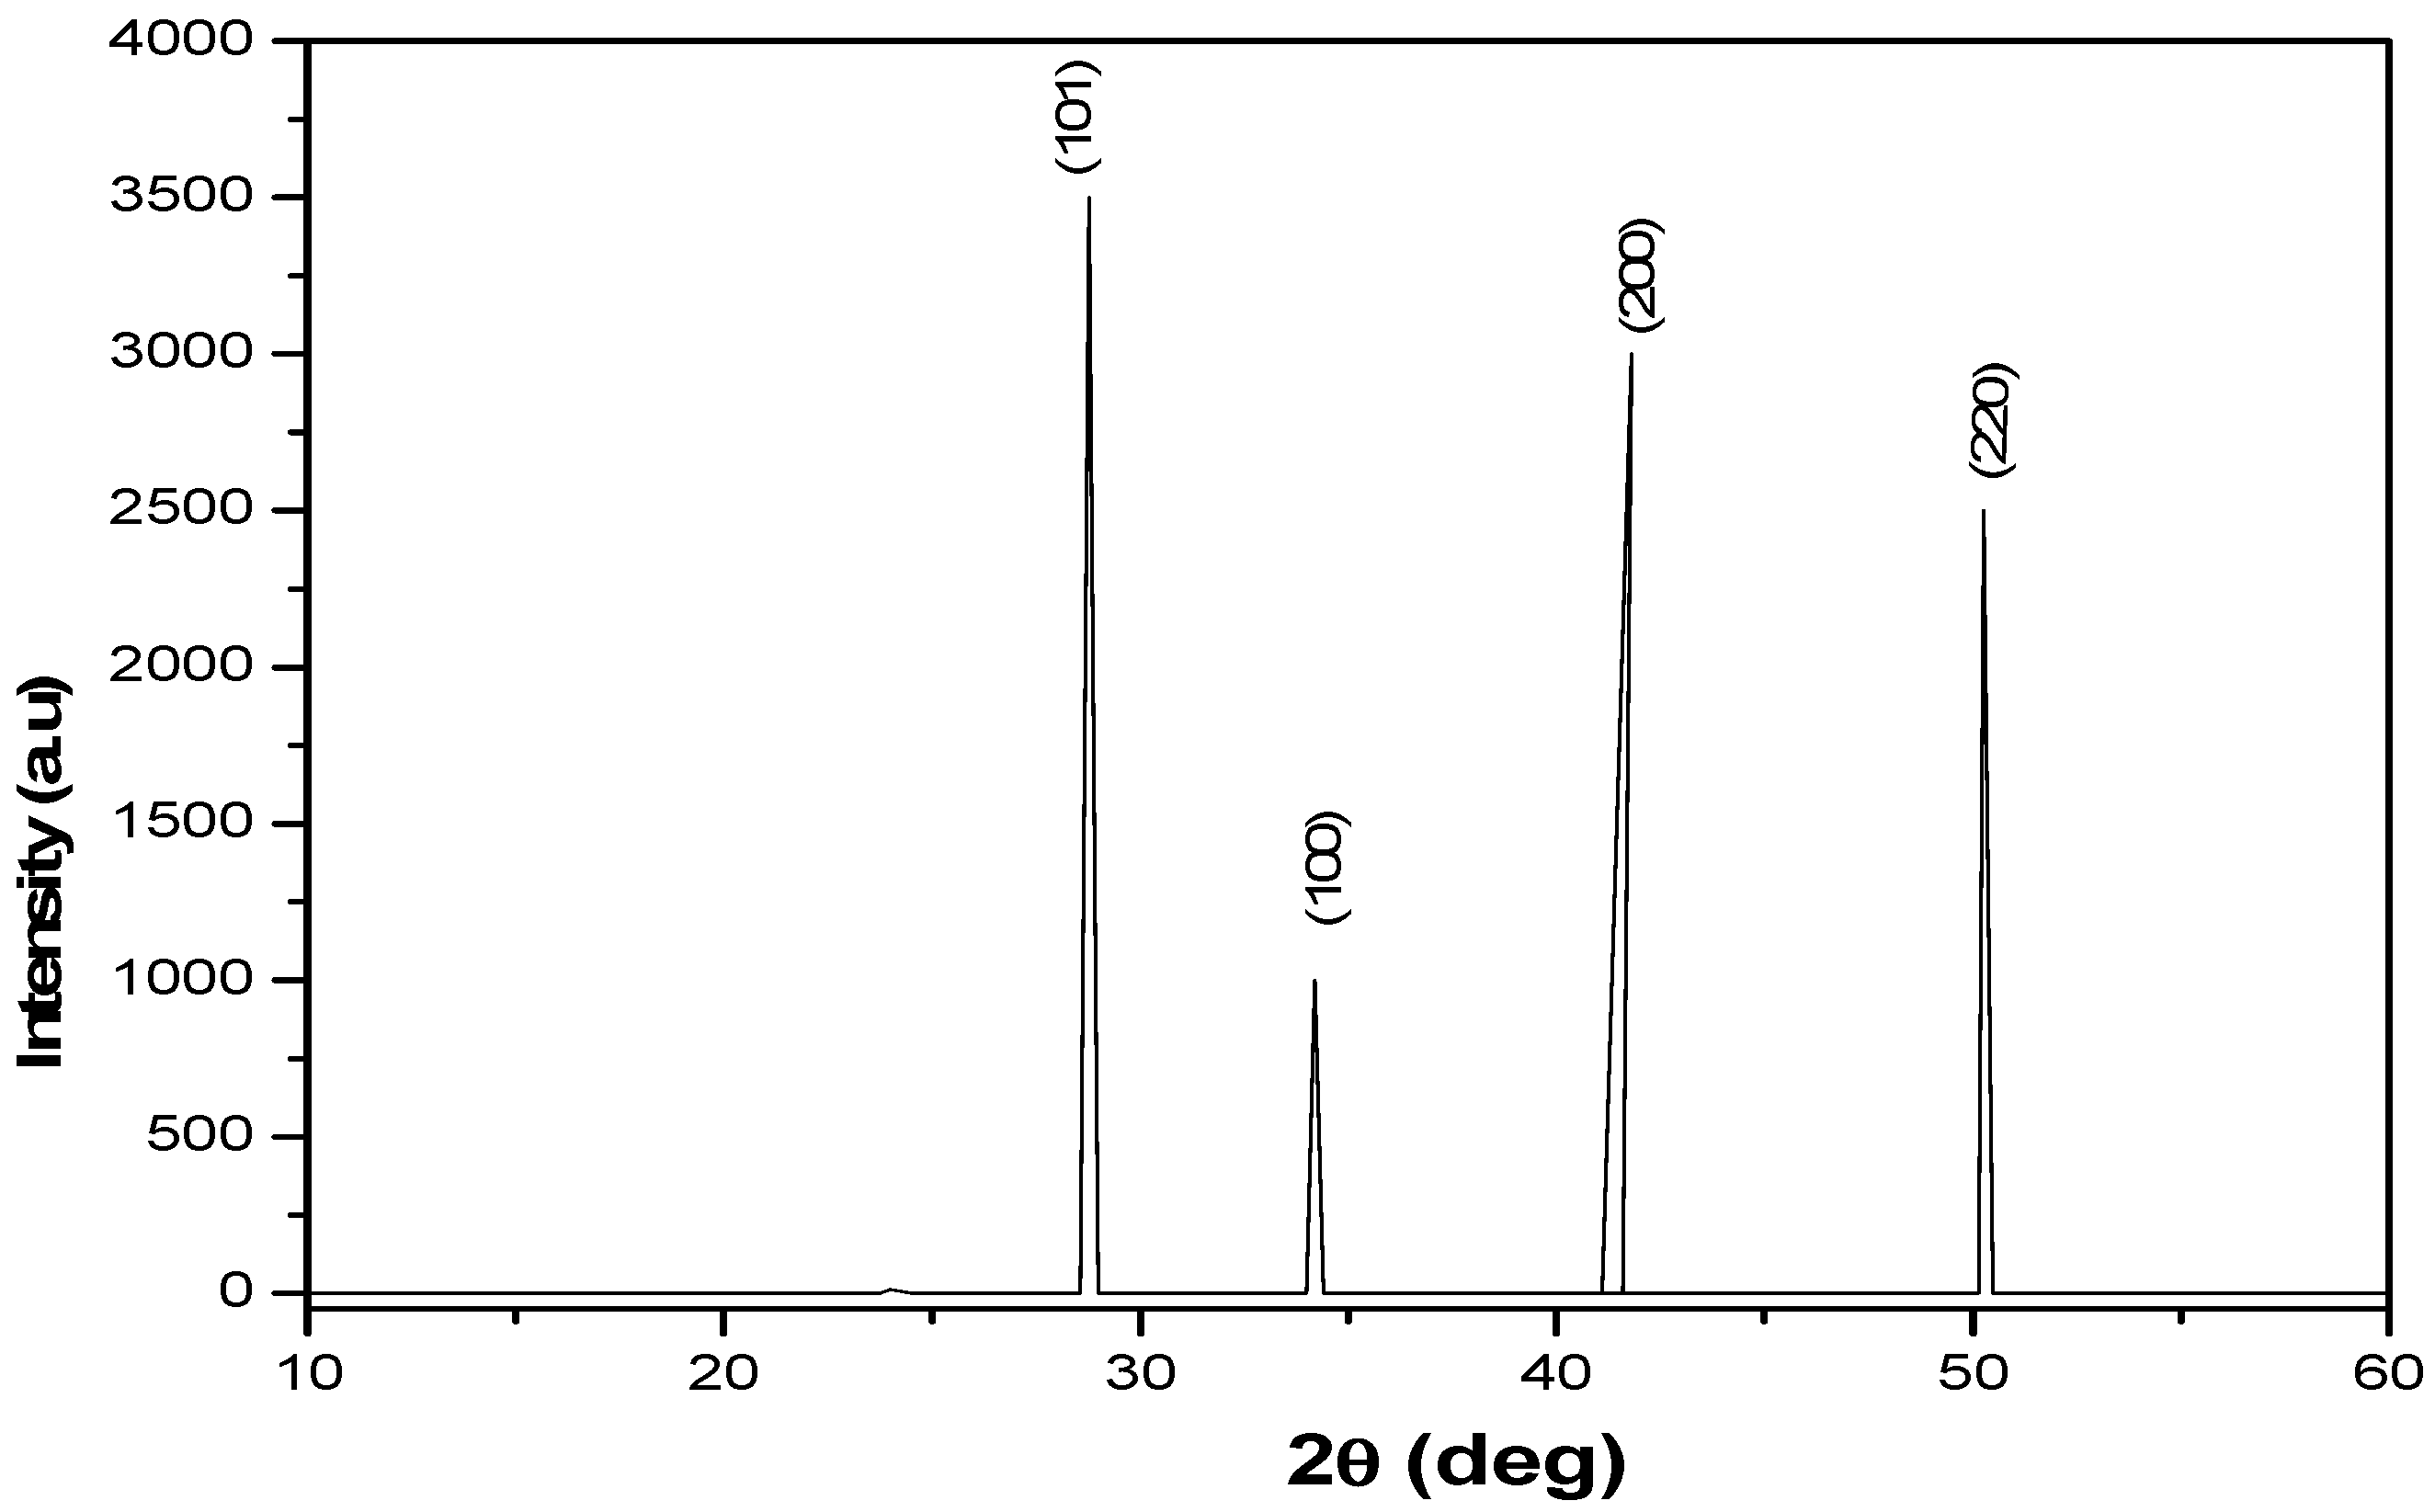
XRD measurements were performed and results are shown in
Figure 3. The most prominent perovskite peak is at the (101) reflection, observed at 2θ =28.8
o compatible with a single- crystalline phase. Three other strong diffraction peaks are located at 32.0
o, 45.4
o and 56.1
o corresponding to the (100), (200) and (220) crystal planes of cubic phase CH
3NH
3PbI
3 halide perovskite respectively. Additionally, the presence of peaks at 28.8
o and 45.4
o indicates presence of CH
3NH
3I crystallization in perovskite films, supporting the conversion of the precursor materials into CH
3NH
3PbI
3 films, and the appearance of the diffraction angles 28.8
o.confirmed cubic phase CH
3NH
3PbI
3 halide perovskite. From the data in
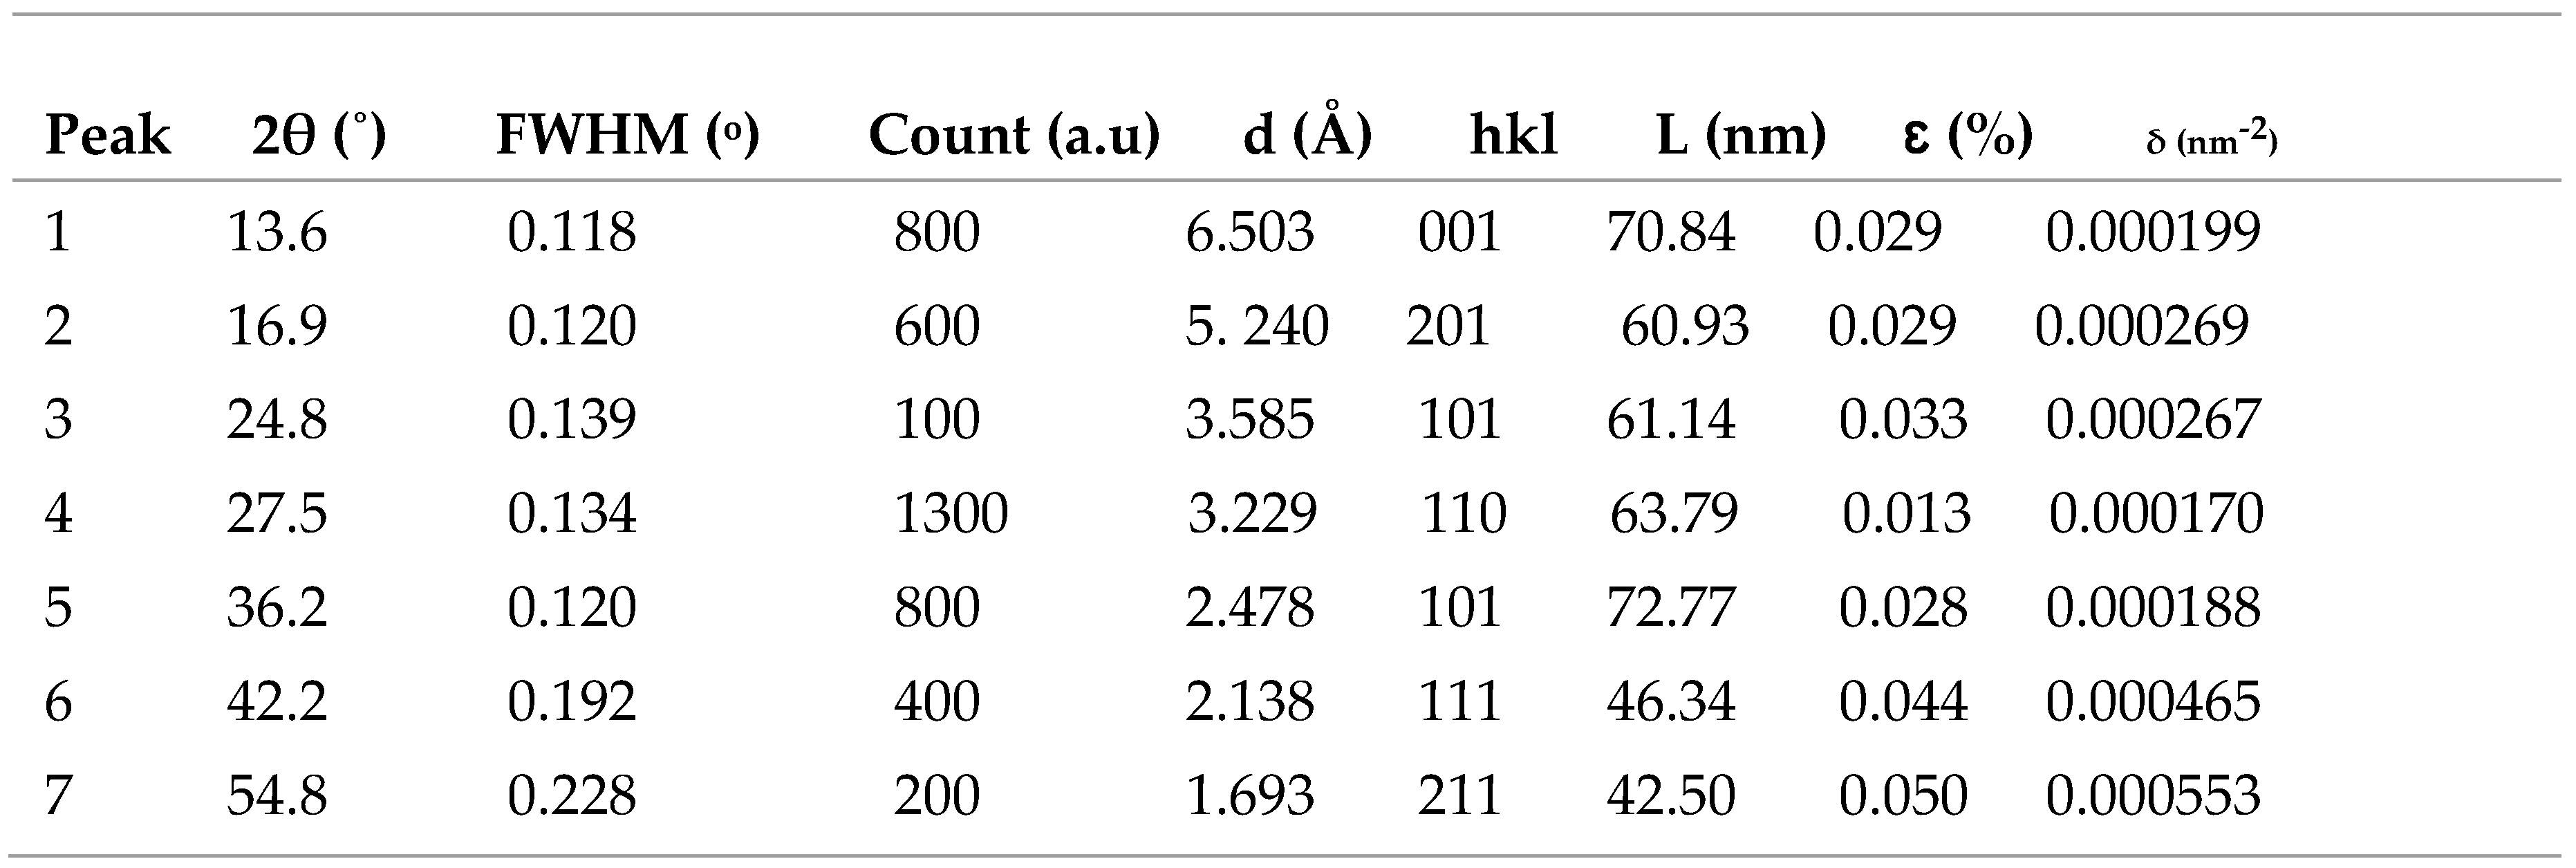
Table 2, the average crystallite size and d-spacing were calculated to be ̴ 7.86 nm and ̴ 1.79 Å respectively.
Table 2.
Structural parameters of in CH3NH3PbI3 film.
Table 2.
Structural parameters of in CH3NH3PbI3 film.
Figure 3.
XRD pattern of CH3NH3PbI3 film.
Figure 3.
XRD pattern of CH3NH3PbI3 film.
4.1.4. SEM Analysis of CH3NH3PbI3 Film
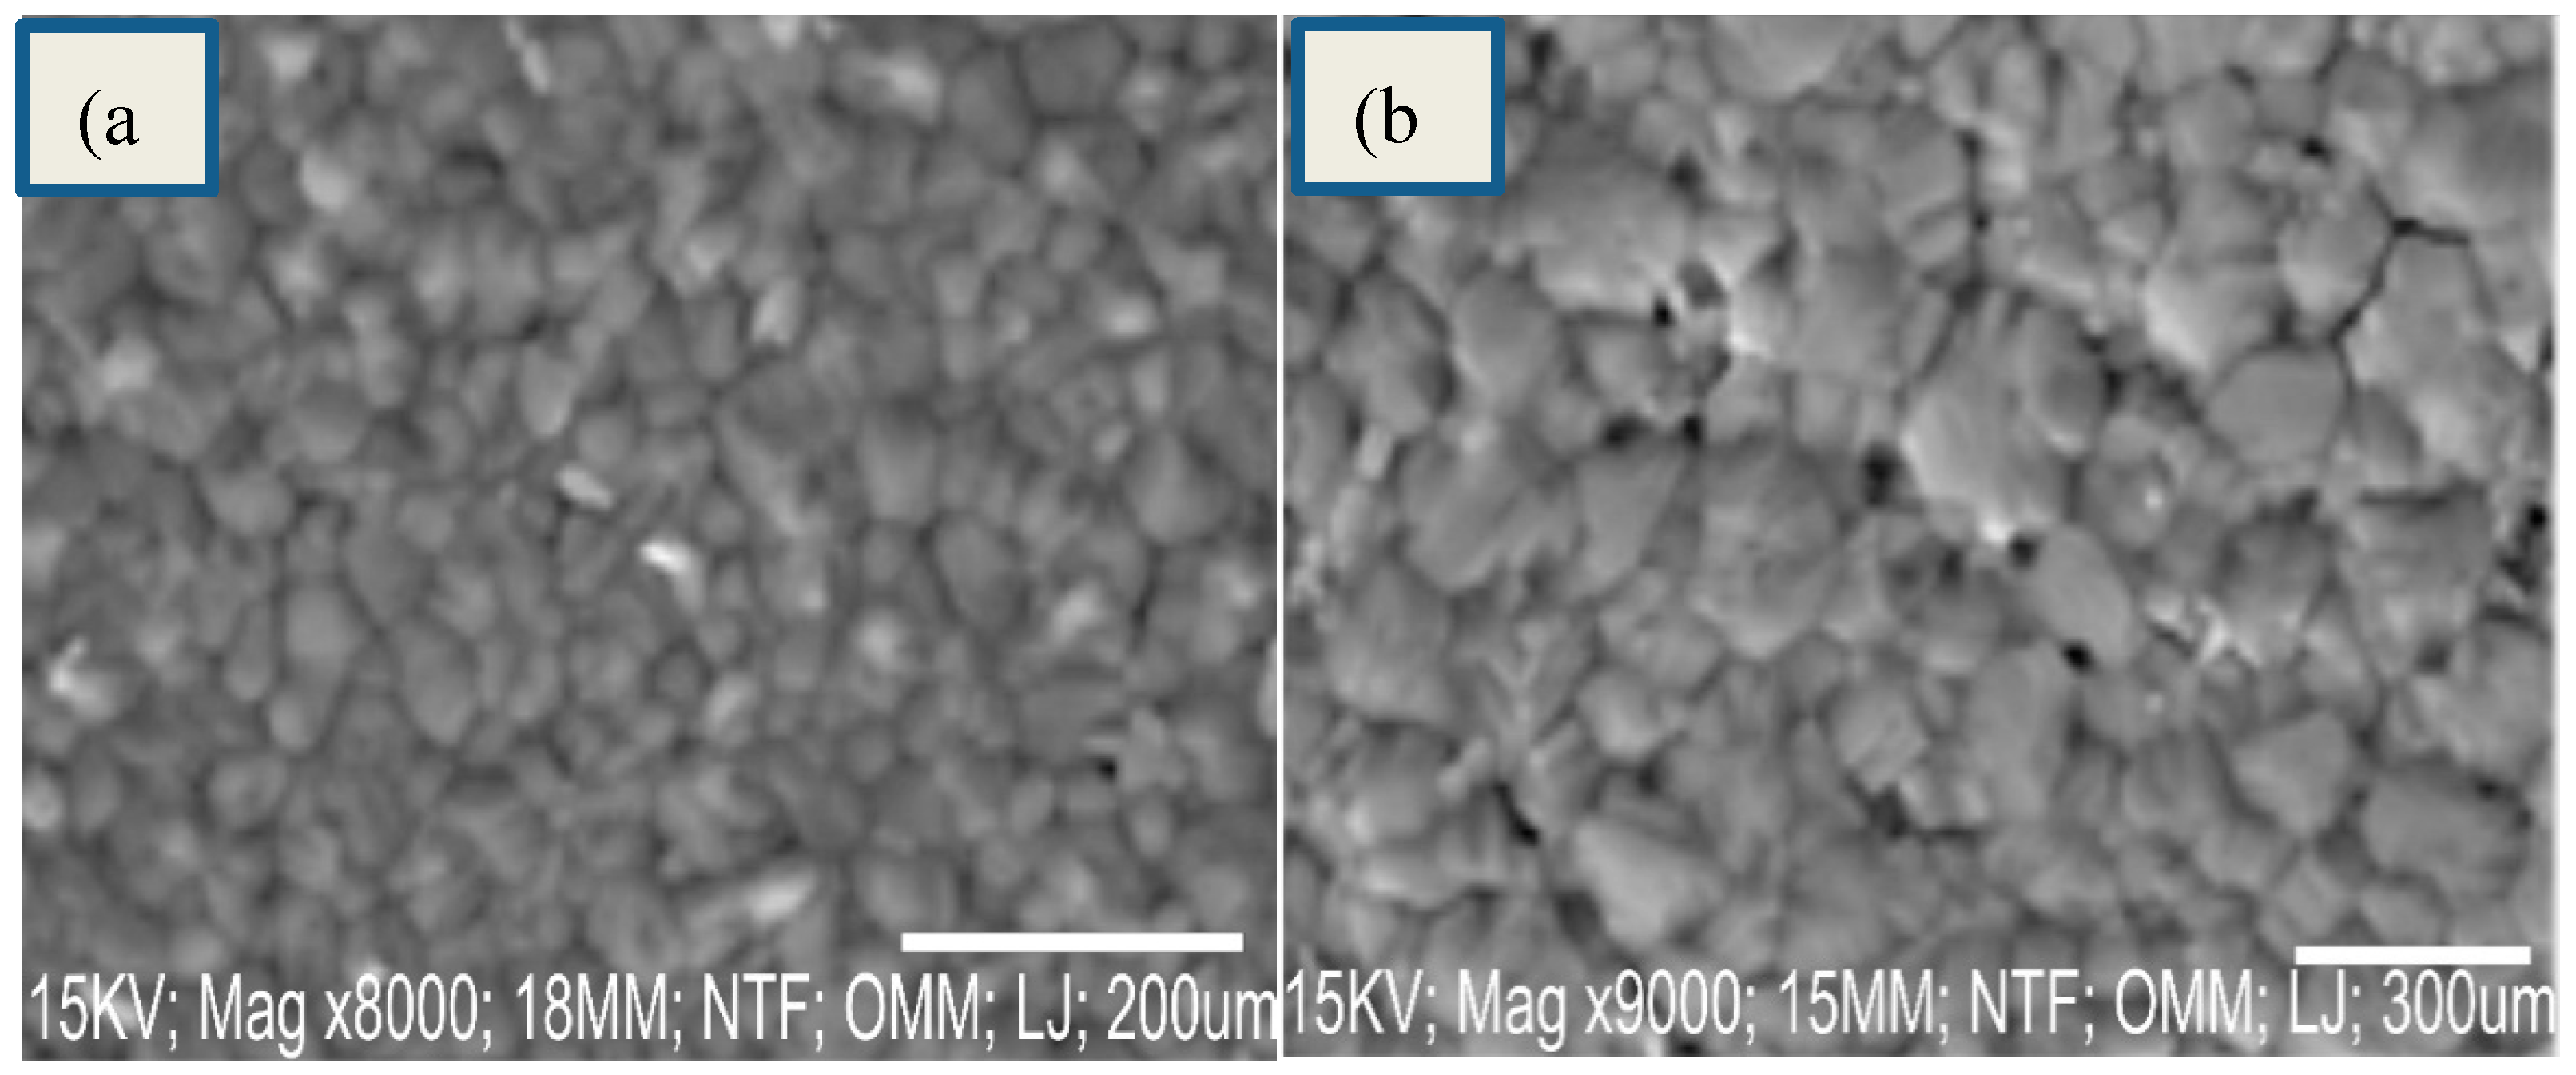
Figure 4 a,b show the SEM images of CH3NH3PbI3 film at 7000 and 8000 magnifications. The Figure 4 shows high film coverage, compact structure, uniform morphology and smooth surface with apparent grain boundries typical of CH3NH3PbI3 films prepared by solution process in one step. No cracks were observed. In perovskite films, the smoothness of each layer is crucial for interface contact. The smooth surface of perovskite thin films lead to the reduced interface resistance of the perovskite, and reduce charge recombination loss at the interface of perovskites. It was reported that the smoothness of perovskite film is necessary to obtain high quality interfaces and high photoconversion efficiency.
Figure 4.
SEM images of CH3NH3PbI3 film.
Figure 4.
SEM images of CH3NH3PbI3 film.
4.2.1. FTIR Characterization of TiO2, RGO and MnO2 Nanoparticles
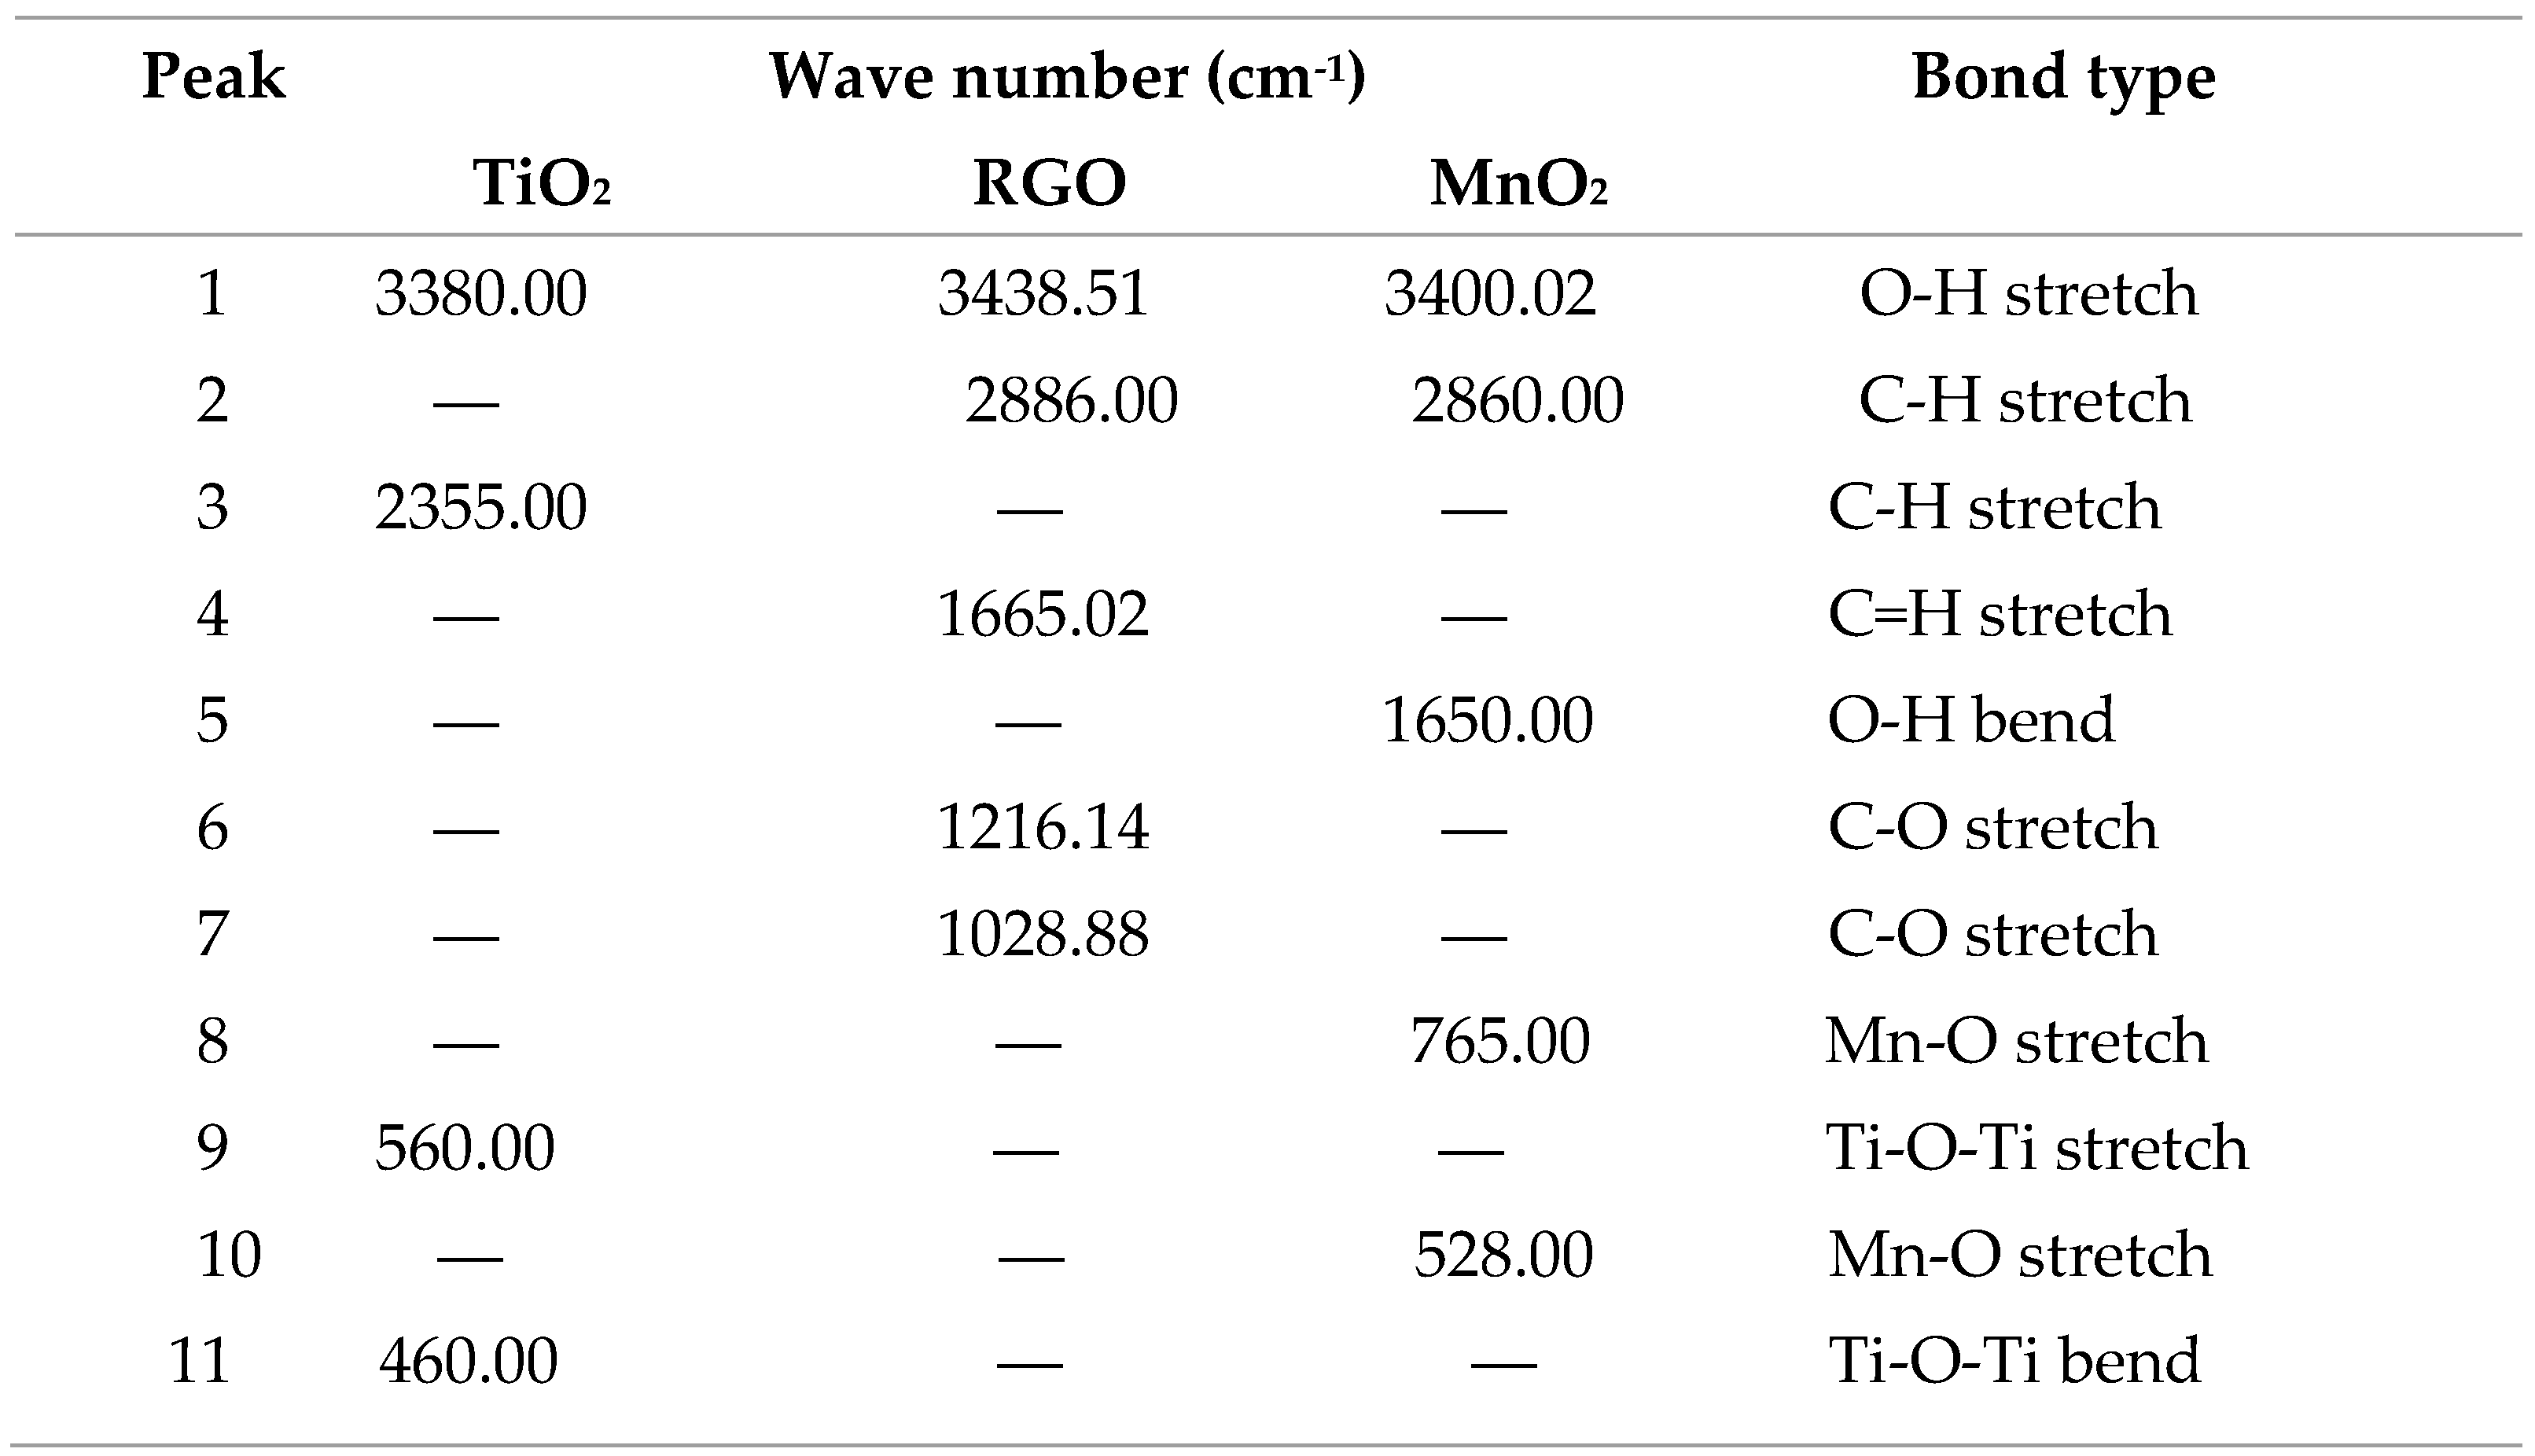
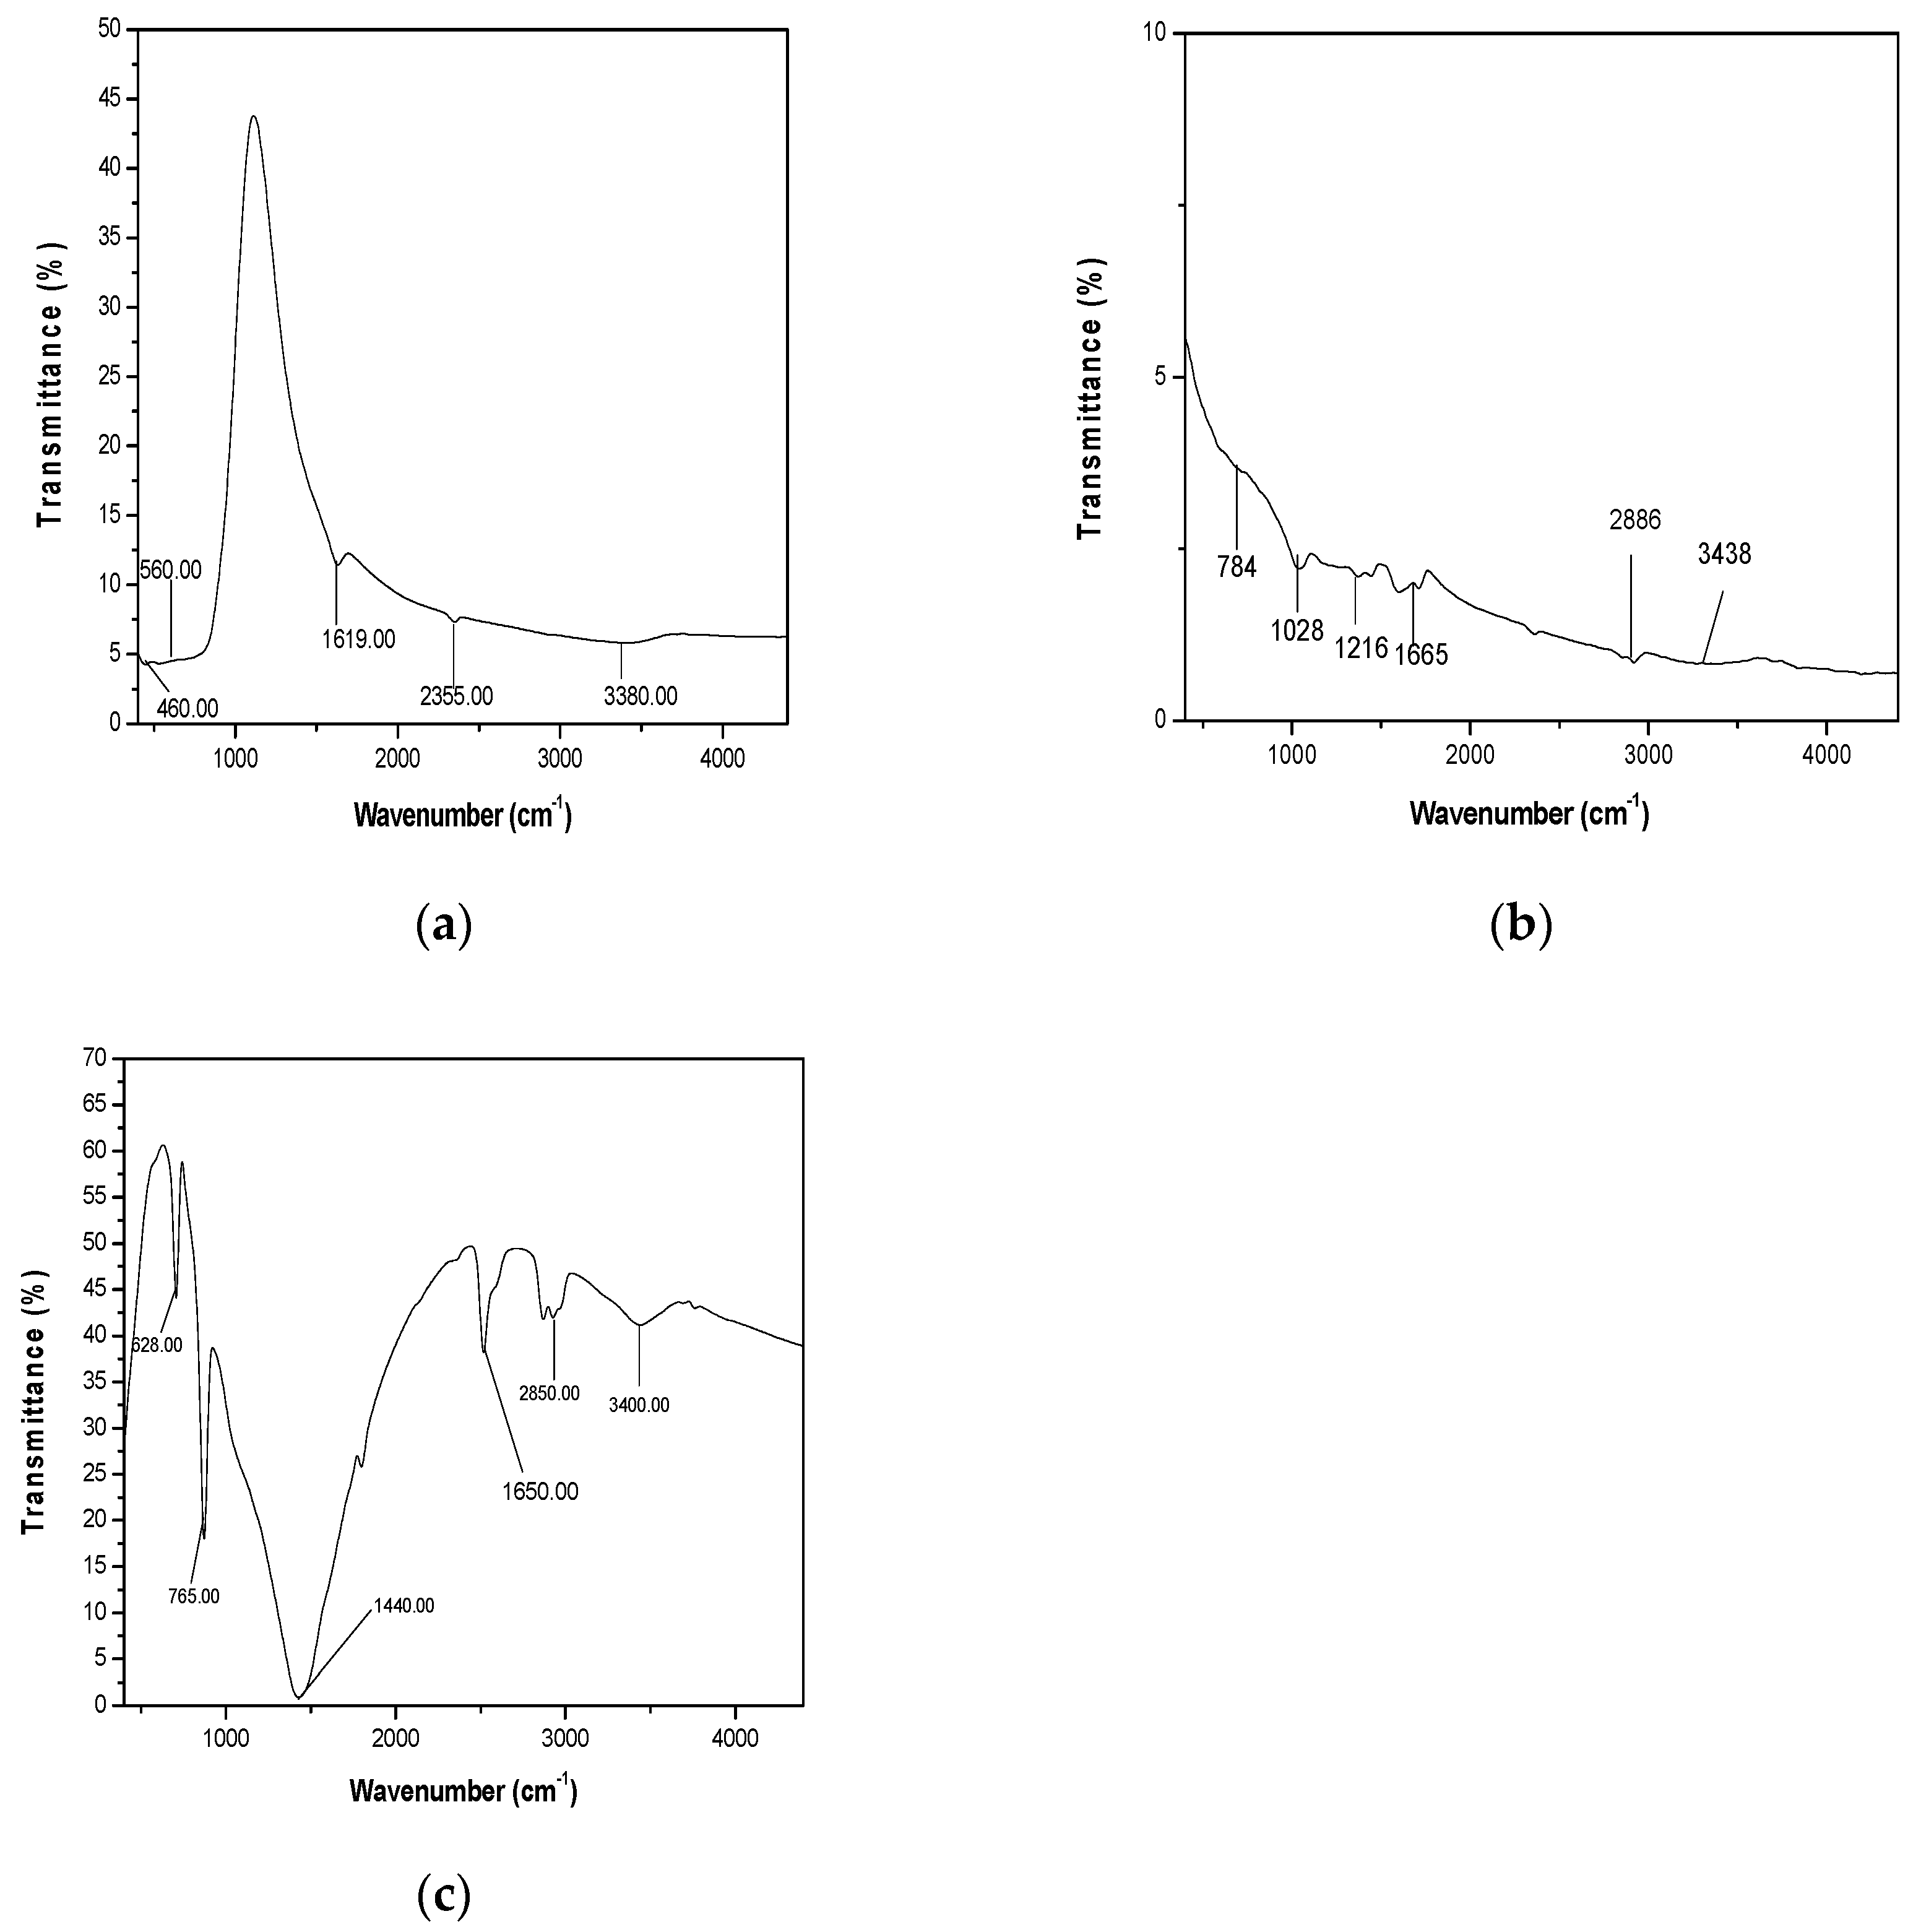
As seen in Figure 4a, several molecular vibration frequencies are identified which include OH (3380.00 cm-1,1619.00 cm-1), C-H (VC-H, 2355.00 cm-1) and Ti-O-Ti (V Ti-O-Ti, 560.00 cm-1, 460.00 cm-1). As see Figure 4b, the hydroxyl compound functional group (–OH) formed at the peak with a wavenumber of 3438.51 cm – 1, the aromatic carbon functional group (C=C) formed at the peak with a wavenumber of 1665.02 cm – 1, and the epoxy functional group (–CO) formed at the peak with a wavenumber of 1216.14 cm – 1. Additionally, alkoxy functional group(–C–O) is located at the peak with a wavenumber 1028.88 cm – 1 and the absorption peak with a wavenumber of 2886.00 cm– 1 signifying the existence –C-H stretching mode (Konios et al., 2014). Figure 4c represents the FTIR spectrum of MnO2 nanoparticles. Two broad bands appear at 3400.00 cm-1 and 1650.00 cm-1. Both bands are the characteristic and specific bands for O–H group representing stretching and bending vibration respectively for surface-adsorbed hydroxyl groups in water (Suriyavathana et al., 2015). The absorption peak with a wavenumber of 2886.00 cm– 1 signifying the existence –C-H stretching mode (Konios et al., 2014). Besides, the transmission peaks 765.00 cm-1 and 528.00 cm-1 represent the stretching vibration of Mn-O bonds, and characteristic stretching of O–Mn–O.
Table 3.
Summary of bond types and wavenumber in TiO2, RGO and MnO2.
Table 3.
Summary of bond types and wavenumber in TiO2, RGO and MnO2.
Figure 4.
(a)FTIR spectrum of TiO2 nanoparticles (b)FTIR spectrum of RGO nanoparticles(a)FTIRspectrum of MnO2 nanoparticles.
Figure 4.
(a)FTIR spectrum of TiO2 nanoparticles (b)FTIR spectrum of RGO nanoparticles(a)FTIRspectrum of MnO2 nanoparticles.
4.2.2. XRD Characterization of TiO2, RGO and MnO2 Nanoparticles
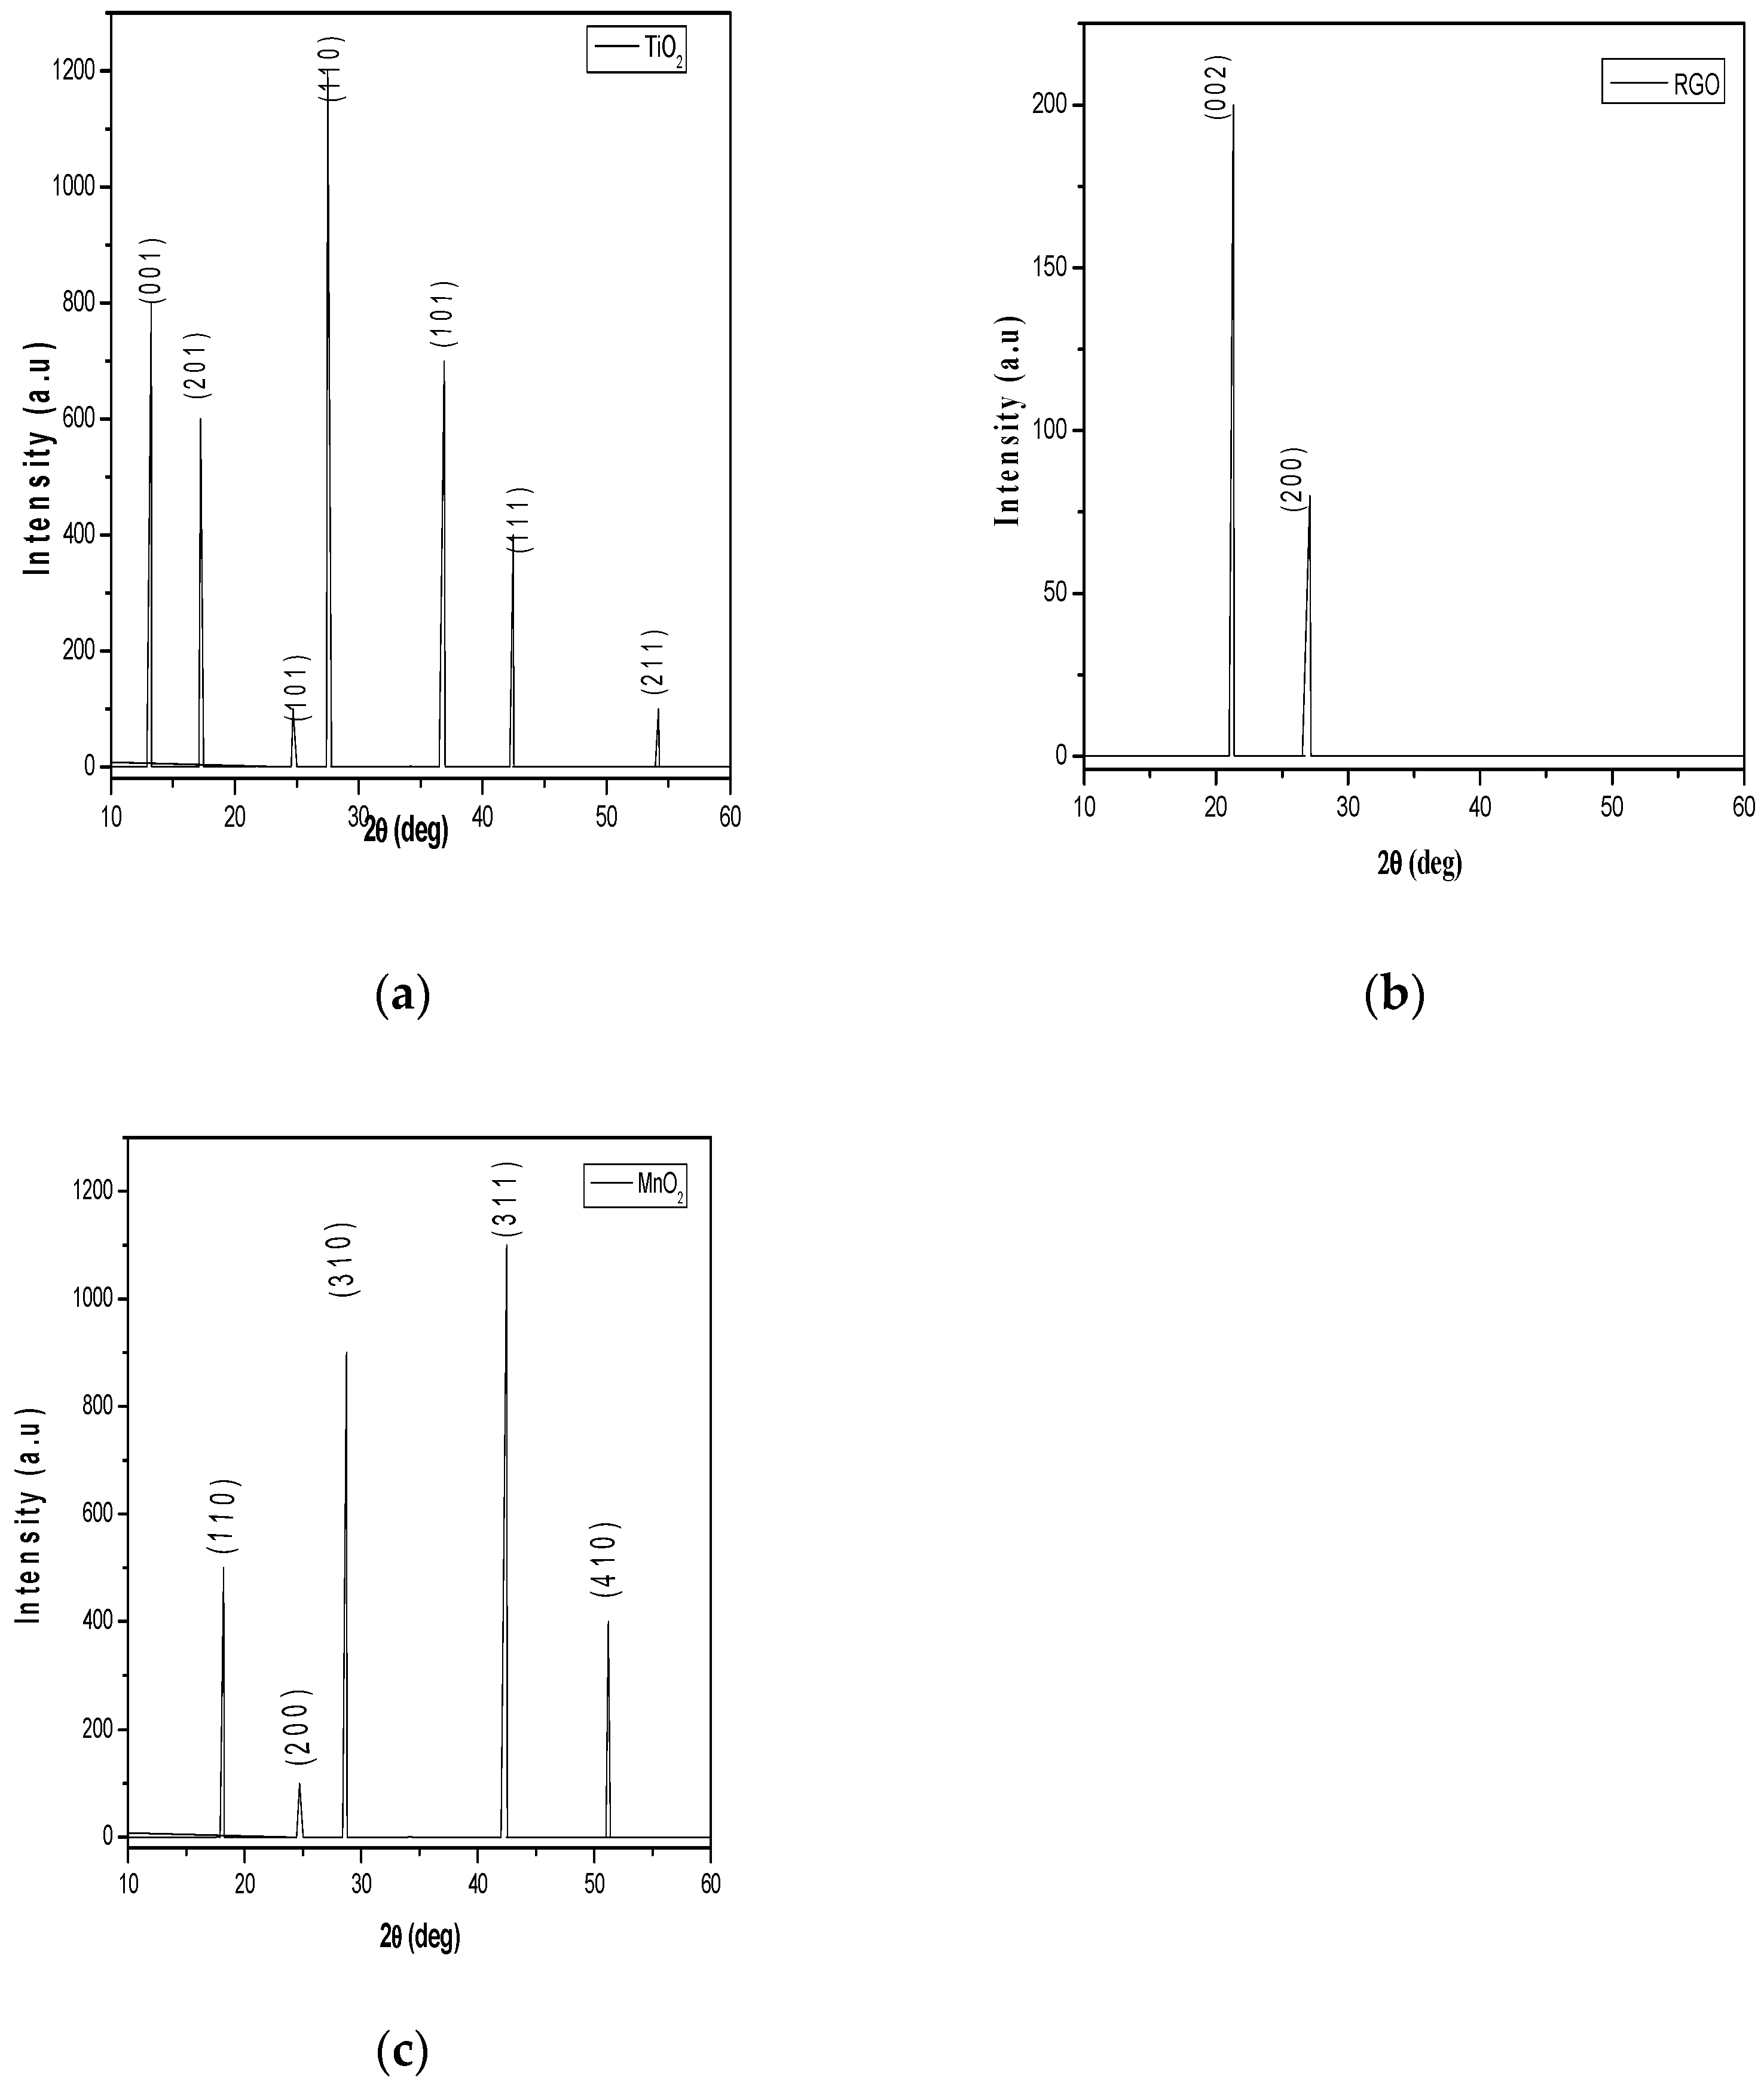
Figure 5a shows the TiO
2 film XRD patterns. The presence of a sharp peak which corresponds to plane(110) at 2θ = 27.59˚ referring to the rutile phase having tetragonal structure. The diffraction peaks for planes (001), (201), (101), (110), (101), (111) and (211) at 2θ=7.60˚, 2θ=14.89˚, 2θ=29.75˚, 2θ=27.50˚, 2θ=37.10˚, 2θ=42.50˚ and 2θ= 54.60˚ reflect the tetragonal structure of TiO
2 nanoparticles. As seen in
Table 4, the average crystallite size of 59.78 nm, lattice strain of 0.032 % and dislocation density of 0.00030 nm
-2 were also calculated. The diffraction patterns for MnO
2 are given in
Figure 5b. The presence of diffraction peaks for planes (110), (200), (310), (311) and (410) at 2θ=18.27˚, 2θ=24.80˚ and 2θ=28.75˚, 2θ=42.50˚ and 51.20˚ reveal the alpha phase having pattern of tetragonal structure conformity with (JCPDS Card No.44-0141) having the lattice constants of (a = b = 9.78475 Å, c = 2.86302 Å) and (α = β = γ = 90˚). As seen in
Table 5, the average crystallite size of 53.87 nm, lattice strain of 0.040 % and dislocation density of 0.00039 nm
-2 were also calculated. The XRD pattern of the synthesized RGO as shown in
Figure 6 demonstrated peaks at 2θ=22.10˚ and 2θ =28.20˚ which is the characteristics of carbonaceous material. The most prominent peak located at 2θ=22.10˚ and other strong diffraction peak at 2θ=22.10˚ correspond to (002) and (200) basal planes respectively. Additionally, the d-spacing of film decreases as the diffraction tends towards larger angle with average d-spacing value of ~ 4.095 Å compared to ~ 7.37 Å obtained for graphene oxide by Mohamed et al, 2015.
Table 4.
Structural parameters of TiO2 film.
Table 4.
Structural parameters of TiO2 film.
Table 5.
Structural parameters of RGO film.
Table 5.
Structural parameters of RGO film.
Table 6.
Structural parameters of MnO2 film.
Table 6.
Structural parameters of MnO2 film.
Figure 5.
(a) XRD pattern of TiO2 nanoparticles (b) XRD pattern of RGO nanoparticles (c) XRD pattern of MnO2 nanoparticles.
Figure 5.
(a) XRD pattern of TiO2 nanoparticles (b) XRD pattern of RGO nanoparticles (c) XRD pattern of MnO2 nanoparticles.
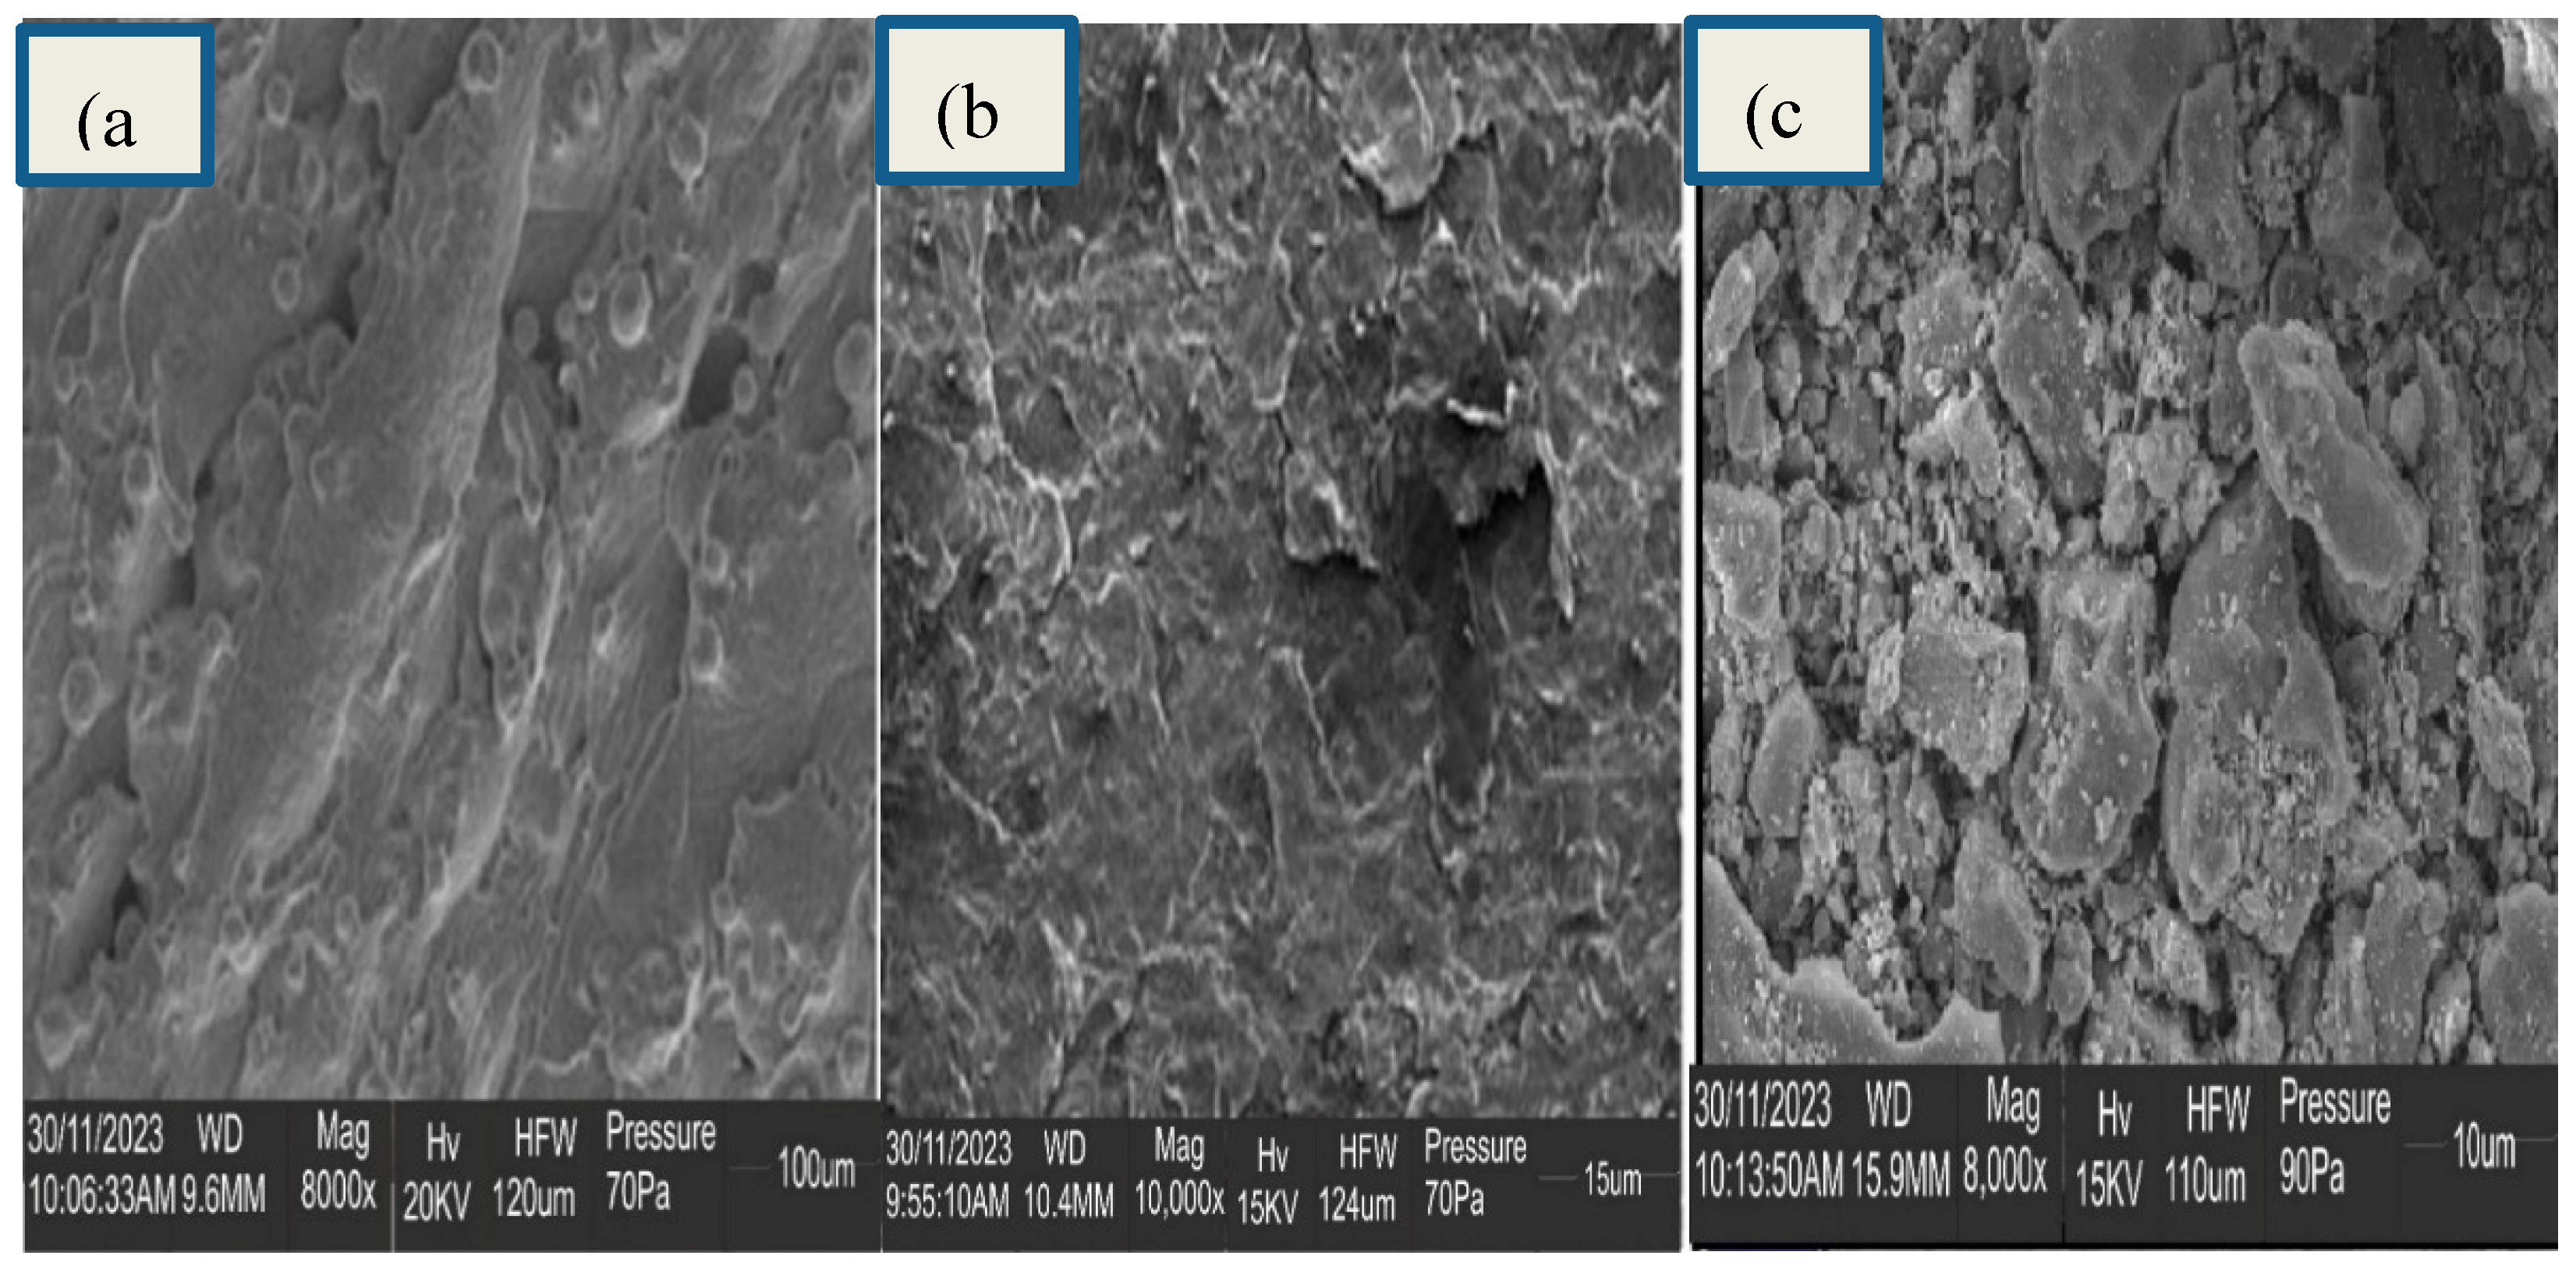
Figure 6.
(a) SEM image of TiO2 nanoparticles (b) SEM image of RGO nanoparticles (c) SEM image of MnO2 nanoparticles.
Figure 6.
(a) SEM image of TiO2 nanoparticles (b) SEM image of RGO nanoparticles (c) SEM image of MnO2 nanoparticles.
4.2.3. SEM Characterization of TiO2, RGO and MnO2 Nanoparticles
The SEM image of TiO
2 in
Figure 6a demonstrated properly-aligned structures of oval shapes constructed by nearly homogenous grains. Additionally, the surface was smooth and presents the crystalline nature of the produced film. SEM image of RGO is shown in
Figure 6b. The morphology of multilayer RGOs revealed rough surface, flake-like shape, not crumpled and corrugated together with non-uniform of particle size. High film coverage was also observed. The aggregation or coalescence of flakes were large and ubiquitous. The agglomeration of the flakes was owing to catalytic oxidation of graphite by surphuric acid (Bhatti
et al., 2016). As seen in
Figure 6c, the morphology study results of MnO
2 nanoparticle film exhibit high-quality nanocomposites having different micrometers average length. The particle size was elongated and nearly spherical.
3.3.1. Optical Characterization of ITO/RGO/ TiO2/CH 3NH3PbI3/Gr and ITO/RGO/ TiO2/CH3NH3PbI3/Gr- MnO2 Films
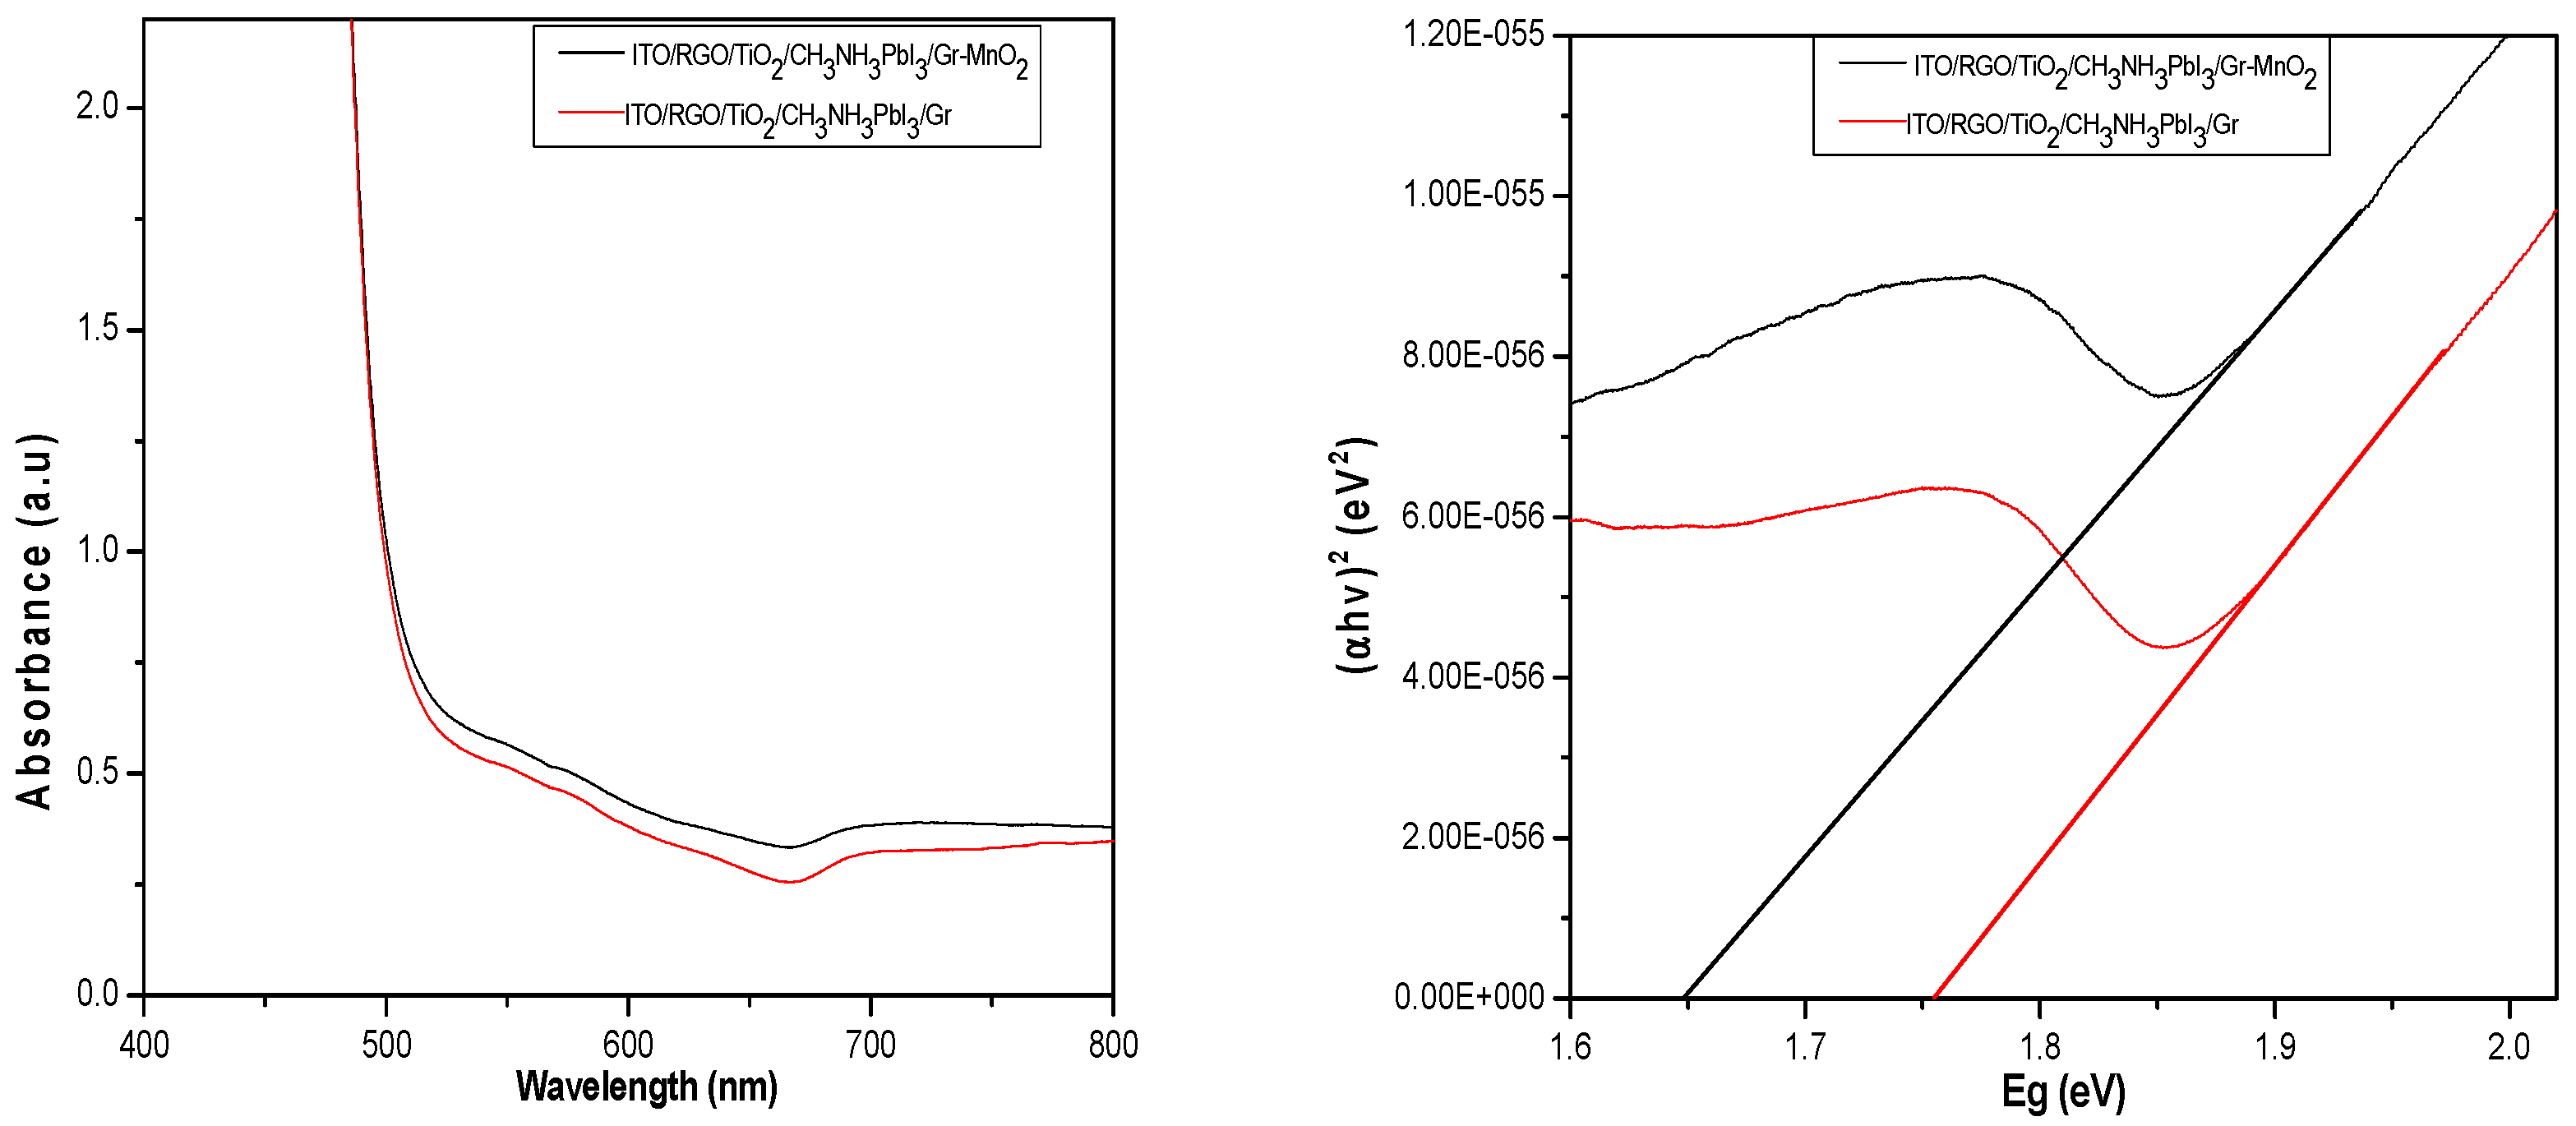
Figure 7a shows the UV-vis absorption spectra of the ITO/RGO/TiO
2/CH
3NH
3PbI
3/Gr and ITO/RGO/TiO
2/CH
3NH
3PbI
3/Gr-MnO
2 films. the modification showed increases the intensity of absorption (hyperchromic effect) due to the increase in the number of delocalized electrons leading to a quasi-fermi level. This high absorbance intensity is attributed to the presence of simple un-conjugated chromophore with lone pair electrons in the MnO
2 and ITO/RGO/TiO
2/CH
3NH
3PbI
3/Gr. As a result, there was a high energy transition from an occupied molecular orbital (a non-bonding 𝜋 orbital) to an unoccupied molecular orbital (σ* orbital) of greater potential energy. i.e., 𝜋→σ* (Subodh, 2006). The (αhv)
2-Eg plots of ITO/RGO/TiO
2/CH
3NH
3PbI
3/Gr and ITO/RGO/TiO
2/CH
3NH
3PbI
3/Gr-MnO
2 film is shown in
Figure 7b. The band gap of fabricated ITO/RGO/TiO
2/CH
3NH
3PbI
3/Gr solar cell was extrapolated to be 1.75 eV, and that of ITO/RGO/TiO
2/CH
3NH
3PbI
3/Gr-MnO
2 reduced to 1.66 eV.
Figure 7.
(a) Absorbance-wavelength plots of ITO/RGO/ TiO2/CH 3NH3PbI3/Gr and ITO/RGO/ TiO2/CH3NH3PbI3/Gr- MnO2 films (b) (αhv)2-Eg plots of ITO/RGO/ TiO2/CH 3NH3PbI3/Gr and ITO/RGO/ TiO2/CH 3NH3PbI3/Gr- MnO2 films.
Figure 7.
(a) Absorbance-wavelength plots of ITO/RGO/ TiO2/CH 3NH3PbI3/Gr and ITO/RGO/ TiO2/CH3NH3PbI3/Gr- MnO2 films (b) (αhv)2-Eg plots of ITO/RGO/ TiO2/CH 3NH3PbI3/Gr and ITO/RGO/ TiO2/CH 3NH3PbI3/Gr- MnO2 films.
4.3.2. FTIR Characterization of ITO/RGO/ TiO2/CH 3NH3PbI3/Gr and ITO/RGO/ TiO2/CH3NH3PbI3/Gr- MnO2 Films
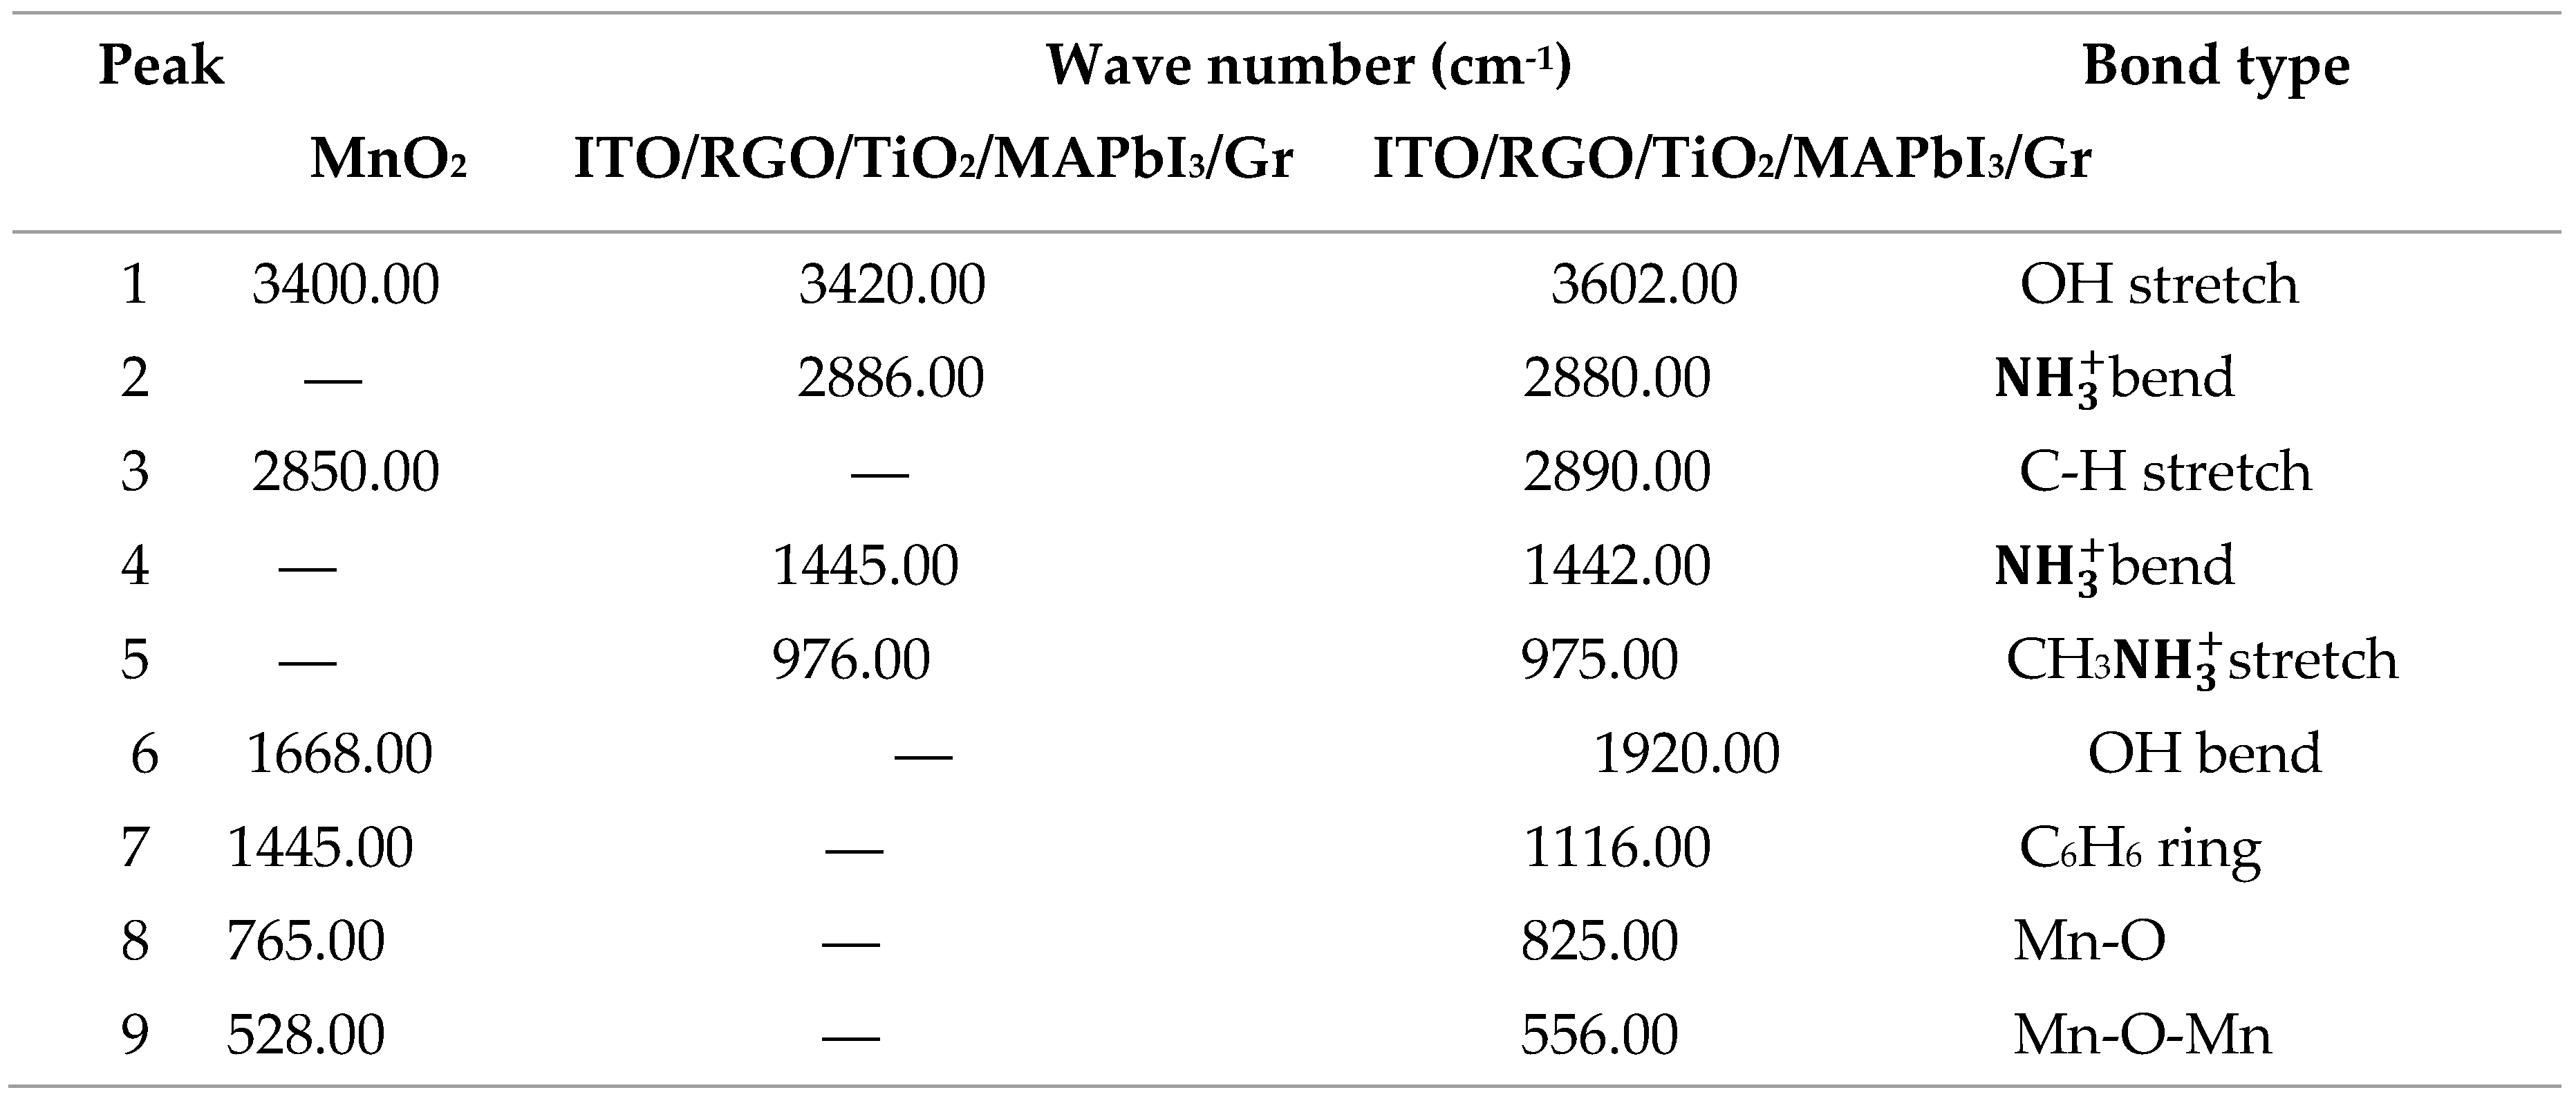
FTIR analysis was carried out to investigate the interaction between MnO
2 and ITO/RGO/TiO
2/CH
3NH
3PbI
3/Gr and results shown in
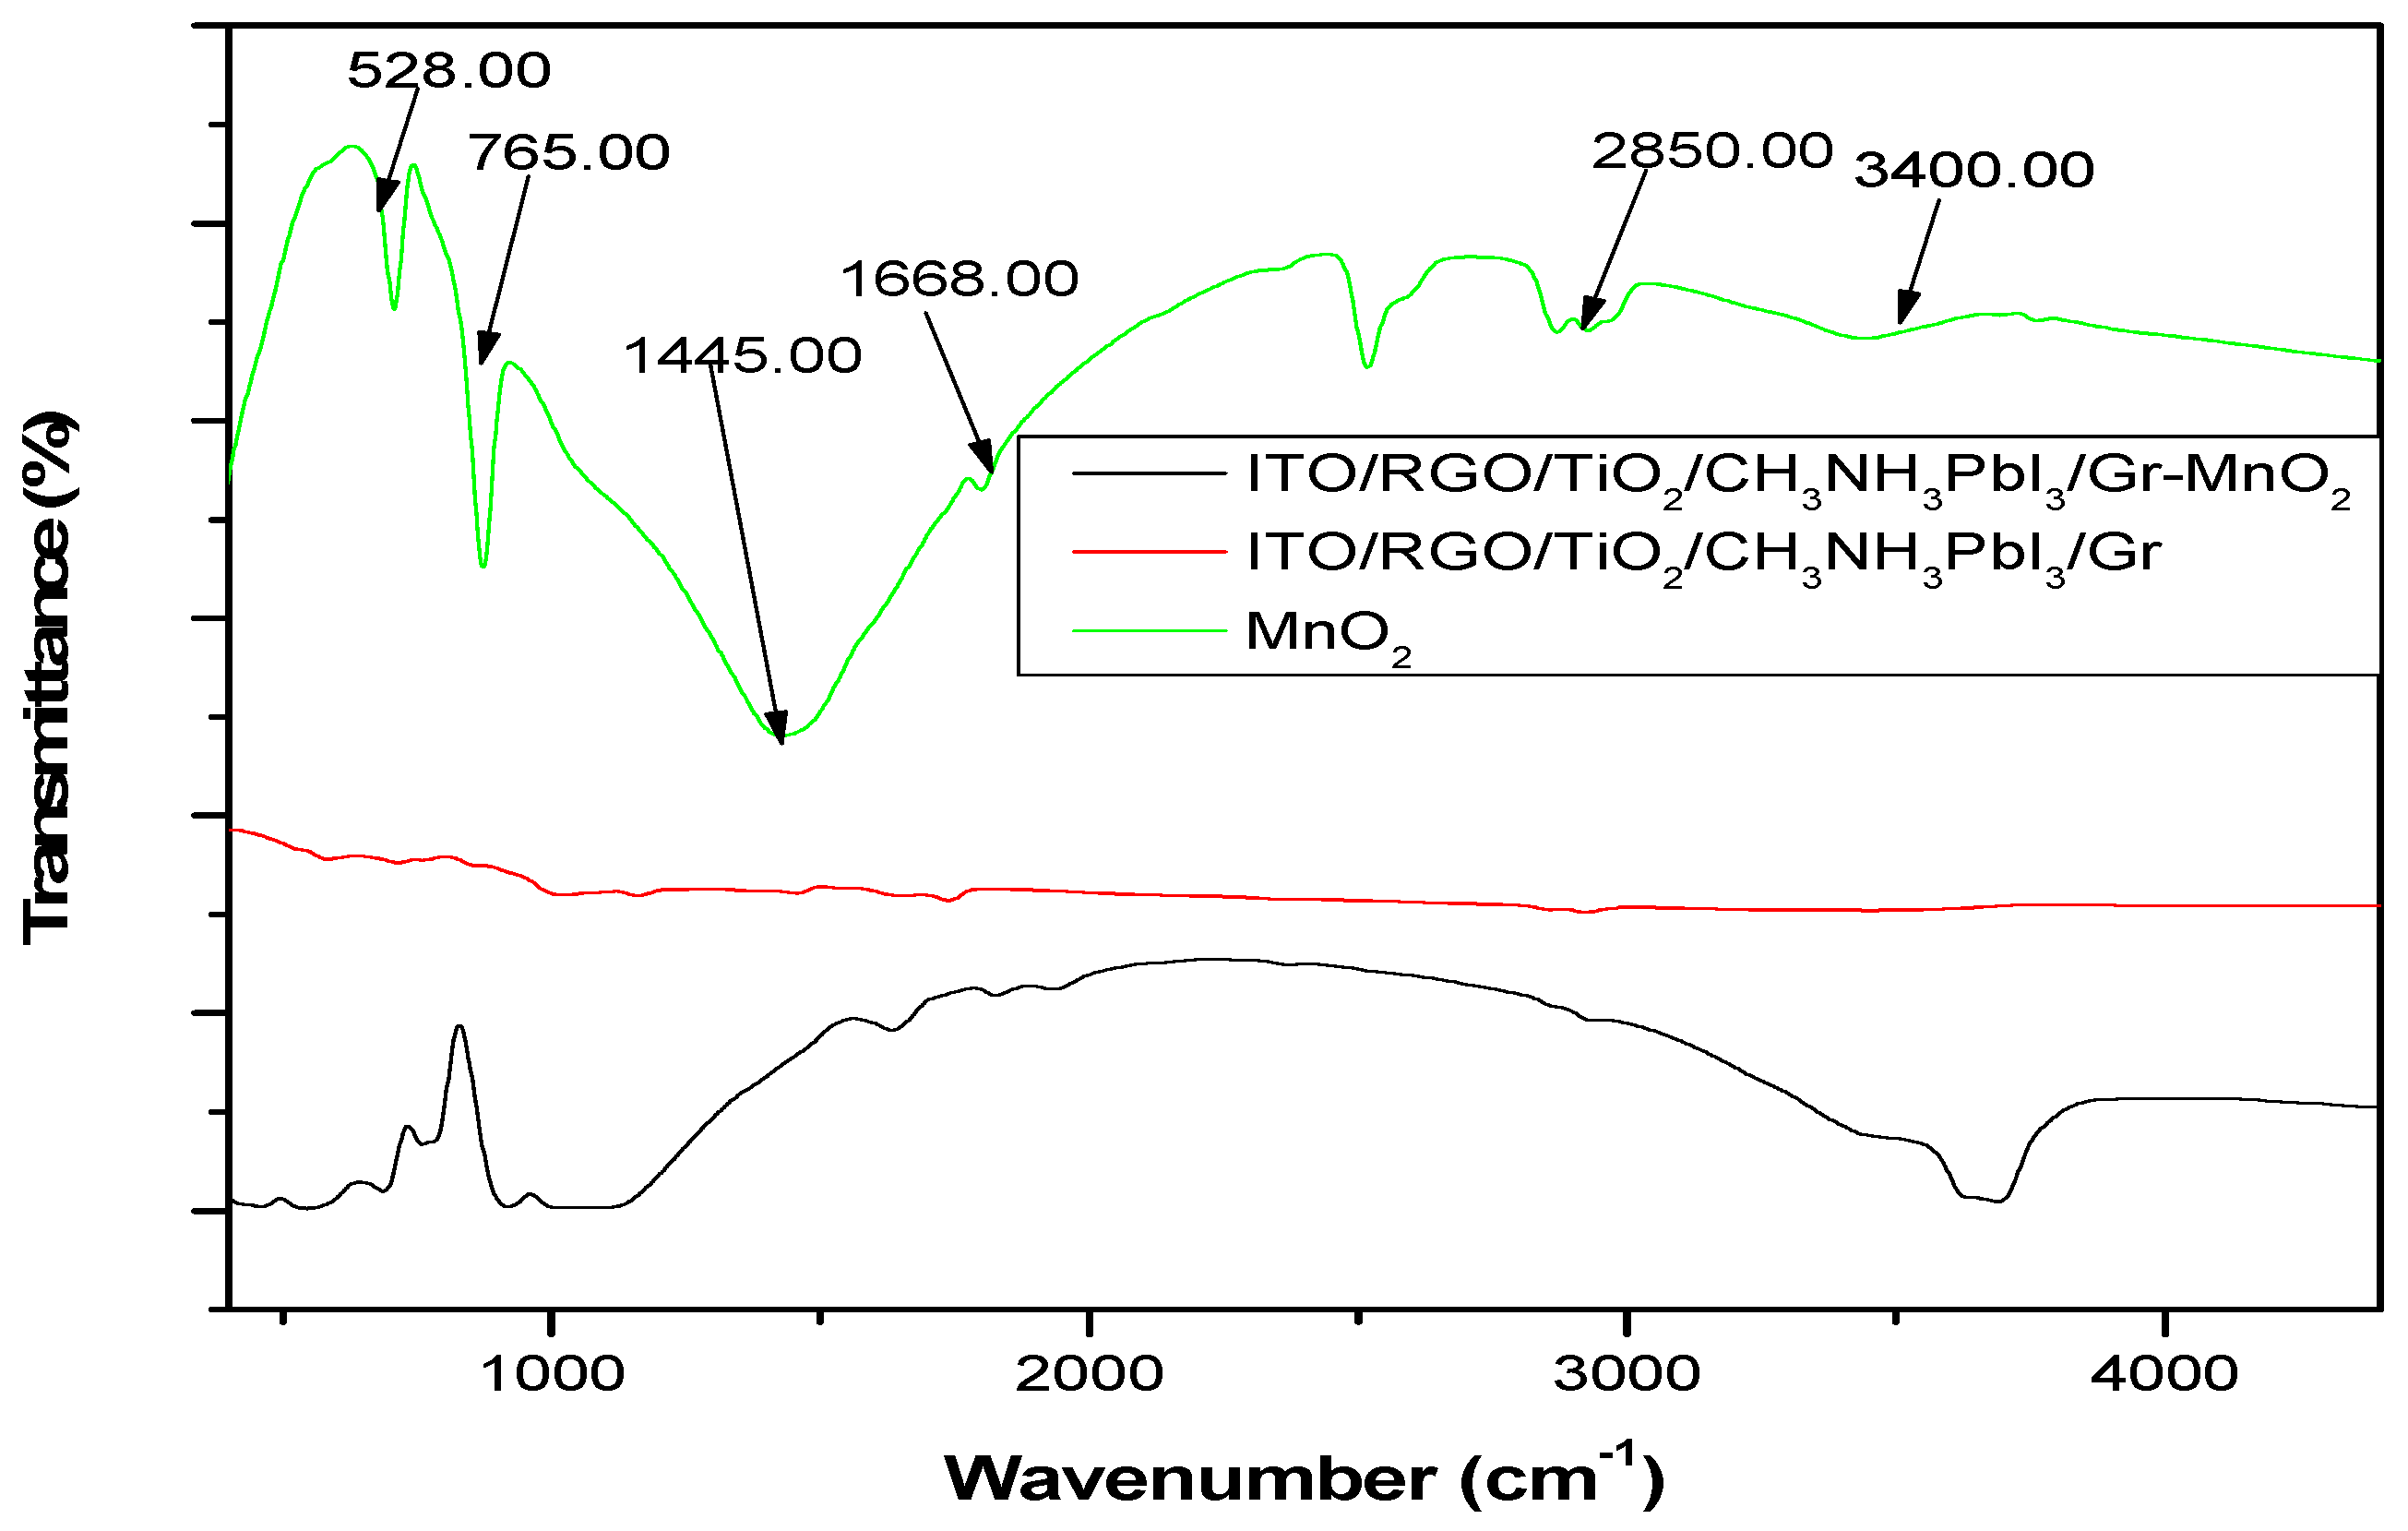
Figure 8. In the fingerprint region of MnO
2 FTIR spectrum, two absorption peaks 528.00 cm
-1 and 765.00 cm
-1 which could be assigned to Mn-O-Mn and Mn-O. These two peaks present in ITO/RGO/TiO
2/CH
3NH
3PbI
3/Gr FTIR spectrum which confirmed incorporation of MnO
2 within the ITO/RGO/TiO
2/CH
3NH
3PbI
3/Gr specie. The peaks of Mn-O-Mn and Mn-O were located at 528.00 cm
-1 and 765.00 cm
-1 in MnO
2 film, while these peaks red shift to 556.00 cm
-1 and 825.00 cm
-1. Besides, the asymmetric
bend, symmetric
bend and CH
3stretch located at 2886.00 cm
-1, 1445.00 cm
-1 and 976.00 cm
-1 in ITO/RGO/TiO
2/CH
3NH
3PbI
3/Gr film blue shift to 2880.00 cm
-1, 1442.00 cm
-1 and 975.00 cm
-1. The blue shift of ITO/RGO/TiO
2/CH
3NH
3PbI
3/Gr film peak and red shift of MnO
2 peak confirmed that there was strong coordination interaction between the functional groups of MnO
2 and Pb defects of the grain boundaries and interfaces of ITO/RGO/TiO
2/CH
3NH
3PbI
3/Gr film.
Table 7.
Summary of bond types and wavenumber in MnO2, ITO/RGO/TiO2/MAPbI3/Gr and ITO/RGO/TiO2/MAPbI3/Gr.
Table 7.
Summary of bond types and wavenumber in MnO2, ITO/RGO/TiO2/MAPbI3/Gr and ITO/RGO/TiO2/MAPbI3/Gr.
Figure 8.
FTIR spectrum of MnO2, ITO/RGO/TiO2/MAPbI3/Gr and ITO/RGO/TiO2/MAPbI3/Gr.
Figure 8.
FTIR spectrum of MnO2, ITO/RGO/TiO2/MAPbI3/Gr and ITO/RGO/TiO2/MAPbI3/Gr.
3.3.3. XRD Characterization of ITO/RGO/ TiO2/CH 3NH3PbI3/Gr and ITO/RGO/ TiO2/CH3NH3PbI3/Gr- MnO2 Films
In order to investigate the effect of MnO
2 on the crystallinity of ITO/RGO/TiO
2/CH
3NH
3PbI
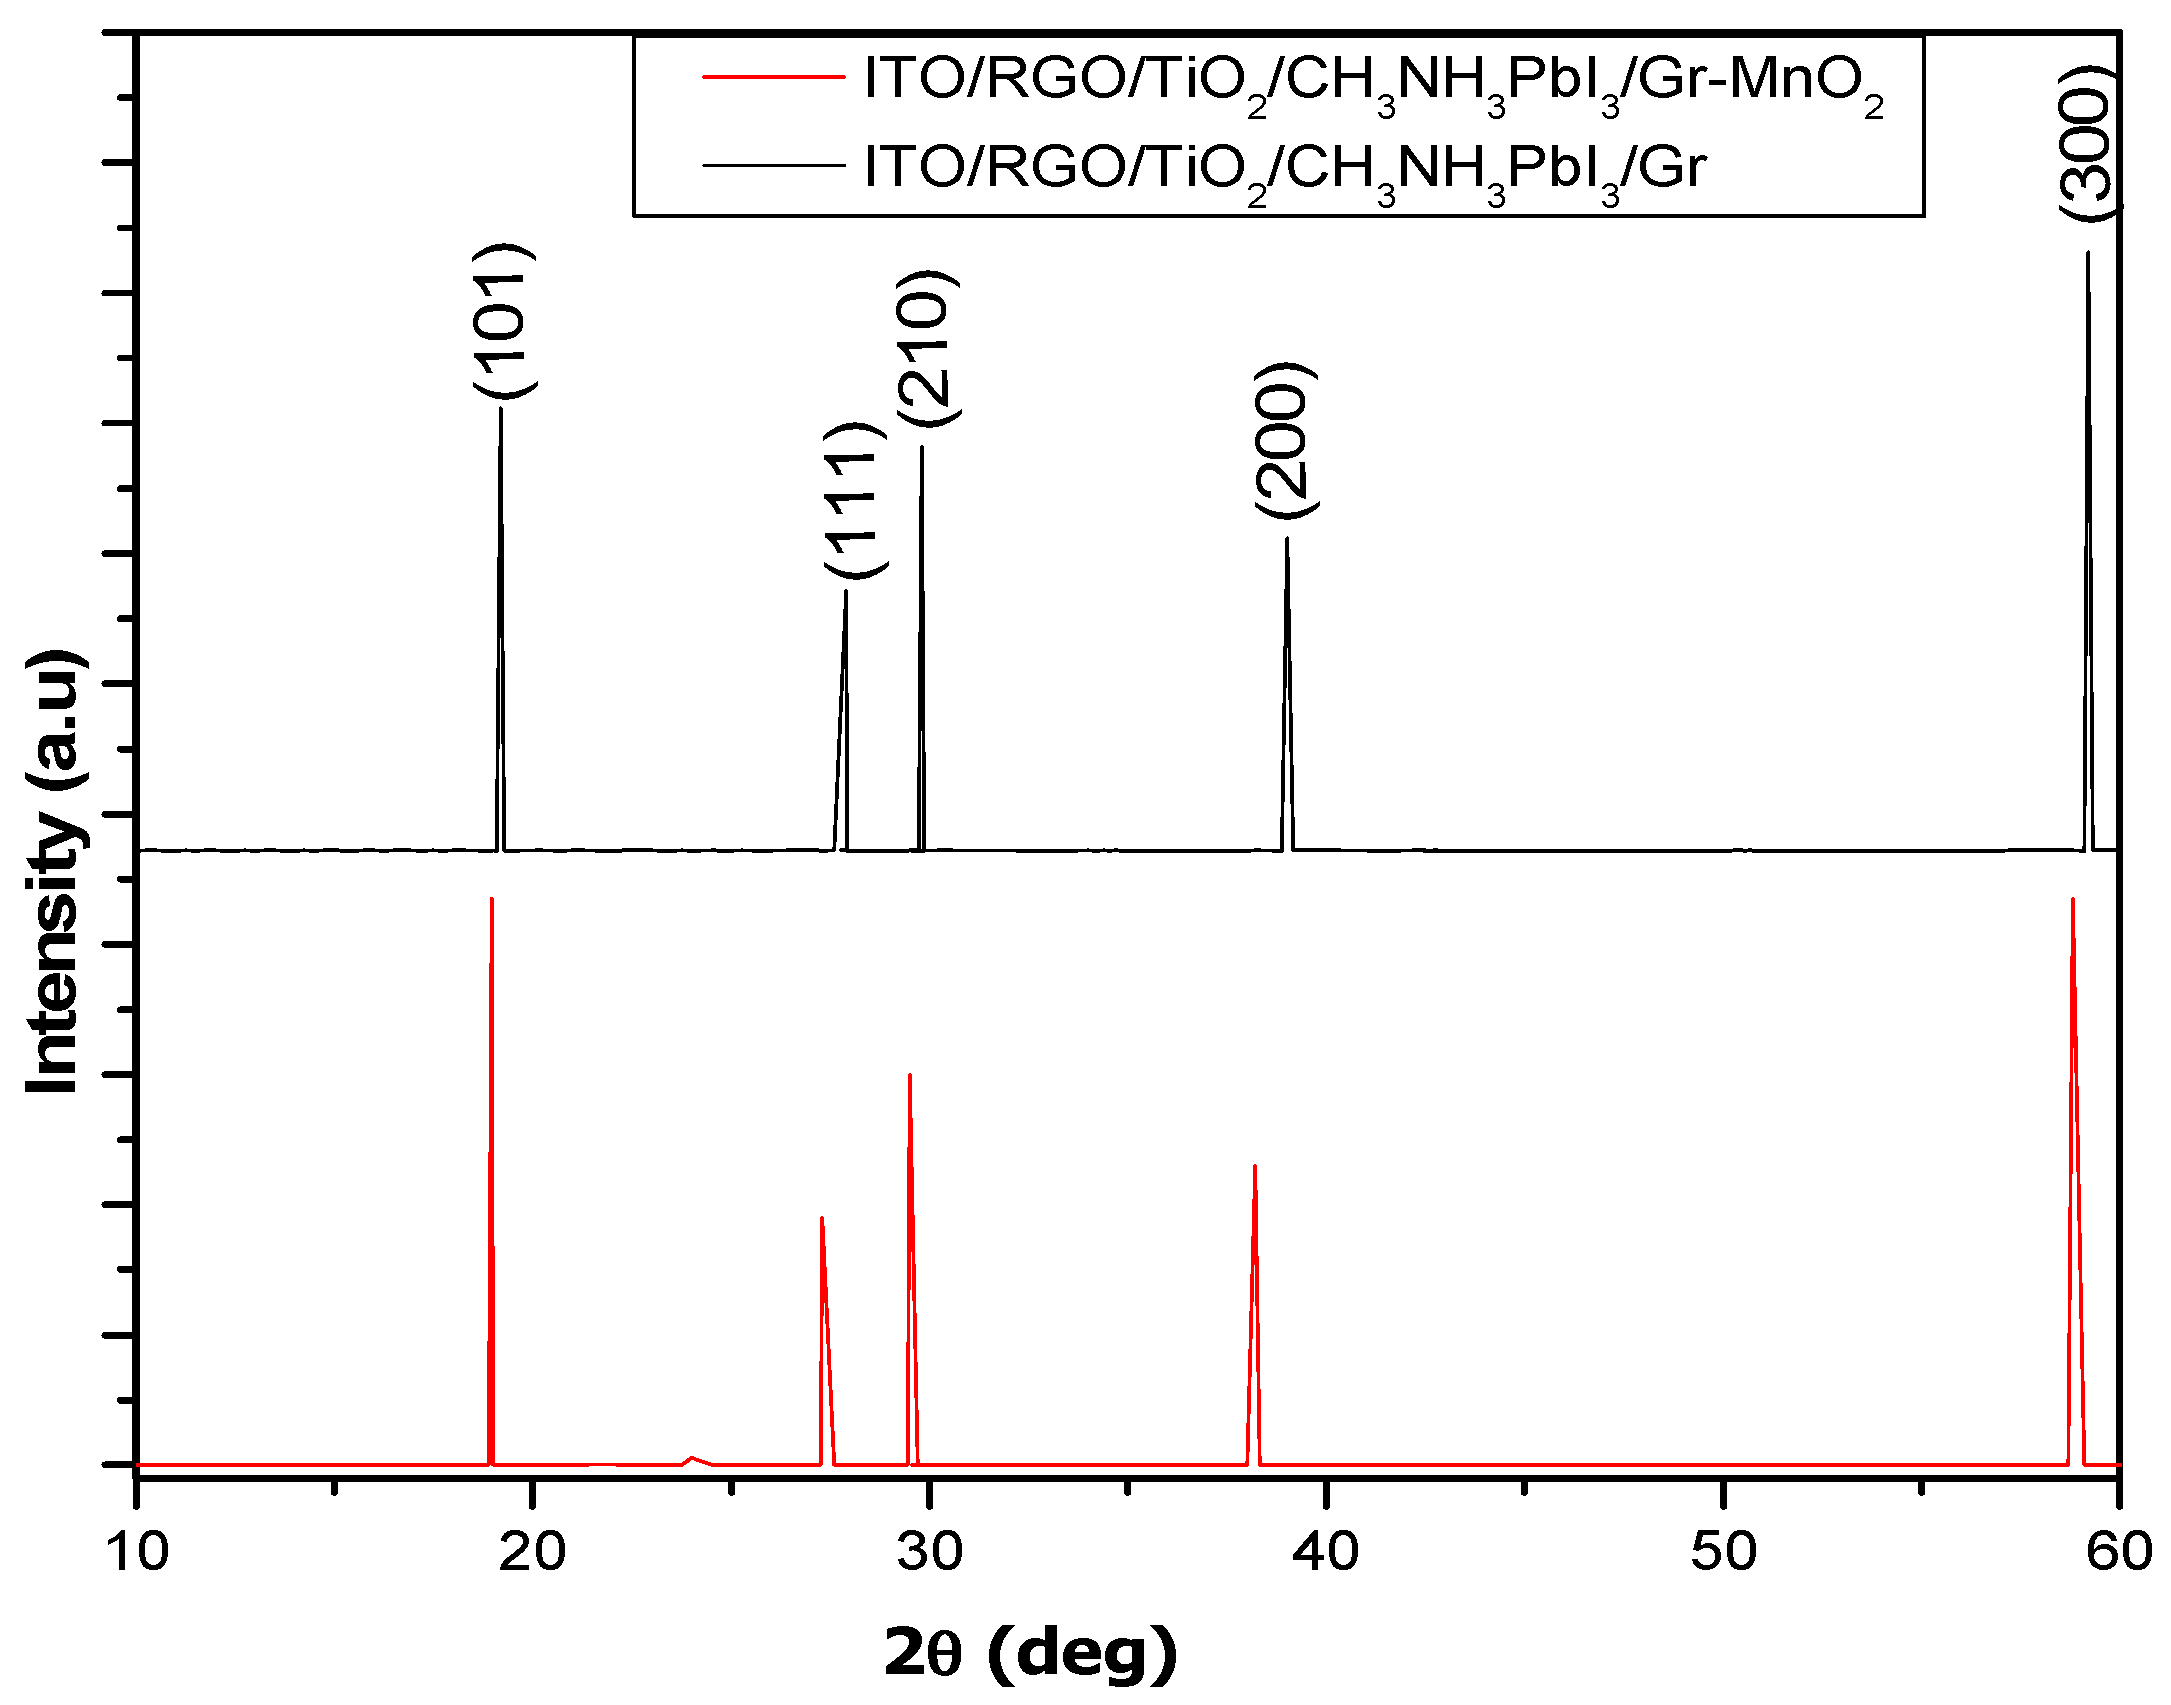
3Br/Gr film. XRD measurements were performed and the results are shown in
Figure 9. Five XRD peaks at 2θ= 19.20
o, 27.90
o, 29.80
o, 38.90
o and 59.20
o were observed in the two perovskite films which correspond to (101), (111), (210), (200) and (310) crystal plane of cubic phase CH
3NH
3PbI
3halide perovskite. The XRD results confirmed that MnO
2 has no remarkable influence on the crystal phase of ITO/RGO/TiO
2/CH
3NH
3PbI
3/Gr film by the addition of MnO
2 (Xu
et al., 2018). The intensities of 19.20
o, 27.90
o, 38.90
o and 59.20
o XRD peaks of ITO/RGO/TiO
2/CH
3NH
3PbI
3/Gr-MnO
2 film were higher than those of ITO/RGO/TiO
2/CH
3NH
3PbI
3/Gr film, and the narrowed widths of these diffraction angles indicating that MnO
2 incorporation enhanced the crystallinity of ITO/RGO/TiO
2/CH
3NH
3PbI
3/Gr film consistent with reports of other additives used in perovskites (Chavan
et al., 2020).
Table 8.
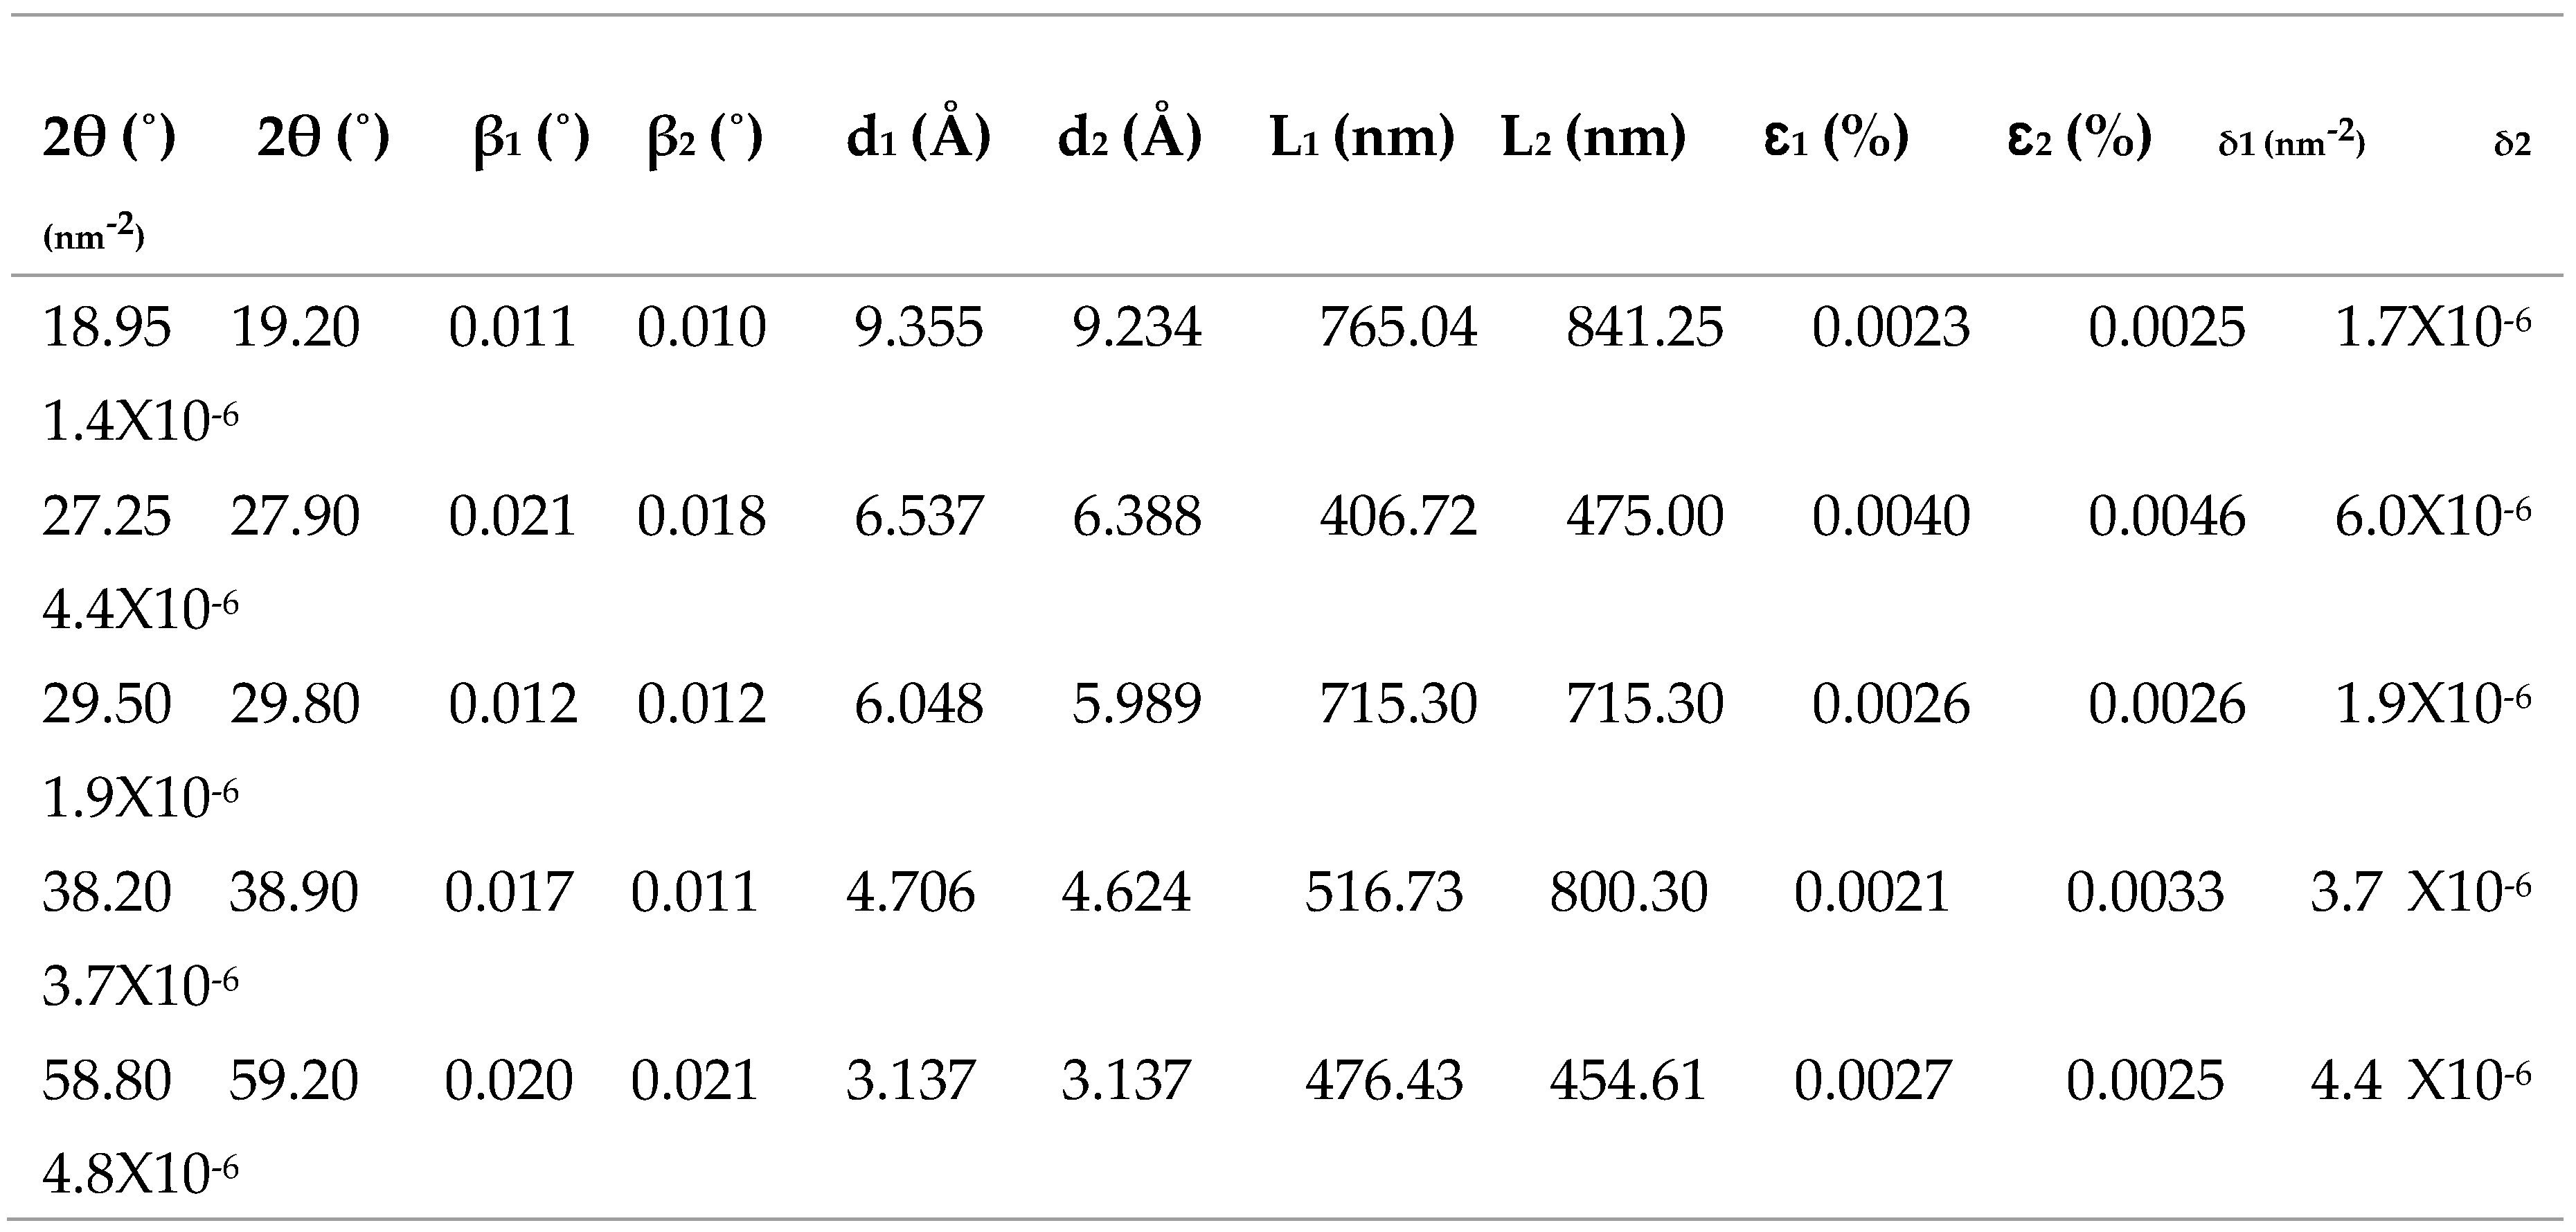
Summary of structural parameter MnO2, ITO/RGO/TiO2/MAPbI3/Gr and ITO/RGO/TiO2/MAPbI3/Gr.
Table 8.
Summary of structural parameter MnO2, ITO/RGO/TiO2/MAPbI3/Gr and ITO/RGO/TiO2/MAPbI3/Gr.
Figure 9.
XRD patterns of ITO/RGO/ TiO2/CH 3NH3PbI3/Gr and ITO/RGO/ TiO2/CH3NH3PbI3/Gr- MnO2 films.
Figure 9.
XRD patterns of ITO/RGO/ TiO2/CH 3NH3PbI3/Gr and ITO/RGO/ TiO2/CH3NH3PbI3/Gr- MnO2 films.
4.3.4. SEM Characterization of ITO/RGO/ TiO2/CH 3NH3PbI3/Gr and ITO/RGO/ TiO2/CH3NH3PbI3/Gr- MnO2 Films
The reference film without MnO
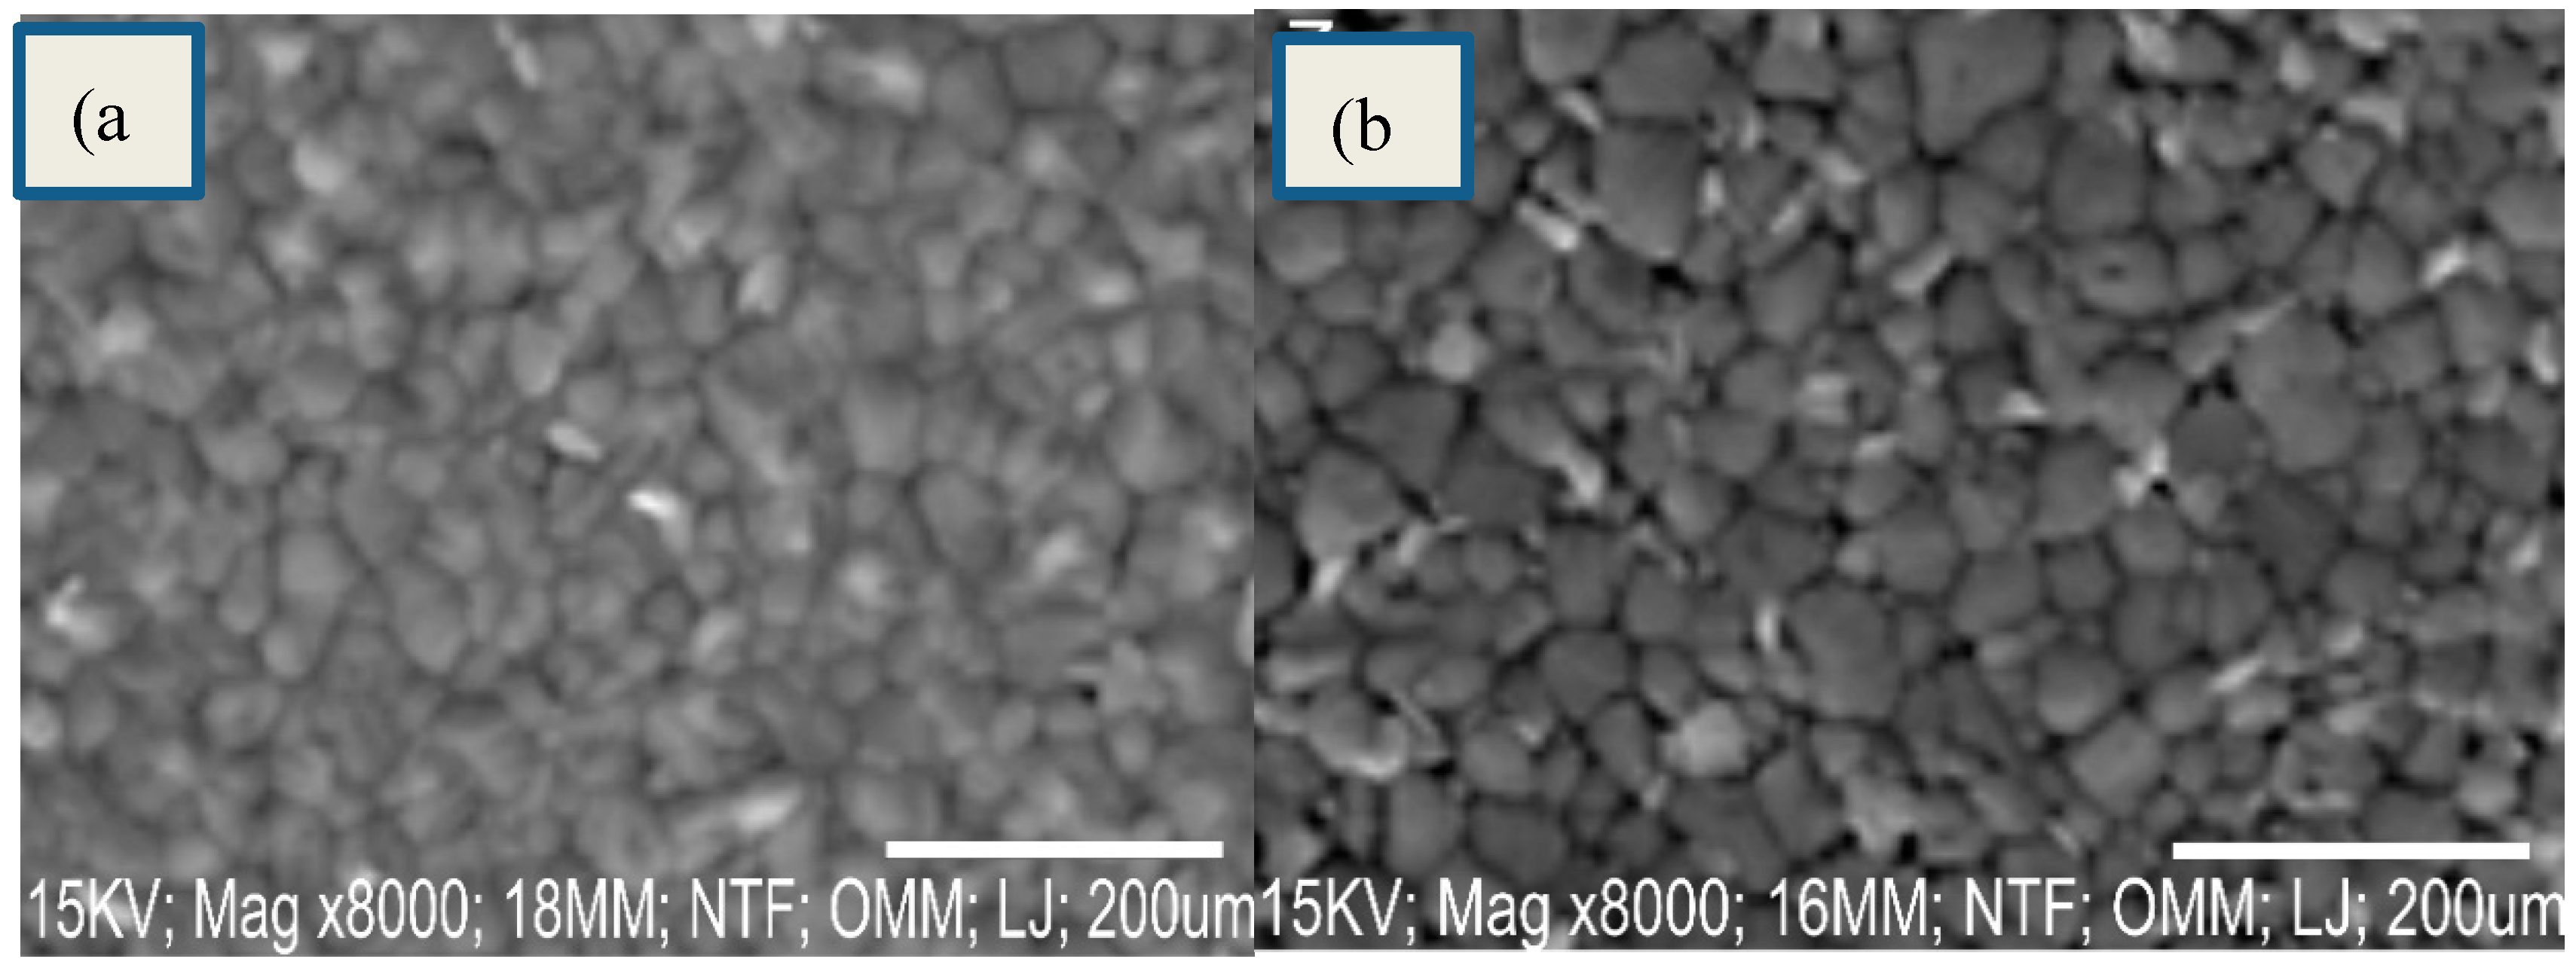
2 showed high film coverage, uniform morphology with apparent grain boundaries (
Figure 9a) typical of perovskite films synthesized using the solution processed in one step method (Yang
et al., 2019, He
et al., 2020, Chiang
et al., 2017). There was an evidence of compositional uniformity, and thus the grain boundaries were ubiquitous. No cracks were observed throughout the films (
Figure 10a).Interesting, ITO/RGO/TiO
2/CH
3NH
3PbI
3/Gr film modified with MnO
2 exhibited a more uniform and compact structure compared to the reference film (
Figure 9b). As seen in
Figure 9b, there was evidence of more smooth surface which confirmed crystallinity enhancement. The average grain size(s) calculated for ITO/RGO/TiO
2/CH
3NH
3PbI
3/Gr and ITO/RGO/TiO
2/CH
3NH
3PbI
3/Gr-MnO
2 films were ̴ 620 nm and ̴ 696 nm using intercept technique. This result confirms the morphology improvement of ITO/RGO/TiO
2/CH
3NH
3PbI
3/Gr modified with MnO
2.
Figure 10.
SEM images of ITO/RGO/ TiO2/CH 3NH3PbI3/Gr and ITO/RGO/ TiO2/CH3NH3PbI3/Gr- MnO2 films.
Figure 10.
SEM images of ITO/RGO/ TiO2/CH 3NH3PbI3/Gr and ITO/RGO/ TiO2/CH3NH3PbI3/Gr- MnO2 films.
4.3.5. Photovoltaic Performance of ITO/RGO/ TiO2/CH 3NH3PbI3/Gr and ITO/RGO/ TiO2/CH3NH3PbI3/Gr- MnO2 Films
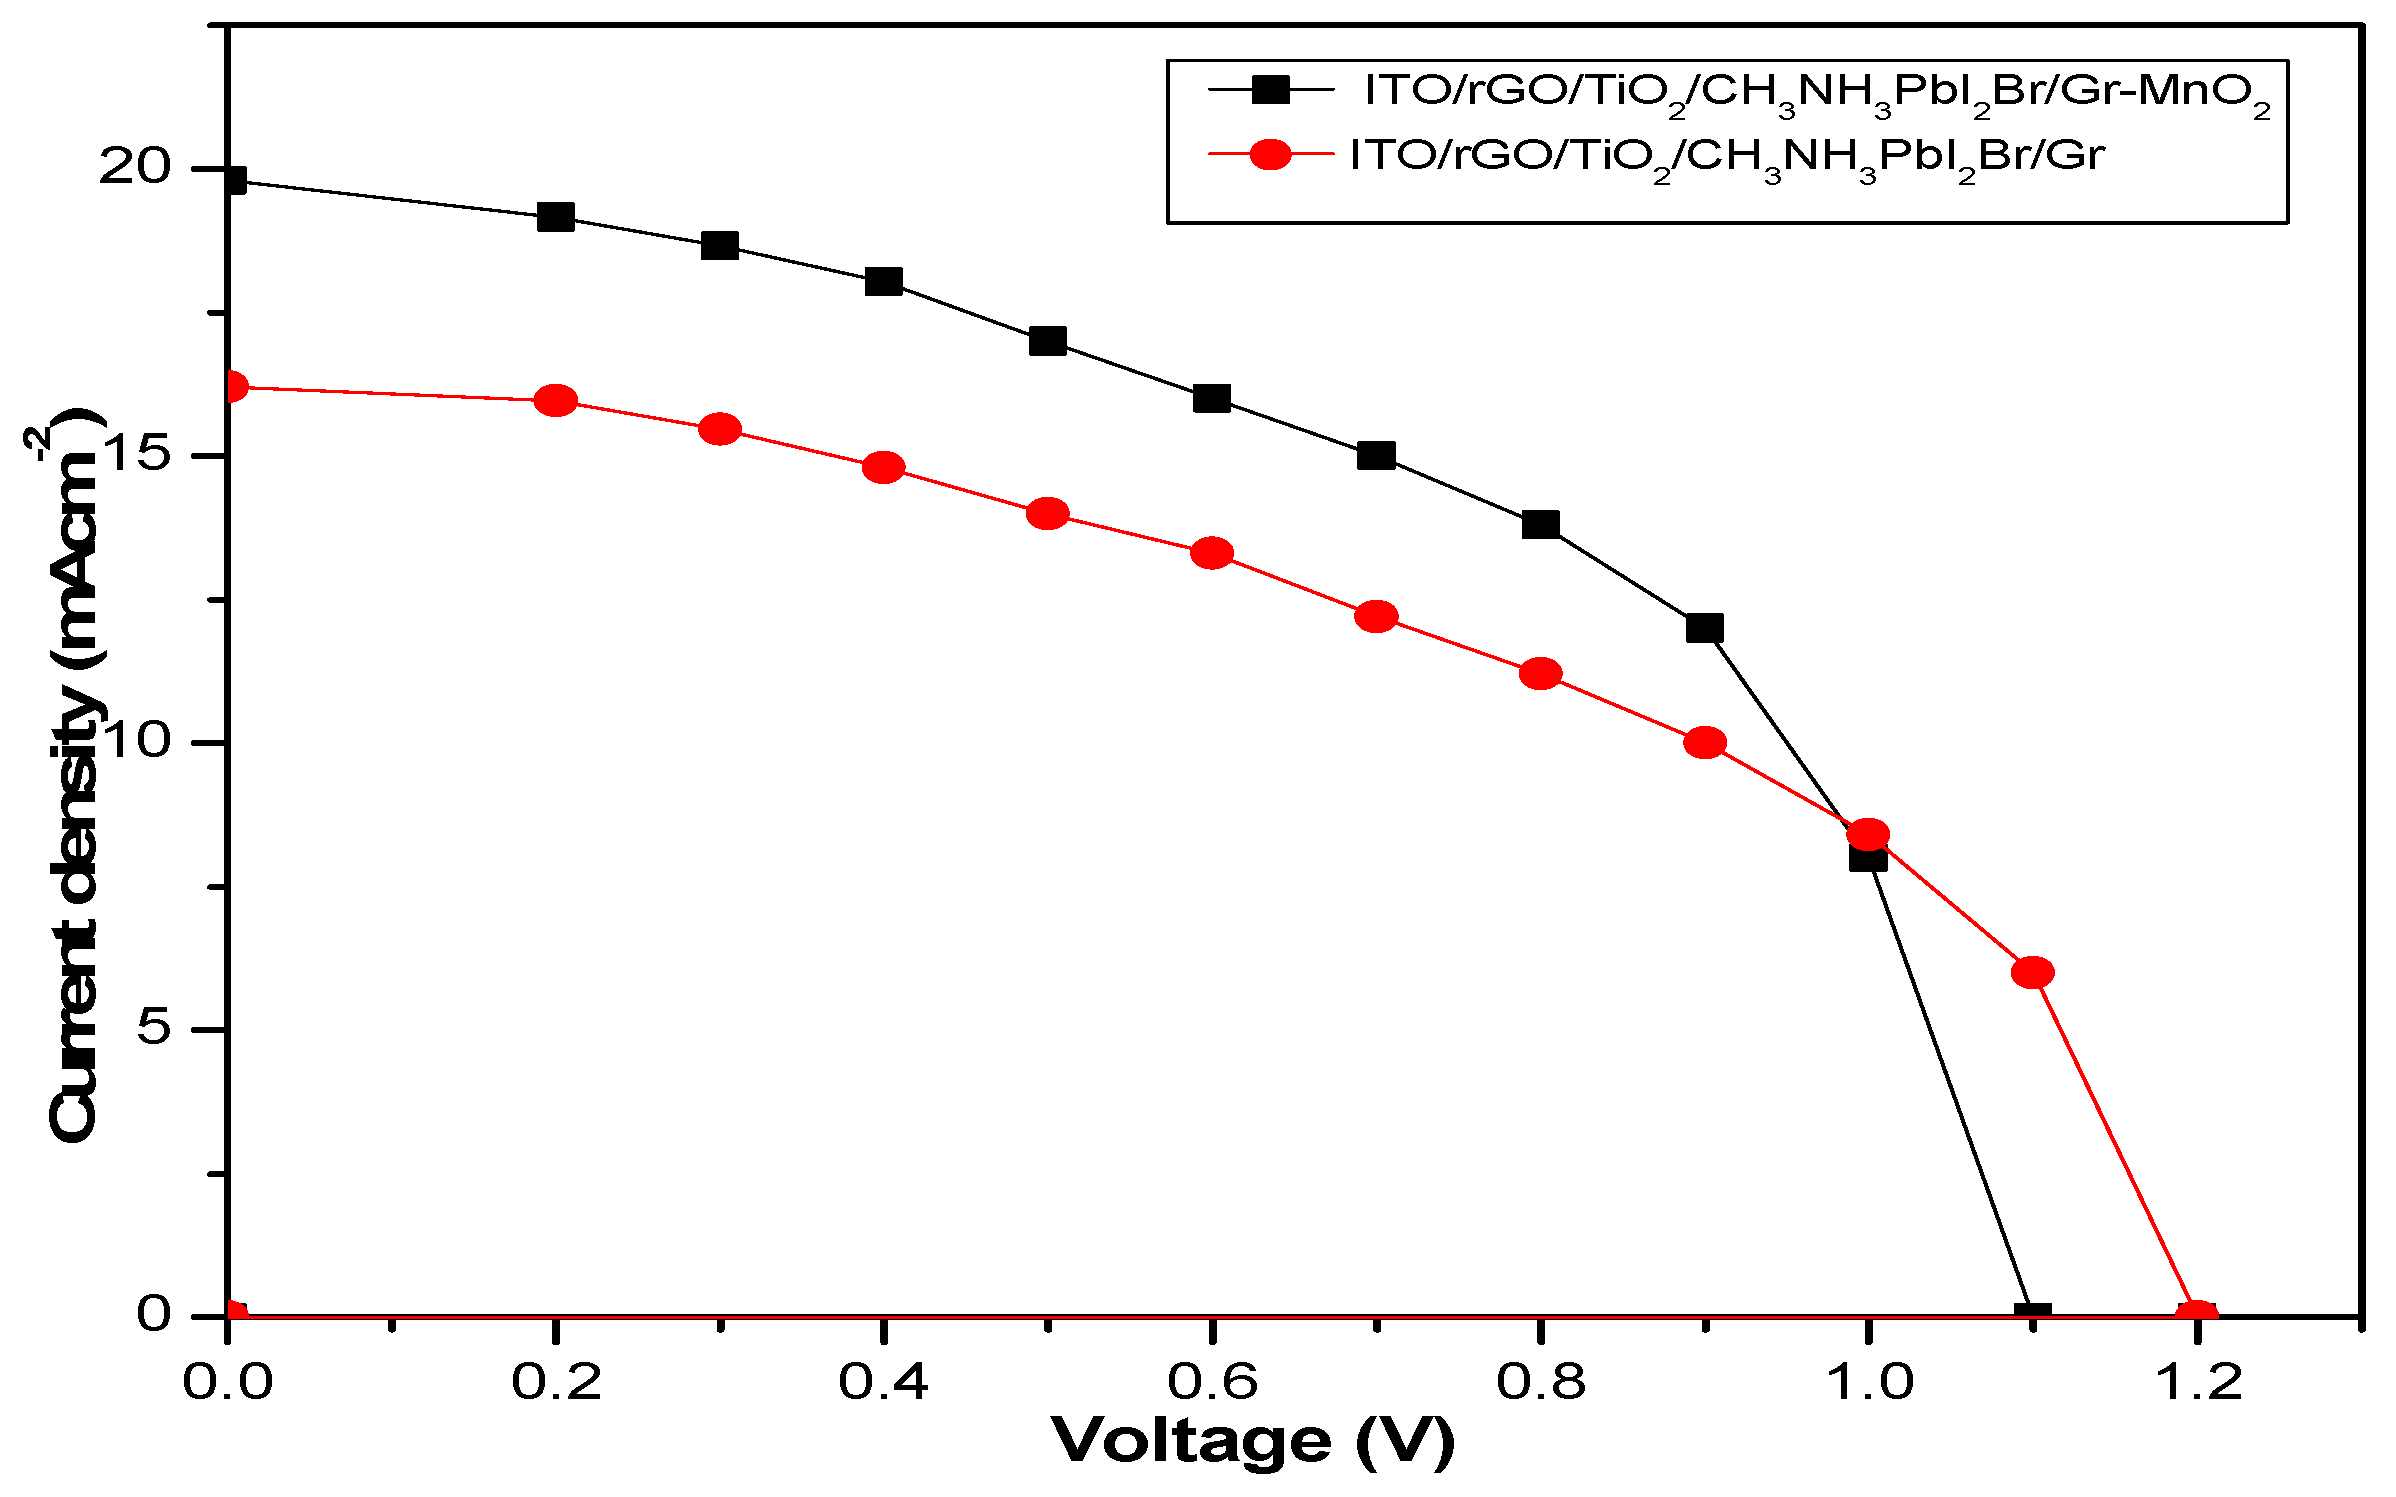
The photovoltaic performance parameters (such as Jsc, Voc, FF, and PCE) are shown in the
Figure 11 As seen in
Table 9, the incorporation of MnO
2 into the second device produced an increased in the value of Jsc from 16.25 mAcm
-2 to 19.00 mAcm
-2. This is due to the improved charge extraction and transfer ability induced in the second device by modification with MnO
2.nanoparticles. FF also increased from 47.48 % to 51.53 %. This indicates that the incorporation of MnO
2 enhanced the grain size of the perovskite absorber and the crystallinity of the absorber at the interface between the absorber and the ETL. As the grain size increases, the grain boundary reduces, thereby eliminating the charge trapping regions within the perovskite structure. However, the variation in the values of Voc in both devices could be as a result of hysteresis effect (Ihly et al, 2016). From the obtained photovoltaic parameters, the PCE increased from 8.64% to 10.79% with an enhancement value of 21.79%. This is due to tailored functionality of MnO
2 in the generation of functional group that act as conducting bridge in reducing the contact resistance between individual nanoparticle.
Table 9.
Summary of Photovoltaic parameter of ITO/RGO/TiO2/MAPbI3/Gr and ITO/RGO/TiO2/MAPbI3/Gr.
Table 9.
Summary of Photovoltaic parameter of ITO/RGO/TiO2/MAPbI3/Gr and ITO/RGO/TiO2/MAPbI3/Gr.
Figure 11.
J-V curves of ITO/RGO/ TiO2/CH 3NH3PbI3/Gr and ITO/RGO/ TiO2/CH3NH3PbI3/Gr- MnO2 films
Figure 11.
J-V curves of ITO/RGO/ TiO2/CH 3NH3PbI3/Gr and ITO/RGO/ TiO2/CH3NH3PbI3/Gr- MnO2 films
4. Conclusion
In this work, ITO/RGO/TiO2/CH3NH3PbI3/Gr and ITO/RGO/TiO2/CH3NH3PbI3/Gr-MnO2 were fabricated on ITO glass slide using solution process-based spin coating method, and their properties were studied. The bandgaps of ITO/RGO/TiO2/CH3NH3PbI3/Gr-MnO2 compared to ITO/RGO/TiO2/CH3NH3PbI3/Gr decreased from 1.75 to 1.65 eV. Besides, the XRD patterns showed variation in the intensity of diffraction angles. The average crystallite size and d-spacing of 657.37 nm and 5.797Å were calculated for ITO/RGO/TiO2/CH3NH3PbI3/Gr-MnO2 compared to 576.05 nm and 5.956 Å calculated for ITO/RGO/TiO2/CH3NH3PbI3/Gr film. J-V curves of ITO/RGO/TiO2/CH3NH3PbI3/Gr and ITO/RGO/TiO2/CH3NH3PbI3/Gr-MnO2 showed that the PCE increased from 8.64% to 10.79%. The Jsc and FF also increased from 16.25 Acm-2-19.00 Acm-2 and 47.48%-51.53% respectively. The enhancement value of 21.79% was achieved with MnO2 passivation.
Acknowledgments
The authors profoundly acknowledge technical supports of the Material Science and Engineering Laboratory, KWASU, Molete and Industrial Laboratory, Pure and Applied Chemistry Department, LAUTECH, Ogbomoso.
Conflicts of Interest
The authors declare no conflicts of interest.
References
- Awodugba A.O, Adedokun. O. (2011). On the physical and Optical Characterizationof CdS Thin Films Deposited by the Chemical Bath Deposition Technique, The Pacific Journal of Sci. and Tech, 334─ 341.
- Bhatti H.S., HussainS.T., Khan F.A., Hussain S.(2016) Synthesis and induced multiferrroicity of perovskite PbTiO3. Appl. Surf. Sci. 367:291-306.
- Chavan R.D., Prochovic D., BuczakB., Tavakoli M.M., Yedav P., Fialkowski M. and HongC.K. (2020) Gold Nanoparticle Functionalized with Fullerene Deivatives as an Effective Interface Layer for Improving the Efficiency and Stability of Planar Perovskite Solar Cells. Adv. Mater. Interface Early View 2001144.
- Chieng C.H., Nazeeruddin K., Gratzelc M. and Wu C.G. (2017) The Synergistic Effect On H2O and DMF Towards Stable and 20 % Efficiency Inverted Perovskite Solar Cells. Energy Environ. Sci. 10, 808-817.
- Gao F., Zhang X., Zhao Y. and You J. (2019) Recent Progresses on Defect Passivation Towards Efficient Perovskite Solar Cells. Adv. Energy Mater 10, 1902650.
- Ihly R, Dowgiallo A M, Yang M, Schulz P, Stanton N J, Reid O G, Ferguson A J, Zhu K, Berry J J,Blackburn J L (2016). Efficient Charge Extraction and Slow Recombination in Organic– inorganic Perovskites Capped with Semiconducting Single walled Carbon Nanotubes. Energy Environ. Sci. 9, 1439-1449. [CrossRef]
- Jiang J., Wang Q., Jin Z., Zhang X., Lei J., Bin H., Zhang Z., Li Y. and Liu S.F (2017)Polymer Doping for High-efficiency Perovskit eSolar Cell with Improved Moisture Stability. Adv. Energy Mater 8,1701757.
- Han T.H., Lee J.W., Choi C., Tan S., Lee C., Zhao Y., Dai Z., Marco N.D., Lee S.J., Bae S.H., Yuan Y.,Lee H.M., Huang Y., andYang Y.(2019) Perovskite Polymer Composite Cross-linker Approach for Highly Stable and Efficient Perovskite Solar Cells Nat. Common. 10, 520.
- Konios, D., et al., (2014) Dispersion behaviour of graphene oxide and reduced graphene oxide. J Colloid Interface Sci. 430: 108-12. [CrossRef]
- Markus D., Istiqomah I., Yusril A.F., Nasikhudin N., Yatimah A. and Worawat M. (2023) Potential of Enhancing MnO2 based Composite and Numerous Morphological for Enhancing Supercapacitors Performance. Journal of Material Sciences. 20,2077-2098.
- Masclocene N., Guaghardi A.(2021) Coherent nanotwins and dynamic disorder in caecium lead halide perovskite nanocrystals ACS Nano 11,3819 3831.
- Mohamad, F.R, Hanifah, J. J., Madzlan, A., Ahmad, F. I, Mukhlis, A.R and Mohd., H. D (2015) Synthesis of Graphene Oxide Nanosheets via Modified Hummers’ Method and Its Physicochemical Properties Journal Teknologi (Sciences & Engineering) 74: 195–198.
- Shao Y., Xiao Z.,Bi C., Yuan Y. and Huang J. (2014) Origin and Elimination of PhotocurrentHysteresis by Fullerene Passivation in CH3NH3PbI3Planar Heterojunction Solar Cells Nat Common 5,5784.
- Subodh K (2006). Spectroscopy of Organic Compounds. Department of Chemistry, Guru Nanak Dev University Amritsar-143005.
- Suriyavathana, M. and Ramalingam, K. (2015) Nanoparticles Synthesis and Antibacterial Studyon Anisomeles Malabarica using Manganese Oxide (MnO), International Journal of Chem. Tech Research, Vol.8, No.11 pp 466-473.
- Tumen-Ulzii G., Qui C., Leyden P., Wang P., Auffray M., Fujihara T., Matsushima T., Lee J.W,Lee S.J, Yang Y. and Aucachi C. (2020) Detrimental Effect of Unreacted PbI2 on the Long-term Stability of Pervskite Solar Cells Adv. Mater 1905035.
- Walton F., Wynne K. (2018) Control over phase separation and nucleation using a laser-tweezing potential. Nat. Chem. 10, 506-510. [CrossRef]
- Wang Q., Dang Q., Li T., Gruverman A and Hasung J. (2024) Thin Insulating Tunneling Contact for Efficient and Water-resistant Perovskite Solar Cells Adv Mater 28,6734-6739.
- Yang S., Dai J., Yu Z., Zhou Y., Xiao X., Zeng X.C. and Huang J. (2019) TailoringPassivation Molecular Structures for Extremely Small Open-circuit Voltage Loss in Perovskite Solar Cells. J. Am. Chem. Soc. 141, 5781-5787.
|
Disclaimer/Publisher’s Note: The statements, opinions and data contained in all publications are solely those of the individual author(s) and contributor(s) and not of MDPI and/or the editor(s). MDPI and/or the editor(s) disclaim responsibility for any injury to people or property resulting from any ideas, methods, instructions or products referred to in the content. |
© 2024 by the authors. Licensee MDPI, Basel, Switzerland. This article is an open access article distributed under the terms and conditions of the Creative Commons Attribution (CC BY) license (http://creativecommons.org/licenses/by/4.0/).
