Submitted:
03 May 2024
Posted:
07 May 2024
You are already at the latest version
Abstract
Keywords:
1. Introduction
2. Results
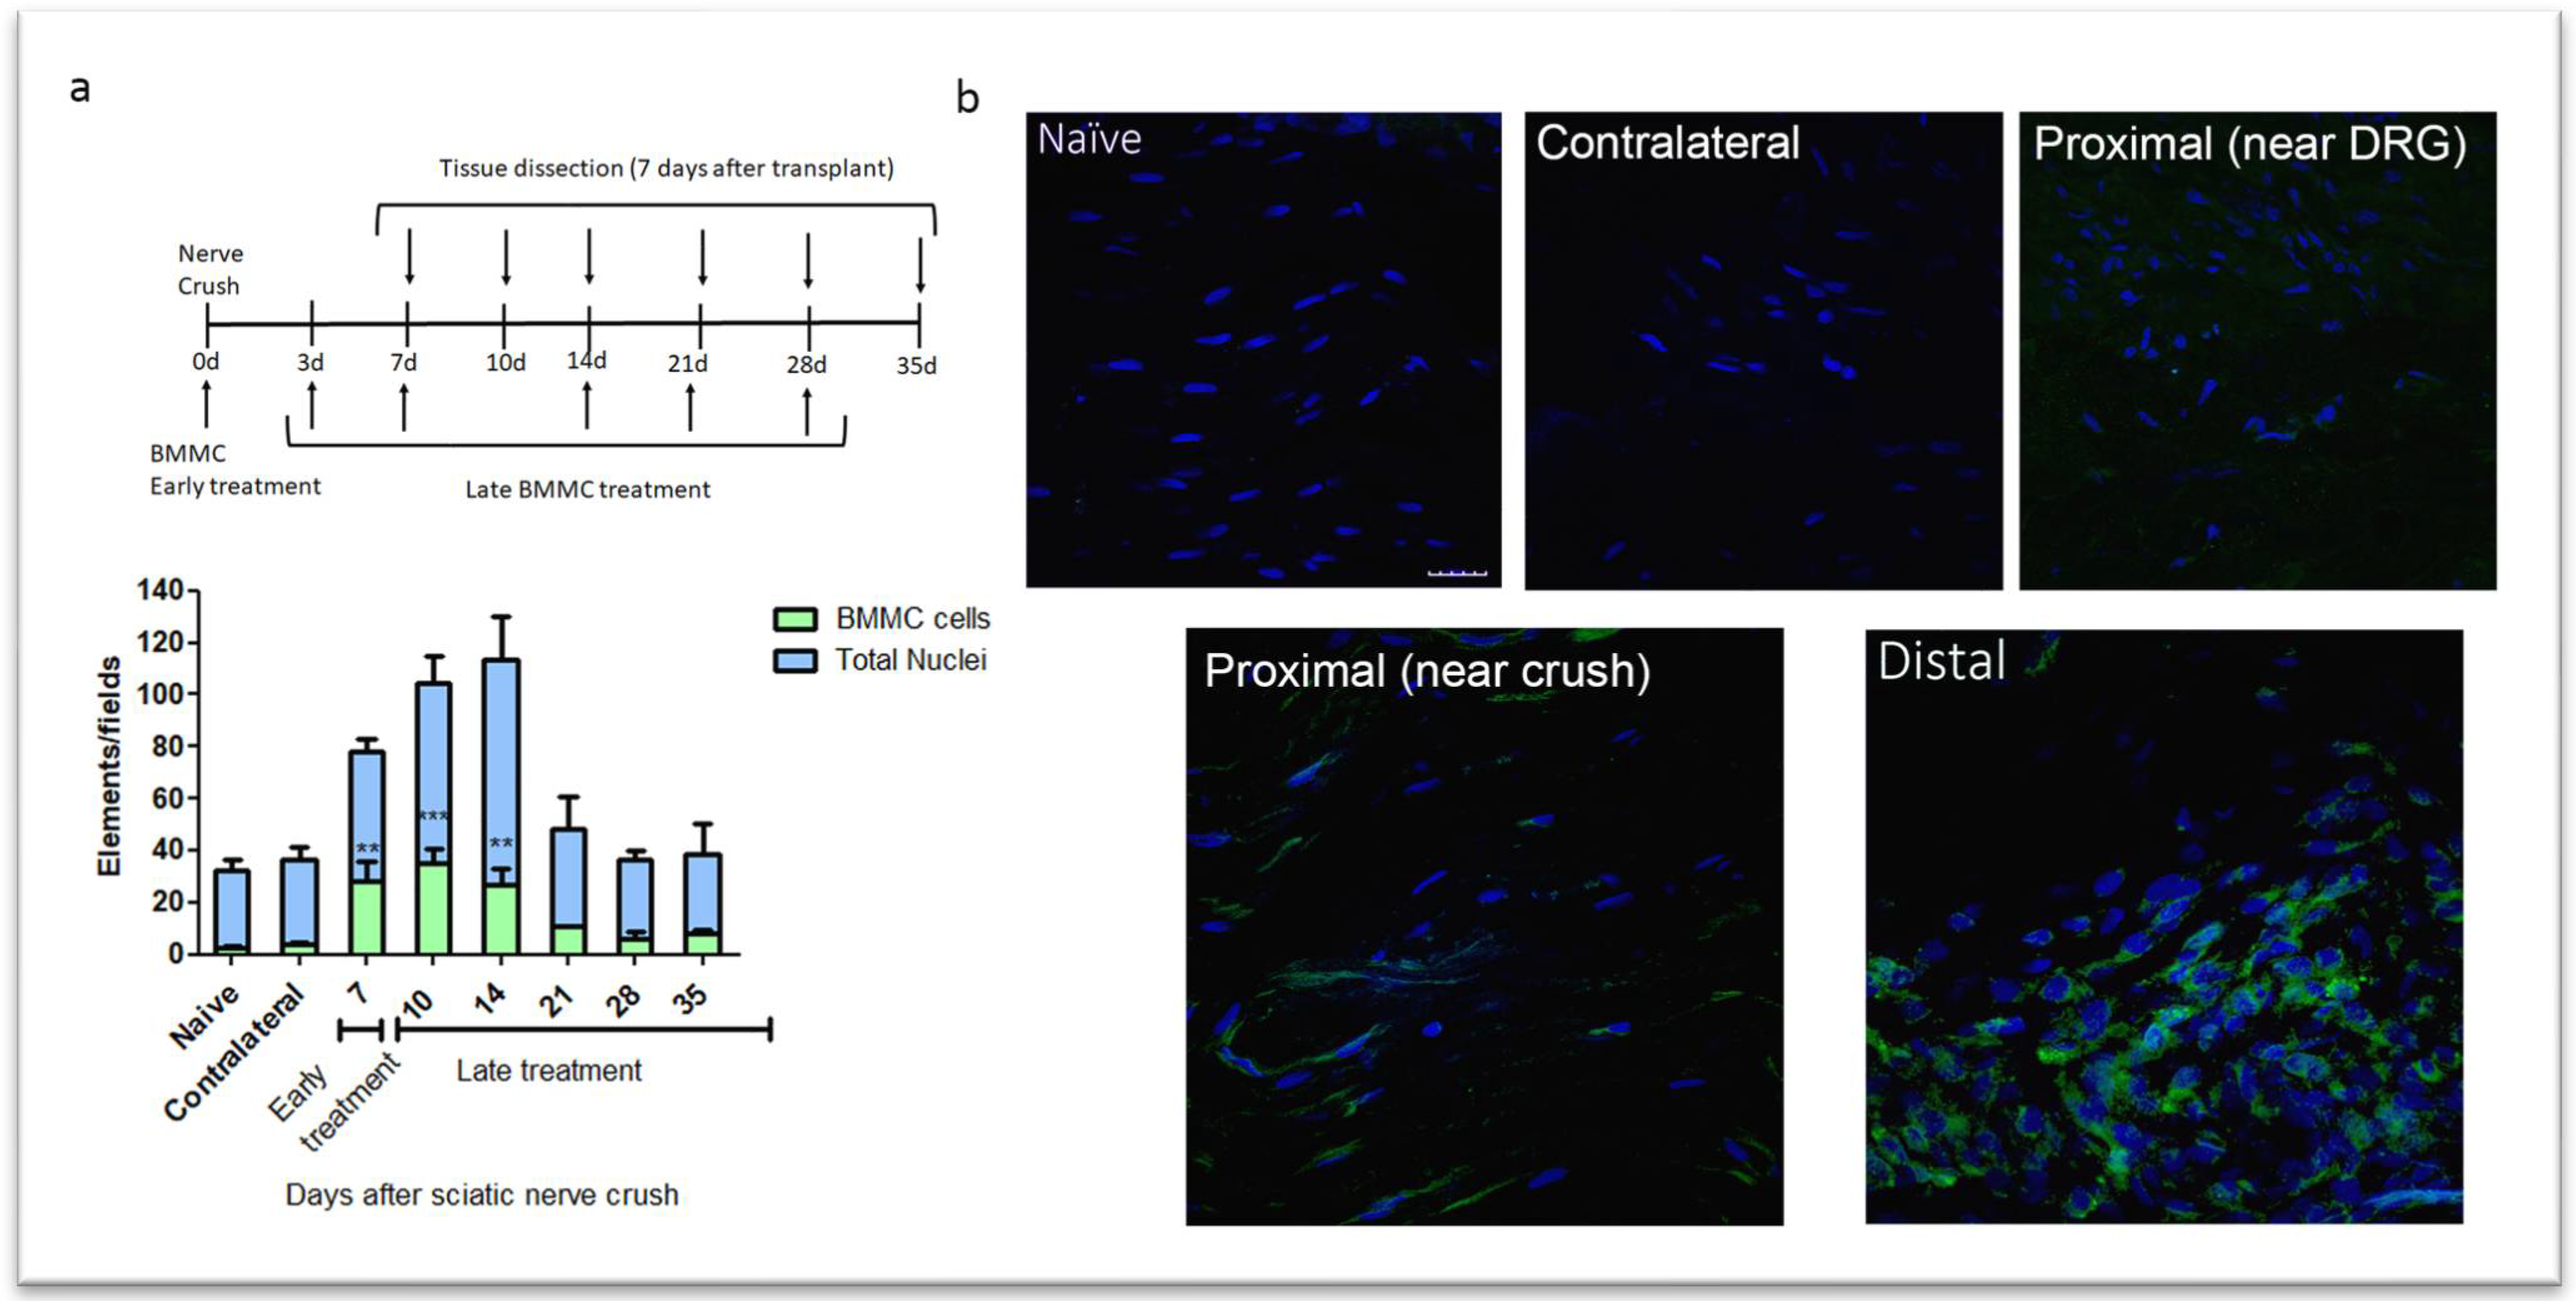
2.1. Kinetics of BMMC Migration
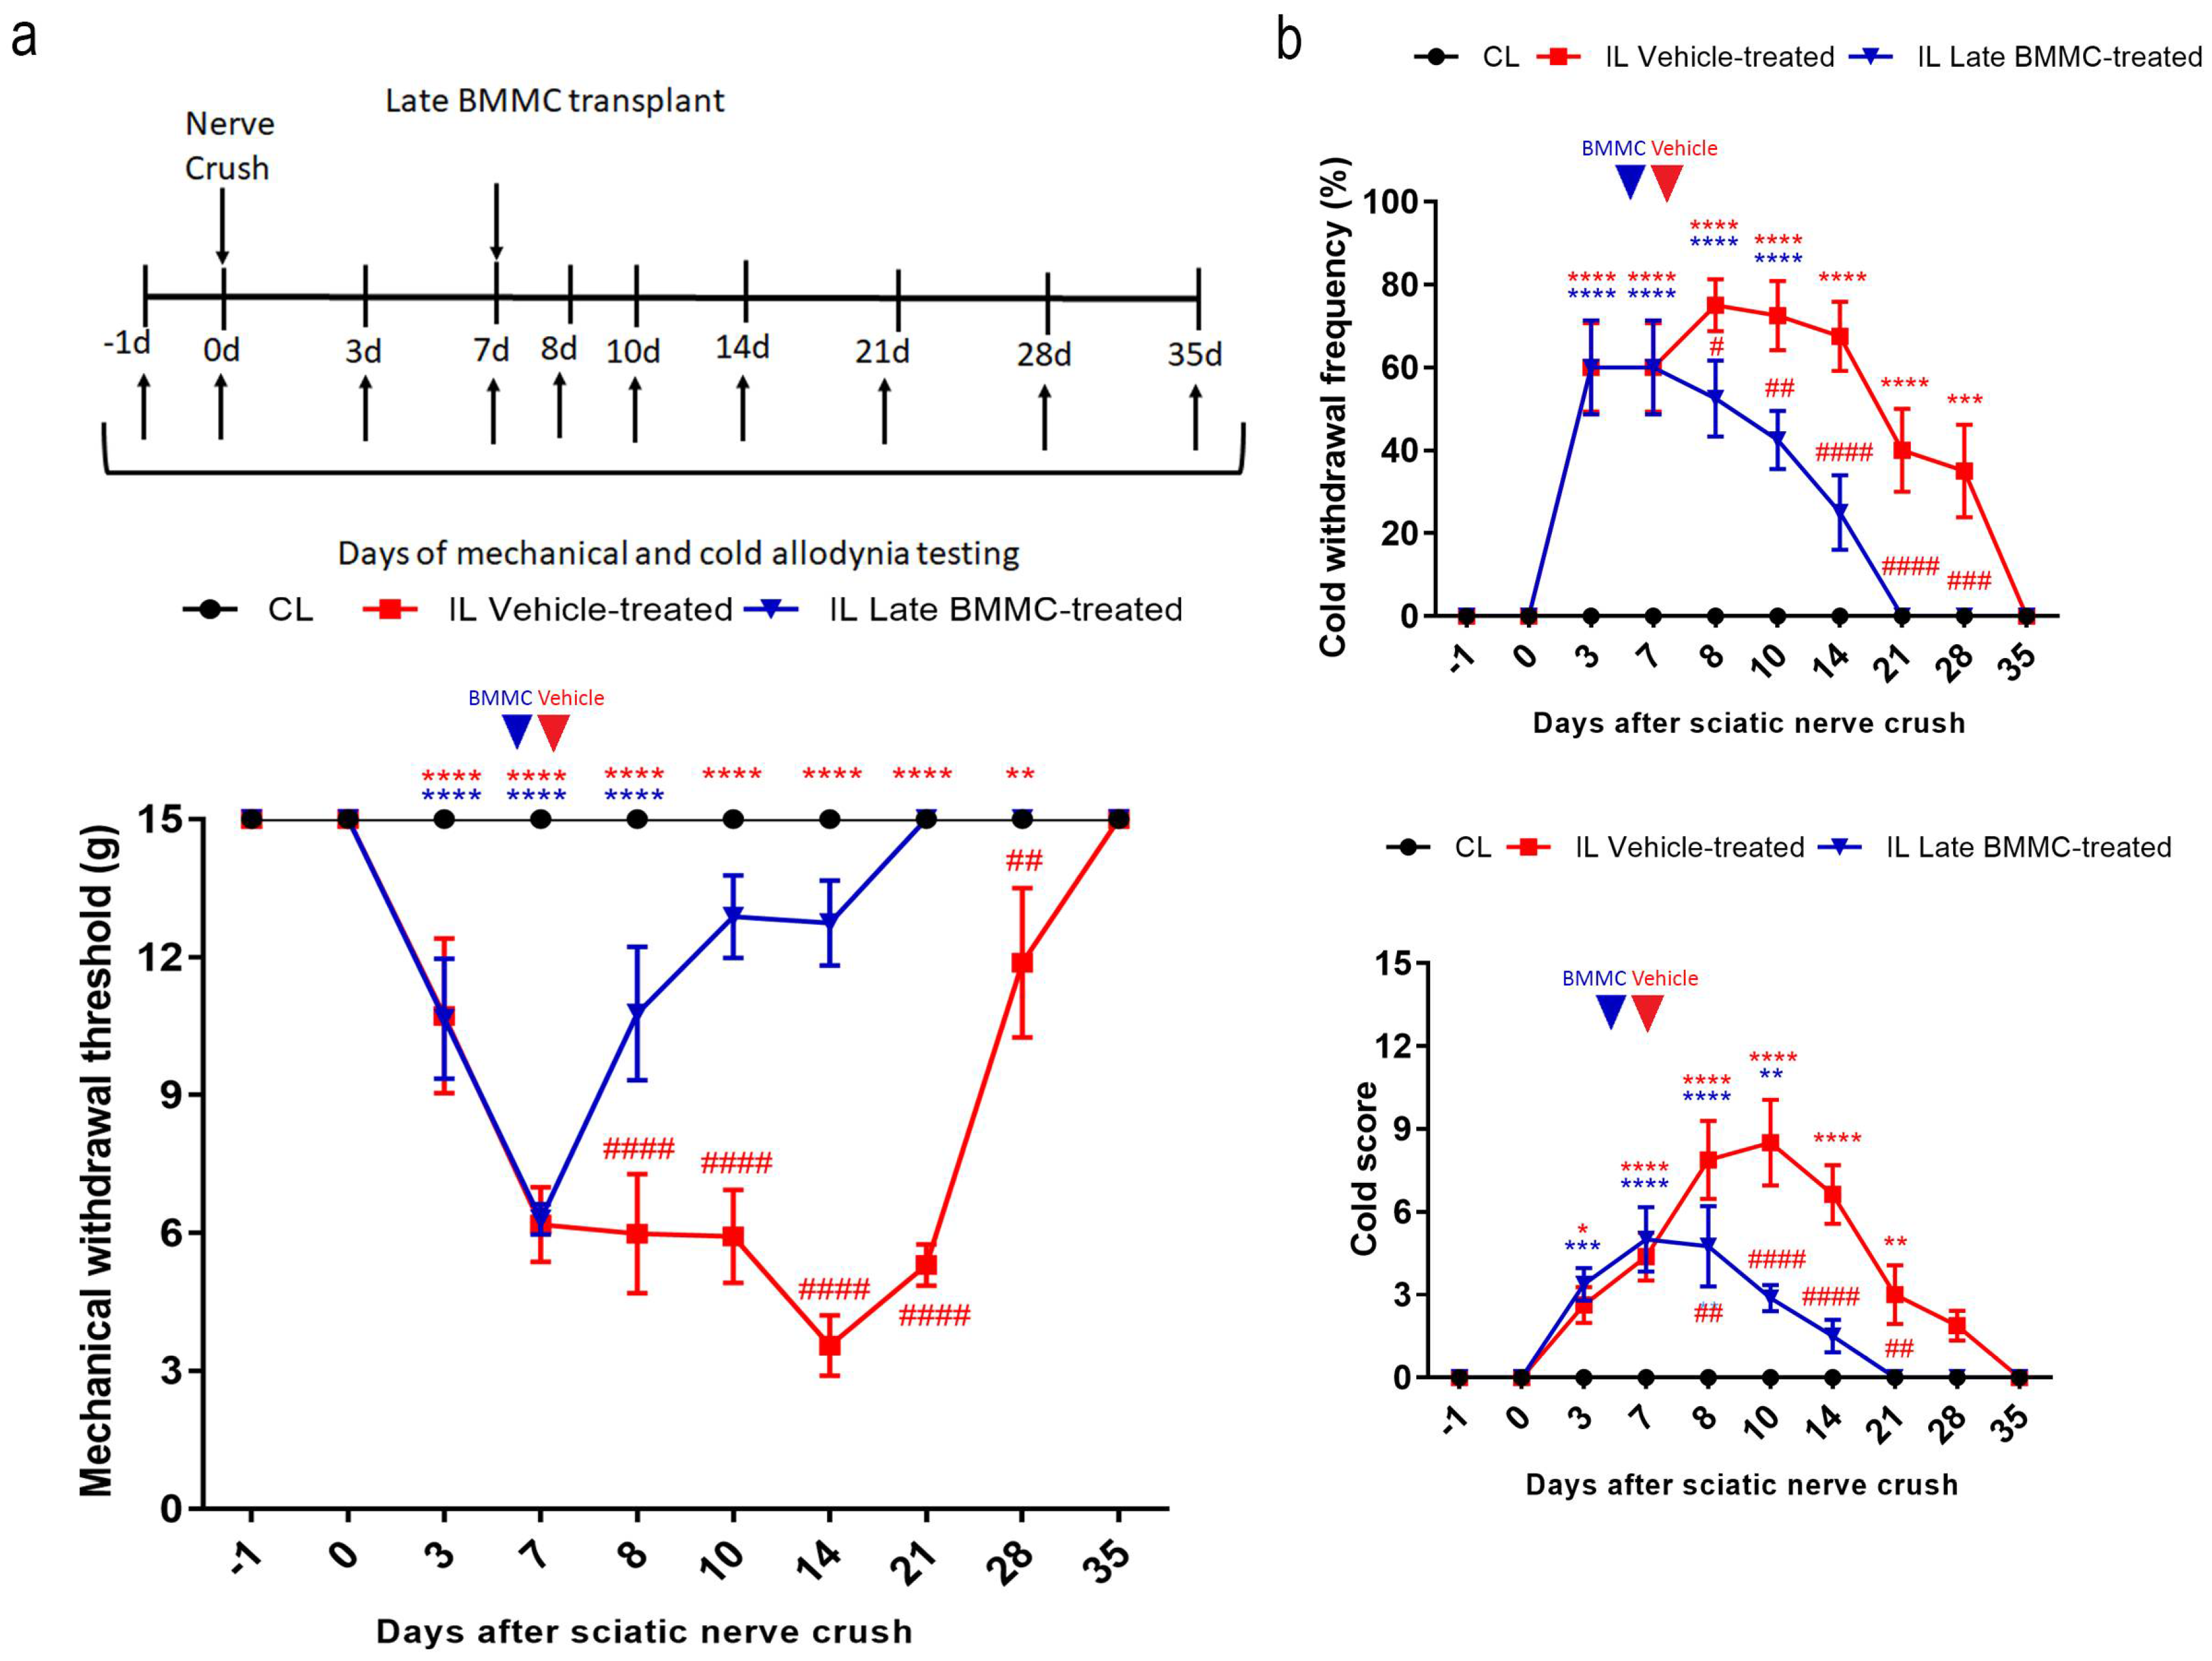
2.2. Effects of late BMMC Transplant on Mechanical and Cold Allodynia
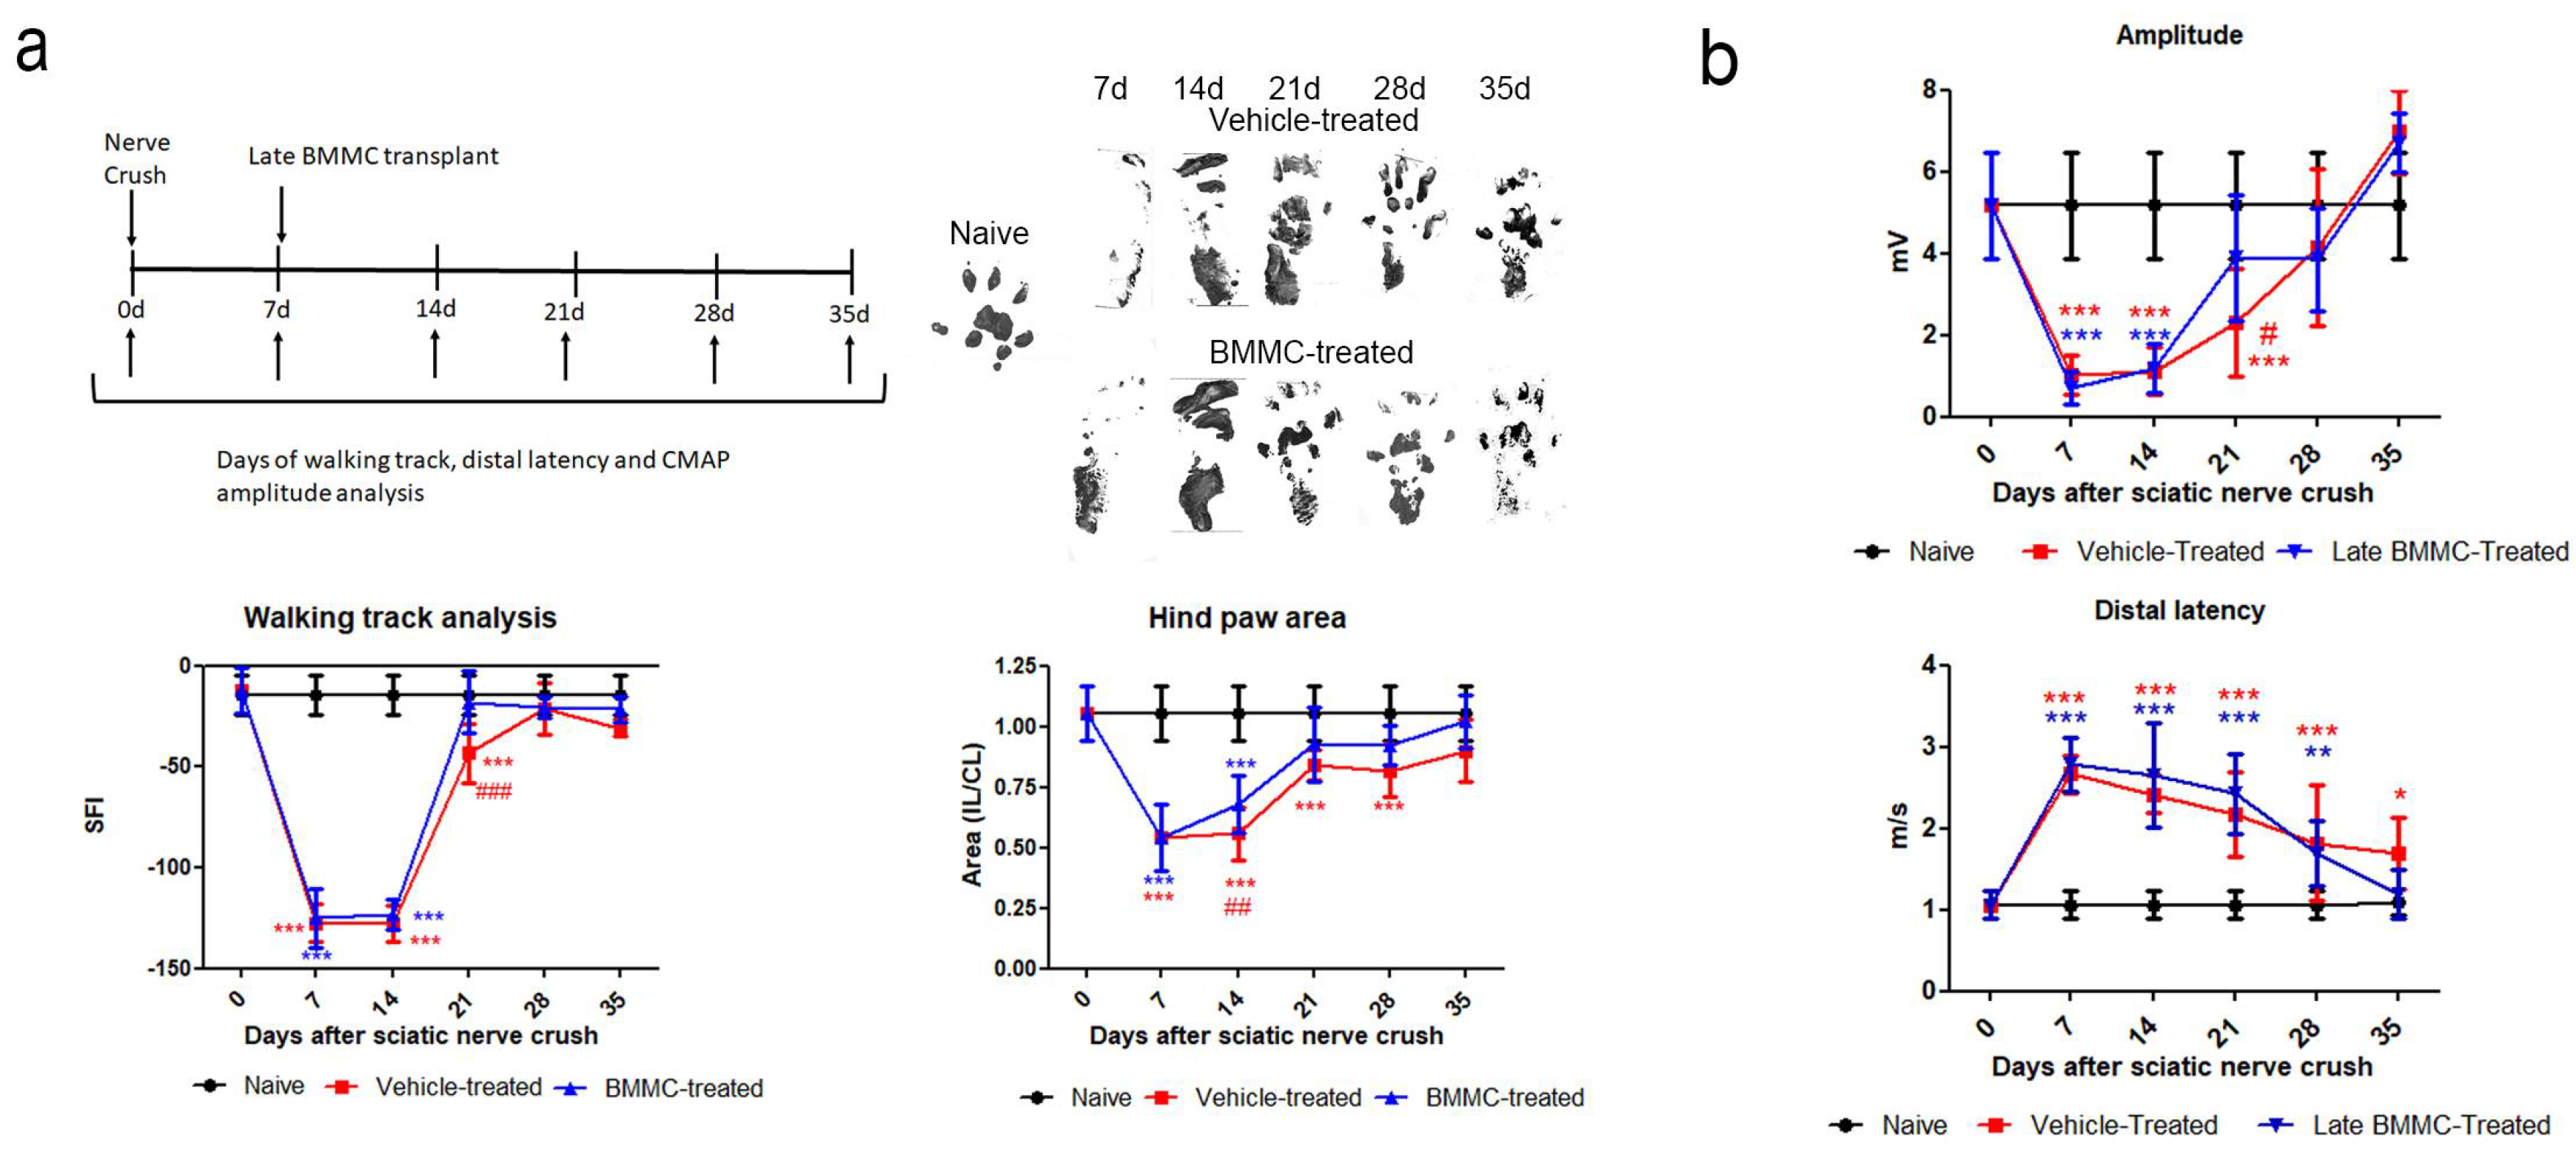
2.3. Effects of Late BMMC Treatment on SFI, Distal Latency and CMAP
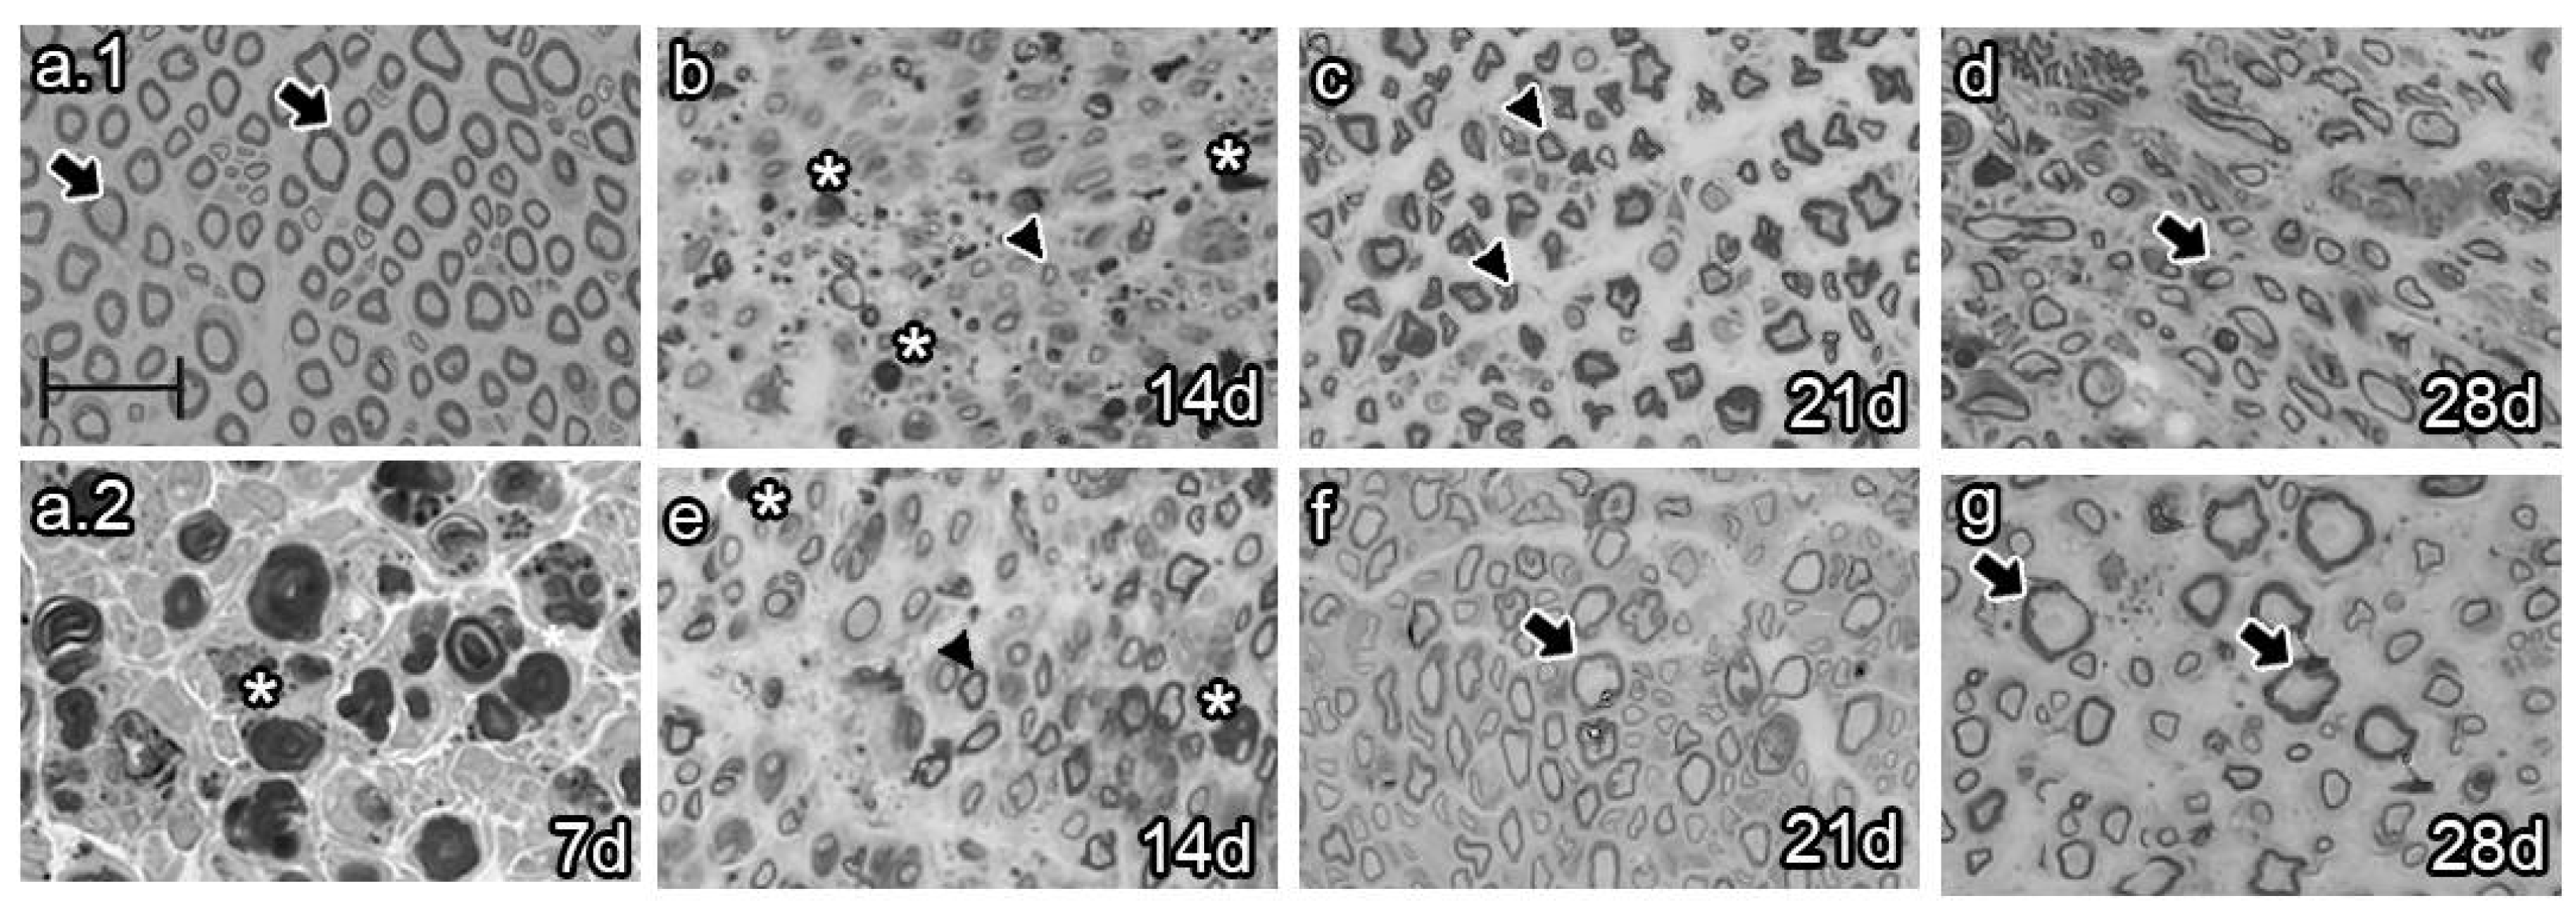
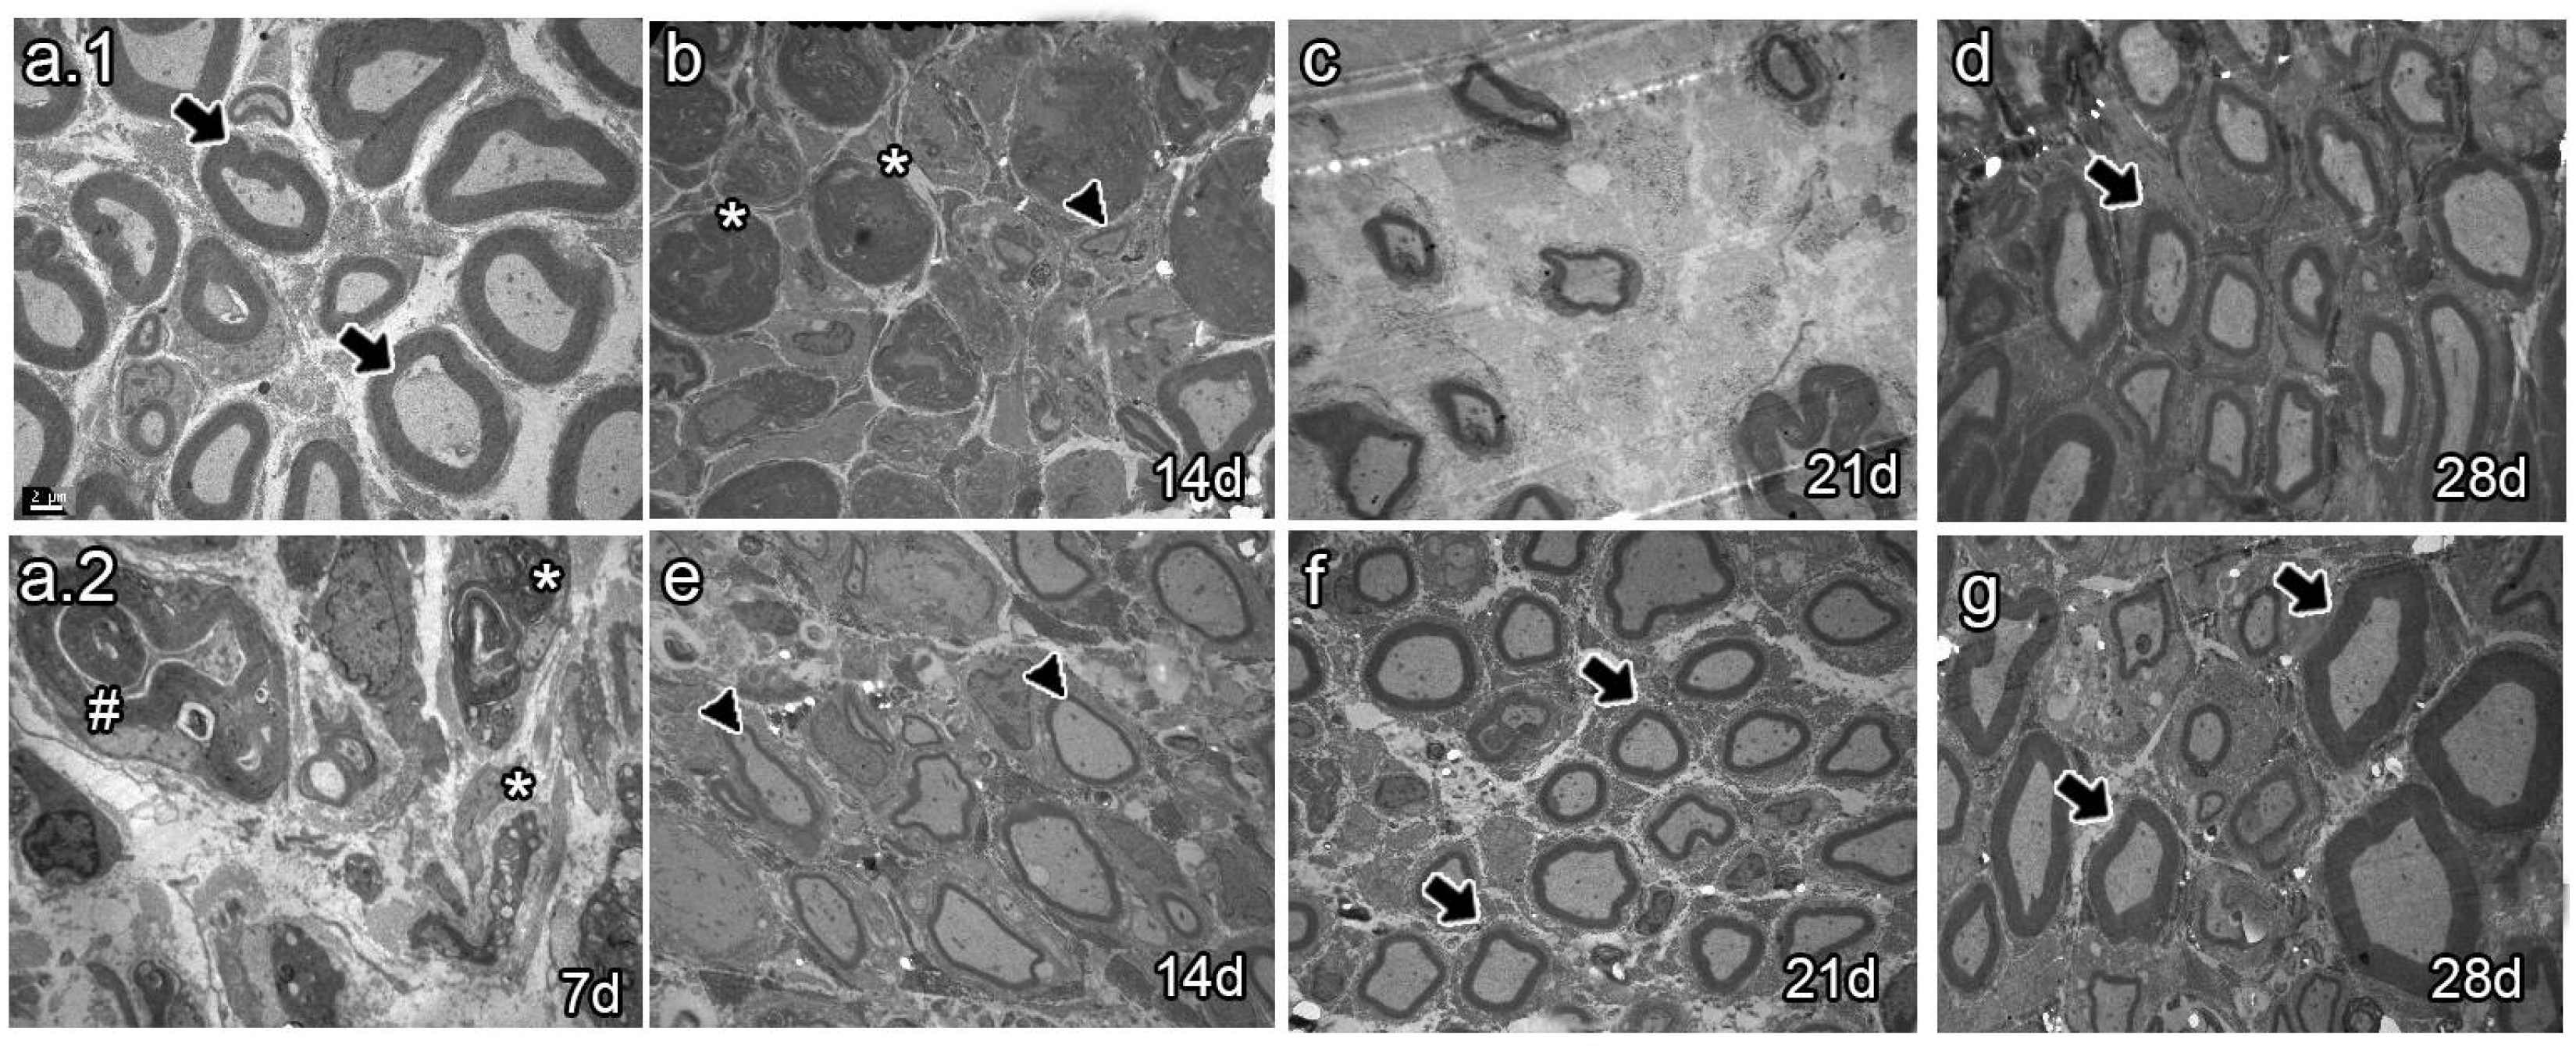
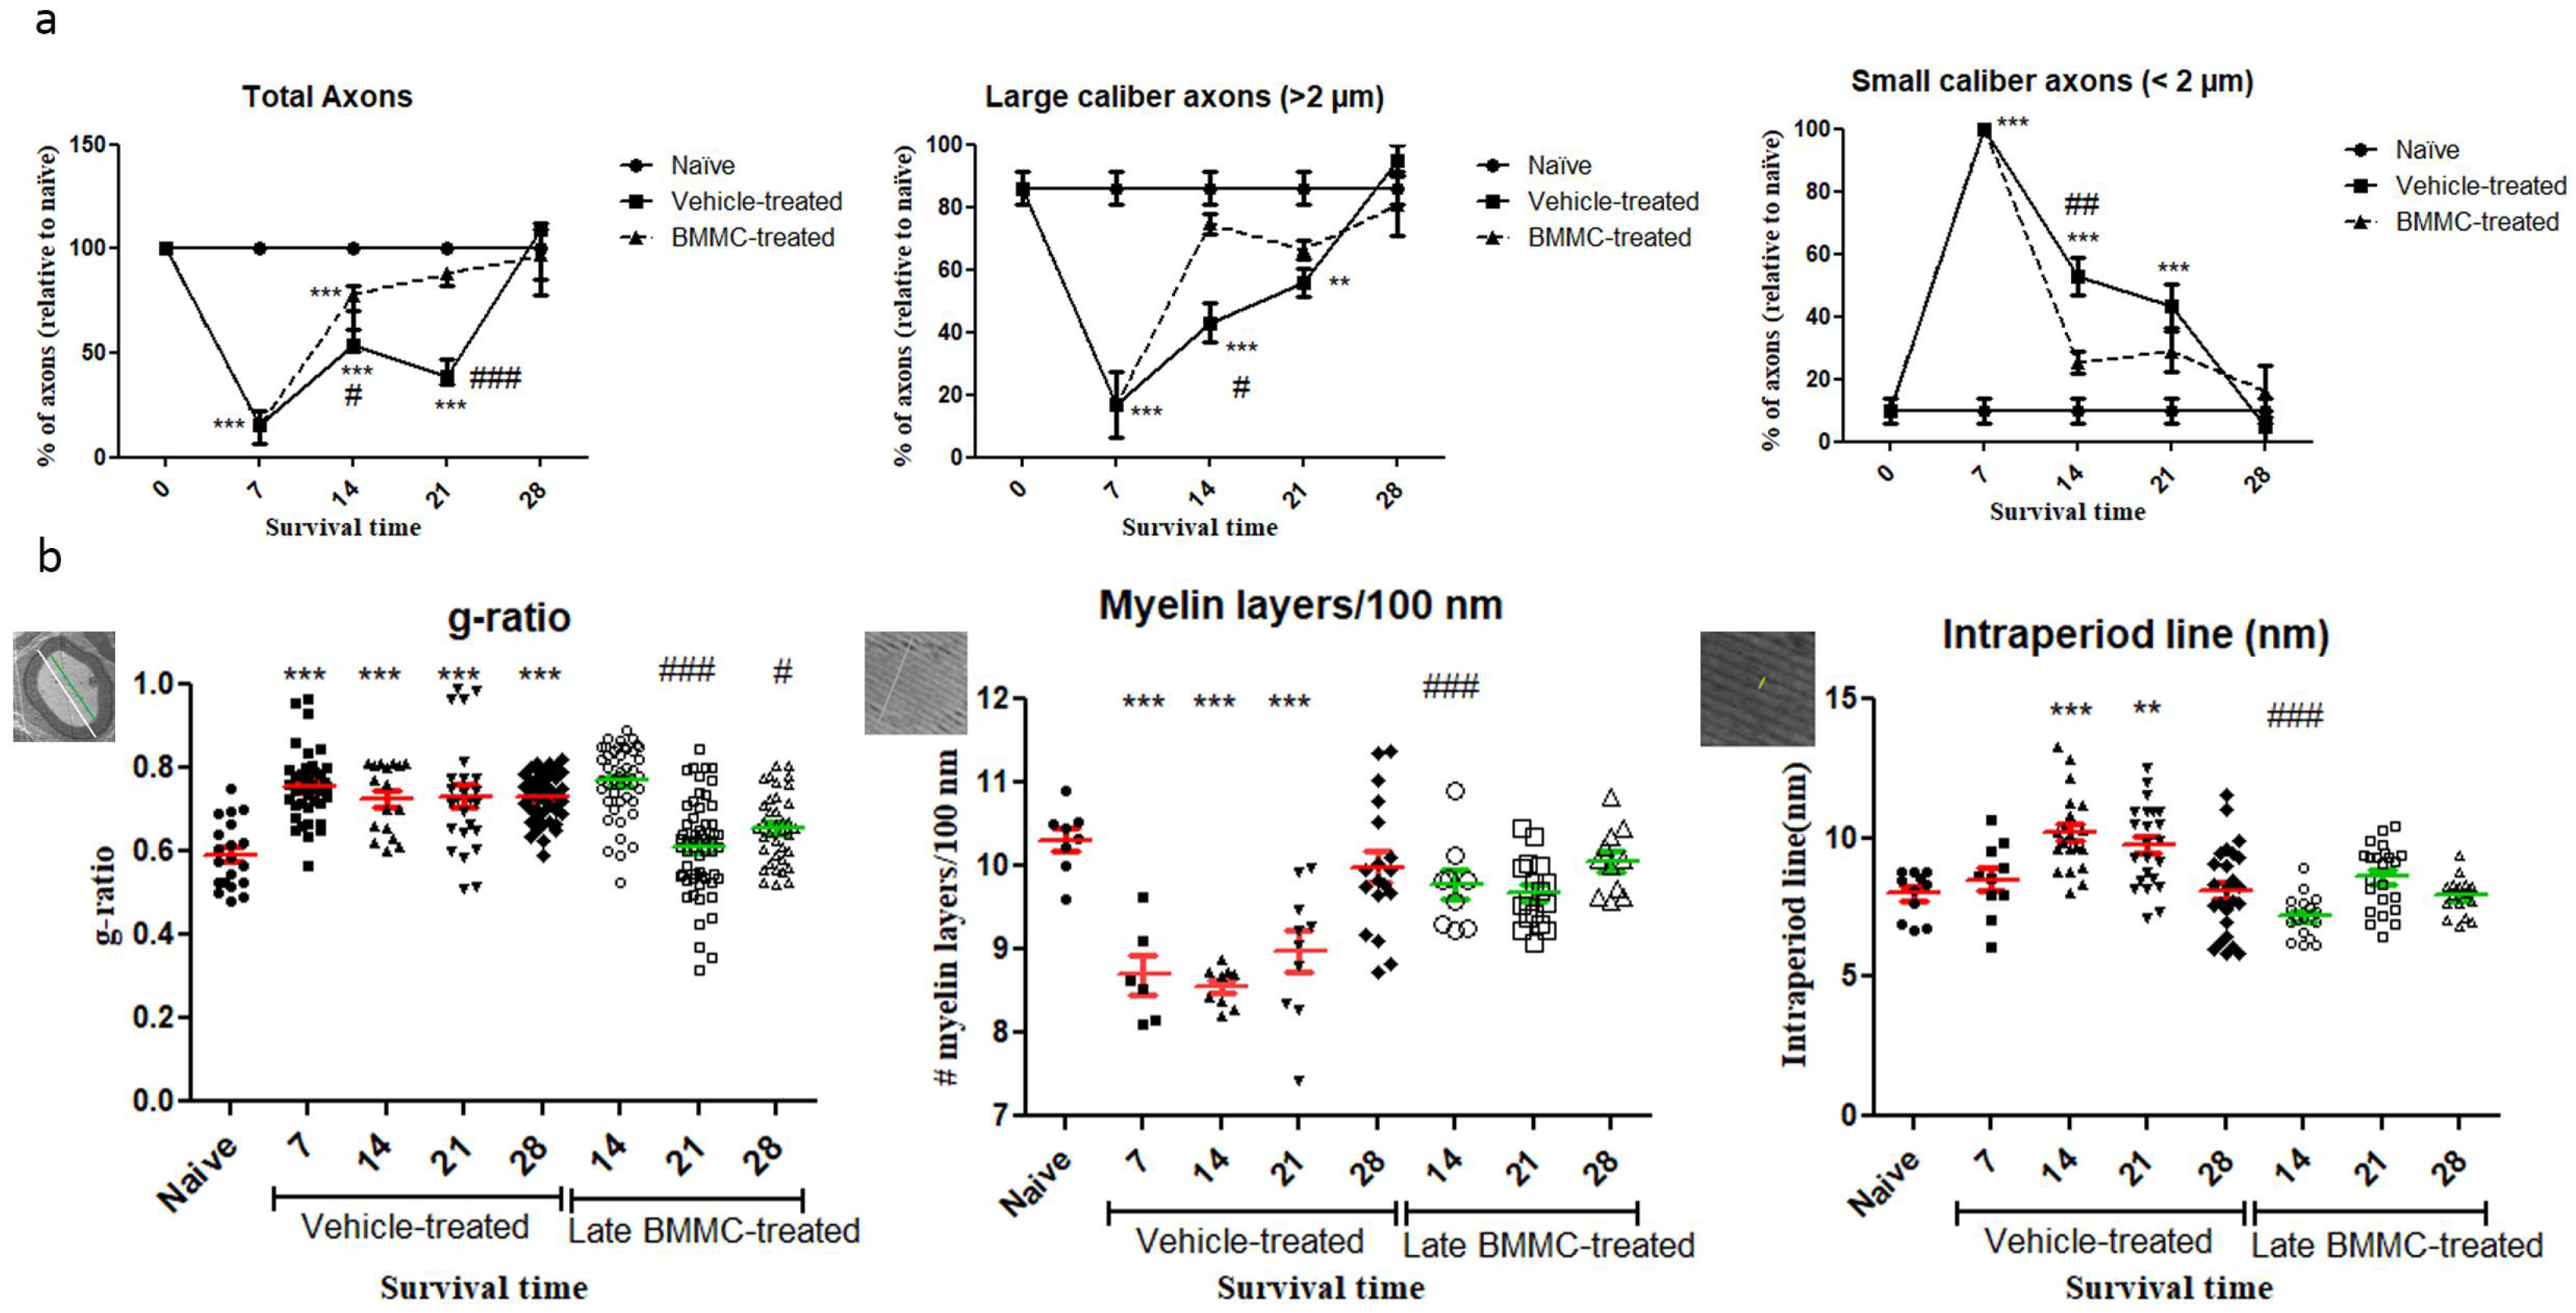
2.4. Effects of Late BMMC Transplant on Axon Number and Remyelination State
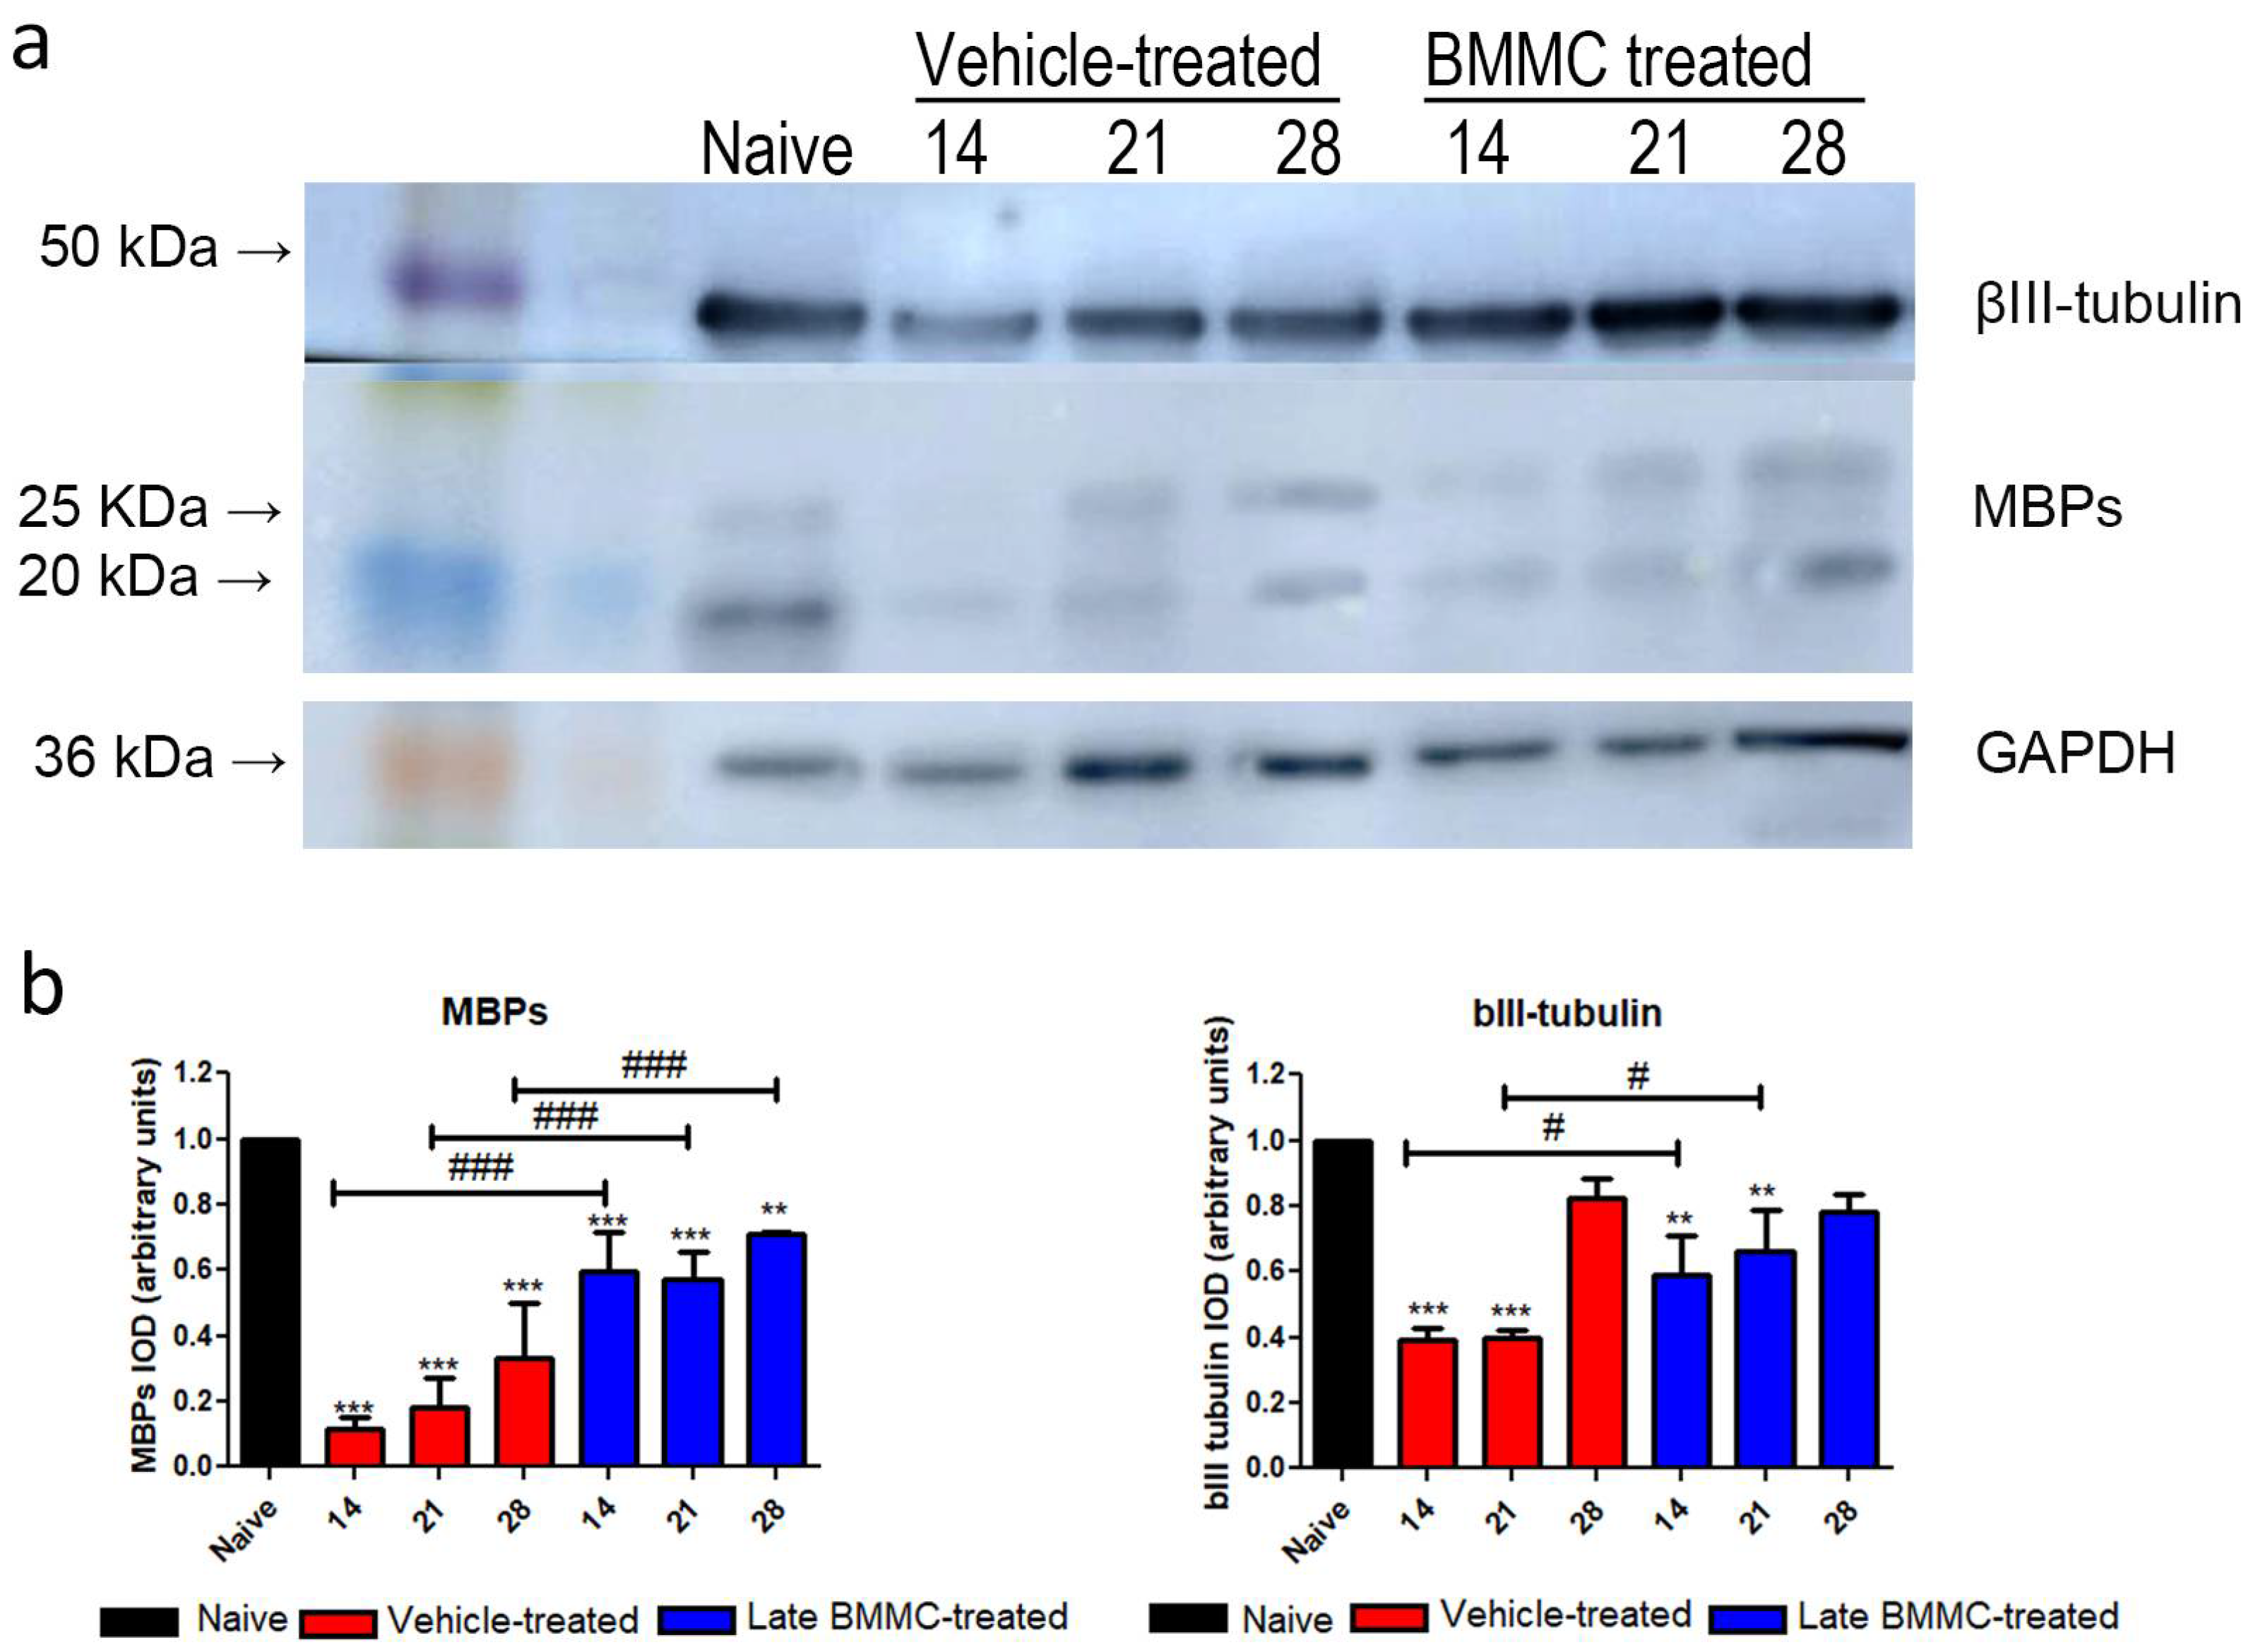
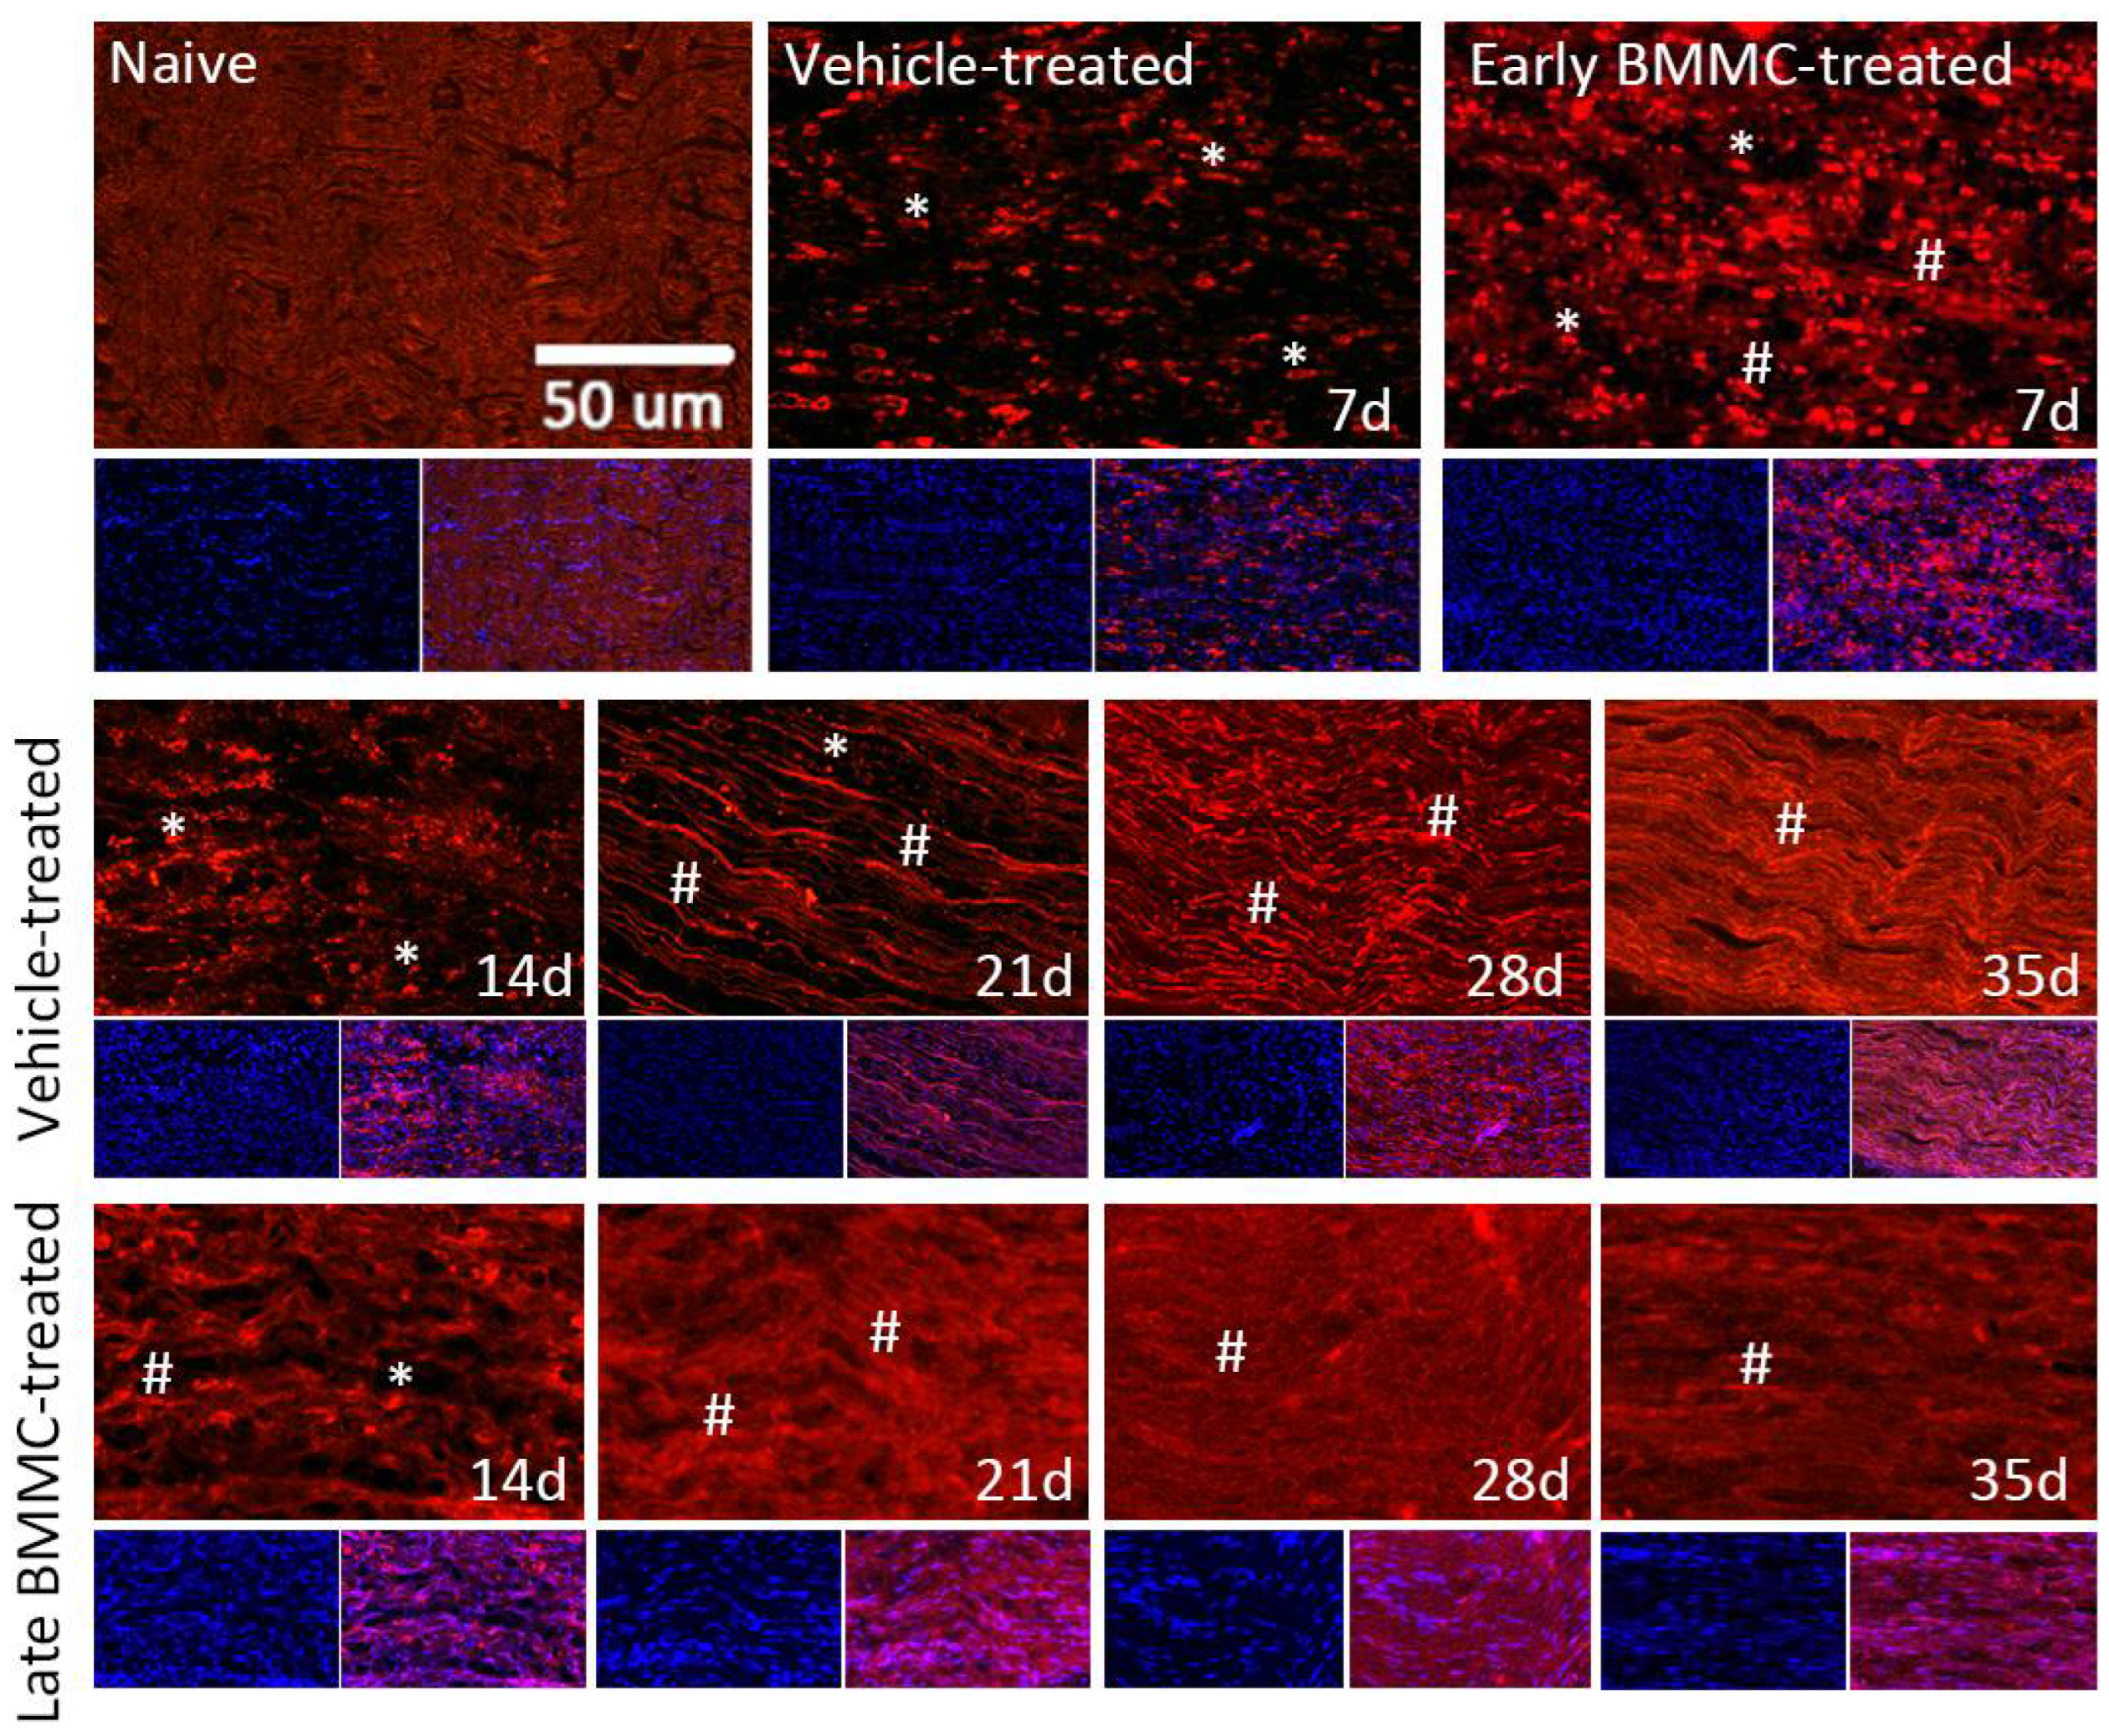
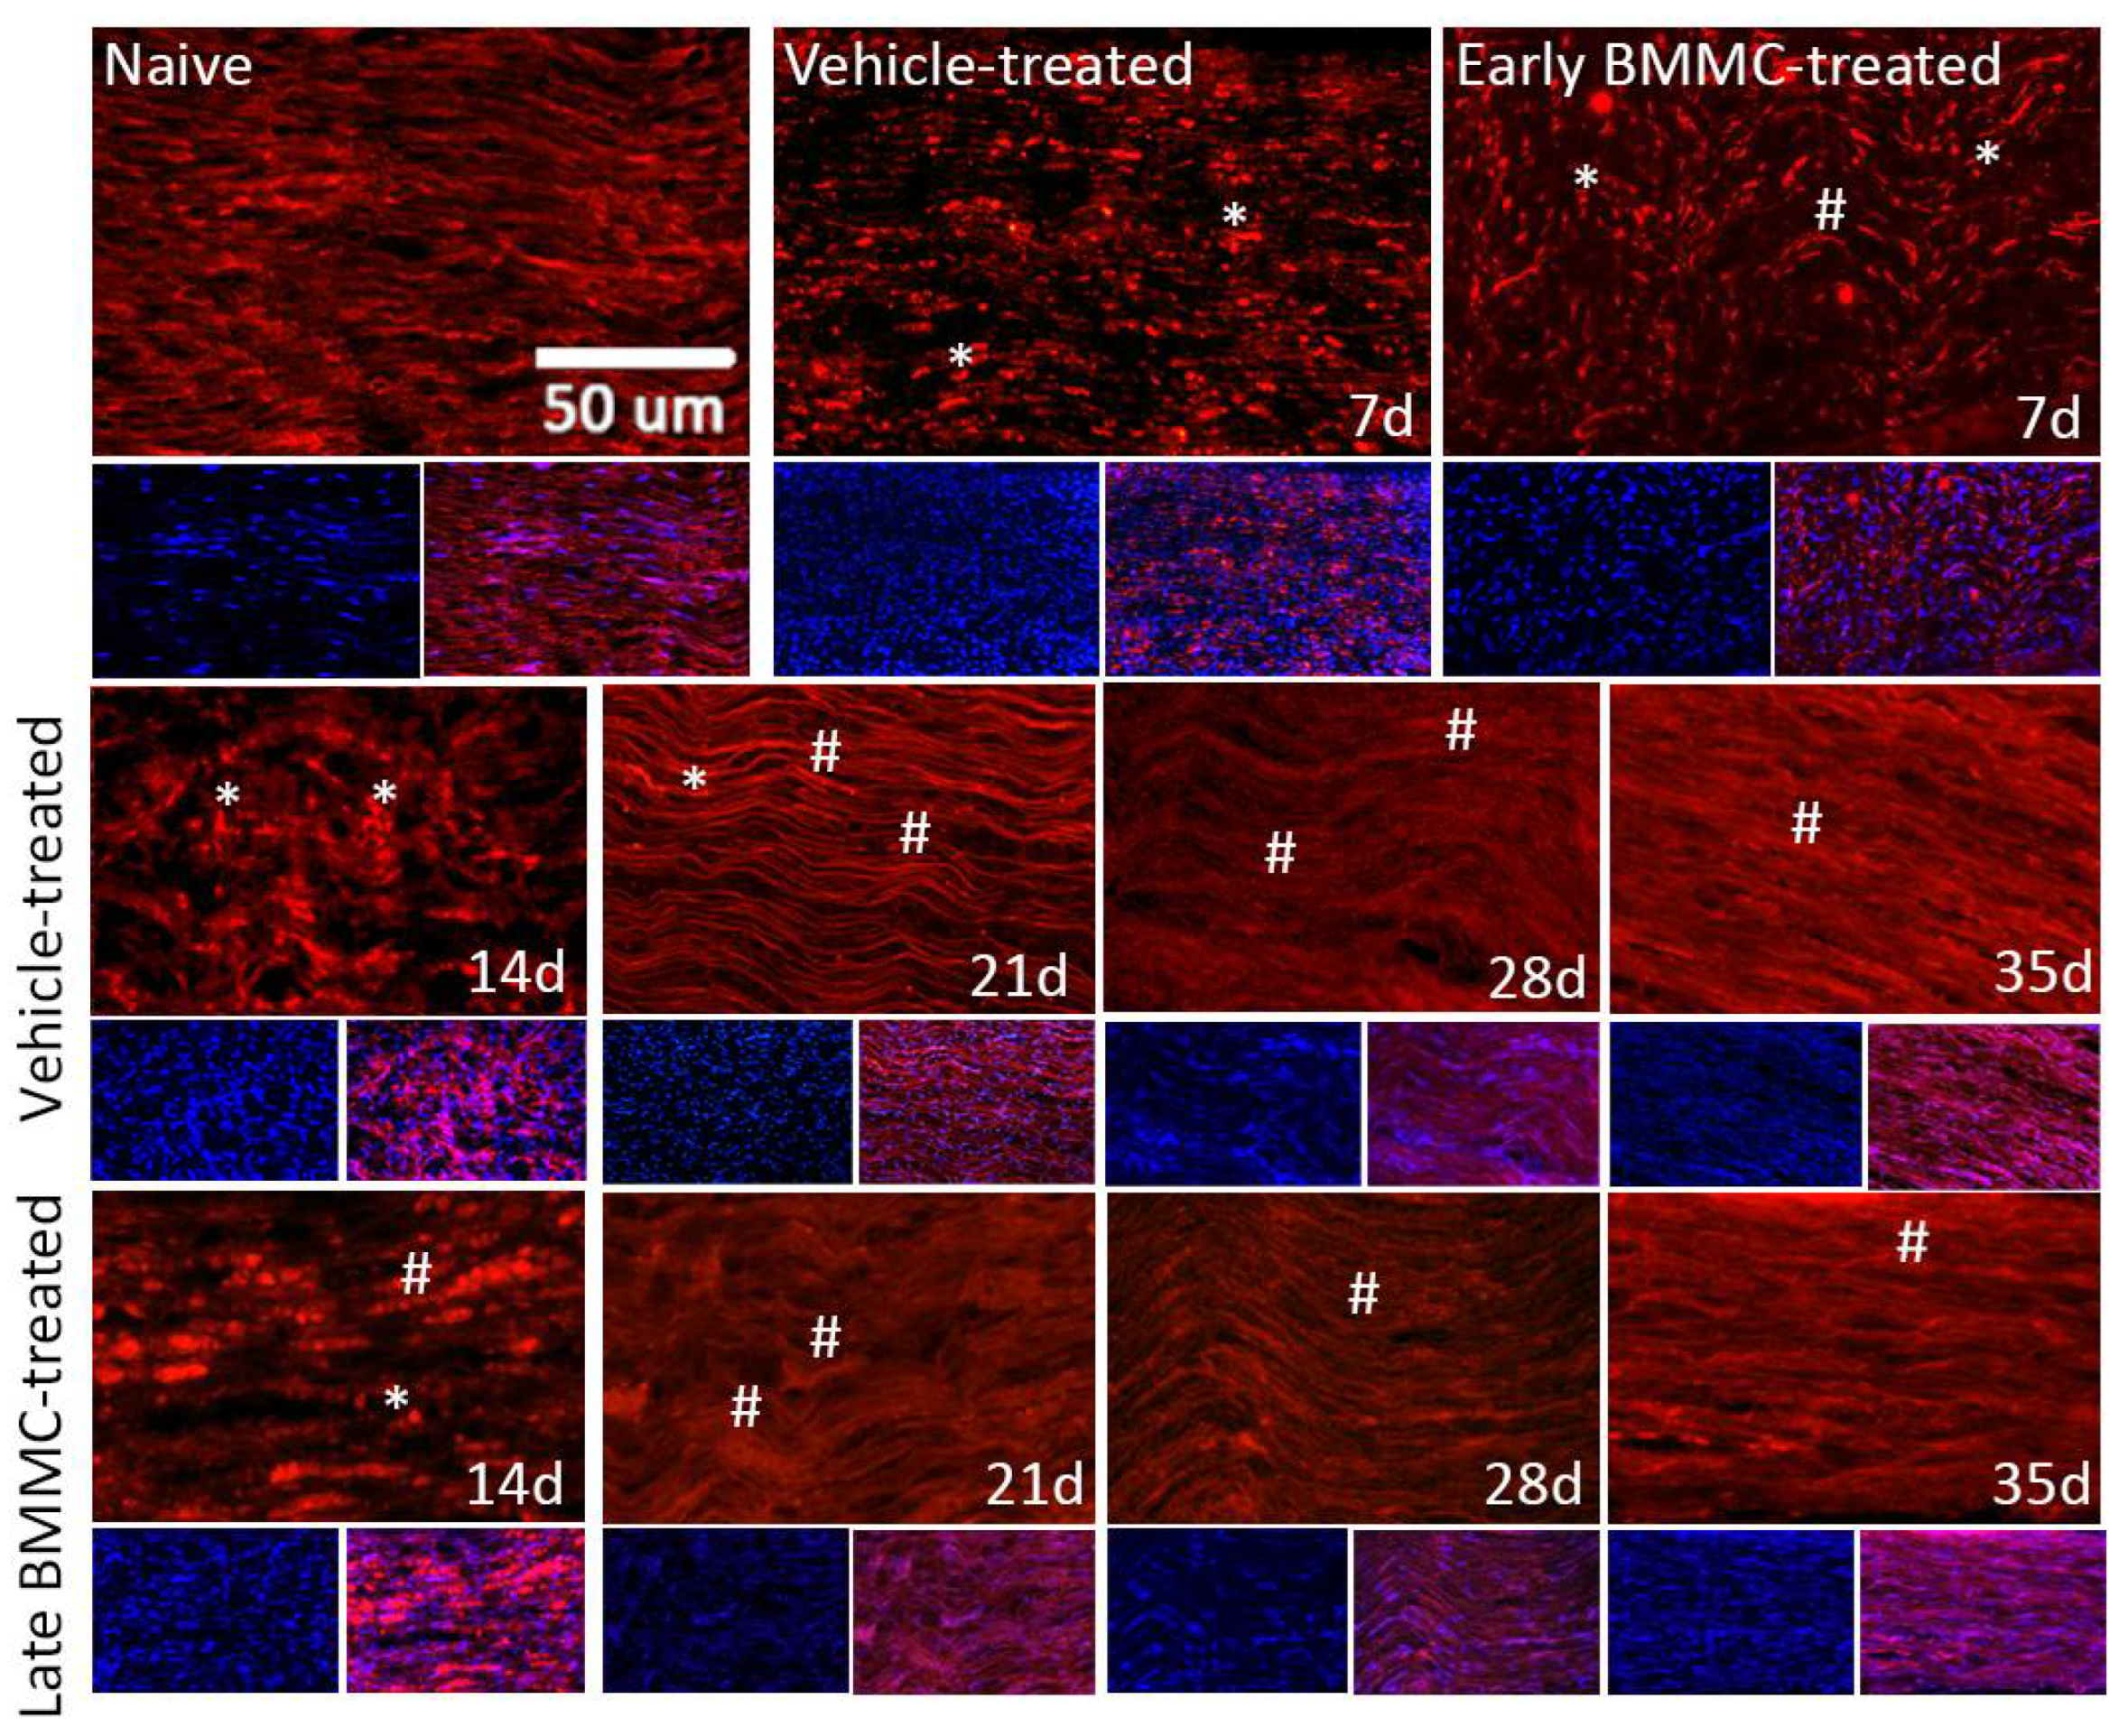
2.5. Effects of Late BMMC Transplant on MBP and βIII-Tubulin Protein Levels and Distribution
3. Discussion
4. Materials and Methods
4.2. Sciatic Nerve Crush
4.3. BMMC Isolation and In Vivo Transplant
4.4. Experimental Groups
4.5. Behavioral Testing
4.6. Mechanical Allodynia
4.7. Cold Allodynia
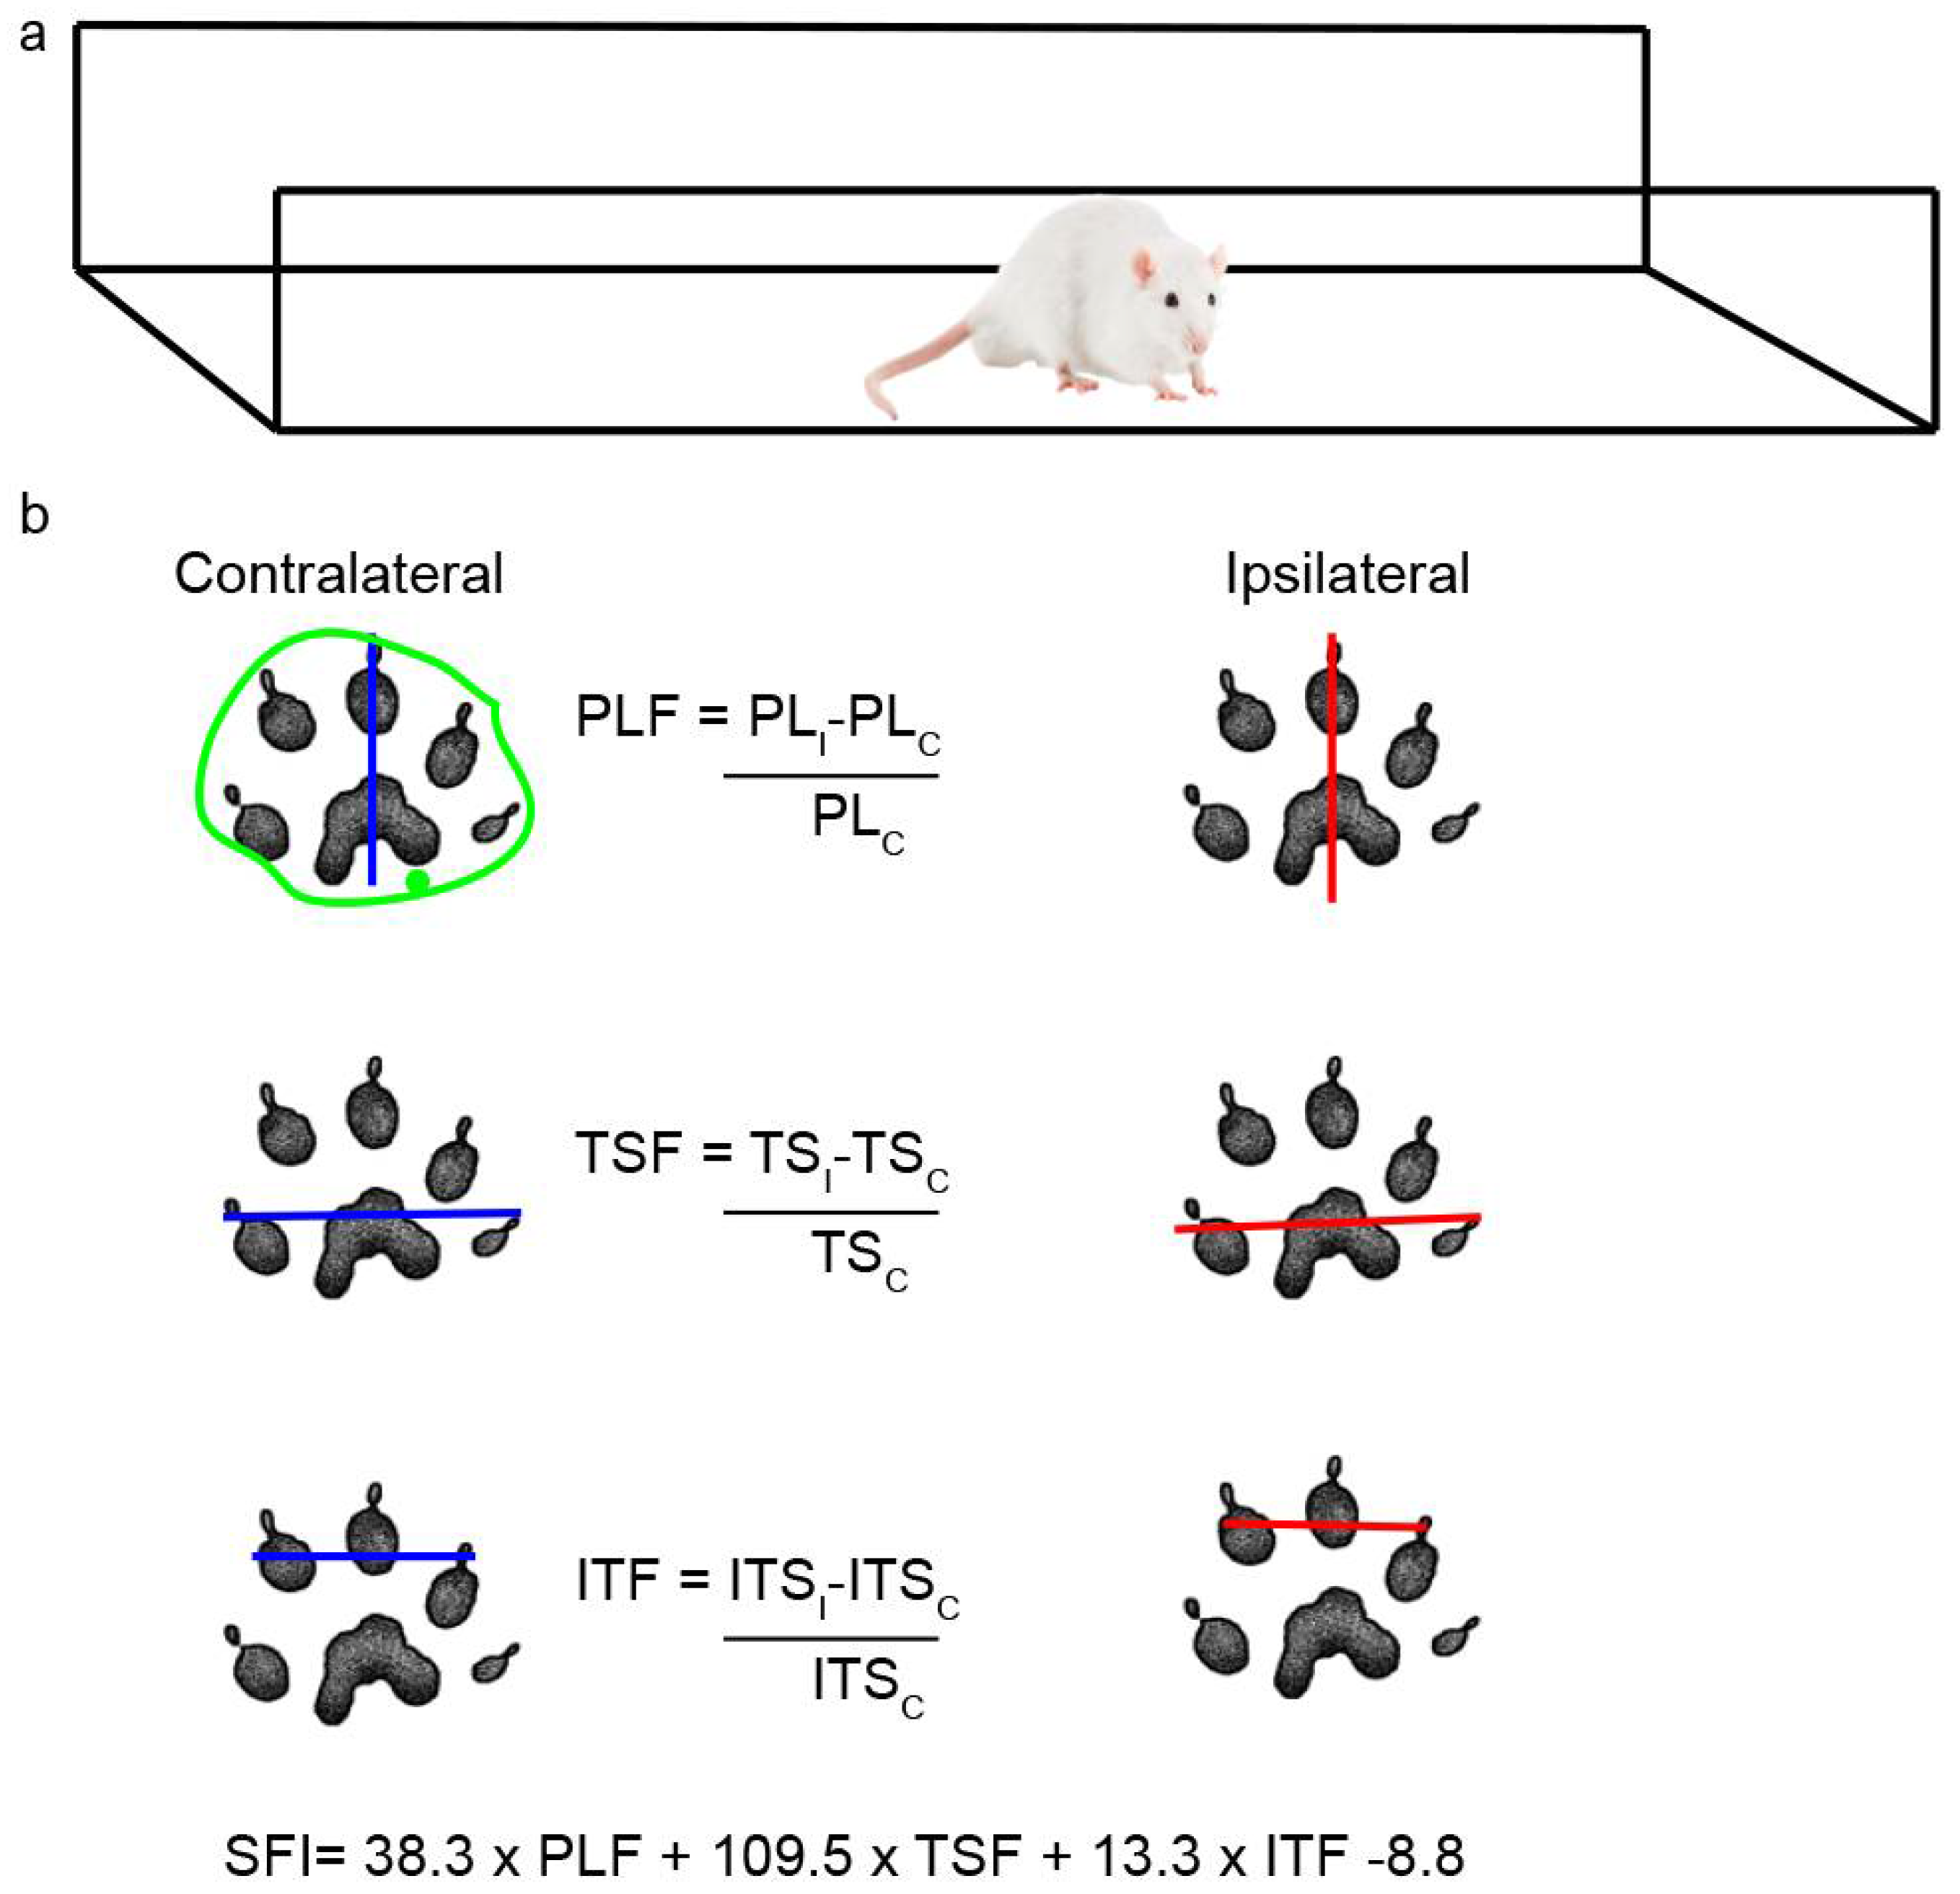
4.8. Walking Track Analysis
4.9. Distal Latency and Compound Muscle Action Potential (CMAP) Recording
4.10. Electron and Optical Microscopy Analysis
4.11. Western Blot Analysis
4.12. Preparation of Tissue Sections and Immunohistochemistry
4.13. Image Analysis
4.14. Statistical Analysis
5. Conclusions
Author Contributions
Funding
Institutional Review Board Statement
Data Availability Statement
Acknowledgments
Conflicts of Interest
References
- Conforti, L.; Gilley, J.; Coleman, M.P. Wallerian Degeneration: An Emerging Axon Death Pathway Linking Injury and Disease. Nat. Rev. Neurosci. 2014, 15, 394–409. [CrossRef]
- Gaudet, A.D.; Popovich, P.G.; Ramer, M.S. Wallerian Degeneration: Gaining Perspective on Inflammatory Events after Peripheral Nerve Injury. J. Neuroinflammation 2011, 8. [CrossRef]
- Chen, P.; Piao, X.; Bonaldo, P. Role of Macrophages in Wallerian Degeneration and Axonal Regeneration after Peripheral Nerve Injury. Acta Neuropathol. 2015, 130, 605–618. [CrossRef]
- Davies, A.J.; Kim, H.W.; Gonzalez-Cano, R.; Choi, J.; Back, S.K.; Roh, S.E.; Johnson, E.; Gabriac, M.; Kim, M.S.; Lee, J.; et al. Natural Killer Cells Degenerate Intact Sensory Afferents Following Nerve Injury. Cell 2019, 176, 716-728.e18. [CrossRef]
- Lancelotta, M.P.; Sheth, R.N.; Meyer, R.A.; Belzberg, A.J.; Griffin, J.W.; Campbell, J.N.; Kretschmer, T.; Richter, H.P.; Linderoth, B.; Huang, J.H.; et al. Severity and Duration of Hyperalgesia in Rat Varies with Type of Nerve Lesion. Neurosurgery 2003, 53, 1200–1209. [CrossRef]
- Casals-Díaz, L.; Vivó, M.; Navarro, X. Nociceptive Responses and Spinal Plastic Changes of Afferent C-Fibers in Three Neuropathic Pain Models Induced by Sciatic Nerve Injury in the Rat. Exp. Neurol. 2009, 217, 84–95. [CrossRef]
- Segers, V.F.M.; Lee, R.T. Stem-Cell Therapy for Cardiac Disease. Nature 2008, 451, 937–942. [CrossRef]
- Usach, V.; Malet, M.; López, M.; Lavalle, L.; Piñero, G.; Saccoliti, M.; Cueto, A.; Brumovsky, P.; Brusco, A.; Setton-Avruj, P. Systemic Transplantation of Bone Marrow Mononuclear Cells Promotes Axonal Regeneration and Analgesia in a Model of Wallerian Degeneration. Transplantation 2017, 101. [CrossRef]
- Guérout, N.; Duclos, C.; Drouot, L.; Abramovici, O.; Bon-Mardion, N.; Lacoume, Y.; Jean, L.; Boyer, O.; Marie, J.P. Transplantation of Olfactory Ensheathing Cells Promotes Axonal Regeneration and Functional Recovery of Peripheral Nerve Lesion in Rats. Muscle and Nerve 2011, 43, 543–551. [CrossRef]
- Yao Chang, M.; Han Chang, C.; Hsi Chen, C.; Cheng, B.; Dong Lin, Y.; Yau Luo, C.; Lin Wu, H.; Jen Yang, Y.; Hong Chen, J.; Hsieh, P.C.H. The Time Window for Therapy with Peptide Nanofibers Combined with Autologous Bone Marrow Cells in Pigs after Acute Myocardial Infarction. PLoS ONE 2015, 10. [CrossRef]
- Ishizaka, S.; Horie, N.; Satoh, K.; Fukuda, Y.; Nishida, N.; Nagata, I. Intra-Arterial Cell Transplantation Provides Timing-Dependent Cell Distribution and Functional Recovery after Stroke. Stroke 2013, 44, 720–726. [CrossRef]
- Loubinoux, I.; Demain, B.; Davoust, C.; Plas, B.; Vaysse, L. Cellules Souches et Récupération Motrice Post-AV. Ann. Phys. Rehabil. Med. 2014, 57, 499–508.
- Li, Y.; Zhang, W.M.; Wang, T.H. Optimal Location and Time for Neural Stem Cell Transplantation into Transected Rat Spinal Cord. Cell. Mol. Neurobiol. 2011, 31, 407–414. [CrossRef]
- Goel, R.K.; Suri, V.; Suri, A.; Sarkar, C.; Mohanty, S.; Sharma, M.C.; Yadav, P.K.; Srivastava, A. Effect of Bone Marrow-Derived Mononuclear Cells on Nerve Regeneration in the Transection Model of the Rat Sciatic Nerve. J. Clin. Neurosci. 2009, 16, 1211–1217. [CrossRef]
- Lopes-Filho, J.D.; Caldas, H.C.; Santos, F.C.A.; Mazzer, N.; Simões, G.F.; Kawasaki-Oyama, R.S.; Abbud-Filho, M.; Oliveira, A.R.; Toboga, S.R.; Chueire, A.G. Microscopic Evidences That Bone Marrow Mononuclear Cell Treatment Improves Sciatic Nerve Regeneration after Neurorrhaphy. Microsc. Res. Tech. 2011, 74, 355–363. [CrossRef]
- Raheja, A.; Suri, V.; Suri, A.; Sarkar, C.; Srivastava, A.; Mohanty, S.; Jain, K.G.; Sharma, M.C.; Mallick, H.N.; Yadav, P.K.; et al. Dose-Dependent Facilitation of Peripheral Nerve Regeneration by Bone Marrow-Derived Mononuclear Cells: A Randomized Controlled Study. Laboratory Investigation. J. Neurosurg. 2012, 117, 1170–1181. [CrossRef]
- Donald Orlic2, Jan Kajstura*, Stefano Chimenti*, Igor Jakoniuk*, Stacie M. Anderson2, Baosheng Li*, James Pickel3, Ronald McKay3, Bernardo Nadal-Ginard*, David M. Bodine2, A.L.& P.A. Bone Marrow Cells Regenerate Infarcted Myocardium. Lett. to Nat. 2001, 410, 701. [CrossRef]
- Holler, V.; Buard, V.; Roque, T.; Squiban, C.; Benderitter, M.; Flamant, S.; Tamarat, R. Early and Late Protective Effect of Bone Marrow Mononuclear Cell Transplantation on Radiation-Induced Vascular Dysfunction and Skin Lesions. Cell Transplant. 2019, 28, 116–128. [CrossRef]
- Sharma, A.; Gokulchandran, N.; Sane, H.; Nagrajan, A.; Paranjape, A.; Kulkarni, P.; Shetty, A.; Mishra, P.; Kali, M.; Biju, H.; et al. Autologous Bone Marrow Mononuclear Cell Therapy for Autism: An Open Label Proof of Concept Study. Stem Cells Int. 2013. [CrossRef]
- Huang, R.; Yao, K.; Sun, A.; Qian, J.; Ge, L.; Zhang, Y.; Niu, Y.; Wang, K.; Zou, Y.; Ge, J. Timing for Intracoronary Administration of Bone Marrow Mononuclear Cells after Acute ST-Elevation Myocardial Infarction: A Pilot Study. Stem Cell Res. Ther. 2015, 6. [CrossRef]
- Assmus, B.; Alakmeh, S.; De Rosa, S.; Bönig, H.; Hermann, E.; Levy, W.C.; Dimmeler, S.; Zeiher, A.M. Improved Outcome with Repeated Intracoronary Injection of Bone Marrow-Derived Cells within a Registry: Rationale for the Randomized Outcome Trial REPEAT. Eur. Heart J. 2016, 37, 1659–1666. [CrossRef]
- Bhansali, A.; Upreti, V.; Khandelwal, N.; Marwaha, N.; Gupta, V.; Sachdeva, N.; Sharma, R.R.; Saluja, K.; Dutta, P.; Walia, R.; et al. Efficacy of Autologous Bone Marrow-Derived Stem Cell Transplantation in Patients with Type 2 Diabetes Mellitus. Stem Cells Dev. 2009, 18, 1407–1415. [CrossRef]
- Madaric, J.; Klepanec, A.; Valachovicova, M.; Mistrik, M.; Bucova, M.; Olejarova, I.; Necpal, R.; Madaricova, T.; Paulis, L.; Vulev, I. Characteristics of Responders to Autologous Bone Marrow Cell Therapy for No-Option Critical Limb Ischemia. Stem Cell Res. Ther. 2016, 7. [CrossRef]
- Daltro, G.C.; Fortuna, V.; De Souza, E.S.; Salles, M.M.; Carreira, A.C.; Meyer, R.; Freire, S.M.; Borojevic, R. Efficacy of Autologous Stem Cell-Based Therapy for Osteonecrosis of the Femoral Head in Sickle Cell Disease: A Five-Year Follow-up Study. Stem Cell Res. Ther. 2015, 6. [CrossRef]
- Ismail, A.M.; Abdou, S.M.; Abdelnaby, A.Y.; Hamdy, M.A.; El Saka, A.A.; Gawaly, A. Stem Cell Therapy Using Bone Marrow-Derived Mononuclear Cells in Treatment of Lower Limb Lymphedema: A Randomized Controlled Clinical Trial. Lymphat. Res. Biol. 2018, 16, 270–277. [CrossRef]
- Suzuki, Y.; Ishikawa, N.; Omae, K.; Hirai, T.; Ohnishi, K.; Nakano, N.; Nishida, H.; Nakatani, T.; Fukushima, M.; Ide, C. Bone Marrow-Derived Mononuclear Cell Transplantation in Spinal Cord Injury Patients by Lumbar Puncture. Restor. Neurol. Neurosci. 2014, 32, 473–482. [CrossRef]
- Setton-Avruj, C.P.; Musolino, P.L.; Salis, C.; Alló, M.; Bizzozero, O.; Villar, M.J.; Soto, E.F.; Pasquini, J.M. Presence of α-Globin MRNA and Migration of Bone Marrow Cells after Sciatic Nerve Injury Suggests Their Participation in the Degeneration/Regeneration Process. Exp. Neurol. 2007, 203, 568–578. [CrossRef]
- Piñero, G.; Usach, V.; Soto, P.A.; Monje, P. V.; Setton-Avruj, P. EGFP Transgene: A Useful Tool to Track Transplanted Bone Marrow Mononuclear Cell Contribution to Peripheral Remyelination. Transgenic Res. 2018, 27, 135–153. [CrossRef]
- Usach, V.; Goitia, B.; Lavalle, L.; Martinez Vivot, R.; Setton-Avruj, P. Bone Marrow Mononuclear Cells Migrate to the Demyelinated Sciatic Nerve and Transdifferentiate into Schwann Cells after Nerve Injury: Attempt at a Peripheral Nervous System Intrinsic Repair Mechanism. J. Neurosci. Res. 2011, 89, 1203–1217. [CrossRef]
- Gomez-Sanchez, J.A.; Carty, L.; Iruarrizaga-Lejarreta, M.; Palomo-Irigoyen, M.; Varela-Rey, M.; Griffith, M.; Hantke, J.; Macias-Camara, N.; Azkargorta, M.; Aurrekoetxea, I.; et al. Schwann Cell Autophagy, Myelinophagy, Initiates Myelin Clearance from Injured Nerves. J. Cell Biol. 2015, 210, 153–168. [CrossRef]
- Jessen, K.R.; Arthur-Farraj, P. Repair Schwann Cell Update: Adaptive Reprogramming, EMT, and Stemness in Regenerating Nerves. Glia 2019, 67, 421–437. [CrossRef]
- Nocera, G.; Jacob, C. Mechanisms of Schwann Cell Plasticity Involved in Peripheral Nerve Repair after Injury. Cell. Mol. Life Sci. 2020, 77, 3977–3989. [CrossRef]
- Chen, F.; Suzuki, Y.; Nagai, N.; Peeters, R.; Coenegrachts, K.; Coudyzer, W.; Marchal, G.; Ni, Y. Visualization of Stroke with Clinical MR Imagers in Rats: A Feasibility Study. Radiology 2004, 233, 905–911. [CrossRef]
- Yang, B.; Strong, R.; Sharma, S.; Brenneman, M.; Mallikarjunarao, K.; Xi, X.; Grotta, J.C.; Aronowski, J.; Savitz, S.I. Therapeutic Time Window and Dose Response of Autologous Bone Marrow Mononuclear Cells for Ischemic Stroke. J. Neurosci. Res. 2011, 89, 833–839. [CrossRef]
- de Vasconcelos dos Santos, A.; da Costa Reis, J.; Diaz Paredes, B.; Moraes, L.; Jasmin; Giraldi-Guimarães, A.; Mendez-Otero, R. Therapeutic Window for Treatment of Cortical Ischemia with Bone Marrow-Derived Cells in Rats. Brain Res. 2010, 1306, 149–158. [CrossRef]
- Tamura, K.; Harada, Y.; Kunimi, M.; Takemitsu, H.; Hara, Y.; Nakamura, T.; Tagawa, M. Autologous Bone Marrow Mononuclear Cell Transplant and Surgical Decompression in a Dog with Chronic Spinal Cord Injury. Exp. Clin. Transplant. 2015, 13, 100–105. [CrossRef]
- Tamura, K.; Maeta, N. Efficacy of Autologous Bone Marrow Mononuclear Cell Transplantation in Dogs with Chronic Spinal Cord Injury. Open Vet. J. 2020, 10, 206–215. [CrossRef]
- do Prado-Lima, P.A.S.; Onsten, G.A.; de Oliveira, G.N.; Brito, G.C.; Ghilardi, I.M.; de Souza, E.V.; dos Santos, P.G.; Salamoni, S.D.; Machado, D.C.; Duarte, M.M.F.; et al. The Antidepressant Effect of Bone Marrow Mononuclear Cell Transplantation in Chronic Stress. J. Psychopharmacol. 2019. [CrossRef]
- Costa-Ferro, Z.S.M.; do Prado-Lima, P.A.S.; Onsten, G.A.; Oliveira, G.N.; Brito, G.C.; Ghilardi, I.M.; dos Santos, P.G.; Bertinatto, R.J.; da Silva, D.V.; Salamoni, S.D.; et al. Bone Marrow Mononuclear Cell Transplant Prevents Rat Depression and Modulates Inflammatory and Neurogenic Molecules. Prog. Neuropsychopharmacol. Biol. Psychiatry 2022, 113. [CrossRef]
- Lutz, A.B.; Chung, W.S.; Sloan, S.A.; Carson, G.A.; Zhou, L.; Lovelett, E.; Posada, S.; Zuchero, J.B.; Barres, B.A. Schwann Cells Use TAM Receptor-Mediated Phagocytosis in Addition to Autophagy to Clear Myelin in a Mouse Model of Nerve Injury. Proc. Natl. Acad. Sci. U. S. A. 2017, 114, E8072–E8080. [CrossRef]
- Li, R.; Li, D.; Wu, C.; Ye, L.; Wu, Y.; Yuan, Y.; Yang, S.; Xie, L.; Mao, Y.; Jiang, T.; et al. Nerve Growth Factor Activates Autophagy in Schwann Cells to Enhance Myelin Debris Clearance and to Expedite Nerve Regeneration. Theranostics 2020, 10, 1649–1677. [CrossRef]
- Sheu, M.L.; Cheng, F.C.; Su, H.L.; Chen, Y.J.; Chen, C.J.; Chiang, C.M.; Chiu, W.T.; Sheehan, J.; Pan, H.C. Recruitment by SDF-1α of CD34-Positive Cells Involved in Sciatic Nerve Regeneration: Laboratory Investigation. J. Neurosurg. 2012, 116, 432–444. [CrossRef]
- Jander, S.; Lausberg, F.; Stoll, G. Differential Recruitment of CD8+ Macrophages during Wallerian Degeneration in the Peripheral and Central Nervous System. Brain Pathol. 2001, 11, 27–38. [CrossRef]
- Moalem, G.; Monsonego, A.; Shani, Y.; Cohen, I.R.; Schwartz, M. Differential T Cell Response in Central and Peripheral Nerve Injury: Connection with Immune Privilege; 1999; Vol. 13.
- Carr, M.J.; Toma, J.S.; Johnston, A.P.W.; Steadman, P.E.; Yuzwa, S.A.; Mahmud, N.; Frankland, P.W.; Kaplan, D.R.; Miller, F.D. Mesenchymal Precursor Cells in Adult Nerves Contribute to Mammalian Tissue Repair and Regeneration. Cell Stem Cell 2019, 24, 240-256.e9. [CrossRef]
- Clements, M.P.; Byrne, E.; Camarillo Guerrero, L.F.; Cattin, A.L.; Zakka, L.; Ashraf, A.; Burden, J.J.; Khadayate, S.; Lloyd, A.C.; Marguerat, S.; et al. The Wound Microenvironment Reprograms Schwann Cells to Invasive Mesenchymal-like Cells to Drive Peripheral Nerve Regeneration. Neuron 2017, 96, 98-114.e7. [CrossRef]
- Nadeau, S.; Filali, M.; Zhang, J.; Kerr, B.J.; Rivest, S.; Soulet, D.; Iwakura, Y.; Vaccari, J.P. de R.; Keane, R.W.; Lacroix, S. Functional Recovery after Peripheral Nerve Injury Is Dependent on the Pro-Inflammatory Cytokines IL-1β and TNF: Implications for Neuropathic Pain. J. Neurosci. 2011, 31, 12533–12542. [CrossRef]
- Sharma, A.; Hemangi Sane; Nandini Gokulchandran; Pooja Kulkarni; Alitta Jose; Vivek Nair; Rohit Das; Vaibhav Lakhanpal; Prerna Badhe Intrathecal Transplantation of Autologous Bone Marrow Mononuclear Cells in Patients with Sub-Acute and Chronic Spinal Cord Injury: An Open-Label Study. Int. J. Health Sci. (Qassim). 2020, 24–32.
- Sharma, A.K.; Sane, H.M.; Kulkarni, P.P.; Gokulchandran, N.; Biju, H.; Badhe, P.B. Autologous Bone Marrow Mononuclear Cell Transplantation in Patients with Chronic Traumatic Brain Injury- a Clinical Study. Cell Regen. (London, England) 2020, 9, 3. [CrossRef]
- Naruse, K.; Sato, J.; Funakubo, M.; Hata, M.; Nakamura, N.; Kobayashi, Y.; Kamiya, H.; Shibata, T.; Kondo, M.; Himeno, T.; et al. Transplantation of Bone Marrow-Derived Mononuclear Cells Improves Mechanical Hyperalgesia, Cold Allodynia and Nerve Function in Diabetic Neuropathy. PLoS ONE 2011, 6. [CrossRef]
- Takamura, H.; Terashima, T.; Mori, K.; Katagi, M.; Okano, J.; Suzuki, Y.; Imai, S.; Kojima, H. Bone-Marrow-Derived Mononuclear Cells Relieve Neuropathic Pain after Spinal Nerve Injury in Mice. Mol. Ther. - Methods Clin. Dev. 2020, 17, 657–665. [CrossRef]
- Song, F.; Tang, J.; Geng, R.; Hu, H.; Zhu, C.; Cui, W.; Fan, W. Comparison of the Efficacy of Bone Marrow Mononuclear Cells and Bone Mesenchymal Stem Cells in the Treatment of Osteoarthritis in a Sheep Model; 2014; Vol. 7.
- Cuende, N.; Rico, L.; Herrera, C. Concise Review: Bone Marrow Mononuclear Cells for the Treatment of Ischemic Syndromes: Medicinal Product or Cell Transplantation? Stem Cells Transl. Med. 2012, 1, 403–408. [CrossRef]
- Takahashi, M.; Li, T.S.; Suzuki, R.; Kobayashi, T.; Ito, H.; Ikeda, Y.; Matsuzaki, M.; Hamano, K. Cytokines Produced by Bone Marrow Cells Can Contribute to Functional Improvement of the Infarcted Heart by Protecting Cardiomyocytes from Ischemic Injury. Am. J. Physiol. Heart Circ. Physiol. 2006, 291. [CrossRef]
- Thrasivoulou, C.; Soubeyre, V.; Ridha, H.; Giuliani, D.; Giaroni, C.; Michael, G.J.; Saffrey, M.J.; Cowen, T. Reactive Oxygen Species, Dietary Restriction and Neurotrophic Factors in Age-Related Loss of Myenteric Neurons. Aging Cell 2006, 5, 247–257. [CrossRef]
- Okano, H.; Ogawa, Y.; Nakamura, M.; Kaneko, S.; Iwanami, A.; Toyama, Y. Transplantation of Neural Stem Cells into the Spinal Cord after Injury. Semin. Cell Dev. Biol. 2003, 14, 191–198. [CrossRef]
- Huang, P.C.; Tsai, K.L.; Chen, Y.W.; Lin, H.T.; Hung, C.H. Exercise Combined With Ultrasound Attenuates Neuropathic Pain in Rats Associated With Downregulation of IL-6 and TNF-α, but With Upregulation of IL-10. Anesth. Analg. 2017, 124, 2038–2044. [CrossRef]
- Piñero, G.; Vence, M.; Aranda, M.L.; Cercato, M.C.; Soto, P.A.; Usach, V.; Setton-Avruj, P.C. All the PNS Is a Stage: Transplanted Bone Marrow Cells Play an Immunomodulatory Role in Peripheral Nerve Regeneration. ASN Neuro 2023, 15. [CrossRef]
- Mapplebeck, J.C.S.; Beggs, S.; Salter, M.W. Sex Differences in Pain: A Tale of Two Immune Cells. Pain 2016, 157 Suppl 1, S2–S6. [CrossRef]
- Ramachandran, R.; Wang, Z.; Saavedra, C.; DiNardo, A.; Corr, M.; Powell, S.B.; Yaksh, T.L. Role of Toll-like Receptor 4 Signaling in Mast Cell-Mediated Migraine Pain Pathway. Mol. Pain 2019, 15. [CrossRef]
- Stokes, J.A.; Cheung, J.; Eddinger, K.; Corr, M.; Yaksh, T.L. Toll-like Receptor Signaling Adapter Proteins Govern Spread of Neuropathic Pain and Recovery Following Nerve Injury in Male Mice. J. Neuroinflammation 2013, 10, 10–13. [CrossRef]
- Kanaya, F.; Firrell, J.C.; Breidenbach, W.C. Sciatic Function Index, Nerve Conduction Tests, Muscle Contraction, and Axon Morphometry as Indicators of Regeneration. Plast. Reconstr. Surg. 1996, 98, 1264–1274. [CrossRef]
- Dellon, A.L.; Mackinnon, S.E. Selection of the Appropriate Parameter to Measure Neural Regeneration. Ann. Plast. Surg. 1989, 23, 197–202. [CrossRef]
- Wang, T.; Ito, A.; Aoyama, T.; Nakahara, R.; Nakahata, A.; Ji, X.; Zhang, J.; Kawai, H.; Kuroki, H. Functional Evaluation Outcomes Correlate with Histomorphometric Changes in the Rat Sciatic Nerve Crush Injury Model: A Comparison between Sciatic Functional Index and Kinematic Analysis. PLoS ONE 2018, 13. [CrossRef]
- Munro, C.A.; Szalai, J.P.; Mackinnon, S.E.; Midha, R. LACK OF ASSOCIATION BETWEEN OUTCOME MEASURES OF NERVE REGENERATION; 1998; Vol. 21.
- Monte-Raso, V.V.; Barbieri, C.H.; Mazzer, N.; Yamasita, A.C.; Barbieri, G. Is the Sciatic Functional Index Always Reliable and Reproducible? J. Neurosci. Methods 2008, 170, 255–261. [CrossRef]
- Nguyen, T.L.; Nguyen, H.P.; Nguyen, T.K. The Effects of Bone Marrow Mononuclear Cell Transplantation on the Quality of Life of Children with Cerebral Palsy. Health Qual. Life Outcomes 2018, 16. [CrossRef]
- Chaplan, S.R.; Bach, F.W.; Pogrel, J.W.; Chung, J.M.; Yaksh, T.L. Quantitative Assessment of Tactile Allodynia in the Rat Paw; 1994; Vol. 53.
- Choi, Y.; Wook Yoon, Y.; Sik Na, H.; Ho Kim, S.; Chung, J.M. Behavioral Signs of Ongoing Pain and Cold Allodynia in a Rat Model of Neuropathic Pain; 1994; Vol. 59.
- Kim, H.; Park, J.S.; Yong, J.C.; Kim, M.O.; Yang, H.H.; Kim, S.W.; Ji, W.H.; Lee, J.Y.; Kim, S.; Houge, M.A.; et al. Bone Marrow Mononuclear Cells Have Neurovascular Tropism and Improve Diabetic Neuropathy. Stem Cells 2009, 27, 1686–1696. [CrossRef]
- Hruskal, R.E.; Kennedy, S.; Silbergeld, E.K. QUANTITATIVE ASPECTS OF NORMAL LOCOMOTION IN RATS; Pergamon Press, 1979; Vol. 25.
- MM, B. A Rapid and Sensitive Method for the Quantitation of Microgram Quantities of Protein Utilizing the Principle of Protein-Dye Binding. Anal. Biochem. 1976, 72, 248–254. [CrossRef]
- Saper, C.B. An Open Letter to Our Readers on the Use of Antibodies. J. Comp. Neurol. 2005, 493, 477–478. [CrossRef]
- Esparza, M.A.; Bollati, F.; Garcia-Keller, C.; Virgolini, M.B.; Lopez, L.M.; Brusco, A.; Shen, H.W.; Kalivas, P.W.; Cancela, L.M. Stress-Induced Sensitization to Cocaine: Actin Cytoskeleton Remodeling within Mesocorticolimbic Nuclei. Eur. J. Neurosci. 2012, 36, 3103–3117. [CrossRef]

| Table 1 (a) Primary antibodies used for WB and IHC, (b) Secondary antibodies used for WB and IHC | ||||||||||||
| Antigen | Cat # | Host | Clonality | Isotype (Clone) | Brand | Dilution | ||||||
| WB | IHC | |||||||||||
| Primaryantibodies | ||||||||||||
| MBP | 800403 | Mouse | Monoclonal | IgG1 (SMI99) | Biolegend* | 1:2500 | 1:1500 | |||||
| βIII-tubulin | 802001 | Rabbit | Polyclonal | Poly18020 | Biolegend* | 1:7500 | 1:2500 | |||||
| Loading control | ||||||||||||
| GAPDH | Ab-8245 | Mouse | Monoclonal | IgG1 (6C5) | Abcam** | 1:5000 | ||||||
| Secondaryantibodies | ||||||||||||
| Reactivity | Cat # | Conjugate | Host | Brand | Dilution | |||||||
| WB | IHC | |||||||||||
| Mouse | 115-035-146 | HRP | Goat | Jackson ImmunoResearch*** | 1:10000 | |||||||
| Rabbit | 111-035-003 | HRP | Goat | Jackson ImmunoResearch*** | 1:8000 | |||||||
| Mouse | A11030 | Alexa546 | Goat | Thermofisher**** | 1:500 | |||||||
| Rabbit | A21206 | Alexa488 | Donkey | Thermofisher**** | 1:500 | |||||||
Disclaimer/Publisher’s Note: The statements, opinions and data contained in all publications are solely those of the individual author(s) and contributor(s) and not of MDPI and/or the editor(s). MDPI and/or the editor(s) disclaim responsibility for any injury to people or property resulting from any ideas, methods, instructions or products referred to in the content. |
© 2024 by the authors. Licensee MDPI, Basel, Switzerland. This article is an open access article distributed under the terms and conditions of the Creative Commons Attribution (CC BY) license (http://creativecommons.org/licenses/by/4.0/).


