Preprint
Article

Assessment of genetic diversity and population structure of Fusarium species from the Fusarium fujikuroi species complex causing Fusarium stalk rot of maize

Altmetrics

Downloads

161

Views

99

Comments

0

A peer-reviewed article of this preprint also exists.

Submitted:

06 May 2024

Posted:

08 May 2024

You are already at the latest version

Alerts
Abstract
Fusarium stalk rot (FSR) caused by the Fusarium species complex is an economic threat to maize cultivation all over the world. We investigated the population structure and genetic diversity of Fusarium spp. obtained from five major maize-growing regions of India. The Tef-1α locus was used for phylogenetic analysis of geographically distinct isolates of Fusarium verticillioides, F. andiyazi, F. proliferatum, F. nygamai, and F. acutatum causing FSR. Geographical separation among four local populations contributed to 7.87% variance, whereas 92.12% of the variance was within popula-tions, suggesting a predominant influence of local adaptation or stochastic events like genetic drift within populations, with geographical separation playing a lesser but significant role in shaping genetic diversity. Genetic differentiation statistics between Fusarium species showed lower gene flow from haplotypes except in the population of F. acutatum and F. andiyazi having high GST values. In contrast, a high Kxy was reported, indicating elevated genetic differentiation between populations. The haplotype network analysis revealed the presence of eight distinct haplotypes which reflected pathogenic evolution and adaptive potential of Fusarium spp. The results offer a comprehensive framework for discussing the implications of genetic diversity in pathogen management and the evolutionary dynamics of the Fusarium spp. causing FSR of maize in the Indian subcontinent.
Keywords: 
Subject: Biology and Life Sciences  -   Biology and Biotechnology

1. Introduction

Fusarium stalk rot (FSR) of maize, is an economically important fungal disease that commonly occurs in 126 maize-growing countries of the world [1,2]. Fusarium is a highly pathogenic fungus that impairs plant growth, reduces the nutritional value and overall crop yield [3]. Based on its ancestral behaviour and shared cultural and morphological traits in common with other Fusarium species, FSR is considered to be a complex of species including F. verticillioides[4,5,6], F. graminearum [7,8], F. falciforme [9], F. temperatum, F. subglutinans[10]. In addition to the above reports, four species were reported from maize fields in Mexico [11]. Other countries including Spain [12], Brazil [13], Canada [14], the USA [15], and India [6] also reported different species as causes of FSR. Nevertheless, F. verticillioides was reported from all those countries as the main species causing FSR in agricultural fields.
FSR is caused by several Fusarium species, including members of the Fusarium fujikuroi species complex (FFSC). The FFSC is one of the best-studied species complexes encompassing genera from varied ecologies [16,17]. The FFSC was first established by Wollenweber et al.[18] as a section Liseola for sporodochia-producing species that do not form chlamydospores. The proponent of bio-geographic hypothesis for FFSC [19] clustered Fusarium isolates into three clusters with well-supported phylogenetic clades named the African, American, and Asian clades. The core African clade included maize and coffee pathogens such as F. verticillioides and F. xylarioides [20,21,22]. Presently, there are more than 60 distinct phylogenetic species recognized under FFSC [23]., F. verticillioides is the most predominant species of Fusarium in maize-growing areas of India[24,6]. F. verticillioides is seed-borne, soil or air-borne however it may enter plants through wounds showing symptomatic and asymptomatic symptoms [25,53]. Initial appearance of FSR occurs at tassel formation or grain filling stage and attains severity at milk to waxy stages. Stem bases of susceptible plants become brown, with non-distinct spots at the stem. Infected stem tissues get shrivelled, loosened, soft, watery, and brown. As the infection spreads, it covers the second and third nodes, and white-pink mycelium appears on the stalk of the plant [26]. In the late stage, plants exhibit symptoms such as drooping, drying, wilting of leaves, empty cob development, and increased angle between cob and stalk in the field at later stage of Fusarium infection [6]. Other Fusarium species are also isolated from infected maize plants exhibiting similar symptoms [27].
The taxonomic identification of Fusarium spp. based on its morphological traits was inefficient with inconclusive species differentiation, due to overlapping morphological traits. However, with recent advancements at the molecular level, characterization and identification of species under FFSC is primarily based on DNA sequence analysis [28]. According to O’Donnell et al.[29]genes of translation elongation factor (Tef-1α), calmodulin (CaM), and β-tubulin (Tub2) could be used for the molecular characterization of most of the Fusarium species in FFSC, while ITS region, 28 S rDNA and mtSSU genes are not. Tub2, Tef-1α and RNA polymerase II subunits 1 (RPB 1) and 2 (RPB 2) are being recommended because these regions can be sequenced easily and can be aligned across the entire genus [27, 28, 29]. The sequence similarity threshold of Tef 1-α is 99.4% and is considered as the most suitable marker to discriminate among Fusarium spp. at the species level. Thus Tef-1α is required for reliable identification of unknown isolates of Fusarium spp. for phylogenetic analysis [30]. Genetic diversity and phylogenetic analysis are based on studying the evolutionary relationship of local and global isolates which may or may not correlate with the geographical region or host species. The biological fitness of these genotypes depends on their ability to adapt to changing environmental conditions thus resulting in a high degree of genetic diversity [32].
The Indian subcontinent is among the most diverse and oldest ecosystems of the subtropical region, and Fusarium spp. in such habitats has evolved with the plant host as well as with other pathogens [33]. The objective of the current investigation was to ascertain the specific Fusarium species within the FFSC that are responsible for infecting maize crops in India. We employed a phylogenetic methodology to examine and analyze partial sequences of the Tef-1α gene and determine DNA polymorphism of Tef-1α sequences of Fusarium spp. isolated from India and the corresponding Gene-Bank reference sequences from other countries. Population genetic studies of pathogenic fungi can provide information on the special distribution of population structure and possible gene flow. In the present study, we determined the haplotype diversity of Fusarium spp. causing FSR. ITS sequences are less informative with lower haplotype diversity distribution resulting in poor resolution and taxa placement in the phylogenetic tree as compared to Tef-1α sequences [32]. Global Tef-1α sequence datasets phylogeny of 11 countries represent the distinct separation of Incarnatum and Equiseti clades [32]. Haplotype networks help to determine the potential spread of putative pathogens across region [32,34]. The pathogenicity and aggressiveness of each Fusarium species in maize stalks by an artificial inoculation assay were reported in our previous publication [6]. In the present study, the genetic diversity of potentially pathogenic Fusarium spp. among Indian states was assessed. The findings of this study will enhance our understanding of the pathogenicity of different Fusarium spp. which will be useful for the management of FSR for enhancing maize productivity.

2. Materials and Methods

2.1. Study Area and Fungal Isolates Sampling

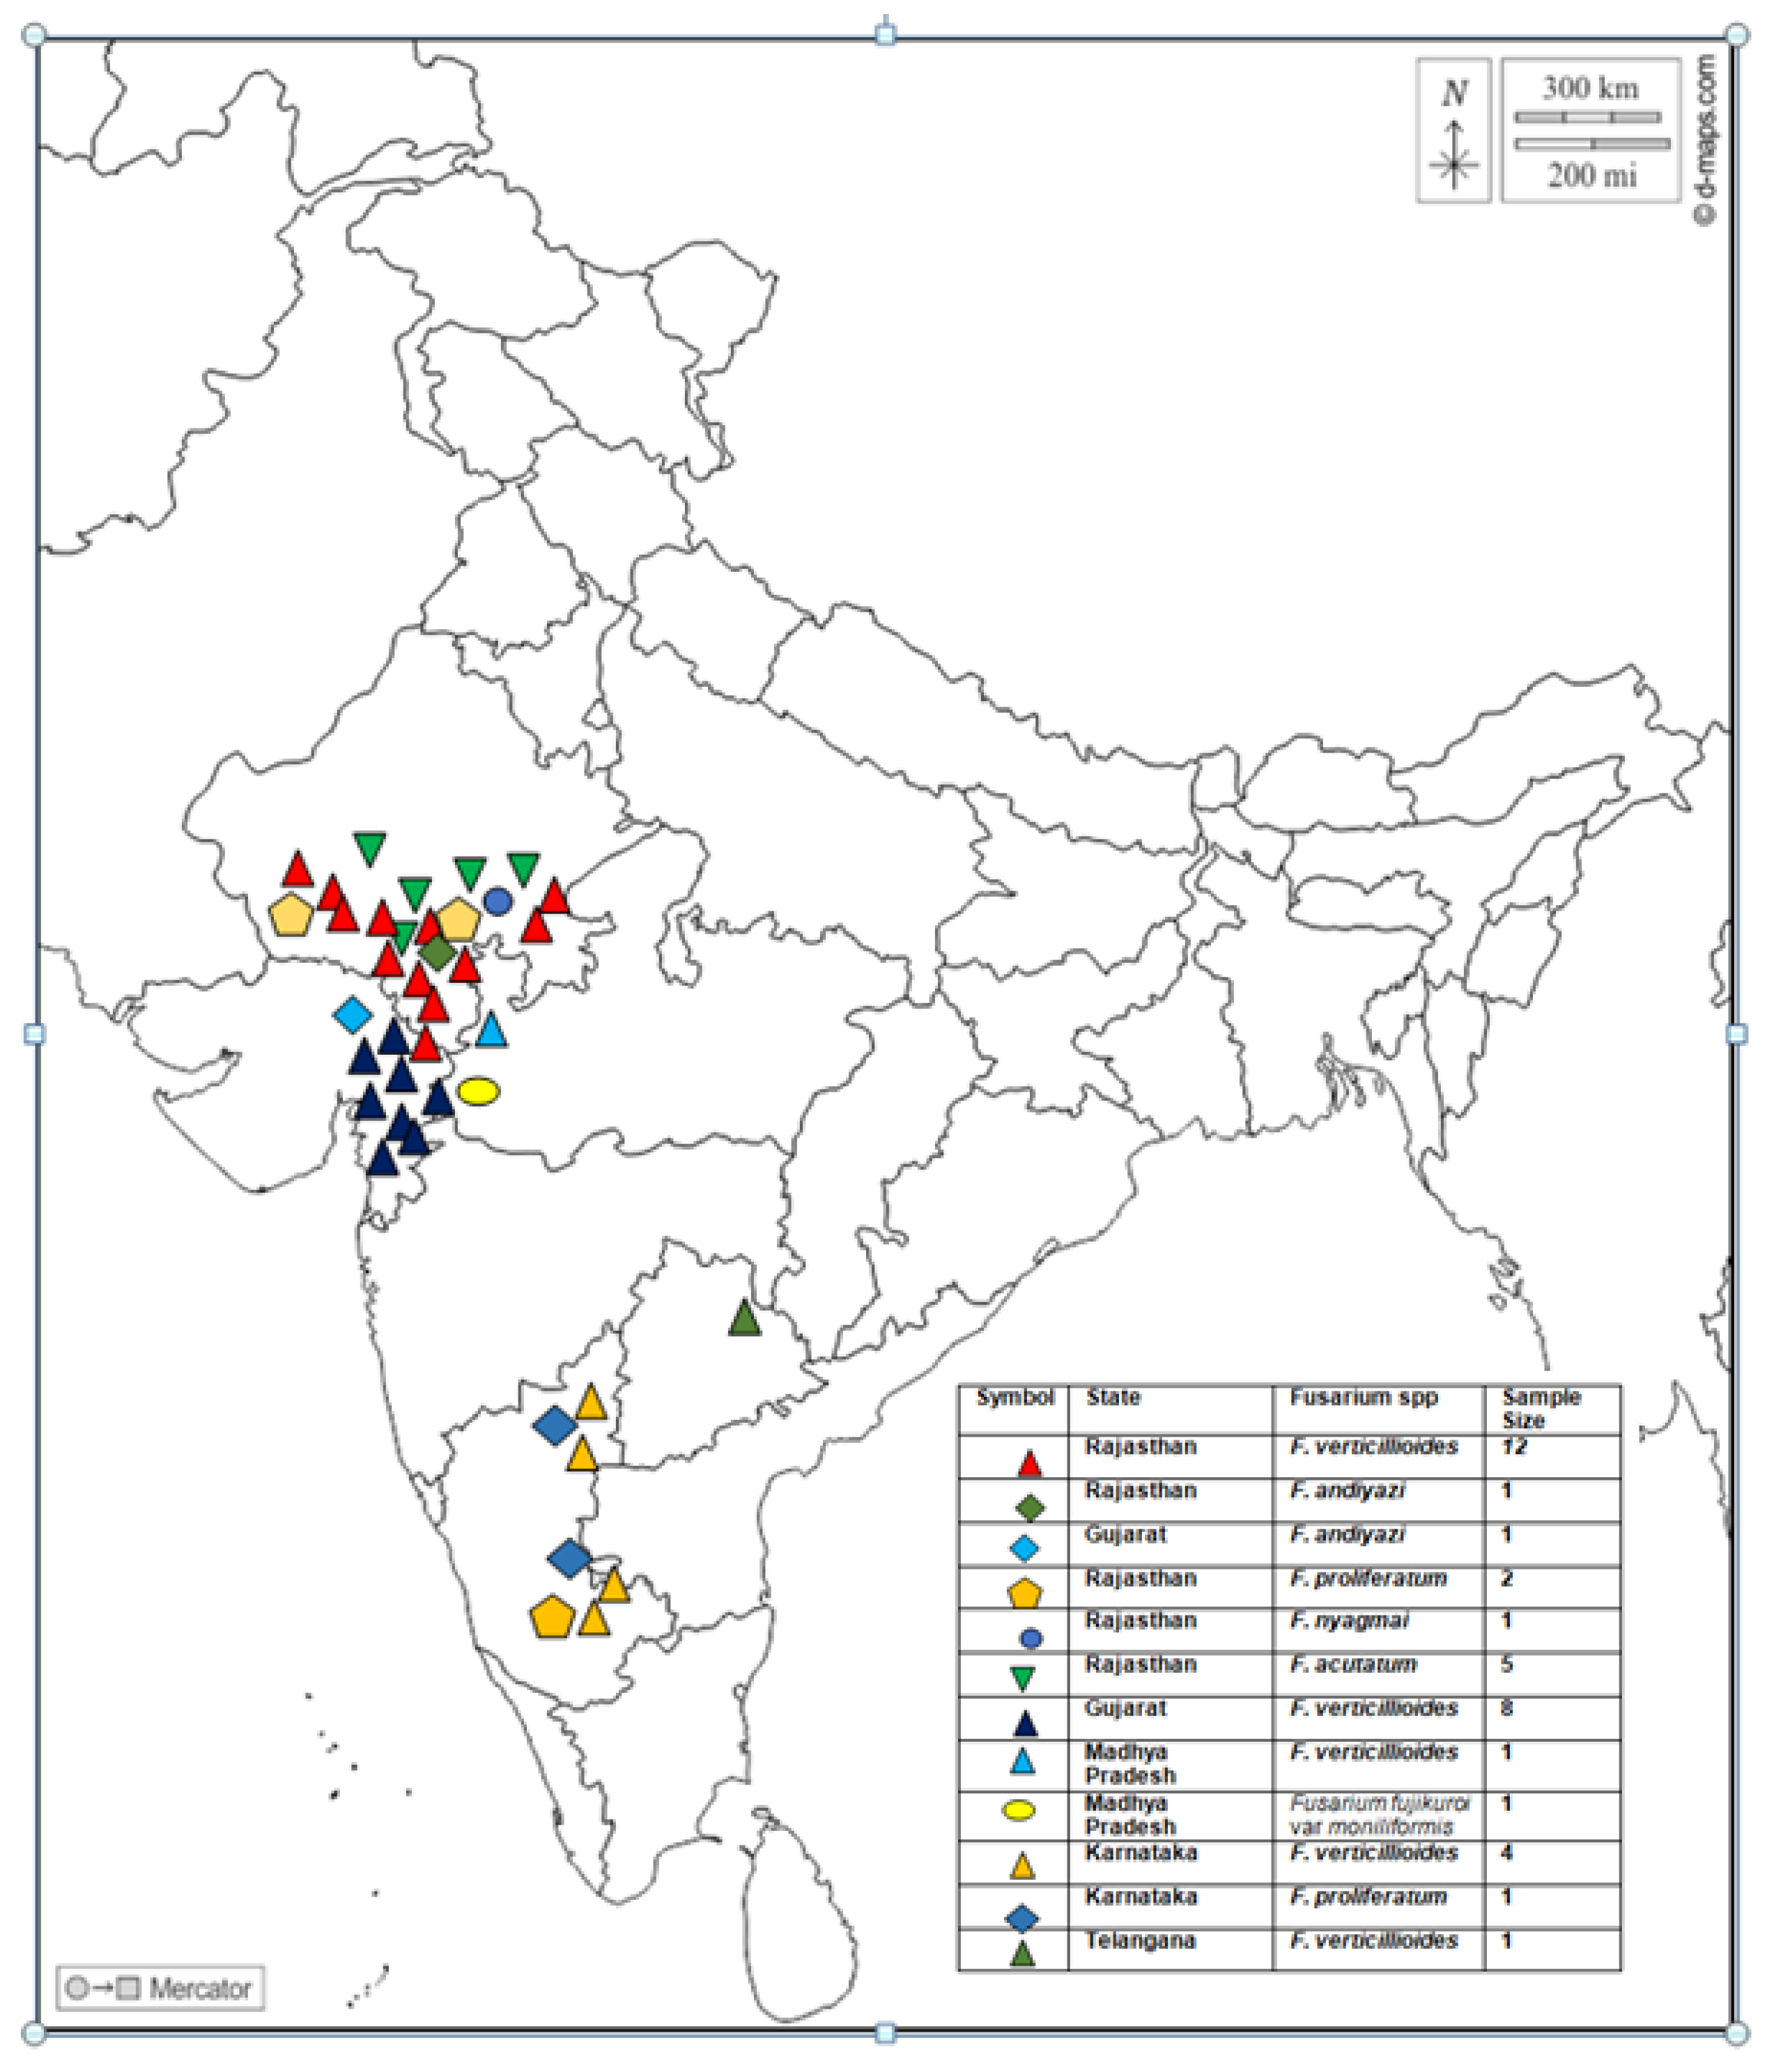
Fusarium isolates were recovered from stalks of naturally infected maize plants with FSR during 2020-2022 from the 40 sites of Southern Rajasthan, Eastern Gujarat, Western Madhya Pradesh, Karnataka, and Telangana states of India. Geographical locations with coordinates of Fusarium spp. samples are depicted in the map (Figure 1). The locations of the sample collection encompassed five agro-climatic zones of India namely, Zone 7- Eastern Plateau and Hills, Zone 8- Central Plateau and Hills, Zone 9- Western Plateau and Hills, 10- Southern Plateau and Hills, and Zone 13- Gujarat Plains and Hills. Infected plant samples were collected from fields, kept in brown paper bags, brought to the laboratory, and processed for isolation of pathogens.

2.2. Fungal Isolation

The pith of the infected plant samples were surface sterilized by soaking in 0.1% sodium hypochlorite solution for 30 s, washed twice with sterilized distilled water and plated on potato dextrose agar (PDA) media. These plates were incubated at 27 ± 1°C in a BOD incubator for 4-5 days. Fugal growth moved from PDA to SpeziellerNahrstoffarmer agar (SNA) medium (1 g KH2PO4,1 g KNO3, 0.5 g MgSO4.7H2O, 0.5 g KCl, 0.2 g glucose, 0.2 g sucrose, and 20 g agar in 1 L SDW), to enhance sporulation, according to Leslie et al. [35]. Single-spore Fusarium isolates were obtained using the method described by Liddell et al.[36]. Monoconidial cultures grown on SNA media and harvested mycelium and conidia were placed in potato dextrose broth with 15% glycerol and cryopreserved in -80 °C. A total of 71 purified isolates were deposited in the culture collection center, Department of Plant Pathology, Rani Lakshmi Bai Central Agricultural University (RLBCAU), Jhansi, India for further use in the experiment.

2.3. DNA Isolation, PCR Amplification and Sequencing

Freshly sub-culturedFusarium isolates on PDA plates incubated at 27±2 °C in the dark for nearly six to seven days [6], were used for DNA extraction. The genomic DNA was extracted using CTAB method [37]. A 1 cm2 plug of fungal mycelium was transferred from the culture plates to a sterile 2 ml Eppendorf tube. Mycelium was macerated using a tissue homogenizer and 500 µl CTAB buffer, then incubated in an Eppendorf tube at 60°C for 1 hour in a hot water bath (Cole-Palmer India Pvt. Ltd. Mumbai) with gentle shaking every 10 minutes. The buffer contained (2.5% CTAB, 4 M NaCl, 20 mM EDTA, 100 mMTris-HCl and 0.2% - Mercaptoethanol; pH 8.0). All buffer preparation components were obtained from Hi-Media® (Thane, Maharashtra, India). The concentration and purity of DNA was evaluated using Nanodrop (ThermoFisherTM Scientific, Mumbai, India) and its absorbance was recorded at 260/280 nm, and the quality of DNA was tested by running agarose gel (0.8% w/v) electrophoresis (iGeneLabserve™, Delhi, India). The Gel documentation system (Syngene R InGenius3™, Frederick, USA) was used to determine the quality of DNA. The final DNA volume was adjusted to 50 ng.
The Tef-1α gene from each Fusarium isolates were amplified using the Tef1α EF-1 [5’-ATGGGTAAGGA (A/G) GACAEAGAC-3’] and EF-2 [5’-GGA (G/A) GTACCAGT (G/C) ATCATGTT-3’] primer pairs [38]. The PCR reaction was performed in a 50 µl reaction volume containing 1 ng DNA template, 1.5 mм MgCl2, 0.5 mм each of dNTP, 0.4 µм of forward and reverse primers and 1.25U of Taq DNA polymerase. The PCR amplification was performed with an initial denaturation at 94 °C for 5 min followed by 35 cycles each at 94°C for 1 min, annealing at 50 °C for 1 min, extension at 72°C for 2 mins,and a final extension at 72°C for 10 mins, in a Thermocycler (VeritiTM, Applied BiosystemTM, New Delhi, India). The PCR products were separated by agarose gel electrophoresis (1% w/v in 0.5 × TAE buffer) and visualized by ethidium bromide staining. The PCR products were sequenced through the Sanger sequencing platform at Medauxin™, Bangalore, India. The sequences received were edited using BioEdit software [39] and compared with sequences in NCBI (National Center for Biotechnology Information) using nBLAST software. The sequences were deposited in NCBI GenBank and got the accession numbers are listed in the Table S1.

2.4. Phylogenetic Analysis

The sequence chromatograms generated for Tef-1αloci of 38 isolates were edited in BioEdit version 7.0.1 [39]. The consensus sequences were determined and assembled in MEGA X [40]. Individual Tef-1 α sequences of 38 isolates were compared with reference sequences present in the NCBI GenBank database.

2.5. Population Genetic Analysis

To infer the population structure of Fusarium species and to examine the process that has structured the distributions, several analysis of amplified Tef1-α sequences were performed. Genetic diversity including polymorphic sites (S), haplotype number (H), haplotype diversity (h), number of mutations, and nucleotide diversity (π) were calculated within species and populations using the DnaSP version 5(http://www.ub.edu/dnasp) [41]. Population structure and gene flow were evaluated by analysis of molecular variance (AMOVA). Genetic differentiation between populations of Fusarium species was estimated using FST[42]

2.6. Indices of Genetic Diversity and Fusarium Population Structure

All sequences were used to calculate the genetic diversity indices of Fusarium spp. causing FSR, from the concatenated set of single gene sequences. Sequence data were uploaded to the R Apex package and the genetic differentiation statistics, (Nei’s GST1982, Lynch and Crease’s NST 1990, Hudson, Slatkin and Maddison’s FST 1992) for Fusarium spp. populations were calculated using the Mmod package (Table S2).
Sequences were grouped by assemblage to calculate indices using DnaSP v.5 program, where input data were sequenced and aligned for the marker. The indices used included Theta (per site) from the total number of mutations, (Eta); number of polymorphic (segregating) sites (S); nucleotide diversity (π)- the average number of nucleotide differences per site between a pair of DNA sequences; the Theta index of the Eta by site (ϴ) and the index of S. Those indices were reported with the corresponding variations and standard deviations; number of haplotype (h), and haplotype diversity (Hd). The latter indices report the probability that two random haplotypes are different. Using the same software, a Tajima’D evolutionary divergence test was performed, to determine if the sequences evaluated reflected natural variation or were involved in the selection process. The difference between estimates of the number of segregating sites and the average number of pairwise differences is the basis for Tajima's D. Based on observed pair-wise differences, 10,000 computer simulations were used to estimate these values. Population expansion is suggested by negative values, whilst population reduction is indicated by positive values.
Separate statistics for genetic differentiation among populations for each species and their concatenated sequence were also calculated. Both the concatenated sequence from the E assemblage and assemblages that were unable to be determined for specific sequences in certain genes were evaluated. Genetic differences were estimated. Statistics based on haplotypes (Hs), nucleotide sequences (Ks), and a few other variables that represent gene flow from nucleotide sequences (e.g. Wright's F (Fst), Delta ST, Gamma ST, and Nst)—were used to assess genetic differences. Nucleotide substitutions per site (Dxy), net nucleotide substitutions per site (Da), the average number of nucleotide differences in pairs (Kxy), and gene flow from haplotypes (Gst) were then analysed using the DnaSP v.5 software.

2.7. Haplotype Network Analysis

The sequences were edited to equal size using BioEdit and then aligned using the MUSCLE algorithm inside MEGA X. The alignment file was imported into DNAsp for haplotype analysis. DnaSP's algorithm then proceeded to identify unique haplotypes based on variations such as single nucleotide polymorphisms (SNPs), insertions, and deletions. The settings within DnaSP were carefully adjusted to handle indels and missing data appropriately, ensuring that the haplotype delineation was both accurate and reflective of the underlying genetic diversity. The output from DnaSP provided a comprehensive list of haplotypes, their frequencies, and a matrix of haplotype differences. For the construction and visualization of the haplotype network, PopART (version 1.7) was used. Importing the haplotype data from DnaSP into PopART, we opted for the Median-Joining (MJ) network algorithm due to its efficiency in handling our dataset's complexity and its ability to accurately depict mutational relationships between haplotypes. The epsilon value was adjusted to zero, adhering to the recommended settings for constructing a network that closely reflects the genetic distances and connections among our identified haplotypes. The visualization in PopART allowed to represent haplotypes in a manner that highlighted their frequencies and the mutational steps between them, using size and lines, respectively. The network visualization was further enriched by incorporating geographical information and color coding to represent different populations, thereby adding layers of interpretative value to the genetic data.

3. Results

3.1. Collection of Isolates

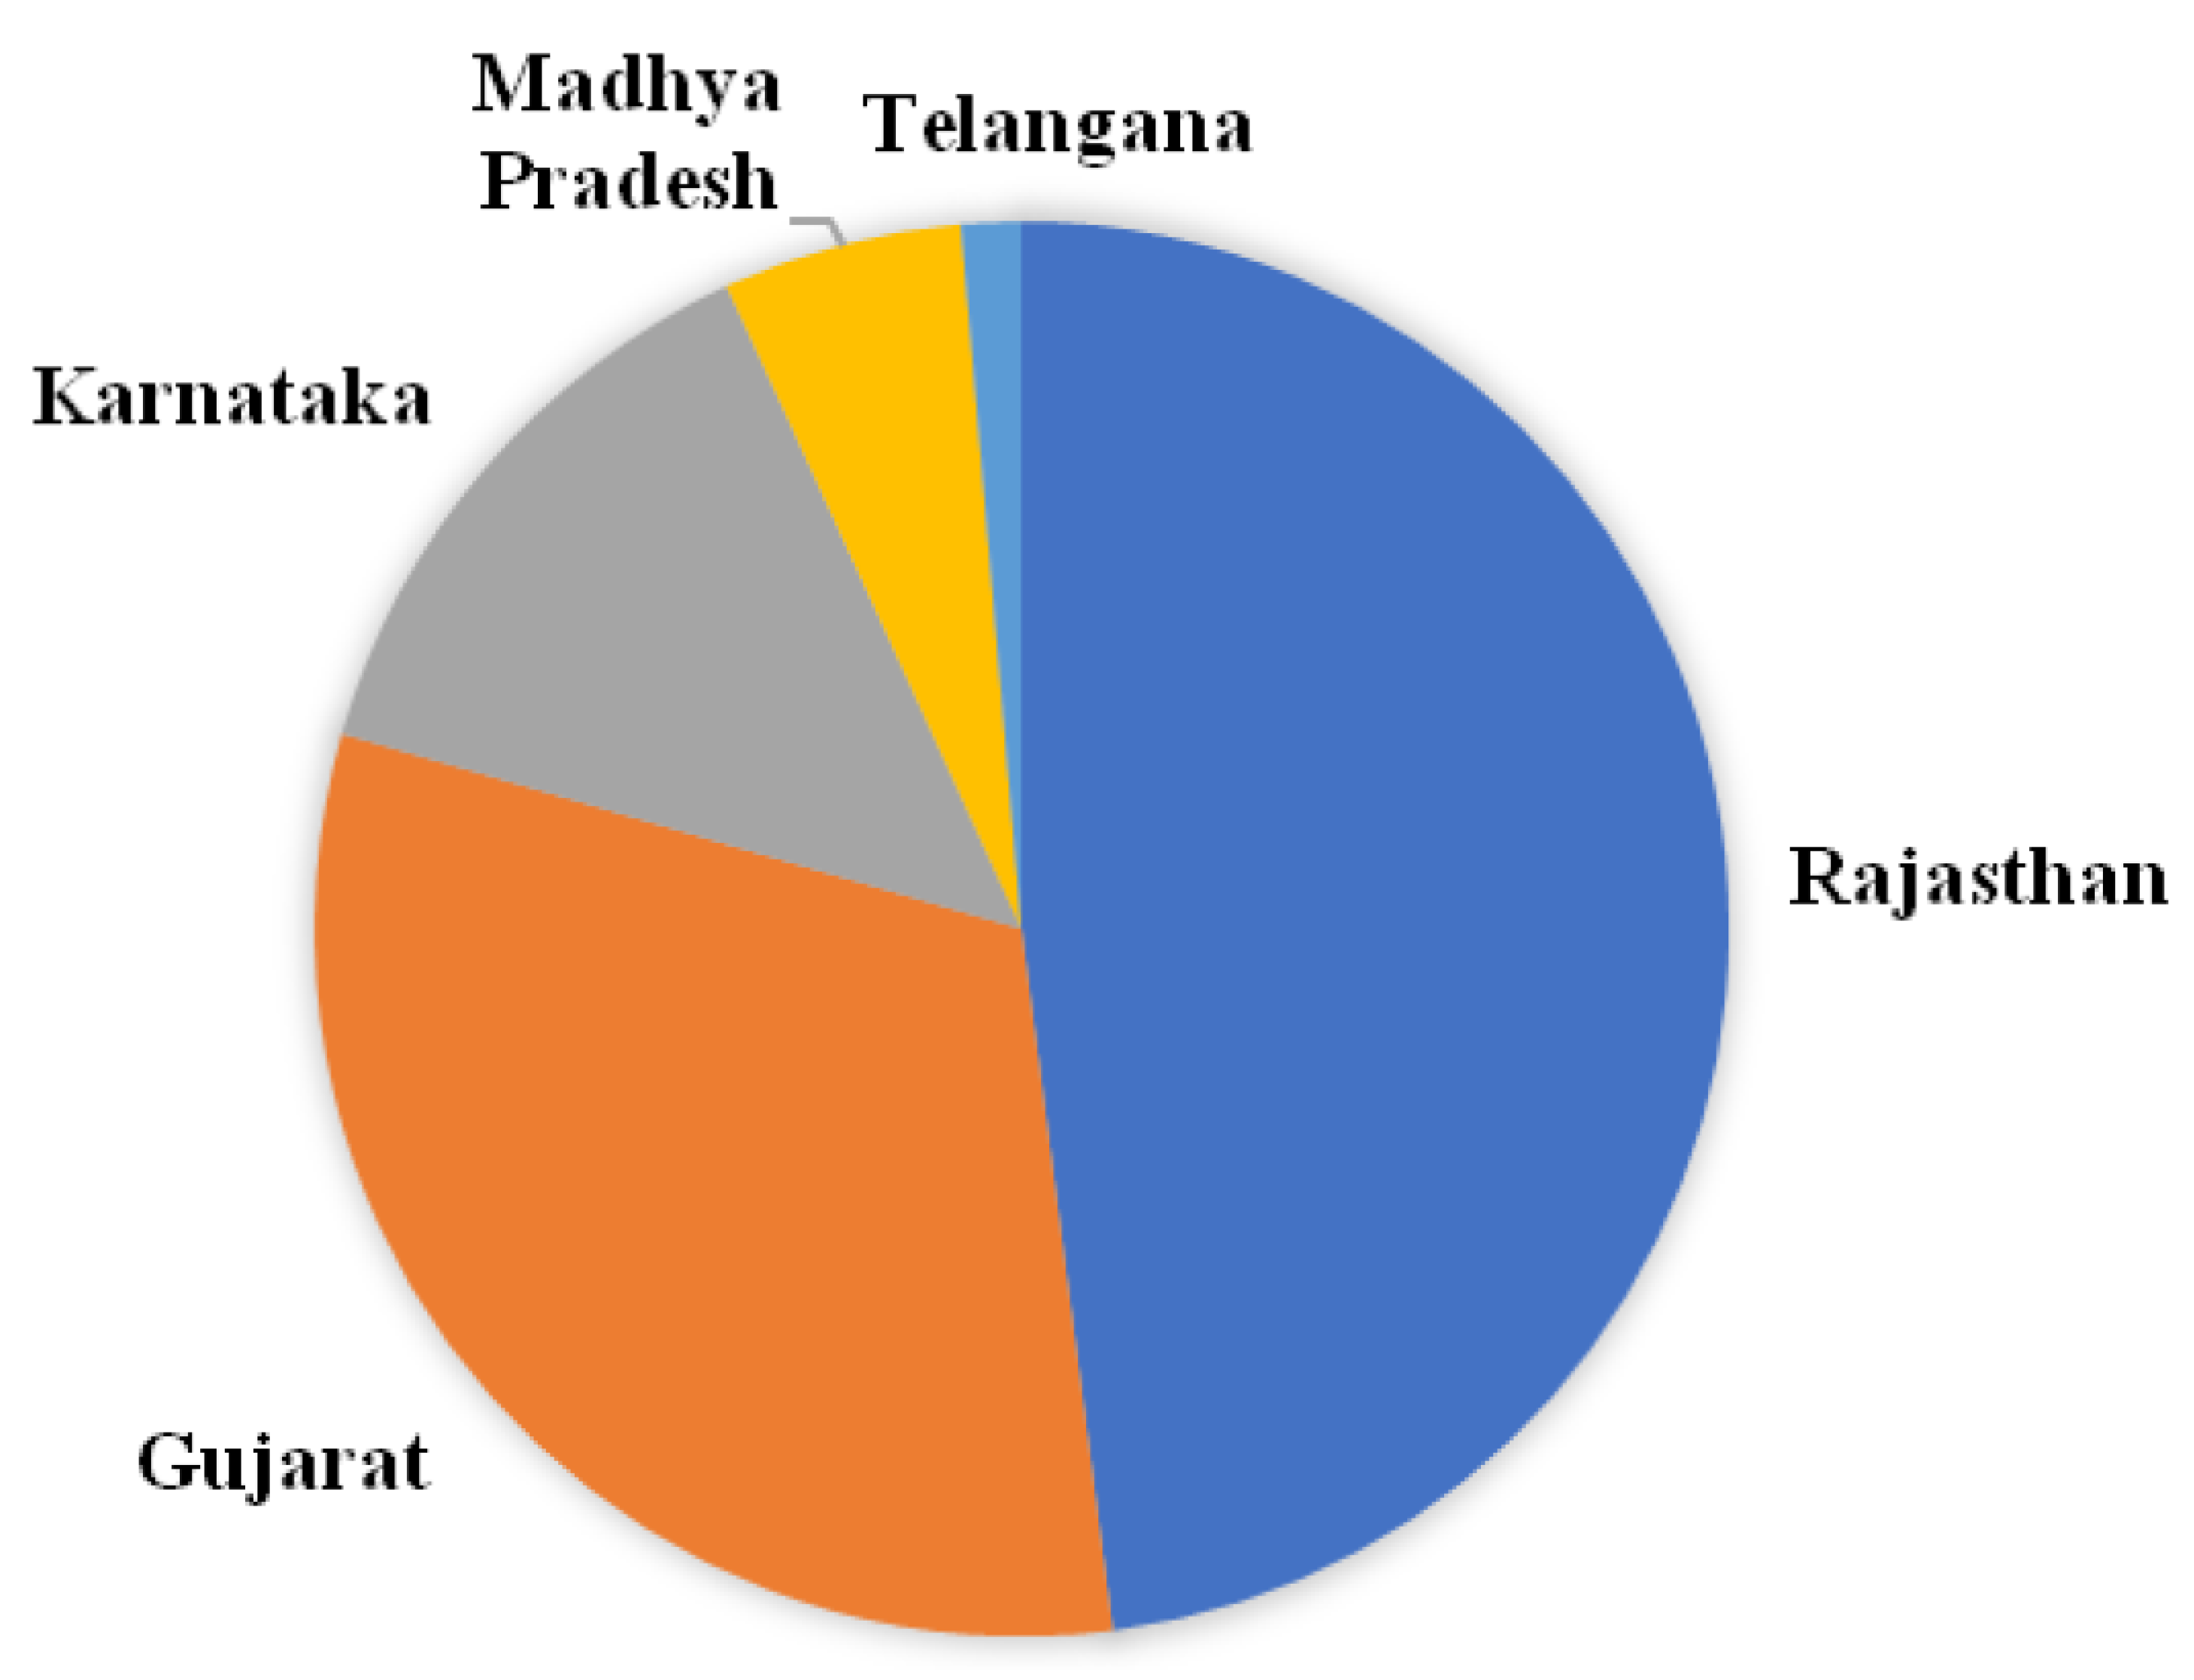
In the present study, we selected maize-growing regions of India having an incidence of FSR.Diseased plants exhibiting symptoms such as drooping, drying, wilting of leaves, empty cob were selected to collect samples (Figure 1).Seventy one isolates were collected from 40 sites. It includes 16 regions of Southern Rajasthan, 4 sites of Madhya Pradesh 5 regions of Gujarat, 7 regions of Karnataka, and 1 site from Telangana State (Figure 2). The isolation frequencies varied between the five states surveyed for sampling: Rajasthan (49.2%), Gujarat (32) and Madhya Pradesh, Karnataka, and Telangana together contribute 20% of the isolates in the study (Figure 3). From each region, we selected 2-3 fields having maize plants with typical FSR symptoms to collect diseased samples. All the 71 isolates of Fusarium spp. were evaluated for pathogenicity by artificial inoculation in susceptible ‘Pusa Composite 4’ cultivar and subsequent recovery of the isolates from diseased plants. The recovery with similar cultural characteristics proved Koch’s postulates.

3.2. Molecular Identification

Approximately 600 bp segments were amplified for Tef-1α region. Sequences of Tef-1α loci of Fusarium spp. were evaluated in combination with other sequences of FFSC available on NCBI, GenBank database. The sequences identity of Tef-1α fragments of 38 strains of Fusarium spp. belonging to FFSC was about 85% (pairwise identity ~95%). The sequences identified in the present study have been deposited in the NCBI GenBank and the accession numbers are present in the Table S1.

3.3. Phylogenetic Analysis and Evolutionary Relationship of Fusarium Strains Causing FSR

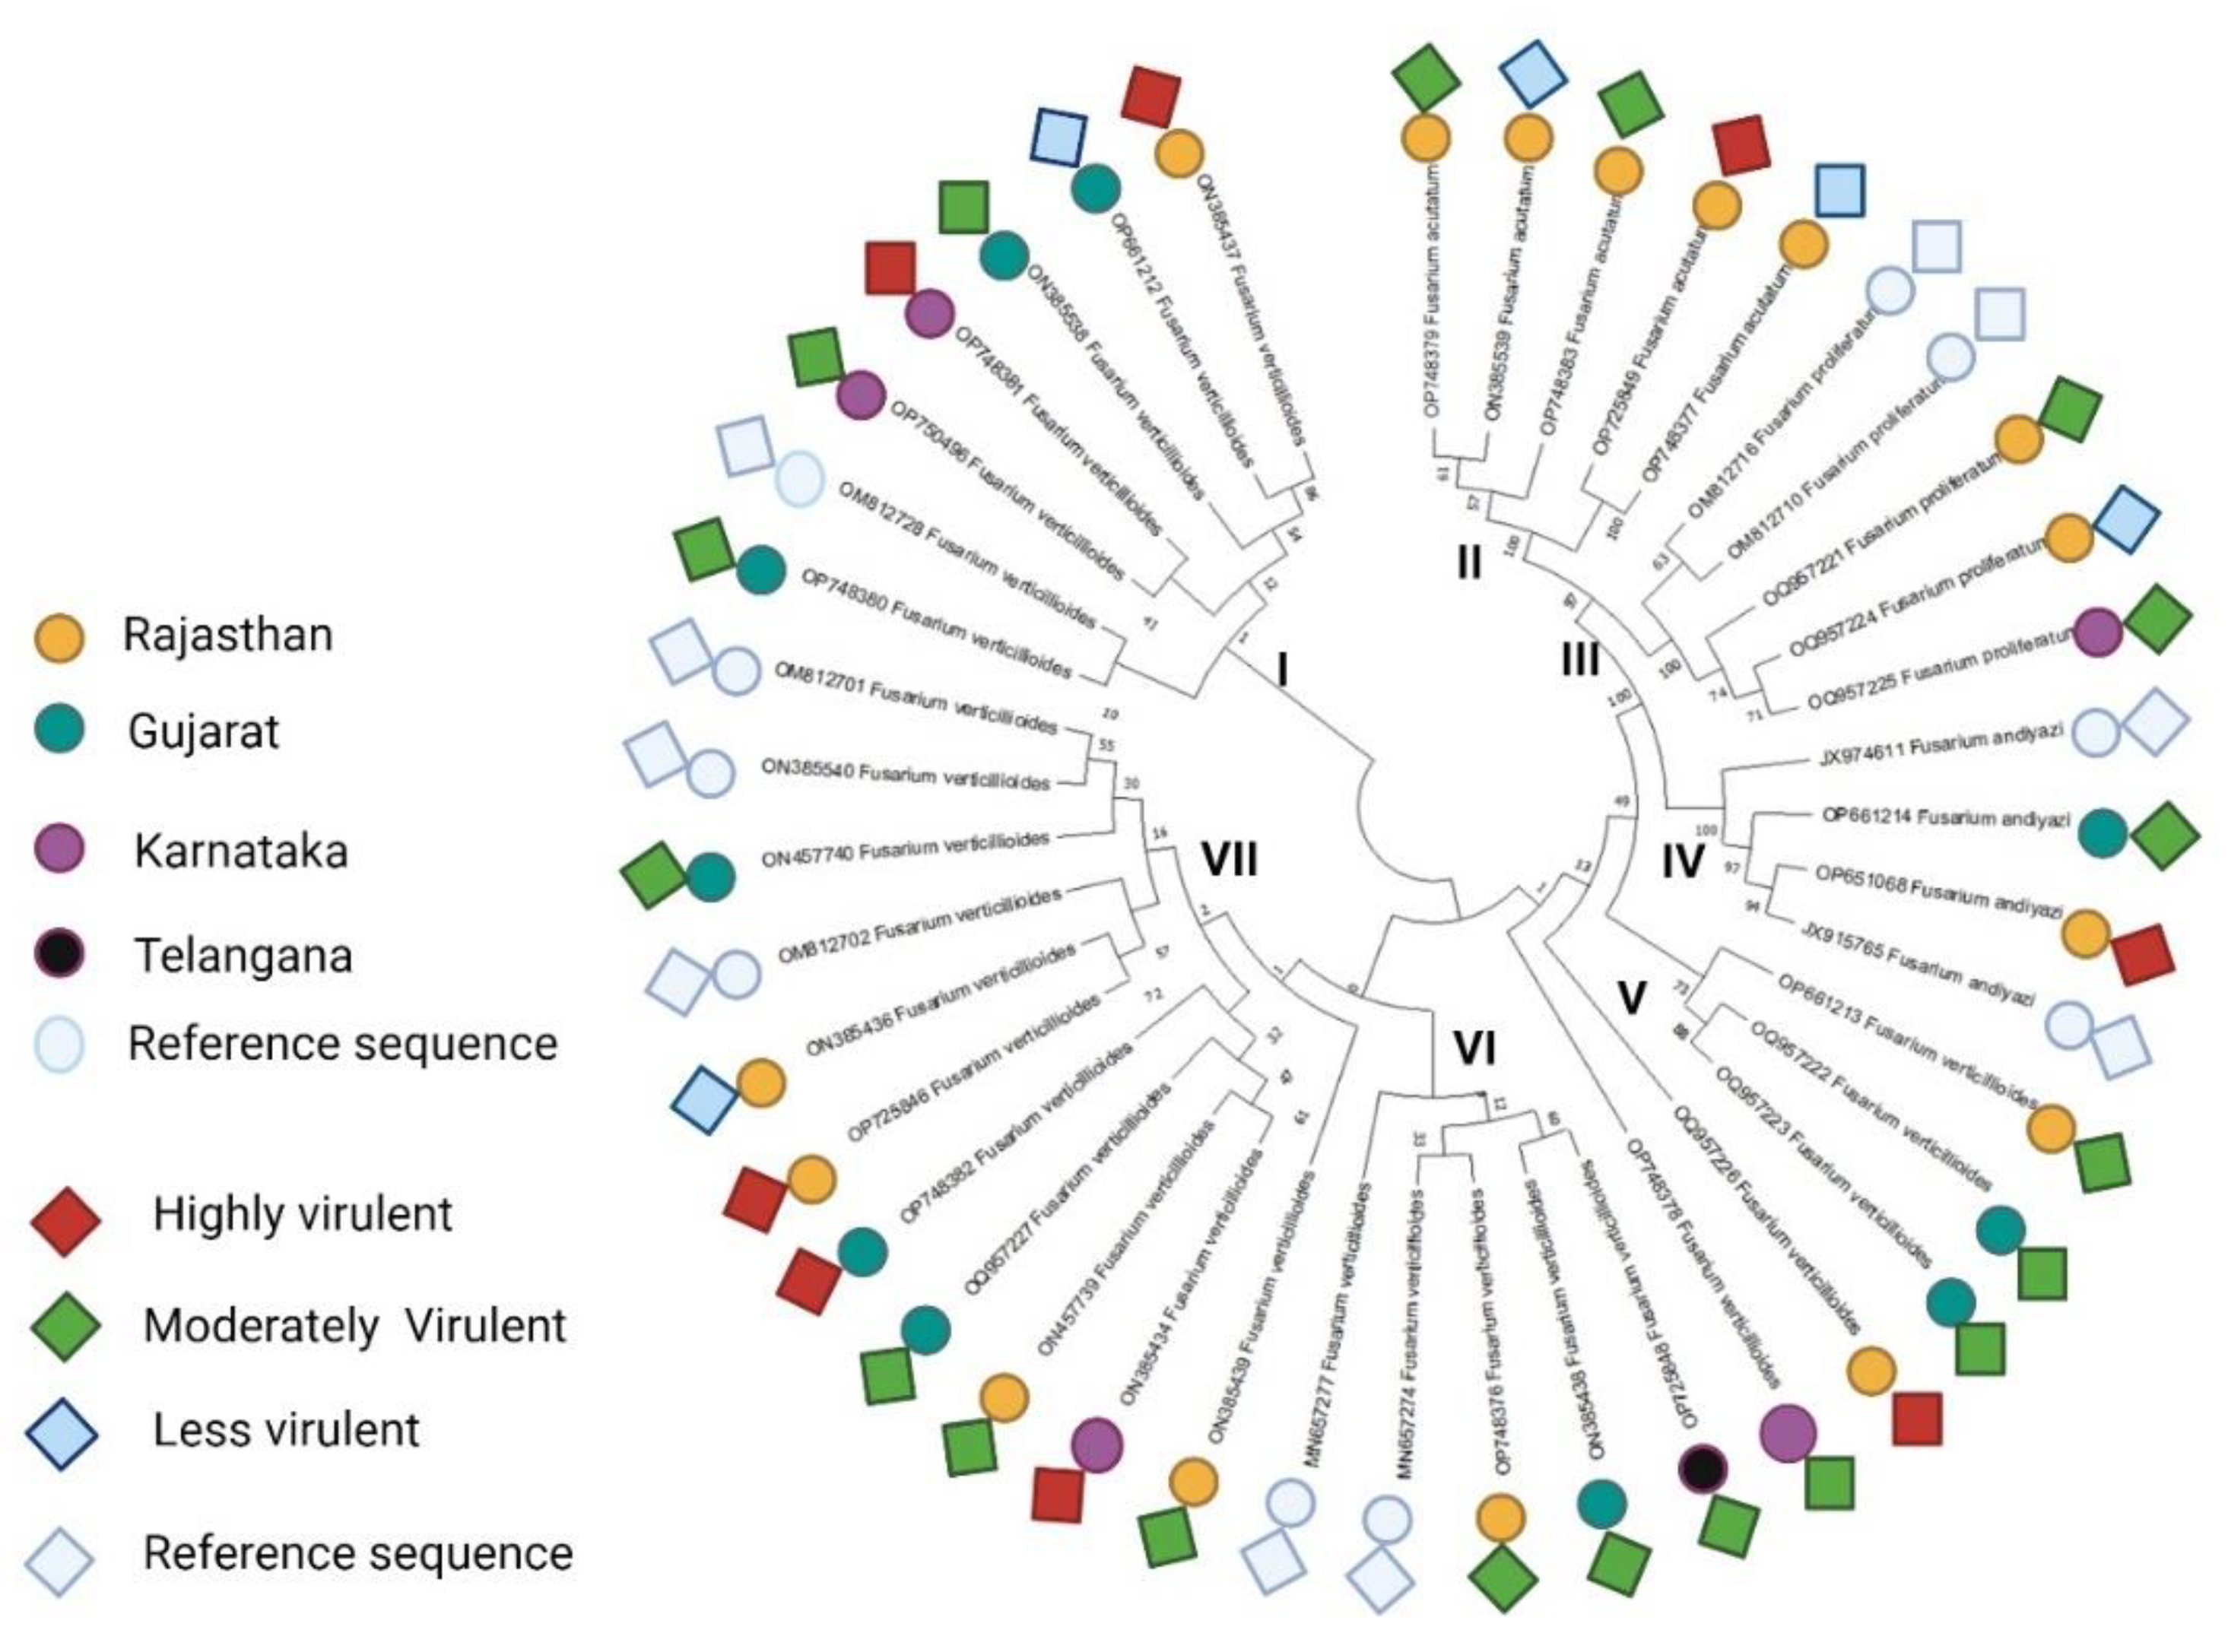
The nucleotide sequences of 38 representative isolates ofFusarium spp. varied from 538 to 831 bp and shared ≥ 90 % nucleotide sequence similarity with Tef-1α sequences of Fusarium spp. available in GenBank. Approximately 700-720bp segments were amplified for Tef-1α region. The gene sequences of 38 Fusarium spp. isolates and 4 other published sequences of Fusariumspp. strains were used to construct a phylogenetic tree using the neighbor-joining method. In addition, the maximum likelihood phylogenetic analysis also displayed strong support for different lineage. It was noticed that all the 38 Fusarium spp. strains were grouped into seven major clusters: Cluster I (7 isolates), Cluster II (5 isolates), Cluster III (5 isolates), Cluster IV (3 isolates), cluster V (4 isolates), Cluster VI (5 isolates) and Cluster VII (5 isolates) (Figure 4). Cluster I, a reference sequence OM812728 from Karnataka showed close similarity with FUG9 (OP748380), a strain from Gujarat. Other strains from Karnataka, Rajasthan and Gujarat including B1-1, Davangere, F23, F36 and F13 are identified as F. verticillioides which grouped together on the basis of genetic similarity. In cluster II, all F. acutatum strains (F27, F28, F10, FUR11, FUR13) clustered together with 57 to 100% sequence similarity and are restricted to Rajasthan State. Cluster III has strains from Karnataka and Rajasthan representing 5 strains of F. proliferatum of which two strains (OM812716, OM812710) are reference strains and the other three with 71 to 74 % sequence similarity are from the present study. Cluster IV has new strains of F. andiyazi, each from Rajasthan and Gujarat. All the isolated Clustered in clade V are F. verticillioidesand are from Karnataka, Rajasthan and Gujarat. Two strains (OQ957222 and OQ957223) are closely similar to each other and are distantly related to strains from Rajasthan (OP661213 and OQ957226) and Karnataka (OP748378). Clade VI has two reference strains of F. verticillioides and three strains of F. verticillioides from three different states ( i.e.Telangana, Madhya Pradesh and Rajasthan). Maximum number of 11 strains clustered together on one clade VII. Of them, 3 are reference strains while the other 8 strains belong to Karnataka, Rajasthan, and Gujarat. More than 50% of the strains belong to F. verticillioides clustered in Clades I, V, VI, and VII.
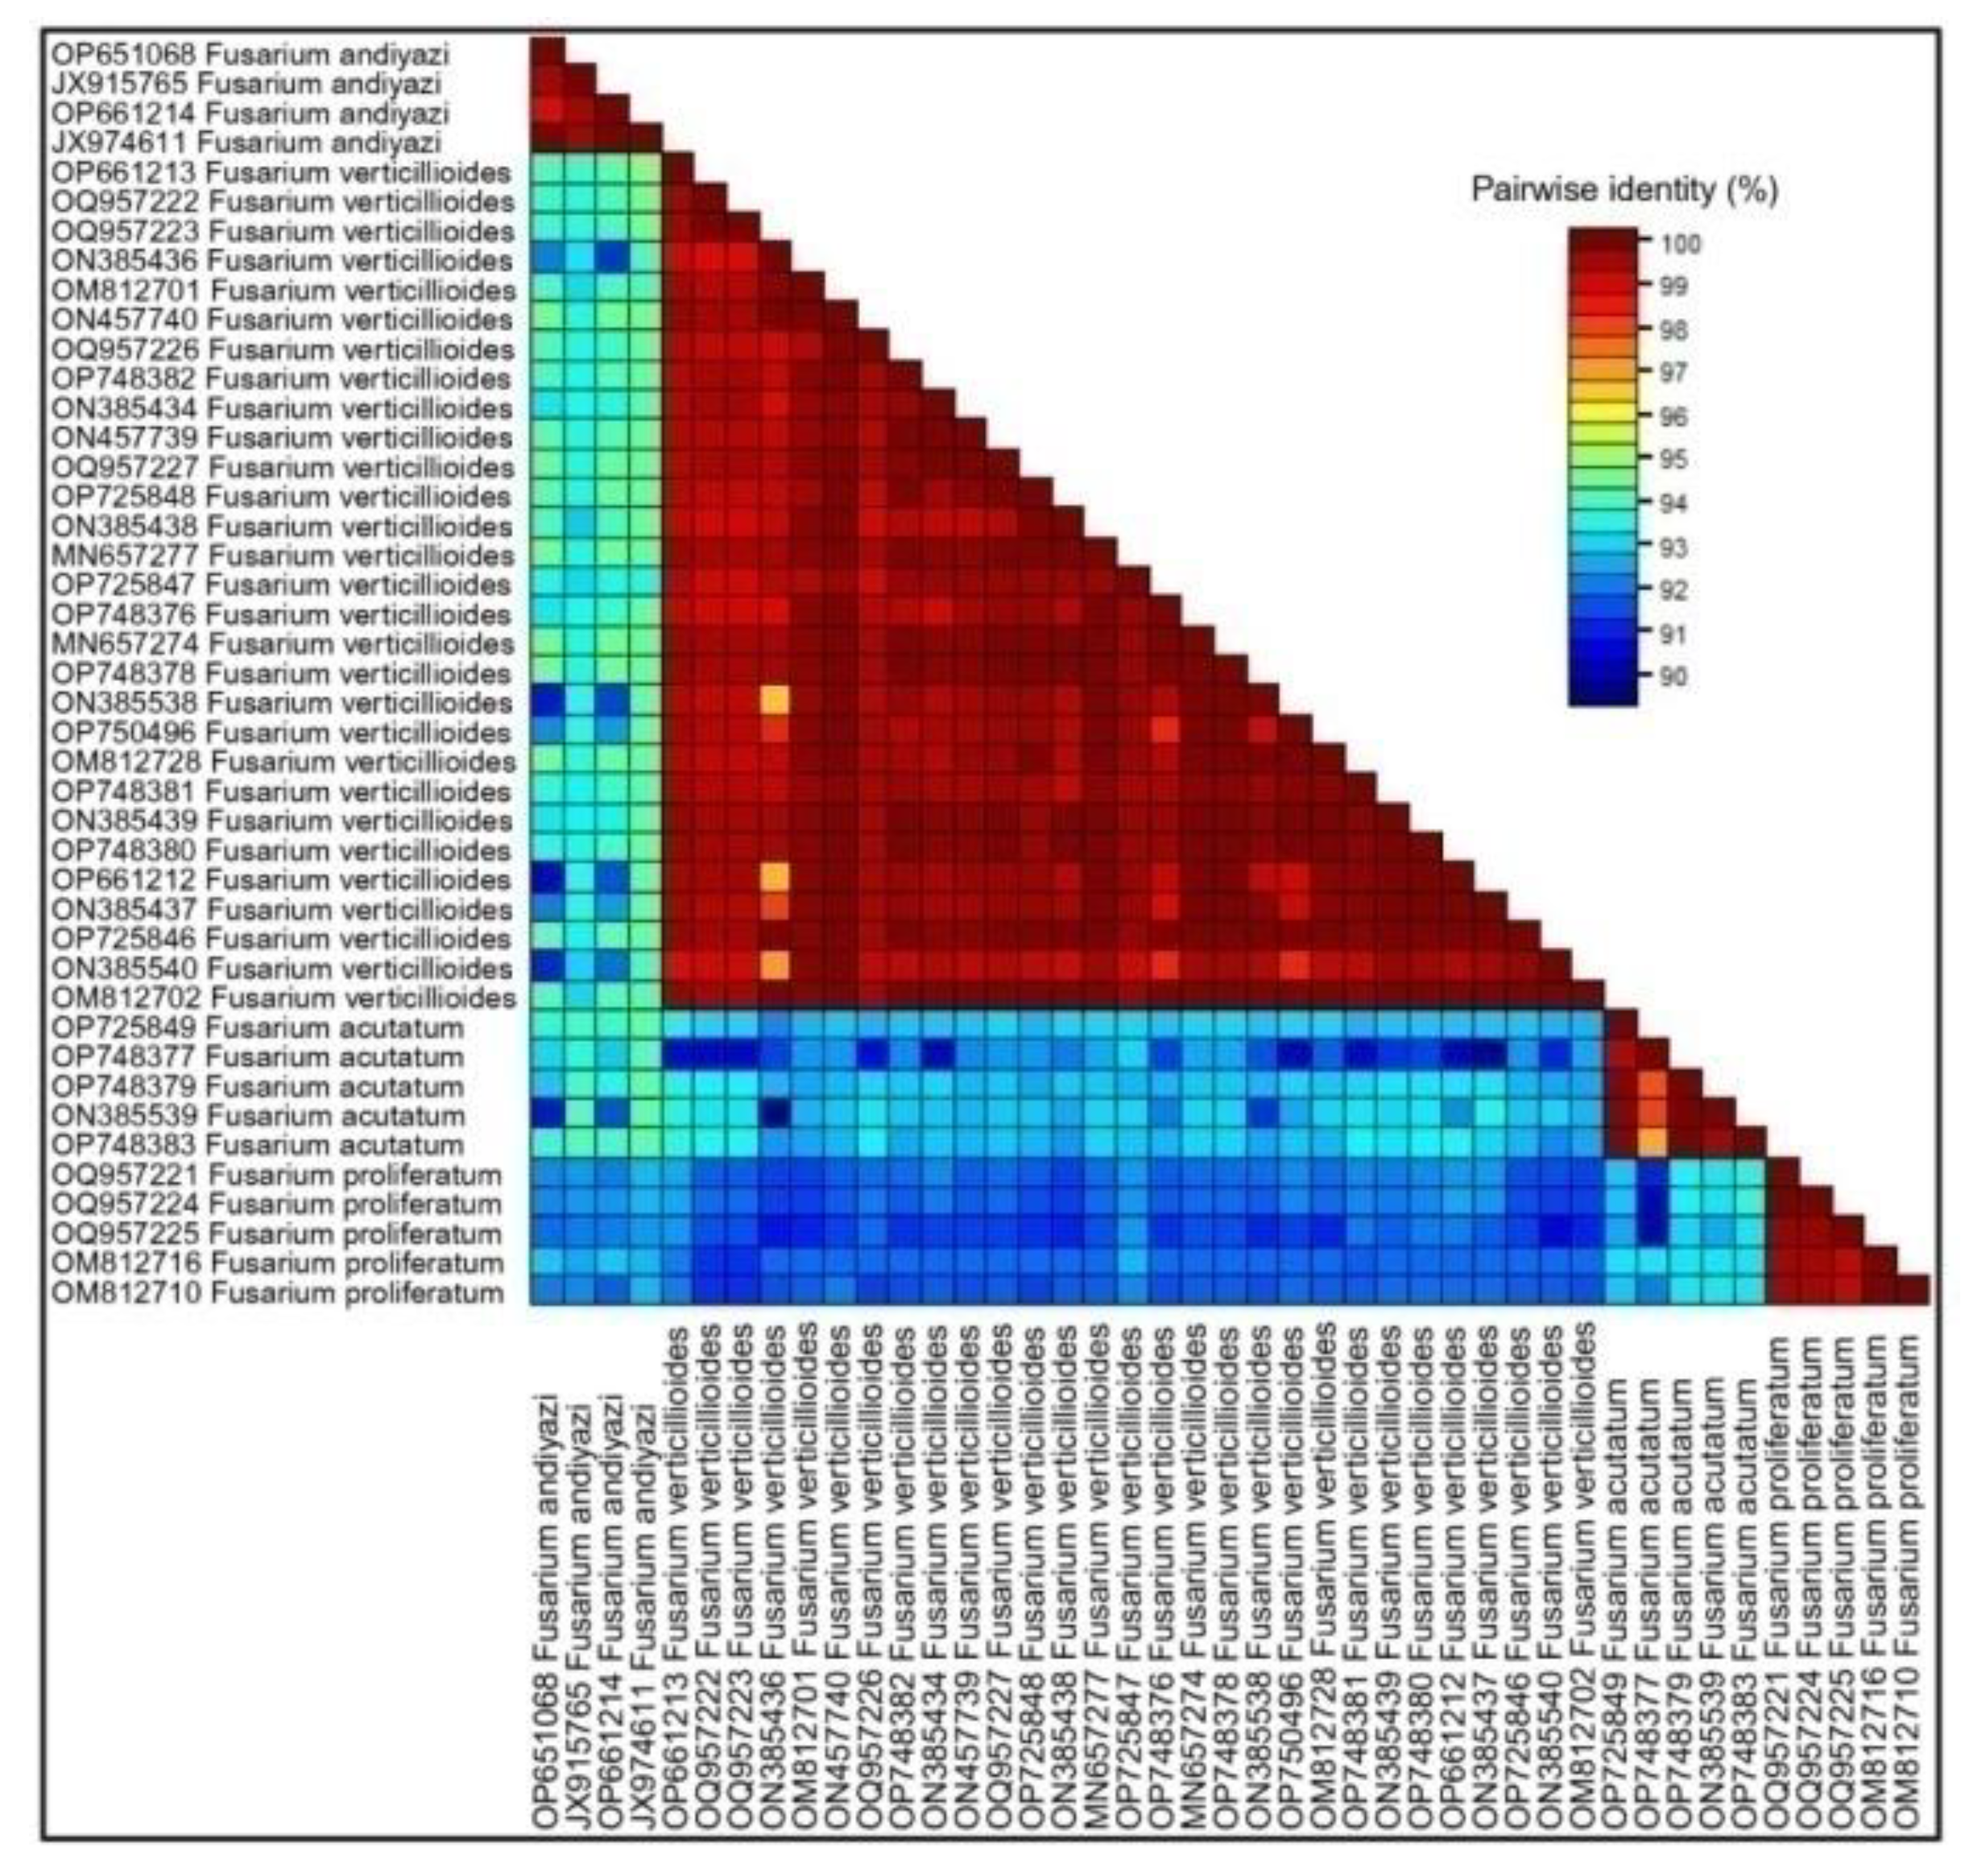
In the current investigation, a sequence was considered to belong to a species if it shared a clade with significant bootstrap support and had a percentage similarity to NCBI GenBank species between 98 and 100%. Sequence Demarcation Tool SDT v1.2 [43] performed similarity analysis rates between sequences to reveal base pair identities without accounting for gaps (Figure 5). It revealed a similarity rate that was approximately similar to the results of the phylogenetic study.

3.4. Relationship among the Geographic Population of Fusarium spp.

In the present study, the relationship among Fusarium spp. populations distributed in different geographical regions were analysed based on allele and genotype frequencies. Among all the Fusarium spp. isolates, the analysis of molecular variance (AMOVA) revealed that geographical separation among 4 local populations contributed 7.87% to the genetic variance while individual populations contributed 92.12%. The results of AMOVA analysis demonstrated a variance of 185.21 within the Fusarium populations. Both within and among population contributions to genetic variation were statistically significant (p<0.005). A strong genetic divergence was observed across the population (FST=0.07878, P<0.005) (Table 1 ).
In pairwise geographical population comparison, we found that all pairwise comparisons showed statistically significant differences at p<0.05. The pairwise FST values ranged from 0.066 (between F. acutatum and F. verticillioides) to 0.117 (between F. acutatumand F. proliferatum). Here, FST values of 0.066 and 0.117 represent the percentages (6.6% and 11.7% respectively) of total genetic variance contributed by the geographic separation between pairs of the local population. Overall based on a total of 38 Fusarium strains, the maximum FST score of 0.11682 was found between F. proliferatumandF.acutatumpopulation showing the highest genetic differentiation from other geographic populations (Table 2).

3.5. DNA Polymorphism Data

High levels of genetic diversity (π and ϴ) were observed among all isolates of Fusariumspp. from Rajasthan, Gujarat, Karnataka, Madhya Pradesh, and Telangana states. Descriptive statistics of aligned sequences are depicted in Table 3. For Fusarium spp. data set, Tef 1-α sequences exhibited a haplotype diversity of 0.589, and the nucleotide diversity (π) was 0.02390 (Table 3). With respect to the Tef-1α sequences, there are 8 haplotypes in the entire 38-sequence dataset. The percent sequence similarity for Fusarium spp. isolates (N=38) were determined after comparison with sequences of NCBI GenBank and the value ranged between 95-100% sequence similarity well within the threshold. The pathogens were identified as F. verticillioides, F. acutatum, F. andiyazi, and F. proliferatum which belong to FFSC. The majority of the isolates were F. verticillioides.

3.6. Genetic Differentiation

Statistics for genetic differentiation between population of Fusarium spp. are shown in Table 4. Established populations correspond to F. verticillioides, F. acutatum, F. andiyazi, and F. proliferatum assemblages. The concatenation and individual sequences of a single locus were evaluated. The highest percentage of segregating sites (3/25=12%) of F. verticillioides relative to the 44 total sites was found. It was observed that there is no gene flow among F. acutatum and F. andiyazi population (π=0). Haplotype diversity for 35 sequences ranged from 0.0 to 0.66667 with total data estimates Hd=0.58992. Nucleotide diversity ranged from 0.0 to 0.00150 with total data estimates π=0.02411. There was a considerable amount of variation in both h and π estimates among population-level samples within species relative to the variance of h and π within total data sets (Table 4 ).

3.7. Population Structure

Statistics used for genetic differentiation between Fusarium spp. population are shown in Table 5. The concatenation and individual sequences by locus were evaluated. The highest value of Gst statistics, gene flow from haplotypes (1.0) when compared to the population of F. acutatum and F. andiyazi was found. Noticeably lower value of Gst for concatenated sequences was noticed when evaluating F. verticillioides and F. proliferatum (0.30761). Gst for other four comparisons were F. verticillioides vs. F. acutatum (0.57092),F. verticillioides vs F. andiyazi (0.40387),F. acutatum vs F. proliferatum (0.55720) and F. andiyazi vs. F. proliferatum (0.4470). In contrast, Kxy, the average number of nucleotide differences in pairs of Fusarium populations, were greatly increased for each pair of concatenated populations of Fusarium species. Fst indices were relatively high (Fst> 0.25) for all the cases, indicating a structure with elevated genetic differentiation between populations.
Statistics based on haplotypes-based statistics (Hs), statistics based on nucleotide sequences (Ks), and a few other variables that represent gene flow from nucleotide sequences—Wright's F (Fst), Delta ST, Gamma ST, and Nst—were used to assess genetic differences. Other observations indicated are nucleotide substitutions per site (Dxy), net nucleotide substitutions per site (Da), average number of nucleotide differences in pairs (Kxy), and gene flow from haplotypes (Gst), and net nucleotide substitutions per site between populations (Da).

3.8. Haplotype Network Analysis

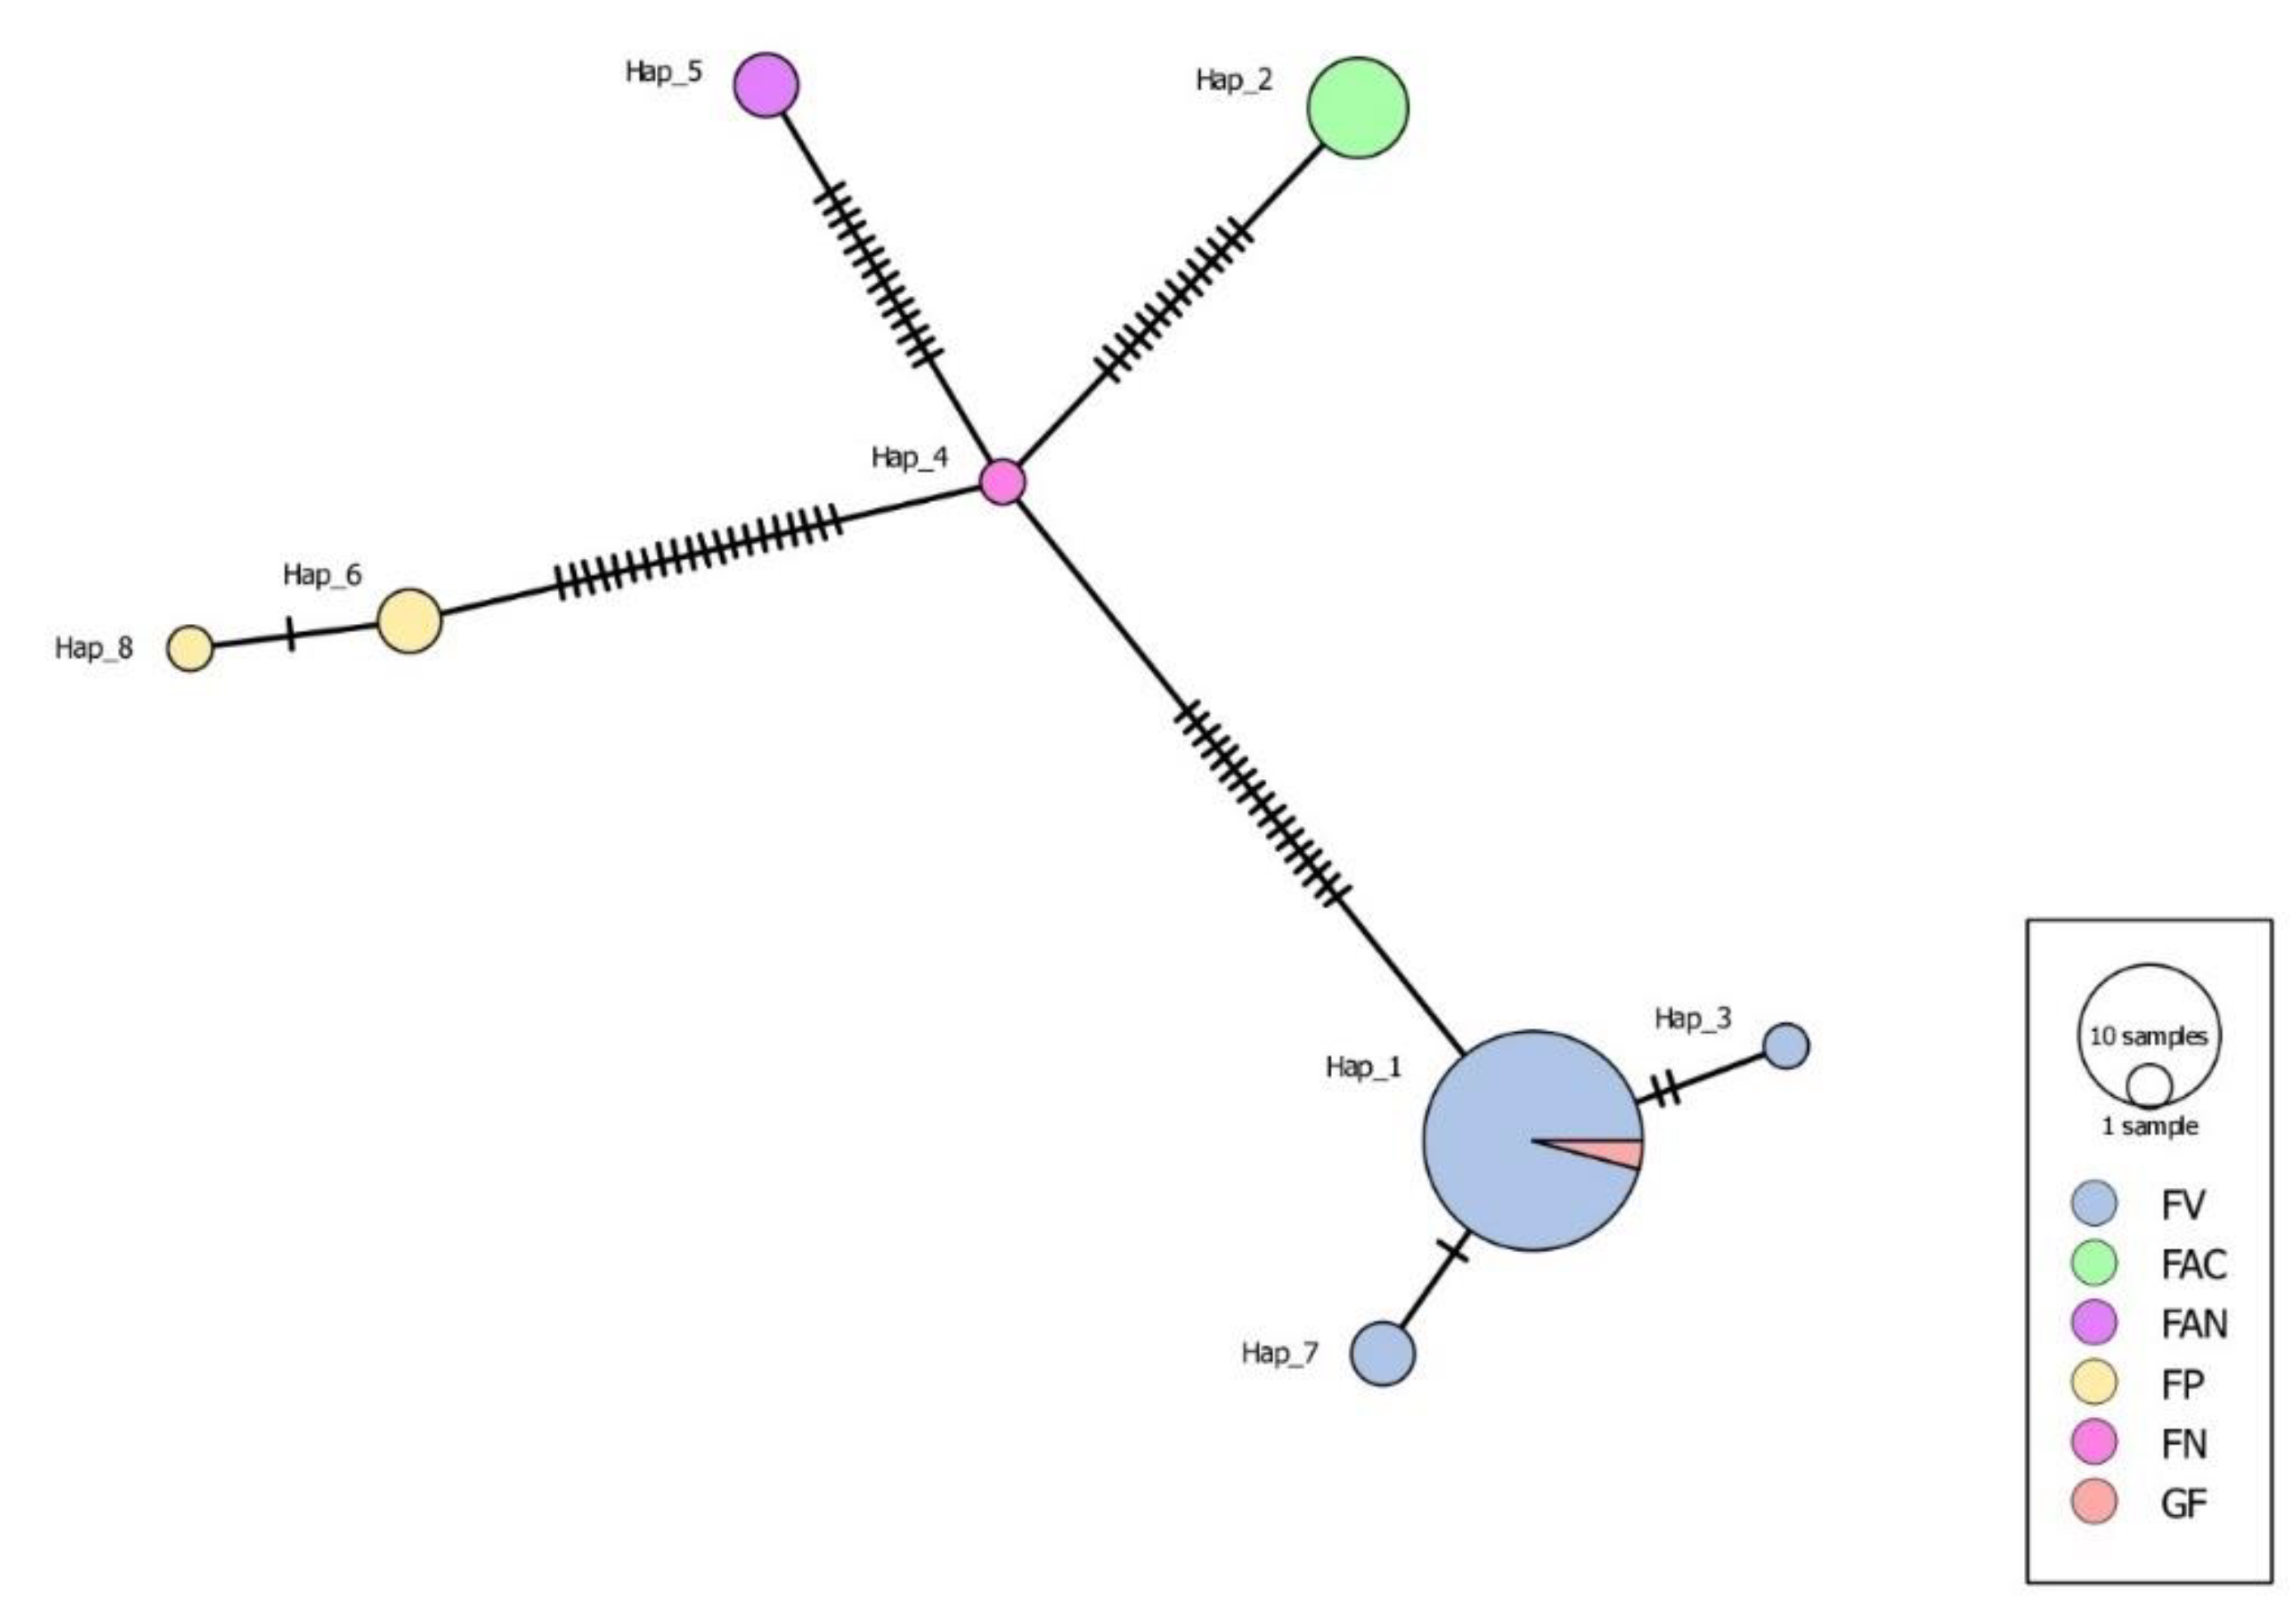
The haplotype network analysis identified a total of eight distinct haplotypes (Hap_1 through Hap_8) across the sampled Fusarium species (Figure 6). Hap_1 emerged as the most prevalent haplotype, represented by 10 samples. This suggests that Hap_1 may possess a competitive advantage or be more adapted to the environmental conditions or host varieties sampled in this study. Hap_2 through Hap_8 were less prevalent, with Hap_2 represented by only 1 sample. The haplotype network did not specify the distribution of haplotypes across the Fusarium species (e.g., F. verticillioides [FV], F. acutatum[FAC], F. andiyazi [FAN], F. proliferatum [FP], F. nygamai [FN], Gibberella fujikuroi [GF]).

4. Discussion

The analysis of the genetic relationship among geographic populations of Fusarium spp., based on allele and genotype frequencies revealed significant insights into the distribution of genetic variance and differentiation across various populations. Our findings from the AMOVA and pairwise FST values underscore the subtle yet significant influence of geographical separation on the genetic structure of Fusarium spp. populations distributed across different geographical regions.
The AMOVA results indicated that geographical separation among four local populations contributed to 7.87% of the genetic variance, whereas the vast majority (92.12%) of variance was attributable to differences within populations. This distribution of genetic variance suggests a predominant influence of local adaptation or stochastic events like genetic drift within populations, with geographical separation playing a lesser but significant role in shaping genetic diversity [44]. The statistical significance (p<0.05) of both within and among population contributions to genetic variation highlights the intricate balance between gene flow and local evolutionary pressures in maintaining genetic diversity within and across populations of Fusarium spp. Furthermore, the pairwise FST comparisons revealed statistically significant differences among all pairs of populations, with FST values ranging from 0.066 to 0.117. These values indicate a moderate level of genetic differentiation, suggest that while gene flow occurs among populations, geographical and possibly ecological barriers limit this exchange to a degree that maintains distinct genetic signatures among populations [45]. The highest genetic differentiation observed between F. proliferatum and F. acutatumpopulations underscores the potential impact of reproductive isolation or ecological specialization on genetic divergence.
The analysis of DNA polymorphism through Tef-1αsequences has provided a comprehensive insight into the genetic diversity present within isolates ofFusariumspp. from diverse geographical regions in India. The diversity within the Fusarium spp. populations, as reflected by haplotype diversity (Hd = 0.589) and nucleotide diversity (π = 0.02390) among all isolates, further supports the conclusion that these populations harbour significant genetic diversity. This diversity is crucial for the resilience and adaptability of the species, enabling populations to withstand environmental changes and selective pressures [46]. The observed haplotype diversity indicates that the Fusarium populations we studied are genetically diverse, with eight distinct haplotypes identified from a relatively small dataset of 38 sequences having wider geographical distances. This level of diversity is significant, suggesting that these populations can rapidly adapt to environmental changes and potentially overcome disease management strategies that are not based on a comprehensive understanding of the pathogen's genetic makeup. The nucleotide diversity (π) further supports this finding, indicating a high degree of variability at the genetic level, which is a critical factor for the survival and adaptation of pathogenic fungi in varying environmental conditions and host interactions. The observed genetic differentiation and diversity patterns will be essential for understanding the evolutionary dynamics and ecological adaptations of Fusarium spp., with implications for managing Fusarium related diseases in agriculture.
Our study aligns with previous research that emphasizes the role of geographical separation and ecological factors in shaping the genetic structure of fungal populations [47,48]. The significant genetic differentiation observed among Fusarium spp. populations, despite the high gene flow within populations, suggests a complex interplay between dispersal mechanisms and local adaptation processes. These findings contribute to the broader understanding of population genetics in fungi, highlighting the need for integrated approaches to manage plant diseases that consider the genetic diversity and differentiation of pathogen populations.
Comparatively, the genetic diversity indices of Fusarium spp. reported in our study are consistent with those found in other studies of fungal pathogens, which also reported significant genetic diversity within populations [48,49]. Such diversity is often attributed to the combined effects of sexual recombination, mutation, and gene flow, which contribute to the genetic reshuffling that fuels adaptability and survival in diverse and changing environments [50].
The high level of sequence similarity (95-100%) with sequences from the NCBI GenBank database underscores the reliability of our sequence data and the identification of our isolates as belonging to F. verticillioides, F. acutatum, F. andiyazi, and F. proliferatum, which are all members of the FFSC. This confirmation is crucial for the accurate assessment of the genetic diversity and structure of these pathogens. It also showed the necessity of utilizing molecular markers, such as Tef-1αsequences, for the precise identification and phylogenetic analysis of Fusarium spp., given their complex taxonomy and widespread occurrence.
Furthermore, the predominance of F. verticillioides among the isolates suggests a widespread distribution of this species in the sampled regions, possibly reflecting its ecological fitness and adaptability to various hosts and environmental conditions. The genetic differentiation data, coupled with the diversity indices, provide essential insights into the population structure and evolutionary dynamics of Fusarium spp., with significant implications for disease management strategies.
The genetic differentiation among populations of Fusarium spp., as revealed by our analysis, provides an overview of the genetic landscape across different Fusarium assemblages. The results, derived from the assessment of various statistics including Hs, Ks, Kxy, Gst, DeltaSt, GammaSt, Nst, Fst, Dxy, and Da, delineate a complex pattern of genetic relationships and differentiation among the populations corresponding to F. verticillioides, F. acutatum, F. andiyazi, and F. proliferatum. These findings are pivotal for understanding the evolutionary dynamics and potential for adaptability within and among Fusarium spp. populations.
The high levels of genetic differentiation observed between certain populations, such as F. acutatum and F. proliferatum, with Fst values reaching up to 0.98684, indicate significant genetic divergence. This divergence suggests limited gene flow between these populations, potentially due to ecological, geographical, or host-related barriers that restrict inter-population mixing. Such barriers can lead to the accumulation of genetic differences over time, fostering distinct genetic identities among populations [51]. This is further supported by the high DeltaSt and GammaSt values observed, which reflect the degree of genetic separation and structure among the populations studied. These patterns of genetic differentiation are critical for understanding the spread and adaptation of Fusarium spp. to different environments and hosts. They highlight the importance of considering both genetic and ecological factors when developing strategies to manage Fusarium diseases, as these factors can significantly influence the efficacy of disease control measures.
The significant genetic differentiation and structure identified in this study align with the findings of previous research, which has documented the importance of genetic diversity and differentiation in the adaptation and survival of fungal pathogens [48,49]. The observed patterns of genetic differentiation among Fusarium spp. populations underscore the evolutionary processes that can lead to the emergence of new pathogenic lineages or the adaptation of existing ones to new hosts or environmental conditions. This has important implications for agriculture, as it suggests that the genetic diversity of Fusarium spp. should be carefully monitored to anticipate and mitigate the impact of Fusarium diseases on crop production.
The haplotype network analysis done on Fusarium species also showed the genetic diversity and structure of these populations, revealing the presence of eight distinct haplotypes. The dominance of Hap_1, represented by ten samples, and other haplotypes (Hap_2 through Hap_8), underscores a complex interplay of genetic adaptation and diversity within these fungal species. These results offer a comprehensive framework for discussing the implications of genetic diversity in pathogen management and the evolutionary dynamics of the Fusarium genus.
The prevalence of Hap_1 suggests that certain genetic configurations may confer advantageous traits that promote survival and proliferation under specific environmental conditions or within host varieties. This phenomenon is reflective of the selective pressures that drive the evolution of pathogenic populations, emphasizing the adaptive potential of Fusarium species [52]. Such adaptations may encompass virulence factors, resistance to fungicides, or the ability to exploit diverse host plants, aligning with the observations made by [48] regarding the evolutionary potential and durable resistance in pathogen populations.
The identification of multiple, less prevalent haplotypes within the Fusarium populations points to a significant underlying genetic diversity. This diversity is crucial for the long-term survival and evolutionary success of these species, enabling them to navigate environmental changes, host resistance mechanisms, and other evolutionary pressures. The concept of a "pathogen reservoir," comprising diverse genetic variants, has been highlighted by Gladieux et al.[49] as a critical factor in the adaptability and spread of fungal diseases. The genetic variability within Fusarium species, as revealed by our haplotype network analysis, exemplifies this reservoir, offering insights into the genetic mechanisms that may underlie the adaptability and resilience of these pathogens.
The distribution of haplotypes among different Fusarium species and the related Gibberella fujikuroi complex suggests potential gene flow and genetic exchange among these closely related fungal entities. This aspect of the genetic structure within the Fusarium genus raises interesting questions about the evolutionary relationships and speciation processes within this group. Understanding the genetic basis of these relationships can provide valuable insights into the evolutionary pressures shaping these fungal populations, as well as their pathogenicity and host specificity.

5. Conclusions

The genetic diversity and structure of Fusarium spp. populations across different geographical regions reveal a complex pattern of genetic variation that is shaped by both geographical separation and local adaptation. This study provides a foundation for future research on the evolutionary biology of Fusarium spp. and underscores the importance of considering genetic diversity in the management of Fusarium diseases. Given the genetic diversity observed among the Fusarium spp. isolates, it is imperative for disease management approaches to incorporate strategies that address the genetic variability and potential for adaptation of the pathogen. Integrated disease management strategies, including crop rotation, resistant cultivars, and fungicide applications, should be designed with an understanding of the genetic landscape of the pathogen populations to enhance their efficacy and sustainability.
Furthermore, our findings highlight the utility of genetic markers and advanced statistical analyses in unravelling the complex genetic relationships among pathogen populations. Such insights are invaluable for the development of targeted and sustainable disease management strategies that can adapt to the dynamic nature of pathogen populations. In summary, the genetic differentiations among Fusarium spp. populations revealed in this study contribute to a deeper understanding of the genetic structure and evolutionary dynamics of these pathogens. This knowledge is crucial for managing the Fusarium stalk rot of maize and for further research into the genetic mechanisms underlying the adaptability and pathogenicity of Fusarium spp.

Supplementary Materials

The following supplementary information can be downloaded at: www.mdpi.com/xxx/s1, Table S1: Accession numbers of Fusarium spp. strains deposited in NCBI GenBank; Table S2: Gene flow estimates

Author Contributions

P.P-J., R. -B., and P.S.-T conceived and designed the experiments. P.P-J., R. -B., H.-J. conducted main experiments. P.P-J., R. -B., P.-V, P.S.-T and A.K.-R. performed the analysis and wrote the draft of the manuscript. B.K.-B, and D. K.-L. writing—review and editing. M.-N. provided scientific inputs and culture. All authors have read and agreed to the published version of the manuscript.

Funding

This research was supported by Department of Science and Technology-Science and Engineering Research Board (DST-SERB). Grant Number: EEQ/2019/000181.

Data availability statement

Data are contained within the article and Supplementary Materials.

Acknowledgments

Authors are thankful to Rani Lakshmi Bai Central Agricultural University for providing facilities to conduct research work.

Conflicts of Interest

The authors declare no conflicts of interest.

References

  1. Munkvold, G.P.; Desjardins, A.E. Fumonisins in maize: can we reduce their occurrence? Plant Dis.1997, 81, 556–565. [CrossRef]
  2. Román, S.G. Caracterización de Genotipos de Maíz (Zea Mays L.) a La Infección de Fusarium verticillioides En DiferentesFases Del Ciclo de Vida de La Planta y Su Correlación Con Marcadores Moleculares de Tipo SNPs. 2017.
  3. Navale, V.D.; Sawant, A.M.; Vamkudoth, K.R. Genetic diversity of toxigenic Fusarium verticillioides associated with maize grains, India. Genet. Mol. Biol.2023, 46, e20220073. [CrossRef]
  4. Görtz, A.; Oerke, E.-C.; Steiner, U.; Waalwijk, C.; Vries, I.; Dehne, H.-W. Biodiversity of Fusarium species causing ear rot of maize in Germany. Cereal Res. Commun.2008, 36, 617–622. [CrossRef]
  5. Gai, X.; Dong, H.; Wang, S.; Liu, B.; Zhang, Z.; Li, X.; Gao, Z. Infection cycle of maize stalk rot and ear rot caused byFusarium verticillioides. PloS One. 2018, 13, e0201588. [CrossRef]
  6. Harish, J.; Jambhulkar, P.P.; Bajpai, R.; Arya, M.; Babele, P.K.; Chaturvedi, S.K.; Kumar, A.; Lakshman, D.K. Morphological characterization, pathogenicity screening, and molecular identification of Fusarium Spp. isolates causing post-flowering stalk rot in maize.Front. Microbiol.2023, 14, 1121781. [CrossRef]
  7. Kazan, K.; Gardiner, D.M.; Manners, J.M. On the Trail of a Cereal Killer: Recent advances in Fusariumgraminearumpathogenomics and host resistance. Mol. Plant Pathol.2012, 13, 399–413. [CrossRef]
  8. Saravanakumar, K.; Li, Y.; Yu, C.; Wang, Q.; Wang, M.; Sun, J.; Gao, J.; Chen, J. Effect of Trichoderma harzianum on maize rhizosphere microbiome and biocontrol of Fusariumstalk rot.Sci. Rep.2017, 7, 1771. [CrossRef]
  9. Douriet-Angulo, A.; López-Orona, C.A.; López-Urquídez, G.A.; Vega-Gutiérrez, T.A.; Tirado-Ramírez, M.A.; Estrada-Acosta, M.D.; Ayala-Tafoya, F.; Yáñez-Juárez, M.G. Maize Stalk Rot Caused by Fusarium Falciforme (FSSC 3 + 4) in Mexico. Plant Dis.2019, 103, 2951. [CrossRef]
  10. Shin, J.-H.; Han, J.-H.; Lee, J.K.; Kim, K.S. Characterization of the maize stalk rot pathogens Fusarium subglutinans and F. temperatum and the effect of fungicides on their mycelial growth and colony formation. Plant Pathol. J.2014, 30, 397. [CrossRef]
  11. Leyva-Madrigal, K.Y.; Larralde-Corona, C.P.; Apodaca-Sánchez, M.A.; Quiroz-Figueroa, F.R.; Mexia-Bolaños, P.A.; Portillo-Valenzuela, S.; Ordaz-Ochoa, J.; Maldonado-Mendoza, I.E. Fusarium species from the Fusariumfujikuroi species complex involved in mixed infections of maize in northern Sinaloa, Mexico. J. Phytopathol.2015, 163, 486–497. [CrossRef]
  12. Aguín, O.; Cao, A.; Pintos, C.; Santiago, R.; Mansilla, P.; Butrón, A. Occurrence of Fusarium species in maize kernels grown in northwesterns plain. Plant Pathol.2014, 63, 946–951. [CrossRef]
  13. Stumpf, R.; Santos, J. dos; Gomes, L.B.; Silva, C.N.; Tessmann, D.J.; Ferreira, F.D.; Machinski Junior, M.; Del Ponte, E.M. Fusarium species and fumonisins associated with maize kernels produced in Rio Grande Do Sul State for the 2008/09 and 2009/10 Growing Seasons. Braz. J. Microbiol.2013, 44, 89–95. [CrossRef]
  14. Mueller, D.S.; Wise, K.A.; Sisson, A.J.; Allen, T.W.; Bergstrom, G.C.; Bosley, D.B.; Bradley, C.A.; Broders, K.D.; Byamukama, E.; Chilvers, M.I.; et al. Corn yield loss estimates due to diseases in the United States and Ontario, Canada from 2012 to 2015. Plant Health Prog.2016, 17, 211–222. [CrossRef]
  15. Ortiz, C.S.; Richards, C.; Terry, A.; Parra, J.; Shim, W.-B. Genetic variability and geographical distribution of mycotoxigenicFusariumverticillioides strains isolated from maize fields in Texas. Plant Pathol. J.2015, 31, 203. [CrossRef]
  16. Sandoval-Denis, M.; Swart, W.J.; Crous, P.W. New Fusarium Species from the Kruger National Park, South Africa. MycoKeys2018, 63.
  17. Al-Hatmi, A.; De Hoog, G.S.; Meis, J.F. Multiresistant Fusarium pathogens on plants and humans: solutions in (from) the antifungal pipeline? Infect. Drug Resist.2019, 12, 3727–3737. [CrossRef]
  18. Wollenweber, H.W.; Sherbakoff, C.D.; Reinking, O.A.; Johann, H.; Bailey, A.A. Fundamentals for taxonomic studies of Fusarium. J. Agric. Res.1925.30, 833–843.
  19. O’Donnell, K.; Cigelnik, E.; Nirenberg, H.I. Molecular systematics and phylogeography of the Gibberella Fujikuroi Species Complex. Mycologia1998, 90, 465–493. [CrossRef]
  20. Geiser, D.M.; Lewis Ivey, M.L.; Hakiza, G.; Juba, J.H.; Miller, S.A. Gibberella Xylarioides (Anamorph: Fusariumxylarioides), a causative agent of coffee wilt disease in Africa, Is a previously unrecognized member of the G.fujikuroi species complex. Mycologia2005, 97, 191–201. [CrossRef]
  21. O’Donnell, K.; McCormick, S.P.; Busman, M.; Proctor, R.H.; Ward, T.J.; Doehring, G.; Geiser, D.M.; Alberts, J.F.; Rheeder, J.P. Marasas et al. 1984 “Toxigenic Fusarium species: identity and mycotoxicology” revisited. Mycologia2018, 110, 1058–1080. [CrossRef]
  22. Sandoval-Denis, M.; Guarnaccia, V.; Polizzi, G.; Crous, P.W. Symptomatic citrus trees reveal a new pathogenic lineage in Fusarium and two new neocosmospora species. Persoonia-Mol. Phylogeny Evol. Fungi2018, 40, 1–25.. [CrossRef]
  23. Yilmaz, N.; Sandoval-Denis, M.; Lombard, L.; Visagie, C.M.; Wingfield, B.D.; Crous, P.W. Redefining species limits in the Fusariumfujikuroi species complex. Persoonia-Mol. Phylogeny Evol. Fungi2021, 46, 129–162. [CrossRef]
  24. Jambhulkar, P.P.; Raja, M.; Singh, B.; Katoch, S.; Kumar, S.; Sharma, P. Potential native Trichodermastrains against Fusariumverticillioides causing post flowering stalk rot in winter maize. Crop Prot.2022, 152, 105838.
  25. Munkvold, G.P. Epidemiology of Fusarium diseases and their mycotoxins in maize ears. Eur. J. Plant Pathol.2003, 109, 705–713. [CrossRef]
  26. Zhang, J.; Abdelraheem, A.; Zhu, Y.; Elkins-Arce, H.; Dever, J.; Whitelock, D.; Hake, K.; Wedegaertner, T.; Wheeler, T.A. Studies of evaluation methods for resistance to Fusarium wilt race 4 (Fusariumoxysporumf. Sp.vasinfectum) in cotton: effects of cultivar, planting date, and inoculum density on disease progression. Front. Plant Sci.2022, 13, 900131. [CrossRef]
  27. Figueroa-Rivera, M.G.; Rodríguez-Guerra, R.; Guerrero-Aguilar, B.Z.; González-Chavira, M.M.; Pons-Hernández, J.L.; Jiménez-Bremont, J.F.; Ramírez-Pimentel, J.G.; Andrio-Enríquez, E.; Mendoza-Elos, M. caracterización de Especies de Fusariumasociadas a la pudrición de raíz de maíz en Guanajuato, México. Rev. Mex. Fitopatol.2010, 28, 124–134.
  28. Ha, M.S.; Ryu, H.; Ju, H.J.; Choi, H.-W. Diversity and pathogenic characteristics of the Fusarium species isolated from minor legumes in Korea. Sci. Rep.2023, 13, 22516. [CrossRef]
  29. O’Donnell, K.; Kistler, H.C.; Tacke, B.K.; Casper, H.H. Gene genealogies reveal global phylogeographic structure and reproductive isolation among lineages of Fusarium graminearum , the fungus causing wheat scab. Proc. Natl. Acad. Sci.2000, 97, 7905–7910. [CrossRef]
  30. O’Donnell, K.; Ward, T.J.; Robert, V.A.R.G.; Crous, P.W.; Geiser, D.M.; Kang, S. DNA sequence-based identification of Fusarium: current status and future directions. Phytoparasitica2015, 43, 583–595. [CrossRef]
  31. O’Donnell, K.; Sutton, D.A.; Rinaldi, M.G.; Sarver, B.A.J.; Balajee, S.A.; Schroers, H.-J.; Summerbell, R.C.; Robert, V.A.R.G.; Crous, P.W.; Zhang, N.; et al. Internet-accessible DNA sequence database for identifying fusaria from human and animal infections. J. Clin. Microbiol.2010, 48, 3708–3718. [CrossRef]
  32. Ramdial, H.; Latchoo, R.K.; Hosein, F.N.; Rampersad, S.N. Phylogeny and haplotype analysis of fungi within the Fusariumincarnatum-equiseti species complex. Phytopathology 2017, 107, 109–120. [CrossRef]
  33. Ploetz, R.C. Fusarium-induced diseases of tropical, perennial crops. Phytopathology2006, 96, 648–652. [CrossRef]
  34. Dobbs, J.T.; Kim, M.; Dudley, N.S.; Jones, T.C.; Yeh, A.; Dumroese, R.K.; Cannon, P.G.; Hauff, R.D.; Klopfenstein, N.B.; Wright, S.; et al. Fusarium spp. diversity associated with symptomatic Acacia Koa in Hawaiʽi. For. Pathol.2021, 51, e12713. [CrossRef]
  35. Leslie, J.F.; Summerell, B.A. Fusarium laboratory workshops—A recent history. Mycotoxin Res.2006, 22, 73–74. [CrossRef]
  36. Liddell, C.M.; Burgess, L.W. Survival of Fusariummoniliformeat controlled temperature and relative humidity. Trans. Br. Mycol. Soc.1985, 84, 121–130.
  37. Li, B.; Du, J.; Lan, C.; Liu, P.; Weng, Q.; Chen, Q. Development of a loop-mediated isothermal amplification assay for rapid and sensitive detection of Fusariumoxysporumf. sp.cubenseRace 4. Eur. J. Plant Pathol.2013, 135, 903–911. [CrossRef]
  38. O’Donnell, K.; Kistler, H.C.; Cigelnik, E.; Ploetz, R.C. Multiple evolutionary origins of the fungus causing panama disease of banana: concordant evidence from nuclear and mitochondrial gene genealogies.Proc. Natl. Acad. Sci.1998, 95, 2044–2049. [CrossRef]
  39. Hall, T. BioEdit v7. 0.9: Biological sequence alignment editor for win95/98/2K/XP/7 2012.
  40. Kumar, S.; Stecher, G.; Li, M.; Knyaz, C.; Tamura, K. MEGA X: Molecular evolutionary genetics analysis across computing platforms.Mol. Biol. Evol.2018, 35, 1547. [CrossRef]
  41. Librado, P.; Rozas, J. DnaSP v5: A software for comprehensive analysis of DNA polymorphism data.Bioinformatics2009, 25, 1451–1452. [CrossRef]
  42. Hudson, R.R.; Slatkin, M.; Maddison, W.P. Estimation of levels of gene flow from DNA sequence data. Genetics1992, 132, 583–589. [CrossRef]
  43. Muhire, B.M.; Varsani, A.; Martin, D.P. SDT: A virus classification tool based on pairwise sequence alignment and identity calculation. PloS One2014, 9, e108277. [CrossRef]
  44. Schoville, S.D.; Bonin, A.; François, O.; Lobreaux, S.; Melodelima, C.; Manel, S. Adaptive genetic variation on the landscape: methods and cases. Annu. Rev. Ecol. Evol. Syst.2012, 43, 23–43. [CrossRef]
  45. Ravinet, M.; Faria, R.; Butlin, R.K.; Galindo, J.; Bierne, N.; Rafajlović, M.; Noor, M.A.F.; Mehlig, B.; Westram, A.M. Interpreting the genomic landscape of speciation: A road map for finding barriers to gene flow. J. Evol. Biol.2017, 30, 1450–1477. [CrossRef]
  46. Sgrò, C.M.; Lowe, A.J.; Hoffmann, A.A. Building evolutionary resilience for conserving biodiversity under climate change. Evol. Appl.2011, 4, 326–337. [CrossRef]
  47. Milgroom, M.G. Recombination and the multilocus structure of fungal populations. Annu. Rev. Phytopathol.1996, 34, 457–477. [CrossRef]
  48. McDonald, B.A.; Linde, C. Pathogen population genetics, evolutionary potential and durable resistance. Annu. Rev. Phytopathol.2002, 40, 349–379. [CrossRef]
  49. Gladieux, P.; Ropars, J.; Badouin, H.; Branca, A.; Aguileta, G.; De Vienne, D.M.; Rodríguez De La Vega, R.C.; Branco, S.; Giraud, T. Fungal evolutionary genomics provides insight into the mechanisms of adaptive divergence in eukaryotes.Mol. Ecol.2014, 23, 753–773. [CrossRef]
  50. Giraud, M.; Vandiedonck, C.; Garchon, H. Genetic factors in autoimmune myasthenia gravis.Ann. N. Y. Acad. Sci.2008, 1132, 180–192. [CrossRef]
  51. Loxdale, H.D.; Lushai, G. Population genetic issues: the unfolding story using molecular markers. In Aphids as crop pests; Emden, H.F.V., Harrington, R., Eds.; CABI: UK, 2007; pp. 31–67 ISBN 978-1-84593-202-2.
  52. Kelly, A.C.; Ward, T.J. Population Genomics of Fusariumgraminearum reveals signatures of divergent evolution within a major cereal pathogen. PloS One2018, 13, e0194616. [CrossRef]
  53. Bacon, C.W.; Yates, I.E. Endophytic root colonization by Fusarium species: histology, plant interactions, and toxicity. InMicrobial root endophytes2006, 9, 133-152. In: Soil Biology, Microbial root endophytes B. Schulz, C. Boyle, T. N. Sieber (Eds.) © Springer-Verlag Berlin Heidelberg.
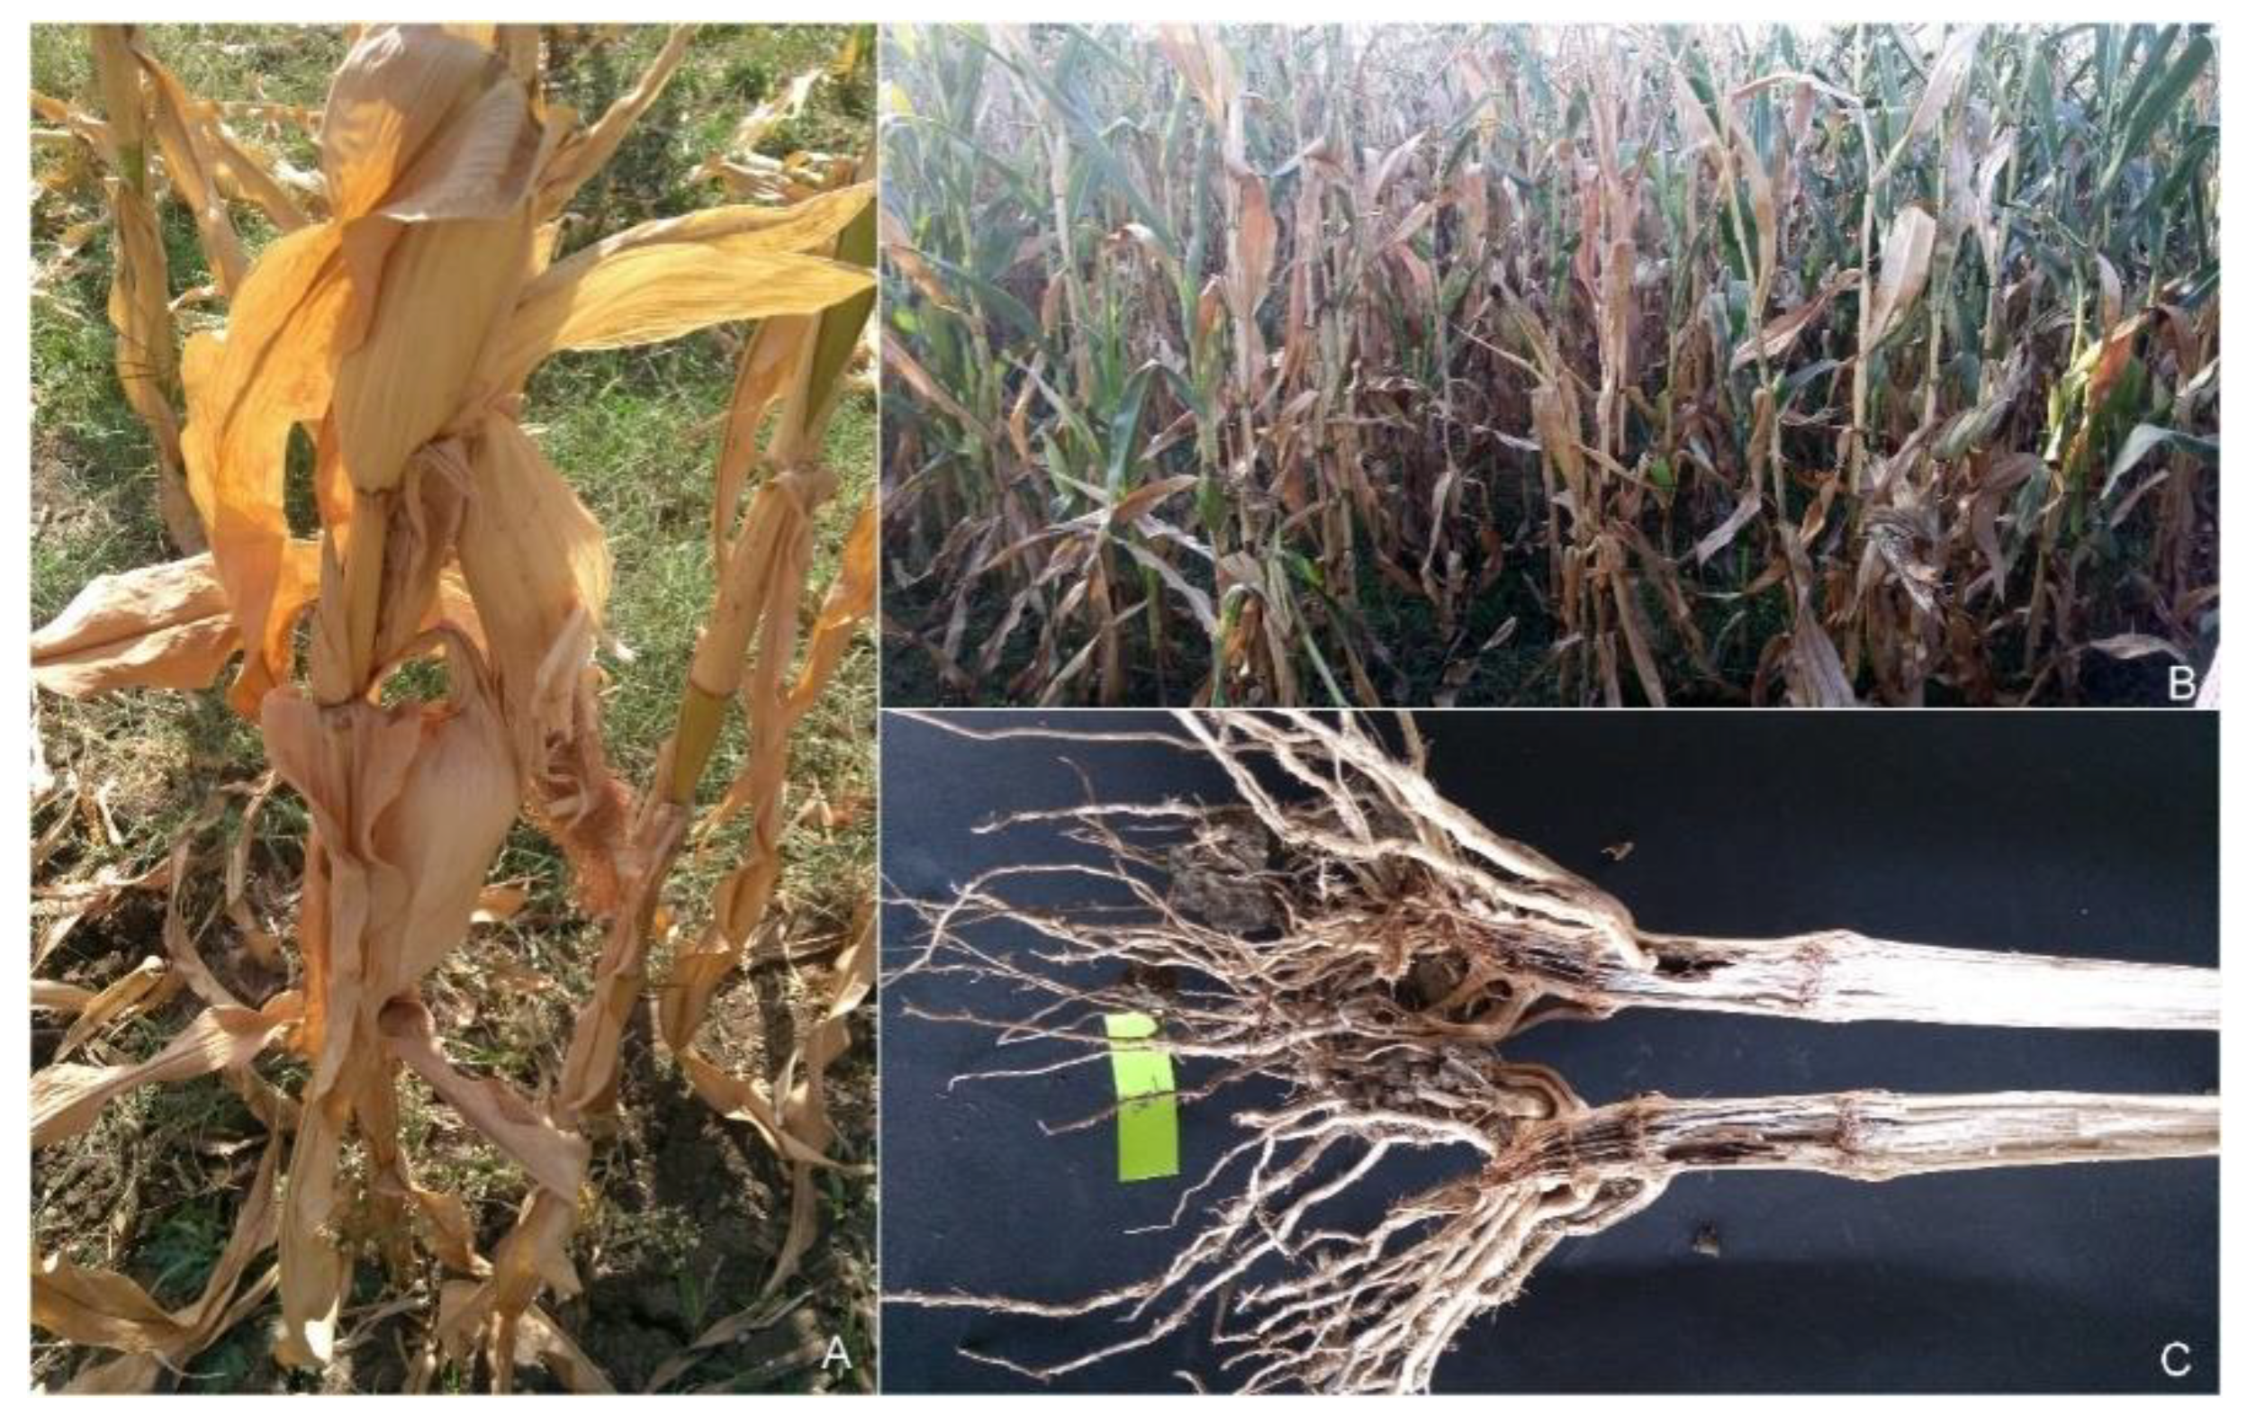
Figure 1. Disease symptoms; A: Drooping, wilting, and drying of leaves, empty cob development, and an increase in the angle between stalks and cobs in the field; B: Severely affected field with Fusarium Stalk Rot; C: Vascular discoloration of the infected stem.
Preprints 105777 g001
Figure 2. Geographical distribution of 38 strains isolated from maize growing states of India having FSR incidence. This figure was generated using the Landmap program (https://www.ldmap.net/index.html) with inputs of geographic co-ordinates of 38 sites.
Preprints 105777 g002
Figure 3. Isolation frequencies of number of isolates collected from different states of India.
Preprints 105777 g003
Figure 4. Phylogenetic tree constructed by Tef-1α gene sequence using the neighbor-joining (NJ) tree method. Round-colored circles represent the isolates collected from Rajasthan, Gujarat, Karnataka, and Telangana, and diamond-shaped boxes represent the isolates' virulency behaviours.
Preprints 105777 g004
Figure 5. Sequence identity heatmap showing the pairwise percentage identity between all 38 sequences. The X and Y axes indicate the 38 different Fusarium species. Identity scores are shown as a color-coded matrix, calculated by comparing every sequence to each other (every sequence vs every sequence). Sequence identity increases from blue to red.
Preprints 105777 g005
Figure 6. A haplotype network derived from concatenated sequencing data of the Tef 1-α gene was constructed for 38 Fusarium spp. isolates collected from the pith of the infected stem of maize plants. All haplotypes were interconnected with identified single nucleotide polymorphisms. Each haplotype (denoted as Hap) was analysed by inter-island composition to identify possible spread. Fusarium verticillioides had the most haplotypes that indicate possible spread, likely because FSR was a target for the survey with multiple symptomatic maize plants.
Preprints 105777 g006
Table 1. AMOVA results for polymorphic loci (average over 537 loci) of the total Fusarium spp. isolates.
Data type Sample category Source of variation df SS Variance comp % Variation Fixation indices
Original data Geographic Among population 3 1249.56 15.84 7.87**
Within population 82 15186.8 185.21 92.12** FST=0.07878
Total 85 16436.35 201.05 100
Df: degree of freedom; SS: Sum of square; **percentage of total variance, p value=0.005.
Table 2. Genetic differentiation (FST) between pairs of geographic populations of Fusarium spp. isolates causing Fusarium stalk rot in maize in India. The analysis is based on a total of 38 strains.
Fusarium spp. F. acutatum F. andiyazi F. proliferatum F.verticillioides
F. acutatum NA 0.001 0.001 0.001
F. andiyazi 0.10533 NA 0.001 0.001
F. proliferatum 0.11682 0.11073 NA 0.001
F. verticillioides 0.06617 0.07984 0.07529 NA
For analysis of molecular variance, number of permutations=1000; For population pairwise FST values number of permutations for significance =100 and No. of permutations for Mantal test =1000, NA=Not applicable.
Table 3. DNA polymorphism statistics derived from multiple sequence alignment of Tef-1αlocus analyzed.
DNA polymorphism parameter Tef 1-α
Number of sequences 38
Selected region analysed 1-866
Number of polymorphic sites, S 47
Number of mutations, Eta 52
Number of haplotypes, h 8
Haplotype diversity, Hd 0.589
Nucleotide diversity, π 0.02390
ϴ (S) 0.02525
ϴ (π) 0.02469
Number of nucleotide differences, k 10.587
Table 4. Coefficient of genetic differentiation among Fusarium spp. Population.
Population Number of sequences Number of segregating sites (S) Number of haplotypes (h) Haplotype diversity (Hd) Average number of differences (K) Nucleotide diversity (π)
F. verticillioides 25 3 3 0.22667 0.31333 0.00071
F. acutatum 5 0 1 0 0 0
F. andiyazi 2 0 1 0 0 0
F. proliferatum 3 1 2 0.66667 0.66667 0.00150
Total data estimates 35 44 7 0.58992 10.70420 0.02411
Table 5. Genetic differentiation among populations with concatenated sequences of Fusarium species.
POPULATION 1 POPULATION 2 Hs Ks Kxy Gst DeltaSt GammaSt Nst Fst Dxy Da
F. verticillioides F. acutatum 0.20051 0.26111 20.16000 0.57092 0.01252 0.95685 0.99245 0.99223 0.04541 0.04505
F. verticillioides F. andiyazi 0.22667 0.29012 20.16000 0.40387 0.00618 0.90788 0.99245 0.99223 0.04541 0.04505
F. verticillioides F. proliferatum 0.24500 0.35119 27.48000 0.30761 0.01168 0.94254 0.98288 0.98217 0.06189 0.06079
F. acutatum F. andiyazi 0.00000 0.00000 17.00000 1.00000 0.01563 1.00000 1.00000 1.00000 0.03829 0.03829
F. acutatum F. proliferatum 0.16667 0.25000 25.33333 0.55720 0.02651 0.98604 0.98733 0.98684 0.05706 0.05631
F. andiyazi F. proliferatum 0.66667 0.40000 22.33333 0.44700 0.02390 0.97549 0.98556 0.98507 0.05030 0.04955
Disclaimer/Publisher’s Note: The statements, opinions and data contained in all publications are solely those of the individual author(s) and contributor(s) and not of MDPI and/or the editor(s). MDPI and/or the editor(s) disclaim responsibility for any injury to people or property resulting from any ideas, methods, instructions or products referred to in the content.
Copyright: This open access article is published under a Creative Commons CC BY 4.0 license, which permit the free download, distribution, and reuse, provided that the author and preprint are cited in any reuse.
Prerpints.org logo

Preprints.org is a free preprint server supported by MDPI in Basel, Switzerland.

Subscribe

© 2024 MDPI (Basel, Switzerland) unless otherwise stated