Preprint
Article

Characterization of Aerosols Elementary Composition Emitted by Fires in the North of the Pantanal

Altmetrics

Downloads

156

Views

67

Comments

0

Submitted:

08 July 2024

Posted:

09 July 2024

You are already at the latest version

Alerts
Abstract
The Brazilian Pantanal region suffers intensely from biomass burning during the dry season. Large quantities of gases and particles are emitted into the atmosphere during this period, with serious implications for fauna and flora. Understanding the dynamics of these emissions is es-sential for mitigating the ecosystem, its functioning, and possible anthropogenic disturbances. In this sense, this study analyzed emissions over the north of the Brazilian Pantanal during the 2022 drought. Measurements of concentration of fine particulate matter (PM2.5), Black carbon (BC), and elemental concentration (25 chemical elements) were determined by gravimetry, reflectance analysis, and X-ray fluorescence, respectively, for samples collected between August and Octo-ber 2022. The average concentrations of PM2.5 and BC had their values increased by approxi-mately 4 and 2.5 times, respectively, when compared to the averages from a decade ago. The maximum concentrations found are close to values typical of the southern Amazon region, a re-gion with high rates of deforestation and changes in land use. The elemental analysis showed large changes in concentrations, mainly associated with biomass burning emission (BB) and soil resuspension. Furthermore, analyses of lead (Pb) concentrations showed strong anthropization at the study site.
Keywords: 
Subject: Environmental and Earth Sciences  -   Atmospheric Science and Meteorology

1. Introduction

Atmospheric aerosols, solid or liquid particles suspended in the atmosphere, have diverse size distributions that can vary from 0.001-100 micrometers. These particles are important components of the climate system and due to their high spatial and temporal heterogeneity, contribute to the greatest source of uncertainty in the Earth's radiative balance [1,2]. These uncertainties are consequences of the poor understanding of the physical and chemical characteristics of aerosols [3,4]. Which can impact the climate both directly through the processes of scattering and absorption of solar radiation [5,6] and indirectly by altering the properties of clouds and consequently the efficiency of the precipitation [7,8].
Some specific aerosols have large absorptive capacities, such as substances made up of carbon and mineral dust. Soot carbon particles, known as black carbon (BC), are almost purely composed of carbon and contribute to the absorption of solar radiation [9]. Biomass burning (BB) aerosols, and particularly BC, absorb and scatter radiation, affecting atmospheric stability [6]. BC emissions are the result of a variety of combustion processes, including biomass burning [7]. The aging process changes the lifespan and removal rate of BC, which makes it difficult to understand the real role of this constituent on the climate [7]. In general, aerosols cool the climate system and, consequently, cause an effect opposite to greenhouse gases, however, BC has a direct radiative forcing, making it the second most responsible for global warming after CO2 [1].
In addition to the effects on the climate, emissions of particulate matter, associated with climate change, have directly impacted the health of the population in several regions of the planet [10]. Specifically in Brazil, it was found that BB emissions considerably worsen hospital records for respiratory diseases [11]. Still in Brazil, local studies found the influence of BB emissions on records of hospitalization of children due to respiratory diseases [12] and the association between meteorological conditions and aerosols on the growth of viral transmission and the risk of mortality from respiratory diseases [13,14].
In Brazil, several studies have characterized the physical and chemical properties of aerosols in the Amazon [5,15,16,17,18,19], works that focus their analyzes on the central Amazon. However, studies are still scarce in the south of the Amazon basin [20]. This region is home to the Pantanal Biome, with peculiar characteristics due to flooding regimes, rich in biodiversity, and providing special conditions for monitoring the physical and chemical properties of aerosols. The Pantanal is an excellent laboratory for monitoring aerosols, as during the rainy season it can be representative of a practically clean atmosphere, under natural conditions. During the dry period, as in other areas of South America and Brazil, it is strongly influenced by emissions from biomass burning [21,22].
The Pantanal is the largest contiguous wetland in the world [23]. Recent land-atmosphere feedback contributed greatly to the unprecedented forest fires recorded in the region, with approximately half of the area burned in 2020. This fire season was responsible for more than 3.9 million hectares burned with diverse impacts on the ecosystem, the hydrological cycle, and the economy [24,25,26]. The occurrence of the 2020 burning motivated this study, which aims to carry out a specific chemical characterization of BB emissions in the Pantanal, now using the 2022 drought as a reference. The chemical results were also complemented with surface remote sensing analyses from AERONET.

2. Material and Methods

2.1. Study site and sampling

Atmospheric aerosol samples were collected at the Pantanal Advanced Research Base (BAPP). The research site is in the SESC Private Natural Heritage Reserve (PNHR SESC), 160 km south of the capital Cuiabá, in the SESC Pantanal Park – Baía das Pedras (16º29'56''S, 56º24'47'' W) in the city of Poconé (Figure 1a). The Pantanal of Mato Grosso is located to the north of the biome, the climate is classified as Humid Tropical with rainy summers and dry winters, and Aw in the Köppen-Geiger classification [27]. Climatological factors make the Pantanal a rare ecosystem, such as the flat relief and seasonal rainfall dynamics, which contribute to flooding part of the biome [20]. Considering only the cities of the Pantanal of Mato Grosso, the average annual precipitation is approximately 1360 mm [28]. Fine particulate (PM2.5) samples used 47 mm Teflon membrane filters with the Partisol Model 2025i Sequential Air Sampler (Thermo Scientific, Waltham, MA, USA), operating at a flow temperature of 17 L.min −1 [29]. The sampling system is shown in Figure 1b. Furthermore, the system was automated, turning off for flow rates below 16 L.min −1. Each filter was sampled for seven days or until the system was automatically turned off. The collection campaign took place between August 25, 2022, and October 14, 2022 (2 months) with the definition of 7 analysis periods: P1 = 08/25 to 09/01, P2 = 09/02 to 09/08, P3 = 09/09 to 09/15, P4 = 09/16 to 09/22, P5 = 09/23 to 09/30, P6 = 01/10 to 07/10 and P7 = 08/10 to 14/10. The period chosen for the sampling campaign, August to October, covers the critical period of emissions for biomass burning in the study area [21,22].
The samples were analyzed to determine the mass concentration of particulate matter in the atmosphere by gravimetric measurement. The procedure consists of determining the filter mass before and after sampling using an electronic microanalytical balance of nominal precision 1µg in a controlled environment with a temperature of 20 °C and relative humidity of 50% [15,30]. The determination of BC concentration was carried out by optical reflectance analysis. The instrument (Reflectometer, model M43D), which uses diffuse white light and a detector with a peak efficiency of around 550 nm, was calibrated with standard BC samples. The reflectometer uses equation 1 to return the equivalent BC concentration, in this study only referred to BC concentration.
BC = [(88.3 – (77.5 * log R)) + (16.7 ∗ (log R)2)] ∗ A/V
Where R is the measured reflection, A is the filter area (in this case, 13.85 cm2), V is the volume of air in m3, and BC concentration is given in μg m-3.
Elemental analysis was performed using EDXRF with a spectrometer (EDX 700HS). The sample was irradiated from below with X-rays. Fluorescence radiation is proportional to the element’s quantity, so detecting each element’s energy condition allows for qualitative and quantitative analyses. Teflon filters were submitted to EDXRF, and spectra were accumulated for 900 s under the following conditions: Al filter, vacuum as X-ray path, 10 mm diameter collimator, 10–20 keV energy range, 50 kV tube voltage, an Rh X-ray tube, and a Si (Li) detector [29]. The analysis determined the concentration of 25 chemical elements (Na, Mg, Al, Si, P, S, Cl, K, Ca, Ti, V, Cr, Mn, Fe, Ni, Cu, Zn, As, Se, Br, Rb, Sr, Cd, Sb e Pb) in the samples. The elementary analysis made it possible to calculate the mass concentration of the dust, according to Equation (2) [31].
Dust = 1.16*(1.90Al+2.15Si+1.41Ca+1.67Ti+2.09Fe)

2.2. Complementary measures and methods

To complement the discussions, this work used records of fire outbreaks (FO) and the sum of fire radiative power (FRP) from the National Institute for Space Research, INPE over the Pantanal (available at: https://queimadas.dgi.inpe.br/queimadas/bdqueimadas). Meteorological data from the BAPP monitoring tower were used for measurements of air temperature (Ta), relative humidity (RH), accumulated rain (AR), radiation net (Rn), and wind direction and intensity were used [32]. Measurements from the CUIABA-MIRANDA station of the AERONET network [33], were also used to obtain the optical depth for the fine, coarse, and total fractions of the aerosol, Version 3: SDA Retrieval Level 2.0 data [22]. The Spearman correlation was used to evaluate the relationships between PM2.5 and BC concentrations with meteorological parameters and AOD values with a significance level of 95% (p-val < 0.05).
To quantify the anthropogenic influence on elemental concentrations, we adopted the Enrichment factor (Ef) method, which quantifies the contribution of each element to a crustal condition [34,35,36], in the case of our study for background condition. The enrichment factor (Ef) was calculated with Equation (3).
Ef = (X/Al)aerosol / (X/Al)background
Where (X/Al) aerosol and (X/Al) background refer to the ratio between the concentration of X for Al in the atmosphere and X for Al in the average background mass, respectively. Al is typically used as a reference because it represents more than 8 percent of the average crustal material [34,35,36].
The average elemental composition for the central Amazon of Arana and Artaxo [15] was used as the background elemental composition. Elements with Ef close to 1.0 have a strong natural component while elements with high enrichment factors tend to be of artificial origin [37,38]. These reference concentrations are justified by the prismatic conditions of elemental concentration in the central Amazon during the rainy season, conditions of an atmosphere as clean as in non-anthropized areas [15].

3. Results and discussion

3.1. Variations in PM2.5 and BC concentrations

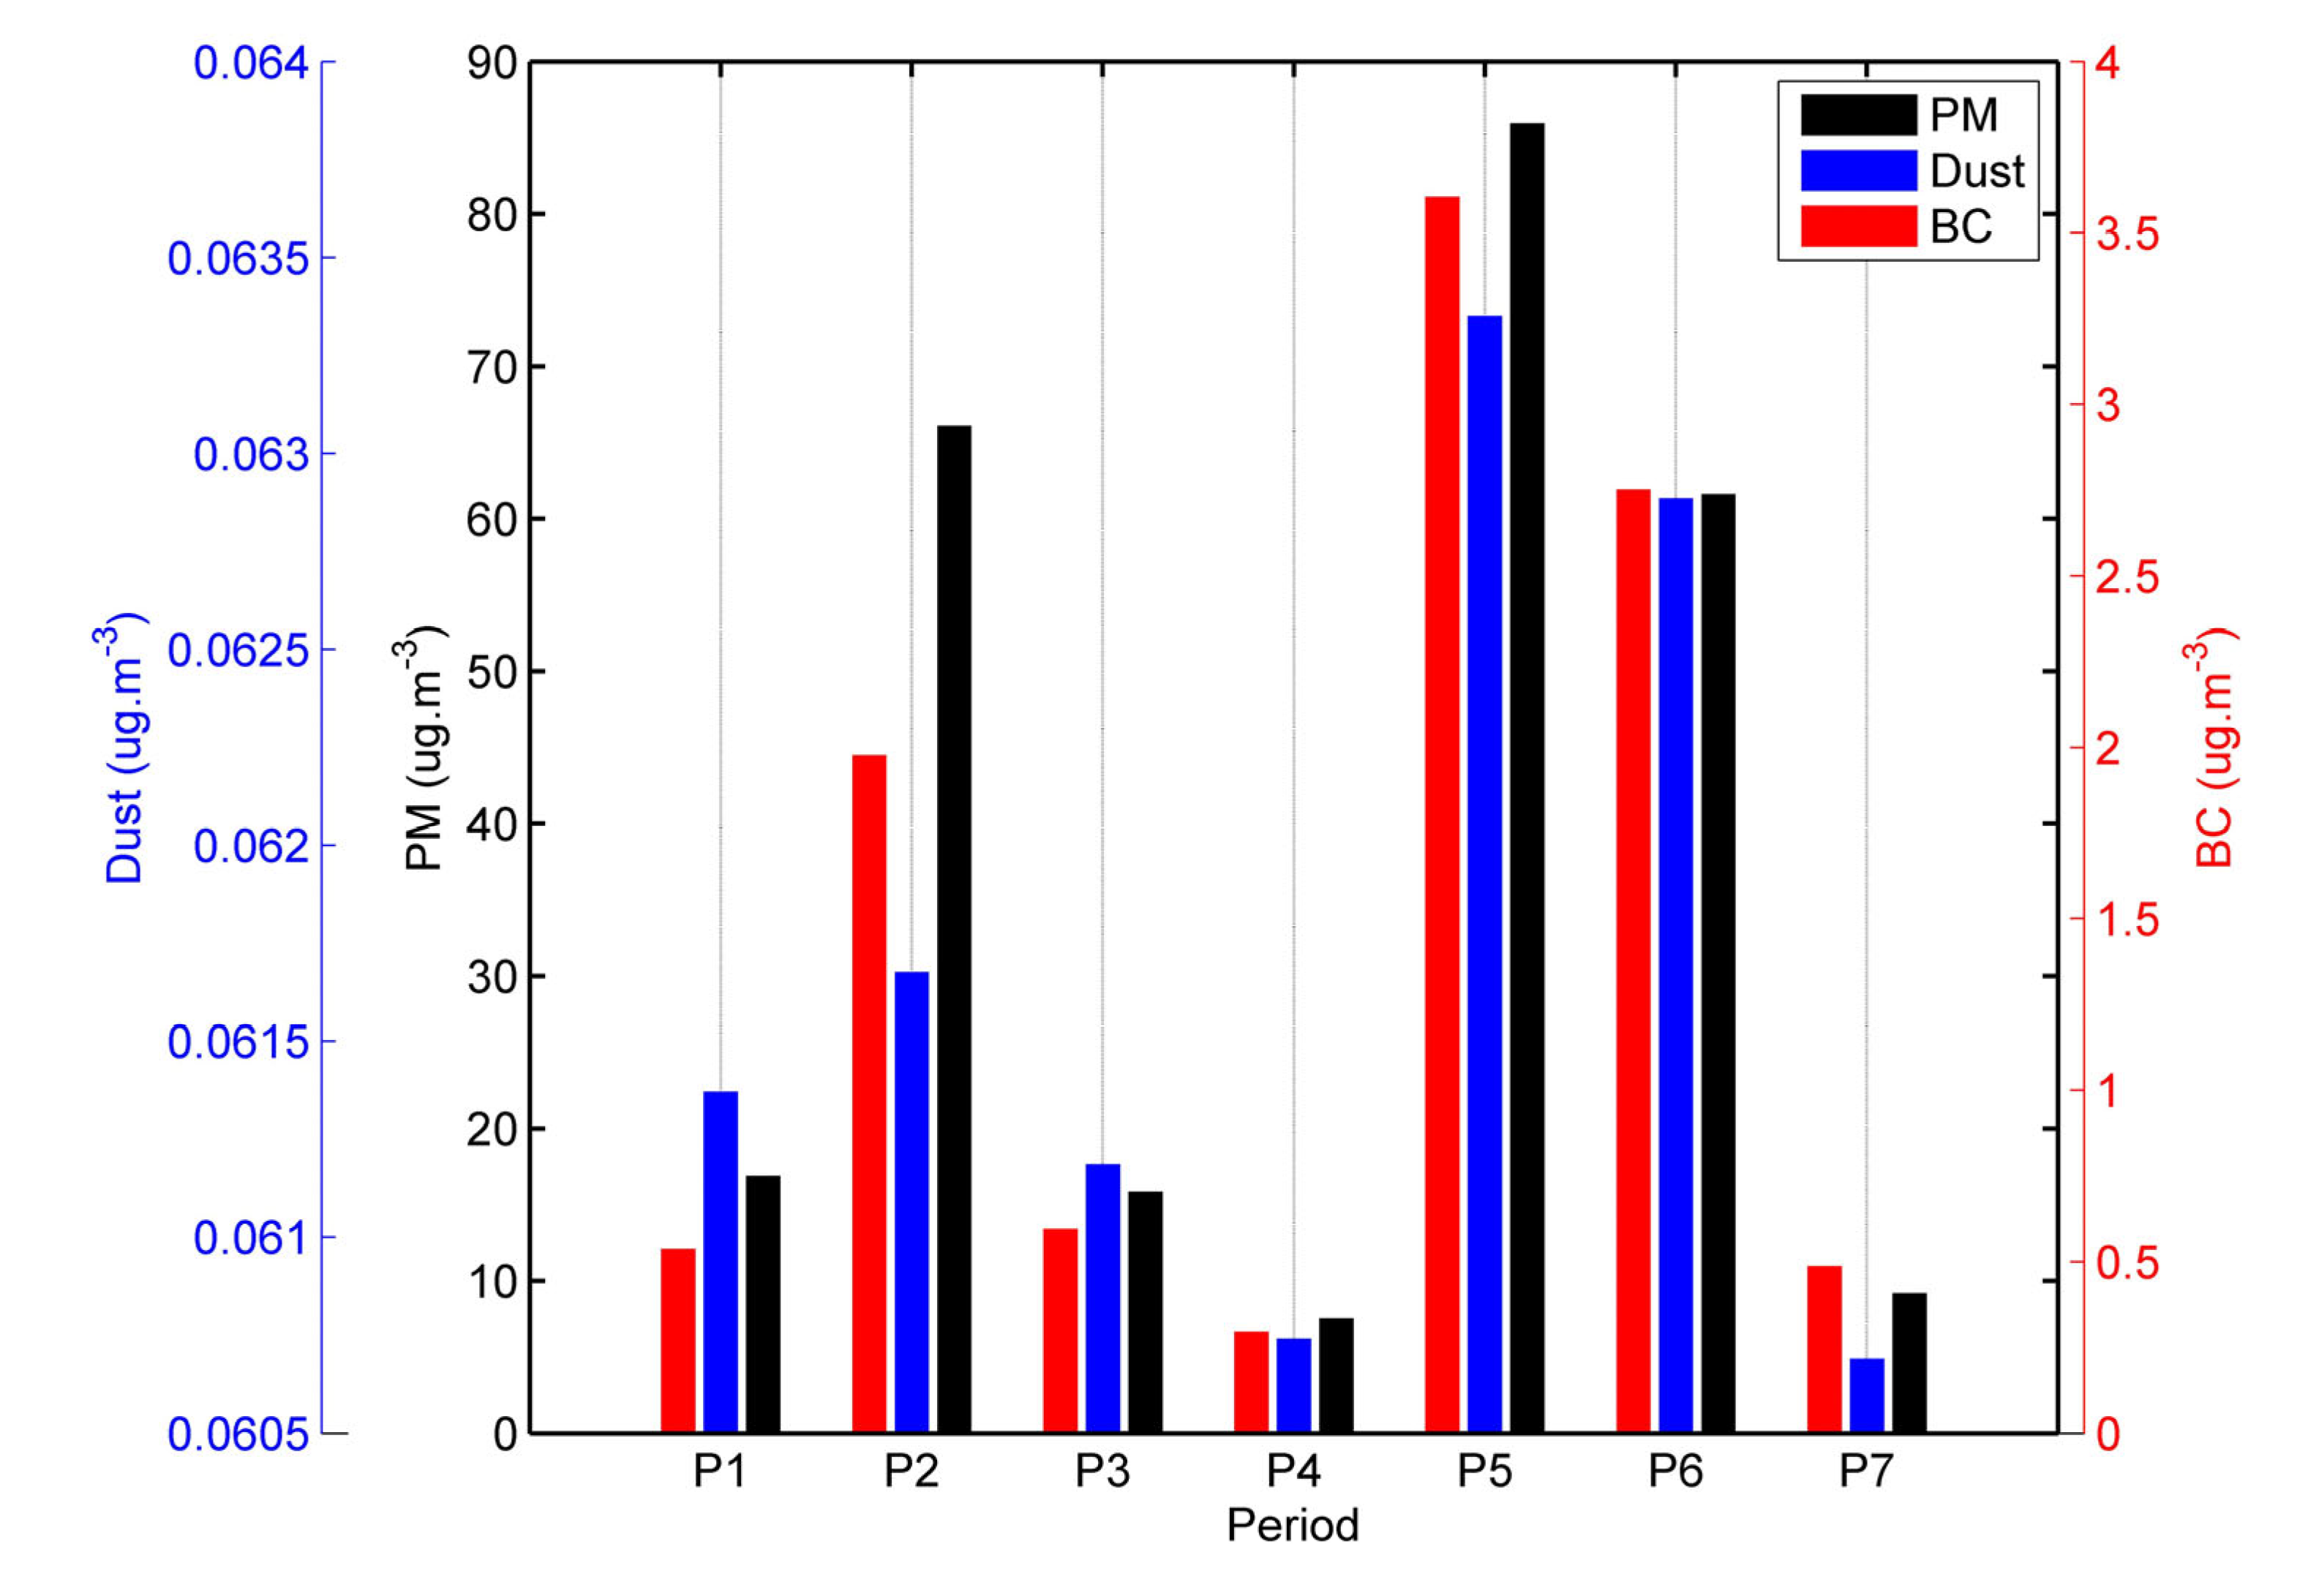
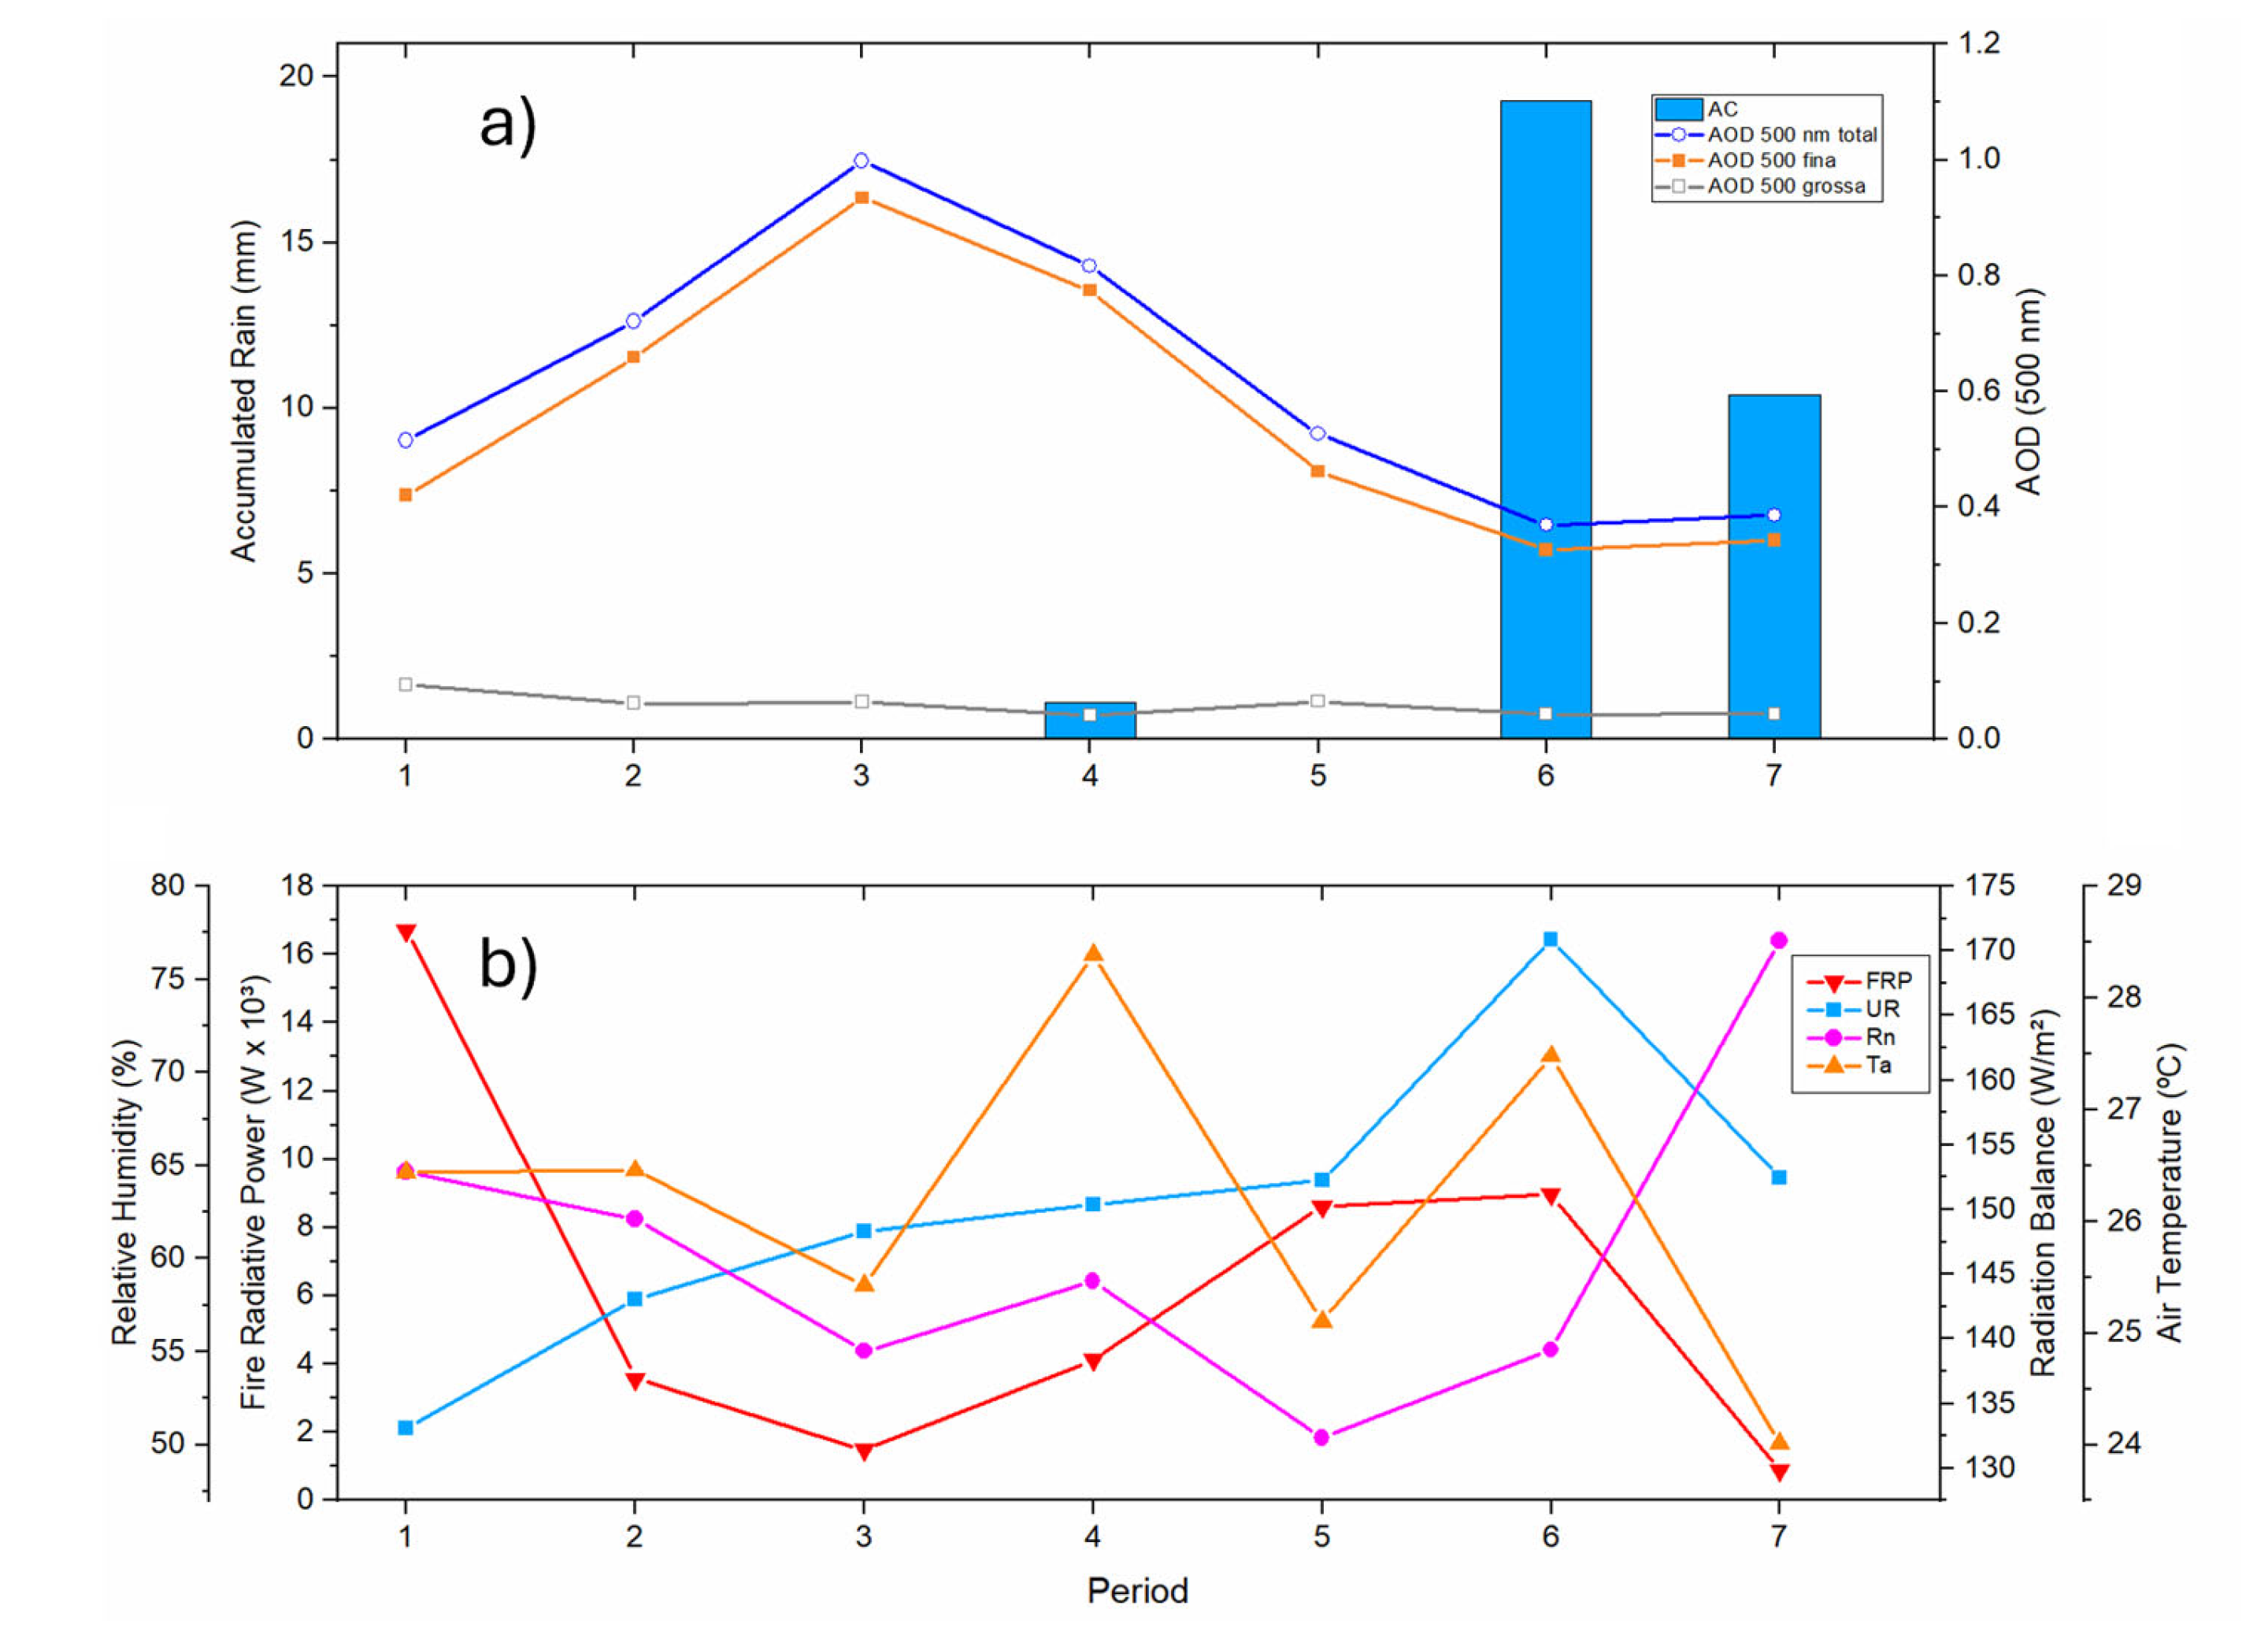
The variations in PM2.5 concentration for the respective analysis periods are shown in Figure 2 and complemented in Table 1. PM2.5 varied from approximately 7 μg.m-3 in P4 to more than 80 μg.m-3 in P5, the average for the entire period being approximately 36 μg.m-3 (36.62 ± 31.69 μg.m-3). The variations in the concentration of BC and dust are also evident in Figure 2, it is possible to observe the same pattern of variation in PM2.5, with a minimum in P4 and a maximum in P5. These variations can be justified based on the meteorological patterns shown in Figure 3. Although the total analysis period is considered dry, precipitation was recorded in P4, P6, and P7. Figure 3a also shows the relationship between accumulated precipitation and the aerosol load in the atmospheric column, in this case, it is possible to observe a different pattern of AOD about PM2.5 measurements on the surface. The total fraction of AOD is practically due to fine AOD, a characteristic of BB emissions. In this case, it is possible to observe the increase in AOD between periods P1 to P4 with a consequent reduction reaching the minimum AOD in P6, with values close to 0.4, which are commonly found in the rainy season in this region [39].
The variation in surface concentrations has different dynamics than the aerosol load in the atmospheric column because wet deposition can act differently at each specific scale. In this study, we hypothesize that the cleaning that occurs in the atmospheric column due to wet deposition in precipitation episodes decreases the aerosol load, decreasing AOD values. However, precipitation is not enough to extinguish the burning spots, which continue to emit gases and particles that concentrate primarily in atmospheric regions closer to the surface, that is, the concentration of PM2.5, in the dry period, will directly depend on the local burning and the influences of wind intensity and direction.
At a comparative level, the work of Santos et al. [20], carried out on the same website and with the same techniques, found maximums varying between 14 and 20 µg.m-3 for the concentration of PM2.5 during the dry period of 2012. Our results show an increase of approximately 4 times for the maximum concentrations of fine aerosols in the Pantanal. The work of Artaxo et al. [40], south of the Amazon biome, in a region directly affected by BB emissions, found maximums varying between 300 and 350 µg.m-3 in the 2010 drought. The study by Santanna et al. [34], with measurements close to the urban area of Cuiabá, found maximum values that varied between 50 and 60 µg.m-3 in August 2004.
On average, PM2.5 concentrations for the central Amazon during the dry period vary between 3.4 [40] and 4.8 µg.m-3 [15], for the south of the Amazon, in the arc of deforestation, this average goes to 33 [40]. The average found in our study approximates the PM2.5 concentrations of regions highly impacted by changes in land cover due to deforestation [40]. We emphasize that the averages found in our study still have a low sample value, and the average value may decrease with more observations, however, the analyses show a high concentration of PM2.5 in the dry period of 2022 in the Pantanal.
For BC concentrations, our results also show higher concentrations than Santos et al. [20] in the Pantanal. For the 2012 dry period, BC maximums varied between 1.6 and 1.8 µg.m-3, while our results show maximums of 3.7 and 2.8, in periods P5 and P6, respectively. Recent work by Palácios et al. [22] also over the north of the Pantanal, with aethalometer measurements, found daily values above 3 µg.m-3 for the dry periods of 2017 and 2019, years in which the Pantanal was also heavily impacted by local fires [22]. The mean for BC in our results was 1.83±1.65 µg.m-3 while Palácios et al. [22] obtained 1.01±0.95, and 0.90±0.81 µg.m-3, for the years 2017 and 2019, respectively. These differences can be justified by the differences in the methods of obtaining BC. Table 2 shows a comparison of our results for PM2.5 and BC with other averages obtained for the Amazon and in urban areas. Table 2 shows the differences in magnitude of PM2.5 and BC concentrations and their respective variations, in studies in Brazil compared to our results.
All information in Table 2 was extracted for the fine fraction of aerosols in the period considered dry, that is, with the influences of BB emissions. The results show large variations between values ​​that can be explained by several factors, such as the method of obtaining PM2.5 and BC, characteristic local emission, and the sampling period. Regarding the sampling period, we highlight that for El Niño years, the central and northern region of Brazil is influenced by a precipitation deficit, causing an increase in the dry period resulting in larger burned areas and more emissions of aerosols [41]. The study by Palácios et al. [41] showed that for El Niño conditions there is a significant increase in the aerosol load south of the Amazon basin. The increase in BC concentrations, found in this study, may have a direct influence on the local microclimate, feeding positive feedback on temperature maximums [32]. The study by Curado et al. [32], in the Pantanal, showed a positive correlation between BC and temperature maximums with consequences for carbon capture.

3.2. Meteorological influences

Figure 3ab shows the average meteorological conditions for each period of analysis, although there is no direct relationship, it is possible to observe some relationships between AOD, PM2.5, and BC concentrations. AOD values are above 0.4 in the initial five periods of AODtotal and period three recorded the highest AODfine average of 0.93. We reinforce that AODfine is linked to the amount of fine optically active aerosols in the atmosphere, therefore a good correlation with PM2.5 is expected. However, there were differences in the patterns for the periods analyzed. Between P1 and P2, the behaviors of AOD and PM2.5 were similar, but, from P3 onwards, surface concentrations are reduced, while AODfine continues to rise, air temperature, and relative humidity patterns follow the measurements of the surface. The air temperature gradually increases from P1 and P2 and then decreases at P3. These results are in line with the analysis by Curado et al. [32] who found a positive correlation between BC concentration and air temperature maxima.
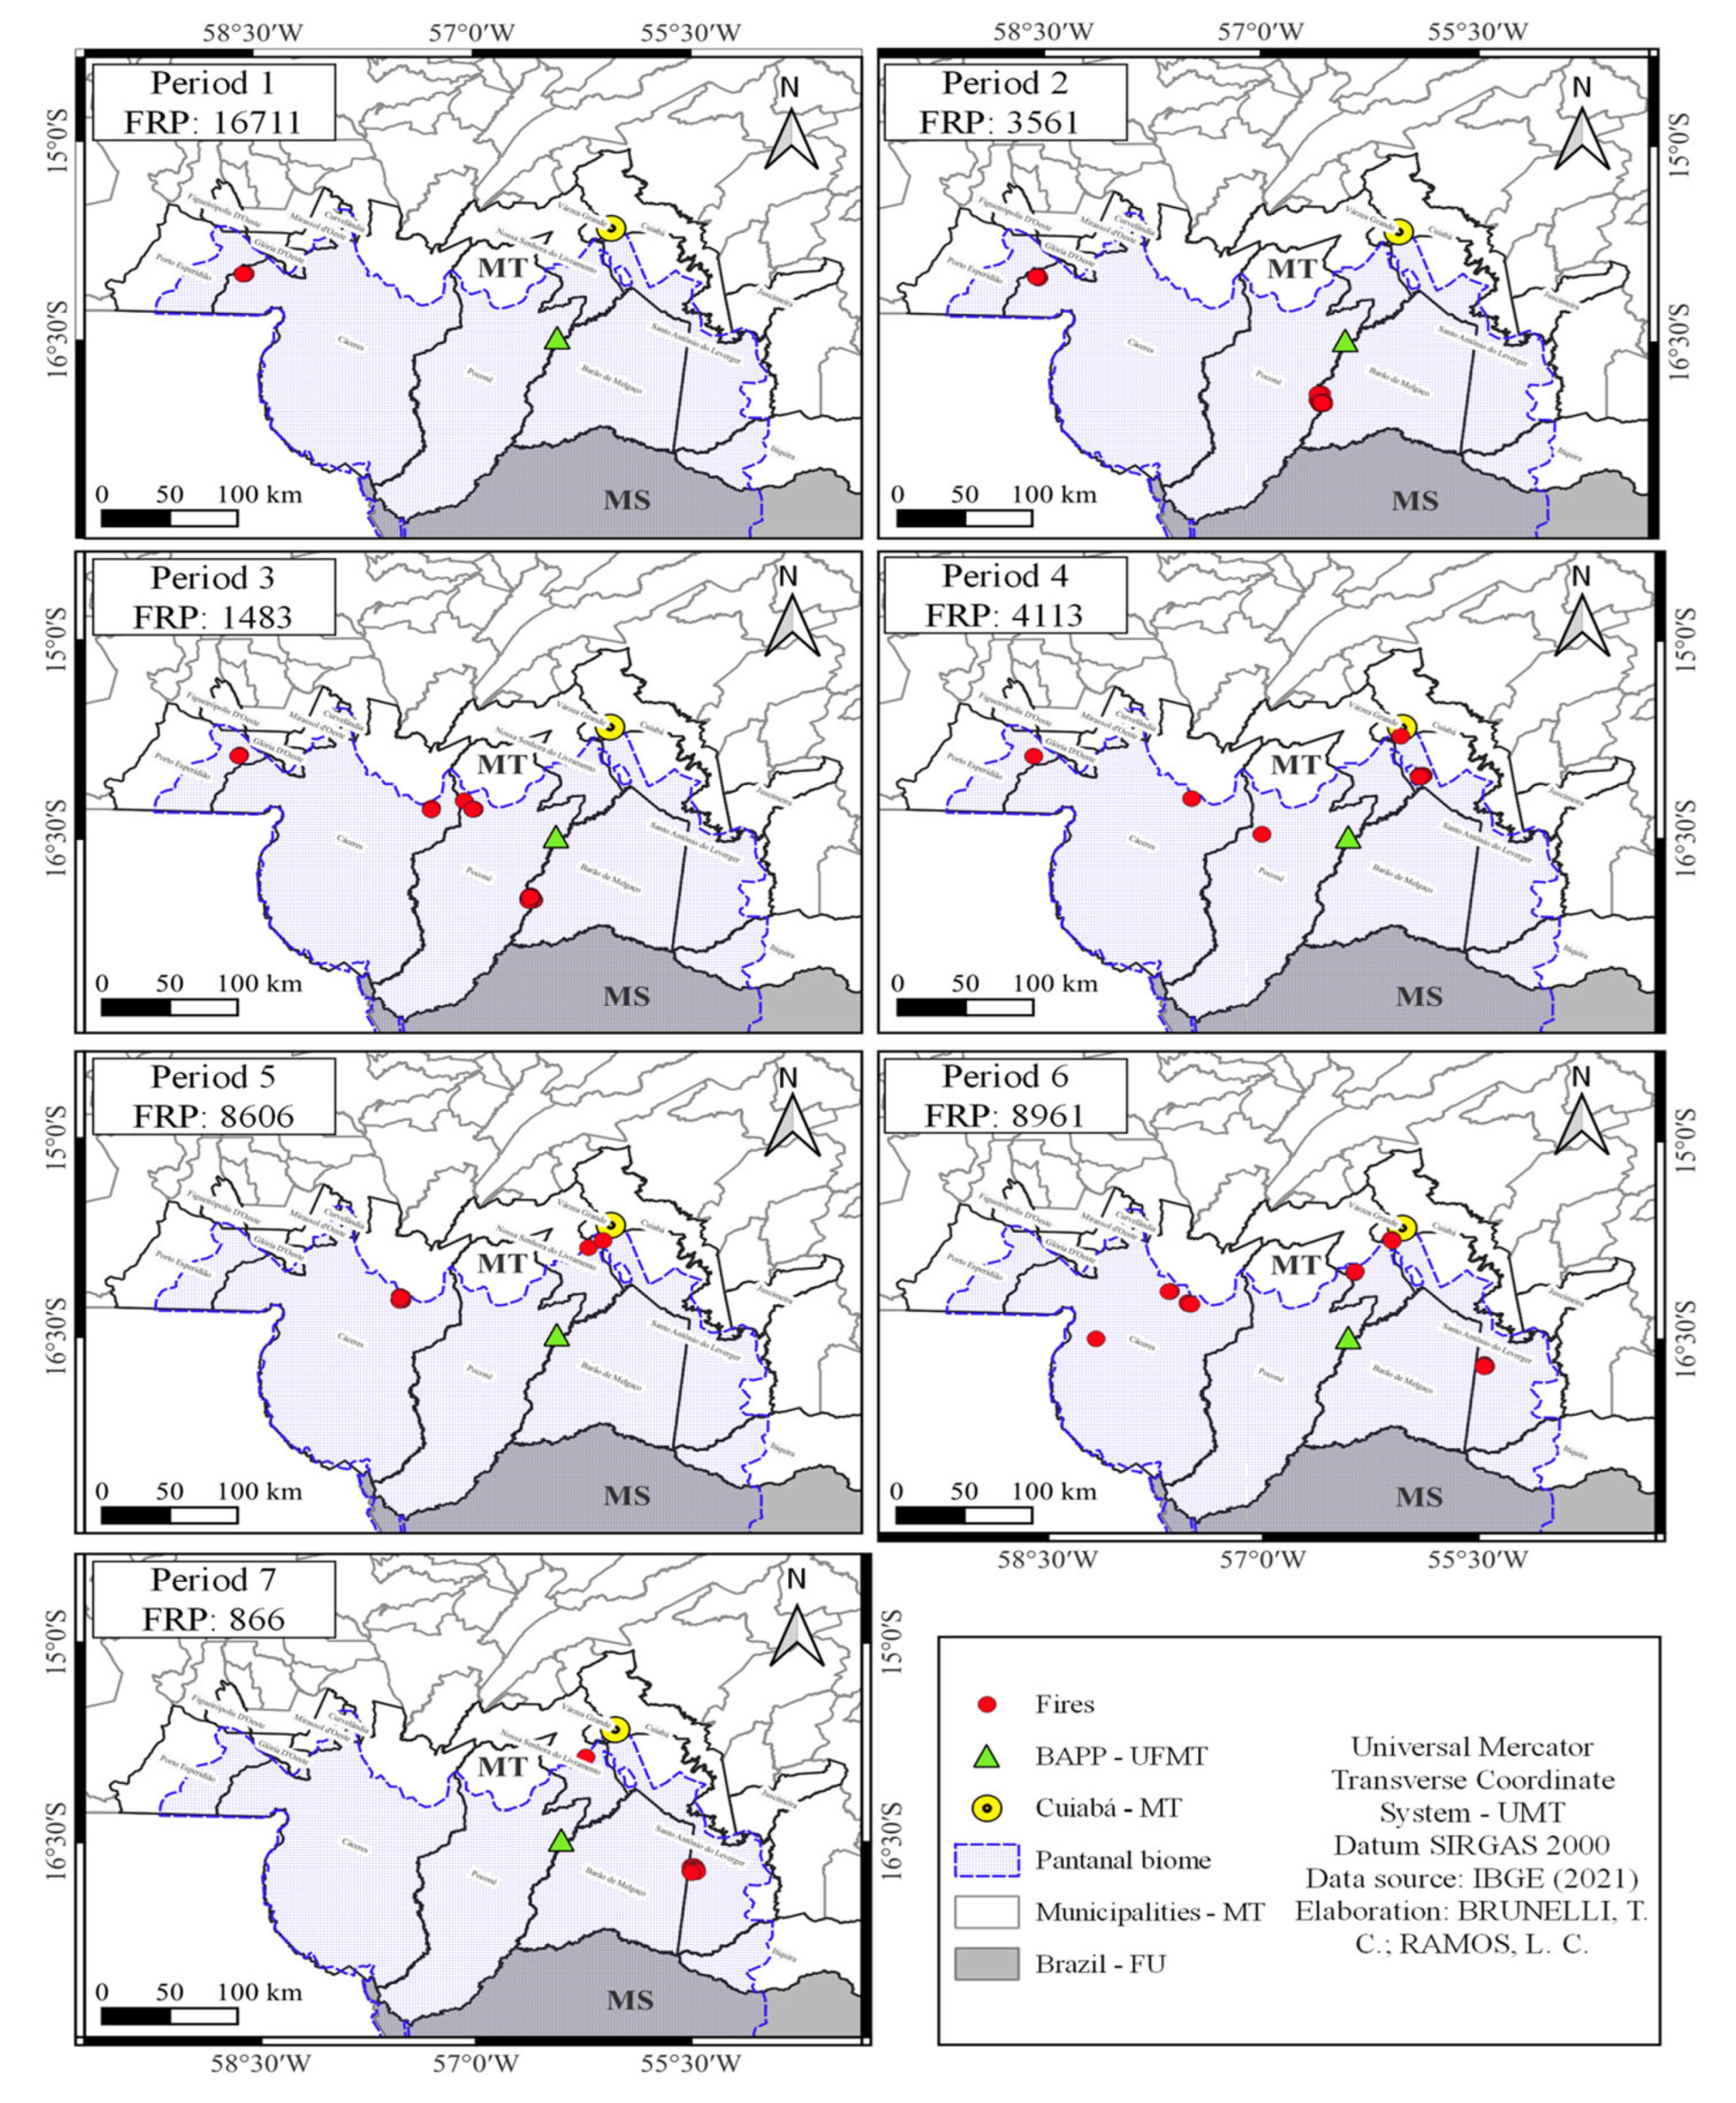
Figure 3b also shows the average behavior of the radiation net Rn. The behavior of Rn has no relationship with AOD or surface concentrations, because this interaction is highly complex [41]. Blocking direct solar radiation, through scattering or absorption, can negatively influence Rn, however, retention of this radiation in the atmosphere can increase the amount of long-wave radiation, influencing Rn positively [32]. In general, more measurements in a specific experimental design need to be developed in the Pantanal so that these feedback processes are better understood. In this study we justify the main variations in surface concentrations based on the number of burning spots that occurred during the analysis period. FO is a recurring problem in the Pantanal, due to the environmental impact and the damage to health they can cause [42]. During the dry season, fires are constant as shown in Figure 4, and with the contribution of wind intensity and direction (Figure 5), concentrations can still increase due to transport in the atmosphere [22].
Our analysis shows that P1 obtained the highest value for FRP, reaching 16,711 W, however, the distance from BAPP, FO (Figure 4), wind direction (Figure 5) and PM2.5 concentration (Figure 2) suggest low BB influence on collected samples. The largest PM2.5 peaks occur in periods two and five, with the value of FRP 3561 and 8606 W, respectively. Considering the position of the FO and the wind speed and direction, the samples collected in these periods may have been directly influenced by regional forest fires. Furthermore, period five presented the highest number of FO (Figure 4) and at the same time the maximum dust concentration of 3.7 μg.m-3 (Figure 2), the highest concentration of chemical elements, including the maximum concentration of Pb of 25 ng.m-3. When analyzing the correlations between surface concentrations (PM2.5 and BC) with the other variables used in this study, no statistically significant correlation was found. We suggest that by continuing the sampling campaign, a more significant number of samples can achieve such a correlation. This is also suggested for evaluating the effects of meteorological parameters.

3.3. Elemental concentration and Enrichment factor

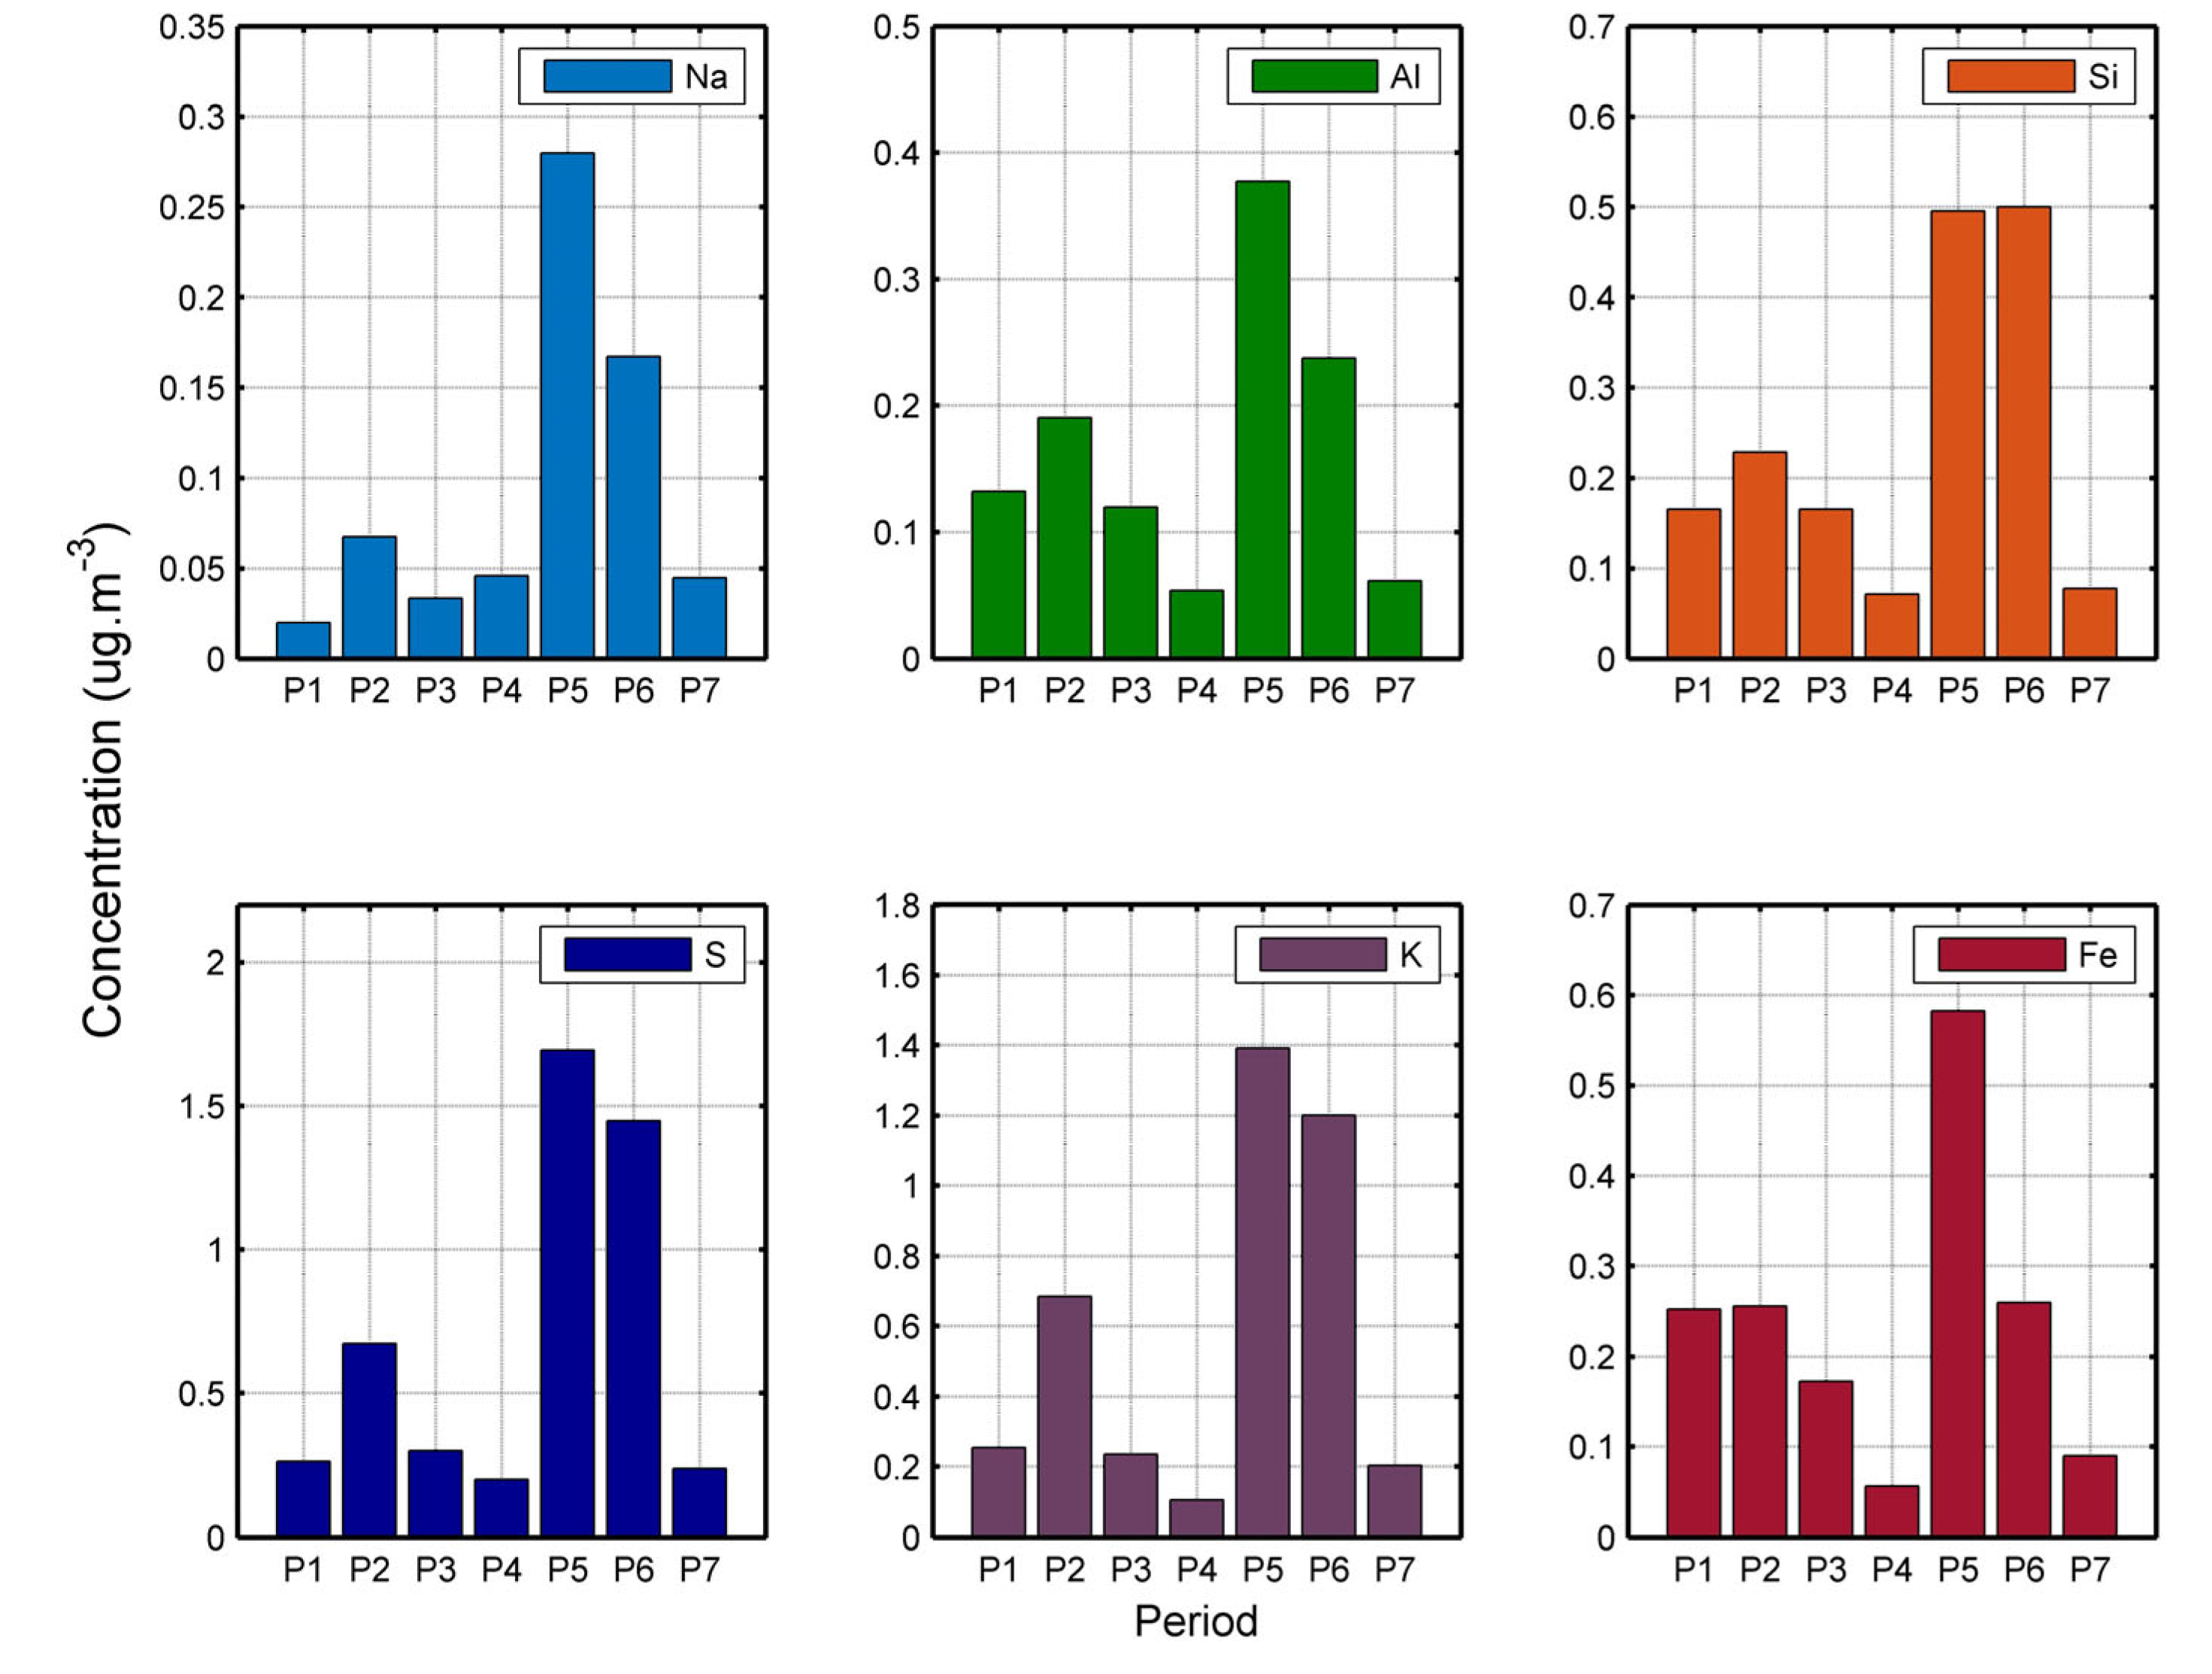
Figure 6 shows the most significant elemental concentrations for the study period. Comparing again with the study by Santos et al. [20] it is possible to notice the increase in S, K, Fe, and Si. The concentrations of Fe and Si are close to the 2012 measurements, however, the maximum concentrations of S and K presented values three times higher. Elemental concentrations follow the same pattern as PM2.5 and BC concentrations with small variations for Si and Fe. For Si, concentrations were the same in periods P6 and P7, while Fe suffered an approximate reduction of 50% for the respective periods. The study by Santanna et al. [34] explains that the increase in Al, Si, and Fe concentrations in the dry period is generally associated with soil conditions and wind speed since during this period the soil is arid and there is a characteristic increase in the average wind speed. which also explains the high sodium concentrations.
Although this study did not perform a factor analysis, the dominant elemental concentrations show a strong relationship with emissions characteristic of biomass burning with contributions from soil resuspension [15,20,34,40]. The concentrations of Fe, S, and K can be a good indication of the contribution of BB, the classic study by Andreae [43] highlights that the concentrations of K can be used as an indicator of fires in the flame phase, as it is a characteristic marker from BB. However, Urban et al. [44] highlight the limitations of using K as a marker when studying soil resuspension emissions in fertilized areas.
For the heavy metals Pb and Cd, the averages found in our study were 4.28 and 8.56 ng.m-3. In the case of Pb, the maximum concentration reaches 24.93 ng.m-3, this peak concentration occurs in period 5, a value six times higher than the average concentration of this element (Table 1). The presence of Pb may be related to anthropogenic factors, especially mining activities that contaminate the soil with heavy metals and increase the suspension of contaminated soil [45]. The dust compound, calculated from the concentration of the elements Al, Si, Ca, Ti, and Fe (Equation (2)), is the main constituent of natural atmospheric aerosols. Annually, the Amazon receives a substantial load of dust from the African continent, which transports tons across the Pacific Ocean [45]. In the Pantanal, land use by agricultural activities, mining, and vehicle traffic is responsible for the suspension of dust, which, depending on the composition of the soil, can pose health risks [20,21,22,23,24,25,26,27,28,29,30,31,32,33,34,35,36,37,38,39,40,41,42]. This work calculated the maximum dust concentration at 3.7 μg.m-3, while in the study by Morais [47] during the dry season at the Amazon Tall Tower Observatory (ATTO), the maximum concentration was 1.4 μg.m-3, reinforcing that area with a greater concentration of human activities promote greater soil suspension.
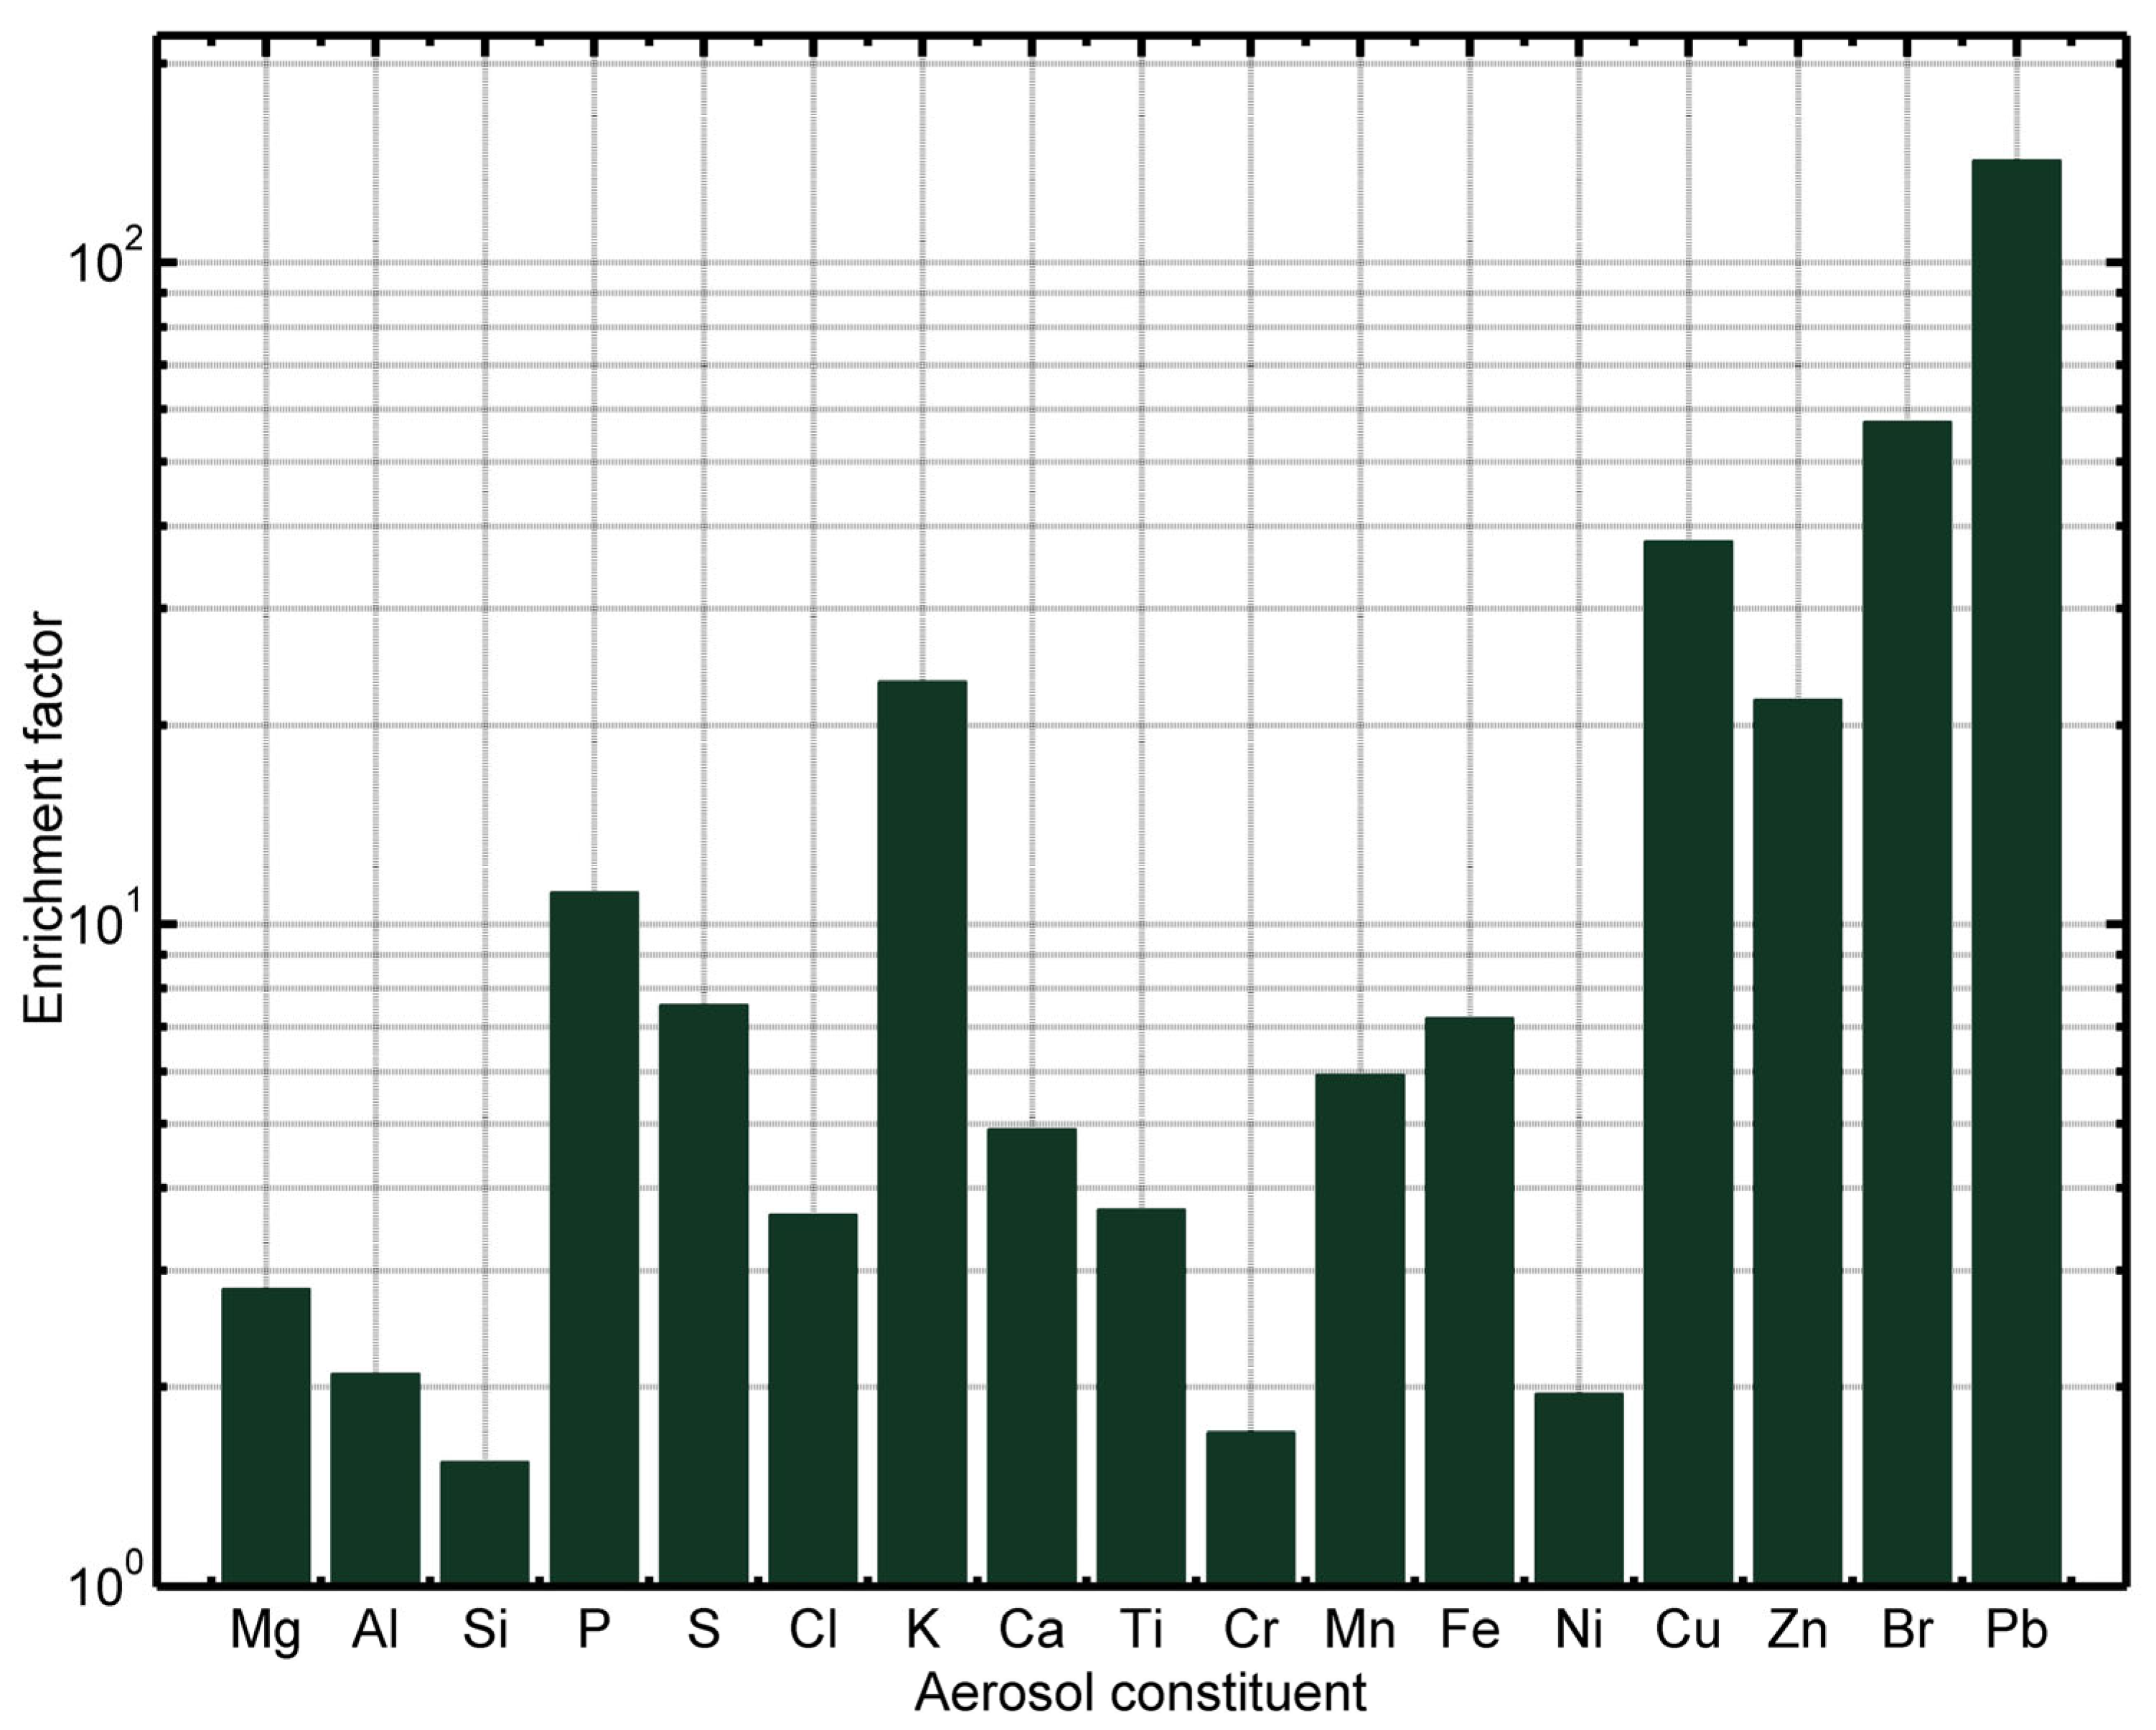
Using reference measurements from Arana and Artaxo [15], it was possible to determine the enrichment factor (Ef) of 17 elements, as shown in Figure 7. Ef’s values close to 1.0 have a strong natural component while elements with values high levels of Ef have a strong anthropic influence. The results in Figure 7 show that for all evaluated elements there is an anthropogenic contribution. For the fine fraction of aerosols, BB emissions are responsible for the high values of K, S, Mg, and Zn [48,49], in this case, we highlight the Ef of K which was approximately 10 times higher than the natural concentration. As for soil resuspension emissions, we have increases in Al, Si, Ti, Fe, Ni, and Cu, which varied in elevations of 1.6 for Si and 12.8 for Cu (times higher). The results also show that Pb was the most anthropic element in the study with Ef above 200, although its average concentration is low (Table 1) its Ef shows that the region is undergoing considerable anthropic transformation with possible implications for the environment and the population health. As previously mentioned, these transformations can be directly associated with mining activities that contaminate the soil with heavy metals and increase the suspension of contaminated soil [45].

4. Conclusions

In this study, the mass concentrations of PM2.5 and BC were determined by gravimetric analysis and optical reflectance for the dry period of 2022 in the Pantanal. Concentrations varied within the analyzed periods depending on local BB emissions. The average concentration of PM2.5 was 36.62±31.69 μg.m-3, while for BC it was 1.83±1.65 μg.m-3. These concentrations increased by approximately 80% and 60% for PM2.5 and BC, respectively, compared to a study on the same site 10 years ago. The elemental concentration of S, K, Fe, and Si has also increased significantly in the last decade. Furthermore, a significant increase in heavy metals was found in the composition of aerosols, we highlight the average concentration of Pb, which, although low, was the constituent most highlighted by the enrichment analysis, with a strong anthropogenic contribution. The results, both for the elemental composition and for the BC component in the ten-year interval, indicate a change in the regional dynamics of the Pantanal. We suspect that the increase in anthropogenic activities in the biome in the last decade is responsible for this change in the concentration and composition of atmospheric aerosols in the Pantanal Mato Grosso and we hope to further explore this issue in a future study.

Author Contributions

Conceptualization, (L.C.R.), (J.B.M.) and (F.C.V.); Methodology, (L.C.R.) and (T.C.B.); software, (T.C.B.) and (J.B.M.); Validation, (F.C.V.), (R.d.S.P.) and (A.M.d.S.L.); Investigation, (L.C.R.), (F.G.M.), (J.B.M.) and (F.C.V.); Resources, (J.B.M.) and (L.F.A.C.); Data curation, (L.C.R.) and (F.G.M.); writing—original draft preparation, (L.C.R.) and (T.C.B.); writing—review and editing, (N.N.d.O.), (F.G.M.), (A.M.d.S.L.), (L.F.A.C.) and (F.C.V.). All authors have read and agreed to the published version of the manuscript.

Funding

The research was funded by Coordenação de Aperfeiçoamento de Pessoal de Nível Superior (CAPES) the authors thanks by the concession of research grant processes (88887.625975/2021-00 and 88887.496169/2020-00).

Data Availability Statement

The AERONET website provides data analysis and dissemination tools at https://aeronet.gsfc.nasa.gov (accessed on 16 November 2022). Data can be viewed in the data display interface, acquired using the data download tool, analyzed, and downloaded using some analysis tools provided by AERONET. The INPE website provides data analysis and dissemination tools at https://queimadas.dgi.inpe.br/queimadas/portal (accessed on 20 November 2022). Every other data must be request directly to the authors.

Acknowledgments

The authors appreciate P Artaxo and J S Nogueira, as well as your team, to establish and maintain the site used in the investigation, to the members of Laboratório de Física Atmosférica (LFA – USP) to support in the samples analyzes and Pró-Reitoria de Pesquisa e Pós-graduação da Universidade Federal de Mato Grosso PROPG/UFMT.

Conflicts of Interest

The authors declare no conflicts of interest

References

  1. IPCC, 2013. Climate Change 2013: the Physical Science Basis. Contribution of Working Group I to the Fifth Assessment Report of the Intergovernmental Panel on Climate Change. Cambridge University Press, New York.
  2. Kumar, M.; Raju, M.P.; Singh, R.S.; Banerjee, T. Impact of drought and normal monsoon scenarios on aerosol induced radiative forcing and atmospheric heating in Varanasi over middle Indo-Gangetic Plain. J. Aerosol Sci. 2017, 113, 95–107. [Google Scholar] [CrossRef]
  3. Kumar, K.R.; Sivakumar, V.; Yin, Y.; Reddy, R.R.; Kang, N.; Diao, A.J.A.; Yu, X. Long-term (2003-2013) climatological trendsand variations in aerosol optical parametersfrom MODIS over three stations in SouthAfrica. Atmos. Envir. 2014, 95, 400–408. [Google Scholar] [CrossRef]
  4. Kang, N.; Kumar, K.R.; Hu, K.; Yu, X.; Yin, Y. Long-term (2002–2014) evolution and trend in Collection 5.1 Level-2 aerosol products derived from the MODIS and MISR sensors over the Chinese Yangtze River Delta. Atmos. Res. 2016, 181, 29–43. [Google Scholar] [CrossRef]
  5. Rizzo, L.V.; Artaxo, P.; Müller, T.; Wiedensohler, A.; Paixão, M.; Cirino, G.G.; Arana, A.; Swietlicki, E.; Roldin, P.; Fors, E.O.; Wiedemann, K.T.; Leal, L.S.M.; Kulmala, M. Long term measurements of aerosol optical properties at a primary forest site in Amazonia. Atmos. Chem. Phys. 2013, 2013. 13, 2391–2413. [Google Scholar] [CrossRef]
  6. Thornhill, G.D.; Ryder, C.L.; Highwood, E.J.; Shaffrey, L.C.; Johnson, B.T. The effect of South American biomass burning aerosol emissions on the regional climate. Atmos. Chem. Phys. 2018, 18, 5321–5342. [Google Scholar] [CrossRef]
  7. Bond, T.C.; Doherty, S.J.; Fahey, D.W.; Forster, P.M.; Berntsen, T.; DeAngelo, B.J.; Flanner, M.G.; Ghan, S.; Kärcher, B.; Koch, D.; Kinne, S.; Kondo, Y.; Quinn, P.K.; Sarofim, M.C.; Schultz, M.G.; Schulz, M.; Venkataraman, C.; Zhang, H.; Zhang, S.; Bellouin, N.; Guttikunda, S.K.; Hopke, P.K.; Jacobson, M.Z.; Kaiser, J.W.; Klimont, Z.; Lohmann, U.; Schwarz, J.P.; Shindell, D.; Storelvmo, T.; Warren, S.G.; Zender, C.S. Bounding the role of black carbon in the climate system: Ascientific assessment. J. Geophys. Res. 2013, 118, 5380–5552. [Google Scholar] [CrossRef]
  8. Artaxo, P.; Martins, J.V.; Yamasoe, M.; Procopio, A.S.; Pauliquevis, T.M.; Andreae,M. O.; Guyon, P.; Gatti, L.V.; Leal, A.M.C. Physical and chemical properties ofaerosols in the wet and dry seasons inRondonia, Amazonia. . J. Geophys. Res. 2002, 107, 8081. [Google Scholar] [CrossRef]
  9. Andreae, M.O.; Gelencsér, A. Black carbon or brown carbon? The nature of light-absorbing carbonaceous aerosols. Atmos. Chem. Phys. 2006, 6, 3131–3148. [Google Scholar] [CrossRef]
  10. Bennett, J.E.; Tamura-Wicks, H.; Parks, R.M.; Burnett, R.T.; Pope, A.; Bechle, M.J.; Marshall, J.D.; Danaei, G.; Ezzati, M. Particulate matter air pollution and national and county life expectancy loss in the USA: A spatiotemporal analysis. PLoS. Med. 2019, 16, e1002856. [Google Scholar] [CrossRef]
  11. Requia, W.J.; Amini, H.; Mukherjee, R.; Gold, D.R.; Schwartz, J.D. Health impacts of wild fi re-related air pollution in Brazil: a nationwide study of more than 2 million hospital admissions between 2008 and 2018. Nat. Commun. 2021, 12, 6555. [Google Scholar] [CrossRef]
  12. Andrade Filho, V.S.; Artaxo, P.; Hacon, S.; Carmo, C.N.; Cirino, G. Aerossóis de queimadas e doenças respiratórias em crianças, Manaus, Brasil. Rev. Saúde Púb. 2013, 47, 239–247. [Google Scholar] [CrossRef] [PubMed]
  13. Brunelli, T.C.; Paiva, S.; Yara, A.; Elizeu, C.; Otávio, L.; Basso, J. Environmental parameters and relationships with COVID-19 cases in central South America. Quim. Nova, 2021, 44, 1236–1244. [Google Scholar] [CrossRef]
  14. Jacobson, L. da S.V.; de Oliveira, B.F.A.; Schneider, R.; Gasparrini, A.; Hacon, S. de S. Mortality Risk from Respiratory Diseases Due to Non-Optimal Temperature among Brazilian Elderlies. Int J Environ Res Public Health. [CrossRef]
  15. Arana, A.; Artaxo, P. Composição elementar do aerossol atmosférico na região central da bacia amazônica. Quim. Nova, 2014, 37, 268–276. [Google Scholar] [CrossRef]
  16. Rizzo, L.V.; Correia, A.L.; Artaxo, P.; Procppio, A.S.; Andreae, M.O. Spectral dependence of aerosol light absorption over \newline the Amazon Basin. Atmos. Chem. Phys. 2011, 11, 8899–8912. [Google Scholar] [CrossRef]
  17. Rizzo, L.V.; Roldin, P.; Brito, J.; Backman, J.; Swietlicki, E.; Krejci, R.; Tunved, P.; Petäjä, T.; Kulmala, M.; Artaxo, P. Multi-year statistical and modelling analysis of submicrometer aerosol number size distributions at a rain forest site in Amazonia. Atmos. Chem. Phys. 2018, 18, 10255–10274. [Google Scholar] [CrossRef]
  18. Saturno, J.; Holanda, B.A.; Pöhlker, C.; Ditas, F.; Wang, Q.; Moran-Zuloaga, D.; Brito, J.; Carbone, S.; Cheng, Y.; Chi, X.; Ditas, J. Hoffmann, T., Angelis, I. H. de, Könemann, T., Lavrič, J. V., Ma, N., Ming, J., Paulsen, H., Pöhlker, M. L., Rizzo, L. V., Schlag, P.; Su, H.; Walter, D.; Wolff, S.; Zhang, Y.; Artaxo, P.; Pöschl, U.; Andreae, M.O. Black and brown carbon over central Amazonia: long-term aerosol measurements at the ATTO site. Atmos. Chem. Phys. 2018, 18, 12817–12843. [Google Scholar] [CrossRef]
  19. Ponczek, M.; Franco, M.A.; Carbone, S.; Rizzo, L.V.; Santos, D.M.; Morais, F.G.; Duarte, A.; Barbosa, H.M.J.; Artaxo, P. Linking the chemical composition and optical properties of biomass burning aerosols in Amazonia. Environ. sci. Atmos. 2022, 2, 252–269. [Google Scholar] [CrossRef]
  20. Santos, A.C.A.; Finger, A. , Nogueira, J.D.S.; Curado, L.F.A.; Palácios, R.S.; Pereira, V.M.R. Analysis of the concentration and composition of aerosols from fires in the Mato grosso wetland. Quím. Nova, 2016, 39, 919–924. [Google Scholar] [CrossRef]
  21. Marengo, J.A.; Cunha, A.P.; Cuartas, L.A.; Leal, K.R.D.; Broedel, E.; Seluchi, M.E.; Michelin, C.M.; Baião, C.F.P.; Ângulo, E.C.; Almeida, E.K.; Kazmierczak, M.L.; Mateus, N.P.A.; Silva, R.C.; Bender, F. Extreme Drought in the Brazilian Pantanal in 2019–2020: Characterization, Causes, and Impacts. Front. Water, 2021, 3, 639204. [Google Scholar] [CrossRef]
  22. Palácios, R.; Romera, K.; Rizzo, L.; Cirino, G.; Adams, D.; Imbiriba, B.; Nassarden, D.; Rothmund, L.; Siqueira, A.; Basso, J.; Rodrigues, T.; Curado, L.; Weber, A.; Nogueira, J.; Morais, F.; Artaxo, P. Optical properties and spectral dependence of aerosol light absorption over the Brazilian Pantanal. Atmos. Pollut. Res. 2022, 13, 101413. [Google Scholar] [CrossRef]
  23. Libonati, R.; Geirinhas, J.L.; Silva, P.S.; Russo, A.; Rodrigues, J.A.; Belém, L.B.C.; Nogueira, J.; Roque, F.O.; DaCamara, C.C.; Nunes, A.M.B. Assessing the role of compound drought and heatwave events on unprecedented 2020 wildfires in the Pantanal. Environ. Res. Lett. 2022, 17, 015005. [Google Scholar] [CrossRef]
  24. Garcia, L.C.; Szabo, J.K.; Roque, F.O.; Pereira, A.M.M.; da Cunha, C.N.; Damasceno-Júnior, G.A.; Morato, R.G.; Tomas, W.M.; Libonati, R.; Ribeiro, D.B. Record-breaking wildfires in the world’s largest continuous tropical wetland: Integrative fire management is urgently needed for both biodiversity and humans. J. Environ. Manage, 2021, 293, 112870. [Google Scholar] [CrossRef] [PubMed]
  25. Kumar, S.; Getirana, A.; Libonati, R.; Hain, C.; Mahanama, S.; Andela, N. Changes in land use enhance the sensitivity of tropical ecosystems to fire-climate extremes. Sci. Rep. 2022, 12, 964. [Google Scholar] [CrossRef] [PubMed]
  26. Martins, P.I.; Belém, L.B.C.; Szabo, J.K.; Libonati, R.; Garcia, L.C. Prioritising areas for wildfire prevention and post-fire restoration in the Brazilian Pantanal. Ecol. Eng. 2022, 176, 106517. [Google Scholar] [CrossRef]
  27. Köppen, G.W.; Geiger, M.R. Handbuch Der Klimatologie; Berlin, 1936.
  28. Guimarães, D.P.; Landau, E.C.; Santos, M.C.B.; Mendes, S.H.G. da S. Caracterização de Chuvas Do Pantanal Mato-Grossense; 2018.
  29. Vieira, E.V.R.; do Rosario, N.E.; Yamasoe, M.A.; Morais, F.G.; Martinez, P.J.P.; Landulfo, E.; Maura de Miranda, R. Chemical Characterization and Optical Properties of the Aerosol in São Paulo, Brazil. Atmosphere, 2023, 14, 1460. [Google Scholar] [CrossRef]
  30. Artaxo, P.; Martins, J.V.; Yamasoe, M.A.; Procópio, A.S.; Pauliquevis, T.M.; Andreae, M.O.; Guyon, P.; Gatti, L. V.; Leal, A.M.C. Physical and Chemical Properties of Aerosols in the Wet and Dry Seasons in Rondônia, Amazonia. J. Geo.Res.: Atmospheres, 2002, 107, LBA–49. [Google Scholar] [CrossRef]
  31. Maenhaut, W.; Raes, N.; Chi, X.; Cafmeyer, J.; Wang, W.; Salma, I. Chemical Composition and Mass Closure for Fine and Coarse Aerosols at a Kerbside in Budapest, Hungary, in Spring 2002. X-Ray Spectrometry, 2005, 34, 290–296. [Google Scholar] [CrossRef]
  32. Curado, L.F.A.; de Paulo, S.R.; da Silva, H.J.A.; Palácios, R.; Marques, J.B.; de Paulo, I.J.C.; Dalmagro, H.J.; Rodrigues, T.R. Effect of biomass burning emission on carbon assimilation over Brazilian Pantanal. Theor Appl Climatol, 2024, 155, 999–1006. [Google Scholar] [CrossRef]
  33. Holben, B.N.; Eck, T.F.; Slutsker, I.; Tanré, D.; Buis, J.P.; Setzer, A.; Vermote, E.; Reagan, J.A.; Kaufman, Y.J.; Nakajima, T.; Lavenu, F.; Jankowiak, I.; Smirnov, A. AERONET – a federated instrument network and data archive for aerossol characterization. Remote Sens. Environ. 1998, 66, 1–16. [Google Scholar] [CrossRef]
  34. Santanna, F.B.; Almeida Filho, E.O.; Vourlitis, G.L.; Arruda, P.H.Z.; Palácios, R.S.; Nogueira, J.S. Elemental composition of PM10 and PM2.5 for a Savanna (Cerrado) region of Southern Amazonia. Quim. Nova, 2016, 39, 1170–1176. [Google Scholar] [CrossRef]
  35. Duce, R.; Hoffman, G.L.; Zoller, W. Atmospheric Trace Metals at Remote Northern and Southern Hemisphere Sites: Pollution or Natural? Science. [CrossRef]
  36. Zoller, W.H.; Gladney, E.S.; Duce, R.A. Atmospheric Concentrations and Sources of Trace Metals at the South Pole. Science. [CrossRef]
  37. Marcazzan, G. M.; Vaccaro, S.; Valli, G.; Vecchi, R. Characterisation of PM10 and PM2.5 particulate matter in the ambient air of Milan (Italy). Atmos. Environ. 2001, 35, 4639. [Google Scholar] [CrossRef]
  38. Braga, C.F.; Teixeira, E.C.; Meira, L. , Wiegand F.; Yoneama M.L.; Dias J.F. Elemental composition of PM10 and PM2.5 in urban environment in South Brazil. Atmos. Environ. 2005, 39, 1801–1815. [Google Scholar] [CrossRef]
  39. Palácios, R.S.; Romera, K.S.; Curado, L.F.A.; Banga, N.M.; Rothmund, L.D.; Sallo, F.d.S.; Morais, D.; Santos, A.C.A.; Moraes, T.J.; Morais, F.G.; Landulfo, E.; Franco, M.A.M.; Kuhnen, I.A.; Marques, J.B.; Nogueira, J.S.; Júnior, L.C.G.d.V.; Rodrigues, T.R. Long Term Analysis of Optical and Radiative Properties of Aerosols in the Amazon Basin. Aerosol Air Qual. Res. 2020, 20, 139–154. [Google Scholar] [CrossRef]
  40. Artaxo, P.; Rizzo, L.V.; Brito, J.F.; Barbosa, H.M.J.; Arana, A.; Sena, E.T.; Cirino, G.G.; Bastos, W.; Martin, S.T.; Andreae, M.O. Atmospheric aerosols in Amazonia and land use change: from natural biogenic to biomass burning conditions. Faraday Discuss. 2013, 165, 203–235. [Google Scholar] [CrossRef] [PubMed]
  41. Palácios, R.; Castagna, D.; Barbosa, L.; Souza, A.P.; Imbiriba, B.; Zolin, C.A.; Nassarden, D.; Duarte, L.; Morais, F.G.; Franco, M.A.; Cirino, G.; Kuhn, P.; Sodré, G.; Curado, L.; Basso, J.; de Paulo, S.R.; Rodrigues, T. ENSO effects on the relationship between aerosols and evapotranspiration in the south of the Amazon biome, Environ. Res. 2024, 250, 118516. [Google Scholar] [CrossRef]
  42. Caumo, S.; Lázaro, W.L.; Sobreira Oliveira, E.; Beringui, K.; Gioda, A.; Massone, C.G.; Carreira, R.; de Freitas, D.S.; Ignacio, A.R.A.; Hacon, S. Human Risk Assessment of Ash Soil after 2020 Wildfires in Pantanal Biome (Brazil). Air Qual Atmos Health, 2022, 15, 2239–2254. [Google Scholar] [CrossRef]
  43. Andreae, M.A. Soot Carbon and Excess Fine Potassium: Long-Range Transport of Combustion-Derived Aerosols. Science, 1148. [Google Scholar] [CrossRef]
  44. Urban, R.C.; Lima-Souza, M.; Caetano-Silva, L.; Queiroz, M.E.C.; Nogueira, R.F.P.; Allen, A.G.; Cardoso, A.A.; Held, G.; Campos, M.L.A.M. Use of levoglucosan, potassium, and water-soluble organic carbon to characterize the origins of biomass-burning aerosols, Atmos. Environ. 2012, 61, 562–569. [Google Scholar] [CrossRef]
  45. Garba, S.T.; Abubakar, M.A. Source and Distribution of The Heavy Metals: Pb, Cd, Cu, Zn, Fe, Cr, and Mn in Soils of Bauchi Metropolis, Nigeria. A. Journal of Eng. Res. 2018, 7, 13–22. [Google Scholar]
  46. Holanda, B.A.; Pöhlker, M.L.; Walter, D.; Saturno, J.; Sörgel, M.; Ditas, J.; Ditas, F.; Schulz, C.; Aurélio Franco, M.; Wang, Q.; et al. Influx of African Biomass Burning Aerosol during the Amazonian Dry Season through Layered Transatlantic Transport of Black Carbon-Rich Smoke. Atmos. Chem. Phys. 2020, 20, 4757–4785. [Google Scholar] [CrossRef]
  47. Morais, F.G. Estudo Das Propriedades de Absorção de Brown Carbon e Black Carbon Utilizando Sensoriamento Remoto e Medidas in Situ Na Amazônia, Instituto de Pesquisas Energéticas e Nucleares, 2022.
  48. Artaxo, P.; Fernandes, E.T.; Martins, J.V.; Yamasoe, M.A.; Hobbs, P.V.; Maenhaut, W.; Longo, K.M.; Castanho, A. Large-scale aerosol source apportionment in Amazonia, J. Geophys. Res. Atmos. 1998, 103, 31837–31847. [Google Scholar] [CrossRef]
  49. Reid, J.S.; Hobbs, P.V.; Ferek, R.J.; Blake, D.R.; Martins, J.V.; Dunlap, M.R.; Liousse, C. Physical, chemical, and optical properties of regional hazes dominated by smoke in Brazil, J. Geophys. Res. Atmos. 1998, 103, 32059–32080. [Google Scholar] [CrossRef]
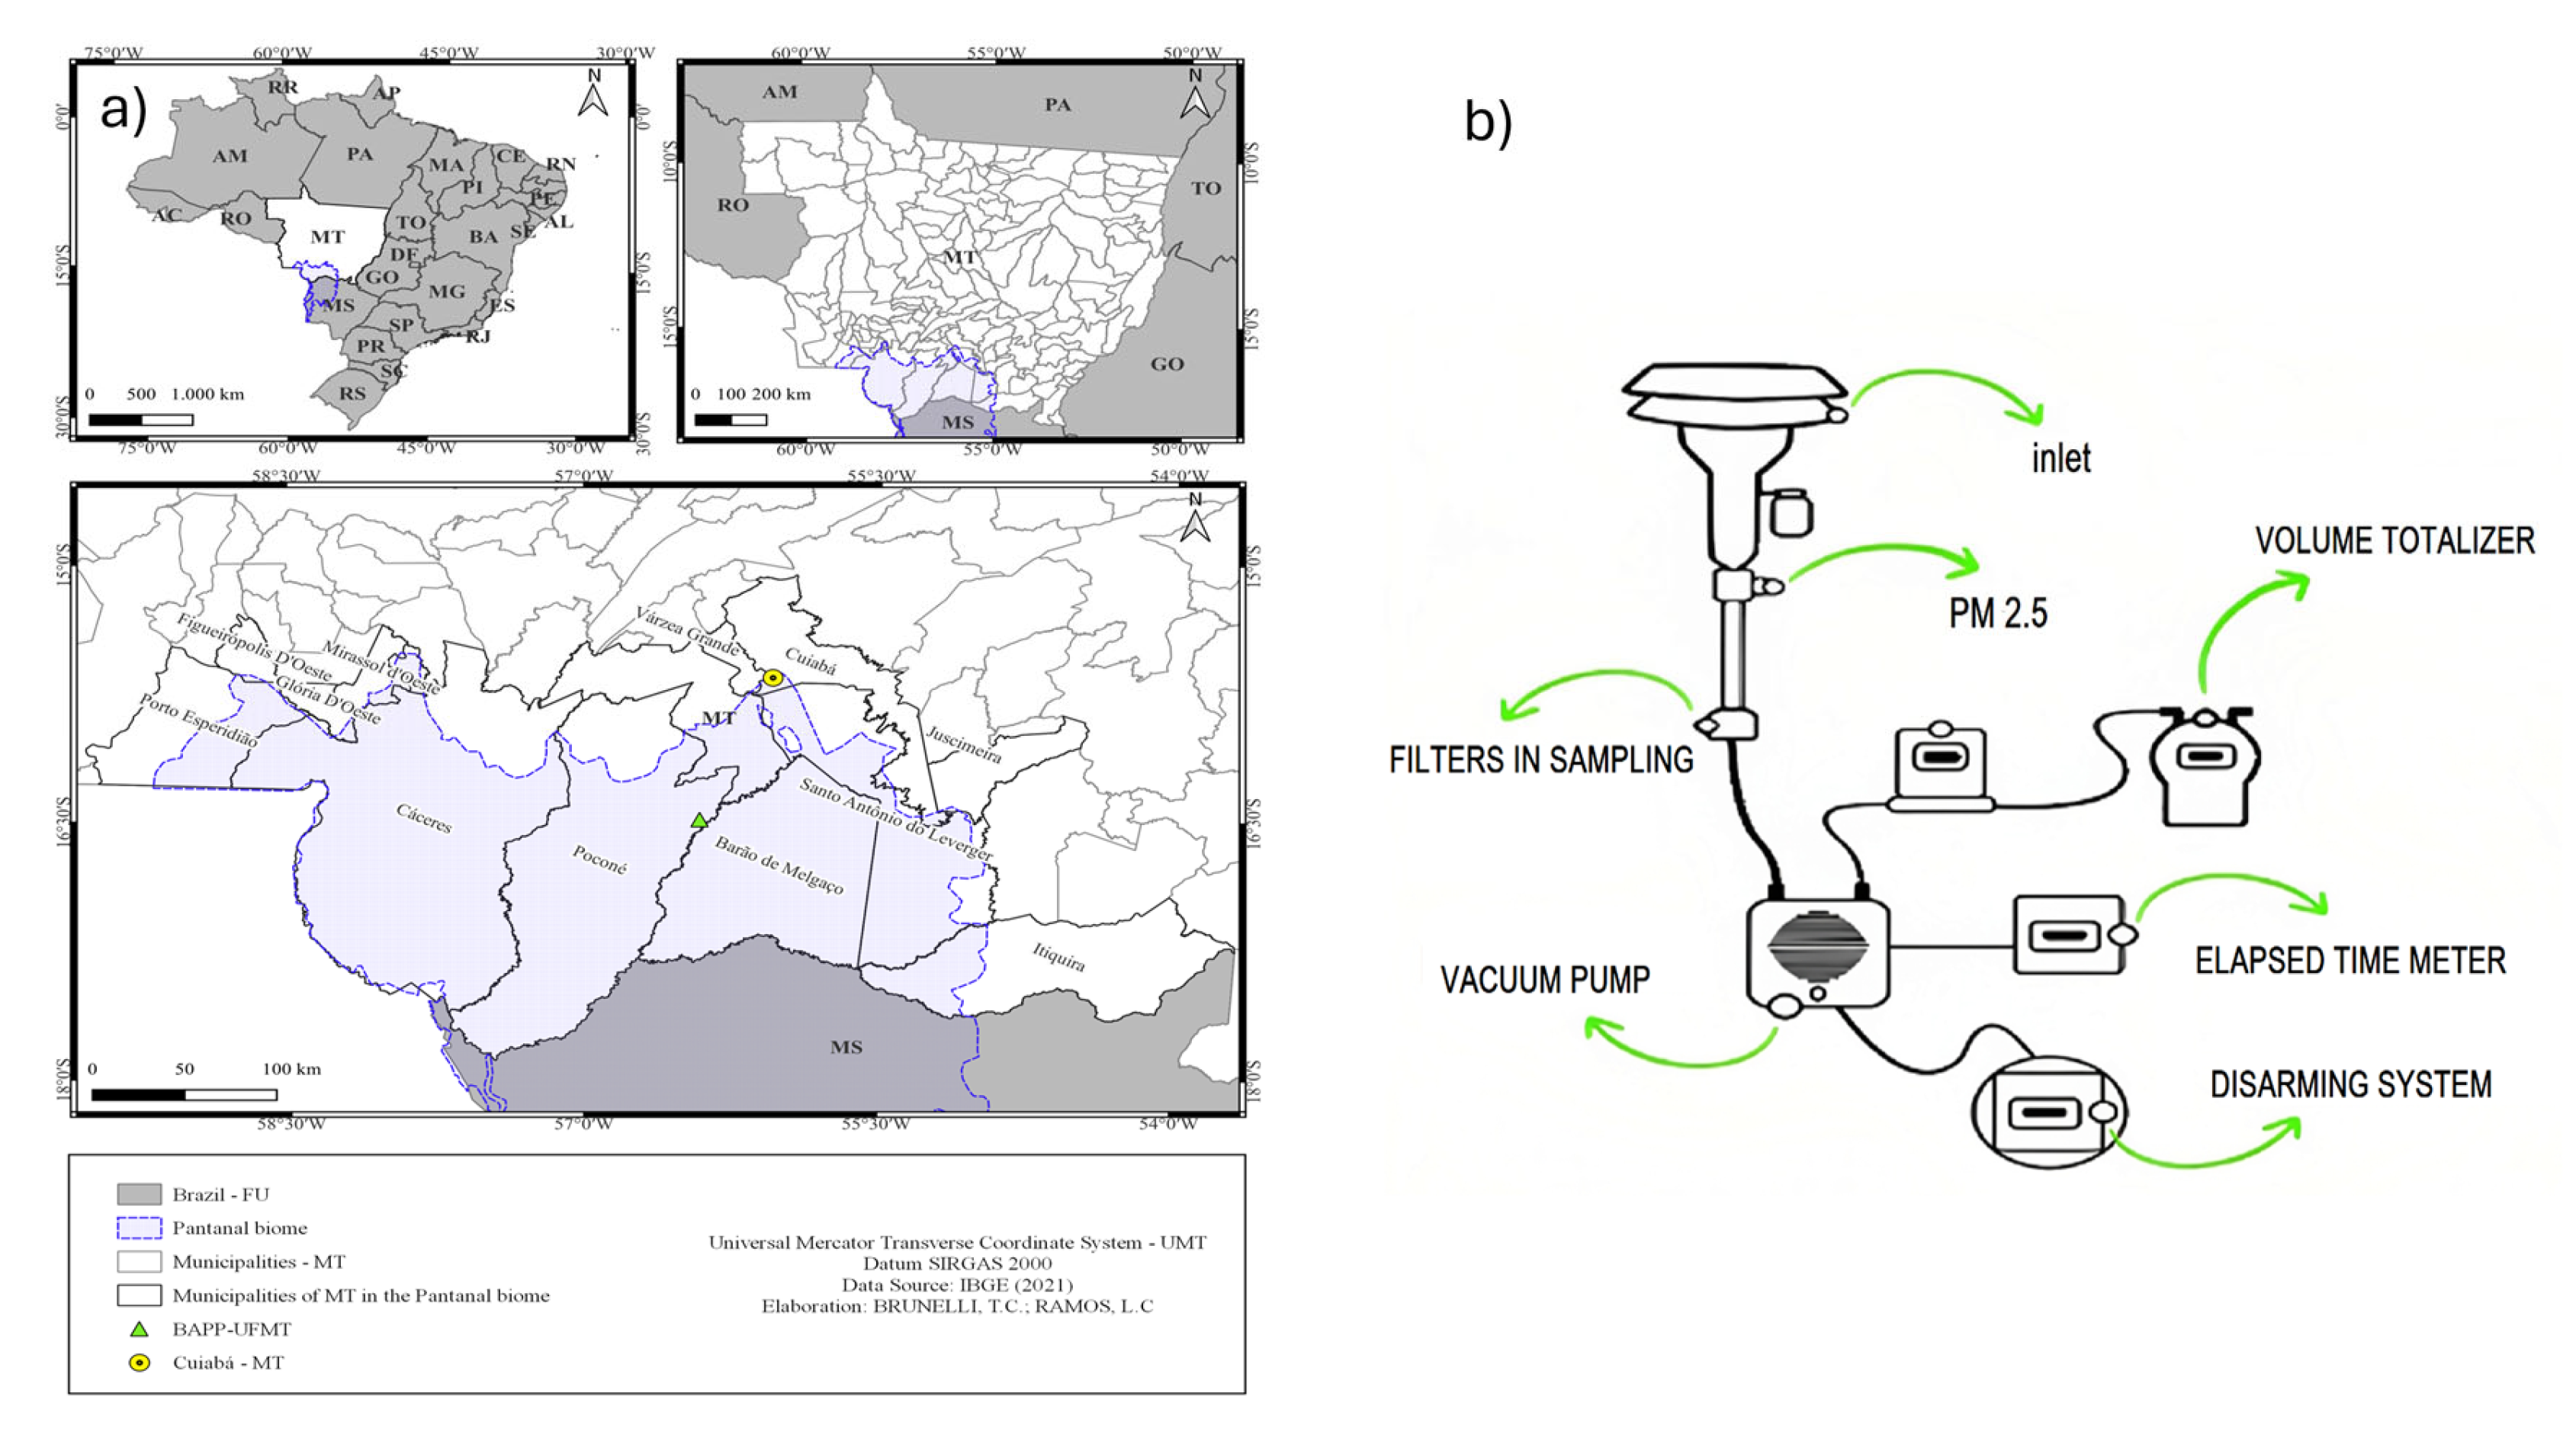
Figure 1. a) Sampling site BAPP, Private Natural Heritage Reserve of SESC Pantanal – Baía das Pedras, state of Mato Grosso, north of Brazilian Pantanal, b) Representative of the sampling system of atmospheric aerosol.
Preprints 111594 g001
Figure 2. Concentration variation of PM2.5, BC, and Dust concentration (μg.m-3) measured in the BAPP, between August and October 2022.
Preprints 111594 g002
Figure 3. a) Relationship between AOD, precipitation, and b) meteorological conditions for the analysis periods.
Preprints 111594 g003
Figure 4. Geographical distribution of fires by period in the municipalities of Mato Grosso in the Pantanal biome between August and October 2022.
Preprints 111594 g004
Figure 5. Roses of wind indicating the mean velocity and direction of the wind thorough the period between August and October 2022 measured at the micrometeorological tower in the BAPP.
Preprints 111594 g005
Figure 6. Variation in the mean concentration of the major elements during the study period.
Preprints 111594 g006
Figure 7. Enrichment factors (Ef) for the PM2.5 fraction. Enrichment factors close to 1 indicate a natural source while enrichment factors > 1 indicate an anthropogenic source.
Preprints 111594 g007
Table 1. Mean concentrations, standard deviations, minimums, and maximums associated with PM2.5, BC, and elemental concentration for the entire study period (PM2.5 and BC are expressed as µg.m-3 and elements expressed as ng.m-3).
Fine particulate matter BAPP Pantanal (Dry season)
Mean σ Min Max
PM 36.62 31.69 7.02 83.66
BC 1.83 1.65 0.37 3.72
Na 94.05 95.33 19.68 279.87
Mg 28.12 27.45 0.86 81.81
Al 167.60 113.47 53.82 377.72
Si 243.52 181.99 71.59 500.15
P 33.54 38.88 5.74 98.82
S 688.32 627.43 200.90 1693.09
Cl 2.19 3.13 0.05 8.55
K 582.71 524.06 106.69 1392.17
Ca 49.07 45.44 11.56 132.15
Ti 18.93 21.01 0.02 53.30
Cr 2.05 1.71 0.42 4.62
Mn 3.86 3.30 0.74 8.65
Fe 238.28 172.63 56.47 582.40
Ni 0.53 0.49 0.11 1.45
Cu 2.65 3.15 0.69 9.16
Zn 7.66 7.22 1.33 22.49
As 0.14 0.10 0.01 0.31
Se 0.12 0.16 0.00 0.45
Br 8.62 7.47 2.36 18.84
Rb 0.98 0.80 0.20 2.53
Sr 2.27 3.96 0.00 11.00
Cd 8.56 8.48 0.85 22.37
Sb 5.47 4.55 1.78 13.39
Pb 4.28 9.16 0.08 24.93
Table 2. Comparison of means and standard deviations of PM2.5 and BC (μg.m-3) for different regions in Brazil.
PM2.5 BC Local Period Reference
3.40±2.00 0.23±0.15 ZF2 Amazon Forest 2008-2012 Artaxo et al. [40]
33.00±36.00 2.80±2.92 PVH Amazon deforested 2009-2012 Artaxo et al. [40]
1.65±0.92 0.09±0.06 ZF2 Amazon Forest 2008 Arana and Artaxo [15]
7.60±3.70 1.20±0.80 Cuiabá 2004 Santanna et al. [34]
26.72±14.20 2.27±1.30 São Paulo 2019 Vieira et al. [29]
8.66±3.14 0.76±0.42 Pantanal 2012 Santos et al. [20]
-- 0.75±0.83 Pantanal 2017-2019 Palácios et al. [22]
36.62±31.69 1.83±1.65 Pantanal 2022 This work
Disclaimer/Publisher’s Note: The statements, opinions and data contained in all publications are solely those of the individual author(s) and contributor(s) and not of MDPI and/or the editor(s). MDPI and/or the editor(s) disclaim responsibility for any injury to people or property resulting from any ideas, methods, instructions or products referred to in the content.
Copyright: This open access article is published under a Creative Commons CC BY 4.0 license, which permit the free download, distribution, and reuse, provided that the author and preprint are cited in any reuse.
Prerpints.org logo

Preprints.org is a free preprint server supported by MDPI in Basel, Switzerland.

Subscribe

© 2024 MDPI (Basel, Switzerland) unless otherwise stated