Submitted:
08 May 2024
Posted:
08 May 2024
You are already at the latest version
Abstract
Keywords:
1. Introduction
2. Materials and Methods
2.1. Compounds analyzed and their solutions
2.2. Thin-layer chromatography
2.3. Spectrodensitometric and densitometric analysis
2.4. LOD calculation
2.5. Statistical calculation
3. Results and Discussion
5. Conclusions
Author Contributions
Funding
Data Availability Statement
Conflicts of Interest
References
- ICH. ICH Harmonised Tripartite Guideline: Validation of Analytical Procedures: Text and Methodology, Q2(R1). 2005. Available online: https://www.ich.org/page/quality-guidelines (accesed on 10 January 2024).
- Boque, R.; Heyden, Y.V. The Limit of Detection. LCGC Europe 2009, 22, 82–85. [Google Scholar]
- Shrivastava, A. Methods for the determination of limit of detection and limit of quantitation of the analytical methods. Chronicles of Young Scientists 2011, 2, 21–25. [Google Scholar] [CrossRef]
- Drug bank online. Available online: https://go.drugbank.com/drugs (accessed on 8 April 2024).
- El Sherbiny, D.; Wahba, M.E.K. Validation of a Micellar Liquid Chromatographic Method for Determination of Caffeine and Non-Steroidal Anti-Inflammatories. J. Chromatogr. Sci. 2014, 52, 806–813. [Google Scholar] [CrossRef] [PubMed]
- Zambakjian, C.; Sakur, A.A. A new gas chromatographic method development and validation for the simultaneous determination of ibuprofen and caffeine in bulk and pharmaceutical dosage form. Future J. Pharm. Sci. 2020, 6, 110. [Google Scholar] [CrossRef]
- Soponar, F.; Staniloae, D.; Moise, G.; Szaniszlo, B.; David, V. Simultaneous determination of paracetamol, propyphenazone and caffeine from pharmaceutical preparations in the presence of related substances using a validated HPLC-DAD method. Rev. Roum. Chim. 2013, 58, 433–440. [Google Scholar]
- Šatínský, D.; Brabcová, I.; Maroušková, A.; Chocholouš, P.; Solich, P. Green chromatography separation of analytes of greatly differing properties using a polyethylene glycol stationary phase and a low-toxic water-based mobile phase. Anal. Bioanal. Chem. 2013, 405, 6105–6115. [Google Scholar] [CrossRef] [PubMed]
- Mladenov, K.; Sunarić, S. Caffeine in hair care and anticellulite cosmetics: sample preparation. Solid-phase extraction and HPLC determination. J. Cosmet. Sci. 2020, 71, 251–262. [Google Scholar] [PubMed]
- Sonone, R.; Tandel, L.; Jain, V. Novel rapid isocratic RP-HPLC method for simultaneous estimation of phenylephrine hydrochloride, paracetamol, caffeine, diphenhydramine dydrochloride. Current Pharm. Anal. 2021, 17, 792–800. [Google Scholar] [CrossRef]
- Ismail, A.; Gamal, M.; Nasr, M. Optimization of analytical method fro simultaneous determination of acetaminophen, caffeine, and aspirin in tablet dosage form. Pharm. Chem. J. 2023, 56, 1682–1688. [Google Scholar] [CrossRef]
- Oliphanta, E.; Purohitb, T.J.; Alsweiler, J.M.; McKinlayc, C.J.D.; Hanning, S.M. Validation and application of a simple and rapid stability-indicating liquid chromatographic assay for the quantification of caffeine from human saliva. J. Liq. Chromatogr. Rel. Technol. 2022, 45, 10–17. [Google Scholar] [CrossRef]
- Dongala, T.; Katari, N.K.; Palakurthi, A.K.; Jonnalagadda, S.B. Development and validation of a generic RP-HPLC PDA method for the simultaneous separation and quantification of active ingredients in cold and cough medicines. Biomed. Chromatogr. 2019, 33, e4641. [Google Scholar] [CrossRef] [PubMed]
- El-Ragehy, N.A.; Ramadan, N.K.; Ragab, M.T.; El-Zeany, B.A. RP-HPLC Method for the simultaneous determination of a quaternary mixture of propyphenazone, flavoxate HCl and two of their official impurities with dissolution profiling of their tablets. J. AOAC Int. 2020, 103, 958–965. [Google Scholar] [CrossRef]
- Golubitskiia, G.B.; Ivanov, V.M. Quantitative analysis of some pharmaceuticals by the HPLC method. Moscow University Chem. Bull. 2009, 64, 210–213. [Google Scholar] [CrossRef]
- Delvadiya, K.; Kabra, P.; Kimbahune, R.; Patel, N.; Nargund, L.V.G. High-performance liquid chromatographic determination of paracetamol, propyphenazone, and caffeine in pharmaceutical formulations. Indian J. Pharm. Educ. Res. 2013, 47, 65–72. [Google Scholar] [CrossRef]
- Ren, H.; Chen, Y.; Wang, H.; Liu, M.; Ji, L. Simultaneous determination of caffeine. Taurine and five water-soluble vitamins in tobacco products by HPLC–MS/MS. Chromatographia 2019, 82, 1665–1675. [Google Scholar] [CrossRef]
- Wang, A.; Sun, J.; Feng, H.; Gao, S.; He, Z. Simultaneous determination of paracetamol and caffeine in human plasma by LC–ESI–M. Chromatographia 2008, 67, 281–285. [Google Scholar] [CrossRef]
- Choi, E.J.; Bae, S.H.; Park, J.B.; Kwon, M.J.; Jang, S.M.; Zheng, Y.F.; Lee, Y.S.; Lee, S.J.; Bae, S.K. Simultaneous quantification of caffeine and its three primary metabolites in rat plasma by liquid chromatography–tandem mass spectrometry. Food Chem. 2013, 141, 2735–2742. [Google Scholar] [CrossRef]
- Onn Kit Loh, G.; Yii Ling Wong, E.; Goh, C.Z.; Tze Fung Tan, Y.; Lee, Y.L.; Pang, L.H.; Shahridzo, S.H.; Damenthi, N.; Hermansyah, A.; Long, C.M.; Peh, K.K. Simultaneous determination of tramadol and paracetamol in human plasma using LC-MS/MS and application in bioequivalence study of fixed-dose combination. Ann. Med. 2023, 55, 2270502. [Google Scholar] [CrossRef]
- Boltia, A.; Soudi, A.T.; Elzanfaly, L.S.; Zaazaa, H.E. Development and validation of chromatographic methods for simultaneous determination of paracetamol, orphenadrine citrate and caffeine in presence of p-aminophenol; quantification of p-aminophenol nephrotoxic impurity using LC–MS/MS. J. Chromatogr. Sci. 2020, 58, 223–233. [Google Scholar] [CrossRef]
- Fekry, R.A.; Kelani, K.M.; Fayez, Y.M.; Tantawy, M.A. Comparative validated chromatographic methods for the simultaneous determination of caffeine, codeine, paracetamol along with the related compound "p-aminophenol" in tablets. J. Planar Chromatogr. – Modern TLC 2022, 35, 51–59. [Google Scholar] [CrossRef]
- Ibrahim, H.; Hamdy, A.M.; Merey, H.A.; Saad, A.S. Simultaneous determination of paracetamol, propyphenazone and caffeine in presence of paracetamol impurities using dual-mode gradient HPLC and TLC densitometry methods. J. Chromatogr. Sci. 2021, 59, 140–147. [Google Scholar] [CrossRef] [PubMed]
- Alam, P.; Shakeel, F.; Ali, A.; Alqarni, M.H.; Foudah, A.I.; Aljarba, T.M.; Alkholifi, F.K.; Alshehri, S.; Ghoneim, M.M.; Ali, A. Simultaneous determination of caffeine and paracetamol in commercial formulations using greener normal-phase and reversed-phase HPTLC methods: A contrast of validation parameters. Molecules 2022, 27, 405. [Google Scholar] [CrossRef]
- Pyka-Pająk, A. Determination of the active pharmaceutical ingredients in Saridon tablets using an economical and sensitive thin layer chromatography method combined with densitometry. Analytica 2024, 5, 1–16. [Google Scholar] [CrossRef]
- Ferchiou, R.; Soussi, M.A.; Ghedira, D.; Ferchiou, D.; Douki, W.; Najjar, M.F. Development and validation of a simple thin-layer chromatography–smartphone method for plasma paracetamol quantification. J. Planar Chromatogr. – Modern TLC 2023, 36, 251–256. [Google Scholar] [CrossRef]
- Foudah, A.I.; Shakeel, F.; Alqarni, M.H.; Aljarba, T.M.; Alshehri, S.; Alam, P. Simultaneous detection of chlorzoxazone and paracetamol using a greener reverse-phase HPTLC-UV method. Separations 2022, 9, 300. [Google Scholar] [CrossRef]
- Wahyuningsih, E.; Isnaeni. Identification of paracetamol and caffeine in jamu powders simultaneously using TLC-densitometry. Berkala Ilmiah Kimia Farmasi, 2023, 10, 18–22. [Google Scholar] [CrossRef]
- Gupta, M.K.; Ghuge, A.; Parab, M.; Al-Refaei, Y.; Khandare, A.; Dand, N.; Waghmare, N. A comparative review on High-Performance Liquid Chromatography (HPLC), Ultra Performance Liquid Chromatography (UPLC) & High-Performance Thin Layer Chromatography (HPTLC) with current updates. Curr. Issues Pharm. Med. Sci. 2022, 35, 224–228. [Google Scholar] [CrossRef]
- Farid, N.F.; Naguib, I.A.; Abdelhamid, N.S.; Anwar, B.H.; Magdy, M.A. Validated ecofriendly chromatographic method for quantitative determination of anti-migraine quaternary mixture. Separation Sci. 2020, 43, 2330–2337. [Google Scholar] [CrossRef]
- Ragab, M.T.; Ramadan, N.K.; El-Ragehy, N.A.; El-Zeany, B.A. Thin layer chromatography‒spectrodensitometric determination of a three-component mixture of propyphenazone, caffeine, ergotamine tartrate, and two of their impurities with application to tablets, spiked human plasma, and green profile assessment. J. Planar Chromatogr. – Modern TLC 2023, 36, 295–305. [Google Scholar] [CrossRef]
- Silva, W.P.; Silva, L.A.J.; França, C.H.; Sousa, R.M.F.; Muñoz, R.A.A.; Richter, E.M. Square-wave voltammetric determination of propyphenazone, paracetamol, and caffeine: comparative study between batch injection analysis and conventional electrochemical systems volume. Electroanalysis 2017, 29, 1860–1866. [Google Scholar] [CrossRef]
- Gergov, G.; Alin, A.; Katsarov, P.; Simeonov, V.; Yankov, D.; Al-Degs, Y. Net analyte signal-based methods for the simultaneous determination of paracetamol. propyphenazone and caffeine by UV spectrophotometry. Bulgarian Chem. Commun. 2018, 50, 265–273. [Google Scholar]
- Ozgur, M.U.; Alpdogan, G.; Asci, B. A Rapid spectrophotometric method to resolve ternary mixtures of propyphenazone, caffeine, and acetaminophen in tablets. Monatshefte für Chemie 2002, 133, 219–223. [Google Scholar] [CrossRef]
| Symbol | System | Composition | Volumetric ratio |
| A | normal phase system (NP) | acetone – chloroform - ammonia | 10:40:0.5 |
| B | n-hexane – acetone - ammonia | 25:25:0.5 | |
| C | chloroform – toluene – ethylene acetate – methanol – 80% acetic acid | 18:18:7.5:6:0.3 | |
| D | reversed phase system (RP) | methanol - water | 25:25 |
| E | methanol - water | 30:20 | |
| F | methanol - water | 40:10 |
| Mobile phase | Technique | Chromatographic plates |
LOD of caffeine [µg/spot] |
RF | LOD of propyphenazone [µg/spot] |
RF | LOD of paracetamol [µg/spot] |
RF |
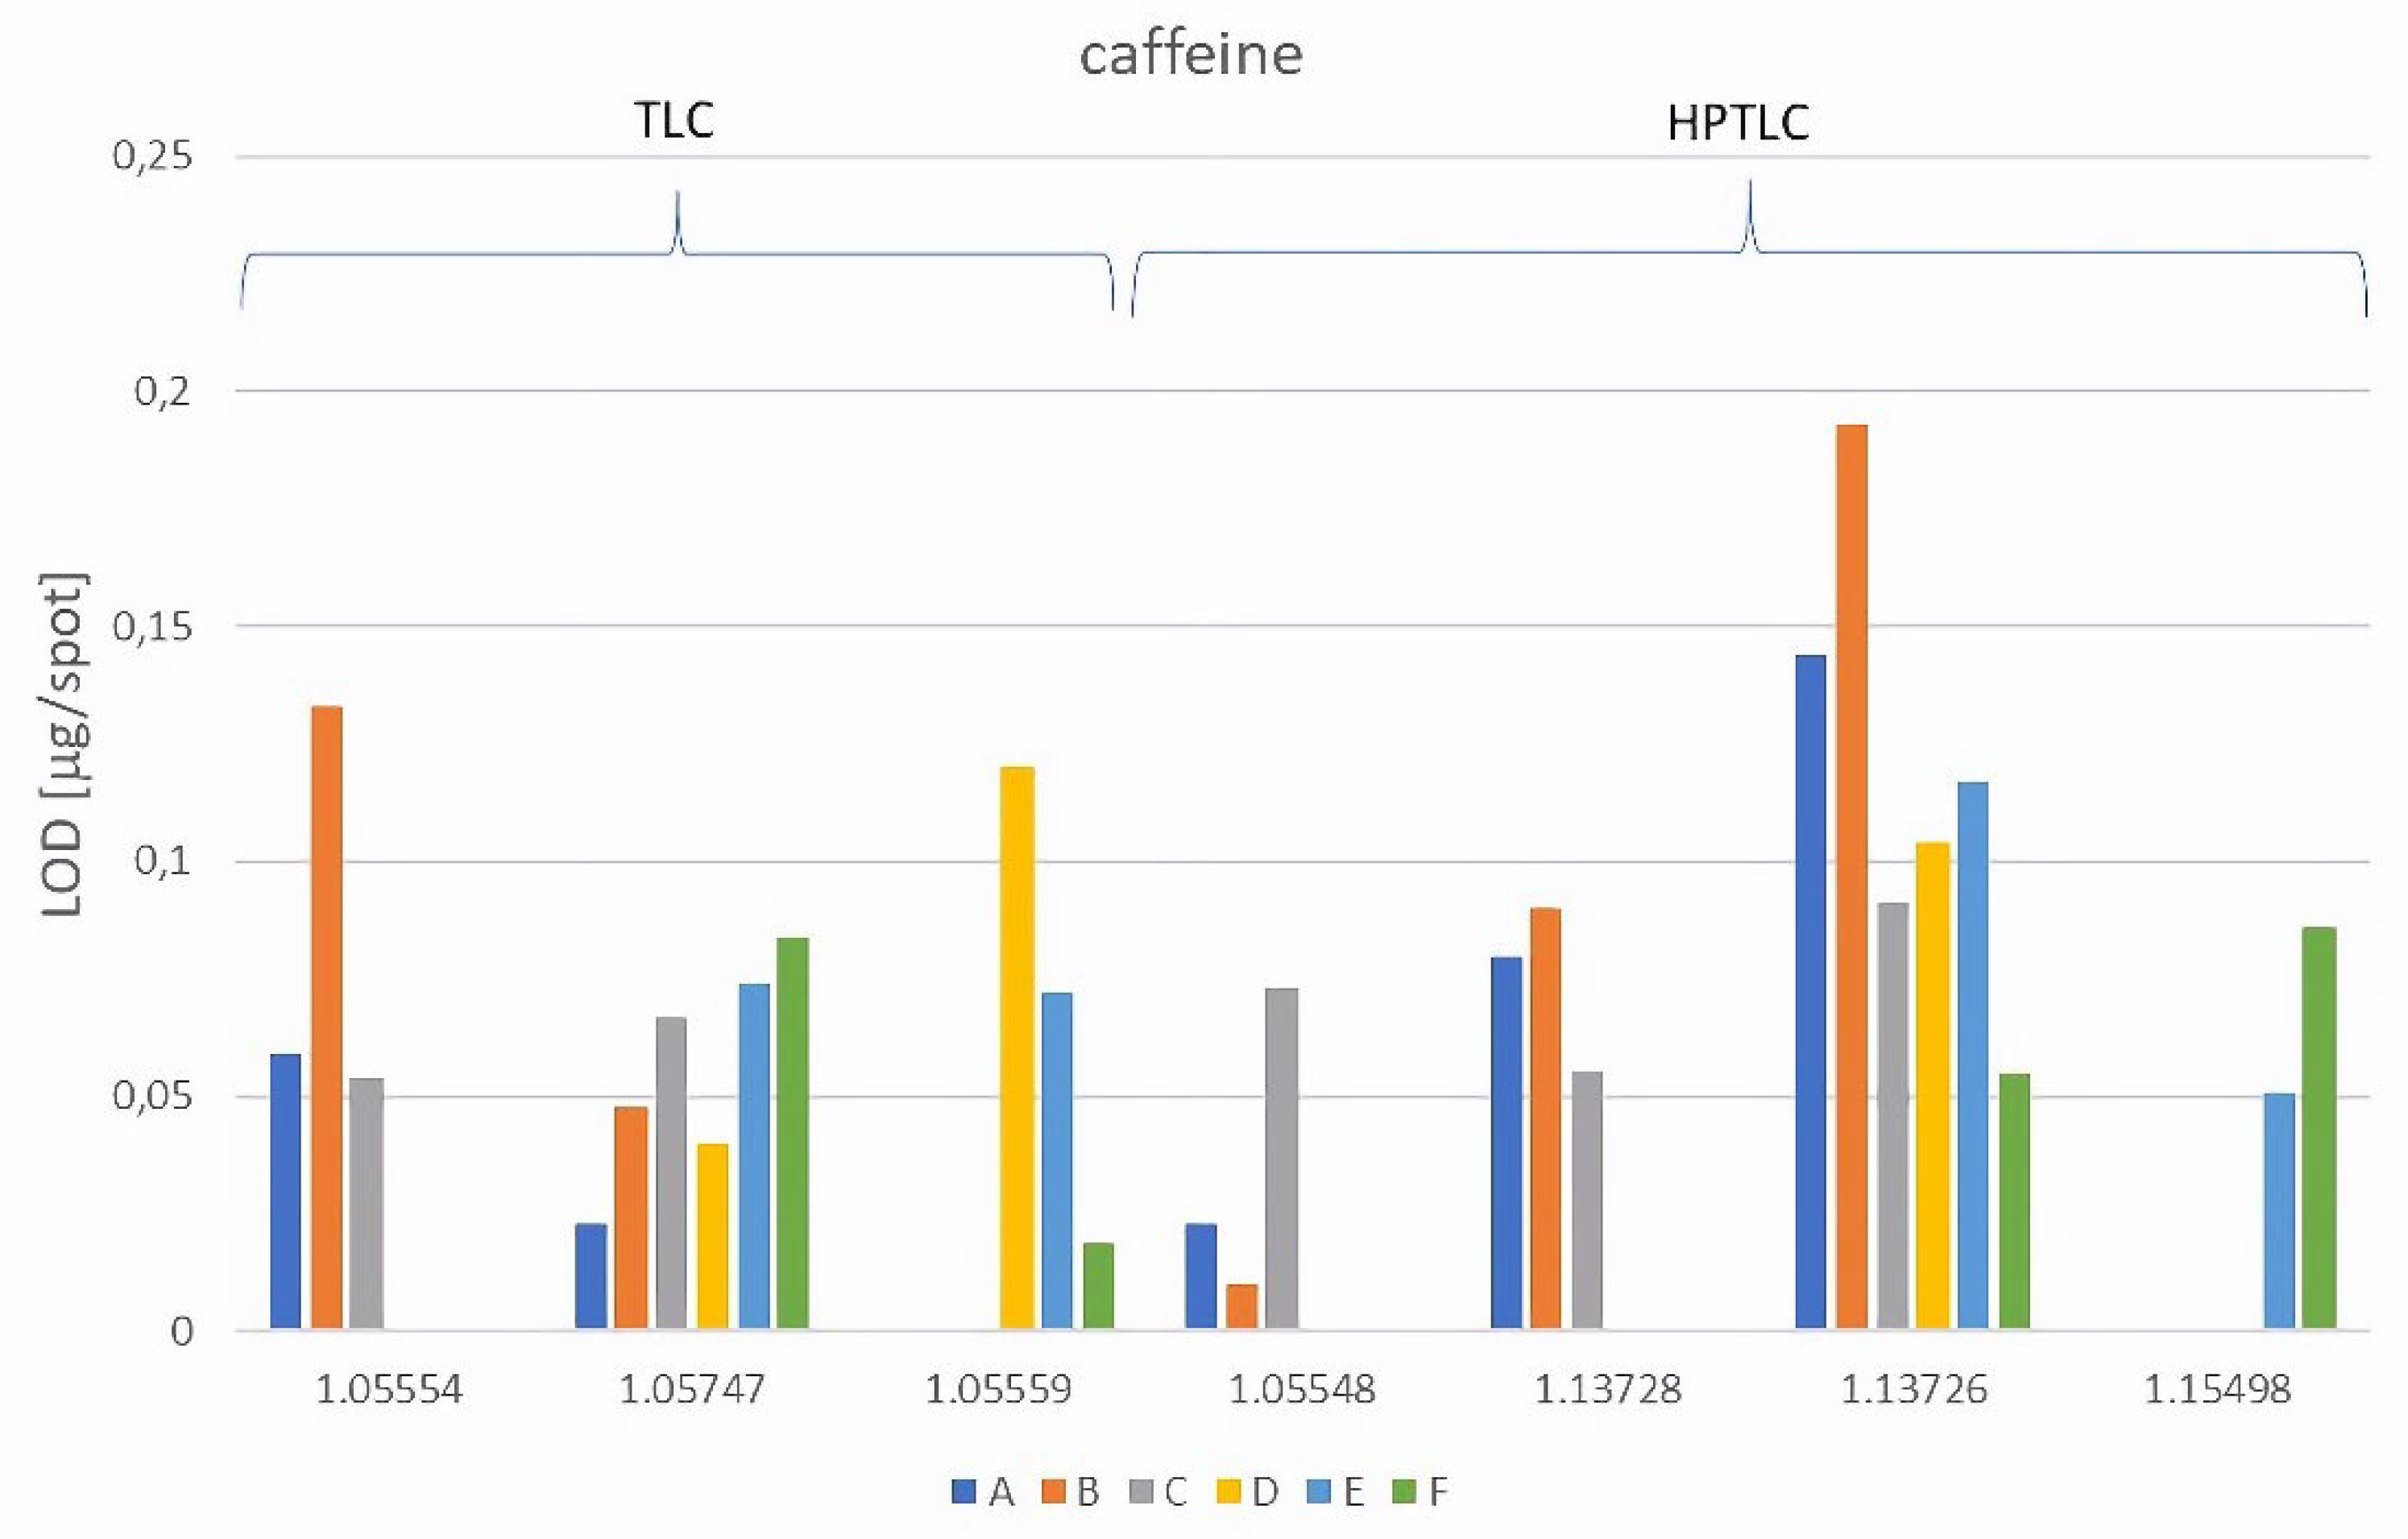
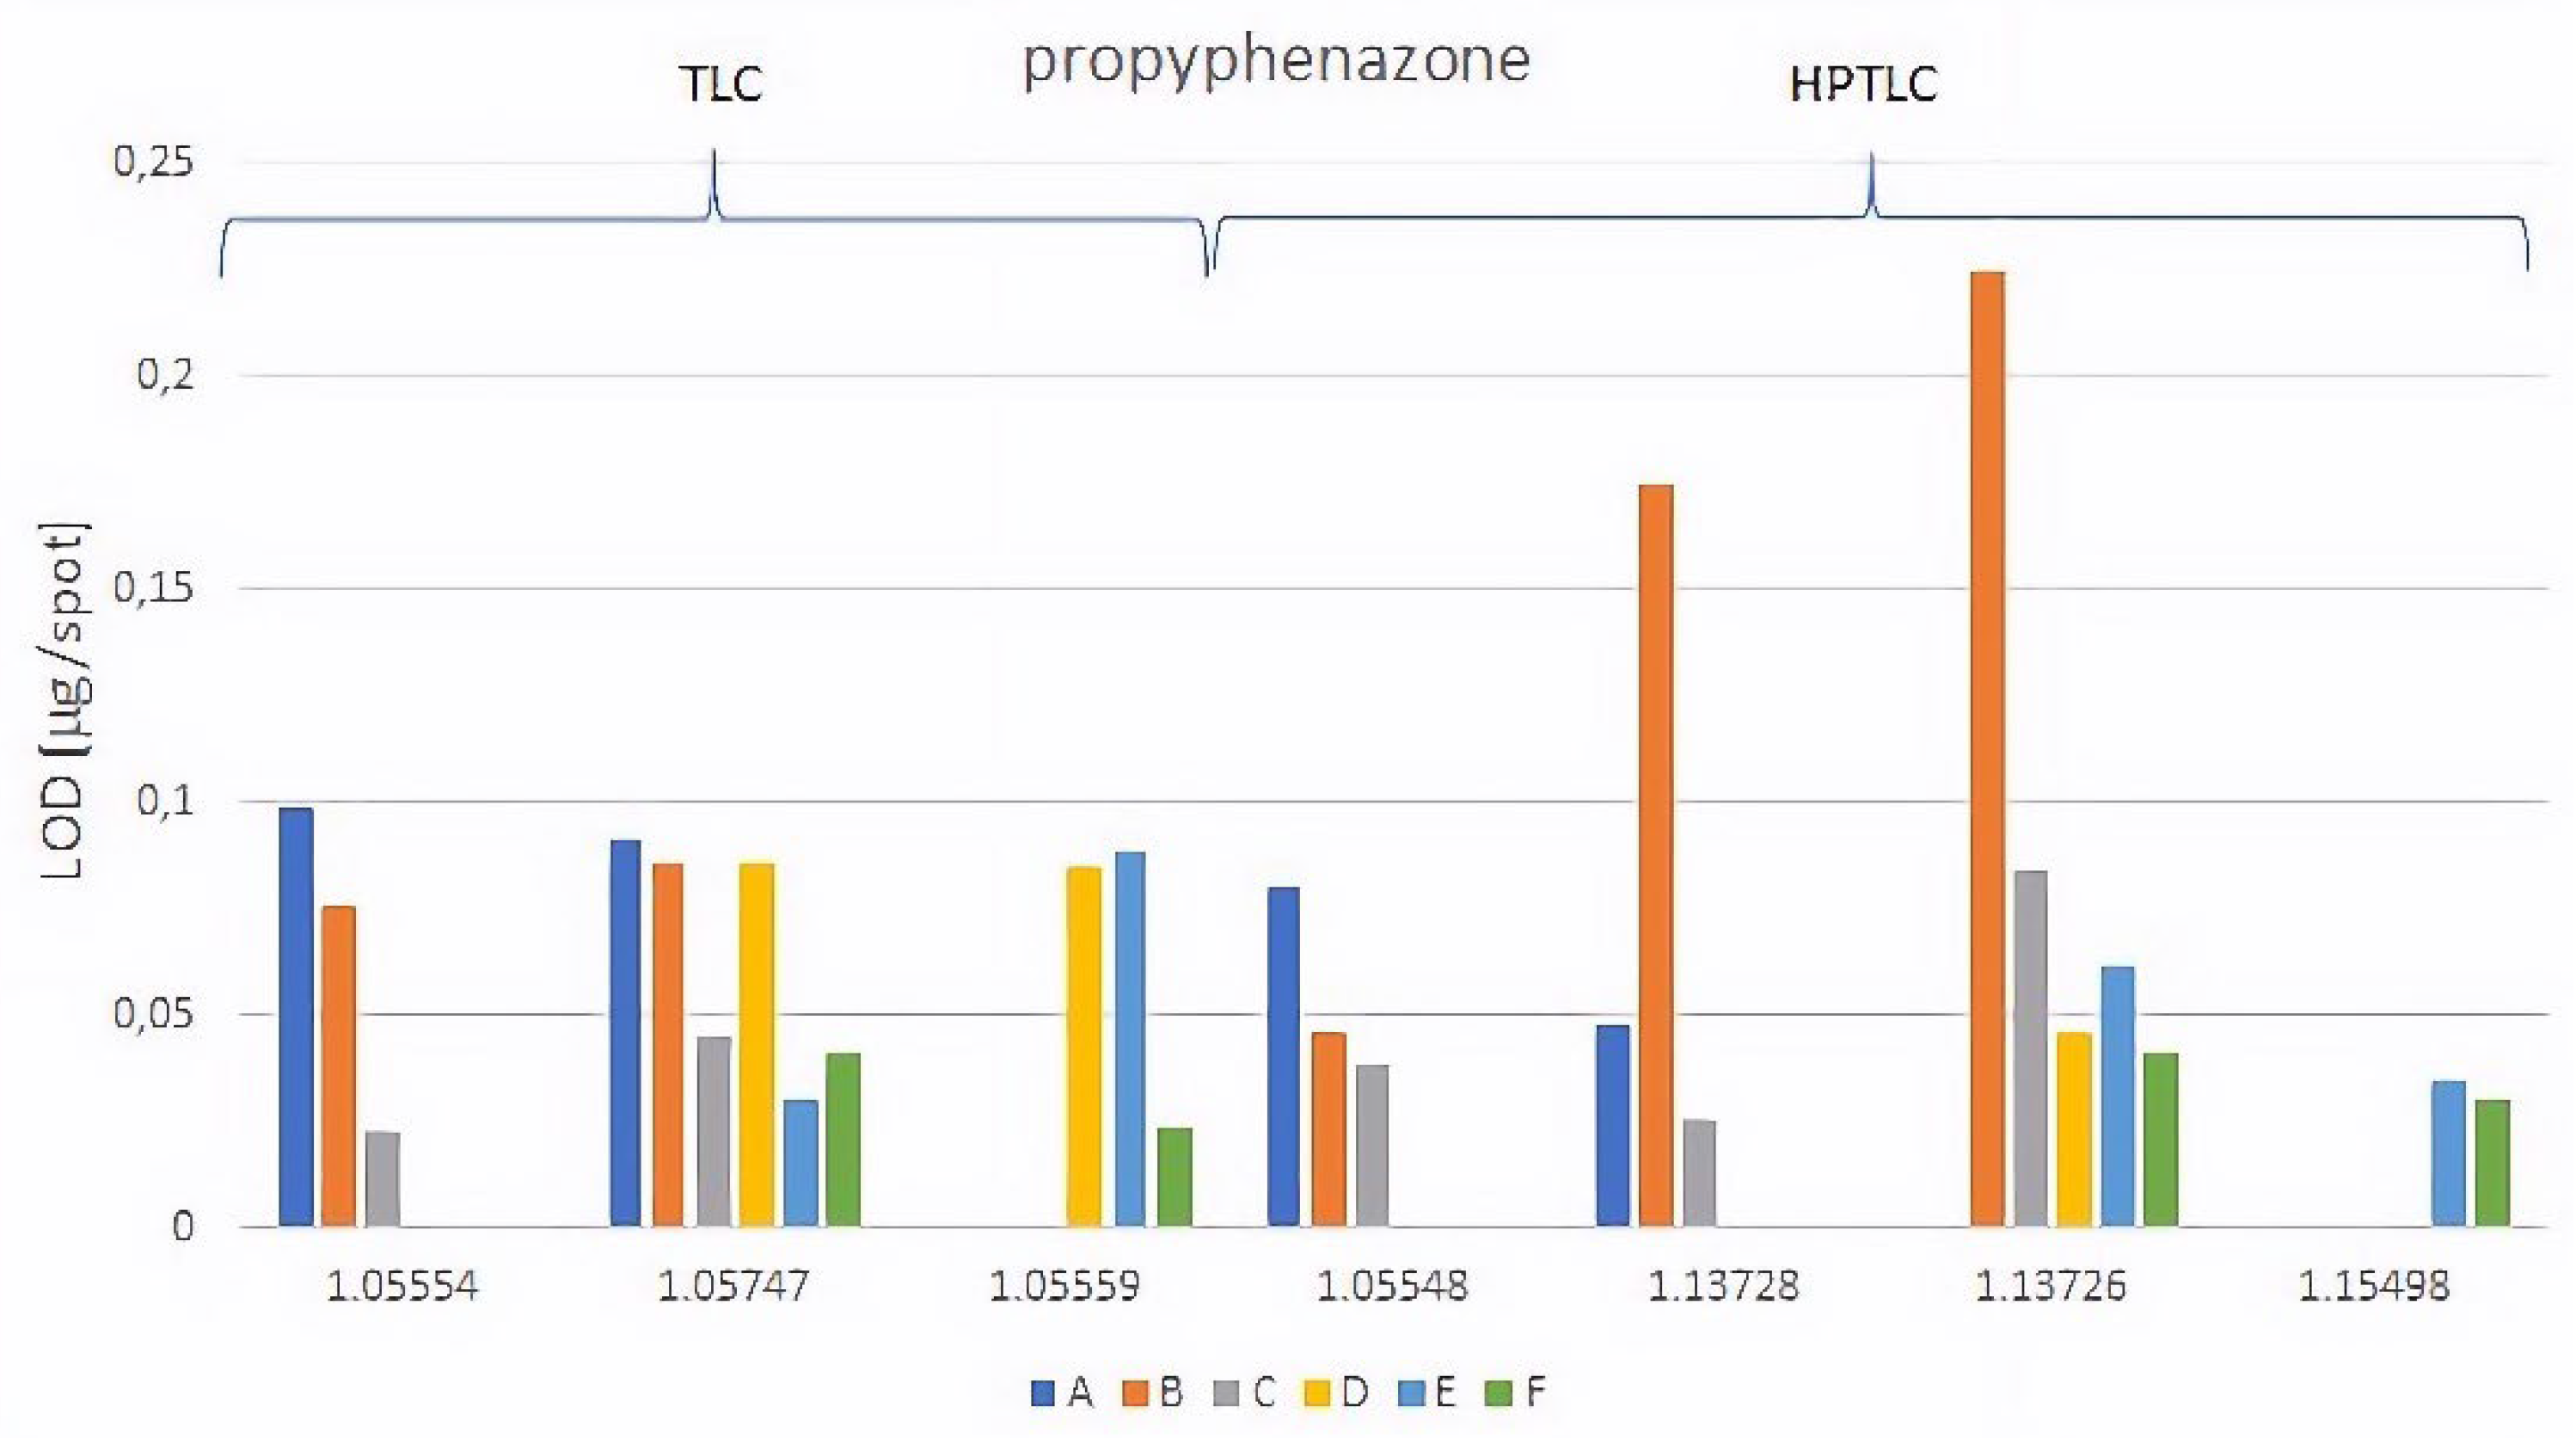
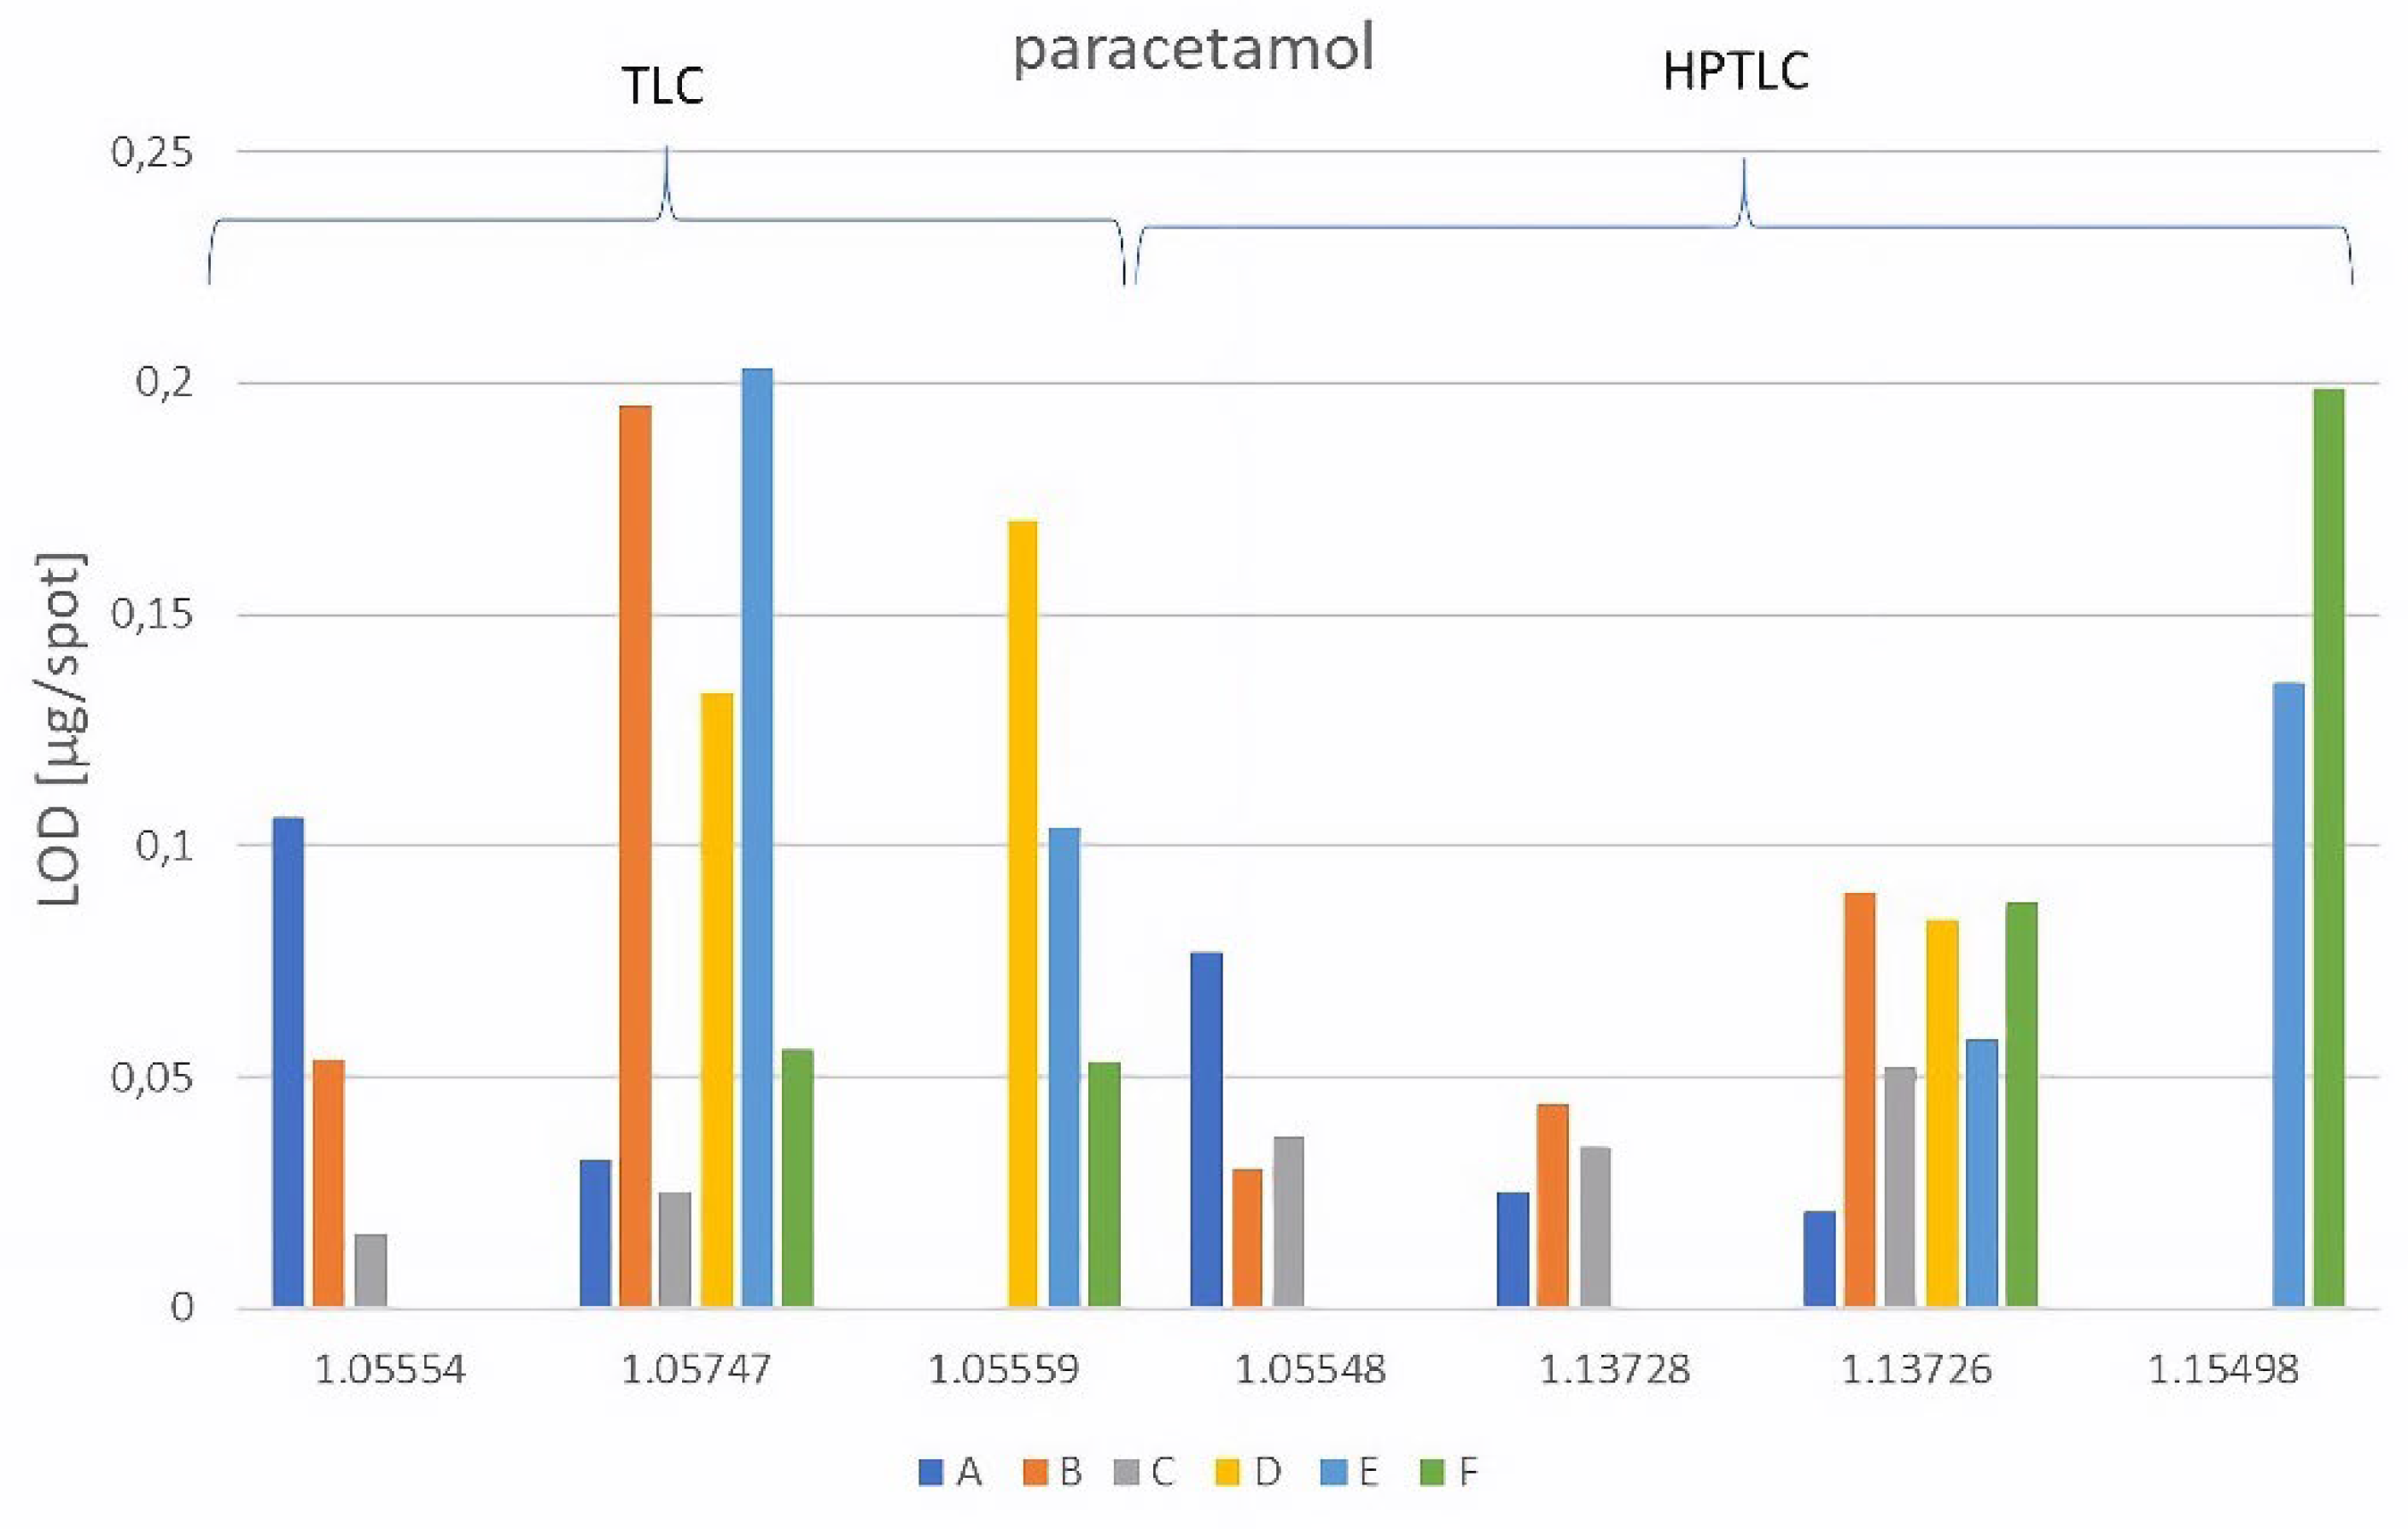
| A | NP-TLC | 1.05554 | 0.059 | 0.12 | 0.099 | 0.73 | 0.106 | 0.13 |
| 1.05747 | 0.023 | 0.76 | 0.091 | 0.83 | 0.032 | 0.66 | ||
| NP-HPTLC | 1.05548 | 0.023 | 0.16 | 0.091 | 0.84 | 0.077 | 0.16 | |
| 1.13728 | 0.080 | 0.34 | 0.048 | 0.86 | 0.016 | 0.17 | ||
| 1.13726 | 0.144 | 0.52 | - | - | 0.021 | 0.73 | ||
| B | NP-TLC | 1.05554 | 0.133 | 0.15 | 0.076 | 0.83 | 0.054 | 0.25 |
| 1.05747 | 0.048 | 0.77 | 0.086 | 0.89 | 0.195 | 0.86 | ||
| NP-HPTLC | 1.05548 | 0.010 | 0.38 | 0.046 | 0.75 | 0.030 | 0.57 | |
| 1.13728 | 0.090 | 0.39 | 0.175 | 0.79 | 0.025 | 0.40 | ||
| 1.13726 | 0.193 | 0.89 | 0.247 | 0.94 | 0.090 | 0.77 | ||
| C | NP-TLC | 1.05554 | 0.054 | 0.47 | 0.029 | 0.60 | 0.016 | 0.38 |
| 1.05747 | 0.067 | 0.76 | 0.045 | 0.86 | 0.025 | 0.72 | ||
| NP-HPTLC | 1.05548 | 0.073 | 0.55 | 0.039 | 0.72 | 0.037 | 0.42 | |
| 1.13728 | 0.057 | 0.52 | 0.026 | 0.70 | 0.035 | 0.39 | ||
| 1.13726 | 0.091 | 0.92 | 0.084 | 0.98 | 0.052 | 0.84 |
| Mobile phase | Ttechnique | Chromatographic plates | LOD of caffeine [µg/spot] |
RF | LOD of propyphenazone [µg/spot] |
RF | LOD of paracetamol [µg/spot] |
RF |
| D | RP-TLC | 1.05747 | 0.040 | 0.52 | 0.086 | 0.19 | 0.133 | 0.65 |
| 1.05559 | 0.120 | 0.20 | 0.085 | 0.06 | 0.170 | 0.55 | ||
| RP-HPTLC | 1.13726 | 0.104 | 0.48 | 0.046 | 0.15 | 0.084 | 0.57 | |
| 1.15498 | - | - | - | - | - | - | ||
| E | RP-TLC | 1.05747 | 0.074 | 0.60 | 0.030 | 0.39 | 0.203 | 0.85 |
| 1.05559 | 0.072 | 0.32 | 0.089 | 0.13 | 0.104 | 0.65 | ||
| RP-HPTLC | 1.13726 | 0.117 | 0.62 | 0.062 | 0.36 | 0.058 | 0.70 | |
| 1.15498 | 0.051 | 0.21 | 0.035 | 0.10 | 0.135 | 0.48 | ||
| F | RP-TLC | 1.05747 | 0.084 | 0.75 | 0.041 | 0.61 | 0.056 | 0.85 |
| 1.05559 | 0.019 | 0.51 | 0.024 | 0.47 | 0.053 | 0.74 | ||
| RP-HPTLC | 1.13726 | 0.055 | 0.71 | 0.041 | 0.70 | 0.088 | 0.79 | |
| 1.15498 | 0.086 | 0.62 | 0.030 | 0.60 | 0.199 | 0.91 |
|
Technique |
Caffeine | Propyphenazone | Paracetamol |
| Range of LOD [µg/spot] | |||
| NP-TLC | 0.023÷0.133 | 0.029÷0.091 | 0.016÷0.195 |
| NP- HPTLC | 0.010÷0.193 | 0.026÷0.247 | 0.016÷0.052 |
| RP-TLC | 0.019÷0.120 | 0.024÷0.089 | 0.053÷0.203 |
| RP-HPTLC | 0.051÷0.117 | 0.030÷0.062 | 0.084÷0.199 |
| Plate | Symbol of mobile phase | |||||
| A | B | C | D | E | F | |
| 1.05554 | propyphenazone paracetamol |
|||||
| 1.05747 | caffeine paracetamol |
caffeine | propyphenazone paracetamol |
caffeine | propyphenazone | propyphenazone |
| 1.05559 | caffeine propyphenazone |
|||||
| 1.05548 | caffeine propyphenazone paracetamol |
propyphenazone paracetamol |
||||
| 1.13728 | propyphenazone paracetamol |
paracetamol |
propyphenazone paracetamol |
|||
| 1.13726 | paracetamol |
propyphenazone | propyphenazone | |||
| 1.15498 | propyphenazone | propyphenazone | ||||
Disclaimer/Publisher’s Note: The statements, opinions and data contained in all publications are solely those of the individual author(s) and contributor(s) and not of MDPI and/or the editor(s). MDPI and/or the editor(s) disclaim responsibility for any injury to people or property resulting from any ideas, methods, instructions or products referred to in the content. |
© 2024 by the authors. Licensee MDPI, Basel, Switzerland. This article is an open access article distributed under the terms and conditions of the Creative Commons Attribution (CC BY) license (http://creativecommons.org/licenses/by/4.0/).


