Preprint
Review

Review on the Axial Hydrokinetic Turbines. Field of Application and Efficiency Enhancement Methods

Altmetrics

Downloads

115

Views

95

Comments

0

Submitted:

08 May 2024

Posted:

08 May 2024

You are already at the latest version

Alerts
Abstract
Along with the increasing industrialization of contries and population growth, the global. With the thougth of overcoming climate change and renducing greenhouse gas emissions in the atmosphere, interest in alternative sloar, wind, water, geothermal, tidal and ocean wave energy has significantly increased. Hydropower is one of the most used inexhaustible sources of energy on a global scale. The efficiency of water turbines can be increased by optimizing the blade cascade and the casing. For this purpose, research is conducted on specialized laboratory benches. The purpose is to determine the influencing parameters which affecting the nature of the power and cavitaion curves This paper presents the results of numerical and laboratoty studies of axial hydrokinetic turbines. A detailed analysis of the influence of the geometric parameters of the blades on the operating curves is made. A mathematica model for synthesis of the blade cascade is derived. An assessment of water energy soures has been made and sites of high energy potential have been pointed. The present material can be used for development of a methodology for calculation of efficient axial hydrokinetic turbines.
Keywords: 
Subject: Engineering  -   Other

1. Introduction

The depletion of fossil fuels on a global scale and the processing of fosil fuels (heavy oils, coal, petroleum, etc.) releases environmentally harmful gas emissions (so called Greenhouse Gases which include but are not limite to Carbon dioxide – CO2, Methane – CH4, Nitrous Oxide – N2O. and etc.) [1] are the main motives for the search of new energy sources. These Greenhouse gases absorb the heat from the Earth’s surface and prevent its release into outer space. Most of the Greenhouse gases occurre naturally in the atmosphere, but human activities, especially during the Industrial Revolution, have contributed significantly to their accumulation. As a result, the Greenhouse effect raises the average temperatures and the climate of our planet is changing at alarming rates. This could cause extreme weather events, increased spreading of disieases and sea levels rising due to the ice caps melting.
In recent years, renewable energy a.k.a. Green energy gains popularity. The benefits of Green energy include inexhaustible supply, power independence, carbon-free energy production and an overall cleaner and healthier environment. Additionally, it helps to diversify the energy supply and reduces the dependence on imported fuels. The five major Green energy sources are: sun, wind, flowing water, biomass from plants, and geothermal energy. Solar power is among the cleanest energy sources and it has no harmful products produced in the process of electricity generation, but it’s still expensive compared to other methods of energy production because of it’s low power density and additionally the photovoltaic effect has an overall low efficiency when transforming the solar energy into electrical energy. Futhermore, solar power systems are not a constant source of energy and has a very variable energy production even during the daylight hours of the day. Wind energy is harnessed with wind turbines. They are installed in windy regions with an open farfield such as: offshore lines, hills, plains, and so on. Wind turbines can generate more electricity than solar panels. However, wind power energy generation is even more difficult to predict than solar, since wind often changes its speed and direction and in some cases it is absent and there is no generation at all.
When it comes to water, the energy generation is more consistant and predictable. Rivers normally have a steady flow, ensuring enough and constant supply of kinetic energy. Given that the density of water is almost а thousand times that of air, the same same power can be extracted from a water fluid flow with 1m/s of average velocity, compared to an air fluid flow with a 10m/s average velocity. Such winds are rare and can occur for a short period of time in certian locations, while stream velocity in most of the rivers vary from 0.5 to 1.1 m/s [1,2,3]. Water kinetic energy is harnessed with so called hydrokinetic turbines, which work on the same principles as wind turbines. Both types of turbines are calculated according to the same theory, which allows the combining of the developed methods that increase their efficiency. The content of the article is focused on axial kinetic turbines, as the reports show that they have higher efficiency, better starting capabilities, and lower cut-in speed, compared to the vertical hydrokinetic turbines [4,5,6,7,8,9,10,11,12].
Axial kinetic turbines are widely used in hydropower due to their simple, easy to maintain design and high efficiency. The design of the runner resembles that of a propeller turbine. It consists most often of two or three spanwise twisted blades with a variable cross section. The choice of generator is easy, since axial kinetic turbines works with high rotational speeds and low torque. Unlike reaction turbines, they are intended to generate electricity mainly from the kinetic energy of the stream. This makes them suitable for flows with no potential energy, such as ocean currents, rivers, tidal waters and man-made channels. The main advantage of the kinetic systems is that they don’t require installation of penstocks or powerhouses. In addition, they have almost negligible environmental impact.
According to the data from the reviewed literature, the global potential of the ocean currents ranges from 5000 GW (43.800 TWh/yr) to 450 GW (3932 TWh/yr [13]). However, harvesting of the kinetic stream energy is beneficial only at sites with flow velocities in the range of 2-2.5 m/s and water depths between 5 m and 25 m [13], as most of the hydrokinetic turbines generates maximum power at flow velocities at around 2.5 - 3m/s [7,8,9,10]. This requirments are met in limited number of sites in Russia, Australia, France, India, South Korea, New Zeland, Argentina, USA, China, Canada, and UK [13]. On the other hand, most of the rivers have much less potential, as the monthly averaged speeds are in range 0.46 – 1.1 m/s. [2,14]. The influacing factors are the slope angle gradient, discharge, and the roughness of the channel. In these conditions, axial hydrokinetic turbines can operate with minimum power, as their cut-in speed is 0.6-0.7m/s [7,8,9]. Some of the rivers, suitable for hydropower
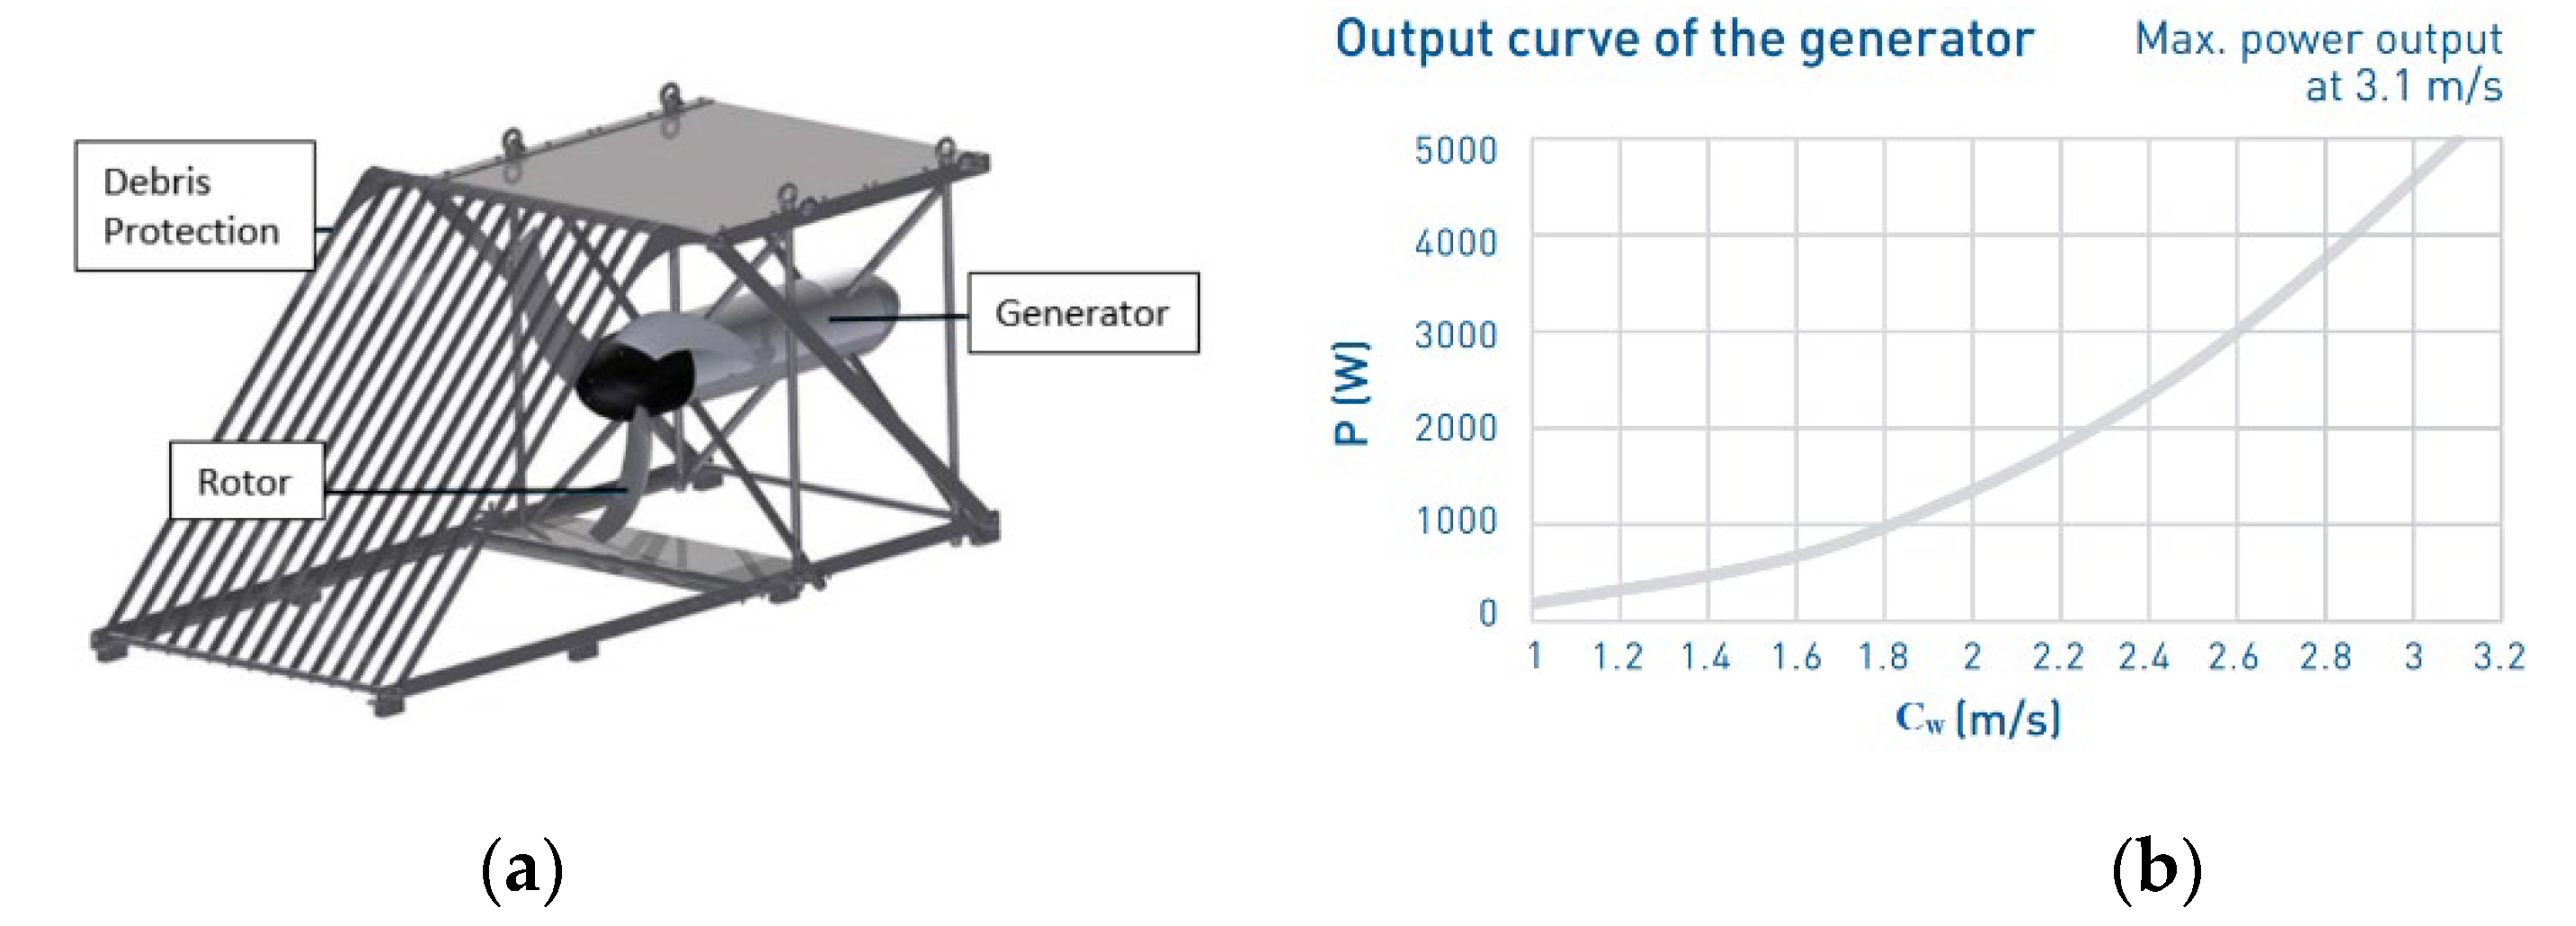
Figure 1 through Figure 3 present the main parameters of some of the commercial hydrokinetic turbines. The turbine runners of Smart Duofloat/Monofloat (Figure 1) are attached inside a cylindrical casing that resembles a diffuser. The floating construction keeps the runner submerged at a certain depth. The generator is placed inside the rear fairing of the turbine. A debris protection is placed in front of the runner. Its purpose is to prevent fish from entering between the turbine blades. According to the power curve presented in Figure 1 (c), the turbine can generate electrical power from 0.220 to 5 kW. The cut-in speed is 0.7m/s [8] and the rated speed is 2.8m/s [8]. Guinard Energys Axial kinetic turbine (Figure 2) has a similar construction. The turbine is attached to a supporting frame, which keeps the runner submerged. The maximum output power is 3.5kW [9] at a rated speed 3m/s [9] (Figure 2 (c)). The runner of the Smart Freestream turbine (Figure 3) is attached inside a reactangular supporting frame. Its parameters are similar to the Duofloat/Monofloat turbine but in this case the maximum obtained power is at 3.1 m/s [10]. According to the velocity data presented in Table 1, the accumulated annual energy from one unit will be 1.928-43.829 kWh. This amount of electricity is enough to power up small residential area and support the global electricity grid.

2. Parameters Affecting Hydrokinetic Turbine Efficiency and Power Generation

C p = P e f P w
The efficiency of kinetic turbines is determined by the power coefficient Cp, which represents the ratio between the power of the turbine Pef and the maximum theoretical power Pw that can be absorbed from the stream:
where Pw is a product of the power density Ps of the flow and the cross-section of the turbine runner Sr:
P w = P S S r
P w = ρ w a t e r c w 3 2
Power density of the air Pw is measured in W/m2 and depends on the water density ρwater and speed of the stream Cw:
The power of the turbine Pef is product of the angular speed ω and the torque Mb:
P e f = M b ω
Usally, the experiments are conducted on experimental benches. To reproduce the predicted power and efficiency one must use the laws of similarity of the flow thtough the model and the real kinetic turbine. This will limitate the influence of the scale effect on the performance curves of the real turbine. The main parameters that ensure the dynamic similarity are Reynolds number Re, Мах number Ma, and Strouhal number Sh, defined as [31,32,33]:
R e = C w L ν
M a = ω R a s
S h = ω R C w
In the above equations, Cw is the farfield stream velocity, L is a specific size referring to the blade chord length or the outer diameter of the runner, ν is the kinematic viscosity, ω is the angular speed of the runner, R is the outer radius of the turbine’s rotor, and as is the speed of sound. The obtained performance and power curves are presented in dimensionless form as C p = f ( λ ) , where λ refers to the so called tip speed reatio (TSR) of the turbine (Strouhal number from equation (7).
The average annual energy production of a particular kinetic turbine can be calculated for a specific location, following the International Electricity Commission (IEC) standards [35]:
E a n n u a l = 0.95 8766 1000 η 1 η 2 η 3 1 2 ρ S r i = 1 n C p C w , i C w   i 3 p C w , i ,
where C w is the average stream velocity in the control section recorded every hour, 8766 is the number of hours in a Julian year, η 1 is the efficiency of the mechanical transmission (0.92-0.96), η 2 is the efficiency of the generator (0.87-0.9), η 3 takes into account the heat losses in the wires (0.98-0.99), p C w , i is a coefficient that takes into account the probability that a given stream velocity will occur during the year. Before placing the hydrokinetic turbine in the river or open channel, it is necessary to evaluate the flow rate, solid content and their chemical composition. According to the studies, the most suitable channels are the ones in which strong turbulent currents develop and where the Reynolds number R e reaches a value up to 105. The Froude number F r determines the type of stream. At F r < 1 (below critical flow), velocity of the waves is greater than the stream velocity (gravitational forces are greater than inertial forces). Hydrokinetic turbines are most often placed in sub critical streams to avoid the formation of large waves and eddies behind the runner. Absorbing part of the kinetic energy will reduce the stream velocity and will change the upper water level.

3. Performance Enchantment Methods

Additional devices such as nozzles, cilyndrical or conical casings (difussers), and guide vanes can improve turbine efficiency. These devices act as flow accelerators and they can boost the turbine’s power. More details are presented in the sections below.

3.1. Cylindrical Casing

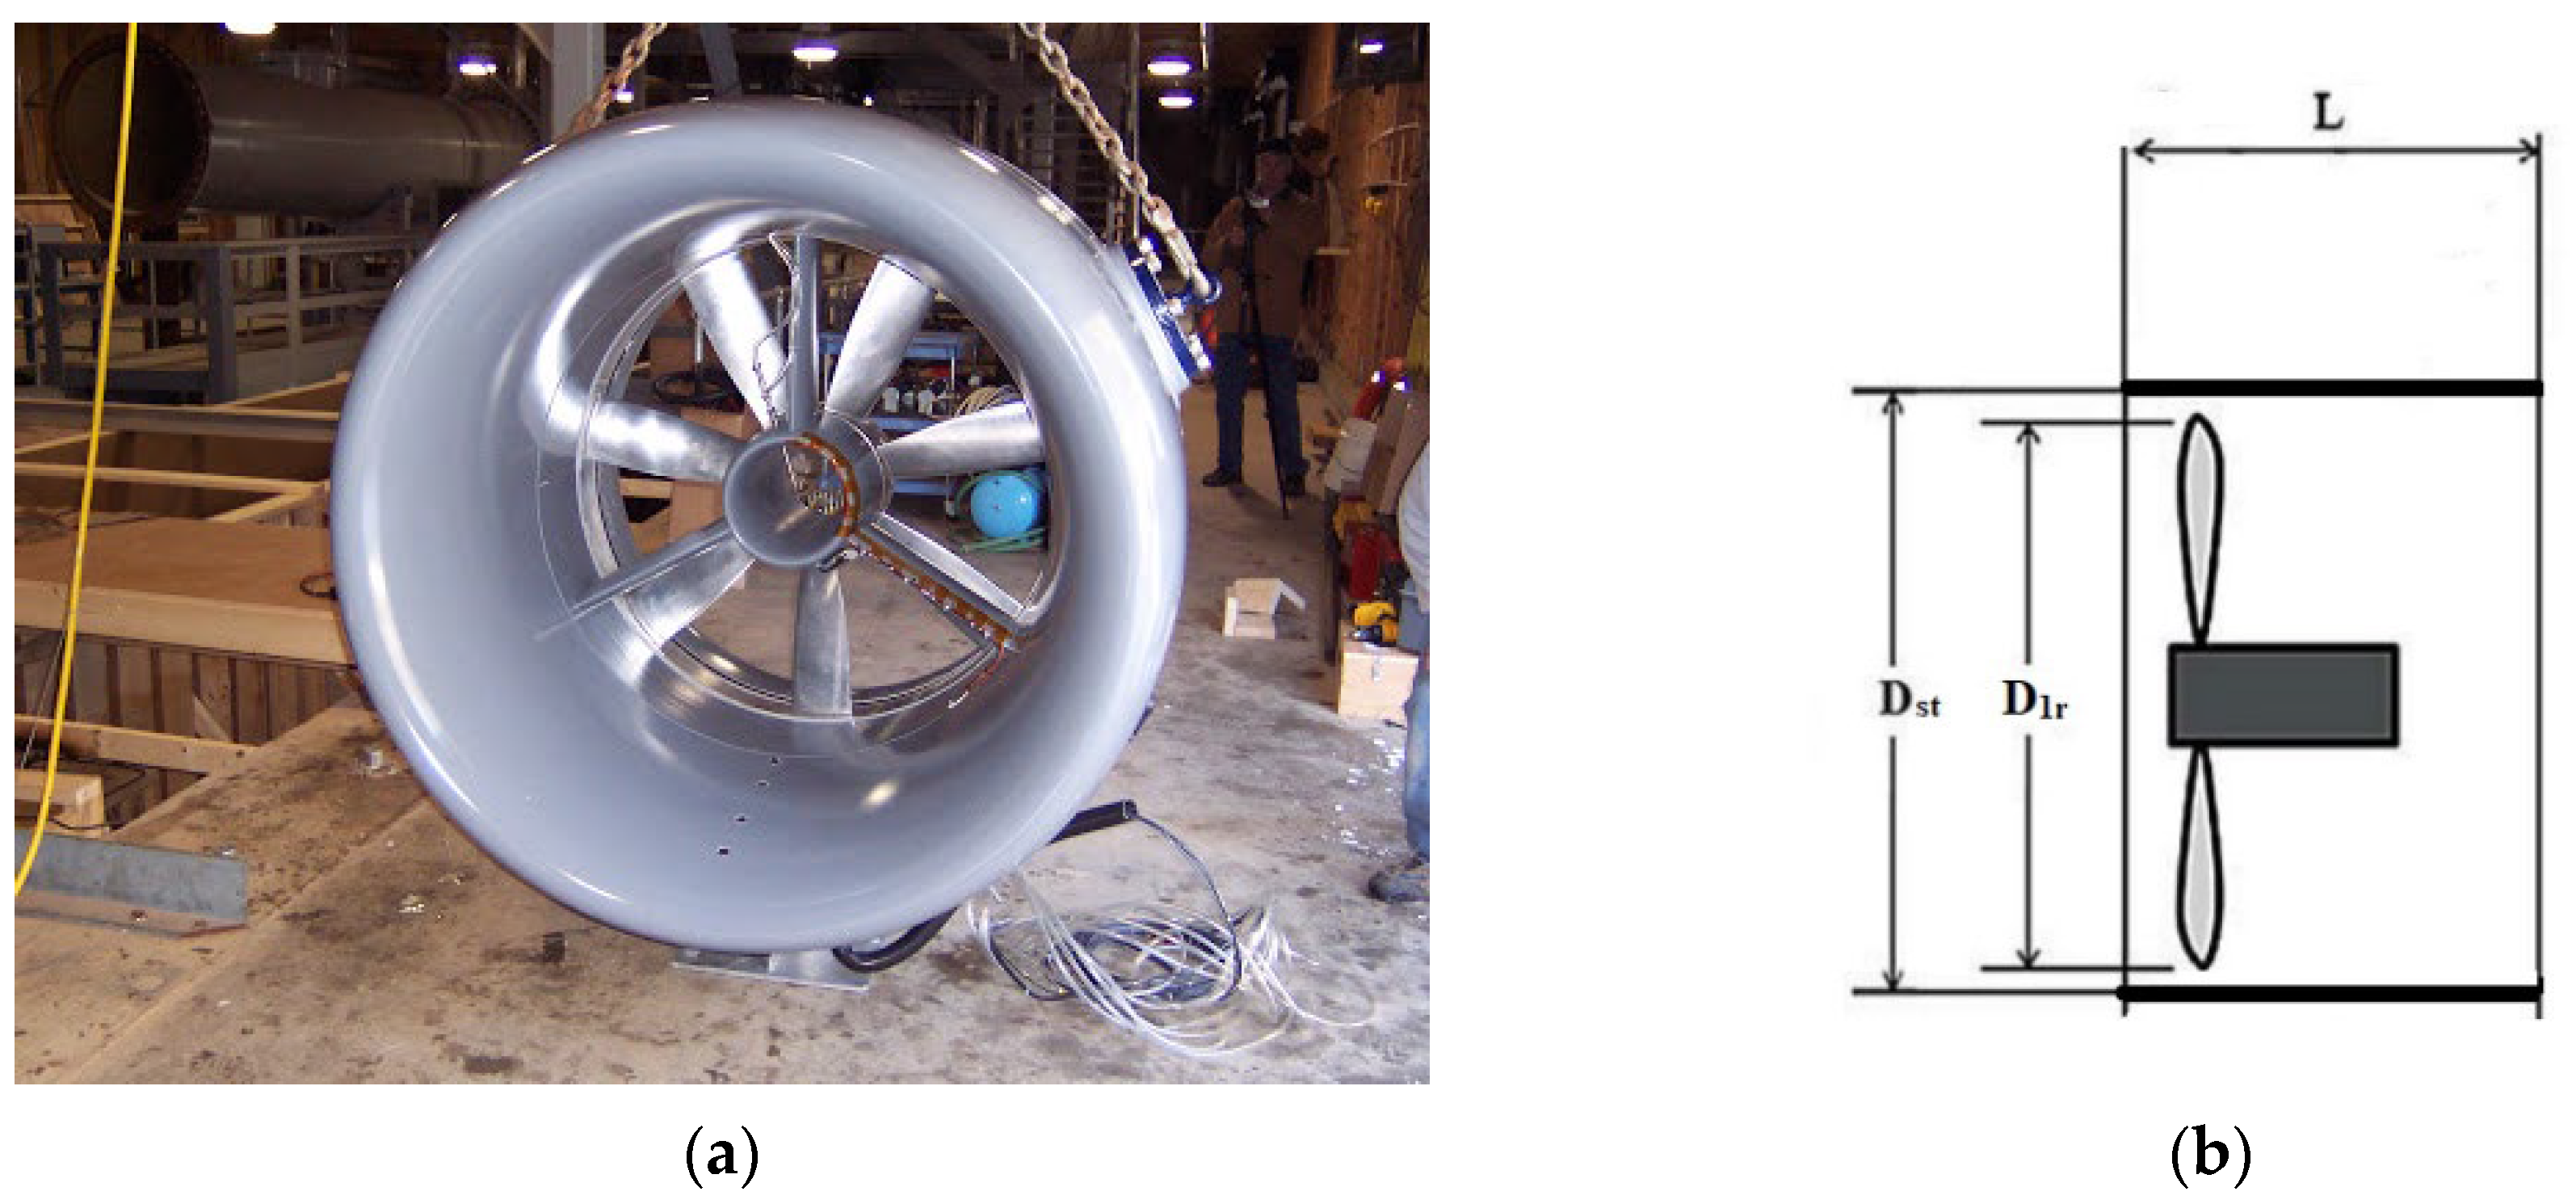
The runner of the turbine is placed inside a casing with circular a cross-section, which acts as a flow stabilizer (Figure 4). Kumar and Saschendra [35] have reach an increase in Cp up to 0.38 with the addition of a cylindrical casing.`
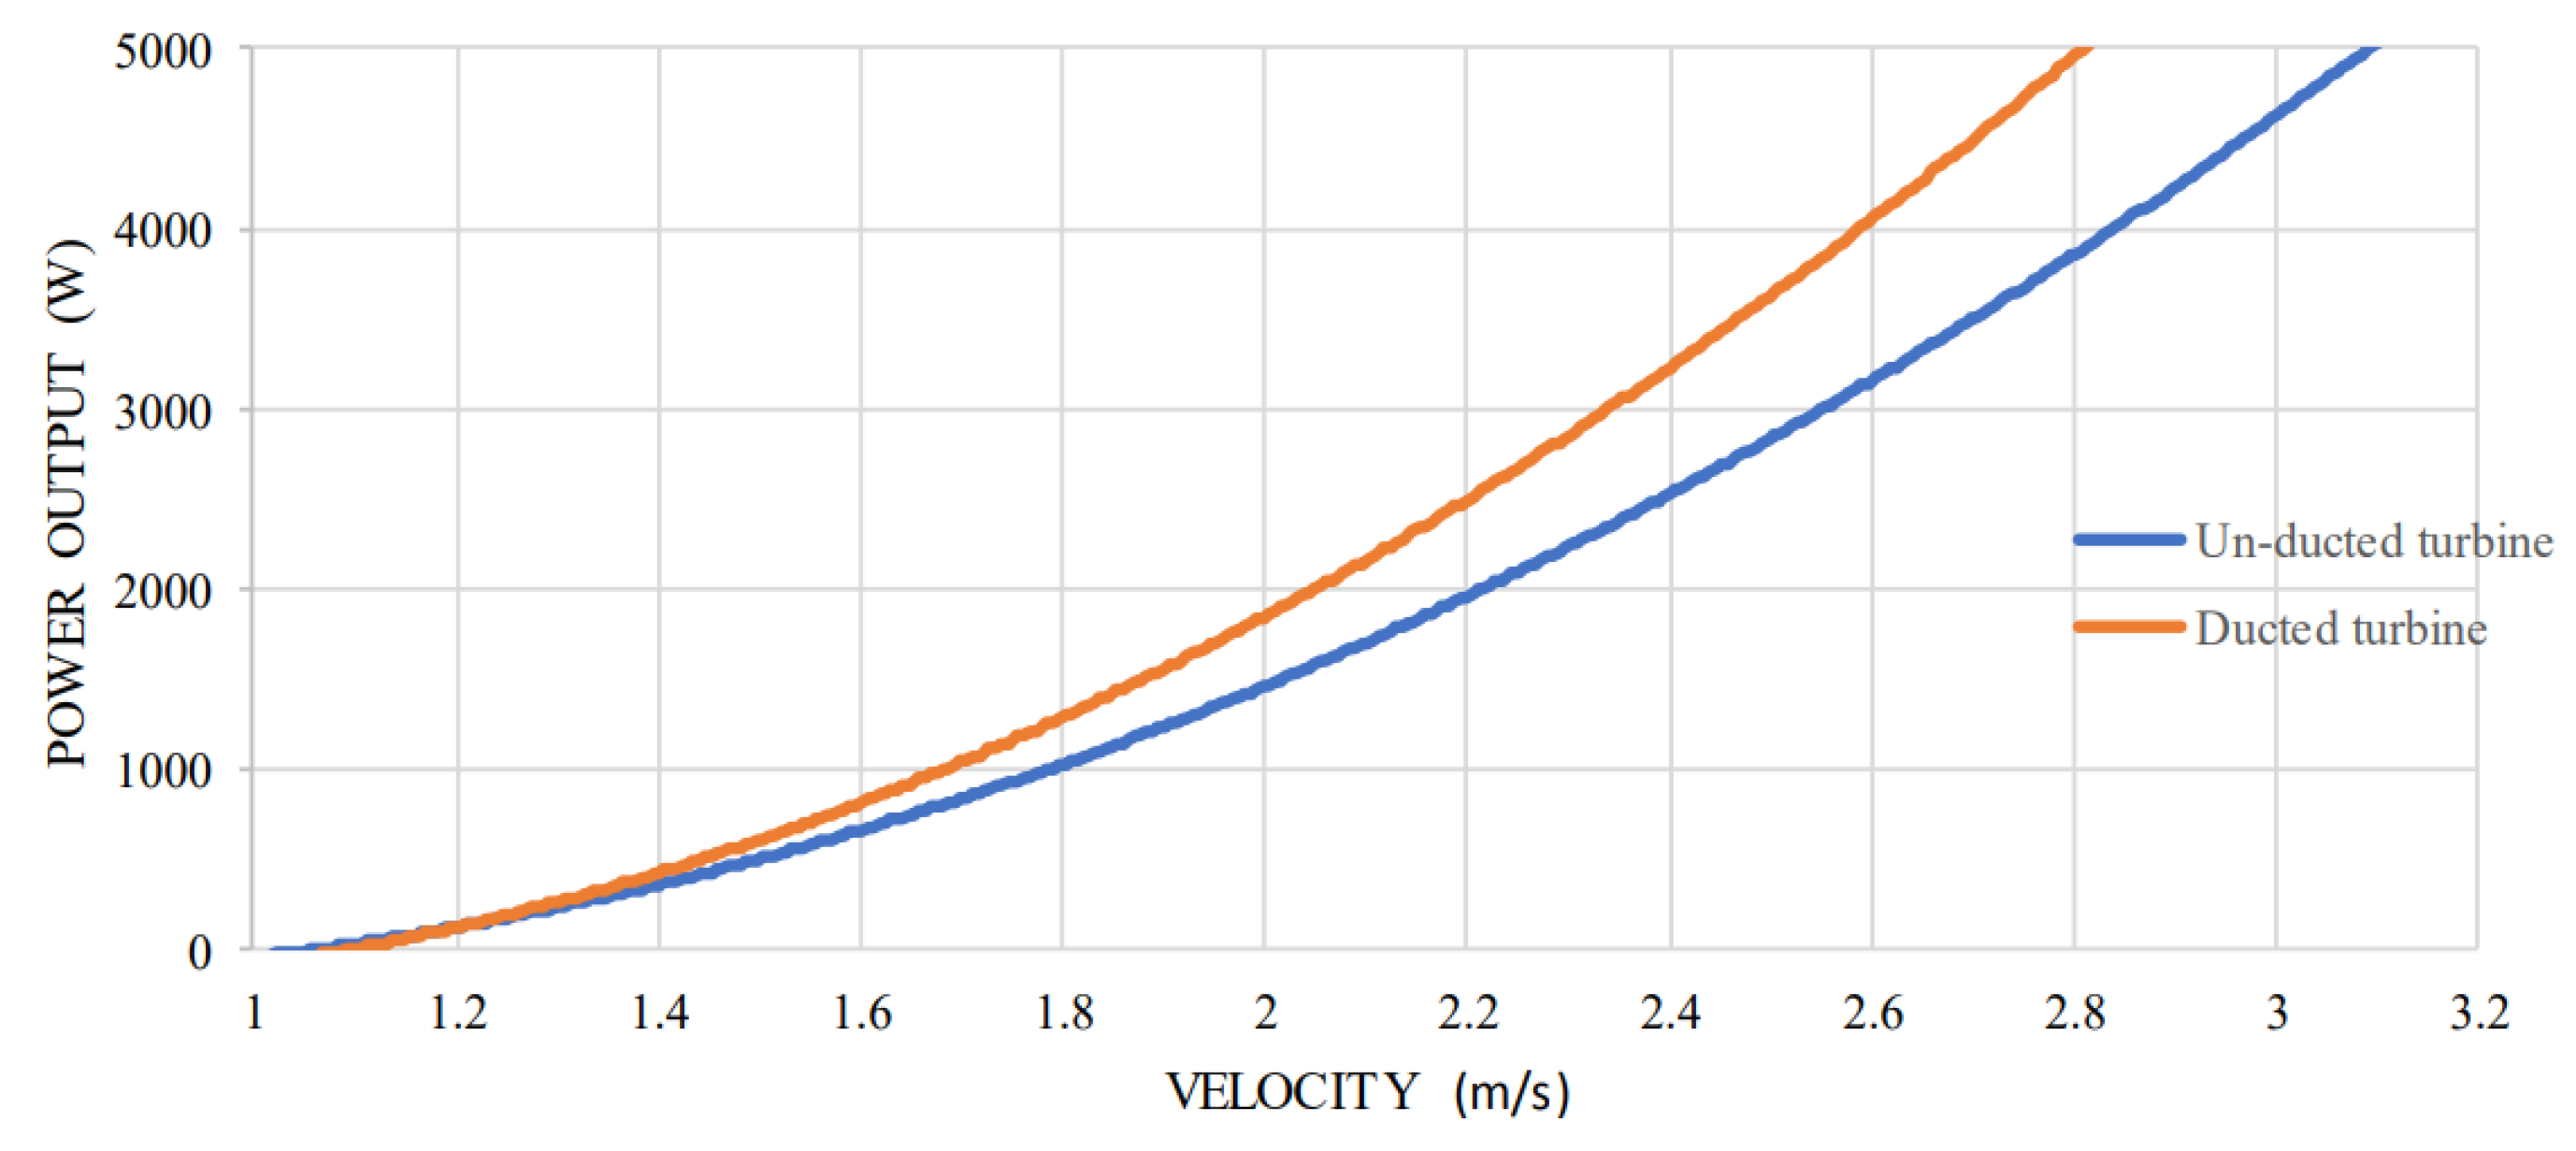
Another study achieves 40% more power compared to a bare runner. Figure 5 compares the power curves P = f ( C w ) of an axial kinetic turbine with and without cylindrical casing. The results are presented by Smart Hydropower Gmbh [8].
The influence of the cylindrical casing increases along with the stream velocity. Its efficiency is gradually improved over the years by modifying the shape of the inlet cross-section, and the radial clearance.

3.2. Conical Casing (Diffuser)

Placing the runner in a diffuser-shaped casing giving better results. Data from research shows that increasing the internal diameter of the outlet section improves futher the efficiency of the turbine. The effect of the diffuser on the stream velocity, investigated by Gaden [35]. The maximum values of the stream velocity between the hub and the shroud for both cases (cylindrical and conical casing) are 2.8 m/s and 4.1 m/s. The numerical study shows that a hydrokinetic turbine with diffuser can produce 3.1 times more power than a turbine with a cylindrical casing. The estimated optimal angle of the diffuser is 20 deg with ratio of the inlet and outlet sections Sr = 1.56. The obtained power coefficient Cp = 0.865 far exceeds Betz’s law

3.3. Channel Modifications

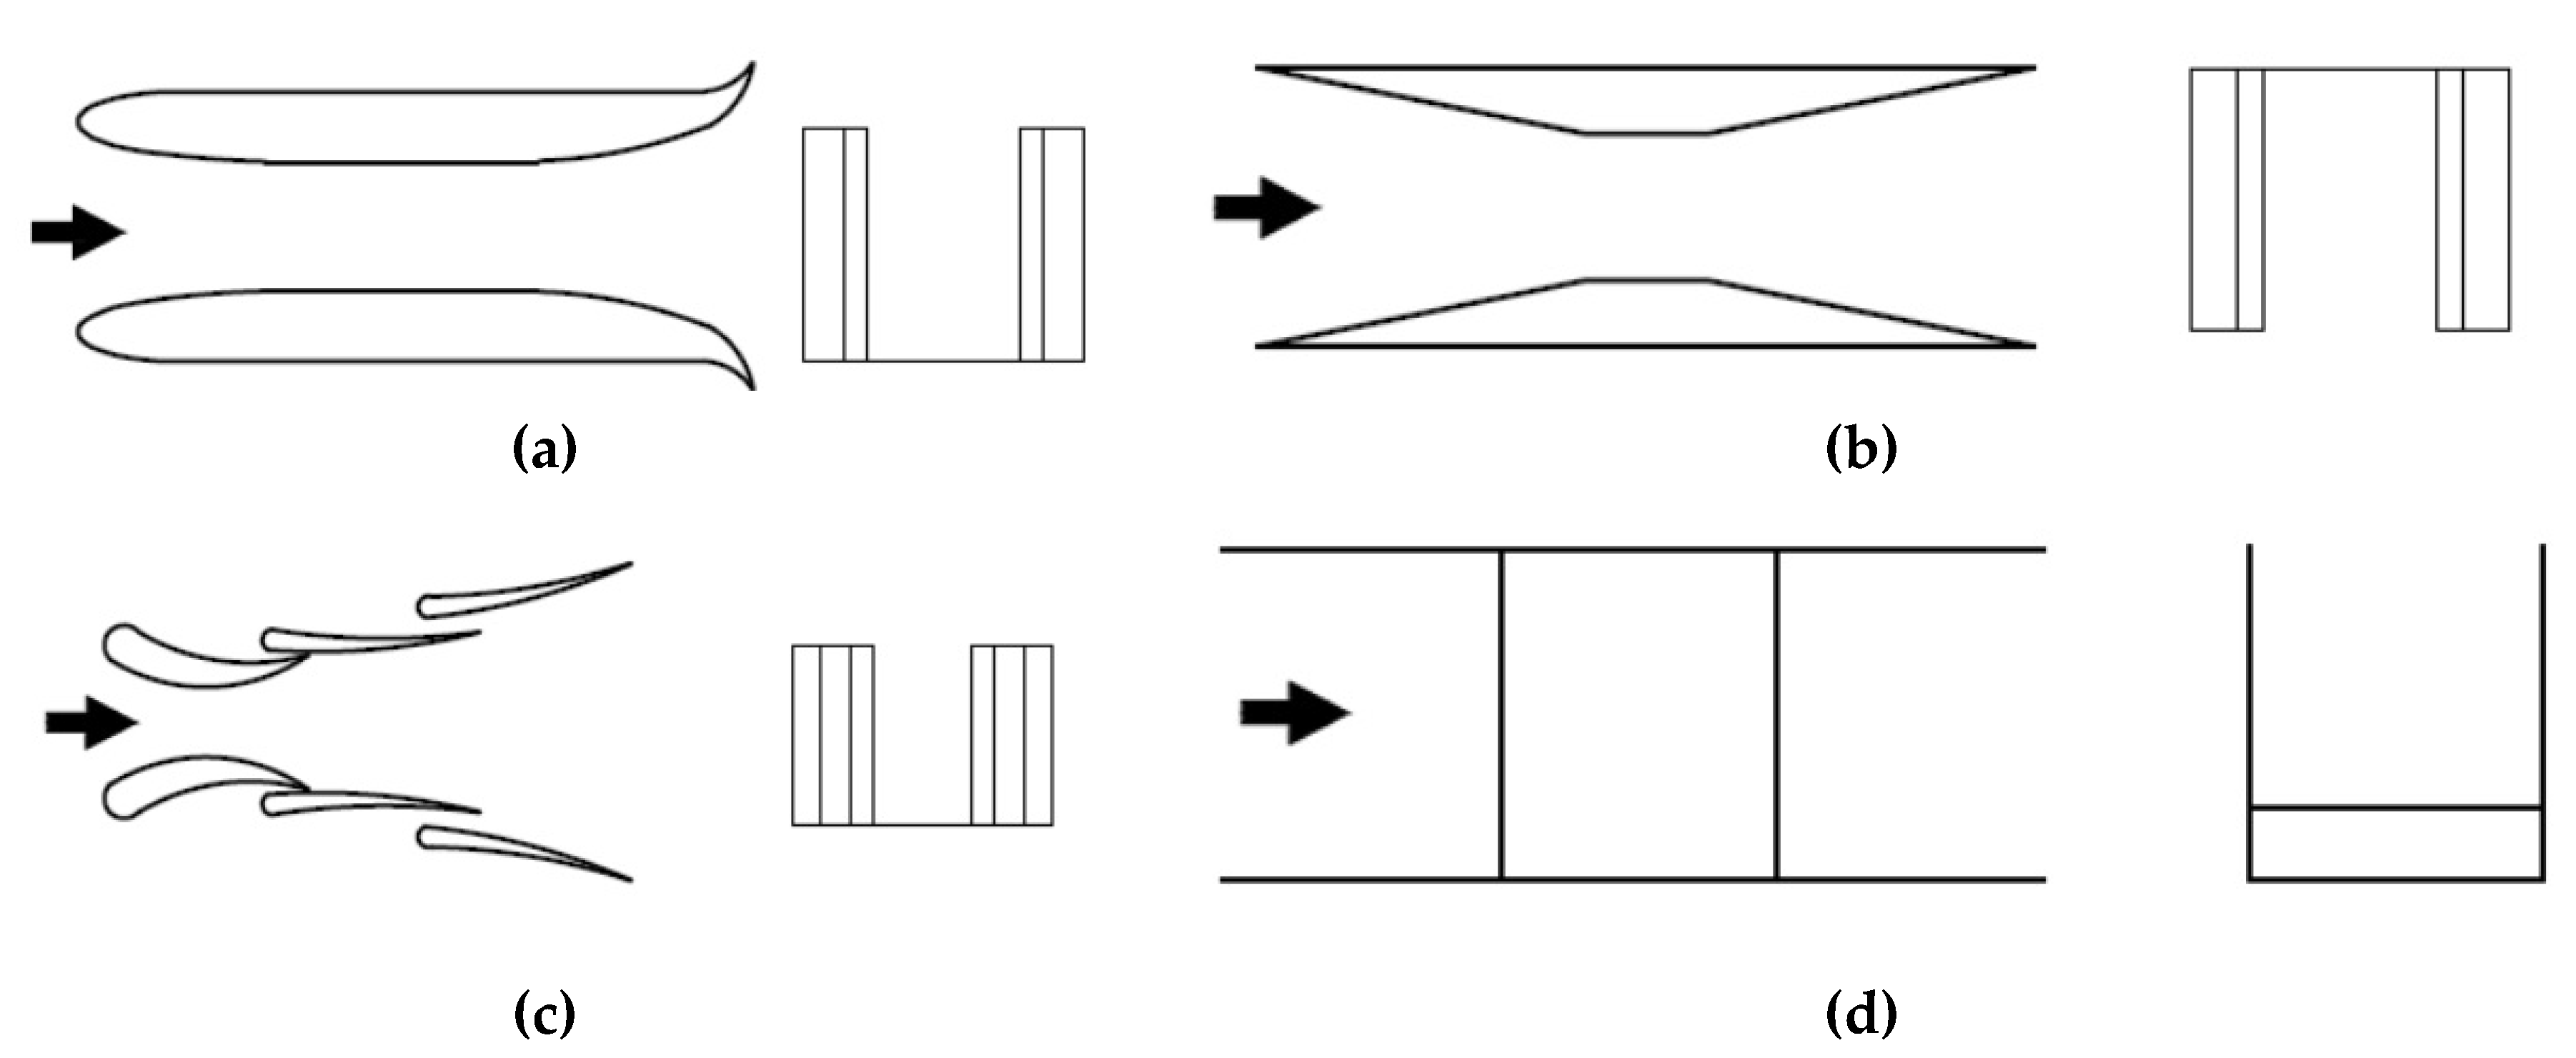
Channel modifications are made to increase the stream velocity in front of the runner. This is so called Venturi effect [38]. Figure 6 show different types of hydrodynamic channels. According to the published results [35], the modified channels can increase the stream velocity 1.67 times, which increase the power coefficient of the turbine 4.63 times.

3.4. System of Sequientially Placed Axial Kinetic Turbines

It is proven that a system of several axial kinetic turbines sequientially placed in a river or channel operates with low power, compared to a system of parallel placed turbines. This is due to the pressure drop of the stream after each runner. A numerical analysis [35] shows that increasing the number of turbines increases the drag coefficient of the system, which leads to a decrease in the flow rate in the channel. However, the system of sequientially placed kinetic turbines have its peak at certain number of the runners [35].

4. Calculation of Axial Kinetic Turbine

The most used theoretical model for calculating the power curves of hydrokinetic turbines are based on the actuator disk theory [39] and the blade element theory (BEM) [40,41,42]. The oscilating disk theory presents the turbine’s runner as rotating penetrant disk that absorbs part of the kinetic energy of the stream. It is assumed that:
  • – the outer diameters of the oscliating disk and the runner are identical;
  • – the flow is stationary, incompressible and continuous;
  • – viscous friction forces are neglected;
  • – the vorticity of the flow around the disk is neglected;
  • – the stream velocity near the disk is the same;
  • – the blade cascade is composed of an infinity number of infinitely thin blades.
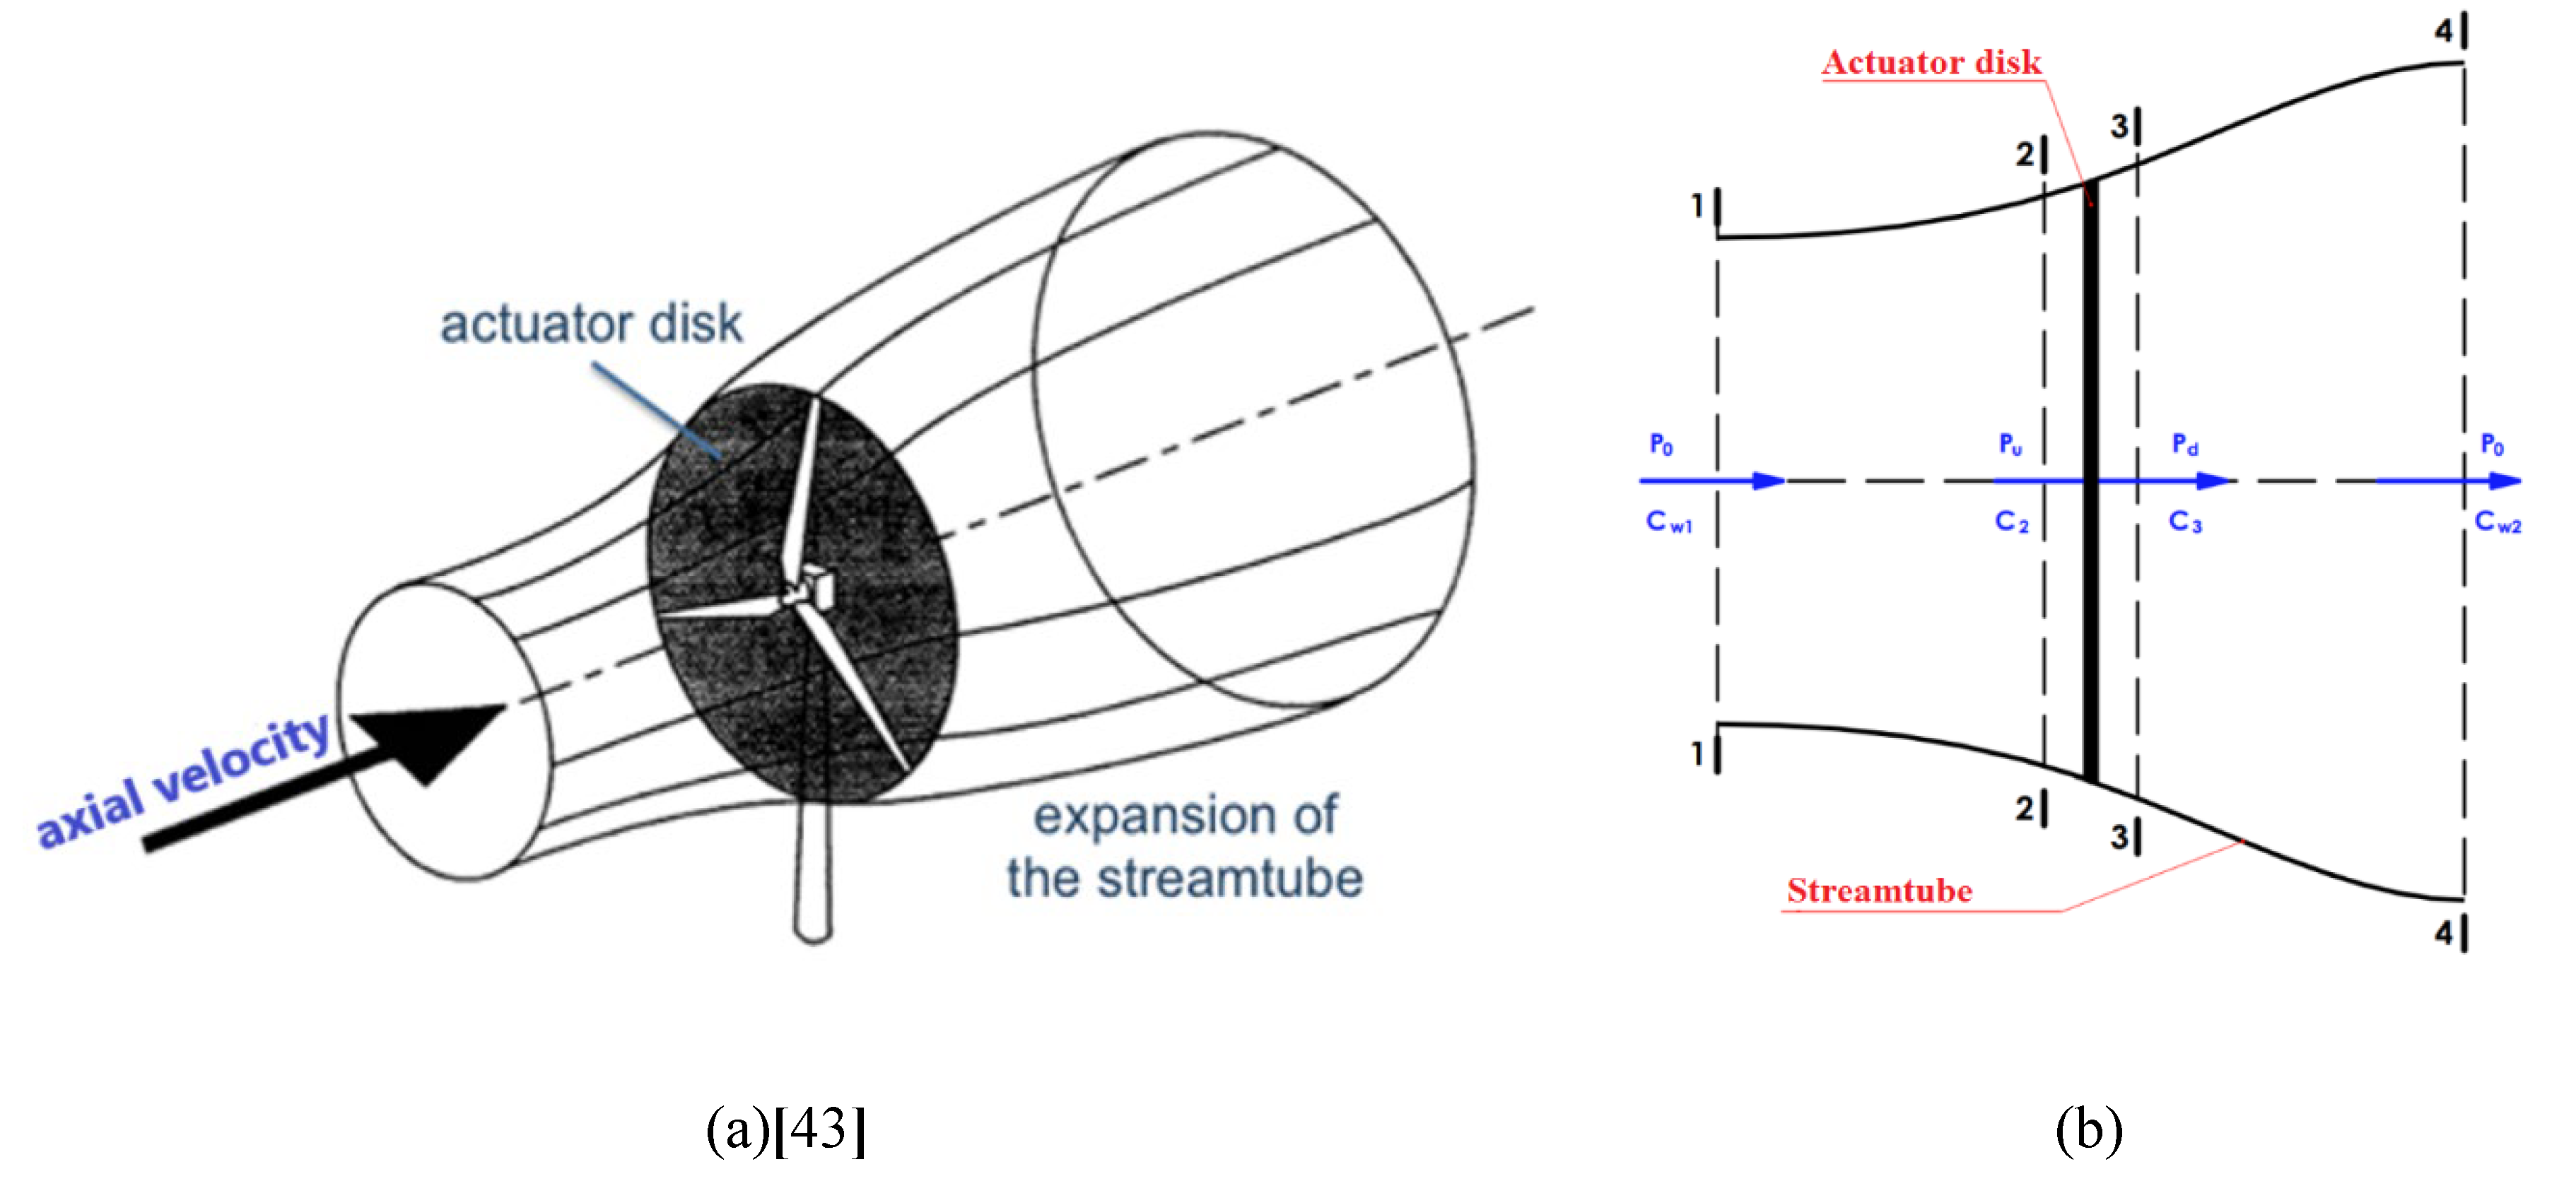
Figure 7 shows the principle scheme of the flow (represented by stream tube) through the actuator disk. The control area is limited by the contour of the tube.
Assuming that the flow velocity across the disk remains constant, the velocities at sections 2 and 3 are equal:
C d i s k = C 2 = C 3
The massflow is:
q m = ρ S d i s k C d i s k .
wher ρ is the density of the flow, and Sdisk is the frontal area of the actuator disk.
According to the law of conservation of momentium in a closed system, the thrust force that acts on the disk is:
F D d i s k = q m ( C w 1 C w 2 )
Since the flow is continuous along the entire length of the stream tube, Bernoulli’s equation can be used for each sections:
p 0 + 1 2 ρ C w 1 2 = p u + 1 2 ρ C d i s k 2
p d + 1 2 ρ C d i s k 2 = p 0 + 1 2 ρ C w 2 ,
where p0 is the pressure in section 1, pd is the pressure in section 3, and pu the pressure in section 2. The thrust force is expressed by the pressure drop:
F D d i s k = S d i s k   ( p u p d )
Equating equations (11) and (12), give the pressure drop through the disk:
Δ p = S d i s k p u p d = 1 2 ρ ( C w 1 2 C w 2 2 )
Substituting equation (15) in equation (16) expressing the thrust force as function of the disk area and the stream velocity:
F D d i s k = 1 2 ρ S d i s k C w 1 2 C w 2 2 .
By equating equations (10), (11), and (17) the stream velocity in the disk plane can be written as:
C d i s k = C w 1 + C w 2 2 .
The axial induction coefficient а expresses the drop in the stream velocity from section 1 to a section in the rotor plane. Its calculated by the formula:
a = C w 1 C w 2 C w 1 .
The dependence of Cdisk on Cw1 is derived from equations (18) and (19):
C d i s k = C w 1 ( 1 a )
The relationship between velocities Cw1 and Cw2 is established by equating equations (18) and (20):
C w 2 = C w 1 ( 1 2 a )
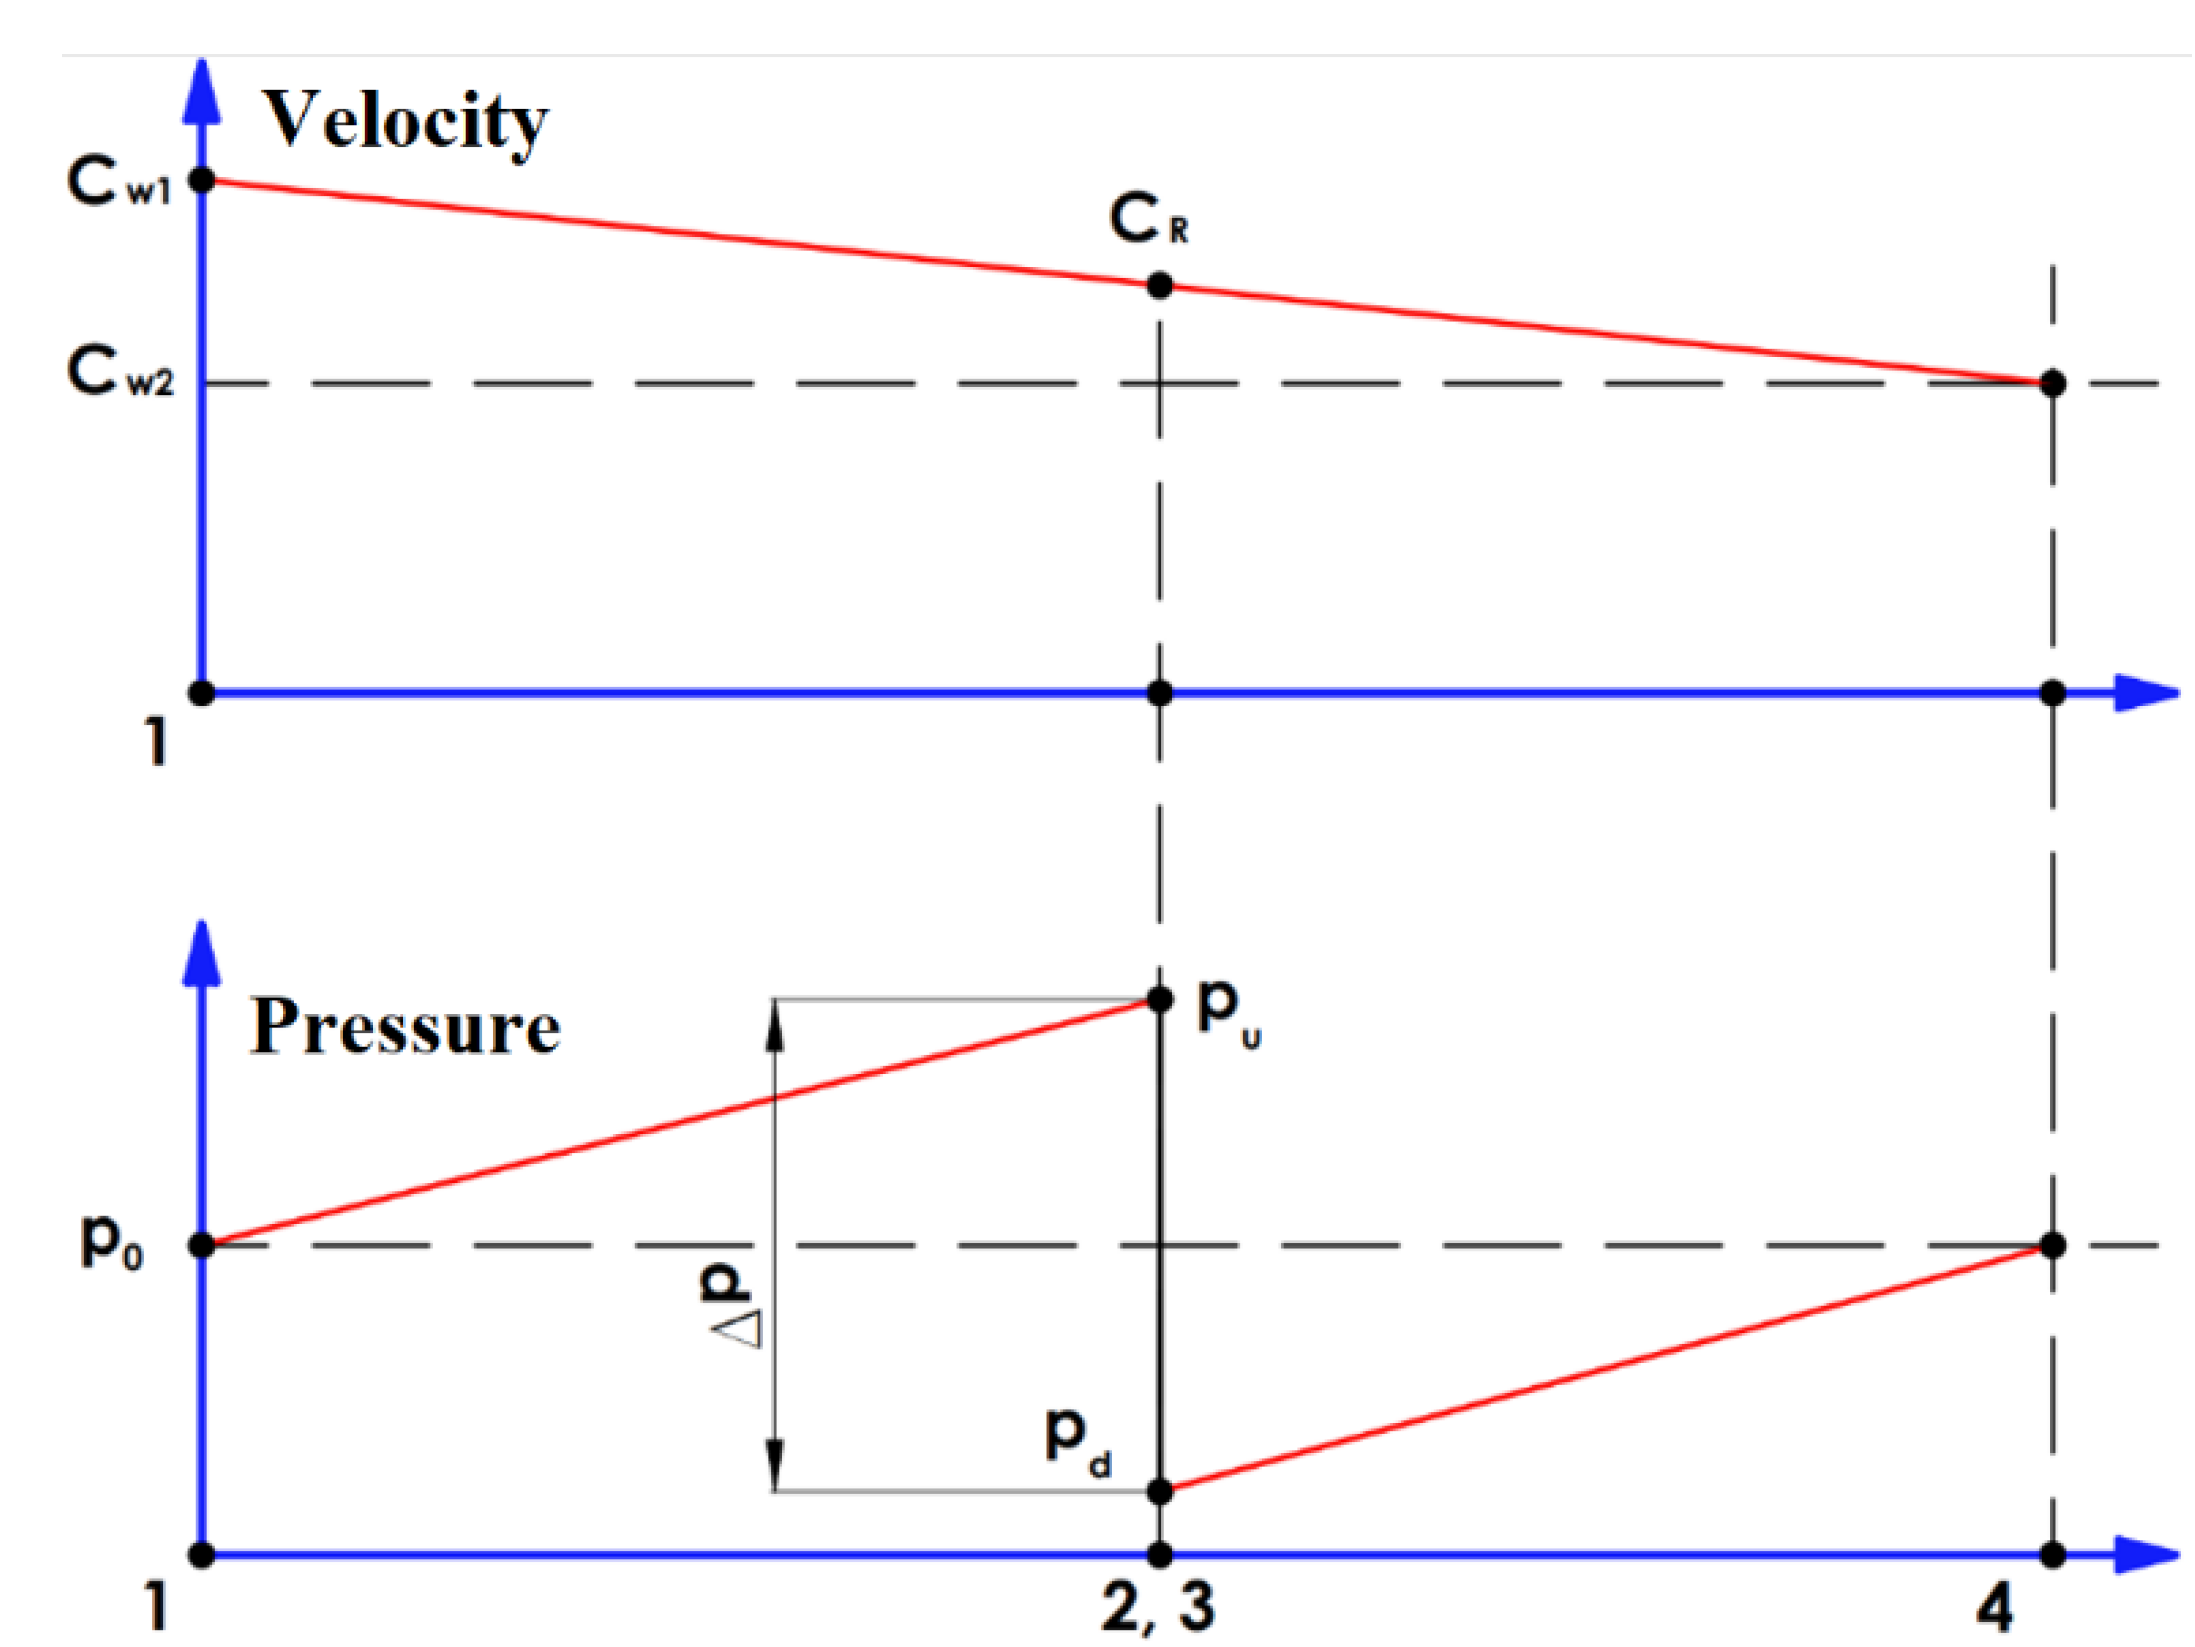
The velocity and pressure distribution along the length of the stream tube is shown in Figure 8. A sudden drop in the dynamic pressure Δp is observed after the actuator disk, due to the absorbed kinetic energy. The pressure at the end sections can be assumed to be the same.
Theoretical power produced by the disk is calculated as equation (17) is multiplied by the in-plane velocity of the disk Cdisk:
P t h = 1 2 ρ S d i s k ( C w 1 2 C w 2 2 ) C d i s k
The theoretical power coefficient of the kinetic turbine is the ratio of the theoretical power of the disk to the maximum theoretical power it can absorb from the stream:
C p t h = P t h P w t h ,
P w t h = 0.5 ρ S d i s k C w 1 3 ,
Equating equations (20), (21), (22), and (24), the theoretical power coefficient is represented as a function of the axial induction coefficient a:
C p t h = 4 a ( 1 a ) 2
The maximum theoretical power coefficient is calculated by equaling to zero the first derivative of Eq (25):
4 16 a + 12 a 2 = 0
and it follows that Cp th max = 16/27 = 0.5926 at a = 1/3.
This value shows that an ideal kinetic turbine can extract maximum around 2/3 of the kinetic energy of the stream, and is better known as the Betz’s law [44]. Similarly, to equation (23), the thrust force coefficient is derived as:
C D d i s k = F D   d i s k 0.5 . ρ . F D   d i s k . C w 1 2 .
Using equations (17), (20), and (26) the thrust force coefficient can be expressed as function of the axial induction coefficient:
C D d i s k = 4 a ( 1 a )
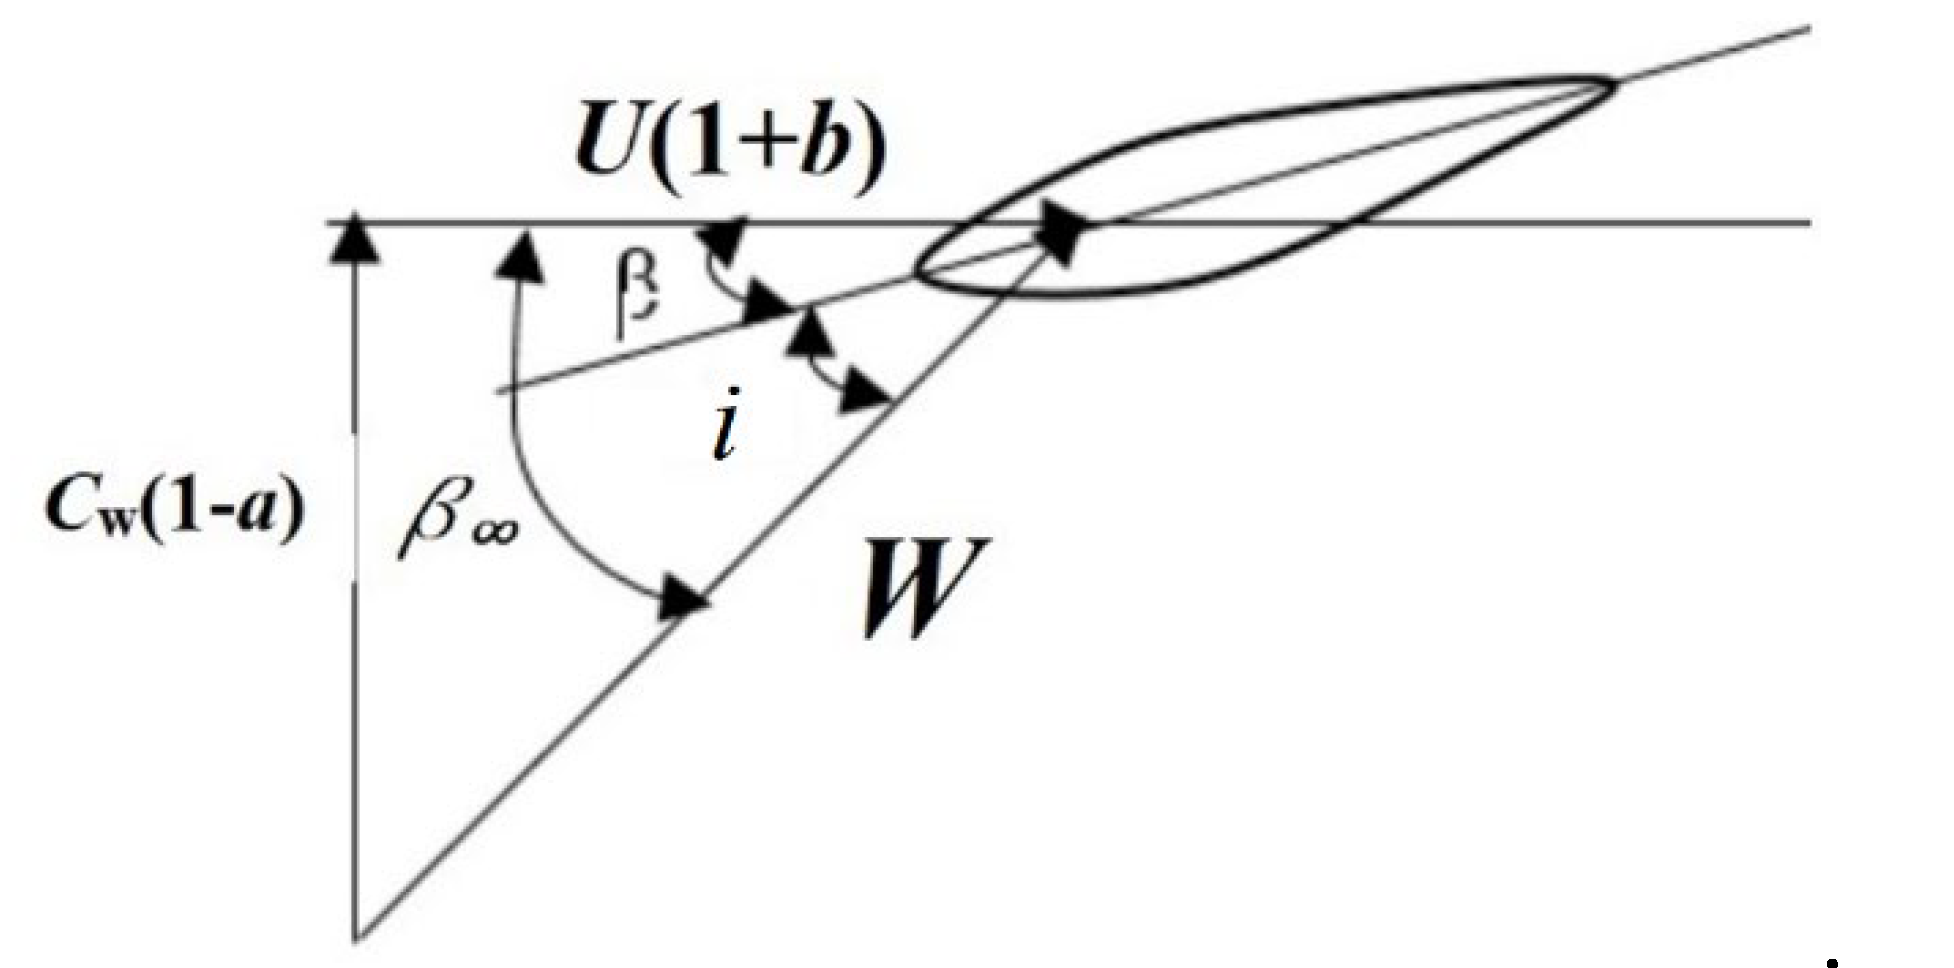
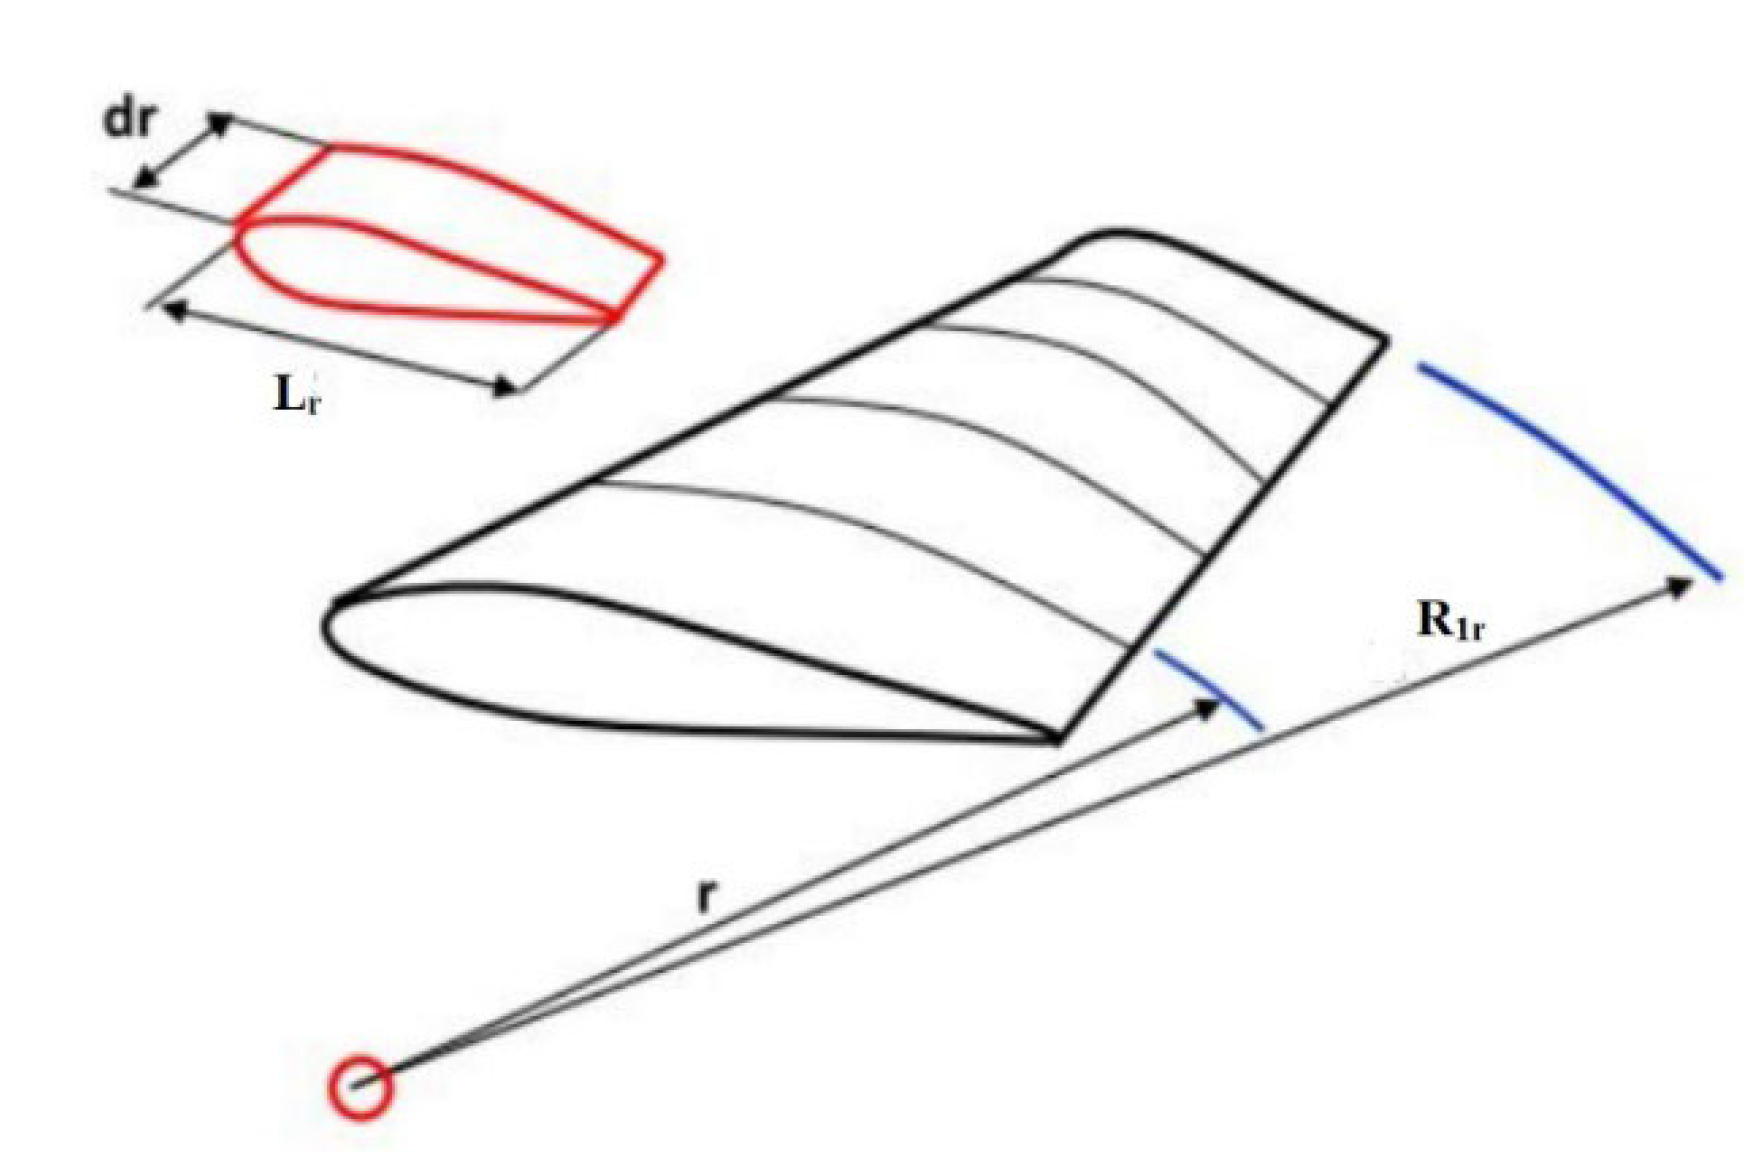
Blade cascade of the kinetic turbine can be calculated with BEM theory. The blades are divided into separate segments of equal height. For each segment the critical parameters are calculated. These include the axial induction coefficient a, tangential induction coefficient b, the acting velocities and forces. The velocity triangles for one blade segment are shown in Figure 9.
Cw is the farfield velocity in front of the runner, a and b are the induction coefficients, and u is the blade linear velocity for this cylindical section. The angle β between the mean relative velocity w and the blade linear velocity u is sum of the angle of attack i and the pitch angle of the blade β:
β = i + β
From the velocity triangle in figure 9, the dependence of β can be deduced to:
β = a t a n C w ( 1 a ) u ( 1 + b ) = a t a n V a V t ,
where Va and Vt are the induced axial and tangential velocities on the blade.
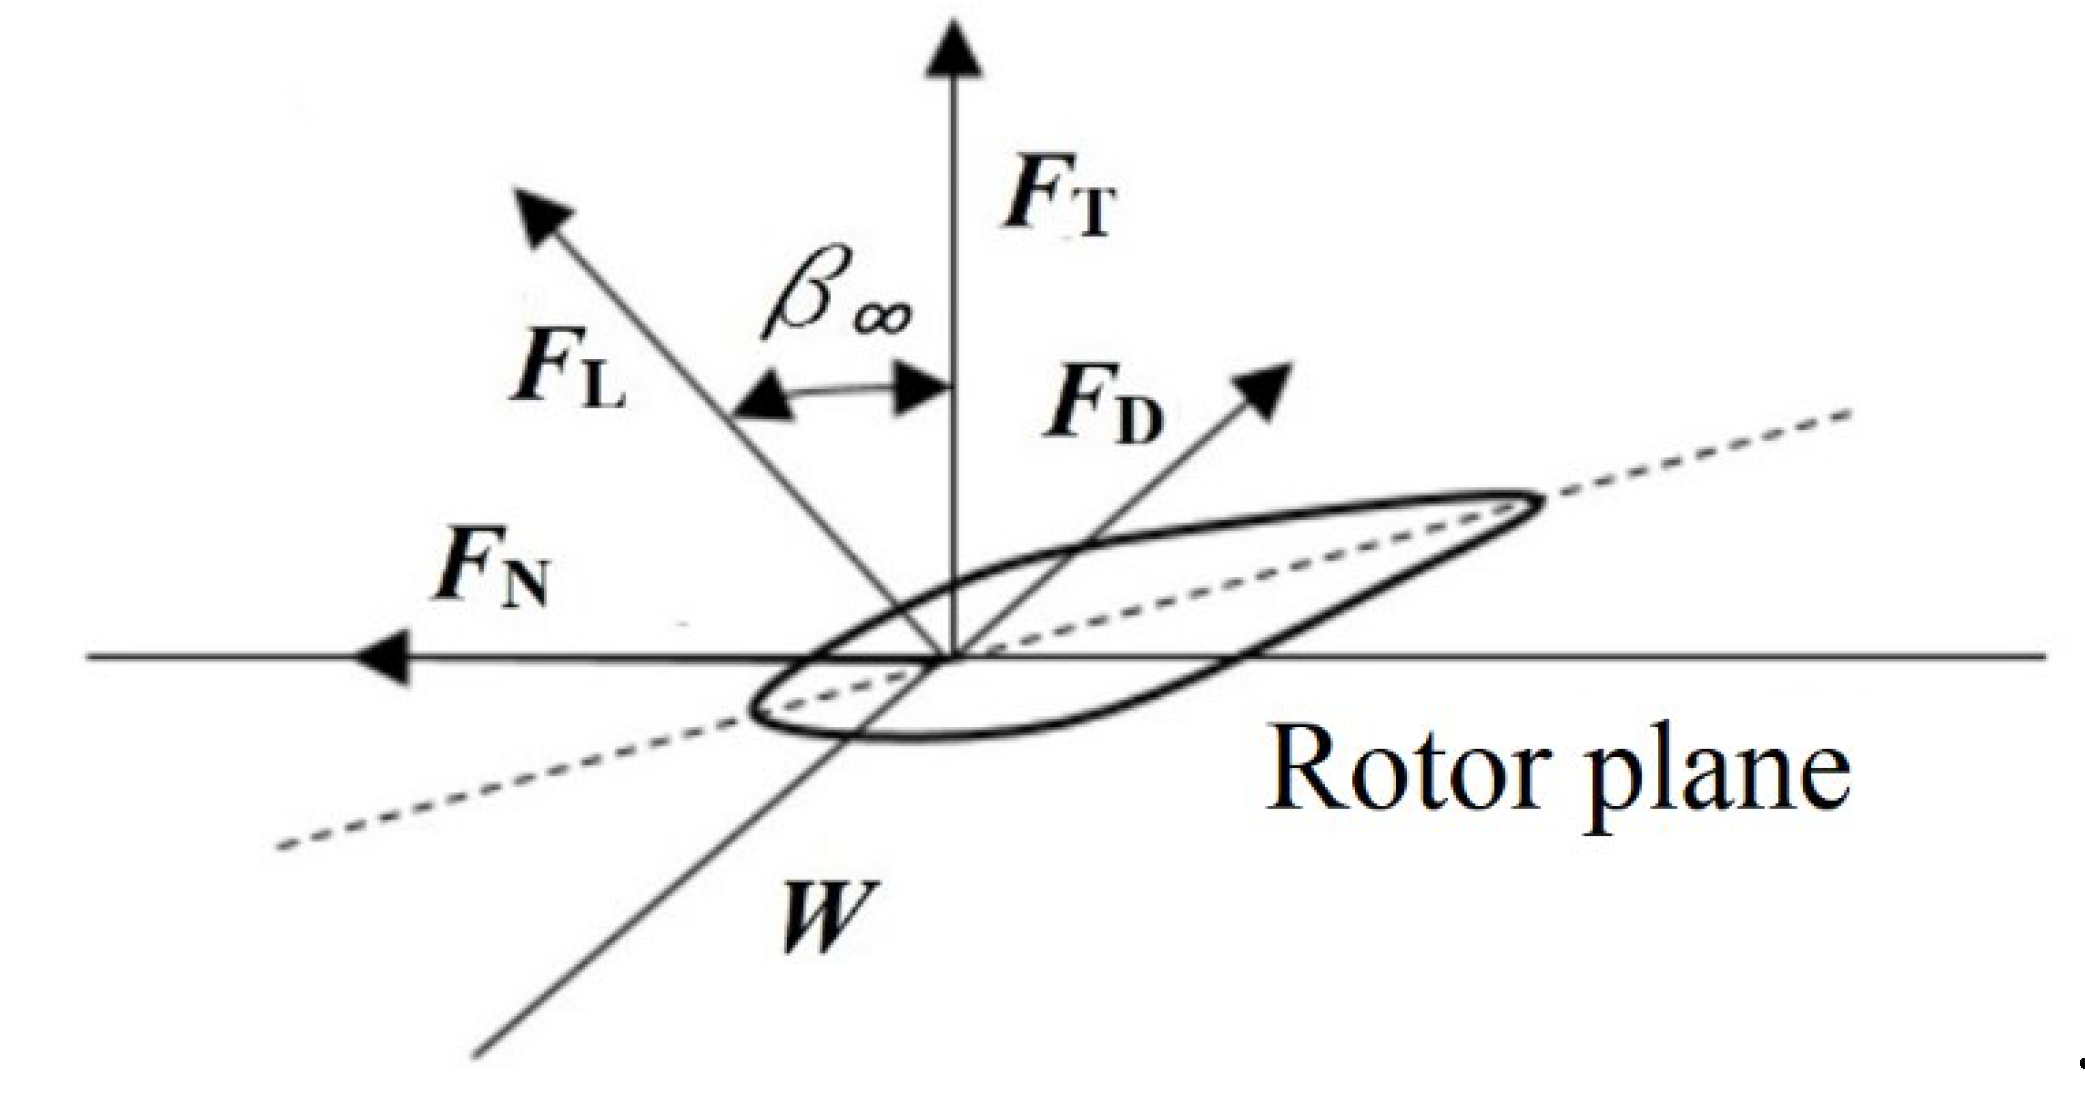
Figure 10 shows the forces that act in a given section of the working blade. The drag force vector Fx is collinear with the mean relative velocity vector w, which is rotated at angle β relative to the rotor plane. The lift force vector Fy is perpendicular to the drag force vector Fx. The aerodynamic coefficients of an isolated air foil, cx and cy, are used to calculate these forces:
L = 1 2 ρ L r c y w 2 ,
D = 1 2 ρ L r c x w 2 ,
where L r is the chord length of the blade, and ρ is the water density.
Mean relative velocity is calculated by the following equation:
w = V a 2 + V t 2
The vector of the normal force FN is projection of the resultant force FR = F x 2 + F y 2 along the axis of the runner. The normal force is used to determine the axial load on the blade cascade at given cylindrical section. The tangential vector FT that creates the torque Mb is a projection of the resultant force FR on the tangent of the circle with radius Ri, which cuts the blade at the corresponding cylindrical section. FN and FT are calculated by the equations below:
F N = F y cos β + F x sin β ,
F T = F y sin β F x cos β ,
The runner torque Mb is obtained with integration of the elementary tangential forfes applied to the individual blade segments (Figure 11):
M b = 1 2 z ρ R b R a w 2 R c t R l R R d R ,
where C T = F T 1 2 ρ l w 2 is the coefficient of the tangential force, and z is the number of the blades in the blade cascade.
The mechanical power of the runner for a given operating regime is obtained by multiplying the angular velocity ω of the runner by its torque:
P = M b ω

5. An Overview of Published Articles

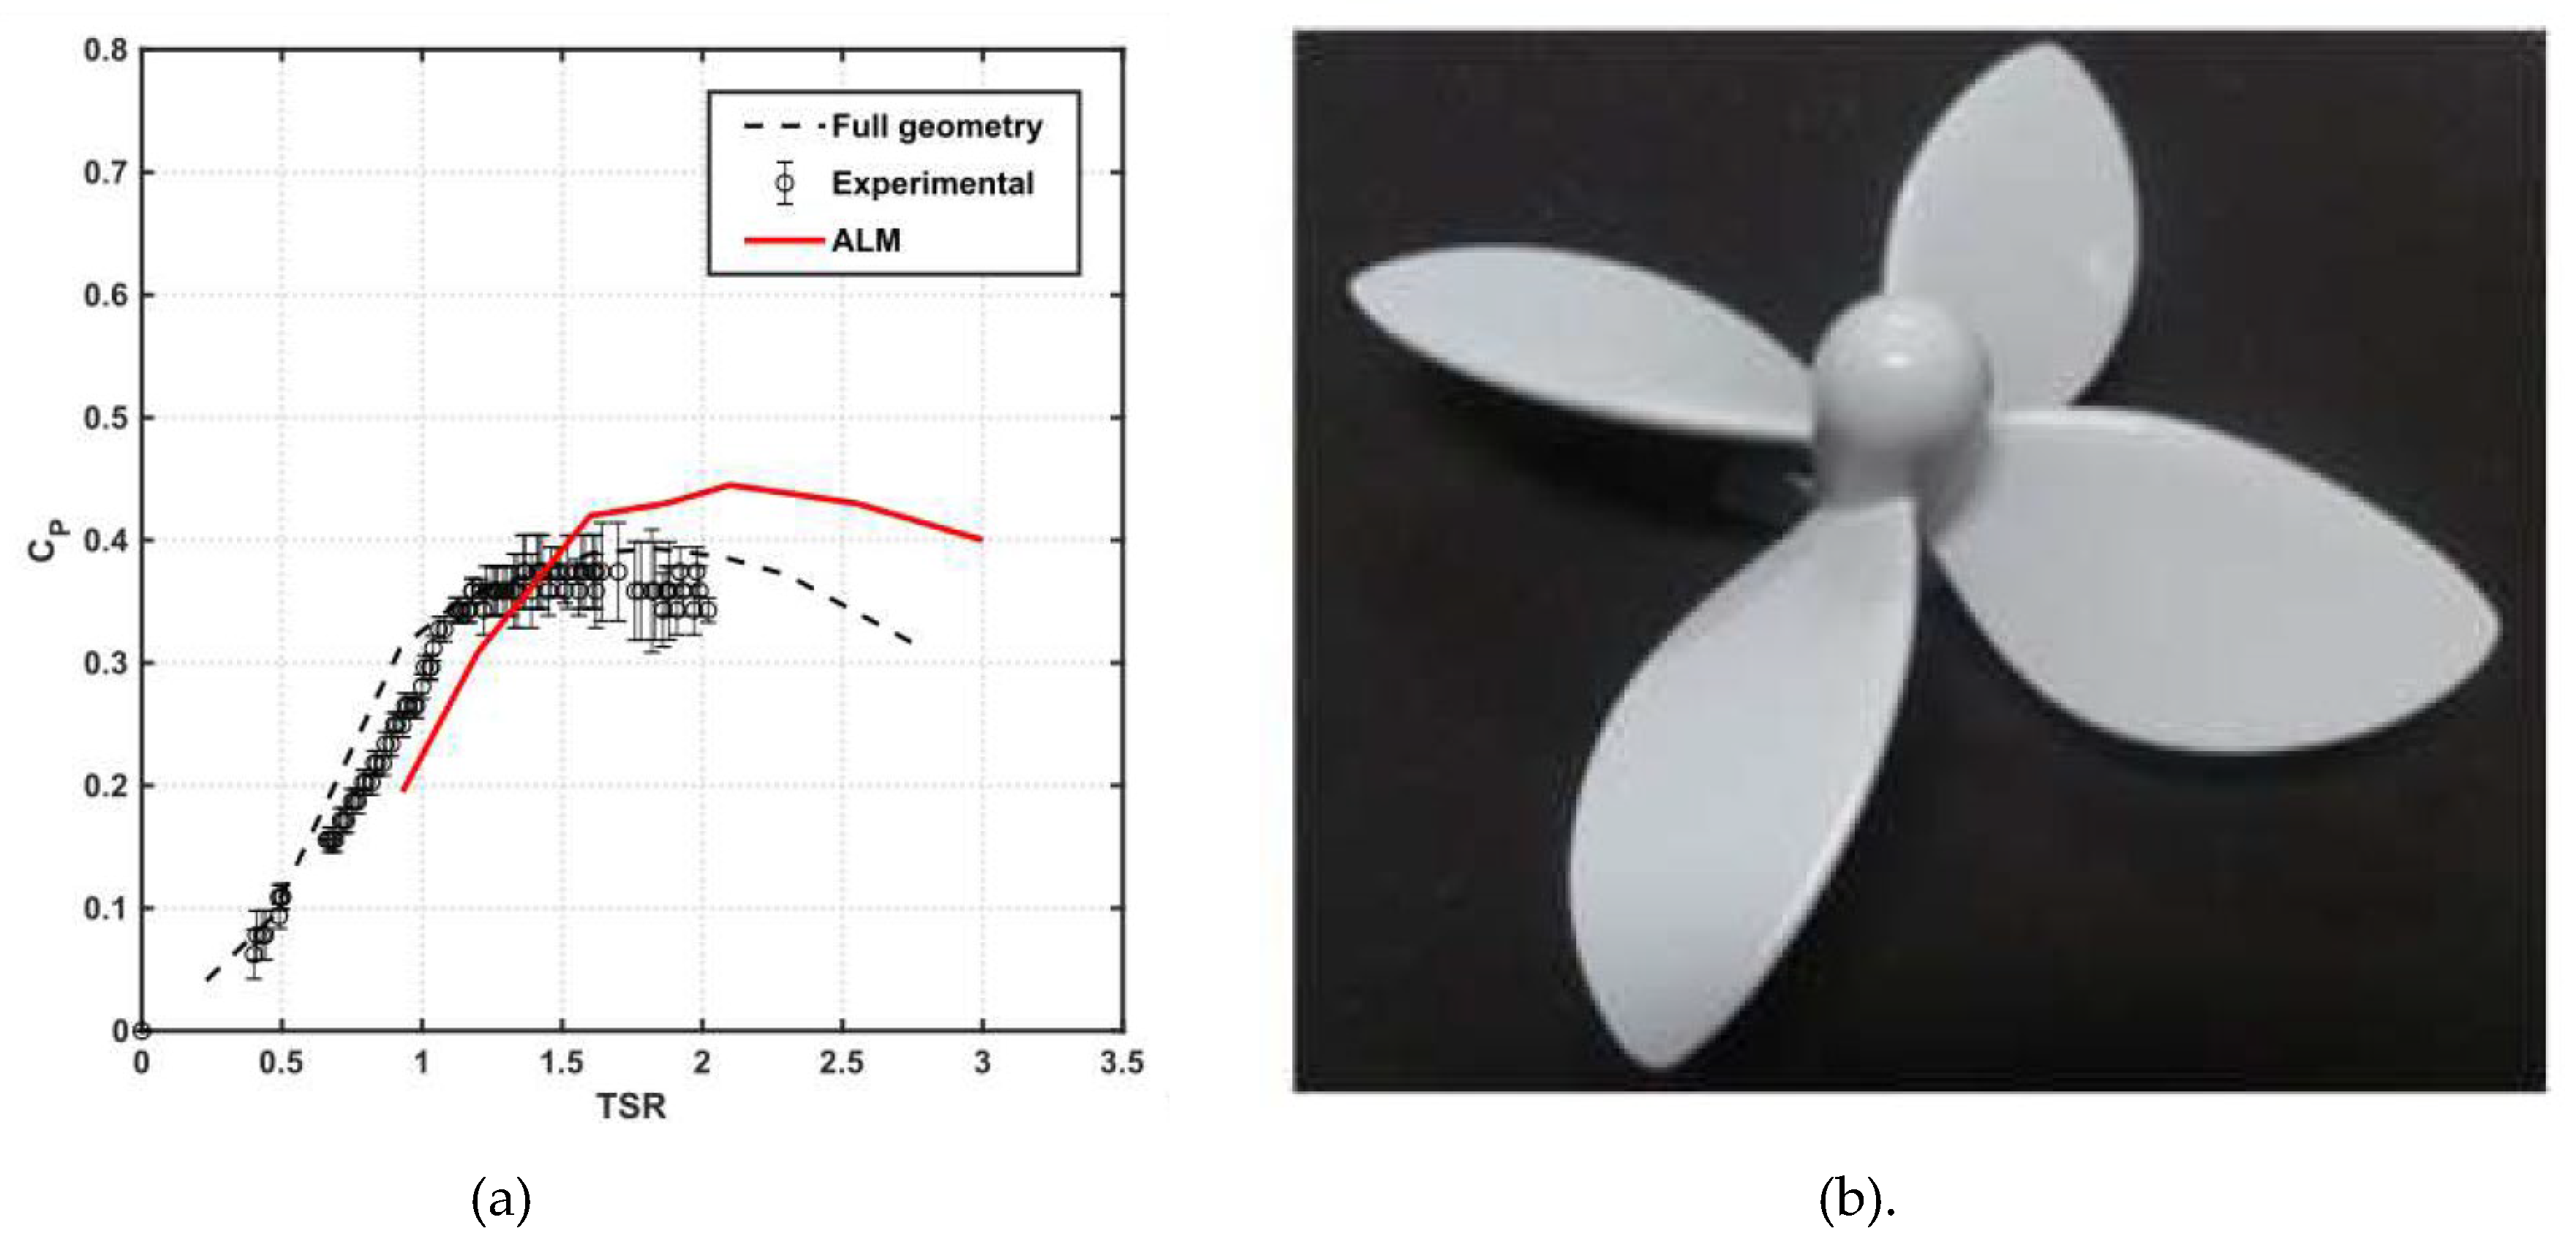
This section summarizes some of the articles published within the field. The first article is presented by Marianela et. al [45]. The experiments are conducted at the Energy and Environment Laboratory of the University of Brasilia [46]. The runner, composed of 4 blades, has an outer diameter D1 = 220 mm. The axis of the hub is placed 234 mm above the floor of the channel. The control chamber has dimensions of 1350x1650x2000 mm. The operating regime is regulated by an electric generator. The torque values and rotational speed are monitored by integrated torque sensor. A comparison is made with a numerical experiment using finite element methods. The mathematical model was created with Ansys CFX. The computational mesh is composed of 557 216 cells. The surrounding space is rectangular with dimensions 15D1x5D1xD1. A k-omega turbulent model is used. The boundary conditions are set as a velocity inlet, a pressure outlet and free slip walls. A structured mesh is used along the contour of the turbine’s runner with minimum dimensionless distance between the contour and the cell nodes y+ = 1.6, which is within the permissible limits of the used turbulence model. Outside the runner region is used a tetrahedral mesh due to its better adaptability to the geometry of the surrounding space. Numerical studies were performed with the full runner geometry and with the actuator line model (ALM). The results are presented in Figure 12. The physical experiment shows a maximum value of the power coefficient Cp = 0.37 with tip speed ratio TSR λ = 1.5, while the numerical experiments shows Cp = 0.39 at TSR λ = 1.7 (Ansys CFX) and Cp = 0.43 at TSR λ = 2.15 (ALM method).
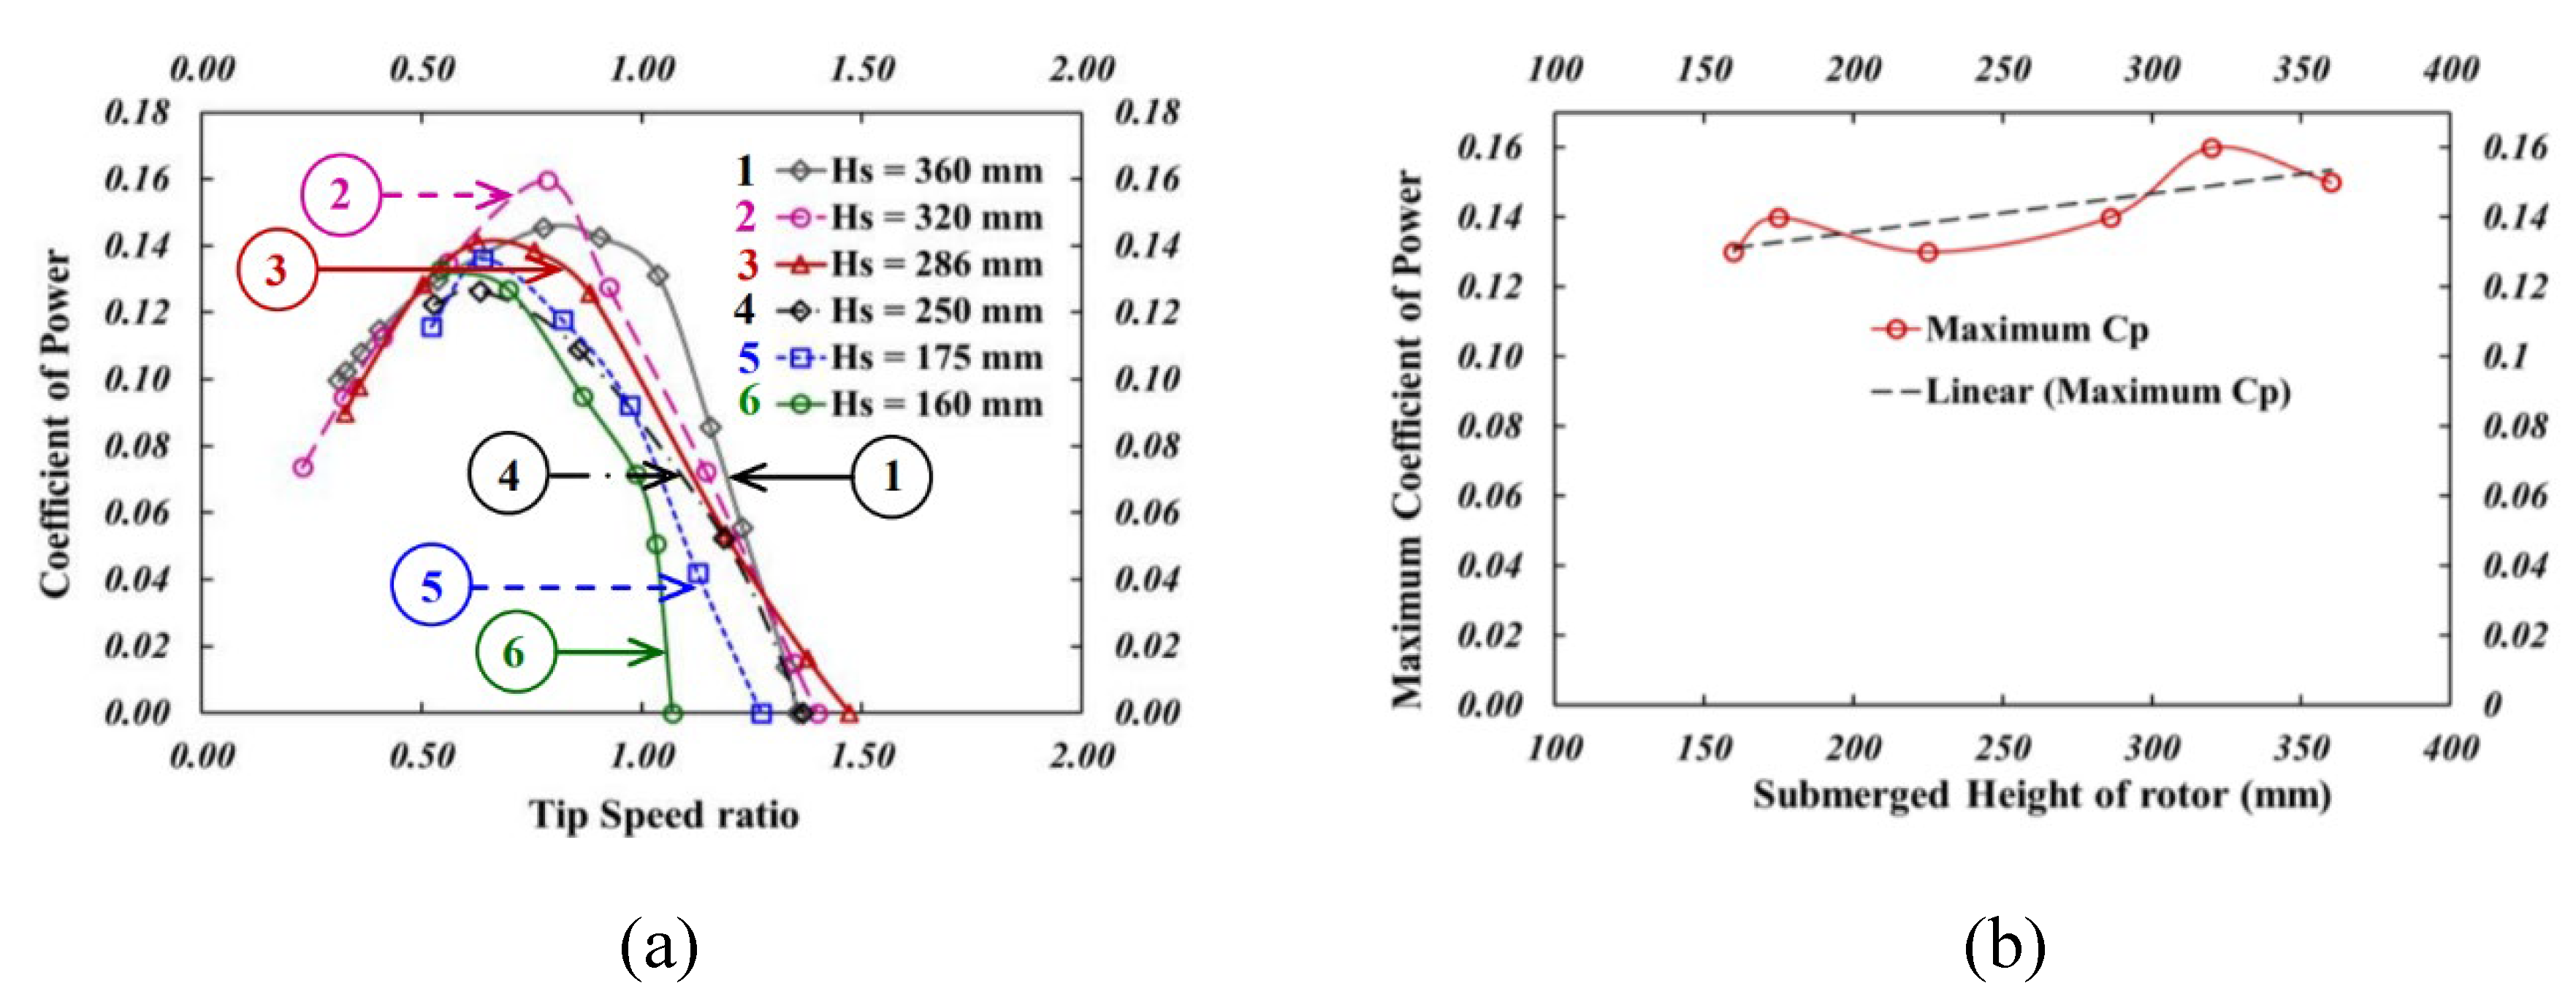
Next article belongs to Vimal Patel et al. [47]. They investigated an axial hydrokinetic turbine placed inside a hydrodynamic channel with dimensions 1000x900 mm. The runner has an outer diameter D1 = 360 mm and its composed of 5 blades. The torque is measured with a dynamometer and a rope. The rotational speed is measered with a chronometer. Experiments are conducted by submerging the runner at six different depth Hs = 160, 175, 250, 286, 320 and 360 mm. The stream velocity is around 0.7m/s. According to the results (Figure 13), the highest value of Cp = 0.16 is achieved at λ = 0.75 and H = 320 mm.
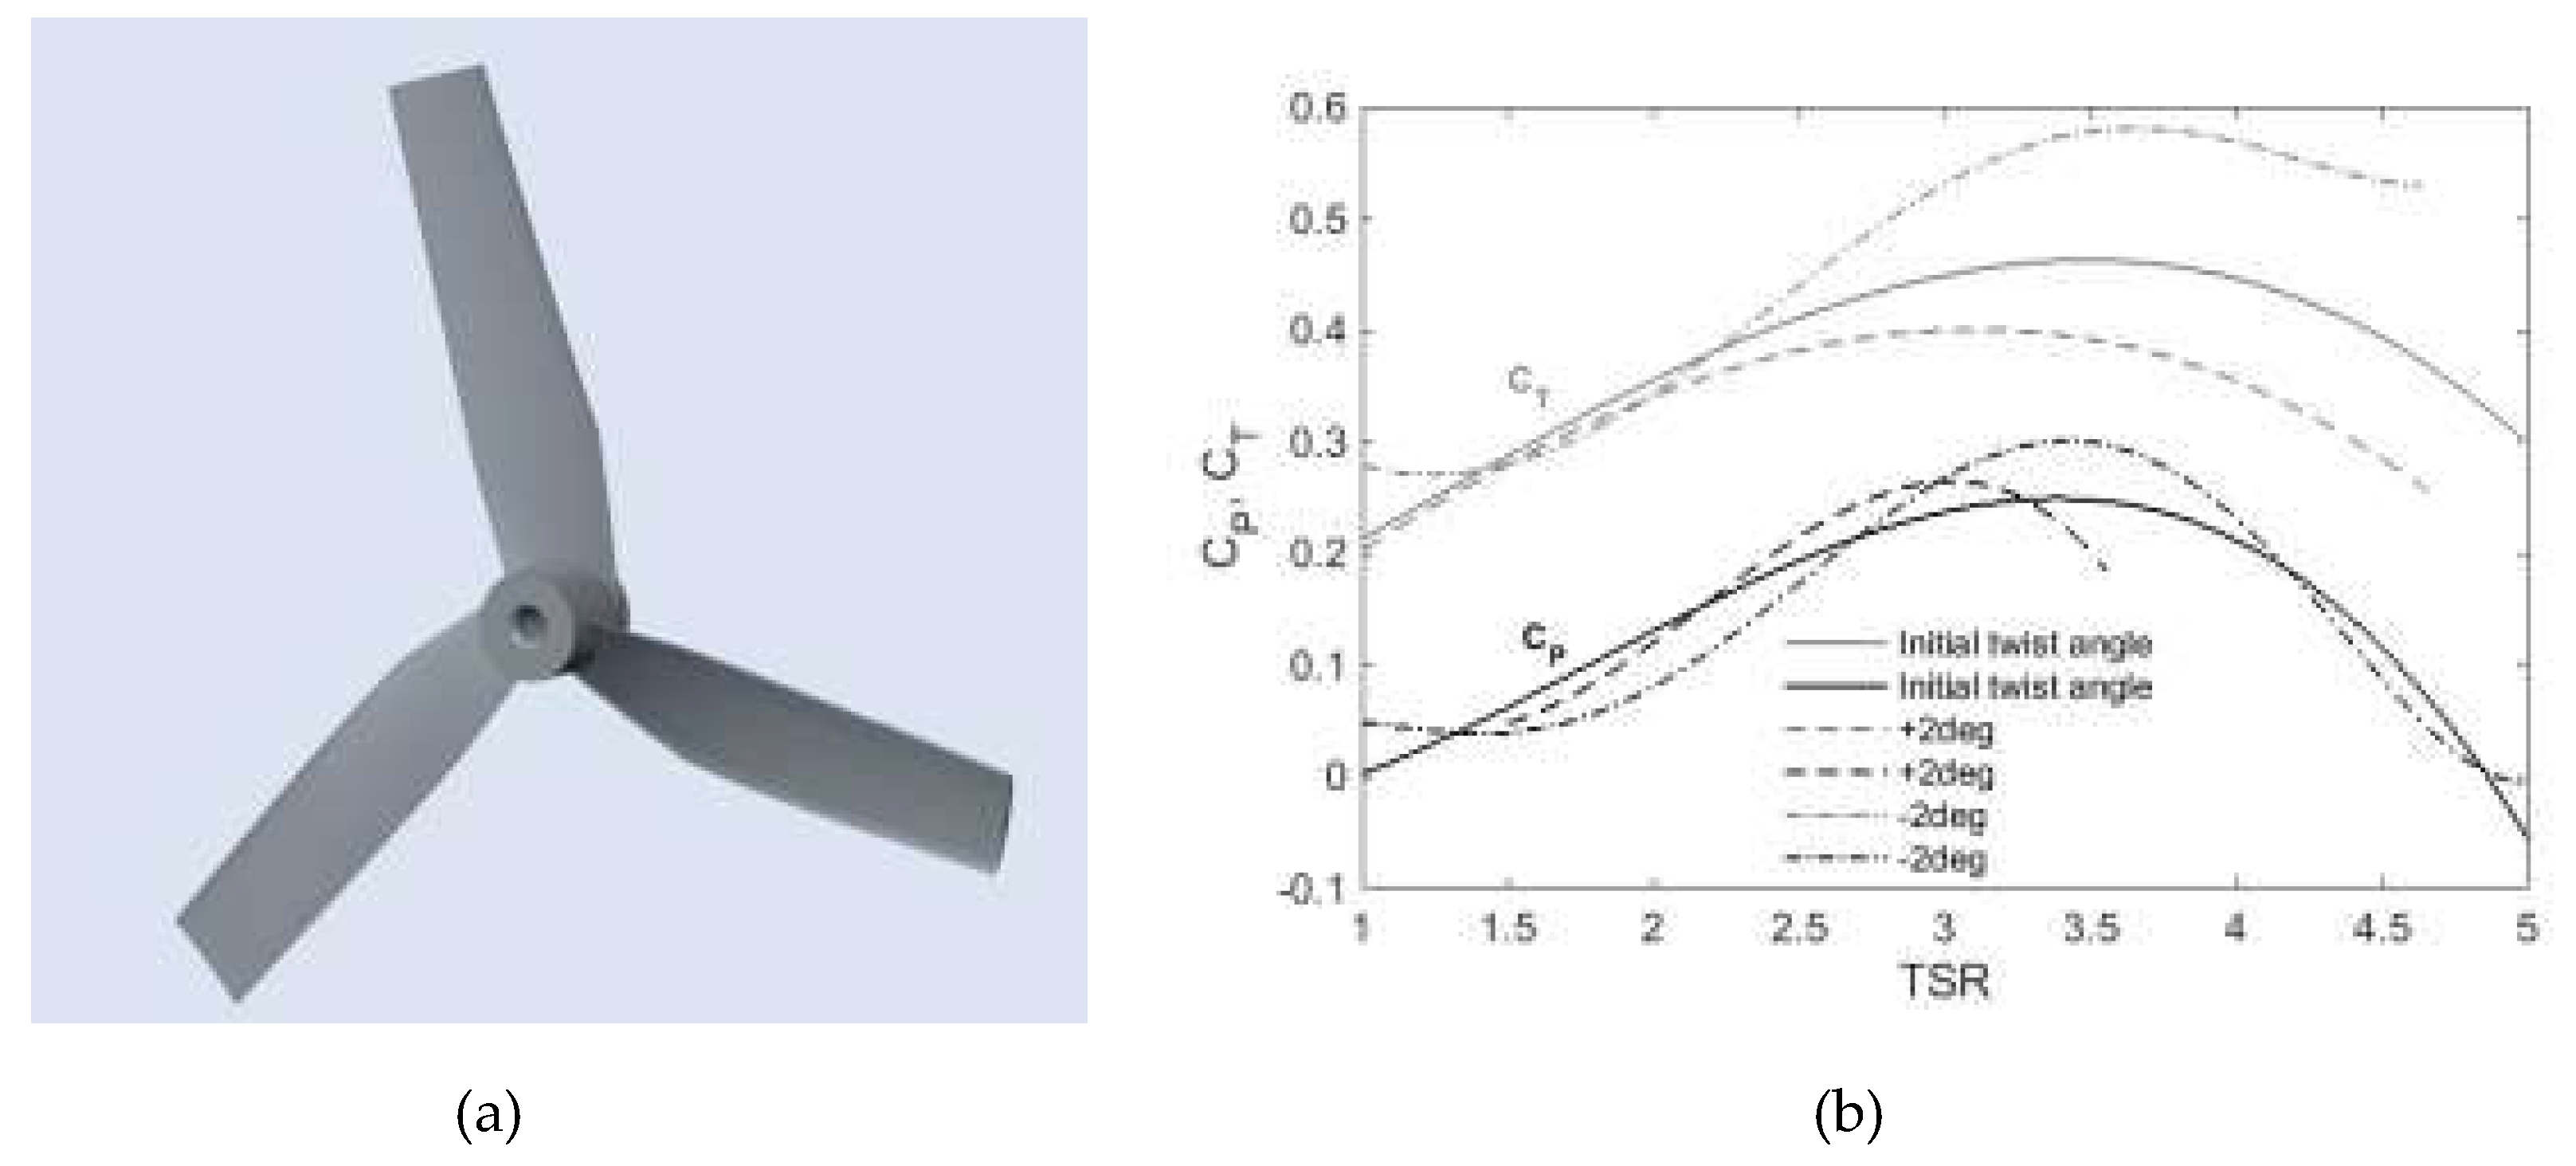
Pournazeri et al. [48] describes in their work an optimization process for the calculating of an axial kinetic turbine with an outer diameter D1 = 110 mm [3]. The blades are using Göttingen 804 profile. They are calculated with two main theories - BEM [40,41] and Momentum theory[42] with 949 variants of the chord length along the blade span and 572 variants of the twist angle. The objective functions are the maximum values of the power coefficient Cp and the thrust force coefficient CT. An optimal version of the working blade (Figure 14 (b)) was obtained, with maximum Cp = 0.3. The studies are carried out in a hydrodynamic channel with stream velocity of 0.45 m/s. In order to validate the calculated geometric parameters, additional studies were made with an offset of the pitch angle of the blades within ± 2 deg. Maximum values of Cp = 0.28 and CT = 0.58 were achieved (Figure 14 (b)).
Paul Danca et al. [49] conduct an experimental study of an axial hydrokinetic turbine with outer diameter D1 = 200 mm, positioned in a hydrodynamic channel with dimensions 1.55D1x1.5D1. The runner has 3 blades with profile NACA4400 (Figure 15 (a)) [49]. It is offset by 0.8xD1 form the floor of the channel. The experiments are carried out at stream velocity of 1.1 m/s at 5 different operating rotational velocities (n = 70, 100, 120, 160 and 210 min-1). The stream velocity is measured with a Pitot Prandtl tube and a differential manometer. Maximum power of 6 W was achieved at a rotational speed of 120 min-1 (Figure 15 (b)).
D. M. Bucur et al. [50] studied two runners of an axial kinetic turbine HT1 and HT2 with outer diameter D1 = 200 mm with 3 profiled blades which differ in the pitch angle along the span. At HT1, the pitch angle changes uniformly from 62.63 deg to 29 deg, while at HT2 it changes from 57.75 deg to 17.07 deg. The experiments are carried out in a hydrodynamic channel at stream velocity Cw = 0.6, 0.7, 0.8, 0.9 and 1 m/s. The water level in the channel is about 275 mm and the dimensions of the control area are 375x300x1015 mm. According to the results of the study (Figure 16), maximum Cp = 0.22 is achieved with runner HT1 at stream velocity Cw = 1.1 m/s, and with HT2 Cp = 0.30. The efficiency of the runner increases with the smaller pitch angles and the large difference in chord lengths in the hub and the peripheral sections.
C. Patel et al. [51] studied the influence of the radius curvature Rtu of the blade’s tip of an axial hydrokinetic turbine with an outer diameter D1 = 86 mm. According to the authors, edge vortices are forming around the leading edge at the tip of the blades, which create additional hydraulic losses thus reducing the efficiency of the turbine. The rounding of the inlet edge at the tip stabilize the flow between the blades and increases the efficiency of the turbine. Five different runners with values of Rtu = 2, 4, 6, 8 and 10 mm were manufactured. The results are presented in Figure 17. The lowest power coefficient Cp = 0.35 is obtained without rounding of the leading edge (Rtu = 0mm), the highest Cp = 0.82 is achived with Rtu = 2 mm. At Rtu = 4 mm Cp decrease with 0.01. Further increasing of Rtu to 10 mm decrease Cp to 0.68.
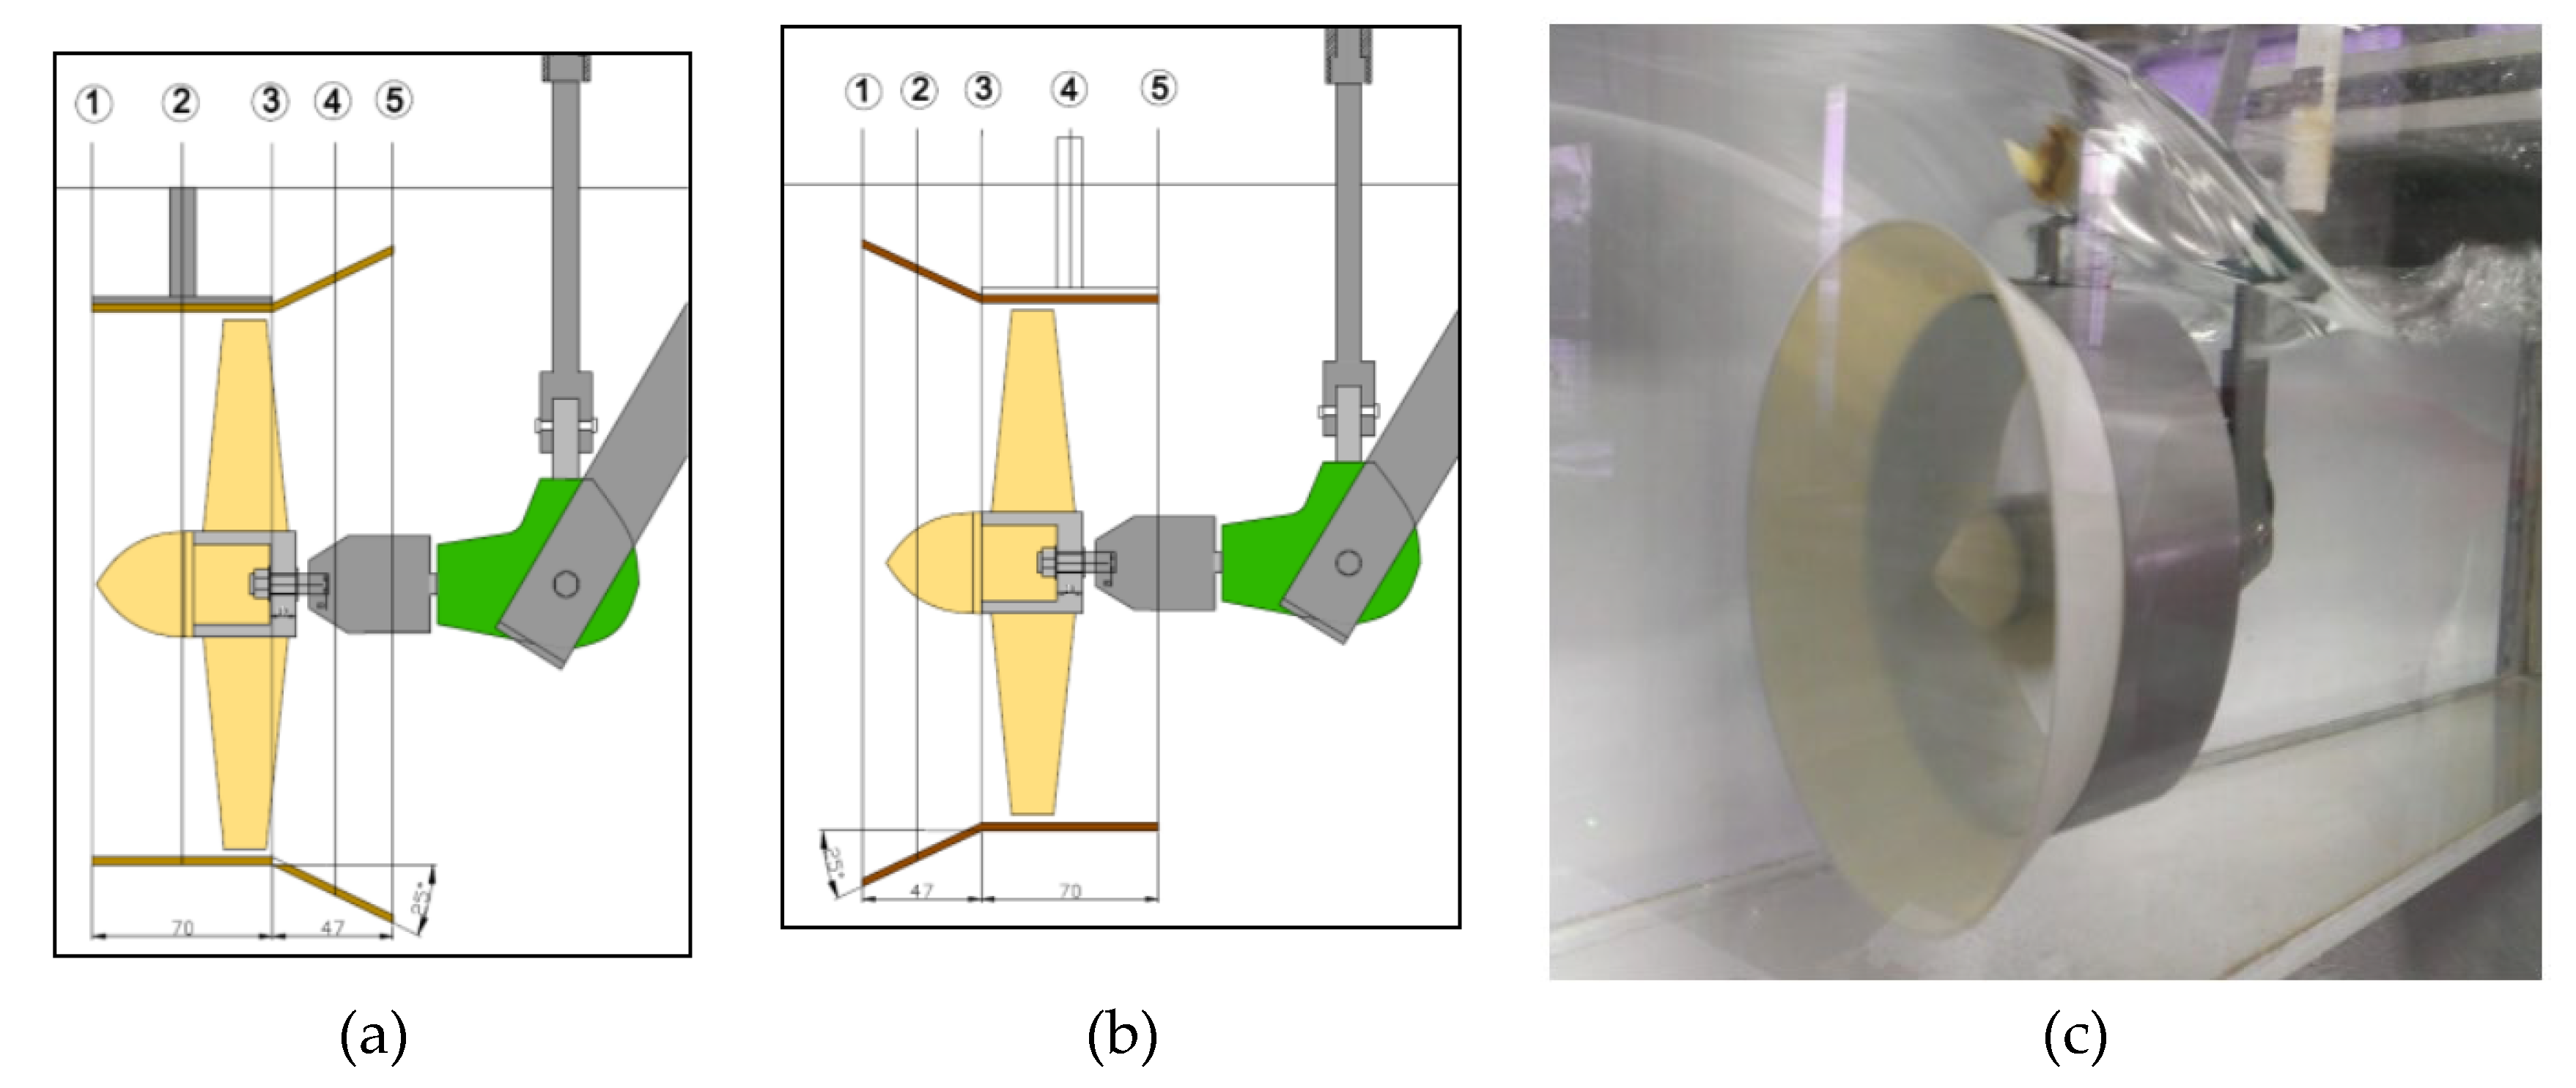
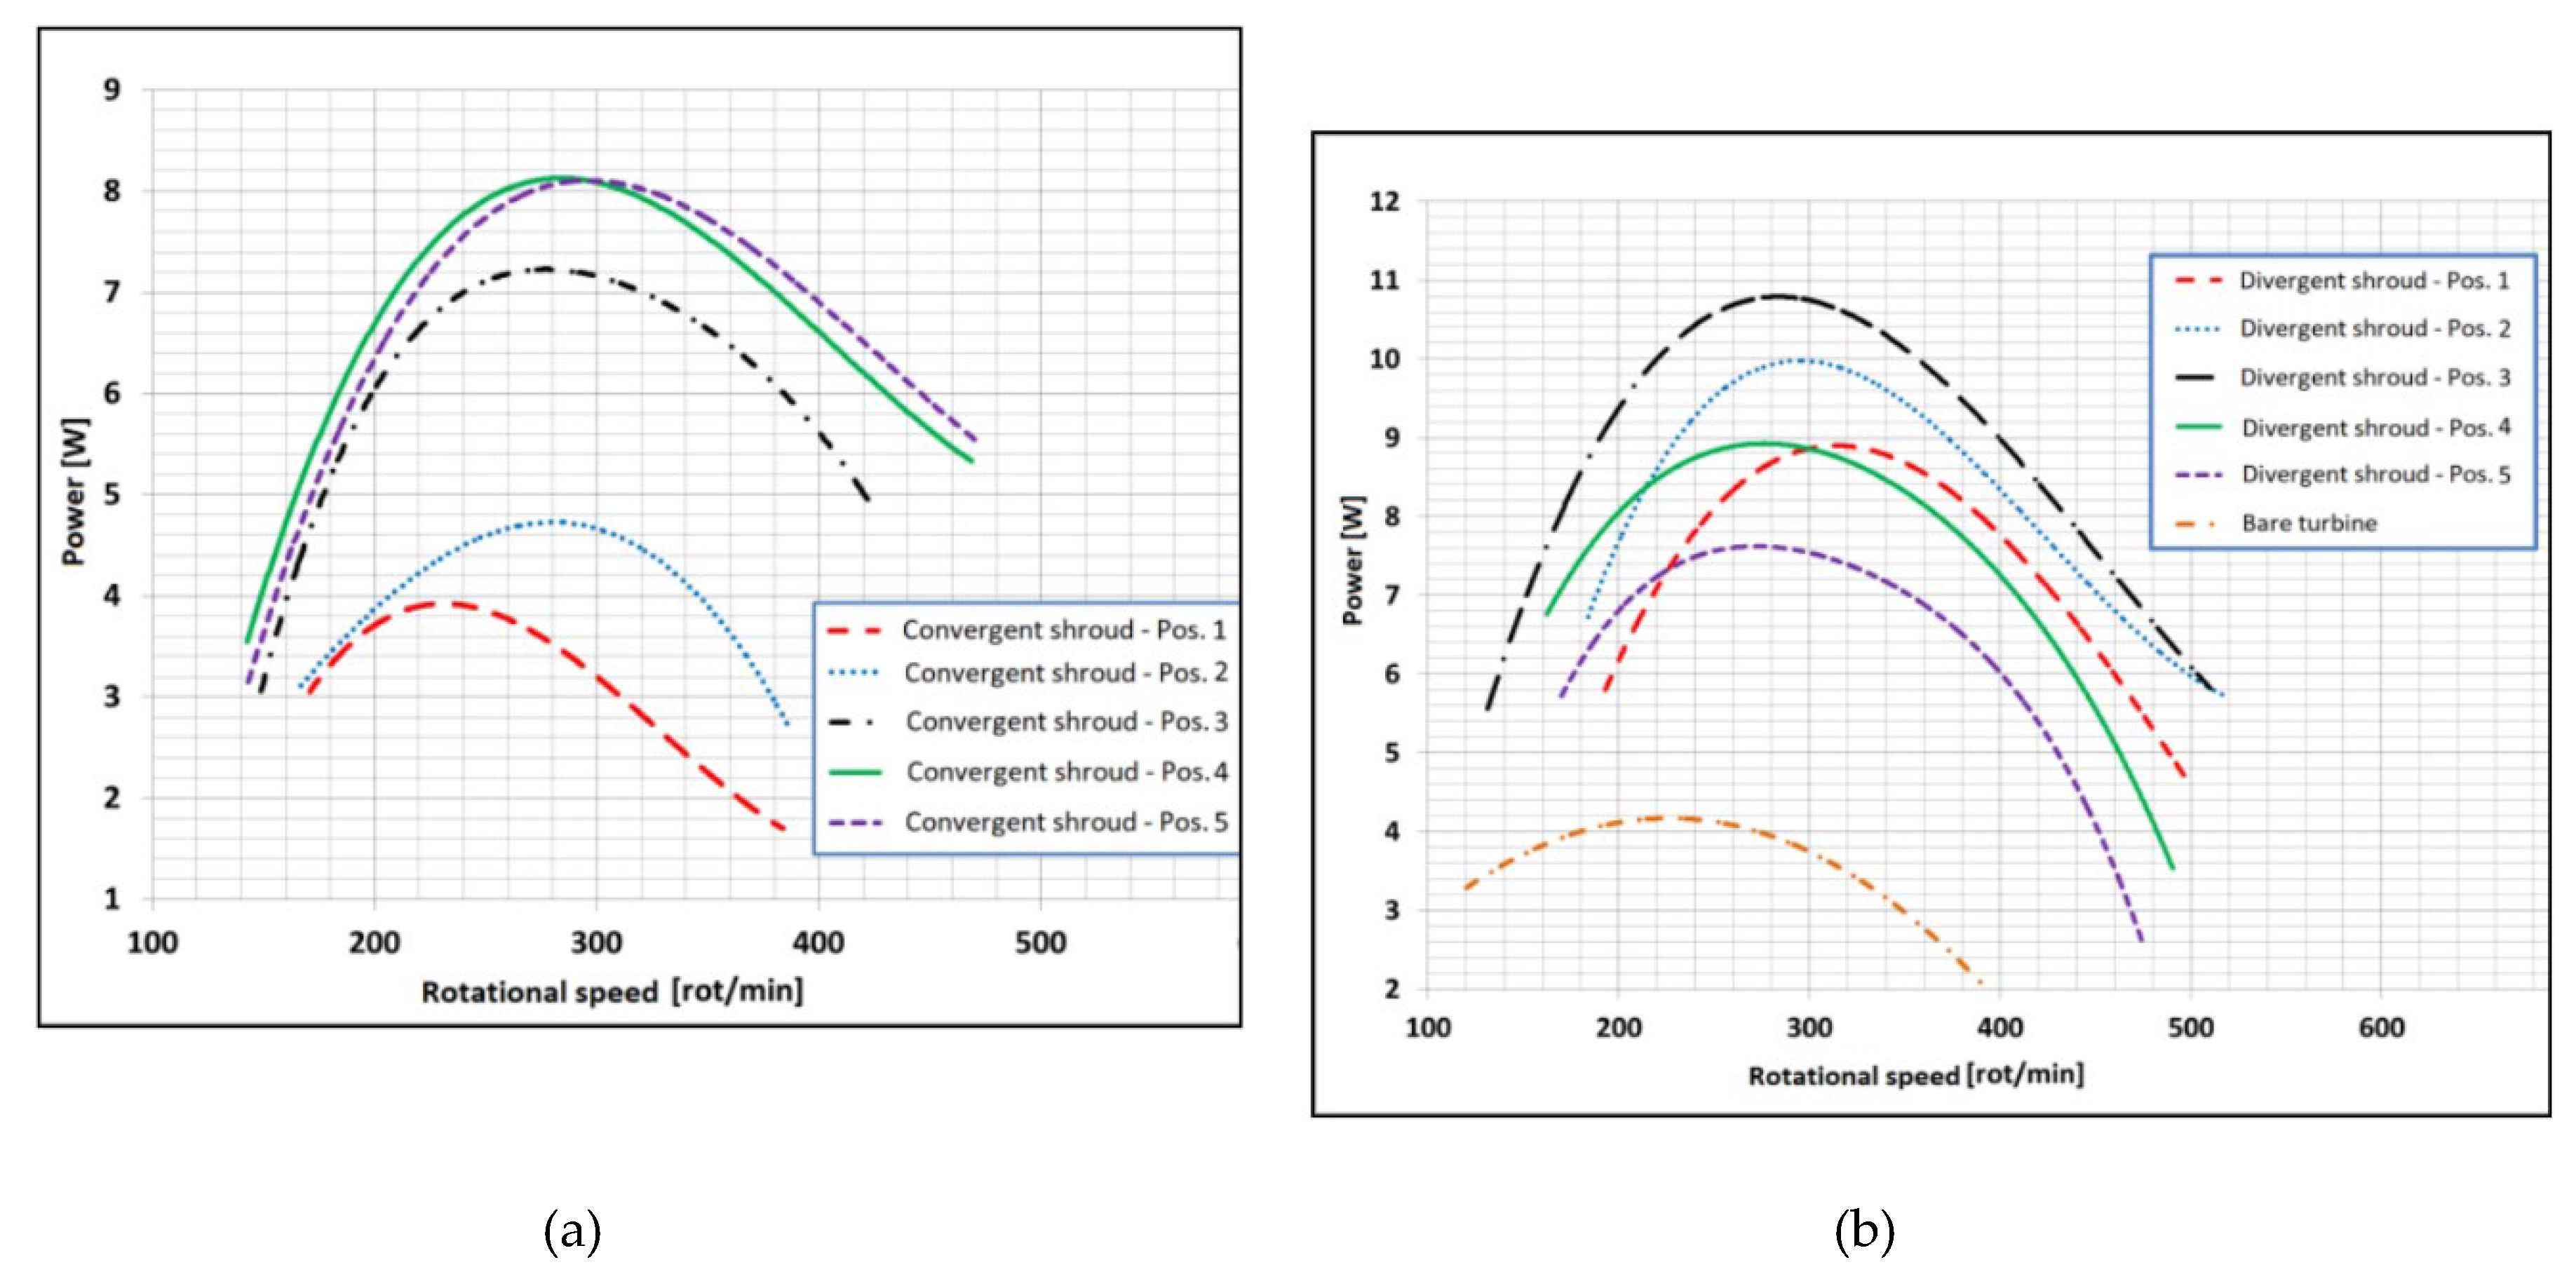
Rareş-Andrei Chihaia et al. [52] investigate an axial hydrokinetic turbine with casing, placed in a hydrodynamic channel with dimensions of the control section 375x300x1015 mm. The experiments are conducted individually with confusor (converged shroud) and diffusor (divergent shroud), placed at both ends of the cylindrical casing. The runner of the turbine has an outer diameter D1 = 200 mm and is composed of 4 blades with variable cross section along the span. The hub diameter is 40 mm. The cylindrical part of the casing has a length L = 70 mm and an internal diameter 206 mm. The conical part has a length L = 47 mm with diameters of the end sections of 206 and 250 mm. The casing can be translated along the axis of the runner with special mechanism. The different operating modes are controlled with the help of an electromagnetic brake. The torque of the runner is transmitted to a vertical shaft via a clutch and bevel gears. It is measured by a torque sensor. Experiments are performed at constant stream velocity of 0.9 m/s. The power and the power coefficient are obtained for 5 different positions of the runner along the casing (Figure 18. Location of the different sections (a) and (b) ; picture of the runner (c) [52]). These positions are: inlet section of the cylindrical part (section 1-1), middle section of the cylindrical part (section 2-2), outlet section of the cylindrical part (section 3-3), middle section of the conical part (section 4-4) and the outlet section of the conical part (section 5-5). According to the results (Figure 19), the highest power coefficient 0.94 is achieved with the help of a diffuser, placed after the runner with the leading edge of the blades overlapping section 3-3. In this case, the shroud is oriented
with its cylindrical part upstream. The lowest value of the power coefficient 0.68 is recorded orienting the conical part of the casing against the flow. The highest value of power coefficient 0.7 is reported in sections 4-4 and 5-5. As the leading edge of the blades approaches the conical part, the power coefficient drops to 0.34. The experimental data in Figure 25 show that placing a diffuser after the outlet section of the hydrokinetic turbine significantly increases its efficiency.
The runner generates maximum power when the leading edge is placed in the middle of the cylindrical part of the casing. The maximum Cp drops about 0.2 when shroud is reversed (i.e. swap the inlet and the outlet). The best results are achieved in sections 4-4 and 5-5, where the leading edge of the blades falls in the middle and in the end of the cylindrical part of the casing.
Dharmesh D. et al. [53] investigated an axial hydrokinetic turbine with an outer diameter D1 = 360 mm and hub diameter 104 mm. The experiments are conducted in an open hydrodynamic channel with a width of 3600 mm, water height of 800 mm at stream velocity of 0.5 m/s [7]. The turbine runner is composed of 5 blades. The loading system is composed of a rope, dynamometer and screw gear that adjust the force of the rope on the shaft. According to the results of the experimental studies (Table 2), maximum power coefficient Cp = 0.178 is achieved at rotational speed 53.61 min-1.
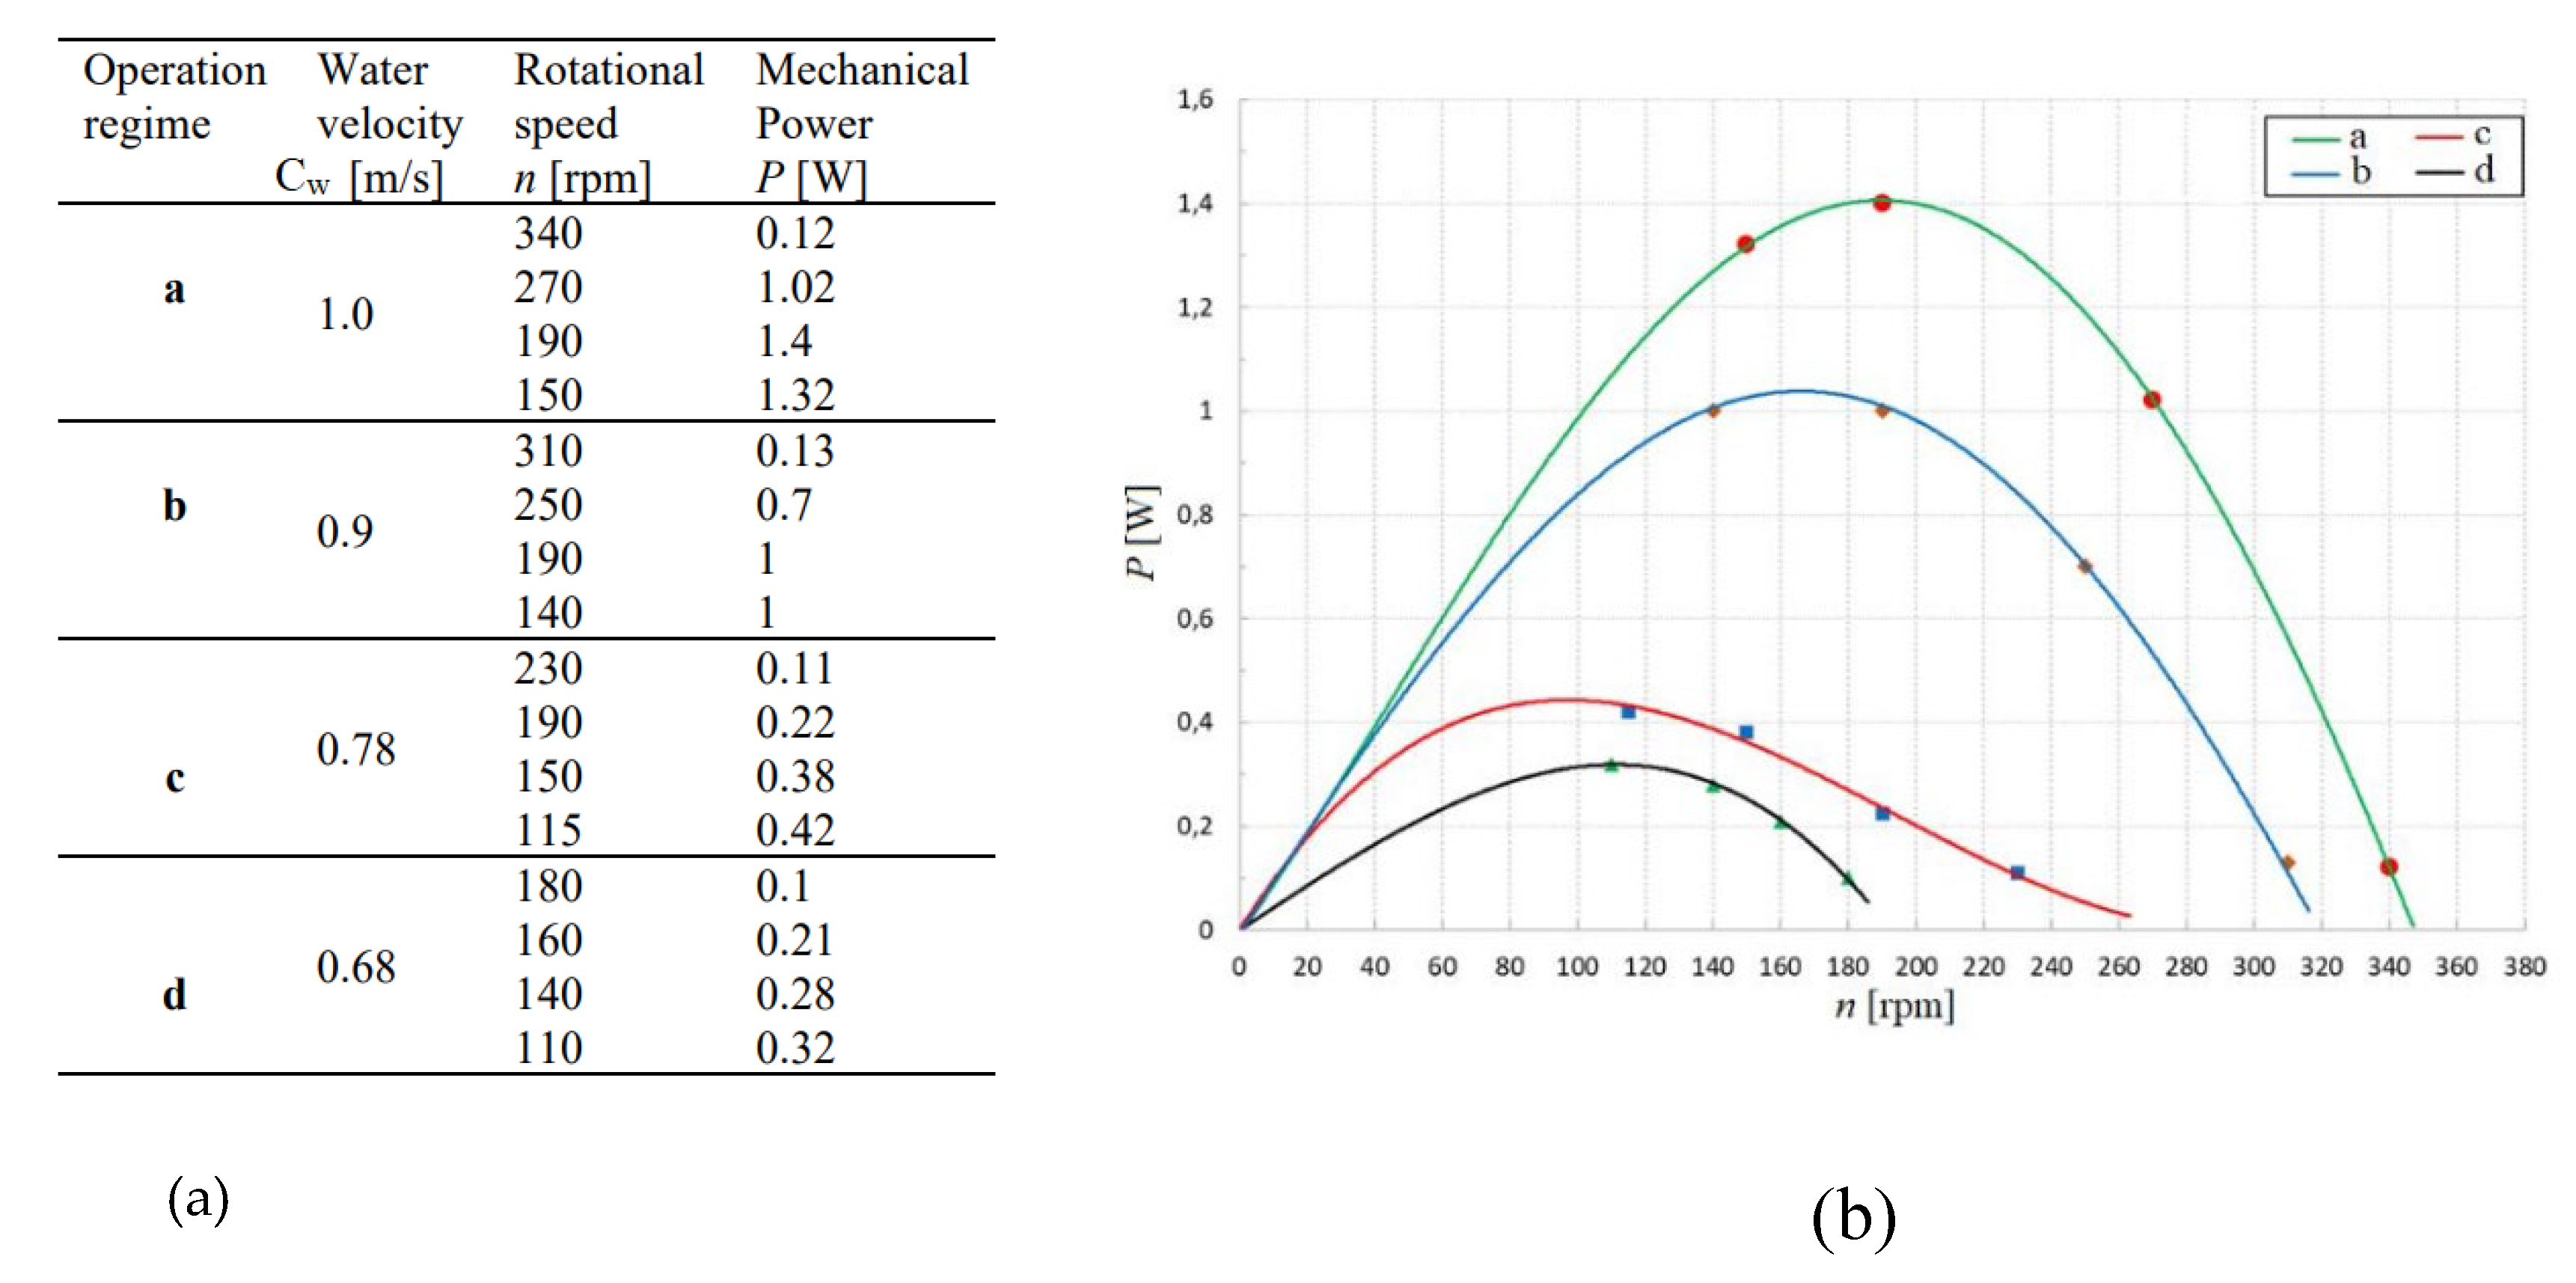
Nedelcul et al. [54] present a study of an axial hydrokinetic turbine placed in front of a 155 mm long conical casing. The diameters of the cross section varies from 142 to 170 mm. The outer diameter of the runner is D1 = 137 mm and of the hub - 80 mm. The experiments are conducted at stream velocities of Cw = 0.68, 0.78, 0.9 and 1 m/s in a hydrodynamic channel with dimensions 375x300x1015 mm. The flow rate is measured by PIV method with monitoring of the trajectory and velocity of the particles. The load on the shaft is created by an electronic brake, positioned above the water level in the channel. The torque of the runner is transmitted to the loading system by bevel gear. Particle velocity measurements are carried out using Dantec system composed of 200 mJ Litron laser and FlowSenseEO_4M 32 CDD camera with resolution of 2072x2072 pixels. Five hundred pictures are recorded of each operating regime. The time interval between laser beams depends on the stream velocity. In this case it is 700 2000 µs. The laser beam is parallel to the flow and the CCD camera is placed perpendicular to the measurement plane. The results from the conducted experiments are presented in Figure 20 in tabular and graphical form.
Optimal operating modes are marked with a red rectangle. According to the data, the highest power of 1.4 W is obtained at stream velocity Cw = 1 m/s and rotational speed n = 190 min-1. It should be noted that the calculated power coefficient reaches values greater than 1. That data is not presented in the publication which casts doubt on the accuracy of the conducted physical experiment. One possible reason is the outside diameter of the runner, which is smaller than the allowable (350 mm) for model studies of turbine runners.
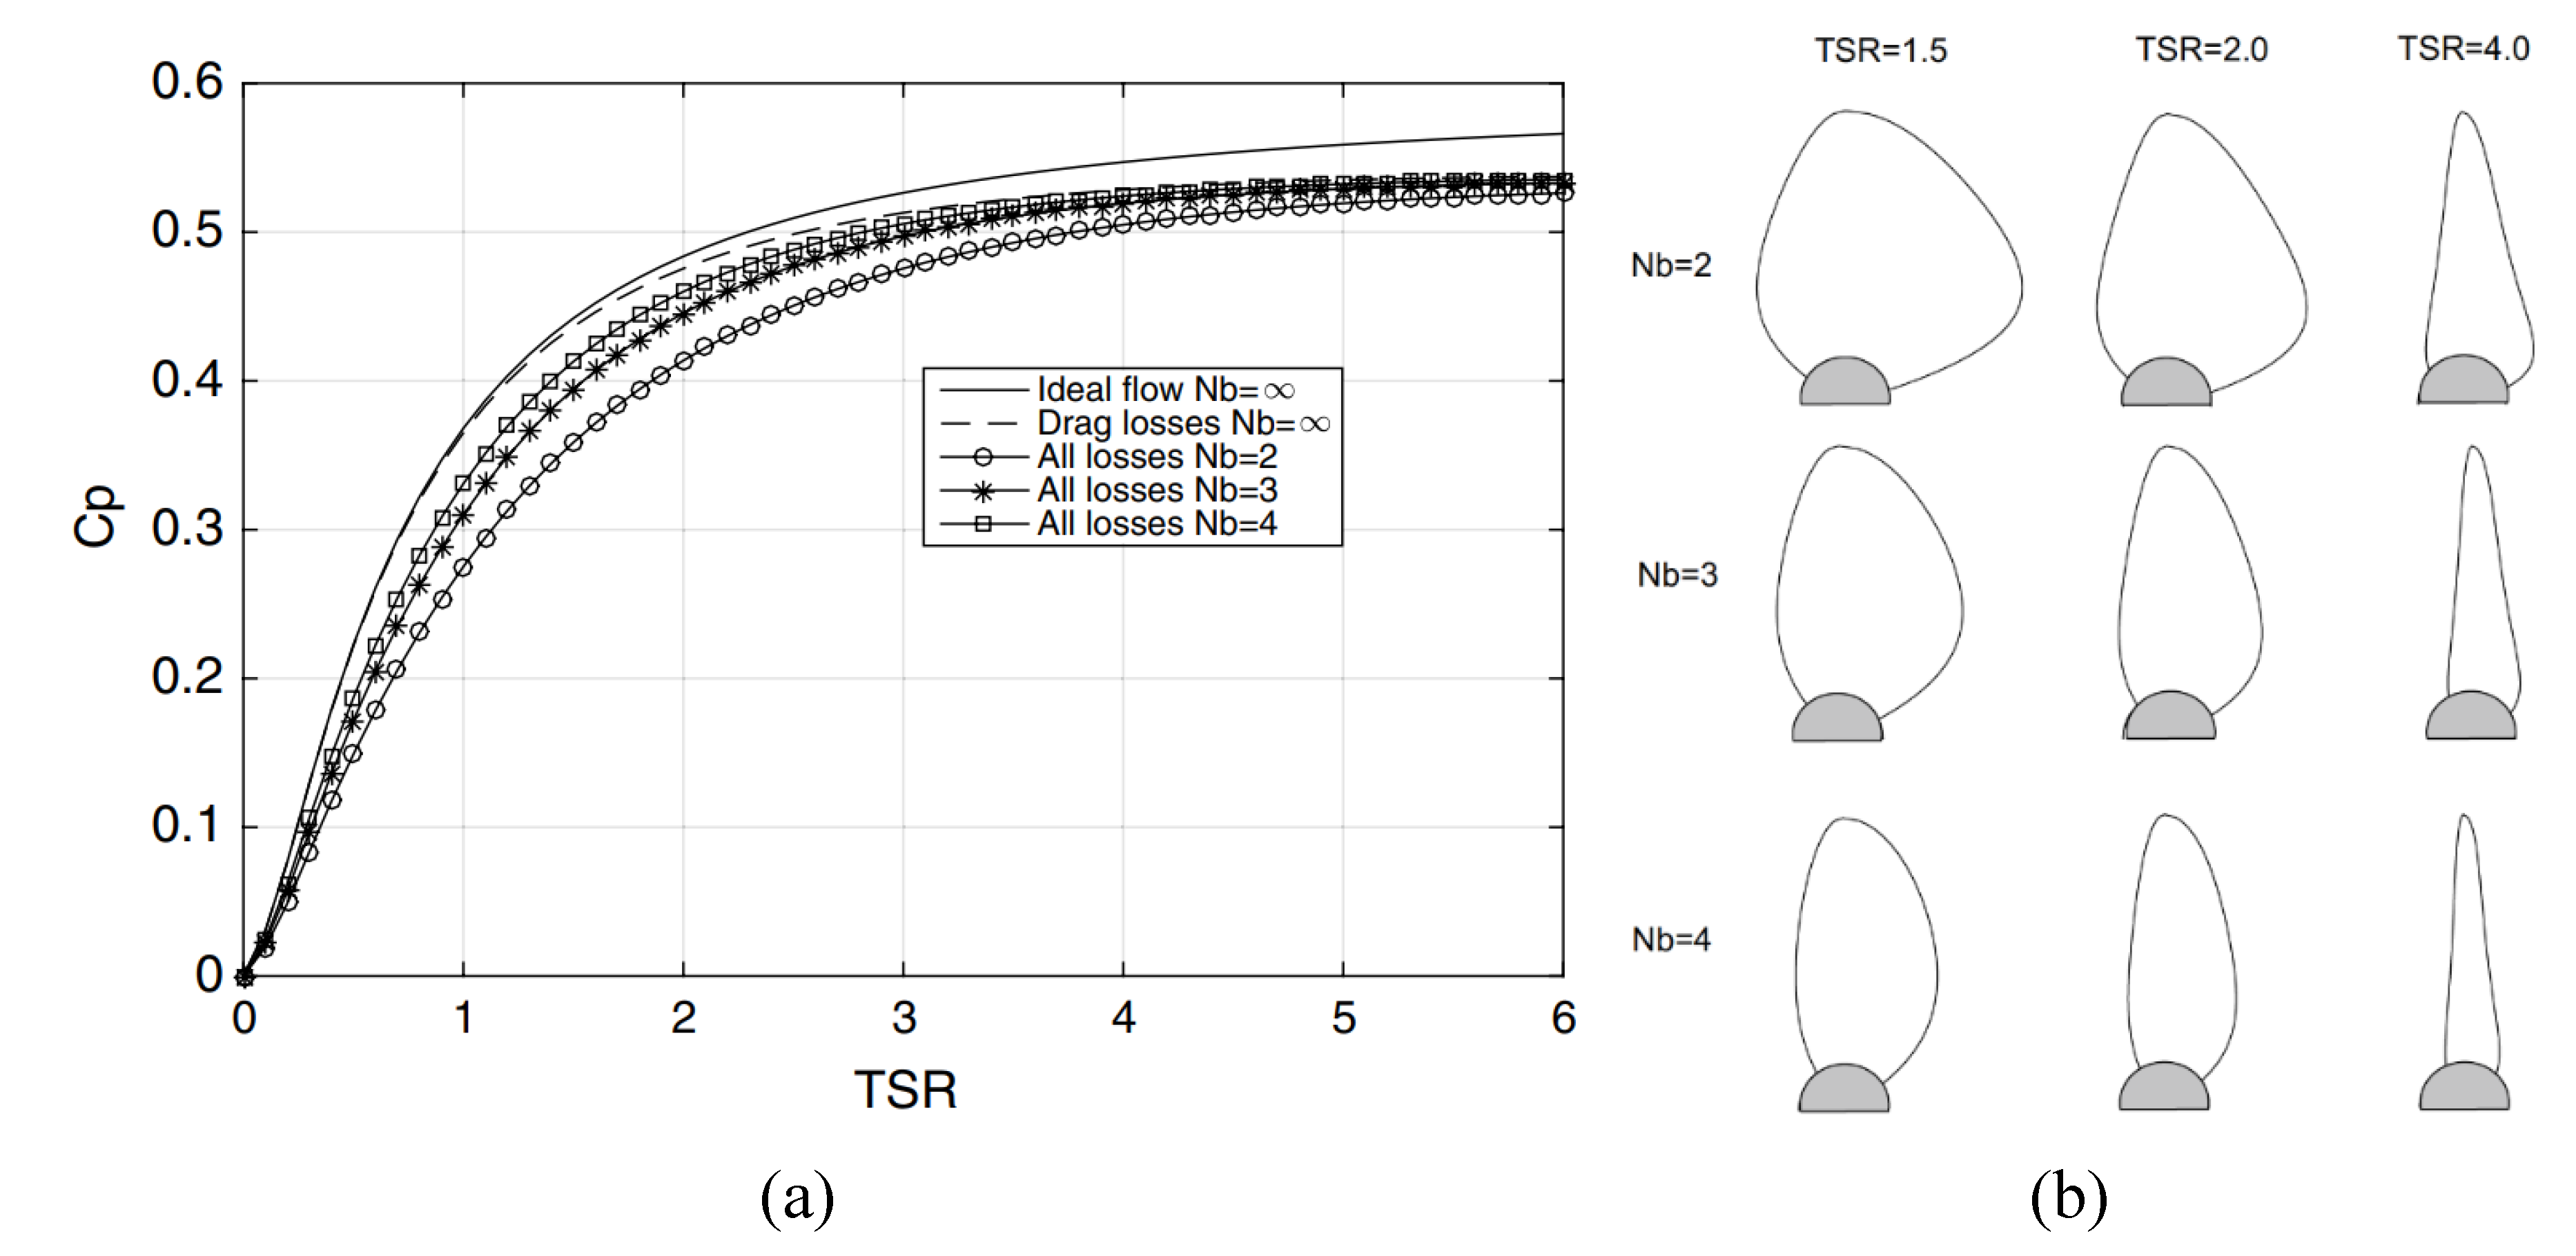
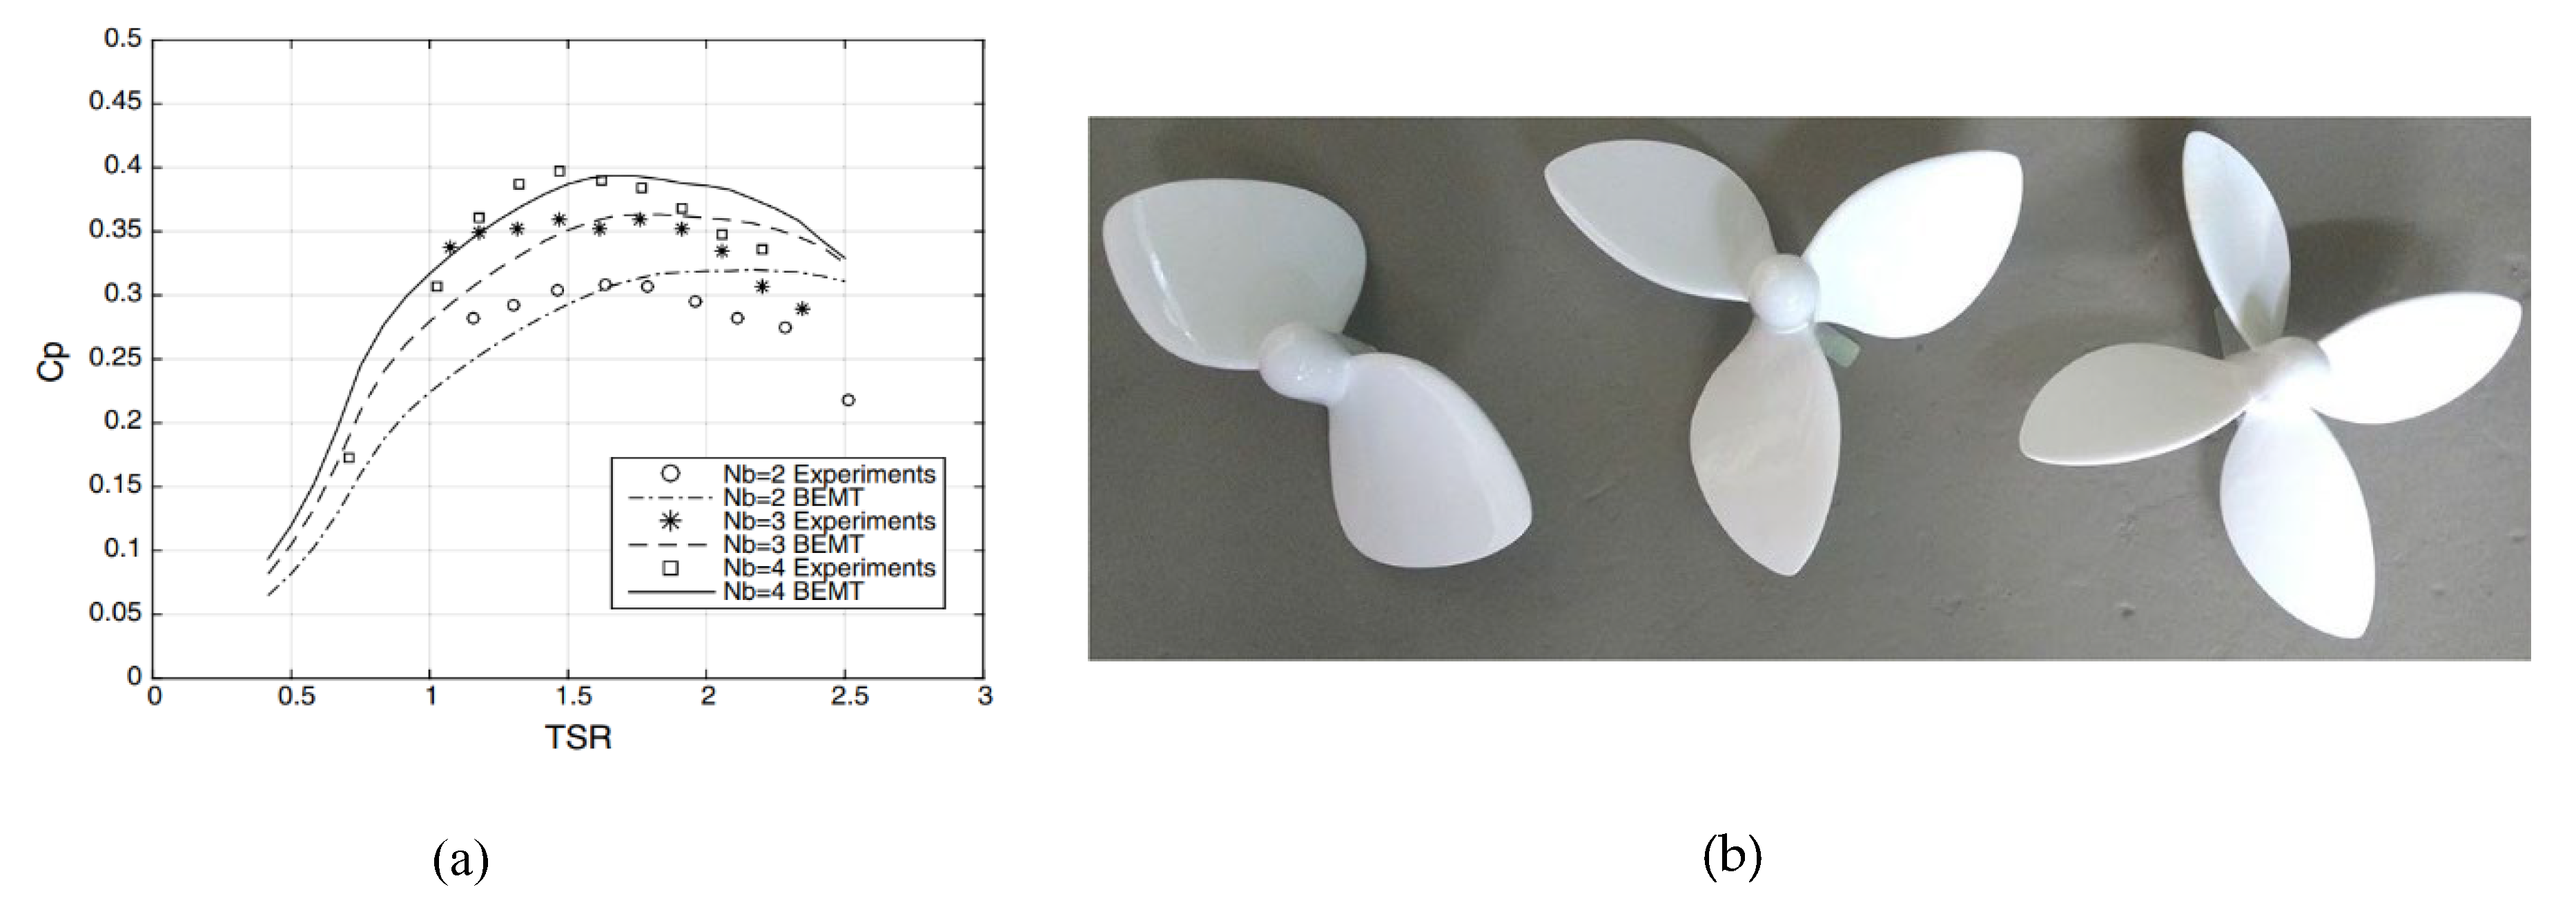
Antonio C et al. [55] describe an analytical mathematical model for the calculation of the blade cascade of an axial kinetic turbine. Three different runners with 2, 3 and 4 blades were manufactured, optimized with the presented methology. The experimental studies are carried out in an open aerodynamic tunnel with dimensions of the control section 1200x1200 mm. The numerical results are presented in Figure 21 (a), and the optimized blade geometry at fixed number of blades and tip speed ratio, in Figure 21 (b). The dependence of Cp on λ resembles a logarithmic function with a maximum value of 0.55 for an infinite number of blades, neglecting flow losses. With consideration of blade cascade hydraulic losses, the maximum power coefficient drops to 0.53. The difference in Cp.increase with decreasing of TSR - λ. According to the data, as the number of blades Nb and λ increases, the chord length along the span of the blades decreases (Figure 21 (b)), and the shape sharpens towards the tip section. The results of the physical experiment are shown in Figure 22 (a). The experimental operating curves (Figure 22 (a)) approach the theoretical at λ = 1-1.75 with a maximum difference in Cp of 0.02 at the peak point. Maximum power coefficient of 0.4 is achieved with a four bladed runner, 0.35 with a three blades runner and 0.3 with a two bladed runner.
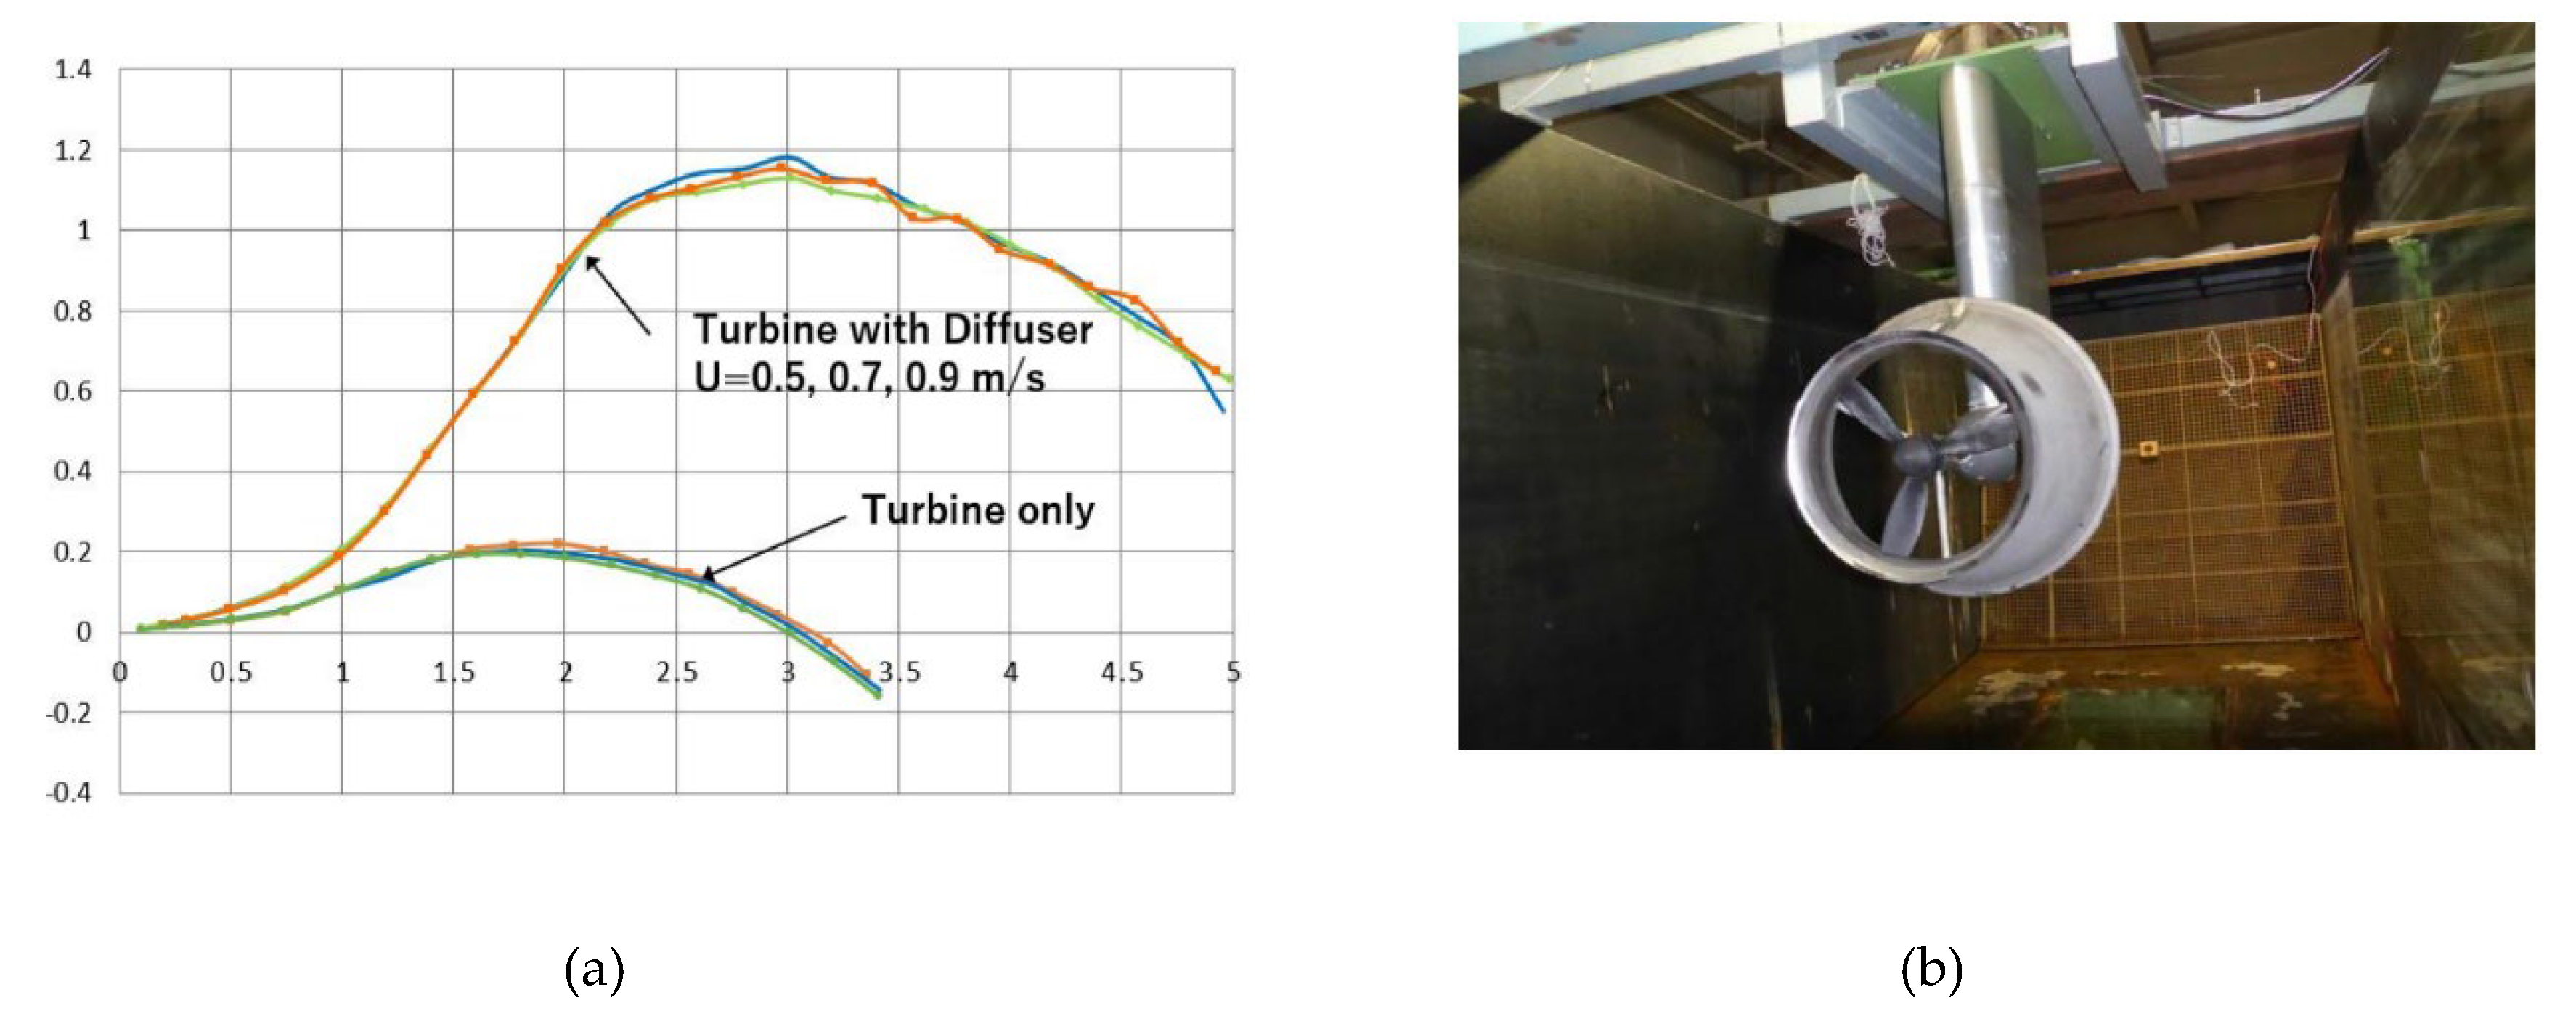
Kyozuka Y. et al.[56] present a numerical optimization of a three bladed axial hydrokinetic turbine with diffuser casing. The runner of the model turbine has an outer diameter D1 = 0.3 m. It is composed of 3 profiled NACA4616 blades. The shape of the diffuser casing is optimized with a numerical design of experiment (DOE) with 64 control points based on artificial neural network developed at the von Karman Institute for Fluid Dynamics[57]. The objective function is the power coefficient Cp. The numerical model is composed of 450000 cells (70000 tetrahedral and 380000 hexacore - Figure 23 (a)). A k-omega turbulence model is used. The dimensionless height of the first layer cells along the inner contour of the casing is y+ = 20. The inlet section of the surrounding space is located at a distance of 2.7xD1 from the cylindrical part of the diffuser casing, and the outlet section at 3.3xD1 from the conical part of the diffuser casing. The boundary conditions are: Velocity inlet with velocity set at 1m/s and Pressure outlet with a pressure set at 0 Pa. The different operating modes of the turbine are calculated by the Frozen Rotor method with the technique of sliding mesh. The velocity and pressure distribution in the casing and the torque of the turbine runner are calculated by solving the Naiver Stokes differential equations. The results of the numerical optimization are presented in figure 38 in tabular and graphical form. The shape of the runner’s fairing and diffuser casing are determined with 7 control points.
The physical experiments are conducted in two hydrodynamic channels with dimensions 6x1.5x1.3 m and 65x5x7 m in the laboratory of Applied Mechanics at RIAM Kyushu University [58]. The diameter of the model runner is D1 = 0.3 m, and the optimal external diameter of the conical part of the casing is 1.64xD1 with an inclination angle of 64 deg. Adhering the optimization data, the inlet part of the casing has the contour of a diffusor with slope angle 15.9 deg. The operating curves of the model turbine with an without a diffuser casing are obtained for several operating modes at stream flow Cw = 0.5, 0.7 and 0.9 m/s. The results are presented in Figure 23. The maximum power coefficient is 0.2 at tip speed ratio λ = 2, and those with a casing have power coefficient 1.2 at λ = 3.
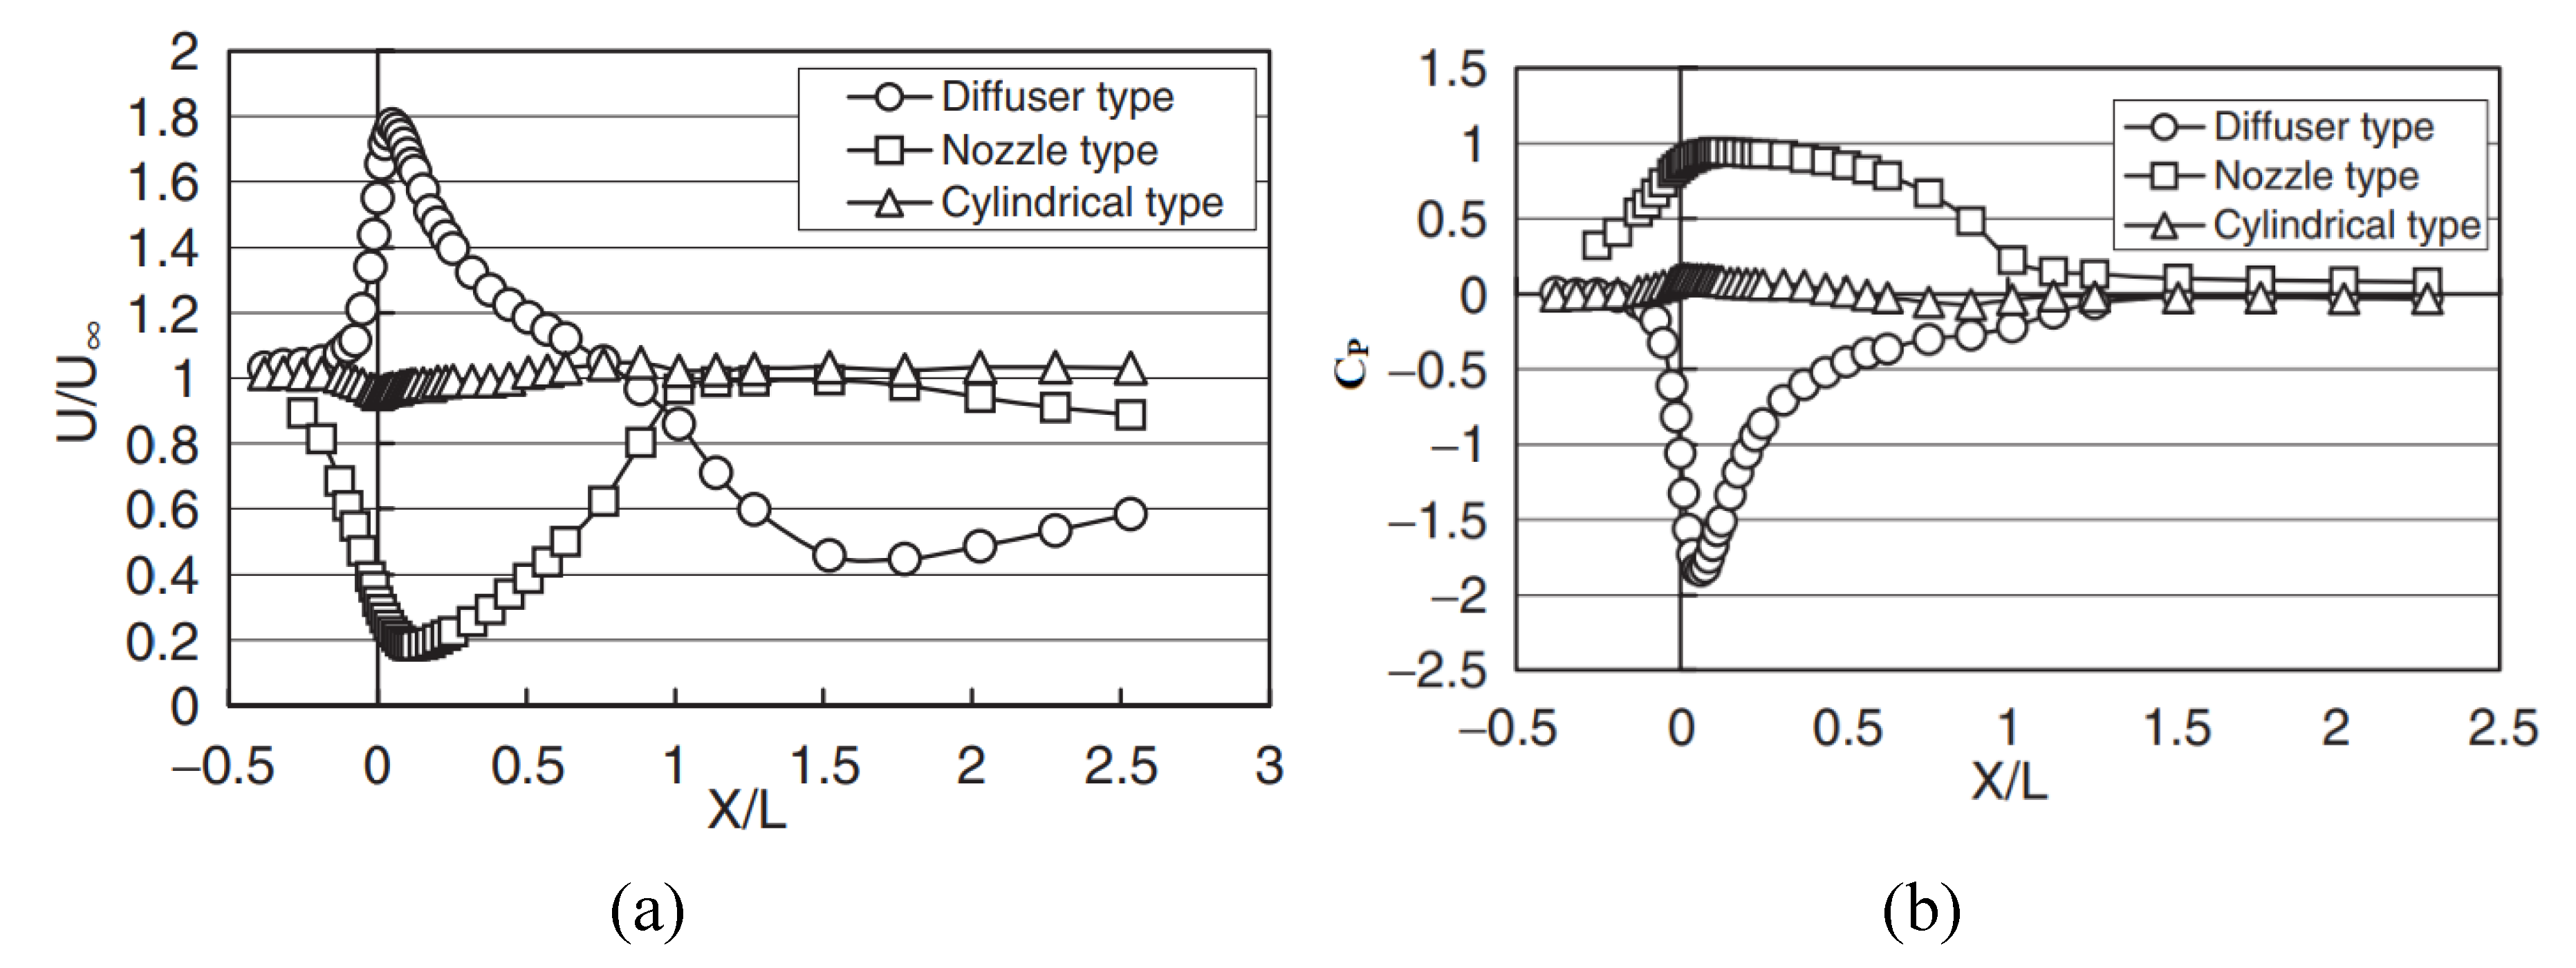
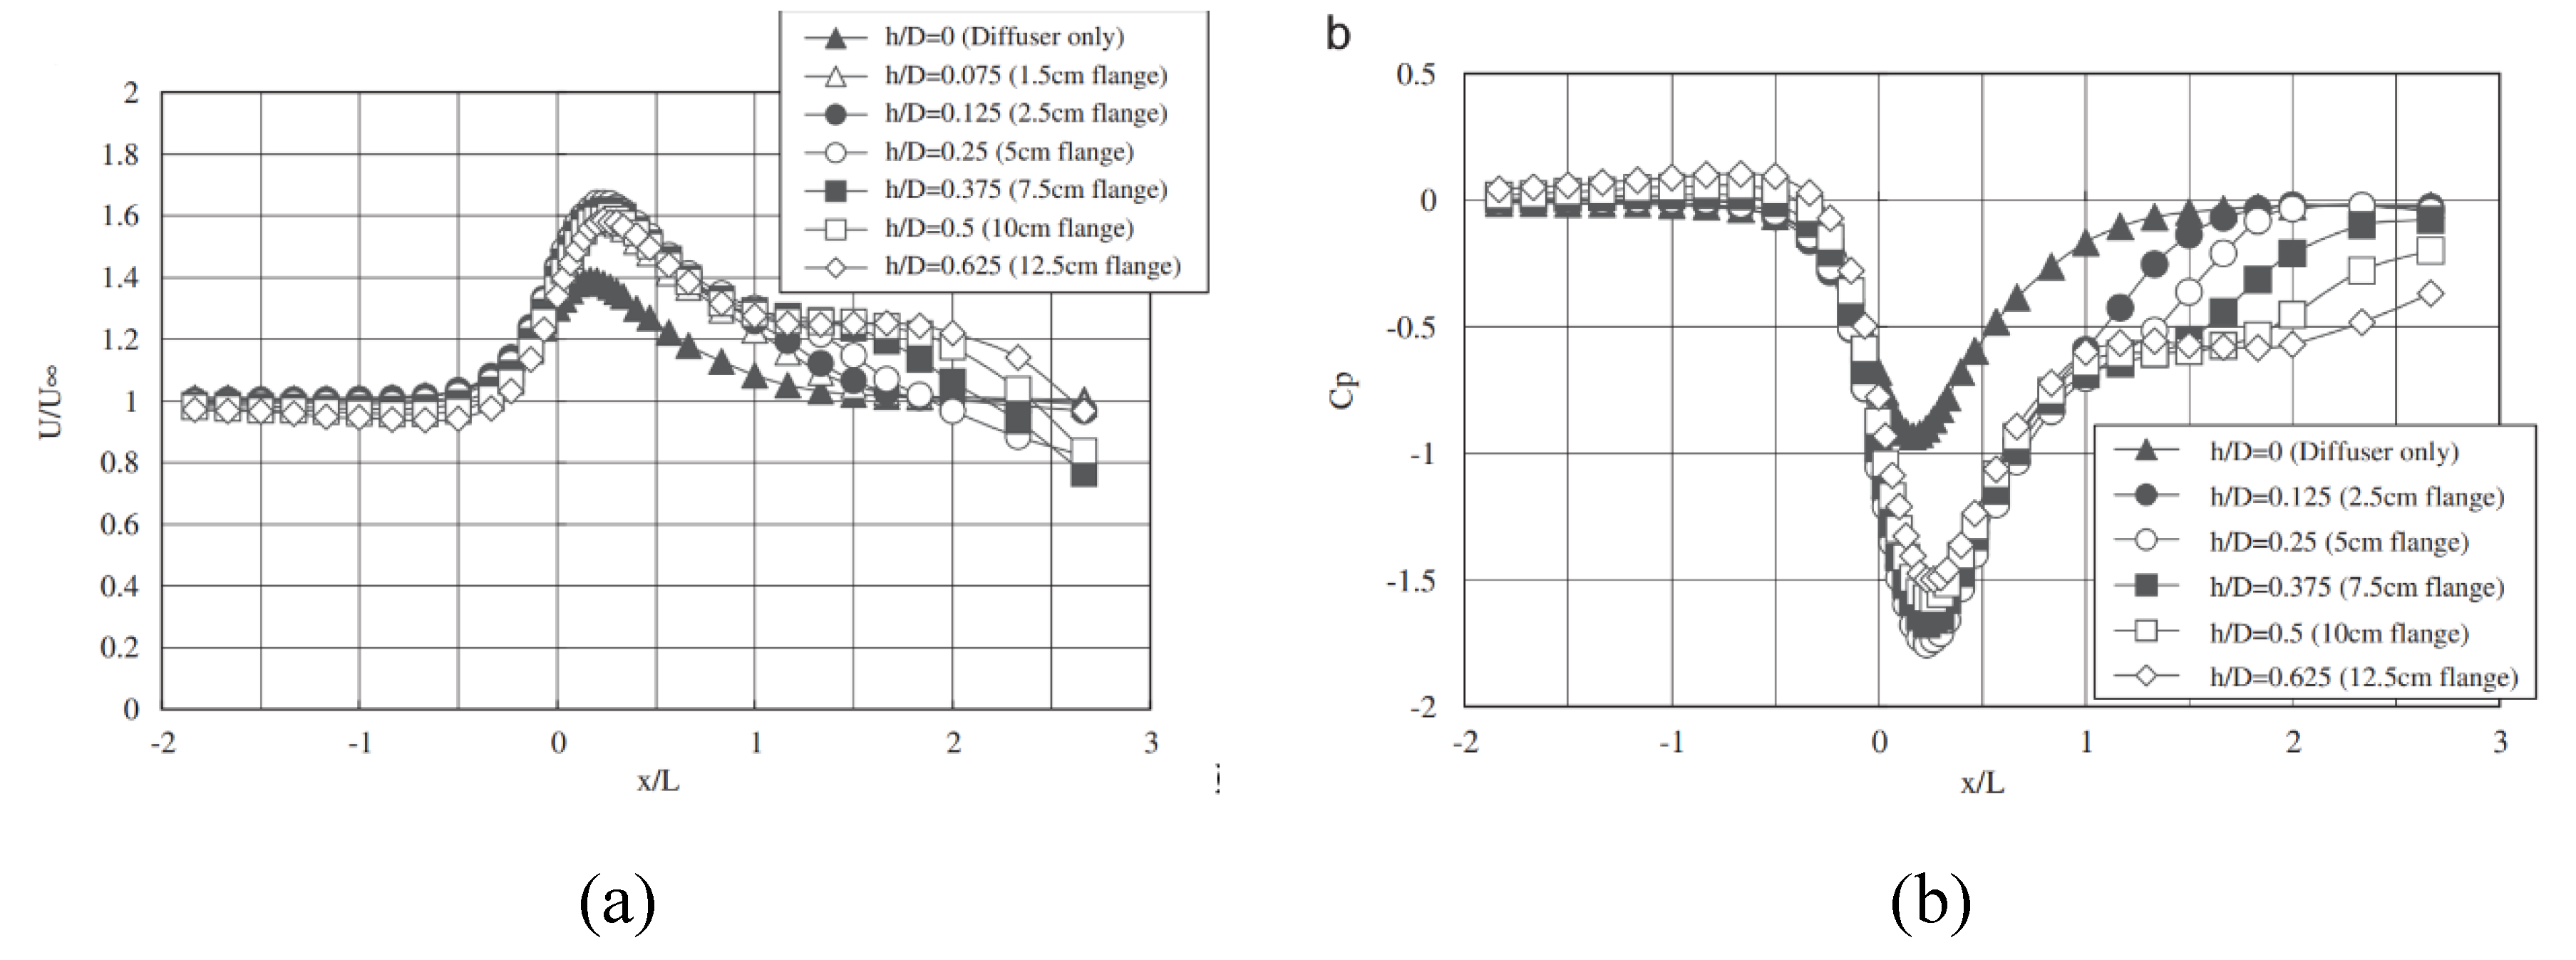
Ohya O et al. [59] present optimization of the casing of a horizontal axis wind turbine (HAWT) using an innovative diffuser that increases the efficiency of the turbine by 2.5 times. With slight modifications, the design can be used in the field of water kinetic turbines. The physical experiments are conducted in wind tunnel with dimensions 3.6x2x15 m at the institute of Applied Mechanics, Kyushu University in Japan [58]. The studied shapes of the casing have a rectangular cross section. These shapes are a confusor, a straight cylindrical pipe and a diffuser. According to the data (Figure 24), the confusor creates a sharp drop in the velocity in the inlet section. The flow gradually recovers its initial value along the confusor until it reaches the exit section. A sharp peak in the static pressure is reported near the inlet section. The reason for this is the large frontal resistance created by the narrowest cross section. It determines the amount of flow that can pass through the casing while the rest of it tends to bypass the confusor. The straight pipeline casing does not significantly affect the flow parameters. The parameters of the stream along the length of the diffusor casing change opposite to those in the confusor. An increase in the dimensionless velocity in the inlet section of 1.8 is observed, which gradually decrease to 0.6 in the outlet section. The pressure coefficient in the inlet section reaches negative value of -1.8, which is an indicator of the creation of vacuum. Approaching the exit section, the pressure reaches the environmental value. The authors claim that the reason for the local increase in velocity at the inlet of the diffuser casing is the vortex wake that growing towards the exit section.
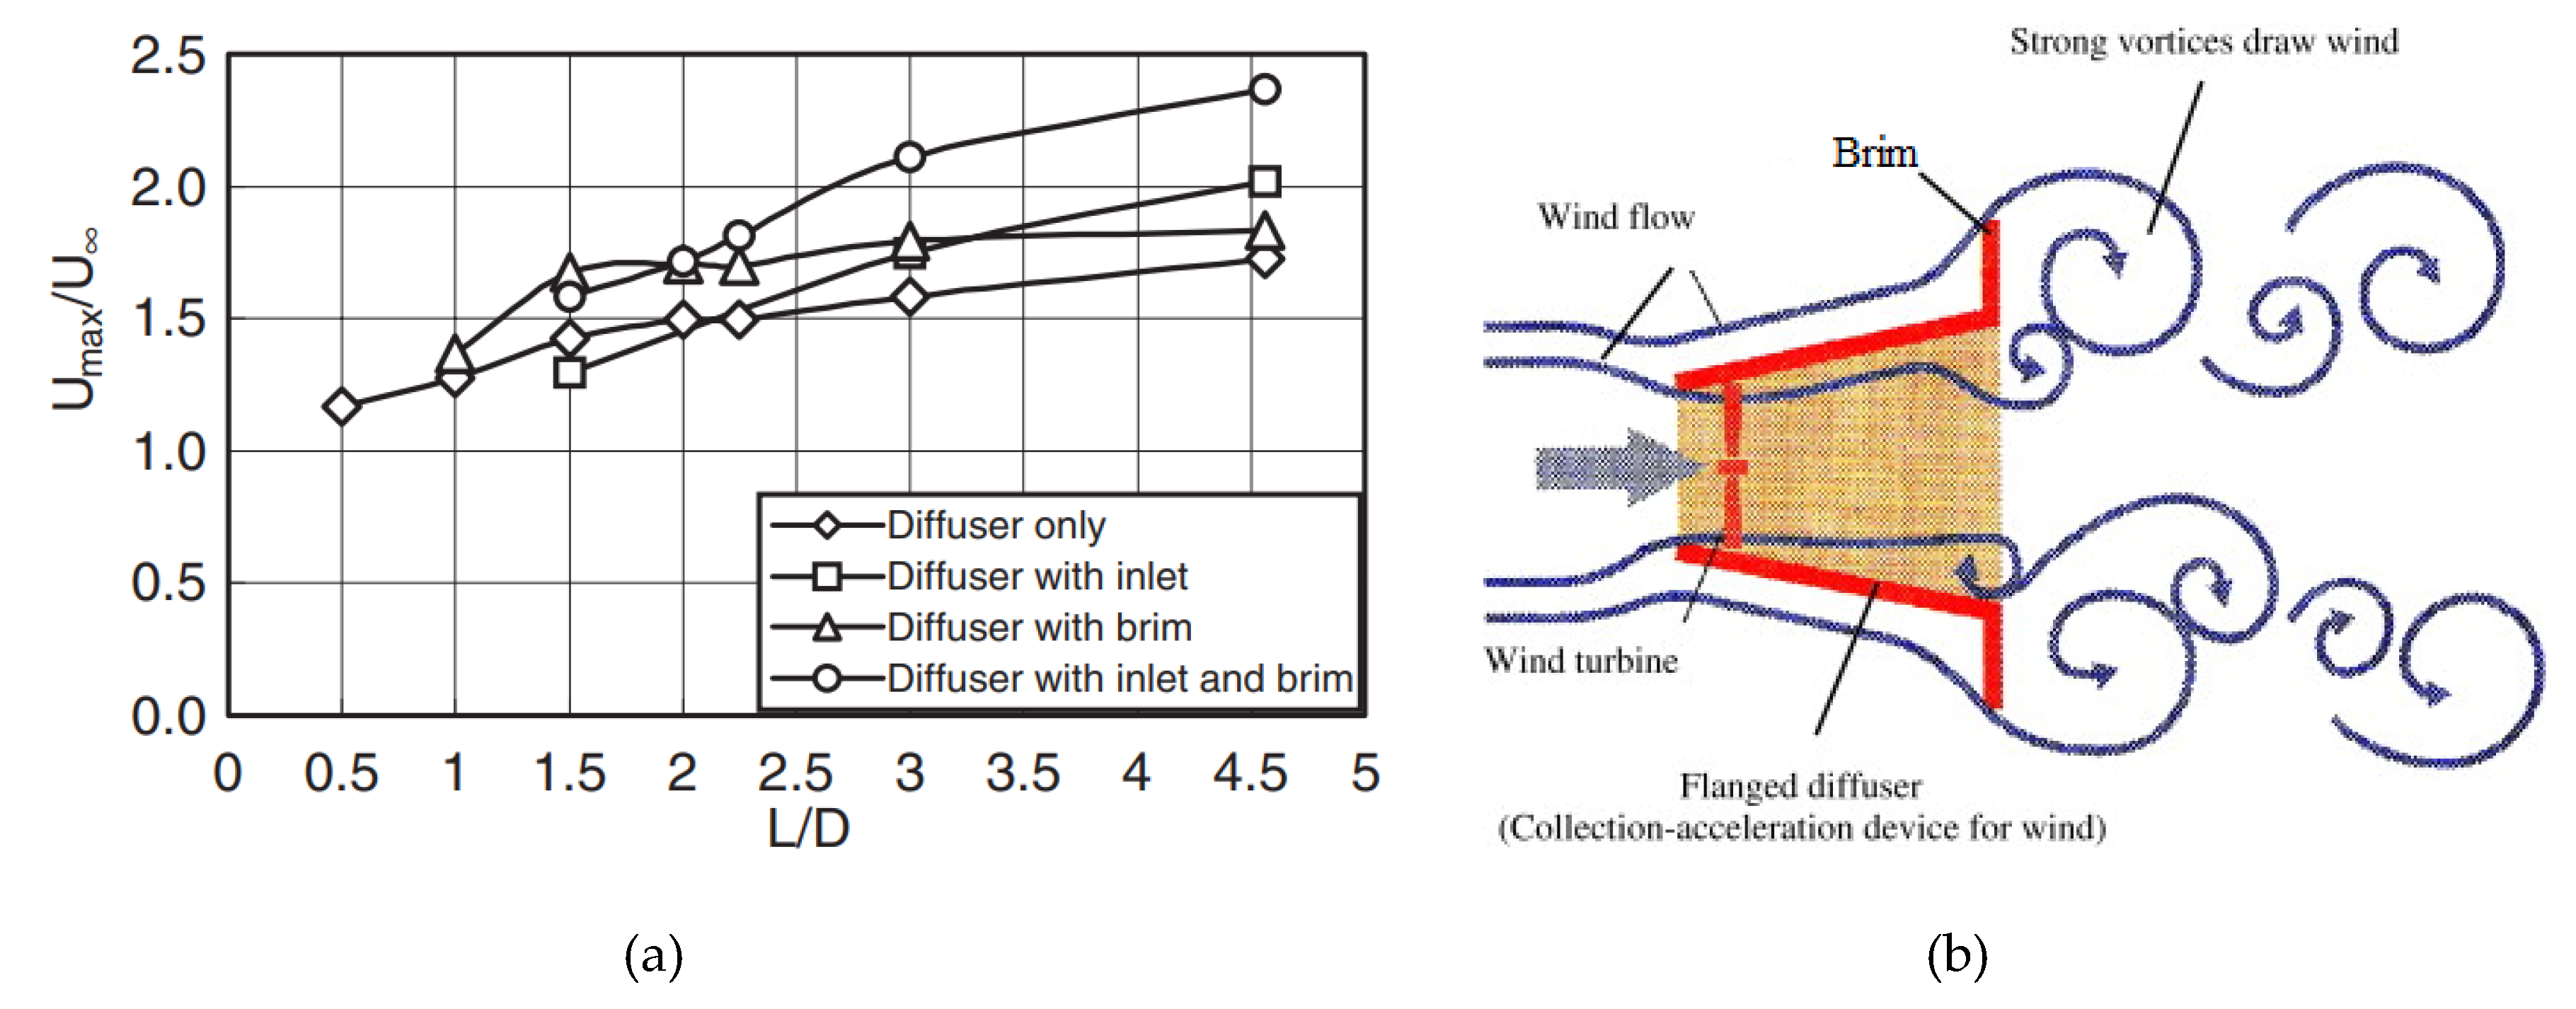
Figure 25 (a) shows the results from the experimental study of the dependence of the inlet velocity on the dimensionless length of the casing L/D, with different modifications of the geometry. The velocity increases along with the L/D ratio. According to the article, placing a flange on the outer edge of the diffuser near its exit section increases the velocity even more, as a result of the larger pulling force. The researchers claim that the reason is the formation of Kármán vortices around the outlet section of the diffuser, which create additional underpressure (Figure 25 (b)). On theother hand, the excessive length of the diffuser prevents its incorporation in hydrokinetic turbines. From a technical and economical point of view, it is more advantageous to use a short diffuser with a flange. The researchers found that there are no significant differences in the parameters of the flow through a casing with rectangular and circular cross section. Figure 26 shows the influence of the relative height of the flange h/D on the flow parameters through the turbine. According to the results, the optimal flange length is h/D = 0.25. The minimum value of the dimensionless velocity is 1.4 and the maximum value 1.75. The peak point of the pressure coefficient CP is around x/L = 0.25.
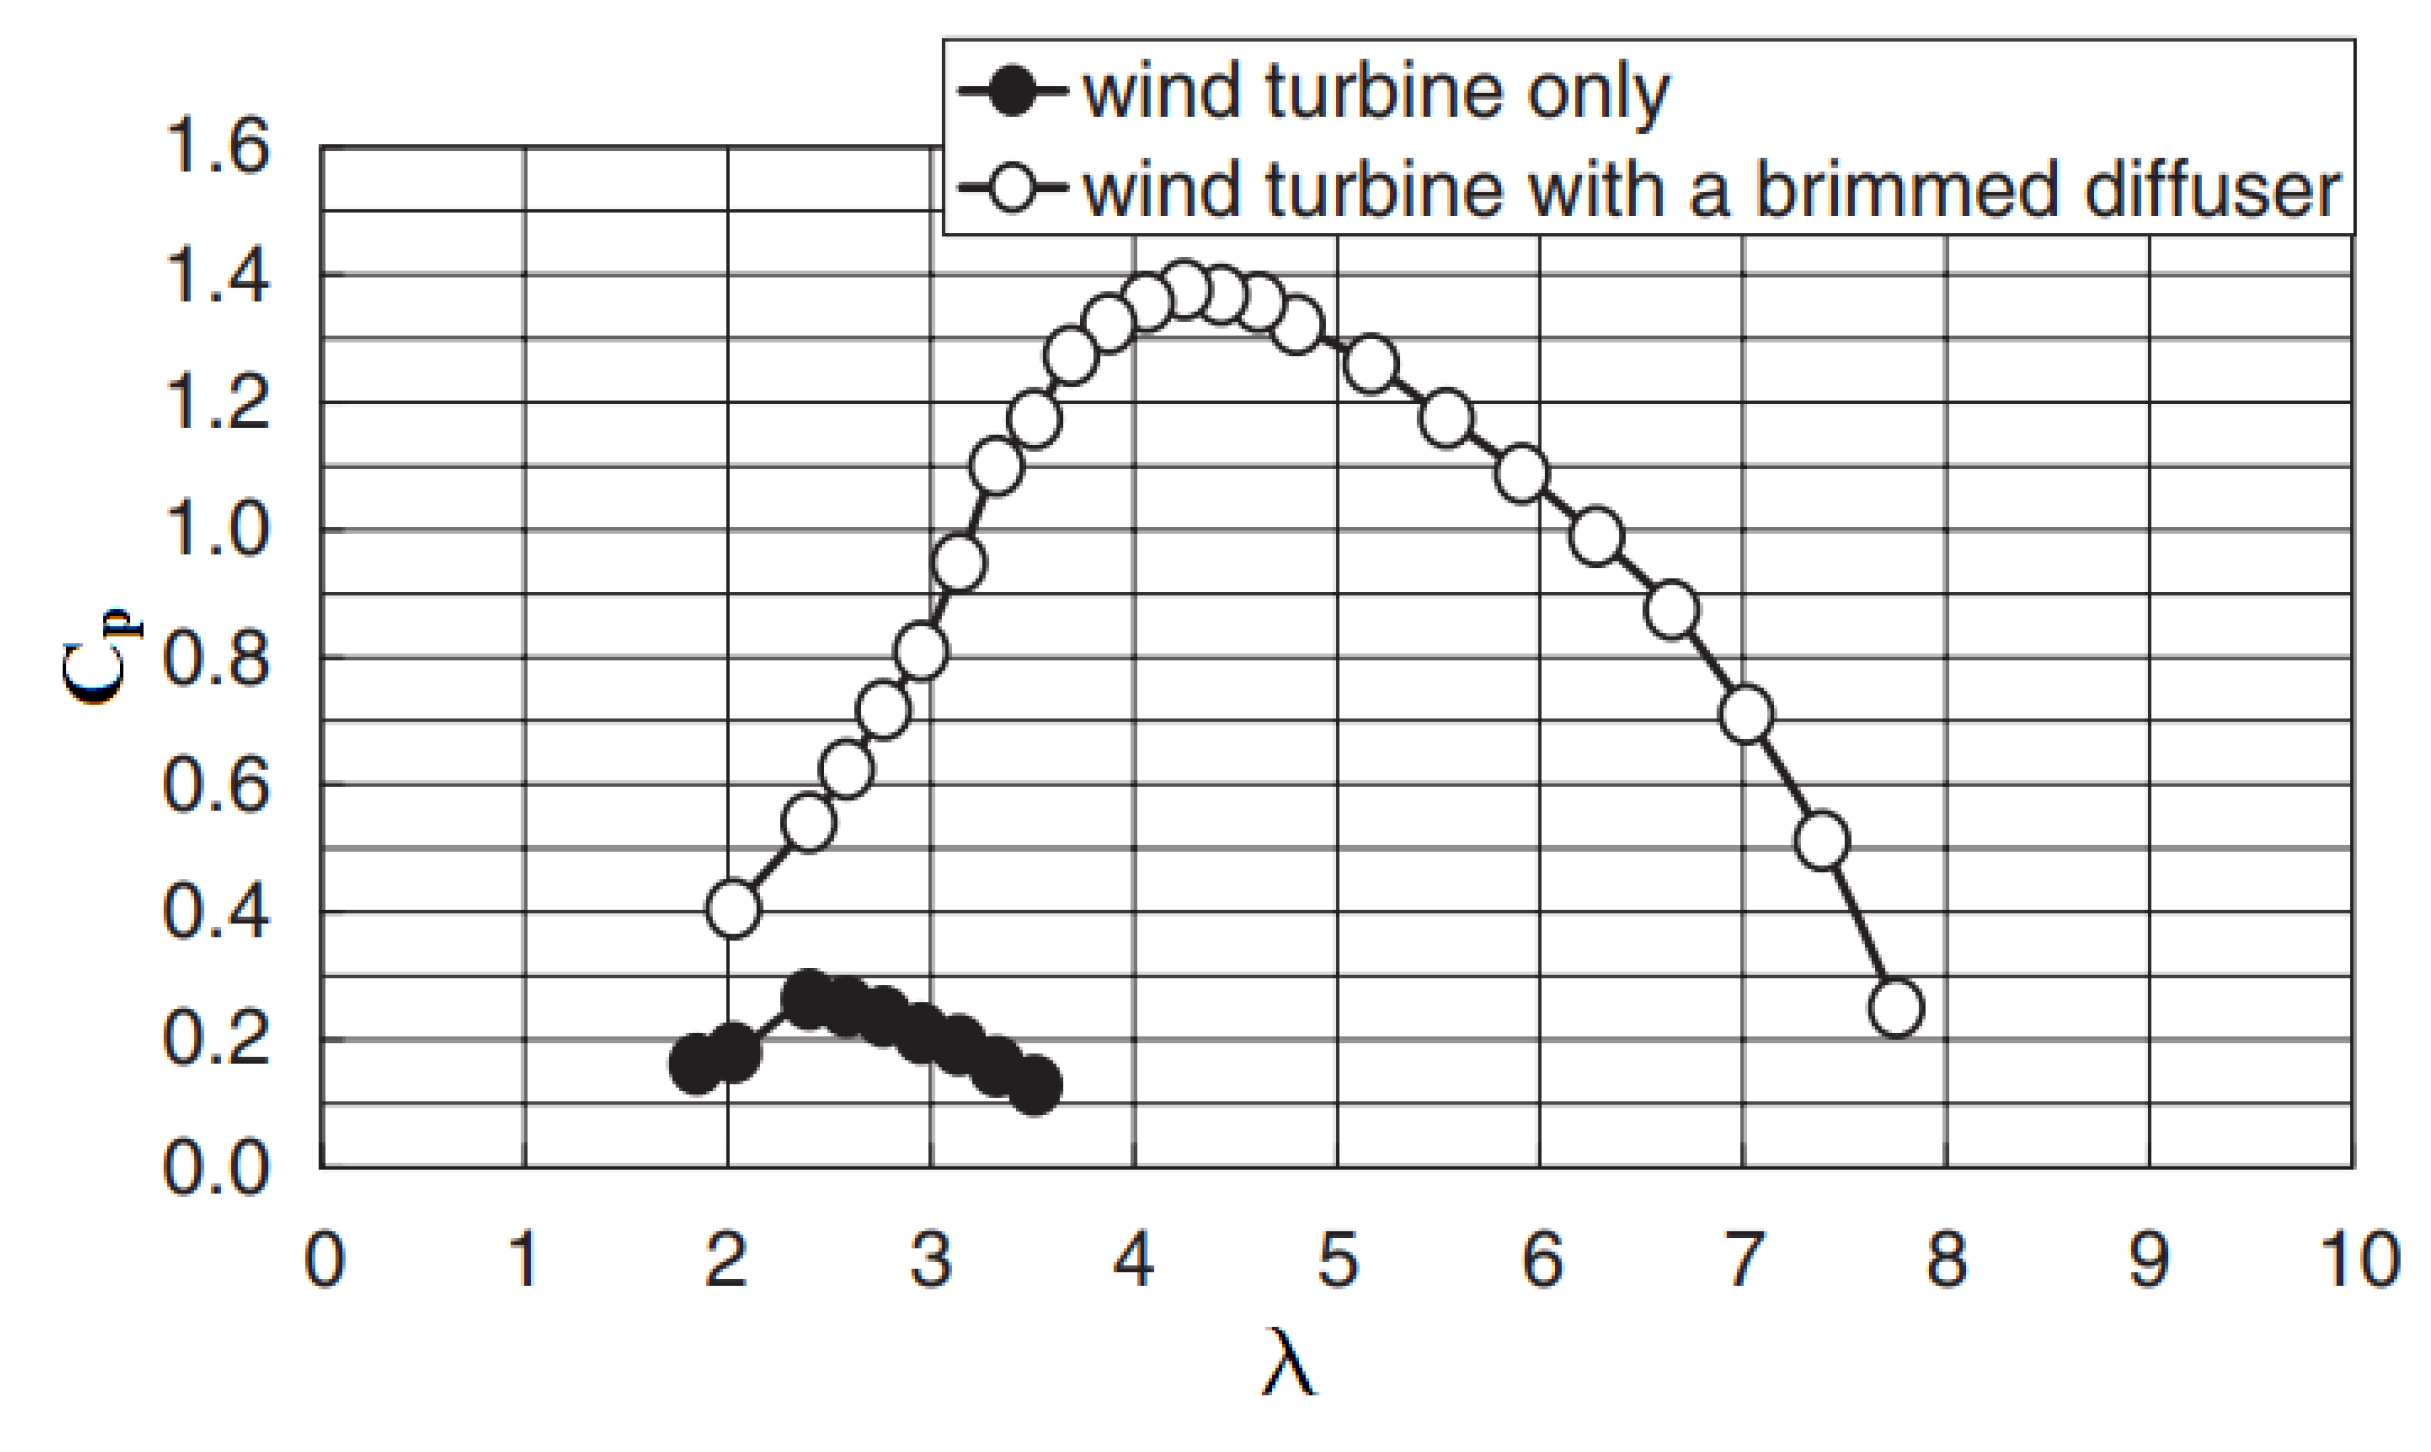
The performance characteristics of the kinetic turbine with and without diffuser casing are shown in dimensionless form in Figure 27. The maximum value of the power coefficient without casing is about 0.28 at tip speed ratio λ = 2.4. The diffuser casing increases the maximum power coefficient up to 1.4 (nearly 5 times).

6. Installation Examples

In india, the power production from the renwable enrgy sources like bio mass, solar, wind and water have reach a signiicant capacity. They plan to expand it even more in the comming years. The hydrokinetic turbines are an extra power source which can contribute to the naton's energy spectrum. Table 3 presents the developed projects so far.
Hydrokinetic turbines are also used in the developed nations, especailly those with the coastal regions. Some of these projects are shown in Table 4.
The return on investment for contruction of a hydroelectric plant depends on a number of factors such as installation cost, maintenance cost, and the price of electricity. On other hand, since the technology improves and the costs decreases, the hydrokinetic energy is becoming more competitive compared to other energy sources. Estimation of the global energy potential of the hydrokinetic turbines vary depending on the technology, environmental and market conditions. Some studies suggest that could be several TWh per year, which is a great for the global energy demands. Despite the promising potential, harnessing of the water kinetic energy is still at early stage. Futher research and development is required to absorb more of the global hydrokinetic potential. For an example most of kinetic turbines can produce electricity at stream velocity larger than 0.6-0.7 m/s, while their rated speed is around 2 m/s. We need a new type of a turbine that can produce electricity at lower stream velocities (0.15-0.30 m/s). Table 5 presents the development stage of some hydrokinetic turbine projects worldwide.
Recently, several different designs of hydrokinetic turbines have appeared on the market, each with their own unique advantages. They are designed to harness energy from the ocean currents and deep rivers:
  • Oscilla Power's Triton-C design [62] is a floating turbine designed for ocean currents. The turbine has a passive steering system that pivots the turbine rotor along the water flow.
  • Verdant Power's Free Flow System [63].
  • Minesto's Deep Green [64] is a hydrokinetic turbine mounted on a mobile kite-like platform. It moves in a trajectory resembling the shape of the number eight.
  • Blue Energy's VIVACE (Vortex Induced Vibration Aquatic Clean Energy) [65] generates electricity from flowing water using the vibrations induced by vortices.
  • When choosing the type of hydrokinetic turbine for a specific location, the following factors should be taken into account:
  • Water velocity: the turbine will generate the maximum amount of electricity if its rated speed approaches or matches the prevailing stream velocity in the control area.
  • Depth, which will specify the type of the turbine.
  • Capital investment.
  • Durable and reliable construction requiring minimal maintenance throughout the service life.

8. Conclusions

In the article were presented results of different methods for increasing the efficiency of axial kinetic turbines: optimizing the shape of the shroud casing, profile of the blades and their number. The analysis lead to the following essential conclusions:
  • Maximum power is obtained with a four-bladed runner. It shoud be noted that difference in efficiency between four-baded and three-bladed runner is small and the choice should be made on the basis of the generated power and the capital investment.
  • The optimal tip speed ratio depends on the active area of the working blades. Higher rotational speeds can be achieved with thinner blades.
  • Rounding of the tip section of the working blades can increase the turbine’s efficiency. According to the authors, the benefits are 47%.
  • Placing the turbine runner inside a cylindrical casing increases the generated electrical power. The benefits are greater at higher stream velocities.
  • Placing the turbine runner inside a cylindrical casing that ends in a diffuser increases the stream velocity through the turbine. The effect can be improved by adding a flange around the outlet section. The benefits are nearly 5 times higher efficiency.
The offshore regions and rivers with suitable energy potential has been specified. The output power based on the performance curves of some notable hydrokinetic turbines has been calculated. A mathematical model for the calculation of the blade cascade of an axial kinetic turbine has been shown. A list of developed worldwide hydrokinetic turbine projects (including locationts, type and capacity) is presented.
The implementation of hydrokinetic turbines is still limited due to the low velocities of most rivers and ocean currents around offshore areas. The hydro units installed so far provide valuable information about the efficiency of different types of impellers, thus contributing to the development of turbine construction. Optimizing hydrokinetic turbines includes improving the efficiency of the work process and reducing the capital investment for the manufacture and installation of the hydro unit. The experience gained from numerical and physical research carried out in recent years, presented in this paper, can be used in the development of an efficient axial hydrokinetic turbines which can generate more power at low stream velocities.

Funding

This study is financed by the European Union-Next Generation EU, through the National Recovery and Resilience Plan of the Republic of Bulgaria, project № BG-RRP-2.004-0005 and by the project КП-06-Н67/8 „Development of a fluid-structural methodology for the study and modernization of HYDRAulic turbomachines, through the TECHnologies of virtual prototyping – HydraTech“.

References

  1. Balaras, A.; Dascalaki, E., G; Patsioti, M.; Droutsa, K., G.; Kontiyiannidis, S.; Cholewa, T. Carbon and Greenhouse Gas Emissions from Electricity Consumption in European Union Buildings. Building 2024, 14. [Google Scholar] [CrossRef]
  2. Schulze, M.; Hunger, M.; Doll, P. Simulating river flow velocity on global scale. ADGEO 2006, 5, 133–136. [Google Scholar] [CrossRef]
  3. Eltner, A.; Sardemann, H.; Grundmann, J. Flow velocity and discharge measurement in rivers using terrestrial and unmanned-aerial-vehicle imagery. HESS 2020, 24, 1429–1445. [Google Scholar] [CrossRef]
  4. Valdes, R., E.; Yosry, A., G.; Ferrauiuolo, R.; Jimenez, A.; Pacheco, M., F. Experimental Comparison between Hydrokinetic Turbines: Darrieus vs. Gorlov. Environ. Sci. Proc. 2022, 21. [Google Scholar] [CrossRef]
  5. Dudhgaonkar, P.; Duraisamu, N.; Jalihal, P. Energy extraction from ocean currents using straight bladed cross-flow hydrokinetic turbine. IJOCS 2017.
  6. Duerr, A., E., S.; Dhanak, M., R. Hydrokinetic power resource assessment of the Florida Current. MTS/IEEE SEATTLE, 2010. [Google Scholar]
  7. Tewari, U.; Karl, K. Hydrokinetic Energy for Enlighting the Future of Rural Communities in Uttarakhand. THDC.
  8. SMART HYDRO POWER. Available online: https://www.smart-hydro.de (accessed on 15 03 2024).
  9. River and tidal hydrokinetic turbines. Available online: https://www.guinard-energies.bzh (accessed on 15 03 2024).
  10. SMART FREE STREAM TURBINE. Available at: https://smart-hydro.de/wp-content/uploads/2015/12/Datasheet_SMART_Freestream.pdf (accessed on 16 03 2024).
  11. Todorov, G; V., Obretenov; K., Kamberov; T., Ivanov; T., Tsalov; B., Zlatev. Concept and Physical Prototyping of Micro Hydropower System Using Vertical Crossflow Turbine. EFEA, 2021, 1-4.
  12. Todorov, G; K. Kamberov; M., Semkov. Improvement of undershot water wheel performance through virtual prototyping. AIP Conf. Proc. 2021, 2333. [Google Scholar]
  13. Samso, R.; Crespin, J.; Garcia-Olivares, A.; Sole, J. Examining the Potential of Marine Renewable Energy: A Net Energy Perspective. Sustainability 2023, 15. [Google Scholar] [CrossRef]
  14. Godinho, F.; Costa, S.; Pinheiro, P.; Reis, F.; Pinheiro, A. Integrated Procedure for Environmental Flow Assessment in Rivers. Environ. Process. 2014, 1, 137–147. [Google Scholar] [CrossRef]
  15. Danube river basin. Available at: https://www.icpdr.org/danube-basin/danube-river-basin (accessed on 15 03 2024).
  16. History of the Rhine River. Available at: https://www.britannica.com/place/Rhine-River/History (accessed on 15 03 2024).
  17. The Neman River. Available at: https://en.wikipedia.org/wiki/Neman (accessed on 15 03 2024).
  18. The Narva River. Available at: http://www.nrwr.net/93eng.html (accessed on 15 03 2024).
  19. The Strømmen River. Available at: https://www.studycountry.com/wiki/what-is-fastest-flowing-river-in-europe#google_vignette (accessed on 15 03 2024).
  20. The Angara River. Available at: https:/www.worldatlas.com/articles/where-does-the-angara-river-flow.html (accessed on 15 03 2024).
  21. The Lena River. Available at: https://www.feow.org/ecoregions/details/608 (accessed on 15 03 2024).
  22. Zou, R.; Che, C.; Cao, J.; Wang, Q. The Flow of the Yangtze River Inverted From a Continuous Global Navigation Satellite System Station. Geophys. Res. Lett. 2023, 50. [Google Scholar] [CrossRef]
  23. Patel, C., G.; Gundaliya, P., J. Calculating Discharge Carrying Capacity of River Tapi. IJERT 2014, 3. [Google Scholar]
  24. Rio Grande Flow. Avaliable at: https://ibwcsftpstg.blob.core.windows.net/wad/DailyReports/flowdata.htm (accessed on 15 03 2024).
  25. Shams, A.; Hussian, T., A.; Al-Mukhtar, M. Modeling Flow Patterns in Tigris River – Baghdad Using the CCHE2D model. Earth Environ. Sci. 2022, 1120.
  26. Das, T., K.; Islam, R.; Khallil, E.; Mamun, A.; Kundu, D. Design Optimization and Economic Analysis of a Hybrid System for a Hilly Area in Bangladesh. LNME, 93 105.
  27. The Nile River. Available at: https://www.touregypt.net/egypt-info/magazine-mag05012001-magf4a.htm (accessed on 15 03 2024).
  28. Oberg, K.; Shelton, J., M.; Gardiner, E., P.; Jackson, P., R. Discharge and Other Hydraulic Measurements for Characterizing the Hydraulics of Lower Congo River. IAHR Congress.
  29. Nwoko, D., U. Modelling Velocity Distribution in 3-D for Nun River, Niger Delta Nigeria. Curr. j. appl. 2017, 20. [Google Scholar] [CrossRef]
  30. Tigabu, M., T.; Guta, D., G.; Admasu, B., T. Economics of Hydro-Kinetic Turbine for off-grid Application: A Case Study of Gumara River, Upper Blue Nile, Amhara, Ethiopia. IJRER 2019, 9. [Google Scholar]
  31. Lust, E., L. ; B., H., Benjamin; K., A., Flack. Performance characteristics of a cross-flow hydrokinetic turbine in current only and current and wave conditions. Ocean Eng. 2021, 219.
  32. Guillaud, N.; G. , Balarac; E., Goncalves; J., Zanette. Large Eddy Simulations on Vertixal Axis Hydrokinetic Turbines and flow phenomena analysis. IOP Conf. Ser.: Earth Environ. 2016, 49, 10. [Google Scholar]
  33. Xu, W.; G. , Xu; W., Duan; Z., Song; J., Lei. Experimental and numerical study of a hydrokinetic turbine based on tandem flapping hydrofoils. Energy 2019, 174, 375–385. [Google Scholar] [CrossRef]
  34. NUST Research & Innovation. . Available online: https.
  35. Niebuhr, C. M.; Dijk, M.; Neary, V. S.; Bhagwan, N. A review of hydrokinetic turbines and enhancement techniques for canal installations: Technology, applicability and potential. Renew. Sustain. Energy Rev. 2019, 113. [Google Scholar] [CrossRef]
  36. ://twitter.com/Research_NUST/status/1376861664868454403 (accessed on 15 03 2024).
  37. Jabbar, A., B.; Al-Quraishi; Asmuin, N. , Z; Nazir N., F.; et. al. CFD Investigation of Empty Flanged Diffuser Augmented Wind Turbine. Int. J. Integr. Eng. 2020, 12. [Google Scholar]
  38. Venturi effect. Available at: https://www.wassertec.co.za/explanation-venturi-effect-applications/ (accessed on 15 -03 2024). 2024.
  39. The Actuator Disk Model. Available at: https://www.e-education.psu.edu/aersp583/node/470 (accessed on 15 03 2024).
  40. El khchine, Y.; Sriti, M. Improved Blade Element Momentum theory (BEM) for Predicting the Aerodynamic Performances of Horizontal Axis Wind Turbine Blade (HAWT). Tech. Mech. 2018, 38. [Google Scholar]
  41. Benini, E. Significance of blade element theory in performance prediction of marine propellers. Ocean Eng. 2004, 31, 957–974. [Google Scholar] [CrossRef]
  42. Liu, S.; Janajreh, I. Development and application of an improved blade element momentum method model on horizontal axis wind turbines. IJEEE 2012, 3. [Google Scholar] [CrossRef]
  43. Actuatror disk 3D scheme. Available at: https://www.e-education.psu.edu/aersp583/node/470 (accessed on 15.03.2024).
  44. Betz’s Law. Available at: https://www.scribd.com/document/342343083/Betz-s-law-pdf (accessed on 20.03 2024).
  45. Marianela, M., M.; Rafael, C.; Faria, M.; Michael, P.; et al. On the wake of propeller hydrokinetic turbines: Numerical simulations and experiments. Proc. J. Braz. Soc. Mech. Sci. Eng. 2023. [Google Scholar]
  46. University of Brasilia. Available at: https://www.unb.br/.
  47. Vimal, P.; Dixit, S.; Mohit, P.; Nisarg, R. Experimental Investigations of Hydrokinetic Axial Flow Turbine. Proc. WCE 2016, II.
  48. Pournazeri, S.; Aghsaee, P.; Mantilla, R.; Markfort, C. Optimization and initial testing of a model-scale horizontal axis hydrokinetic turbine. IIHR, 2016. [Google Scholar]
  49. Paul, D. et al. Experimental study of the flow induced by an axial hydrokinetic turbine. IOP Conf. Ser.: Earth Environ. Sci. 1136 2023.
  50. Bucur, D. M. Experimental investigation of small axial hydro-kinetic turbines. IOP Conf. Ser.: Earth Environ. Sci. 1079, 2022. [Google Scholar]
  51. Patel, C.; Rathod, V; Patel, V. Experimental Investigations of Hydrokinetic Turbine Providing Fillet at the Leading Edge Corner of the Runner Blades. J. Appl. Fluid Mech. 2023, 16, 865–876. [Google Scholar]
  52. Chihaia, R.; El-Leathey, L; Circuimaru, G. ; Tănase, N. Increasing the energy conversation efficiency for shrouded hydrokinetic turbinrs using experimental analysis on a scale model. EENVIRO. 2019, 85. [Google Scholar]
  53. Dharmesh, D., J.; Vimal, K., P.; SVMIT, N. Experimental Investigation of Axial Flow Horizontal Axis Water Turbine with Fix Vane Angle. IJEDR 2014, 2.
  54. Nedelcu, A.; Bunea, F.; Danca, P., A.; Chihaia, R., A.; Babutanu, C., A.; Marin, D.; Ciocan, G., D. Experimental research on a hydrokinetic turbine model. IOP Conf. Ser.: Earth Environ. Sci. 2021, 664. [Google Scholar] [CrossRef]
  55. Antonio C., P; Rafael, B., J.; Mendes, C., F.; Taygoara, T., W.; Noguera, R.; Oliveira, F. On the design of propeller hydrokinetic turbines: the effect of the number of blades. J. Braz. Soc. Mech. Sci. Eng, 2019. [Google Scholar]
  56. Kyozuka, Y.; Sakaguchi, D.; Sueyoshi, M.; Hu, Ch. A floating/submersible shrouded tidal current turbine system applicable in low speed tidal flow. Proc. Of the 13th EWTEC 1 2019.
  57. Von Karman Institute for Fluid Dynamics. Available at: https://www.vki.ac.be/ (accessed at 18.03.2024).
  58. Institute of Applied Mechanics, Kyushu University in Japan. Available at: https://www.riam.kyushu-u.ac.jp/en/index-e.html (accessed on 15.03.2024).
  59. Ohya, O.; Karasudani, T.; Sakurai, A.; Abe, K.; Inoue, M. Development of a shrouded wind turbine with a flanged diffuser. J. Wind Eng. Ind. Aerodyn 2008, 96, 524–539. [Google Scholar] [CrossRef]
  60. REPORT OF THE COMMITTEE TO STUDY THE CONCEPT & COMMERCIAL APPLICATIONS OF HYDRO KINETIC TURBINE DEVELOPED BY M/s MACLEC. Available online: https://cea.nic.in/wp-content/uploads/he___td/2022/07/Final_Report_on_SHK_Turbine_by_Maclec-1.pdf (accessed on 15 03 2024).
  61. River, Tidal, and Ocean Current Hydrokinetic Energy Technologies: Status and Future Opportunities in Alaska. Available at: https://tethys.pnnl.gov/sites/default/files/publications/Johnson_Pride_2010.pdf (accessed on 15 03 2024).
  62. Review of Triton –, C. Available at: https://www.oscillapower.com/triton-c (acessed on 22.03.2024).
  63. Review of Verdant Power's Free Flow System. Available at: https://verdantpower.com/ (accessed on 23.03.2024).
  64. Swedish tidal kite developer Minesto. Available at: https://minesto.com/ (accessed on 23.03.2024).
  65. Blue Energy Canada. Available at: https://www.bluenergy.com/ (accessed om 23.03.2024).
Figure 1. Smart (a) Duofloat and (b) Monofloat, axial kinetic turbine [8] with parameters: n = 90 230min-1, Pef = 5kW, D1 = 1 m, and nominal current speed 2.8m/s. (c) Power curve of the Smart hydrokinetic turbine [8].
Preprints 105959 g001
Figure 2. Guinard Energies. Axial kinetic turbine [9] with parameters Pef = 130-3500W. Nominal current speed 3m/s. (a) Components of the Guinard Energies turbine, (b) Axial look into the fan shroud (c) Power curve of the GuinardEnergies turbine [9].
Preprints 105959 g002
Figure 3. Smart Freestream, axial kinetic turibne [10] with parameters: Pef = 5kW, D1r = 1m, and nominal current speed 3.1 m/s. (a) Components of Smart Freestream turbine, (b) Power curve of the Smart Freestream turbine.
Preprints 105959 g003
Figure 4. Horizontal axis hydrokinetic turbine with cylindrical casing. (a) A photo of the said turbine turbine [36], (b) Scheme of a horizontal axis hydrokinetic turbine with cylindrical casing [37].
Preprints 105959 g004
Figure 5. Power curves of an axial kynetic turbine with and without cylindrical casing [35].
Preprints 105959 g005
Figure 6. Different channel modifications (a) Hybrid (curvlilinear), (b) hybrid (rectilinear), (c) multi hydrofoil diffuser, (d) channel bed modifications (bed lifting) [35].
Preprints 105959 g006
Figure 7. Principles of the stream tube model (a) 3D view, (b) 2D with Pressure and Velocity sections.
Preprints 105959 g007
Figure 8. Velocity and pressure disstribution along the length of the stream tube.
Preprints 105959 g008
Figure 9. Velocity triangles [40].
Preprints 105959 g009
Figure 10. Force triangles [40].
Preprints 105959 g010
Figure 11. Location of the blade segments along the span [40].
Preprints 105959 g011
Figure 12. Dependence of the power coefficient on the tip speed ratio of the investigated turbine [45] (a), and picture of the runner [45] (b).
Preprints 105959 g012
Figure 13. (а) Dependence of Cp on λ and (b) dependence of Cp on Hs [47].
Preprints 105959 g013
Figure 14. (а) 3D computer model of the optimized runner, (b) results of the conducted research [48].
Preprints 105959 g014
Figure 15. Location of the runner in the hydrodynamic channel (a) [49], and results of the conducted experiments (b) [49].
Preprints 105959 g015
Figure 16. Obtained results: (a) HT1 and (b) HT2 [50].
Preprints 105959 g016
Figure 17. Results of the conducted physical examinations for Rtu [51].
Preprints 105959 g018
Figure 18. Location of the different sections (a) and (b) ; picture of the runner (c) [52].
Preprints 105959 g019
Figure 19. Results from the conducted study: (а) runner with confusor, (b) runner with diffusor [52].
Preprints 105959 g020
Figure 20. Results from the conducted study (a) tabular form (b) graphic form [54].
Preprints 105959 g021
Figure 21. Dependence of Cp on λ at different density of the blade cascade [55].
Preprints 105959 g022
Figure 22. Numerical and experimental performance curves (a) of the examined runners (b) [55] .
Preprints 105959 g023
Figure 23. Results from the physical examinations.[56] (a) and picture of the model hydrokinetic turbine (b) [56].
Preprints 105959 g024
Figure 24. Distribution of the velocity and pressure trough the casing [59].
Preprints 105959 g025
Figure 25. Variation of the stream velocity along the length of the prototypes (a) [59], and scheme of the vortex wake after the flanged diffuser casing (b) [59].
Preprints 105959 g026
Figure 26. Velocity and pressure variation along the length of the casing at different flange heights [59].
Preprints 105959 g027
Figure 27. Results from the conducted experiments [59].
Preprints 105959 g028
Table 1. Velocities of some rivers in Europe, Asia and Africa.
Europe Speed, m/s Asia Speed, m/s Africa Speed, m/s
1 Danube 2.22-2.5 [15] Angara 1-2 [20] Nile 2.1 [27]
2 Rhine 1.66 [16] Lena 1.11-1.67 [21] Congo 4 [28]
3 Nemunas 1 [17] Yangtze 2-3 [22] Nun 0.85-1.54 [29]
4 Narva 1.5 [18] Tapi 1.53-3.24 [23] Gumara 1-3 [30]
5 Strömmen 1.94 [19] Rio Grande 0.45-2.68 [24] - -
6 - - Tigris 0.7 -1.6 [25] - -
7 - - Matamuhuri 2.4-4 [26] - -
Table 2. Results of the conducted physical experiments. [53].
RPM of Rotor Torque
(Nm)
Protor
(Watt)
Phyd
(Watt)
Cp Ω
(rad/s)
TSR
λ
Net load
(N)
1 62.500 0.033 0.218 5.831 0.037 6.545 2.356 3.335
2 59.435 0.048 0.299 5.831 0.051 6.224 2.241 4.807
3 59.406 0.070 0.433 5.831 0.074 6.221 2.240 6.965
4 55.556 0.101 0.588 5.831 0.101 5.818 2.094 10.104
5 53.461 0.131 0.736 5.831 0.126 5.598 2.015 13.145
6 63.610 0.184 1.035 5.831 0.178 5.614 2.021 18.443
7 50.761 0.180 0.954 5.831 0.164 5.316 1.914 17.952
Table 3. Some of the Projects carried out in India [60].
Project name Power Company Constraints Location
1. Chilla
Power Channel
25 kW DLZ Corp., US Submerged turbine
Low debris handling capability
Require constant depth of operation.
Chilla canal, Dehradun Uttarakhand, India
2. Neyveli Lignite Corporati on Ltd. 4x5 kW
(total 20kW)
M/s Smart Hydropower(G erman) in collaboration with M/s Imp Powers(Indian) High flow velocity requirement (3.1 m/s)
Intricate blade shape
High debris protection required
Neyveli Lignite Corporation India, Chennai, Tamil Nadu, India
3. Kakkad HEP 5x5 kW
(total 25 kW)
M/s Imp Powers (an Indian firm in technological collaboration with M/s Smart Hydropower, Germany) Project Allotted Kerala, India
Table 4. Some of the Projects carried out worldwide [60].
Project name Company Constraints Location
4. Sluice of
Dutch icon Afsluitdijk, Wadden Sea
M/s Torcado • High Flow velocity (4.2 m/s/) and depth requirement (4 meters) UK
8. RITE Project M/s Verdant, USA Minimum flow velocity of 2.2 m/s
High depth requirement
Blade complexity
Debris protection requirement
Canada and USA
9. HyTide 1000 M/s Voith Hydro High depth requirement
Severely affected by debris
High flow velocity requirement
Jindo, Korea
Table 5. Horizontal axis turbine companies and turbine technology stage of development [61].
Company Location Device Stage of Technology Capacity
Atlantis Resources Corporation UK Nereus Scale model sea trials 150 kW
Clean Current
Power Systems
Canada Clean Current tidal turbine generator Full scale prototype 65 kW
Free Flow Power Gloucester, MA SmarTurbine Generator Scale model tank testing 10 kW
Free Flow 69 UK Osprey Scale model sea trials 1 kW
Hammerfest Strom UK UK Tidal Stream Turbine Full scale prototype 300 kW
HydroCoil Power, Inc. Wynnewood, PA HydroCoil Scale model sea trials 20-40 kW
Hydro Green Energy Huston, TX Hydro+ Commercial 35 kW
Maine Current Turbines UK SeaGen Full scale prototype 300 kW-1.2
MW
Natural Currents
Energy Services
Highland, NY RED HAWK Tidal Turbine Scale model sea trials 125 kW
Ocean Flow Energy UK Evopod Scale model sea trials 1 kW
Ocean Renewable Power Company Fall River, MA ORPC Turbine Generating Unit Scale model sea trials 32 kW
OpenHydro Ireland Open-Centre Turbine Full scale prototype 250 kW-1 MW
Robert Gordon University UK Sea Snail Full scale prototype 150 kW
SMD Hydrovision UK TidEl Scale model tank testing 500 kW
Swanturbine Ltd. UK Swanturbine Scale model sea trials 330 kW
Tidal Energy Pty.
Ltd.
Australia Davidson-Hill Venturi
Turbine
Scale model sea trials Unavailable
Tidal Generation Ltd. UK DEEP-Gen Full scale prototype 500 kW
Tidal Steam UK Triton Scale model tank testing 10 MW
Tocardo Tidal Energy Ltd. Netherlands Tocardo Aqua 2800 Full scale prototype 32 kW
University of Strathclyde UK Contra-Rotating Marine Turbine(CoRMaT) Scale model sea trials 30 kW
Verdant Power New York, NY Free Flow System Full scale prototype 35 kW-1 MW
Disclaimer/Publisher’s Note: The statements, opinions and data contained in all publications are solely those of the individual author(s) and contributor(s) and not of MDPI and/or the editor(s). MDPI and/or the editor(s) disclaim responsibility for any injury to people or property resulting from any ideas, methods, instructions or products referred to in the content.
Copyright: This open access article is published under a Creative Commons CC BY 4.0 license, which permit the free download, distribution, and reuse, provided that the author and preprint are cited in any reuse.
Prerpints.org logo

Preprints.org is a free preprint server supported by MDPI in Basel, Switzerland.

Subscribe

© 2024 MDPI (Basel, Switzerland) unless otherwise stated