Preprint
Article

Canopy Architecture and Sun Exposure Influence Berry Cluster Water Relations in Grapevine

Altmetrics

Downloads

175

Views

100

Comments

0

A peer-reviewed article of this preprint also exists.

Submitted:

08 May 2024

Posted:

10 May 2024

You are already at the latest version

Alerts
Abstract
Climate change related increases in frequency and intensity of heatwaves affect viticulture, leading to losses in yield and grape quality. We assessed whether canopy architecture manipulation mitigates the effects of summer stress in a Mediterranean vineyard. Muscat of Alexandria grapevines were monitored during 2019-2020. Two canopy shoot positioning treatments were applied: Vertical shoot positioning (VSP); and Modulated shoot positioning (MSP), the west side upper foliage released to promote partial shoot leaning, shading the clusters. Clusters were sampled at pea size (PS), veraison (VER) and full maturation (FM). Measurements included rachis anatomy and hydraulic conductance, and aquaporins (AQP) and stress-related genes expression in cluster tissues. Results show significant seasonal and interannual differences in Kh and vascular anatomy. At VER, Krachis , Krachis+pedicels, and xylem diameter decreased but were unaffected by treatments. The Phloem/Xylem ratio was either increased (2019) or reduced (2020) in MSP, compared to VSP. Most AQP were down-regulated at FM in pedicels, and up-regulated at VER in pulp. A potential maturation shift in MSP was observed, confirmed by the up-regulation of several stress-related genes in all tissues. The study pinpoints the role of canopy architecture in berry water relations and stress response during ripening.
Keywords: 
Subject: Biology and Life Sciences  -   Plant Sciences

1. Introduction

Reports by the IPCC [1] indicate that the ongoing increase in temperature and decrease in precipitation in southern Europe are a result of climate change. Projections foresee a marked increase in the frequency and intensity of heatwaves, meteorological droughts, and heavy precipitation events in the region [2,3]. Specifically, diurnal, and nocturnal temperatures during the grape growing season will increase, as well as maximum temperatures during the ripening period [4]. These changes, together with the phenomenon of global brightening [2], will increase the incidence of sunburn damage in grape berries, with disastrous economic consequences.
Winemaking is considered one of the most historically relevant socio-economic activities in Portugal, with grapevine representing approximately 14% of the total planted area of the overall agriculture sector and 6% of the total production [5], wine accounting for nearly 2% of total national exports. In recent decades, the Portuguese wine industry has been severely affected by climate change, a trend expected to remain unchanged in the near future due to the high sensitivity of grapes to small changes in climatic conditions.
Although in the past sunburn was not a frequent event in European viticultural regions, historical records show an increased frequency of seasons with significant sunburn damage. In Portugal, this phenomenon has been attributed mainly to a higher frequency and intensity of heat waves [6]. Berry sunburn is a recurring disorder that can reduce berry quality and cause severe yield loss [7]. Canopy management and manipulation of training systems could be used as strategies to protect grape berries from sunburn. Although traditional training management in southern Europe was designed to provide a certain degree of protection to grapes (e.g., gobelet and pergola), in recent years, vertical shoot positioned (VSP) canopy systems have become widespread in vineyards in Portugal, mainly because it is a training system very well adapted to mechanization. Historically, VSP training systems were designed in traditional vineyards in central Europe to increase fruit exposure. Consequently, when used in hot and dry terroirs, VSP risks overexposing clusters [8].
Different short-term solutions have been implemented to reduce yield losses due to sunburn in VSP grapevines in the hottest winegrowing regions, including the use of netting, particle-film-forming products, anti-transpirants, and hydrocooling. However, the results of the effectiveness of these solutions in viticulture are still inconclusive (reviewed in [9]). These solutions also increase vineyard management costs and potentially increase the carbon and/or water vineyard footprint. Minimal pruning systems are employed in the hottest winegrowing regions and provide sufficient shelter to protect grapes from sunburn, although several reports warn that this type of management is prone to producing smaller-sized clusters and modifying oenological characteristics [10,11]. Alternative manipulation of north-south oriented VSP by modulating the shoot position on the west side of the canopy could provide adequate protection to the exposed clusters and reduce sunburn incidence, as it keeps clusters under a diffuse light regime and decreases direct radiation. This management could be easily applied by grapevine growers and could be of high significance in sunburn-susceptible cultivars, such as Riesling or Muscat of Alexandria [12]. However, the role of irradiance on the control of shoot and leaf hydraulic conductivity [13] suggests that increasing berry shading could influence the water relations between the parent plant and berry clusters. Furthermore, the ability to maintain berry turgor is related to resistance to shriveling [9].
Grape growth is mainly the result of water accumulation, and therefore, its maintenance requires the concerted action of long-distance water and solute transport through vascular tissues (which connect the fruit to the parent plant), and short-distance water and solute uptake by individual cells. The role of vascular tissues in grape berries has been a subject of research for several decades, with the aim of deciphering the basis of cluster and berry water relations. It has been demonstrated that water enters the fruit predominantly via the xylem before veraison, after which xylem transport declines gradually and the phloem provides most of the water during the ripening stages of the fruit [14]. Nonetheless, several biological questions regarding the mechanisms underlying berry weight loss and other ripening disorders remain unanswered. Currently, the cessation of xylem flow into berries at veraison is conventionally accepted. However, data from dye-tracing studies in pedicels have proven that xylem remains physically intact [15,16] enabling water backflow from the fruit to the parent plant when the water inflow exceeds the elastic modulus of fruits [17]. In addition, several studies on fleshy fruits have shown the detrimental effects of late season rain or excessive irrigation on the late stages of fruit ripening [18,19,20]. More recently, McElrone et al. [21] reported that grapevine exhibits functional hydraulic sectoring and confirmed that the xylem remains conductive into the berry through ripening, but only the clusters attached to hydraulic sectored shoots had these direct connections. These data opened the debate on the extent to which viticultural management and environmental events could disrupt water relations between plants and fruits. However, post-vascular transmembrane water transport mediated by aquaporins (AQP) should also be considered, since differential expression of AQP genes occurs during fruit development [22,23]. Aquaporins are related to changes in xylem hydraulic resistance during berry maturation or to the accumulation of sugars at post-veraison stages (see review by Sabir et al., [24]). Particularly, the modulation of gene expression in different classes of AQP has been associated with the hydraulic buffering of grape berries from the parent plant at veraison [16,23]. Furthermore, AQP have been related to the regulation of water homeostasis in light-adapted leaves in bur oak [25]. This suggests that differential AQP expression in berries due to canopy modulation and light interception could have a critical impact on berries/cluster turgor and hydraulic properties, ripening processes, and quality. However, to the best of our knowledge, the influence of canopy architecture manipulation in cluster water relations and in the mitigation of the characteristic abiotic stress conditions of the Mediterranean summer season are yet to be thoroughly addressed.
Therefore, the present study aims to assess the responses of sunburn-sensitive Muscat of Alexandria grapevines to short-term adaptation strategies, such as different shoot training systems, e.g. modulated shoot positioning (MSP), expected to balance grape berry growth regulation and sunburn protection. By combining physiological (hydraulic conductance), anatomical (rachis vascular tissues), and molecular (AQP and stress-related gene expression) approaches, we aim to decipher how VSP and MSP impact water inflow in grape berry clusters and contribute to reducing sunburn effects in vineyards with varieties sensitive to sunburn.

2. Results

The present work consisted on the manipulation of canopy architecture during two grapevine growing seasons (2019 and 2020, meteorological conditions characterized in Figure S1) in the variety Muscat of Alexandria in a vineyard in Lisbon, Portugal. Two canopy shoot positioning treatments were applied: Vertical shoot positioning (VSP), consisting on keeping the foliage in an upward position, and Modulated shoot positioning (MSP), where the west side upper foliage is released to promote partial shoot leaning, aiming at shading the clusters. Clusters were monitored and tissues sampled at pea size (PS), veraison (VER) and full maturation (FM).

2.1. Histochemical Analysis of Peduncles

Transverse sections of the peduncle showed identical tissue organization in VSP and MSP at the three phenological stages (Figure 1A). The external organization of the sections is composed by a monostratified layer of small, isodiametric epidermal cells (Ep) covered by a thin cuticle (Figure 1B). The cortex parenchyma is divided into two layers: The outer layer (OCx) of small, well-organised cells bellows the epidermis, and the inner layer (ICx) of larger cells surrounding the vascular cylinder (Figure 1B). The vascular bundles are collaterals, with an average of 22-24 vascular bundles, in which xylem and phloem are arranged in a specific radial pattern (Figure 1C). In particular, the peduncle is maintained in an intermediate state between primary and secondary growth, and it is unlikely to fully form the secondary growth, being a temporary organ. In this variety, the epidermis is not continuous, it contains stomata, and the formation of small lenticels is observed, which could be involved in the exchange of gases with the atmosphere (Figure S2).
The comparative study of the effect of shoot position on peduncle cell parameters (MSP vs VSP) in the 2019 and 2020 seasons is shown in Table 1 and Table 2, respectively. In both seasons, the peduncle section's total areas together with the areas occupied by the different tissues (pith, xylem, phloem cortex, and epidermis) were measured and their relative proportion was calculated. Results showed that the area occupied by the different tissues (cortex, vascular cylinder, xylem, phloem, and pith) decreased at VER compared to PS, which may indicate a halt of growth.
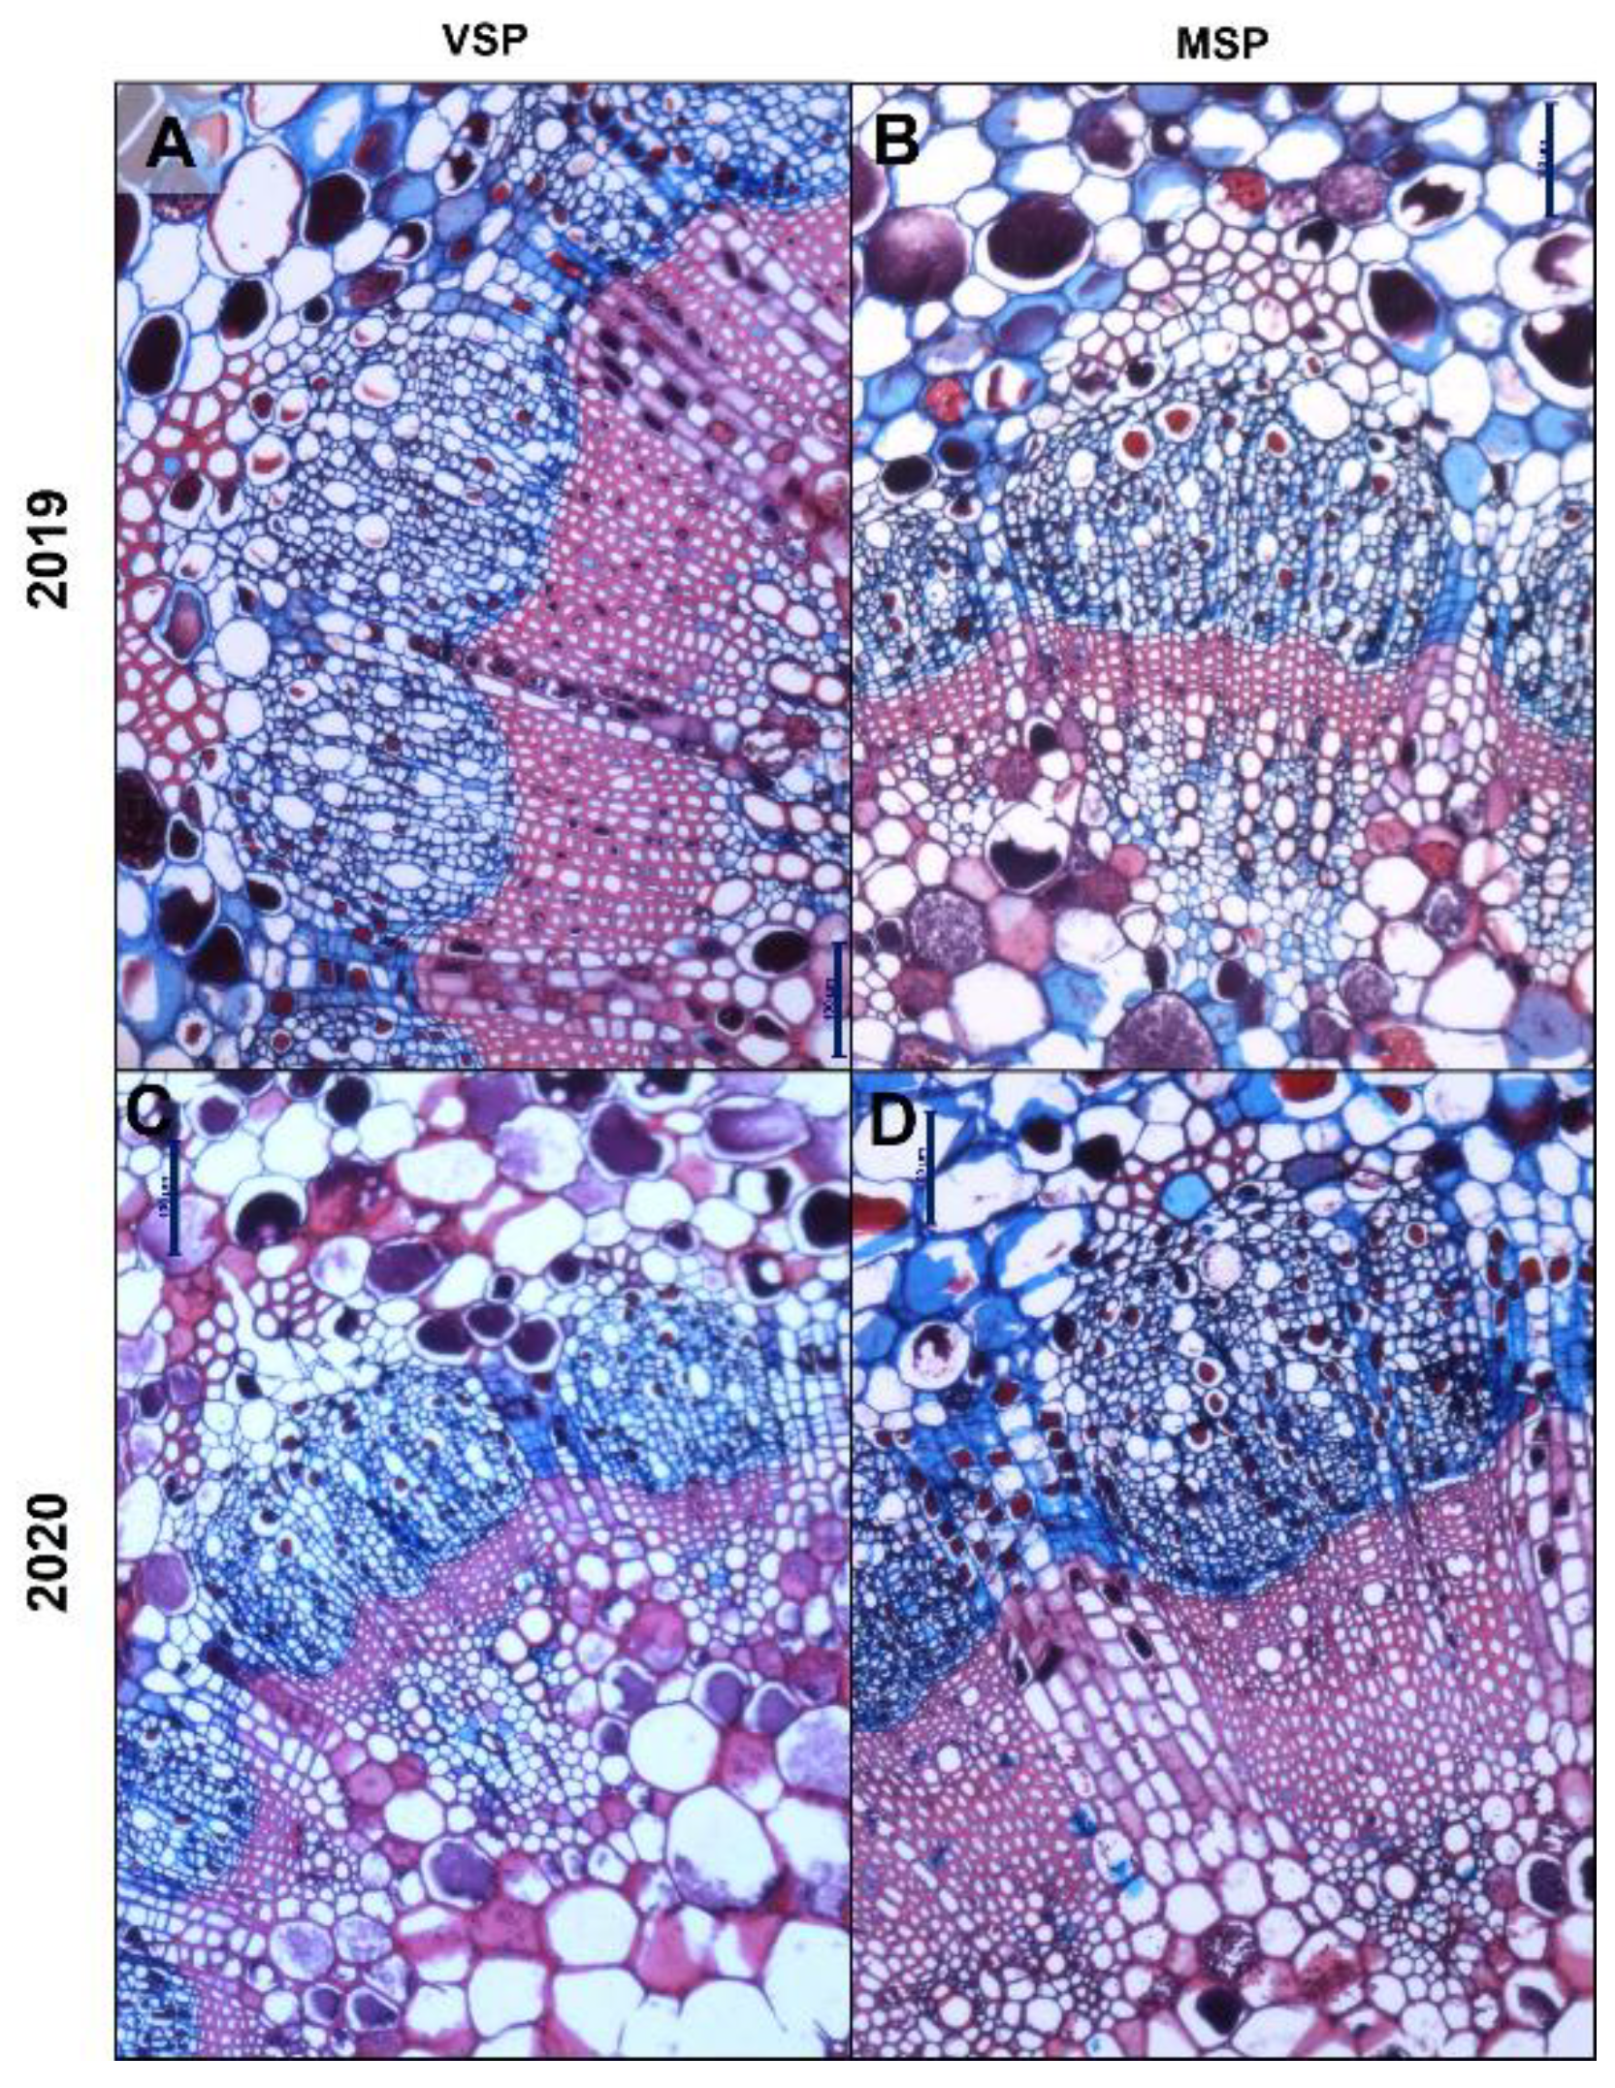
Overall, the treatment MSP did not induce a significant change in the sectional area, the cortex and vascular cylinder, in all phenological stages. However, a significant effect of MSP on the total vascular tissue areas (phloem and xylem) was observed. Xylem area did not suffer changes along the three phenological stages in both treatments in both seasons except for VSP in 2019, where lowest xylem area values were observed at VER. Phloem area showed conserved values along berry maturation in VSP both in 2019 and 2020. However, in MSP phloem area was reduced from PS onward in both 2019 and 2020 (Table 1 and Table 2). At FM, MSP showed a significant decrease in xylem (1.61±0.07 vs. 1.11±0.09) and phloem (1.52±0.06 vs. 1.32±0.07) areas when compared to VSP in 2019. However, in 2020, MSP showed higher xylem area at FM (1.18±0.10 vs. 1.81±0.10). These contrasting results between seasons impacted on the Phloem/Xylem ratio (Figure 2), which was significantly higher at FM in MSP in 2019 (Table 1) but lower in 2020 when compared to VSP (Table 2).
In general, the primary xylem vessel area, perimeter and diameter significantly decreased at VER, and at FM as compared with PS in both treatments and years. When compared to VSP, MSP significantly increased primary xylem area at VER in 2019 (Table 1). In contrast, no significant difference between VSP and MSP was observed on the primary xylem parameters in 2020 (Table 2). At VER, all measured secondary xylem parameters decreased when compared to PS in both treatments and years. At FM, all parameters (area, perimeter, and diameter) of secondary xylem vessels increased under MSP in 2019 (Table 1). In contrast, in 2020, these parameters decreased significantly in MSP (Table 2).

2.2. Hydraulic Conductance

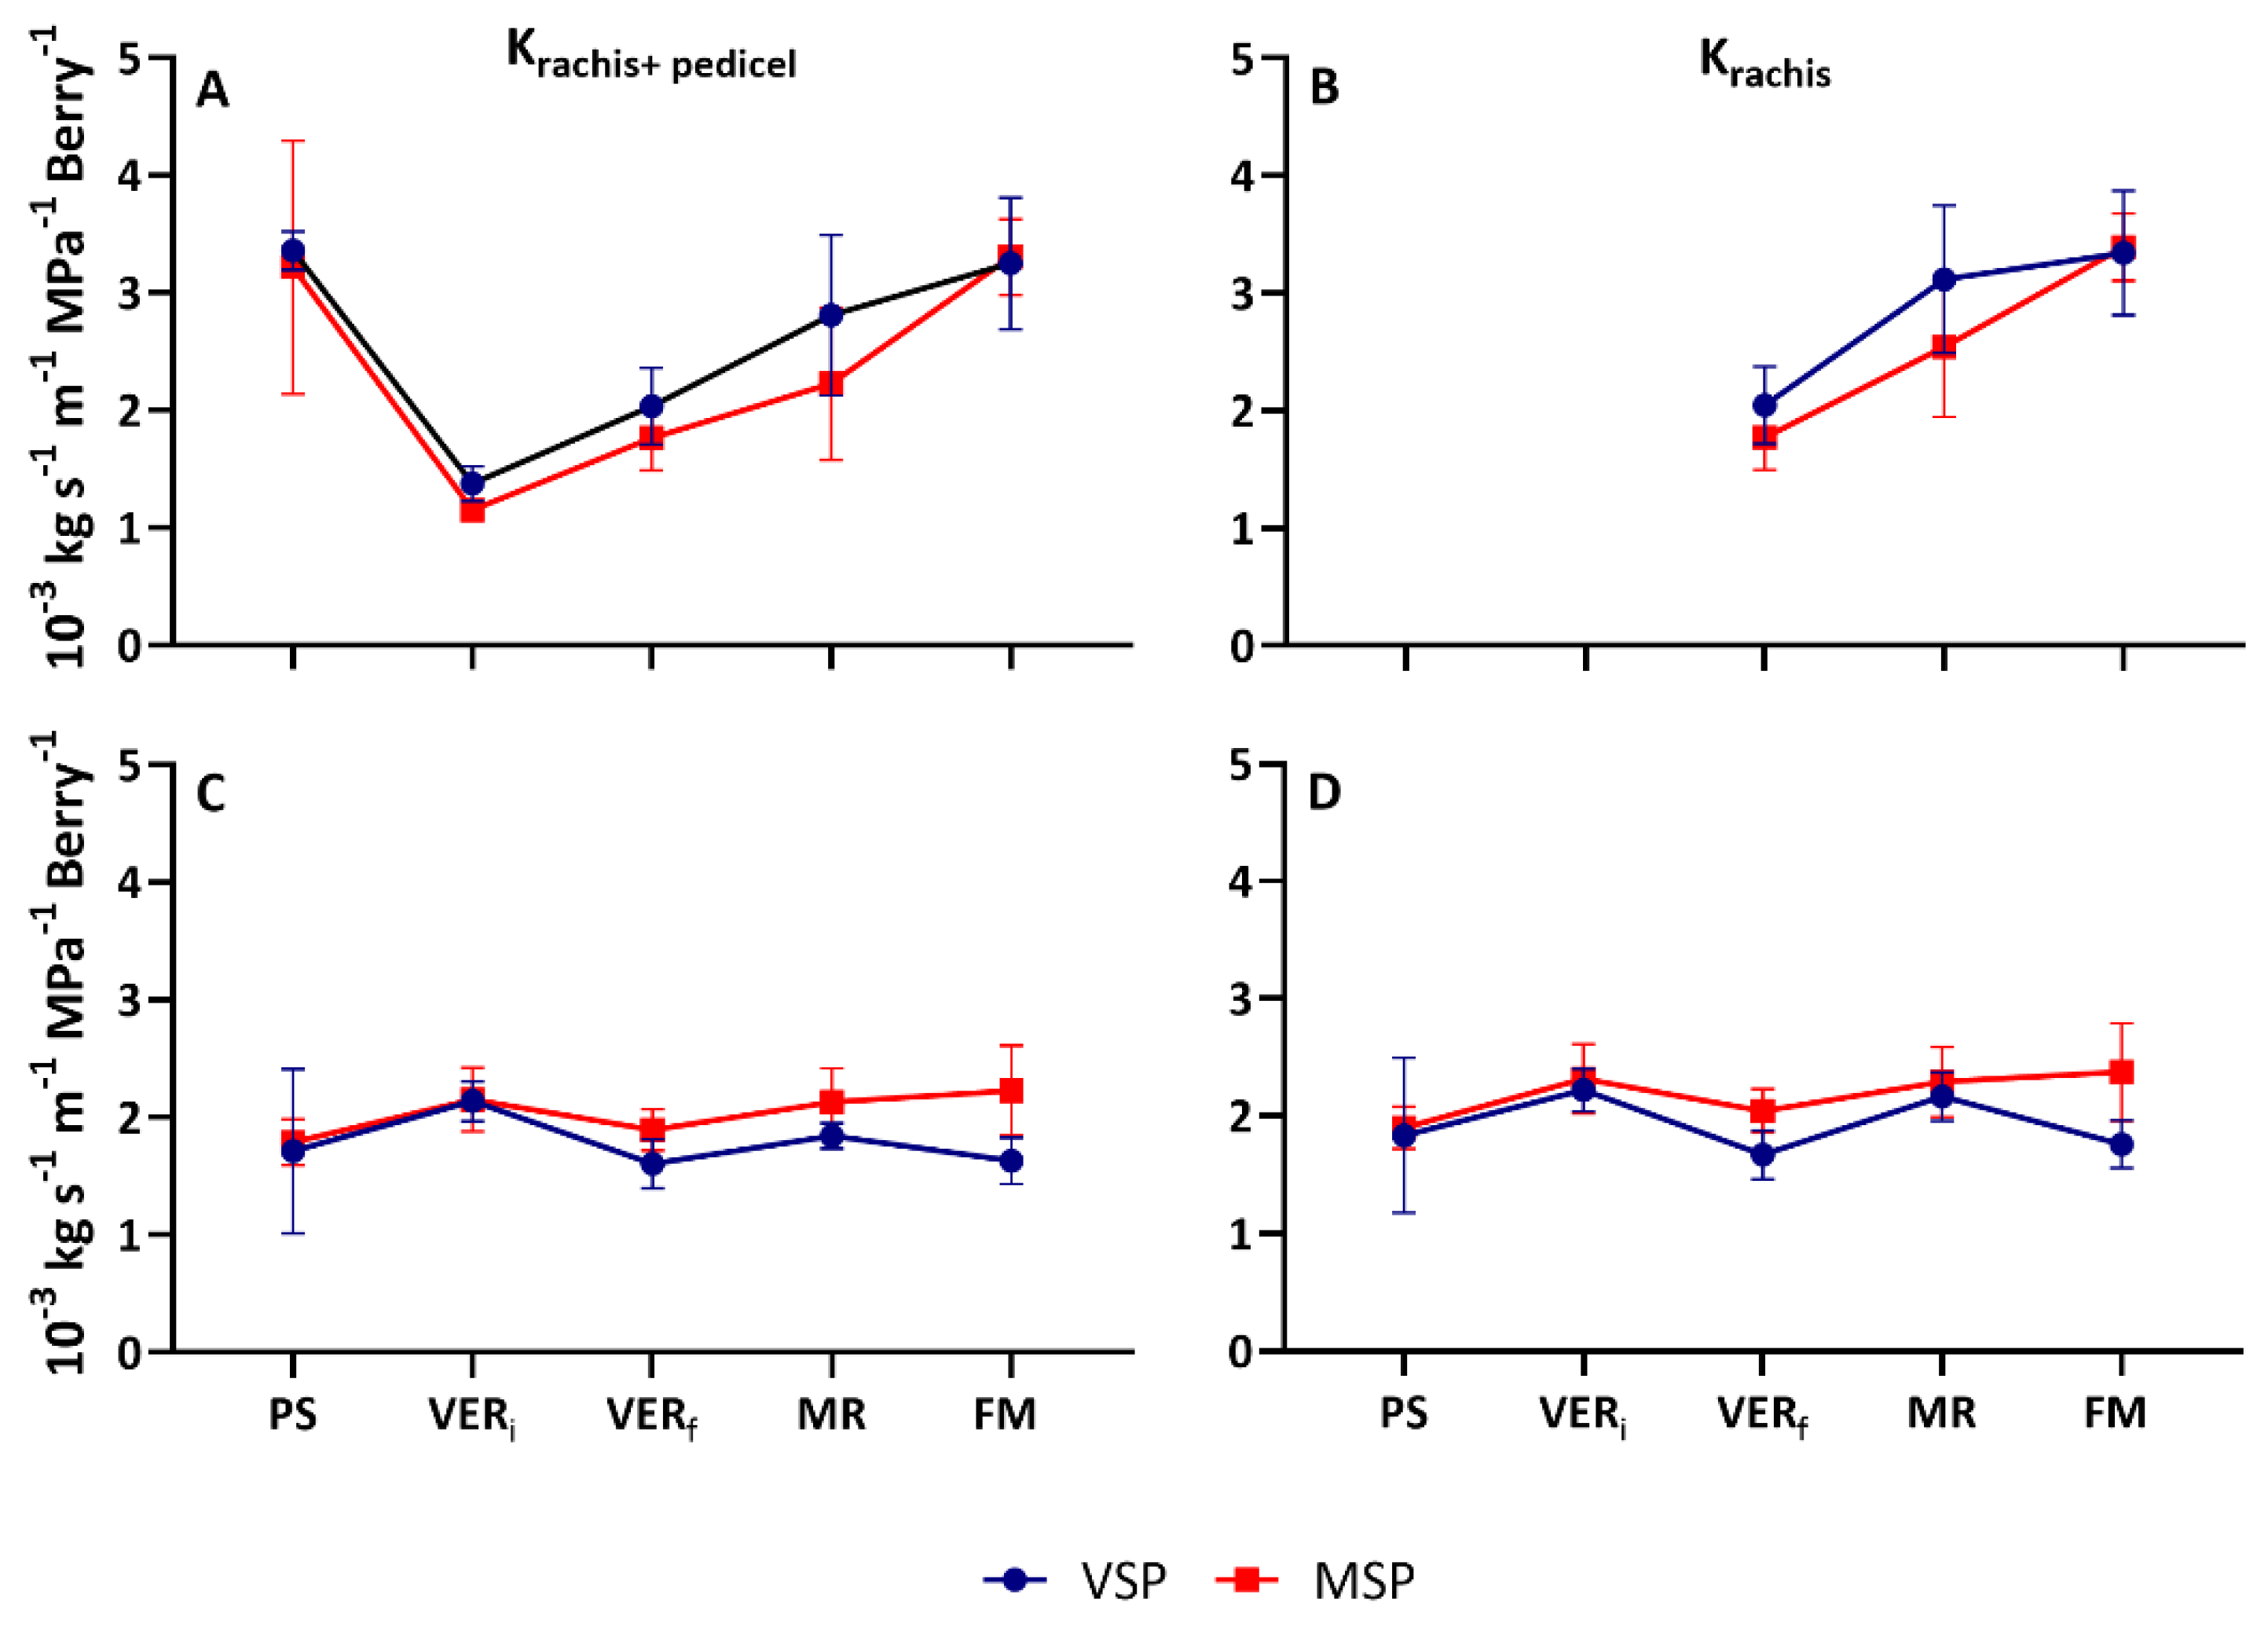
Grapevine berry asynchronous growth and ripening within the same cluster is previously reported by several authors, being veraison a critical stage for cluster asynchrony [26]. To avoid biased results in hydraulic conductance, three extra sampling points were done for these measurements, the beginning of veraison (VERi), the end of the veraison (VERf), and mid-ripening (MR). Different cluster hydraulic dynamic along berry maturation was observed between seasons (Figure 3). However, no differences in pattern were observed in the hydraulic conductance of rachis and pedicel (Krachis+pedicel) and hydraulic conductance of rachis (Krachis) between the two treatments, VSP and MSP.
In the 2019 season, Krachis+pedicel was high at PS and decreased significantly thereafter (≈60% in VSP and ≈65% in MSP), showing minimal values at VERi. After veraison, Krachis+pedicel increased in both treatments showing maximal values at FM (Figure 3A). After veraison Krachis increased both in VSP and MSP (Figure 3B). Although no significant differences were observed between treatments in all assessed stages, MSP showed a slow increase of hydraulic as compared with VSP.
In the 2020 season, both Krachis+pedicel and Krachis showed a steady-state behavior along berry ripening (Figure 3C-D). A slight decrease (≈25% in VSP and ≈10% in MSP) at VER and subsequent minimal increase at FM of both parameters was observed.
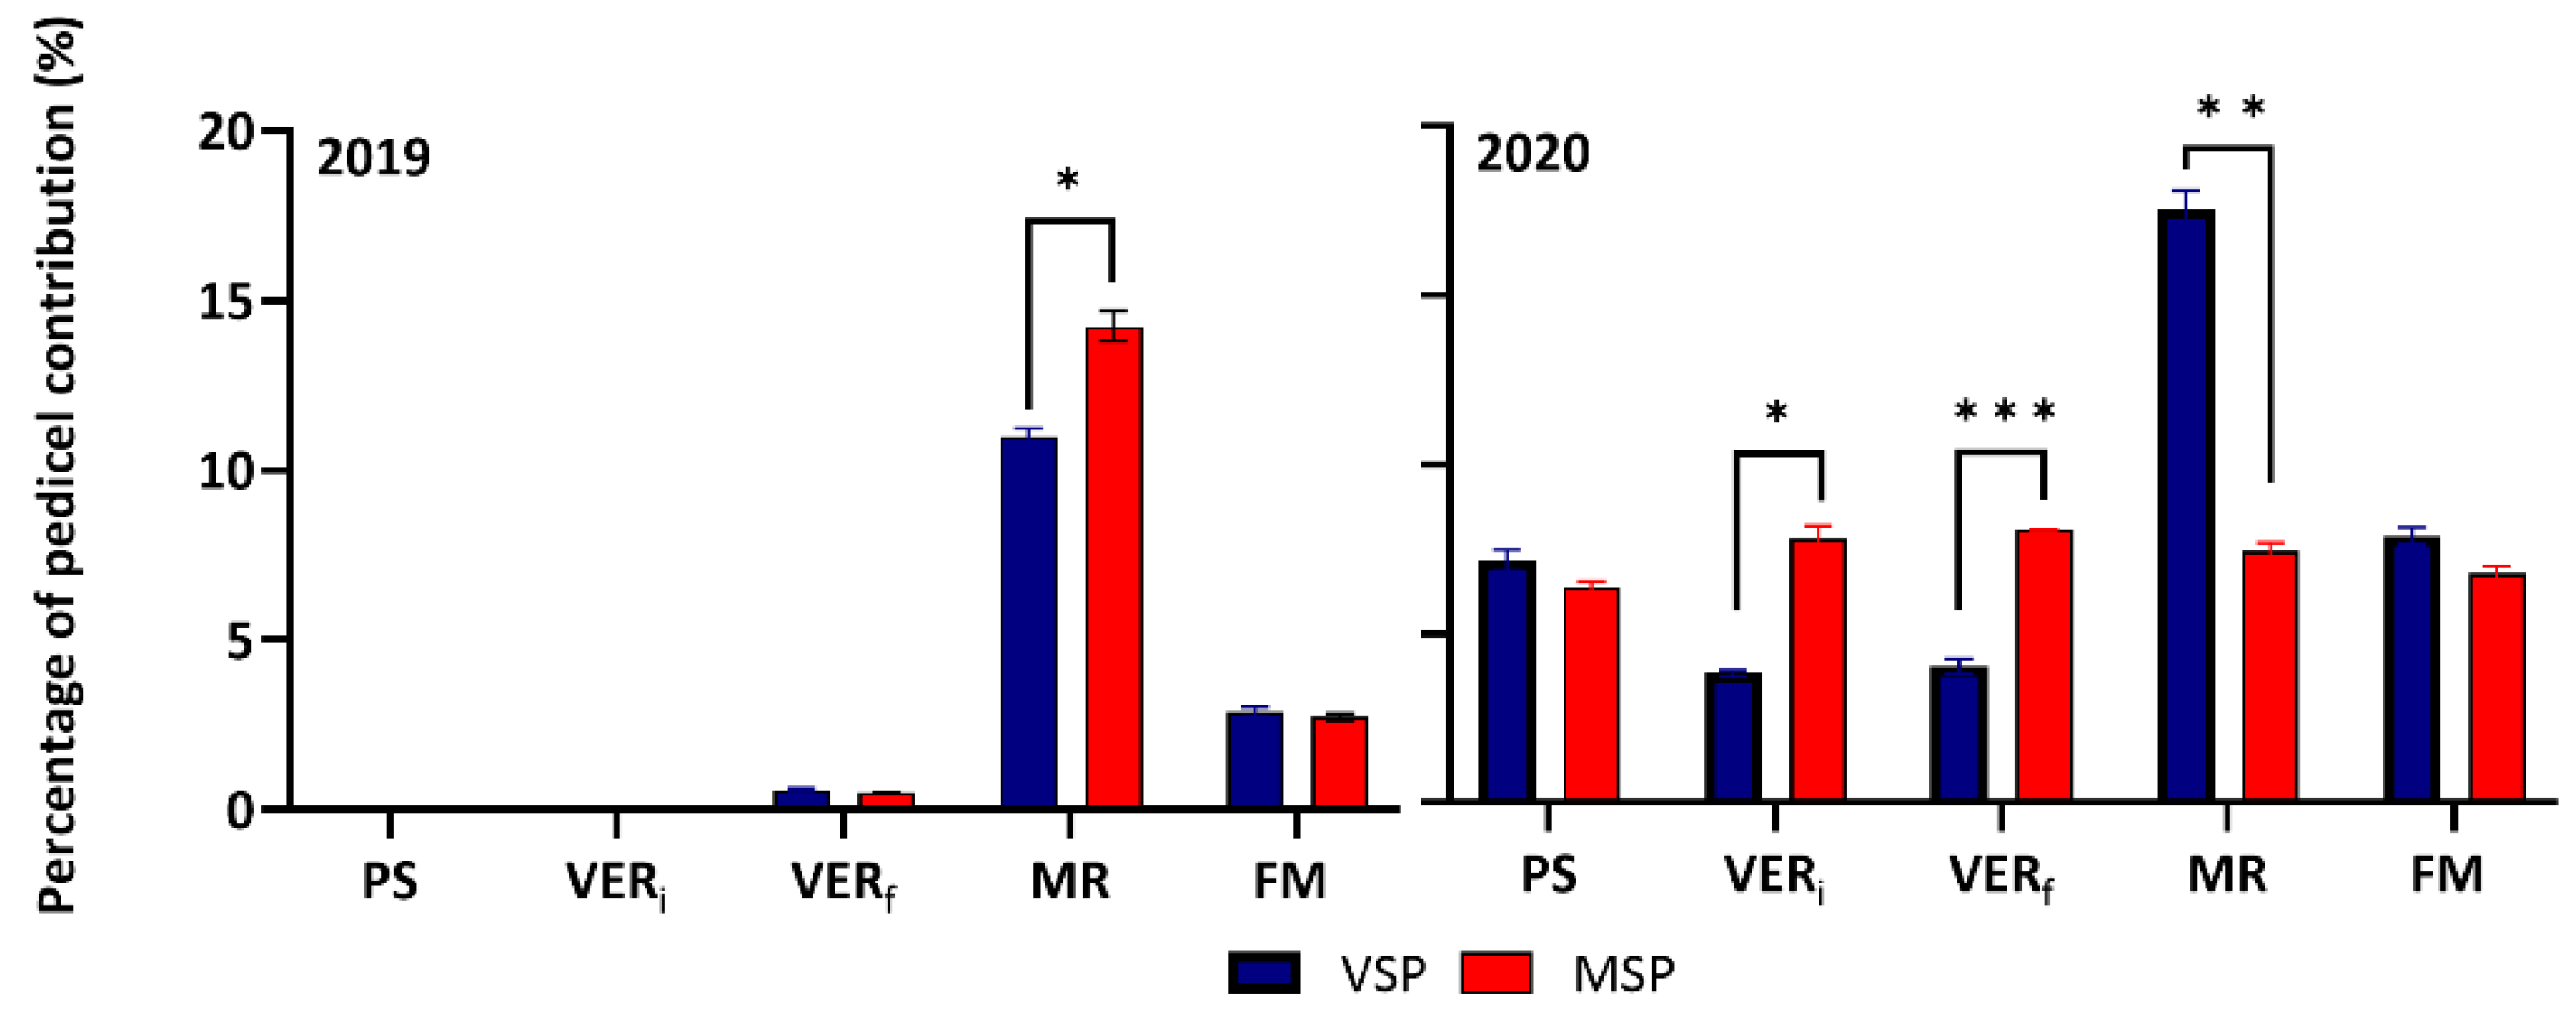
In both seasons, pedicels exerted a strong control of water flow in all stages. The pedicel hydraulic conductivity, derived from the difference between Krachis and Kpedicel+rachis, was lowest around VER (VERi and VERf) and highest at MR in both seasons. Interestingly in 2020, the contribution of pedicels in the total conductivity of the cluster, showed a steady-state behavior in MSP along the berry development stages, while it was modulated by phenology in VSP (Figure 4).

2.3. Gene Expression

As mentioned above, the largest trend changes in hydraulic conductivity along berry maturation were observed in 2019 as compared with 2020. Consequently, and to understand the role of aquaporins (AQP) in water movement and hydraulics within the reproductive structures and tissues, AQP expression was performed on 2019 samples. Also, the pattern of expression of some stress related genes was monitored solely in 2019. Gene expression was quantified in PS, VER and FM, in pedicels, pulp, and skin (except in PS where the whole berry was used) from the west side of the canopy. Also, in FM, gene expression was quantified in tissues taken from the east and the west side of the canopy.

2.3.1. Aquaporins

In general, AQPs showed differential expression among tissues and developmental stages, with different regulation responses to the treatment, being the extent of changes in expression more significant in the pedicel and pulp as compared with skin.
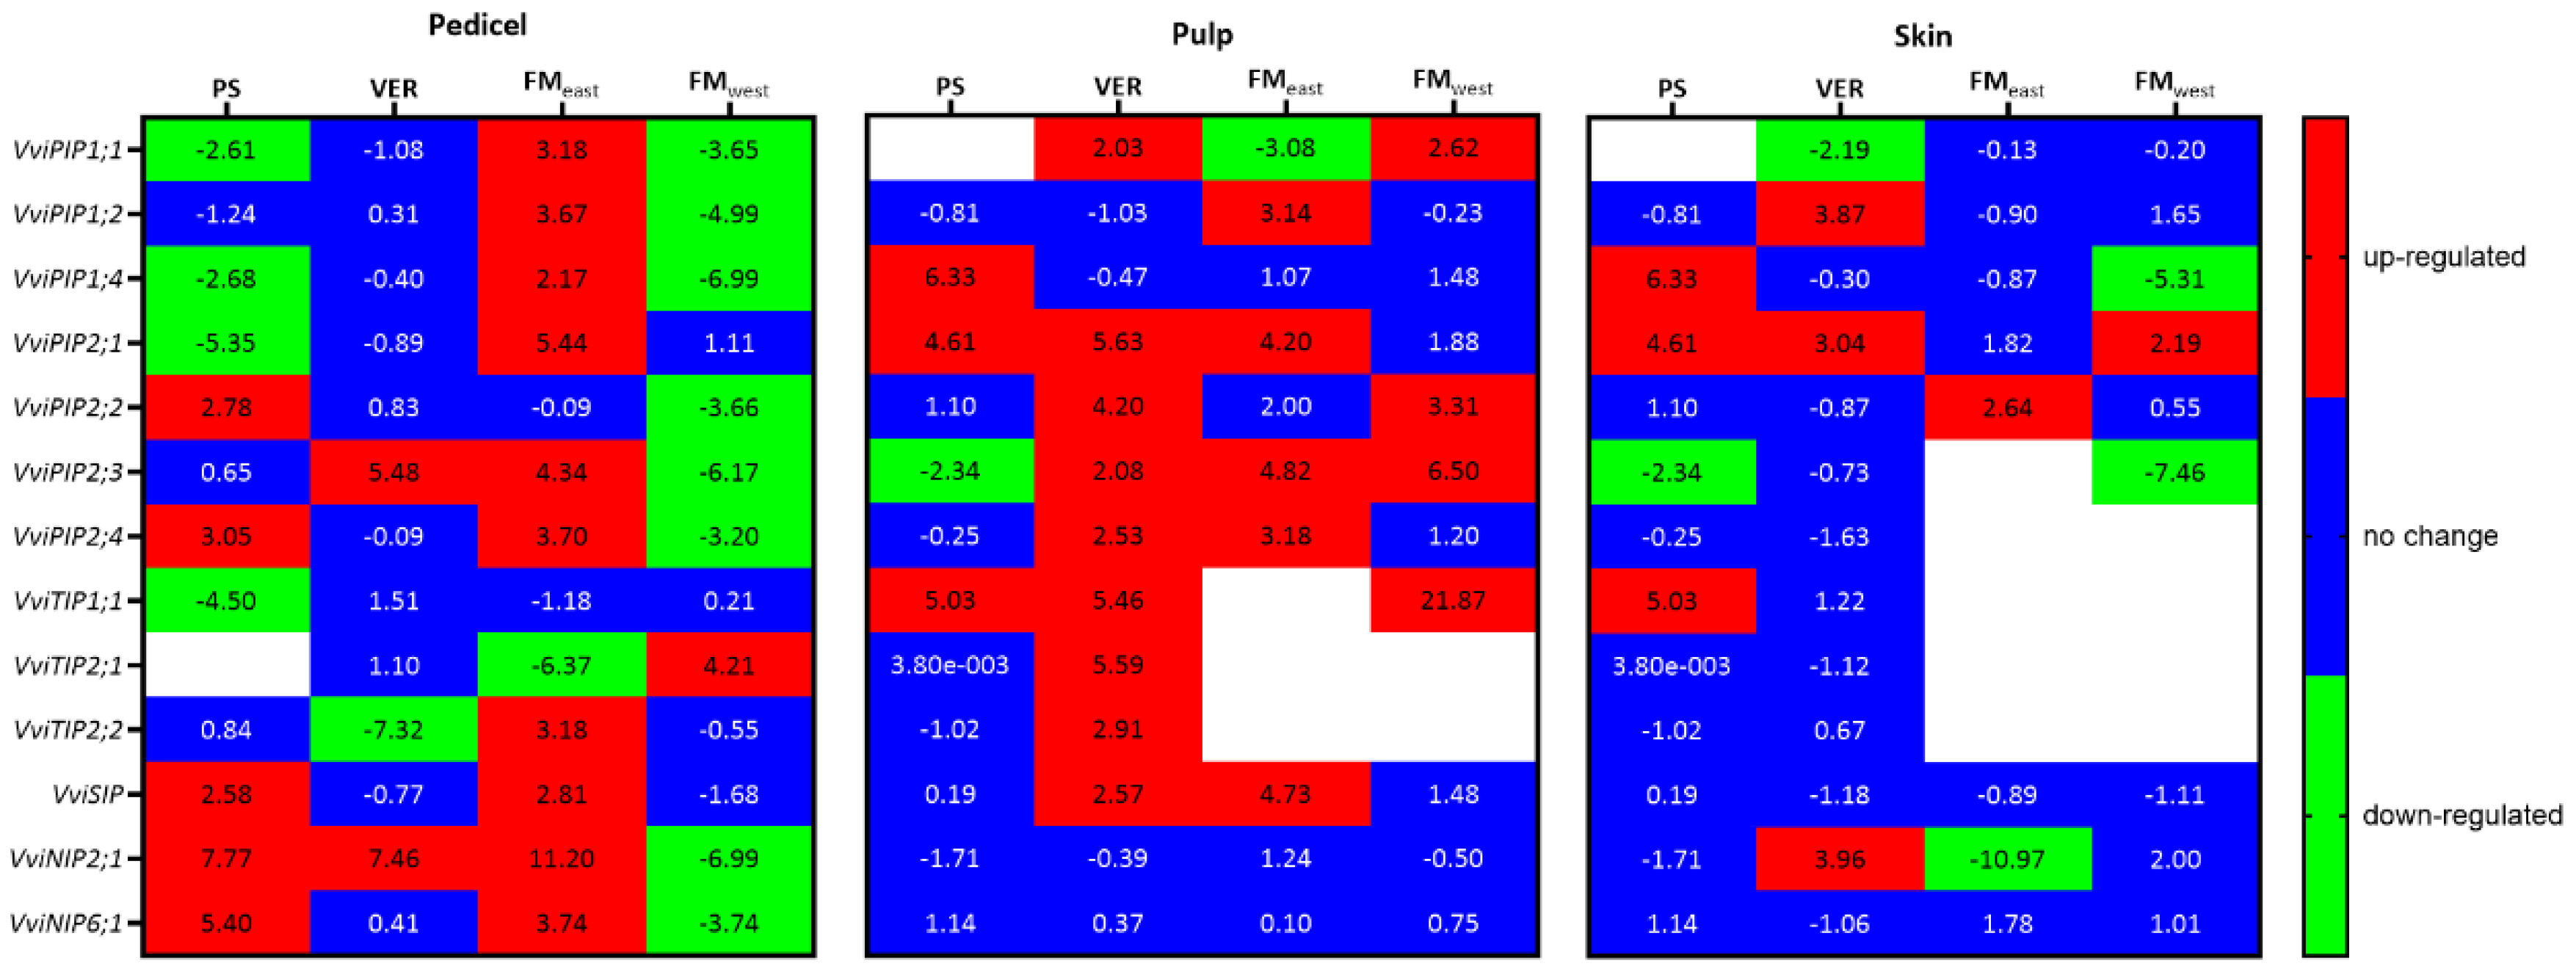
As shown in the heat map on Figure 5, the highest expression levels of most AQP genes was attained during the first stages of berry ripening (PS and VER), and decreased thereafter, in FM.
In pedicel, the genes coding PIP1 and PIP2 isoforms showed contrasting response to the treatment at PS. PIP1 isoforms were in general down-regulated (except for VviPIP1;2) while PIP2 were up-regulated (except for VviPIP2;3). Concerning TIPs, VviTIP1;1 was significantly down-regulated at PS, while no expression of VviTIP2;1 was observed in both treatments. On the other hand, SIP and NIP families were up-regulated in MSP. At VER, no significant expression changes were observed between treatments, except for VviPIP2;3 and VviNIP2;1 that were up-regulated in MSP and VviTIP2;2 that was highly down-regulated in MSP. At FM, differences between the two sides of the canopy were observed. At FMwest (side shaded by the canopy in MSP), all PIPs and NIPs were down-regulated, except for VviPIP2;1. which was up-regulated. In contrast at FMeast, most AQPs were up-regulated except for VviPIP2;1, VviTIP1;1 that showed no change and VviTIP2;1 that was downregulated.
At PS VviPIP1;4, VviPIP2;1 and VviTIP1;1 were up-regulated in MSP, while VviPIP2;3 was down-regulated. VviPIP1;1 was not detected in the berry at this stage.
In pulp, almost all studied AQPs were up-regulated at VER in MSP except for VviPIP1;2, VviPIP1;4 and VviNIPs. At FM, VviPIP1;1, VviPIP2;2, VviPIP2;3 and VviTIP1;1 maintained the up-regulation at the west side. At the east side, VviPIP1;2, VviPIP2;1, VviPIP2;3, VviPIP2;4 and VviSIP were up-regulated, while VviPIP1;1 was down regulated. It is worth to note that VviTIP1;1 expression was not detected in VSP at FM and in MSP on the east side, while it was highly expressed in MSP on the west side. In contrast, VviTIP2;1 expression was repressed in MSP on both sides. VviTIP2;2 was no longer expressed in pulp at FM in both treatments.
Compared with the other organs, in skin, few AQPs showed differential expression response between treatments. At VER, VviPIP1;1 was down-regulated in MSP, while VviPIP1;2, VviPIP2;1 and VviNIP2;1 were up-regulated. At FM, few changes occurred on the east side, with the up-regulation of VviPIP2;2 and the down-regulation of VviNIP2;1 in MSP. In FMwest VviPIP1;2 was up-regulated, while VviPIP1;4 and VviPIP2;3 were significantly down-regulated. No expression was recorded in skin for VviPIP2;4 and VviTIPs. No VviTIPs were detected in FM on both sides of the canopy.

2.3.2. Stress Related Genes

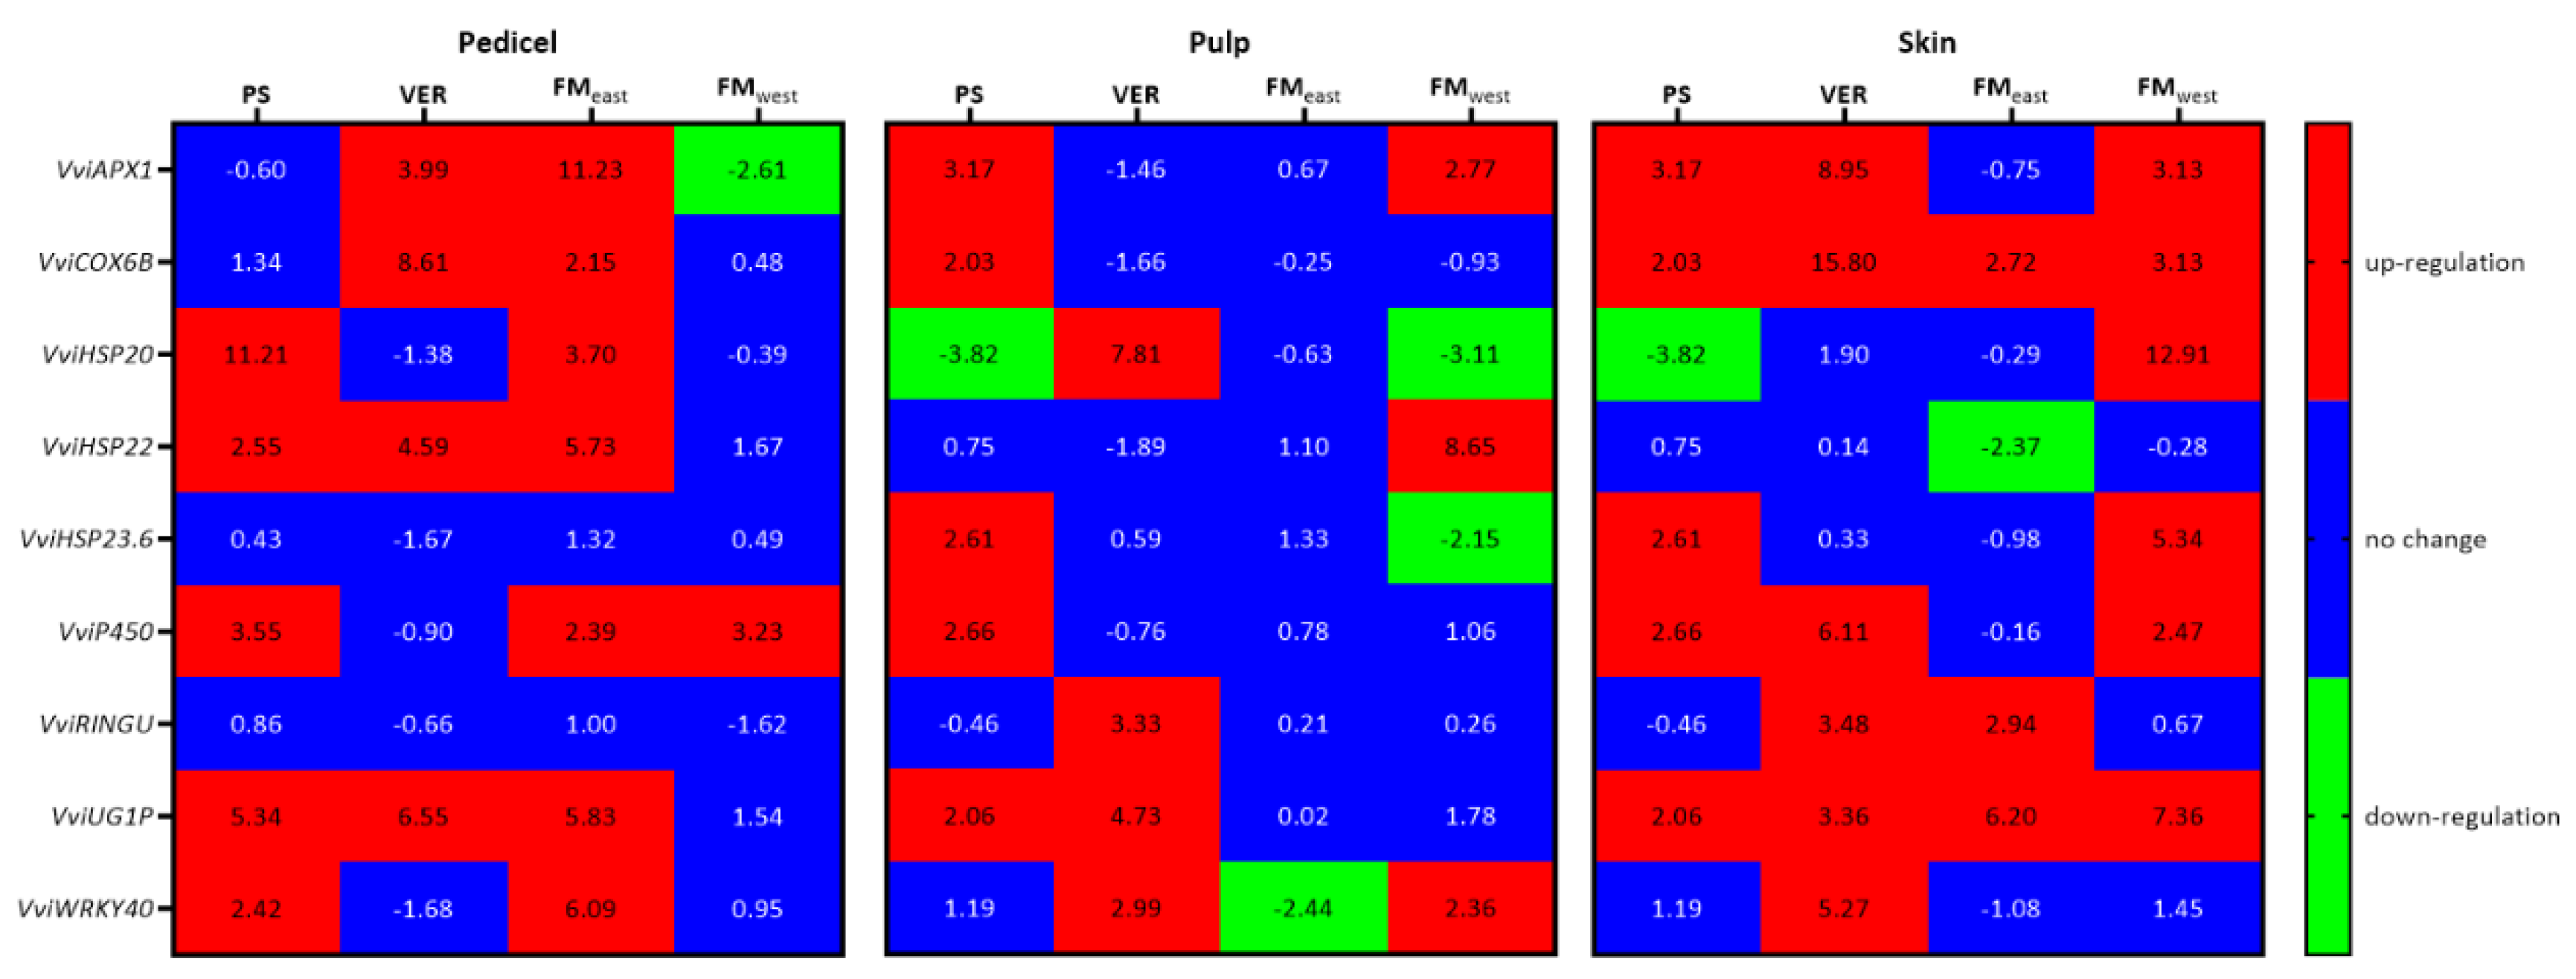
As well as AQP, stress related genes also showed different patterns of expression along time and in each tissue (Figure 6). In pedicels, the most striking pattern was the significant up-regulation of most genes in FMeast in MSP when compared with VSP. In fact, the only exceptions were VviRingU and VviHSP23.6, that suffered no significant changes between treatments. In PS VviHSP20, VviHSP22, VviP450, VviUGIP and VviWRKY40 were significantly up-regulated in MSP. In VER VviAPX1, VviCOX6B, VviHSP22 and VviUGIP, were significantly up-regulated in MSP. On those two developmental stages no genes were significantly down-regulated. Only on FMwest was a gene significantly down-regulated in pedicels, APX1, while P450 was up-regulated.
In pulp, three significantly high levels of up-regulation of sHSPs were observed, VviHSP23.6 in PS, VviHSP20 in VER and VviHSP22 on FMwest. In pulp FMeast, contrary to the pattern of pedicels, no genes were up-regulated, and the only significant change was the down-regulation of VviWRKY40. In VER, VviHSP20, VviRingU, VviUGIP and VviWRKY40 were up-regulated, while in FMwest, the three upregulated genes were VviAPX1, VviHSP22 and VviWRKY40 while VviHSP20 and VviHSP23.6 were down-regulated. On PS, VviAPX1, VviCOX6B, VviHSP23.6, VviP450 and VviUGIP were significantly up-regulated and VviHSP20 was down-regulated.
In skins, only two genes were down-regulated, and they are both sHPSs, VviHSP20 in PS and VviHSP22 in FM east. VviCOX6B and VviUGIP were up-regulated in all phenological stages, while VviWRKY40 was only up-regulated in VER. VviAPX1 and VviP450 were up-regulated in all phenological stages but FMeast, while HSP23.6, was up-regulated in PS and FM west, and VviHSP20 was also up-regulated in FMwest. In contrast, VviRingU was up-regulated in VER and FMeast.

3. Discussion

Fruit hydraulics is receiving increasing attention because of the importance of water transport for fruit growth and quality [27]. Berry water transport depends on the pathway resistance between several structures to which the berry is connected (e.g., peduncle, rachis, and pedicel) and the parent plant, as well as on the driving force for water flow. The resistance is generally attributed to lumen and inter-conduct resistchoatance, and to the resistance of the cell membrane [28], which is regulated by water channels and aquaporins (AQPs) [24,29]. Hydraulic measurements on Muscat of Alexandria clusters showed a dynamic change across phenological stages. Particularly, an increase in resistance around veraison was observed, corroborating several previous reports [14,23,30]. This decrease in water flow has been attributed to a shift in the pathway of water transport into the berry from the xylem to the phloem [31], due to the hydraulic buffering of grape berries from the parent plant [16,23]. However, the mechanisms that result in hydraulic buffering have not yet been elucidated. Scharwies and Tyerman [32] showed that cluster hydraulic conductivity could change over the ripening process depending on the genotype’s iso/anisohydric behavior. A decrease in whole cluster hydraulic conductivity during berry development has been considered as a characteristic of anisohydric genotypes [14]. In our study, Muscat of Alexandria showed contrasting trends between years. While hydraulic conductivity (normalized to rachis length and berry number) decreased along berry ripening during the 2019 season, in 2020 no significant changes were observed. Muscat genotypes have been classified as near-isohydric [33], and this behavior could explain the results obtained in 2020 but fails to explain the plants’ behavior in 2019. Regardless of the controversial classification of grapevine genotypes on iso/anisohydric groups [35,36]), Vandeleur et al. [36] demonstrated the ability of grapevine genotypes to switch their strategy by shifting from a near-isohydric to a near-anisohydric behavior, depending on soil water content, thanks to the activity of several AQPs. Another hypothesis could be that there was not a complete correspondence in berry developmental status between both seasons. Indeed, the onset of ripening depends not only on genetics of the genotype but is also highly influenced by environmental conditions [37]. This means that, in different seasons, the same apparent phenological stage, visually assessed, could in fact represent different metabolic stages for berries. Indeed, climatic conditions were different in 2019 and 2020 (Figure S1). In June 2019, at PS, meteorological conditions were favorable for grapevine physiology and berry development, with optimal temperatures (below 30 °C) accompanied by a precipitation event of 16 mm. This may have enhanced leaf stomatal opening and, thus, the increase of water flux within the canopy, explaining the high hydraulic conductance of berry clusters observed at PS. In 2020, however, heavy precipitation occurred in April-May (≈200 mm), coinciding with berry set, which delayed berry maturation by almost 10 days compared with 2019. This implied that the berry growth period (e.g. PS, VER, MR) was delayed to later in the season, occurring in a shorter time span than in 2019, and under more stressful conditions due to the high air temperatures and absence of precipitation during summer. These conditions could have affected the cluster xylem development (e.g. no significant changes in primary and secondary xylem after VER), limiting the water transport capacity which could explain the relatively stable cluster hydraulic conductance after VER in 2020 compared with 2019 when Kh increased in VERf. Corroborating this later assumption, anatomical data in 2019, shows a reduction in vessel diameters (primary and secondary xylem) around VER, while in 2020 vessel diameter shows a constant value along berry development. Knipfer et al.[38] observed a decrease in Kh pedicel despite the increase of xylem area and associated it to blockage due to vessel elements. Hence, our data suggest that conditions that favor water transport at pea size defined the threshold for later season water transport in clusters. The increase in hydraulic conductivity, observed in VERf in 2019, was somehow unexpected given the common assumption that berries become dependent on phloem water supply because xylem inflow declines at the onset of ripening [15,40]. Nonetheless, in tomato, xylem water import still remains the dominant pathway throughout fruit ripening [40]. A recent report in grapevine also points to the functionality of xylem after VER [17], but with the function to sustain the backflow of excess phloem-derived water. Scharwies and Tyerman [32], on the other hand, suggested a possible xylem water import reactivation at the end of ripening when phloem import ceases. In all cases, the lag phase of berry growth, occurring prior to VER, is likely to affect xylem development, with new vessels having smaller diameter than those produced before and after this stage.
Environmental impacts may be mediated by changes in the water potential and osmotic gradients of the stem-pedicel-fruit continuum. In this sense, low light intensity was shown to decrease the total sap flow and increase the relative contribution of the xylem to the import of fruit water [42,43]. It is thus expected that MSP would change water flow in the berry clusters. The absence of significant differences in hydraulic conductance between VSP and MSP in both seasons, may result from the timing of the treatment application. As Kh is a relatively conservative trait, the fact that MSP was only applied at PS stage resulted in a short time span to induce significant hydraulic adaptations capable of explaining changes in water flow through the xylem.
According to Pace et al. [43], when fibers increase in abundance, fiber bands become more closely arranged, leading the elements towards a tangential disposition, while the axial parenchyma reduces in abundance and becomes sieve-tubecentric. The presence of this sieve-tubecentric axial parenchyma in the fibrous species may contribute fundamentally to phloem transport by creating the osmotic pressure known to be necessary to maintain turgor pressure for phloem loading and unloading [45,46,47].On the other hand, different studies reported the involvement of AQPs in changing xylem hydraulic resistance along maturation and/or the accumulation of sugars at post-veraison (see review by Sabir et al., [24]). Accordingly, AQPs showed differential expressions among organs and developmental stages. Interestingly, MSP treatment modulated the expression of the different AQP genes in all tissues particularly at pedicel and pulp levels and with less extent in berry skin. Previous reports showed greater membrane water permeability of PIP2s compared with PIP1s in the yeast system. In grapevine, the ability of water conductance was only demonstrated for VviPIP2;1, while the remaining members, VviPIP2;2, VviPIP2;3, VviPIP1;1 and VviPIP1;4, did not affect yeast water transport despite their correct localization in the plasma membrane [47]. In addition, reports have shown that water permeability of grapevine VviTIPs is generally higher than in VviPIPs [47]. It is worth to note that VviPIP2;1 and VviTIP1;1 were down-regulated at PS in the MSP pedicel but highly up-regulated in the berry, indicating the opposite effect of canopy architecture modulation (MSP) in the cell-to-cell water transport among organs. These later results contrast with reports associating the loss in pedicel osmotic potential over fruit development with a decline in aquaporin activity in the pedicel [38], based on what had been observed for some isoforms in the berry [22,23]. The fact that several AQPs able to transport water were down-regulated at the pedicel at the early stages of berry ripening in MSP, but up-regulated at full maturation (e.g. all AQPs but VviPIP2;2, VviTIP1;1, VviTIP2;1 on the east side and VviTIP2;2 on the west side) indicate that the treatment induces changes in water relations within the berry cluster along berry maturation in the same plant. The up-regulation of AQPs at FM could be related to high water content in the apoplast driven by the phloem at late ripening to sustain accumulation of sugars in fruits as suggested by Keller et al. [39]. This is an indication that MSP stimulates sugar translocation to the berry, as compared with VSP. This result is sustained by the up-regulation of VviUG1P at FMeast and FMwest in MSP berry skins. The X1 isoform of UTP-glucose-1-phosphate uridyltransferase (UG1P), coded by VviUG1P [48], is involved in the synthesis and degradation of sucrose [49]. As such, VviUG1P plays an important role in the accumulation of sugars in the berry, selectively channeling the mobilization of sucrose to promote its accumulation in berries [49,50]. Notwithstanding, VviUG1P was in contrast down-regulated in MSP at VER, suggesting a delay in the accumulation of sugars by the shade effect to a more advanced phenological stage (up-regulation at FM). The results suggest that artificial shading may induce higher accumulation of sugars after VER, through the activity of VviUG1P and AQPs, when compared to exposure to direct sunlight.
In addition, AQP expression may be related to the detoxification process, as part of the oxidative burst around VER [51]. Several grapevine AQP showed capacity for hydrogen peroxide (H2O2) transport across membranes [24]. Our data corroborate this hypothesis since several AQP related with H2O2 transport increased their expression in the berry at VER, particularly in pulp. Interestingly, these AQP were up-regulated in MSP. In addition the up-regulation of VviAPX1 in the three tissues at PS and/or VER, known for its activity in scavenging H2O2, and metabolic processes as berry maturation [52], suggests that, together with AQP it may contribute to a higher activity of elimination and regulation of H2O2 levels compared to the conditions of direct sunlight, and may prevent excessive accumulation of ROS during the maturation of the berries and thus exert a protective effect against oxidative damage, particularly in the organelles.
Considering that the ripening process in general is associated with large increases in sugar transport and accumulation with changes in cell wall metabolism [53] and turgor, that are mediated by AQP and their modulation of membrane water permeability, our results indicate an effect of MSP on the ripening process of the berries. The shading provided by MSP may have altered the cluster microclimate at the level of temperature and relative humidity, which may in turn have impacted on the vapor pressure deficit (VPD) with consequences in fruit transpiration rate and thus changes in water demand and flow in the rachis and pedicel. This could explain the down-regulation of most of the AQP in the pedicel at FMwest and not at FMeast. The up-regulation of VviCOX6B only at FM in MSP confirms the microclimate change induced by this treatment. COX6 plays an essential role in the assembly of cytochrome c oxidase (COX), involved in electron transport in the mitochondrial respiratory chain [15], and its expression is associated with the absence of light and the presence of sugars [54]. Thus, the up-regulation of VviCOX6B in MSP skins and in pedicels may be related to the lower luminosity provided by the artificial shading of the canopy and/or to an increased availability of sugars, that may contribute to higher mitochondrial function in skins and pedicels [55]. This also suggests that respiration of VSP pedicels is starved probably due to high temperature and radiation incidence. Pedicels are major pathways for O2 diffusion into the grape berry, the decrease, or the halt, of respiration in pedicels reduces O2, leading to hypoxia and berry shrivel [56].
Notably, the absence of expression of some AQPs at some phenological stages highlights their specific seasonal function in each organ. In particular, the lack of TIP expression at full maturation both in pulp (except for VviTIP1;1) and skin could be related to the reduction of vacuolar osmotic pressure in relation to apoplastic pressure as shown by Keller et al.[39], thereby reducing TIP recruitment for vacuolar homeostasis in these tissues. The high up-regulation of VviTIP1;1 at FM in MSP suggests the effect of the shading treatment in cell water movement and corroborates the hypothesis of a maturation shift in MSP treated plants.
Heat-shock proteins (HSPs) are related to the plant’s ability to acquire thermotolerance. HSPs expression was shown to be activated and/or increased under high temperature stress in several organs/tissues [57,58,59], but also under other abiotic stresses [60,61] as well as by fruit developmental processes [62]. The expression pattern of the three studied HSPs differed among berry organs and tissues and was modulated by MSP, indicating their specific role in each phenology and berry compartment. Interestingly, VviHSP20 and VviHSP22 were up-regulated at PS in the pedicel, while only VviHSP23.6 was up-regulated at this stage in pulp and skin while VviHSP20 was down regulated in these tissues. In citrus, the concomitant up-regulation of AQPs and HSPs was related to the reduction of oxidative stress risks under drought [63]. These results suggest that canopy architecture manipulation (MSP) activated, rather than repressed, physiological processes, by enhancing the onset of oxidative stress in PS berries at pulp and skin level. This assumption is corroborated by the down-regulation of VviHSP20 at this stage, that has been previously shown to be repressed by H2O2 in Kyhoto berries [64].
VviWRKY40 acts as a transcriptional repressor that, by binding to the GT14 promoter, represses its activity and impairs the biosynthesis of monoterpenoids [65,66] VviWRKY40 expression was also shown to be down-regulated by ABA [66]. Its up-regulation under MSP treatment at VER in pulp and skin corroborates the hypothesis of a metabolic delay of the onset of maturation in MSP berries. Interestingly, in pulp, VviWRKY40 is down-regulated in FMeast while it is up-regulated in FMwest. This points towards a delay of terpenoid accumulation in shaded berries in one side. In addition, it also suggests that in the same plant, MSP applied on the west side of the canopy also modulates the microclimate of berries located at the east side. In fact, vertically upwards shoots of VSP on the west side act as barriers to direct solar radiation after solar noon to berries located on the east side of the canopy. However, when leaning the shoots (MSP), this barrier is reduced, and berries located on the east side become more prone to direct solar radiation in the afternoon. Overall, the MSP agronomic practice may lead to an increase in the expression of VviGT14 on the east side and reduction of expression on the east side and, consequently, to berries with different amount of glycosylated monoterpenoids.

4. Materials and Methods

4.1. Field Trial and Plant Material

The experimental research was conducted from June to September 2019 and 2020, in a vineyard located at Tapada da Ajuda, Lisbon (38° 42’ 27.5’’ N, 9° 10’ 56.3’’ W and 62 m above sea level). The vineyard has an area of 1.7 ha and belongs to Instituto Superior de Agronomia (ISA). It was planted in 2006 with a North-South row orientation, a density of 4000 plants/ha with 1.0 m between plants and 2.5 m between rows. The training system is Vertical Shoot Positioning (VSP) spur pruned in a unilateral Royat cordon with plants uniformly pruned to 12-14 nodes per vine and the rootstock is 1103 Paulsen. The soil is a clay loam with 1.6% of organic matter and a pH of 7.8 [67]. The climate is mesothermic [68], and the monthly mean precipitation values, mean, maximum, and minimum temperatures in the two seasons of the trial are shown on Figure S1. The vineyard was drip-irrigated with drip irrigation lines in the center of the row and consisted of pressure compensating 2.5 L h-1 emitters at 1.0 m spacing (one per vine positioned between two adjacent vines). Irrigation began in June (BBCH 69, end of flowering) and was managed using a soil water probe. Water was kept at readily available levels until veraison, after which irrigation was managed to obtain values of predawn leaf water potential of ≈ -0.3 MPa. Irrigation stopped a week before harvest, at BBCH 89. The inter-row was managed with resident vegetation that was mowed in the spring and left on the ground as mulch.
The experiment was conducted on eight rows of the variety Muscat of Alexandria (syn. Moscatel Graúdo). The experimental design was a randomized complete block with two treatments and four replicates per treatment. The treatments consisted of a conventional Vertical Shoot Positioning (VSP) training with two pairs of movable wires as control, and the shaded treatment (Modulate Shoot Positioning, MSP), an adaptation of the conventional VSP by withdrawing the upper movable wire at the west side of the canopy to promote the downwards re-positioning of shoots to provide shading of the western facing bunches. It was decided not to curve the shoots to both sides to prevent the opening of the canopy and therefore the exposure of the central bunches. The shoots were not trimmed. In each replicate, six plants were selected for analysis, and the beginning of the MSP treatment took place at berry touch stage (BBCH 79) that occurred at the middle of June in both seasons.

4.2. Histology

In both seasons peduncle samples were taken from four clusters at three different times according to the phenological stage of the vines (PS, VER, and FM). In each sample, a 0.5-1 cm long segment of the upper-middle zone of the stalk of the cluster (peduncle) of the same clusters where the hydraulic measurements were made, i.e. 4 segments from the control treatment (VSP) and 4 segments from the shading treatment (MSP). All collected samples were immediately fixed in FAE (formalin:acetic acid:ethanol, in 2:1:10 proportion) [69]. Afterwards, they were dehydrated in ascending ethanol solutions, clarified with tertiary butyl alcohol, and embedded in paraffin plasticized + DMSO pellets (M.P. 56-58 °C, Panreac-AppliedChem) by paraffine/TBA method [69]. Transverse sections of 10 μm thick were cut using a rotary microtome (Leica RM2255).
Two staining procedures allowed us to analyse the cluster peduncle anatomy: after deparaffinization with Cytrosol (Panreac-AppliedChem) and dehydration with ethanol decreasing series, the sections were stained using either (i) single staining with a 0.05 % (w/v) aqueous solution of Toluidine blue (Sigma-Aldrich) or with a 0.05 % (w/v) aqueous solution of Safranine O DC (Sigma-Aldrich) or (ii) double staining with a 1 % aqueous solution of Safranin for 1 min, washed with distilled water, and then stained with a 0.5 % (w/v) aqueous solution of Astra blue (Sigma-Aldrich) for 20 minutes and washed with distilled water [70]. After that, sections were dehydrated with increasing ethanol concentrations and mounted in a Eukitt mounting medium (Sigma-Aldrich). Finally, all sections were observed and photographed, using a Nikon SMZ1000 stereomicroscope (0.8x) and Nikon Eclipse 50i light microscope (at different magnifications), both coupled a Nikon DS-Fi1 camera and analyzed with NIS-Elements Advanced Research v. 3.22.15 Software (Nikon Instruments Inc.).
For each treatment and sampling stage, the total section area and the areas occupied by the different tissues (cortex, vascular cylinder, xylem, phloem, and pith) were measured on microphotographs of peduncle cross sections using Image J software. These morphometric measurements were performed on five complete cross-sections of four peduncles per treatment and sampling with a minimum spacing of at least 150 µm. Similarly, the quantitative characteristics of the primary and secondary xylem vessels (area, perimeter, and diameter) were determined on a 90° circular sector of the same sections [71].

4.3. Hydraulic Conductance

Sampling was done at different times according to the phenological stage of the plants. at PS, at the beginning of veraison (VERi), at the end of the veraison (VERf), at mid-ripening (MR) and at FM. Visually healthy clusters in the west side of each replicate of both treatments (n = 4 plants) were collected at early morning (to ensure minimal xylem tension). Clusters were excised under water, to avoid artificially induced bias in hydraulic conductance (Kh). Samples were then bagged and transported in water to the lab at 4 °C for hydraulic analyses. For each cluster, berries were counted and excised (without pedicel) under water. Rachis length was assessed with image analysis software (ImageJ). The upper cross section diameter of the cluster, cluster fresh weight (FW) and dry weight (DW) as well as pedicel number, FW and DW were also assessed.
Cluster peduncles were wrapped in Teflon tape, connected to the flow meter by their proximal ends, and Kh was measured at low pressure (2–4 × 10⁻³MPa) when flow reached a stable value. A perfusion solution of ultra-pure, deionized, degassed, and filtered (0.2 µm) water was used in Kh measurements.
Hydraulic conductance (Kh, kg s−1 MPa−1), calculated as the ratio between the flow through each cluster and the corresponding hydrostatic pressure gradient, was measured in whole cluster (rachis+pedicels) following Sperry et al. [72], with a high precision flow meter, XYL’EM (Embolism Meter, Bronkhorst, Montigny-Les-Cormeilles, France). Hydraulic conductance was normalized to the length of each cluster (hydraulic conductivity, kg s−1 m MPa−1). The hydraulic conductivity was converted to cluster specific hydraulic conductivity (Khrachis+pedicels) by dividing by the cluster sectional area (m2) and by the berry number. To assess the pedicel resistance, a second Kh measurement was done after excising all pedicels under water. The hydraulic conductivity was converted to cluster specific hydraulic conductivity (Khrachis) by dividing by the cluster sectional area (m2) and by the pedicel number.
It is important to note that during 2019, hydraulic measurements were only performed in rachis+pedicels, at PS and VERi, while measurements of the rachis without pedicels were only performed at VER and FM. In 2020, hydraulic measurements were performed both in rachis+pedicels and in rachis at all phenological stages.

4.4. RNA Extraction

Cluster fractions were collected in grapevines of both treatments, on the West side of the canopies in PS and VER, and on the East and the West side of the canopies at FM. Samples were kept at -80 °C until processing. Samples were ground in the presence of liquid nitrogen with a mortar and pestle. Total RNA was extracted using Spectrum™ Plant Total RNA kit (Sigma-Aldrich, St. Louis, MO, USA). Nucleic acid concentration was quantified spectrophotometrically using a Take3 plate and the software Gen5 1.09 in a Synergy HT (Bio-Tek Instruments, Winooski, USA). The quality of the RNA extracted was evaluated through the ratios A260/A280 and A260/A230 and RNA integrity was assessed through 1.5 % agarose gel electrophoresis under denaturing conditions.

4.5. cDNA Synthesis for qPCR

RNA samples were treated with RQ1 RNase-Free DNase (Promega, Madison, WI). cDNA was synthesized from 1 µg of total RNA using oligo(dT)20 in a 20 µL-reaction volume using RevertAid Reverse Transcriptase (Thermo Fisher Scientific, Waltham, MA) according to the manufacturer’s recommendations. cDNA was tested for gDNA contamination in PCRs using intron spanning primers that yield a 229 bp amplicon in cDNA and a 547 amplicon in gDNA. Amplicon sizes were compared in 2 % agarose gels together with the molecular weight marker 1Kb+ (Thermo Fisher Scientific) and no gDNA contamination was detected. cDNA was stored at -20 °C until further use.

4.6. qPCR

Primers for AQP, HSPs, and other stress responsive genes were obtained from the literature or from previous studies. Primers were designed with the software Beacon Designer (Premier Biosoft) using a primer length of 20 ± 2 bp, melting temperature of 60 °C ± 2 °C, a guanine-cytosine content of circa 50 % and an expected amplicon size of 180-280 bp. See Table S1 for sequences, amplicon size, and respective references. Real-time qPCR reactions were performed in 96 well clear plates (Bio-Rad, Hercules, CA), using an IQ5 Real Time PCR (Bio-Rad, Hercules, CA) with five biological replicates. The 20 µL reaction mixture was composed of 1 µL cDNA diluted 50-fold, 0.5 µM of each gene-specific primer and 10 µL master mix (SsoFast_EvaGreen Supermix, Bio-Rad, Hercules, CA). Amplification of PCR products was monitored via intercalation of the Eva-Green present in the master mix. The following program was applied: initial polymerase activation, 95 °C, 3 min; then 40 cycles at 94 °C 10 s (denaturation), 60 °C 20 s (annealing), 72 °C 15 s (extension), followed by a melting curve analysis to confirm the accurate amplification of target gene fragments and the absence of primer dimers. The PCR products were run on 2 % agarose gels to verify that there was only one amplicon of the expected size. PCRs with each primer pair were also performed on samples lacking cDNA template, in triplicate (no template controls). To assess amplification efficiency of the candidate genes, identical volumes of cDNA samples were diluted and used to generate five-point standard curves based on a five-fold dilution series (1; 1:5; 1:25; 1:125; 1:625), in triplicate. Amplification efficiency (E) is calculated as E= 10(-1/a)-1, “a” being the slope of the linear regression curve (y = a log(x) + b) fitted over the log-transformed data of the input cDNA dilution (y) plotted against the respective quantification cycle (Cq) values (x). E-values of the target genes were considered comparable when they did not exceed 100 ± 10%, corresponding to a standard curve slope of 3.3 ± 0.33. All cDNA samples were diluted 50-fold and were amplified in duplicate in two independent PCR runs.
To generate a baseline-subtracted plot of the logarithmic increase in fluorescence signal (ΔRn) versus cycle number, baseline data were collected between cycles 5 and 17. All amplification plots were analyzed with an Rn threshold of 0.2 at the beginning of the region of exponential amplification, to obtain Cq (quantification cycle) and the data obtained were exported into a MS Excel workbook (Microsoft Inc., USA) for analysis. Reference genes used were ACT2, TIF, TIF-GTP [73], and ACT1.

4.7. Statistical Analysis

The statistical analysis of the morphometric measurements of the microphotographs and hydraulic conductivity were performed using the statistical package IBM SPSS Statistics v. 22. To study the effect of treatment in the same sampling, Student's t-test (P<0.05) was performed and to analyze the effect of maturation in each year, an ANOVA test was performed followed by Tukey's HSD multiple comparisons test (P<0.05).
For the relationship between the expressions of the selected genes and the reference genes the relative quantity values were transformed into log2 and tested through ANOVA in the software R [74]. When the p-value of the ANOVA was lower than 0.05 a Tukey test was performed, and statistically significant differences were accepted for a p-value lower than 0.05.
GraphPad Prism 10 for Windows (GraphPad Software, San Diego, California, USA) was used for figure creation.

5. Conclusions

This study highlights the role of shading, through canopy architecture manipulation, in modulating berry water relations and influencing the response to stress during fruit development. This role is also influenced by environmental conditions, likely becoming more pronounced in seasons with more stressful events, such as drought, precipitation distribution anomalies, high average temperatures and/or heat waves.
Grape cluster hydraulics is very dynamic in the variety Muscat of Alexandria, changing according to the phenological stages whilst reflecting each year’s conditions for berry growth. Veraison is shown to be a pivotal phenological stage for hydraulic adjustment in grapevine clusters, with reduction in xylem diameter and increase in hydraulic resistance, confirming the shift in water transport into the berry from the xylem to the phloem. Differential expression of several genes coding AQPs confirms this shift in water transport and in regulating xylem hydraulic resistance. In fact, canopy architecture manipulation (MSP) modulates the expression of the different AQP genes in all tissues. Water transport, mediated by AQP, was down-regulated in pedicels at full maturation, while in pulp it was enhanced, especially at veraison and in the shaded treatment. Conversely, the shaded treatment had little influence in AQP expression in berry skins. Stress response was heightened in all berry tissues during the whole season, with an enhancement of the onset of oxidative stress in pea-size berries in the shaded treatment.
Overall, this study highlights that a simple agronomical management, such as canopy manipulation, induces changes in water relations within the berry cluster along berry maturation in the same plant. Shading affects the ripening process with a likely consequence in sugar, amino acid and phenolic compounds accumulation.

Supplementary Materials

The following supporting information can be downloaded at the website of this paper posted on Preprints.org. Figure S1: Monthly temperatures and precipitation during the years of 2019 and 2020; Figure S2: Stomata and Lenticels; Figure S3: Morphometric peduncle measurements and image analysis; Table S1: List of Primers utilized in RT-qPCR.

Author Contributions

Conceptualization, O.Z., C.M.L., S.A. and L.C.C.; Methodology, O.Z., C.P. and L.C.; Histology, image analysis and figures’ preparation, M.V.A. and A.F-R.; Hydraulic conductivity, C.P., O.Z. and T.S-D.; qRT-PCR, L.S. and L.C.C; Data and statistical analysis, O.Z. M.V.A and L.C.C.; writing—original draft preparation, O.Z., M.V.A. and L.C.C.; writing—review and editing, all. All authors have read and agreed to the published version of the manuscript.

Funding

This research was funded by Fundação para a Ciência e Tecnologia (FCT) through the research unit Linking Landscape, Environment, Agriculture, and Food (LEAF), in the scope of the projects UID/AGR/04129/2019; UIDP/04129/2020, LEAF Exploratory Project MicroBerry, and through DL57/2016/CP1382/CT0024 to LC. M.V.A. received a grant from the Regional Mobility Programme of Junta de Extremadura (MOV19A017) for this research, FEDER funds, and GR21196 and AGROS projects. A. F-R. received a grant from the Youth Employment Programme of the Ministry of Science, Innovation and Universities of the Government of Spain (PEJ2018-004265-A) and ESF.

Data Availability Statement

The original contributions presented in the study are included in the article/supplementary material, further inquiries can be directed to the corresponding author/s.

Acknowledgments

Authors acknowledge M. Joao Fernandes for the laboratory technical support and to Cell Biology and Microscopy Laboratory from CICYTEX (Junta de Extremadura) for assistance with histological procedures.

Conflicts of Interest

The authors declare no conflicts of interest.

References

  1. Intergovernmental Panel on Climate Change. Climate change. Synthesis report. 2014. 16 pp.
  2. Wild, M. Decadal changes in radiative fluxes at land and ocean surfaces and their relevance for global warming. Wiley Interdiscip. Rev. Clim. Change 2016, 7, 91–107. [Google Scholar] [CrossRef]
  3. Climate Impacts in Portugal. 2019 www.climateanalytics.org, accessed on the 10th February 2024.
  4. Santos, J.A.; Fraga, H.; Malheiro, A.C.; Moutinho-Pereira, J.; Dinis, L.T.; Correia, C.; Moriondo, M.; Leolini, L.; Dibari, C.; Costafreda-Aumedes, S.; Kartschall, T.; Menz, C.; Molitor, D.; Junk, J.; Beyer, M.; Schultz, H.R. A review of the potential climate change impacts and adaptation options for European viticulture. Appl. Sci. 2020, 10, 3092. [Google Scholar] [CrossRef]
  5. INE 2016. (n.d.).
  6. Silvestre, J.; Damásio, M.; Egipto, R.; Cunha, J.; Brazão, J.; Eiras-Dias, J. Tolerance to sunburn: A variable to consider in the context of climate change. Proceedings of the 21st GiESCO International Meeting, Thessaloniki, Greece 2019, 681–682. [Google Scholar]
  7. Keller, M. The Science of Grapevines: Anatomy and Physiology. 2015 Elsevier Science.
  8. Dry, P. Bunch exposure management. Grape And Wine Research And Development Corporation Report 2009 6 p.
  9. Gambetta, J.M.; Holzapfel, B.P.; Stoll, M.; Friedel, M. Sunburn in Grapes: A Review. Front. Plant Sci. 2021, 11, 604691. [Google Scholar] [CrossRef] [PubMed]
  10. Reynolds, A.G.; Wardle, D.A. Evaluation of minimal pruning upon vine performance and berry composition of Chancellor. Am. J. Enol. Vitic. 2001, 52, 45–48. [Google Scholar] [CrossRef]
  11. Main, G.L.; Morris, J.R. Impact of pruning methods on yield components and juice and wine composition of Cynthiana grapes. Am. J. Enol. Vitic. 2008, 59, 179–187. [Google Scholar] [CrossRef]
  12. Rustioni, L.; Milani, C.; Parisi, S.; Failla, O. Chlorophyll role in berry sunburn symptoms studied in different grape (Vitis vinifera L.) cultivars. Sci. Hortic. 2015, 185, 145–150. [Google Scholar] [CrossRef]
  13. Schultz, H.R.; Matthews, M.A. Xylem development and hydraulic conductance in sun and shade shoots of grapevine (Vitis vinifera L.): evidence that low light uncouples water transport capacity from leaf area. Planta 1993, 190, 393–406. [Google Scholar] [CrossRef]
  14. Tilbrook, J.; Tyerman, S.D. Hydraulic connection of grape berries to the vine: Varietal differences in water conductance into and out of berries, and potential for backflow. Func. Plant Biol. 2009, 36, 541–550. [Google Scholar] [CrossRef]
  15. Bondada, B.R.; Matthews, M.A.; Shackel, K.A. Functional xylem in the post-veraison grape berry. J. Exp. Bot. 2005, 56, 2949–2957. [Google Scholar] [CrossRef]
  16. Keller, M.; Smith, J.P.; Bondada, B.R. Ripening grape berries remain hydraulically connected to the shoot. J. Exp. Bot. 2006, 57, 2577–2587. [Google Scholar] [CrossRef] [PubMed]
  17. Zhang, Y.; Keller, M. Discharge of surplus phloem water may be required for normal grape ripening. J. Exp. Bot. 2017, 68, 585–595. [Google Scholar] [CrossRef] [PubMed]
  18. Knoche, M. Water uptake through the surface of fleshy soft fruit: Barriers, mechanism, factors, and potential role in cracking. In Abiotic Stress Biology in Horticultural Plants 2015 Springer Japan, pp. 147–166. [CrossRef]
  19. Winkler, A.; Peschel, S.; Kohrs, K.; Knoche, M. Rain cracking in sweet cherries is not due to excess water uptake but to localized skin phenomena. J. Am. Soc. Hortic Sci. 2016, 141, 653–660. [Google Scholar] [CrossRef]
  20. Grimm, E.; Hahn, J.; Pflugfelder, D.; Schmidt, M.J.; van Dusschoten, D.; Knoche, M. Localized bursting of mesocarp cells triggers catastrophic fruit cracking. Hortic. Res. 2019, 6, 79. [Google Scholar] [CrossRef] [PubMed]
  21. McElrone, A.J.; Manuck, C.M.; Brodersen, C.R.; Patakas, A.; Pearsall, K.R.; Williams, L.E. Functional hydraulic sectoring in grapevines as evidenced by sap flow, dye infusion, leaf removal and micro-computed tomography. AoB PLANTS 2021, 13, plab003. [Google Scholar] [CrossRef] [PubMed]
  22. Fouquet, R.; Léon, C.; Ollat, N.; Barrieu, F. Identification of grapevine aquaporins and expression analysis in developing berries. Plant Cell Rep. 2008, 27, 1541–1550. [Google Scholar] [CrossRef] [PubMed]
  23. Choat, B.; Gambetta, G.A.; Shackel, K.A.; Matthews, M.A. Vascular function in grape berries across development and its relevance to apparent hydraulic isolation. Plant Physiol. 2009, 151, 1677–1687. [Google Scholar] [CrossRef] [PubMed]
  24. Sabir, F.; Zarrouk, O.; Noronha, H.; Loureiro-Dias, M.C.; Soveral, G.; Gerós, H.; Prista, C. Grapevine aquaporins: Diversity, cellular functions, and ecophysiological perspectives. Biochimie 2021, 188, 61–76. [Google Scholar] [CrossRef] [PubMed]
  25. Voicu, M.C.; Cooke JE, K.; Zwiazek, J.J. Aquaporin gene expression and apoplastic water flow in bur oak (Quercus macrocarpa) leaves in relation to the light response of leaf hydraulic conductance. J. Exp. Bot. 2009, 60, 4063–4075. [Google Scholar] [CrossRef]
  26. Gouthu, S.; Deluc, L.G. Timing of ripening initiation in grape berries and its relationship to seed content and pericarp auxin levels. BMC Plant Biol. 2015, 15, 46. [Google Scholar] [CrossRef]
  27. Hou, X.; Li, H.; Zhang, W.; Yao, Z.; Wang, Y.; Du, T. Water transport in fleshy fruits: Research advances, methodologies, and future directions. Physiol. Plant 2021, 172, 2203–2216. [Google Scholar] [CrossRef] [PubMed]
  28. Loepfe, L.; Martinez-Vilalta, J.; Piñol, J.; Mencuccini, M. The relevance of xylem network structure for plant hydraulic efficiency and safety. J. Theor. Biol. 2007, 247, 788–803. [Google Scholar] [CrossRef] [PubMed]
  29. Chaumont, F.; Tyerman, S.D. Aquaporins: Highly regulated channels controlling plant water relations. Plant Physiol. 2014, 164, 1600–1618. [Google Scholar] [CrossRef] [PubMed]
  30. Tyerman, S.D.; Tilbrook, J.; Pardo, C.; Kotula, L.; Sullivan, W.; Steudle, E. Direct measurement of hydraulic properties in developing berries of Vitis vinifera L. cv Shiraz and Chardonnay. Aust. J. Grape Wine Res. 2004, 10, 170–181. [Google Scholar] [CrossRef]
  31. Greenspan, M.D.; Shackel, K.A.; Matthews, M.A. Developmental changes in the diurnal water budget of the grape berry exposed to water deficits. Plant Cell Environ. 1994, 17, 811–820. [Google Scholar] [CrossRef]
  32. Scharwies, J.D.; Tyerman, S.D. Comparison of isohydric and anisohydric Vitis vinifera L. cultivars reveals a fine balance between hydraulic resistances, driving forces and transpiration in ripening berries. Func. Plant Biol. 2017, 44, 324–338. [Google Scholar] [CrossRef]
  33. Gisbert, C.; Soler, J. X.; Fos, M.; Intrigliolo, D. S.; Yuste, A.; Picó, B.; Torrent, D.; Peiró, R. Characterization of Local Mediterranean Grapevine Varieties for Their Resilience to Semi-Arid Conditions under a Rain-Fed Regime. Agronomy 2022, 12, 2234. [Google Scholar] [CrossRef]
  34. Villalobos-González, L.; Muñoz-Araya, M.; Franck, N.; Pastenes, C. Controversies in Midday Water Potential Regulation and Stomatal Behavior Might Result From the Environment, Genotype, and/or Rootstock: Evidence From Carménère and Syrah Grapevine Varieties. Front. Plant Sci. 2019, 10, 1522. [Google Scholar] [CrossRef]
  35. Gambetta, G.A.; Herrera, J.C.; Dayer, S.; Feng, Q.; Hochberg, U.; Castellarin, S.D. The physiology of drought stress in grapevine: Towards an integrative definition of drought tolerance. J. Exp. Bot. 2020, 71, 4658–4676. [Google Scholar] [CrossRef]
  36. Vandeleur, R.K.; Mayo, G.; Shelden, M.C.; Gilliham, M.; Kaiser, B.N.; Tyerman, S.D. The role of plasma membrane intrinsic protein aquaporins in water transport through roots: diurnal and drought stress responses reveal different strategies between isohydric and anisohydric cultivars of grapevine. Plant Physiol. 2009, 149, 445–460. [Google Scholar] [CrossRef]
  37. Kuhn, N.; Abello, C.; Godoy, F.; Delrot, S.; Arce-Johnson, P. Differential Behavior within a Grapevine Cluster:Decreased Ethylene-Related Gene Expression Dependenton Auxin Transport Is Correlated with Low Abscission of First Developed Berries. PLoS ONE 2014, 9, e111258. [Google Scholar] [CrossRef]
  38. Knipfer, T.; Fei, J.; Gambetta, G.A.; McElrone, A.J.; Shackel, K.A.; Matthews, M.A. Water transport properties of the grape pedicel during fruit development: Insights into xylem anatomy and function using microtomography. Plant Physiol. 2015, 168, 1590–1602. [Google Scholar] [CrossRef]
  39. Keller, M.; Zhang, Y.; Shrestha, P.M.; Biondi, M.; Bondada, B.R. Sugar demand of ripening grape berries leads to recycling of surplus phloem water via the xylem. Plant Cell Environ. 2015, 38, 1048–1059. [Google Scholar] [CrossRef]
  40. Windt, C.W.; Gerkema, E.; van As, H. Most water in the tomato truss is imported through the xylem, not the phloem: A nuclear magnetic resonance flow imaging study. Plant Physiol. 2009, 151, 830–842. [Google Scholar] [CrossRef]
  41. Hanssens, J.; De Swaef, T.; Steppe, K. High light decreases xylem contribution to fruit growth in tomato. Plant Cell Environ. 2015, 38, 487–498. [Google Scholar] [CrossRef]
  42. Simon, J.; Baptiste, C.; Lartaud, M.; Verdeil, J.L.; Brunel, B.; Vercambre, G.; Génard, M.; Cardoso, M.; Alibert, E.; Goze-Bac, C.; Bertin, N. Pedicel anatomy and histology in tomato vary according to genotype and water-deficit environment, affecting fruit mass. Plant Sci. 2022, 321, 111313. [Google Scholar] [CrossRef]
  43. Pace, M.R.; Alcantara, S.; Lohmann, L.G.; Angyalossy, V. Secondary phloem diversity and evolution in Bignonieae (Bignoniaceae). Ann Bot. 2015, 116, 333–358. [Google Scholar] [CrossRef]
  44. Aloni, B.; Wyse, R.E.; Griffith, S. Sucrose Transport and Phloem Unloading in Stem of Vicia.faba: Possible Involvement of a Sucrose Carrier and Osmotic Regulation. Plant Physiol. 1986, 81, 482–486. [Google Scholar] [CrossRef]
  45. Sjolund, R. D. (1997). The Phloem Sieve Element: A River Runs through It. Plant Cell 1997, 9, 1137–1146. [Google Scholar] [CrossRef]
  46. Van Bel AJ, E. The phloem, a miracle of ingenuity. Plant Cell Environ. 2003, 26, 125–149. [Google Scholar] [CrossRef]
  47. Sabir, F.; Leandro, M.J.; Martins, A.P.; Loureiro-Dias, M.C.; Moura, T.F.; Soveral, G.; Prista, C. Exploring three PIPs and three TIPs of grapevine for transport of water and atypical substrates through heterologous expression in aqy-null yeast. PLoS ONE 2014, 9, e102087. [Google Scholar] [CrossRef] [PubMed]
  48. Shelden, M.C.; Howitt, S.M.; Kaiser, B.N.; Tyerman, S.D. Identification and functional characterisation of aquaporins in the grapevine, Vitis vinifera. Func. Plant Biol. 2009, 36, 1065–1078. [Google Scholar] [CrossRef] [PubMed]
  49. Noronha, H.; Conde, C.; Delrot, S.; Gerós, H. Identification and functional characterization of grapevine transporters that mediate glucose-6-phosphate uptake into plastids. Planta 2015, 242, 909–920. [Google Scholar] [CrossRef] [PubMed]
  50. Krasnow, M.; Weis, N.; Smith, R. J.; Benz, M. J.; Mathews, M.; Shackel, K. Inception, progression, and compositional consequences of a berry shrivel disorder. Am. J. Enol. Vitic. 2009, 60, 24–34. [Google Scholar] [CrossRef]
  51. Pilati, S.; Perazzolli, M.; Malossini, A.; Cestaro, A.; Demattè, L.; Fontana, P.; Dal Ri, A.; Viola, R.; Velasco, R.; Moser, C. Genome-wide transcriptional analysis of grapevine berry ripening reveals a set of genes similarly modulated during three seasons and the occurrence of an oxidative burst at vèraison. BMC Genomics 2007, 8, 428. [Google Scholar] [CrossRef]
  52. Da Silva, F.G.; Iandolino, A.; Al-Kayal, F.; Bohlmann, M.C.; Cushman, M.A.; Lim, H.; Ergul, A.; Figueroa, R.; Kabuloglu, E.K.; Osborne, C.; Rowe, J.; Tattersall, E.; Leslie, A.; Xu, J.; Baek, J.M.; Cramer, G.R.; Cushman, J.C.; Cook, D.R. Characterizing the grape transcriptome. Analysis of expressed sequence tags from multiple vitis species and development of a compendium of gene expression during berry development. Plant Physiol. 2005, 139, 574–597. [Google Scholar] [CrossRef] [PubMed]
  53. Fernandes, J.C.; Cobb, F.; Tracana, S.; Costa, G.J.; Valente, I.; Goulao, L.F.; Amâncio, S. Relating Water Deficiency to Berry Texture, Skin Cell Wall Composition, and Expression of Remodeling Genes in Two Vitis vinifera L. Varieties. J. Agric. Food Chem. 2015, 63, 3951–3961. [Google Scholar] [CrossRef] [PubMed]
  54. Castellarin, S.D.; Gambetta, G.A.; Wada, H.; Krasnow, M.N.; Cramer, G.R.; Peterlunger, E.; Shackel, K.A.; Matthews, M.A. Characterization of major ripening events during softening in grape: Turgor, sugar accumulation, abscisic acid metabolism, colour development, and their relationship with growth. J. Exp. Bot 2016, 67, 709–722. [Google Scholar] [CrossRef] [PubMed]
  55. Keunen, E.; Peshev, D.; Vangronsveld, J.; Van Den Ende, W.; Cuypers, A. Plant sugars are crucial players in the oxidative challenge during abiotic stress: Extending the traditional concept. Plant Cell Environ. 2013, 36, 1242–1255. [Google Scholar] [CrossRef]
  56. Xiao, Z.; Rogiers, S.Y.; Sadras, V.O.; Tyerman, S.D. Hypoxia in grape berries: The role of seed respiration and lenticels on the berry pedicel and the possible link to cell death. J. Exp. Bot. 2018, 69, 2071–2083. [Google Scholar] [CrossRef]
  57. Carvalho, L.C.; Coito, J.L.; Colaço, S.; Sangiogo, M.; Amâncio, S. Heat stress in grapevine: The pros and cons of acclimation. Plant Cell Environ. 2015, 38, 777–789. [Google Scholar] [CrossRef] [PubMed]
  58. Rocheta, M.; Becker, J.D.; Coito, J.L.; Carvalho, L.; Amâncio, S. Heat and water stress induce unique transcriptional signatures of heat-shock proteins and transcription factors in grapevine. Funct. Integr. Genomics 2014, 14, 135–148. [Google Scholar] [CrossRef] [PubMed]
  59. Wu, J.; Gao, T.; Hu, J.; Zhao, L.; Yu, C.; Ma, F. Research advances in function and regulation mechanisms of plant small heat shock proteins (sHSPs) under environmental stresses. Sci. Total Env. 2022, 825, 154054. [Google Scholar] [CrossRef] [PubMed]
  60. Tan, J.W.; Shinde, H.; Tesfamicael, K.; Hu, Y.; Fruzangohar, M.; Tricker, P.; Baumann, U.; Edwards, E.J.; Rodríguez López, C.M. Global transcriptome and gene co-expression network analyses reveal regulatory and non-additive effects of drought and heat stress in grapevine. Front. Plant Sci, 2023, 14, 1096225. [Google Scholar] [CrossRef] [PubMed]
  61. Upadhyay, R.K.; Tucker, M.L.; Mattoo, A.K. Ethylene and RIPENING INHIBITOR Modulate Expression of SlHSP17.7A, B Class I Small Heat Shock Protein Genes During Tomato Fruit Ripening. Front. Plant Sci 2020, 11, 975. [Google Scholar] [CrossRef] [PubMed]
  62. Ji, X.R.; Yu, Y.H.; Ni, P.Y.; Zhang, G.H.; Guo, D.L. Genome-wide identification of small heat-shock protein (HSP20) gene family in grape and expression profile during berry development. BMC Plant Biol. 2019, 19, 433. [Google Scholar] [CrossRef] [PubMed]
  63. Shafqat, W.; Jaskani, M.J.; Maqbool, R.; Chattha, W.S.; Ali, Z.; Naqvi, S.A.; Haider, M.S.; Khan, I.A.; Vincent, C.I. Heat shock protein and aquaporin expression enhance water conserving behavior of citrus under water deficits and high temperature conditions. Environ. Exp. Bot. 2021, 181, 104270. [Google Scholar] [CrossRef]
  64. Guo, D.L.; Wang, Z.G.; Pei, M.S.; Guo, L.L.; Yu, Y.H. Transcriptome analysis reveals mechanism of early ripening in Kyoho grape with hydrogen peroxide treatment. BMC Genomics 2020, 21, 784. [Google Scholar] [CrossRef] [PubMed]
  65. Keller, M.; Romero, P.; Gohil, H.; Smithyman, R.P.; Riley, W.R.; Casassa, L.F.; Harbertson, J.F. Deficit irrigation alters grapevine growth, physiology, and fruit microclimate. Am. J. Enol. Vitic. 2016, 67, 426–435. [Google Scholar] [CrossRef]
  66. Xiangyi, L.; Lei, H.; An, X.; Keji, Y.; Meng, N.; Duan, C. Q.; Pan, Q. H. VVIWRKY40, a WRKY transcription factor, regulates glycosylated monoterpenoid production by VviGT14 in grape berry. Genes 2020, 11, 485. [Google Scholar] [CrossRef]
  67. Teixeira, G.; Monteiro, A.; Santos, C.; Lopes, C.M. Leaf morphoanatomy traits in white grapevine cultivars with distinct geographical origin. Cienc. e Tec. Vitivinic. 2018, 33, 90–101. [Google Scholar] [CrossRef]
  68. Thorntwaite, C.W. An Approach Toward a Rational Classification of Climate. The Geographical Review, 1948, 38, 55–94. [Google Scholar] [CrossRef]
  69. Ruzin, S. E. Plant microtechnique and microscopy; Oxford University Press, 1999. [Google Scholar]
  70. Piermattei, A.; Crivellaro, A.; Carrer, M.; Urbinati, C. The “blue ring”: anatomy and formation hypothesis of a new tree-ring anomaly in conifers. Trees 2015, 29, 613–620. [Google Scholar] [CrossRef]
  71. Scholz, F.G.; Bucci, S.J.; Meinzer, F.C.; Goldstein, G. Maintenance of Root Function in Tropical Woody Species During Droughts: Hydraulic Redistribution, Refilling of Embolized Vessels, and Facilitation Between Plants. In G. Goldstein, L. Santiago (Eds.), Tropical Tree Physiology: Vol. 6, Tree Physiology, Springer, 2016, pp. 227–241. [CrossRef]
  72. Sperry, J.S.; Donnelly, J.R.; Tyree, M.T. A method for measuring hydraulic conductivity and embolism in xylem. Plant Cell Environ. 1988, 11, 35–40. [Google Scholar] [CrossRef]
  73. Coito, J.L.; Rocheta, M.; Carvalho, L.; Amâncio, S. Microarray-based uncovering reference genes for quantitative real time PCR in grapevine under abiotic stress. BMC Res. Notes 2012, 5, 220. [Google Scholar] [CrossRef]
  74. R Core Team. RStudio: Integrated Development for R; PBC: Boston, MA, USA, 2020; Available online: http://www.rstudio.com/ (accessed on 1 March 2021).
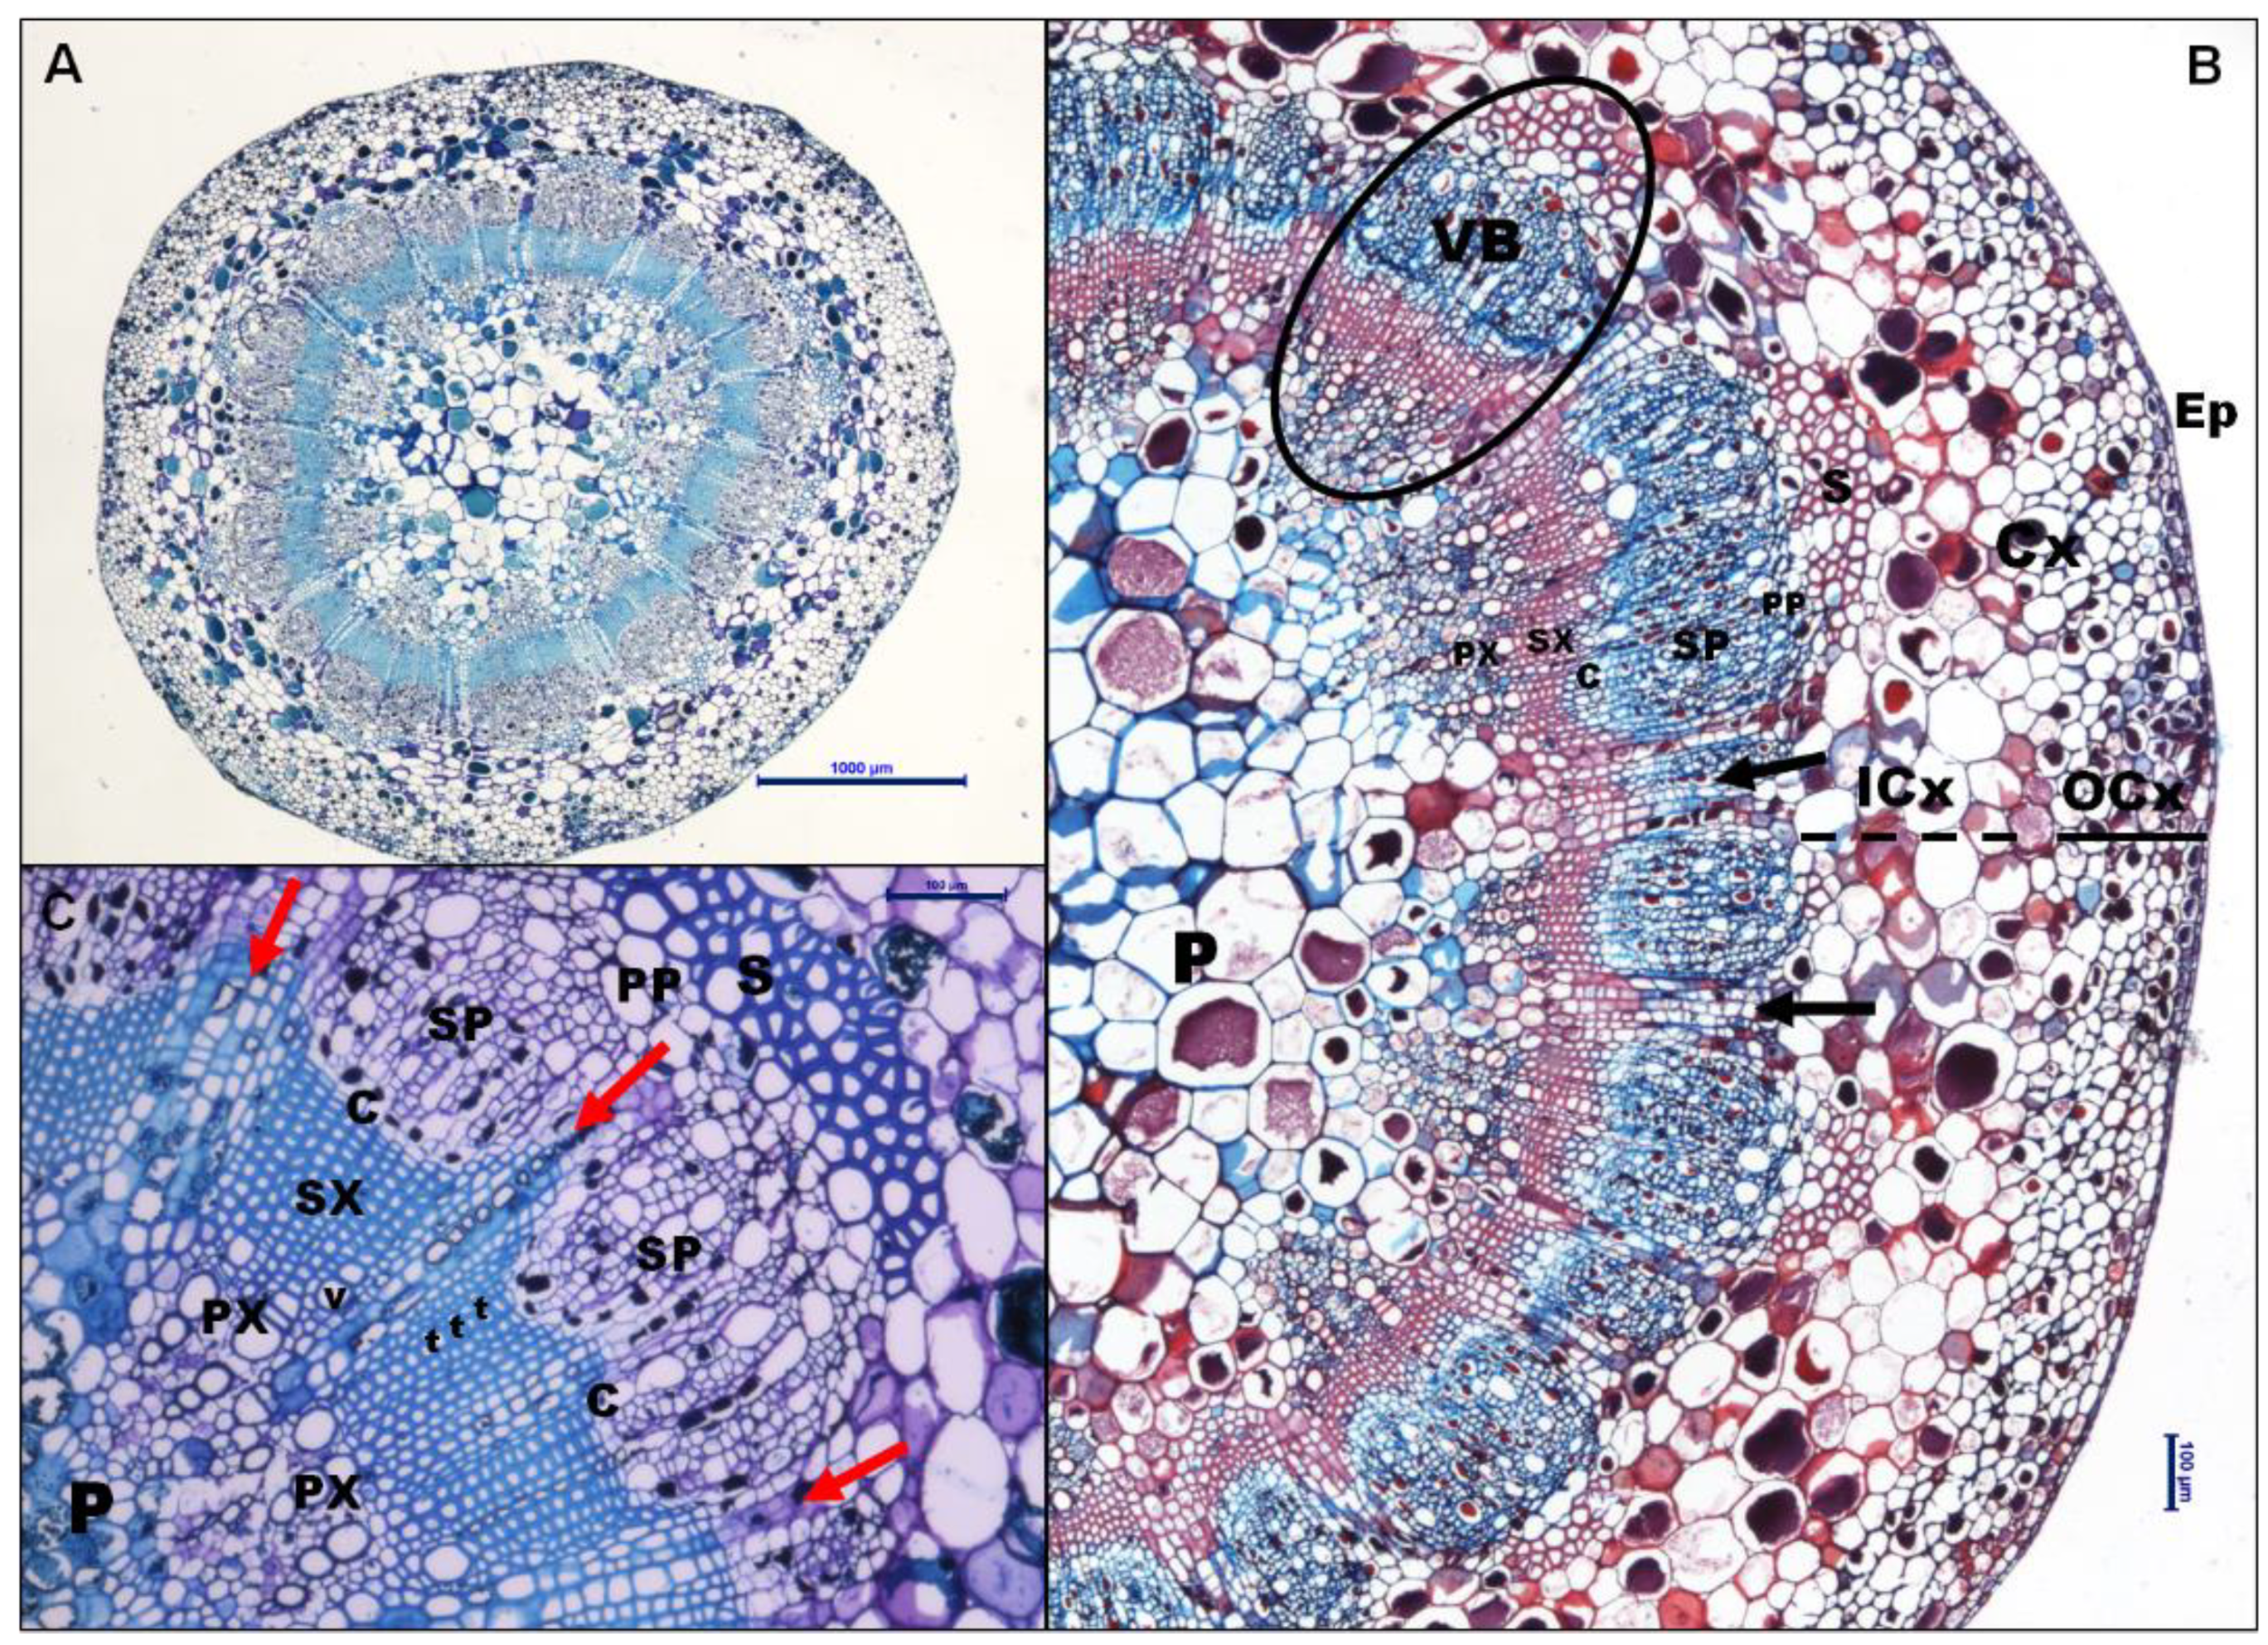
Figure 1. Anatomy of peduncle. A) Complete cross section of FM in VSP from 2019, stained with Toluidine Blue. Scale bar: 1000 μm. B) Cross section of PS in MSP from 2020 stained with Safranin and Astra Blue. Both lignified secondary xylem cells and sclerenchyma cells turn reddish with safranin. Scale bar: 100 μm C) Details of a vascular bundle of VER in MSP from 2020 stained with Toluidine Blue. Scale bar: 100 μm. Arrows indicate radiomedullary parenchyma rays. Abbreviations: C: cambium; Cx: cortex; OCx and ICx indicate outer and inner layer of cortex parenchyma. Ep: epidermis; P: pith; PP: primary phloem; PX: primary xylem; S: sclerenchyma; SP: secondary phloem; SX: secondary xylem; t: tracheid; v: vessel; VB: vascular bundle. .
Preprints 105953 g001
Figure 2. Details of vascular tissue areas at FM stained with Safranin and Astra Blue. In 2019, a significant decrease in xylem and phloem areas in MSP (B) when compared to VSP (A). In 2020, xylem area is increased in MSP (C) versus VSP (D). Scale bars: 100 μm.
Preprints 105953 g002
Figure 3. Specific hydraulic conductivity Kh (Kg s-1 MPa-1 m-1 Berry-1) in cluster (rachis+pedicel) and in rachis (normalized to cluster length and berry number) at five phenological stages (pea size (PS), beginning of veraison (VERi), end of veraison (VERf), mid-ripening (MR), full maturation (FM)) of Muscat of Alexandria variety conducted in VSP and MSP in 2019 (A and B) and 2020 (C and D) seasons. Data are means ± SE (n=5).
Preprints 105953 g003
Figure 4. Pedicel conductivity contribution to the total cluster (rachis+pedicel) hydraulic conductivity (%) at five phenological stages (pea size (PS), beginning of veraison (VERi), end of veraison (VERf), mid-ripening (MR), full maturation (FM)) of Muscat of Alexandria variety trained in VSP and MSP during 2019 and 2020 seasons. Data are means ± SE (n=4). Comparison between treatments at the same sampling time were performed by Student's t-test (*: P<0.05; **: P<0.01; ***: P<0.001).
Preprints 105953 g004
Figure 5. PIPs, TIPs, SIP and NIPs aquaporin gene expression (log2(fold change)) along the grape maturation stages (pea size (PS), veraison (VER) and full maturation both at east (FMeast) and west side (FMwest)) in pedicel, pulp, and skin of Muscat of Alexandria variety. Relative values for the treatments MSP are expressed in comparison to VSP. White boxes correspond to not detected gene expression.
Preprints 105953 g005
Figure 6. Stress related genes VviAPX1, VviCOX6B, VviHSP20; VviHSP22, VviHSP23.6, VviP450, VviRINGU, VviUG1P, VviWRKY40 gene expression (log2(fold change)) along the grape maturation stages (pea size (PS), veraison (VER) and full maturation both at east (FMeast) and west side (FMwest)) in pedicel, pulp, and skin of Muscat of Alexandria variety. Relative values for the treatments MSP are expressed in comparison to VSP.
Preprints 105953 g006
Table 1. Morpho-anatomical parameters and quantitative characteristics of vascular tissue of Muscat of Alexandria peduncle at three developmental stages during the 2019 season under different shoot positioning treatments (VSP and MSP) at three different phenological stages (pea size, veraison and full maturation). Data are means ± SE (n=4).
2019 Season
Parameters Pea size Veraison Full Maturation
VSP MSP Sig. VSP MSP Sig. VSP MSP Sig.
Peduncle section area (mm2) 12.71±0.55 12.86±0.41 ns 11.49±0.55 12.46±0.47 ns 12.25±0.50 11.57±0.43 ns
Cortex area (mm2) 7.20±0.26 7.18±0.23 ns 6.55±0.27 7.11±0.25 ns 6.94±0.25 6.64±0.23 ns
Vascular cylinder area (mm2) 5.51±0.31 5.68±0.21 B ns 4.94±0.29 5.34±0.22 AB ns 5.32±0.26 4.93±0.21 A ns
Xylem area (mm2) 1.54±0.09 ab 1.43±0.11 ns 1.28±0.07 a 1.44±0.12 ns 1.61±0.07 b 1.11±0.09 *
Phloem area (mm2) 1.66±0.08 1.84±0.12 B ns 1.47±0.08 1.50±0.07 A ns 1.52±0.06 1.32±0.07 A *
Pith area (mm2) 2.32±0.16 2.41±0.05 ns 2.20±0.17 2.40±0.17 ns 2.19±0.16 2.51±0.06 ns
Ratio Phloem/Xylem 1.10±0.03 b 1.31±0.03 B *** 1.15±0.02 b 1.11±0.04 A ns 0.97±0.04 a 1.24±0.03 B ***
Vascular bundles (nº) 24.35±0.92 24.75±0.85 A ns 24.05±0.95 27.95±0.83 B * 23.45±0.71 24.80±0.60 A ns
Primary xylem vessels
Area (µm2) 247.23±18.96 b 309.69±25.69 B * 158.33±7.90 a 244.26±15.76 A *** 215.87±11.43 b 198.41±10.11 A ns
Perimeter (µm) 53.94±2.19 b 59.79±2.50 B ns 43.22±1.13 a 53.85±1.79 AB *** 50.75±1.42 b 48.36±1.31 A ns
Diameter (µm) 17.17±0.70 b 19.03±0.80 B ns 13.76±0.36 a 17.14±0.57 AB *** 16.15±0.45 a 15.39±0.42 A ns
Secondary xylem vessels
Area (µm2) 527.44±91.52 b 432.35±102.06 A ns 175.83±14.80 a 175.30±28.83 A ns 216.91±30.84 a 841.67±217.17 B ***
Perimeter (µm) 76.96±6.56 b 67.04±7.59 AB ns 46.22±2.18 a 44.03±3.80 A ns 50.65±3.21 a 94.13±13.63 B ***
Diameter (µm) 24.50±2.09 b 21.34±2.41 AB ns 14.71±0.69 a 14.01±1.21 A ns 16.12±1.02 a 29.96±4.34 B ***
% Phenolic compounds in Phloem 22.40±2.48 22.32±1.78 ns 19.23±1.11 21.01±2.21 ns 16.83±1.87 15.39±2.31 ns
Different letters in the same row indicate significant differences between sampling times for VSP (lower-case) or MSP (upper-case) (ANOVA and Tukey’s HSD. P<0.05). Comparison between treatments at the same sampling time were performed by Student's t-test (*: P<0.05; **: P<0.01; ***: P<0.001. ns: No significant).
Table 2. Morpho-anatomical parameters and quantitative characteristics of vascular tissue of Muscat of Alexandria peduncle at three developmental stages during the 2020 season under different shoot positioning treatments (VSP and MSP) at three different phenological stages (pea size, veraison and full maturation). Values are Means ± Standard Error.
2020 Season
Parameters Pea size Veraison Full Maturation
VSP MSP Sig. VSP MSP Sig. VSP MSP Sig.
Peduncle section area (mm2) 15.17±0.80 b 14.51±0.95 B ns 11.80±0.67 a 11.39±0.90 A ns 13.41±1.00 ab 13.00±0.64 AB ns
Cortex area (mm2) 8.74±0.47 b 7.95±0.60 ns 6.709±0.44 a 6.76±0.72 ns 7.59±0.57 ab 7.44±0.42 ns
Vascular cylinder area (mm2) 6.44±0.34 b 6.56±0.45 B ns 5.01±0.24 a 4.64±0.21 A ns 5.81±0.43 ab 5.57±0.23 AB ns
Xylem area (mm2) 1.55±0.09 b 1.78±0.22 ns 1.23±0.02 a 1.36±0.09 ns 1.18±0.10 a 1.81±0.10 ***
Phloem area (mm2) 1.75±0.12 1.98±0.17 B ns 1.43±0.08 1.35±0.06 A ns 1.48±0.13 1.69±0.07 AB ns
Pith area (mm2) 3.14±0.21 b 2.80±0.16 B ns 2.35±0.16 a 1.93±0.13 A * 3.15±0.27 b 2.07±0.07 A ***
Ratio Phloem/Xylem 1.13±0.02 a 1.20±0.06 B ns 1.16±0.06 ab 1.05±0.06 AB ns 1.27±0.04 b 0.95±0.02 A ***
Vascular bundles (nº) 24.65±0.36 25.30±1.04 B ns 22.87±0.56 22.10±0.54 A ns 24.40±0.91 22.90±0.68 AB ns
Primary xylem vessels
Area (µm2) 286.26±22.67 b 289.94±17.31 B ns 242.76±16.79 ab 212.40±16.17 A ns 204.65±12.50 a 224.80±12.94 A ns
Perimeter (µm) 55.86±2.34 b 58.41±1.88 B ns 52.51±1.85 ab 48.94±2.07 A ns 48.71±1.50 a 51.08±1.48 A ns
Diameter (µm) 17.78±0.75 b 18.59±0.60 B ns 16.71±0.59 ab 15.58±0.66 A ns 15.50±0.48 a 16.26±0.47 A ns
Secondary xylem vessels
Area (µm2) 380.26±44.62 602.15±100.28 B * 236.45±24.50 223.15±31.26 A ns 423.28±50.10 198.12±12.72 A *
Perimeter (µm) 66.16±4.82 ab 86.87±8.30 B ns 53.11±2.78 a 50.54±3.54 A ns 82.31±6.59 b 48.72±1.66 A *
Diameter (µm) 22.01±1.54 ab 27.65±2.64 B ** 16.91±0.89 a 16.09±1.13 A ns 26.20±2.10 b 15.51±0.53 A **
% Phenolic compounds in Phloem 20.58±2.42 18.84±3.53 ns 14.06±1.31 13.77±1.17 ns 18.23±1.02 14.61±1.52 ns
Different letters in the same row indicate significant differences between sampling times for VSP (lower-case) or MSP (upper-case) (ANOVA and Tukey’s HSD. P<0.05). Comparison between treatments at the same sampling time were performed by Student's t-test (*: P<0.05; **: P<0.01; ***: P<0.001. ns: No significant).
Disclaimer/Publisher’s Note: The statements, opinions and data contained in all publications are solely those of the individual author(s) and contributor(s) and not of MDPI and/or the editor(s). MDPI and/or the editor(s) disclaim responsibility for any injury to people or property resulting from any ideas, methods, instructions or products referred to in the content.
Copyright: This open access article is published under a Creative Commons CC BY 4.0 license, which permit the free download, distribution, and reuse, provided that the author and preprint are cited in any reuse.
Prerpints.org logo

Preprints.org is a free preprint server supported by MDPI in Basel, Switzerland.

Subscribe

© 2024 MDPI (Basel, Switzerland) unless otherwise stated