1. Introduction
The mathematical model of GNSS navigation and positioning includes two components. The first is the functional model which describes the mathematical relationship between GNSS observations and the estimated parameters. The other is the stochastic model which describes the statistical properties of observations and is presented as variance-covariance (VC) matrix. The diagonal part of VC matrix is mainly related to the standard deviation of observation noise, which is the focus of data quality control.
In the past, there are a lot of studies related to data quality control. Most of them focused on weighting schemes (Amiri-Simkooei and Tiberius, 2007, Gao et al., 2011, Farzaneh et al., 2020, Kamal et al., 2023), some use elevation-dependent ones, such as (Li el al, 2016) or , some considers the signal-to-noise ratio (SNR) (Talbot, 1988), the others take into more complicated factors, for example different types of receivers & antennas and different environmental conditions (Tiberius and Kenselaar, 1999, Tiberius and Kenselaar, 2000). Almost all these studies are based on PPP techniques (Li and Geng, 2019, Li et al., 2022, Parvazi et al., 2020, Satirapod and Luansang, 2008). These studies typically only evaluate code observation noise (Amiri-Simkooei and Tiberius, 2007, Gao et al., 2011, Farzaneh et al., 2020), and do not separately address the code type for each frequency band due to ionospheric delay. Another limitation is the reliance on limited experimental data, often characterized by brief durations and a small number of stations (Wang et al., 1998; Wang et al., 2002). Though some research has been conducted on double-differenced baseline observations over extended periods, the applicability of these findings to practical applications is questionable, as they are based on zero-baselines (Zhang et al., 2002).
To accurately assess the observation noise for both code and phase across each frequency band, the use of ultra-short baselines, no more than 100 meters in length, is ideal. This approach allows for the relative position to be estimated with a precision of submillimeter, effectively nullifying atmospheric delay.
This research undertakes a comprehensive observation noise assessment for both code and phase observations across each frequency band, utilizing ultra-short baselines formed with IGS stations over an extensive 82-day period. Initially, the study explores and analyze the relationships between observation noise, elevation angle and signal-to-noise ratio. Subsequently, it evaluates the standard deviations of observation noise at various elevation angles for both code and phase observations across each frequency band. The findings are then compared to popularly used elevation-dependent weighting schemes. Finally, the conclusions are drawn.
2. Experimental Design
To minimize the impact atmospheric delays, particularly those caused by the ionosphere, the experimental observations utilized in this study are from ultra-short baselines formed with stations from the International GNSS Service (IGS) network. These baselines are typically no more than 100 meters. The observation period spanned from January 1 to March 20, 2024, lasting a total of 82 days, with data collected at 30-second interval.
Table 1 lists the selected baselines with detailed information.
Table 2 list the main settings for data processing. First, for each epoch, double-difference equations are established as follows:
where
is the vector of coordinate parameter and
is the vector of ambiguity parameter;
and
correspond to their respective coefficient matrices;
is the design vector. An elevation-dependent weight scheme of
is used.
Then, integer ambiguity vector is resolved through search based on the float ambiguity resolution and is then incorporated into Equation (1) as follows:
In the third step, the daily coordinate parameter vector can be estimated using a full day observations:
where
is the total number of epochs per day, which typically amounts to 2880.
Finally, the previously estimated
is assumed to be true value and is substituted into Equation (2):
where
is considered the true error of the double-differenced observation. And its standard deviations, denoted as
for code and carrier phase observations of each frequency band will be computed. The standard deviation of zero-differenced observations is then determined by:
is regarded as the standard deviation of observation noise.
3. Numerical Results
This section will present all the numerical results of GPS, Galileo and BeiDou, including both code and carrier phase across each frequency band.
3.1. Elevation vs SNR
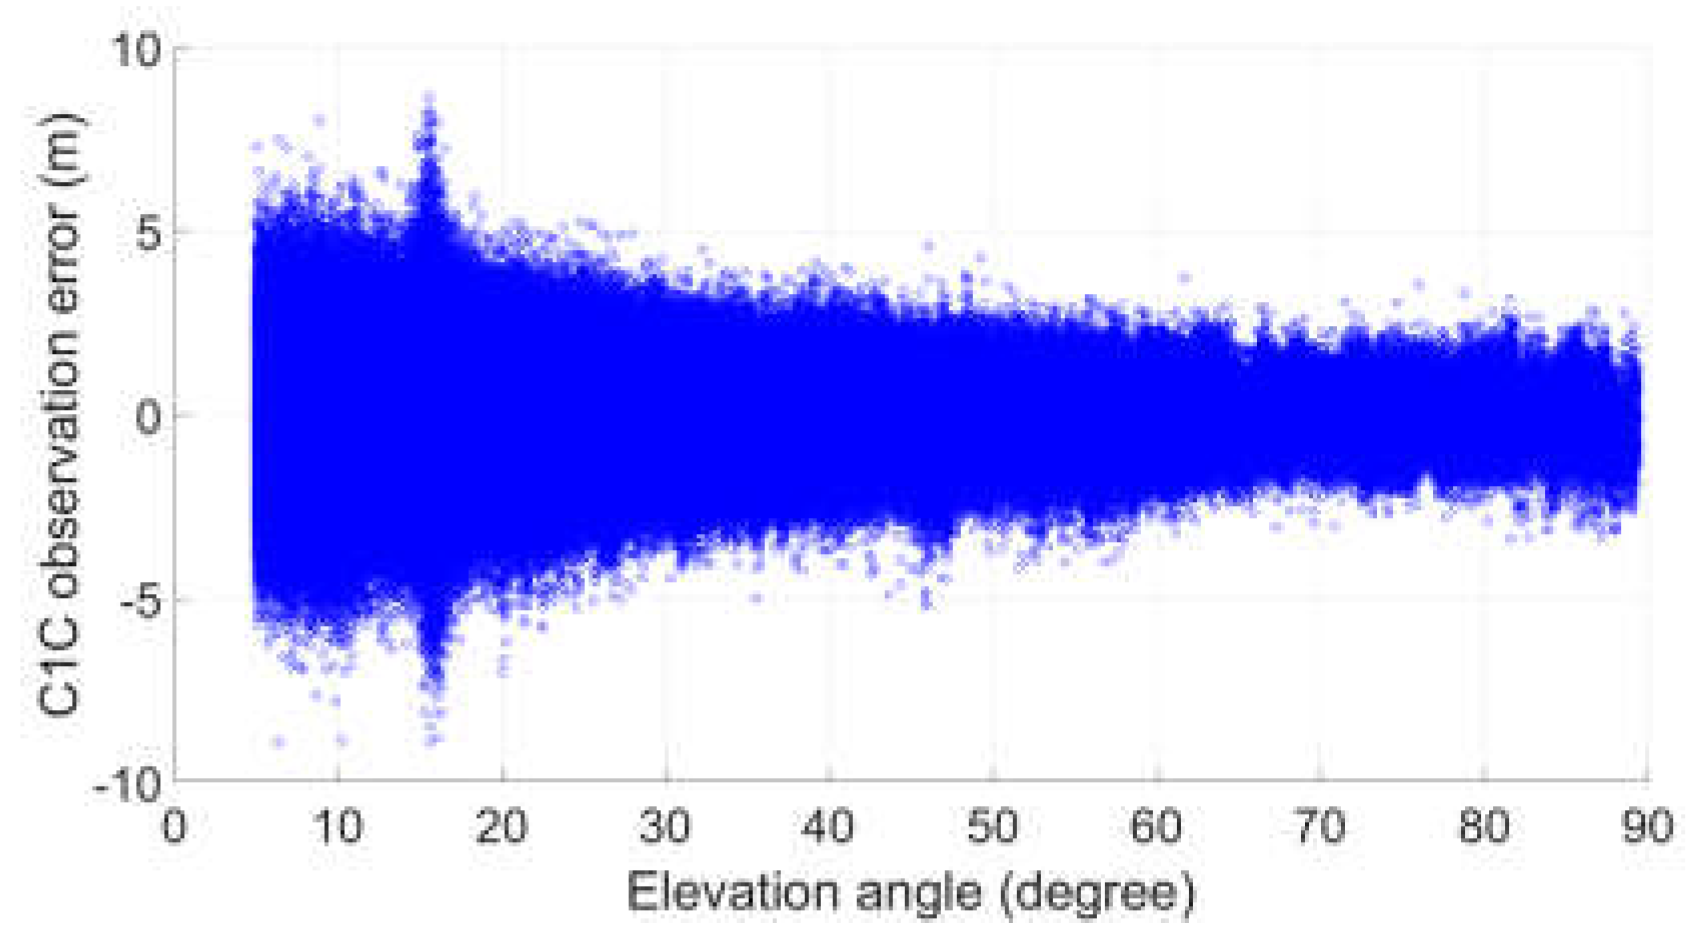
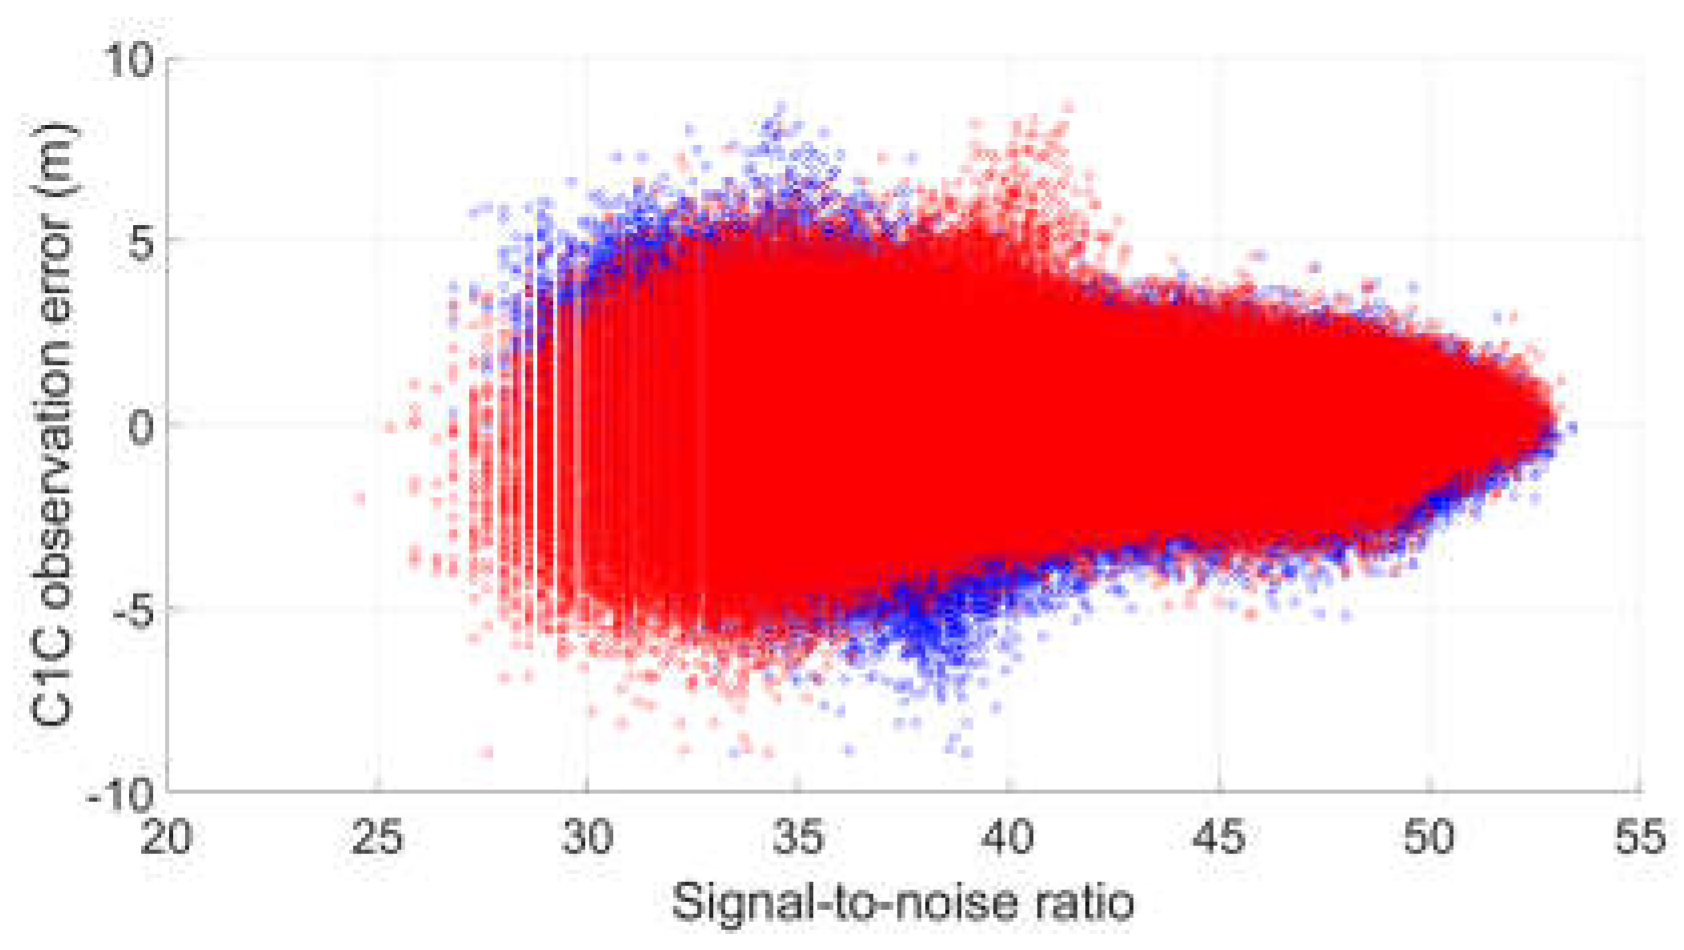
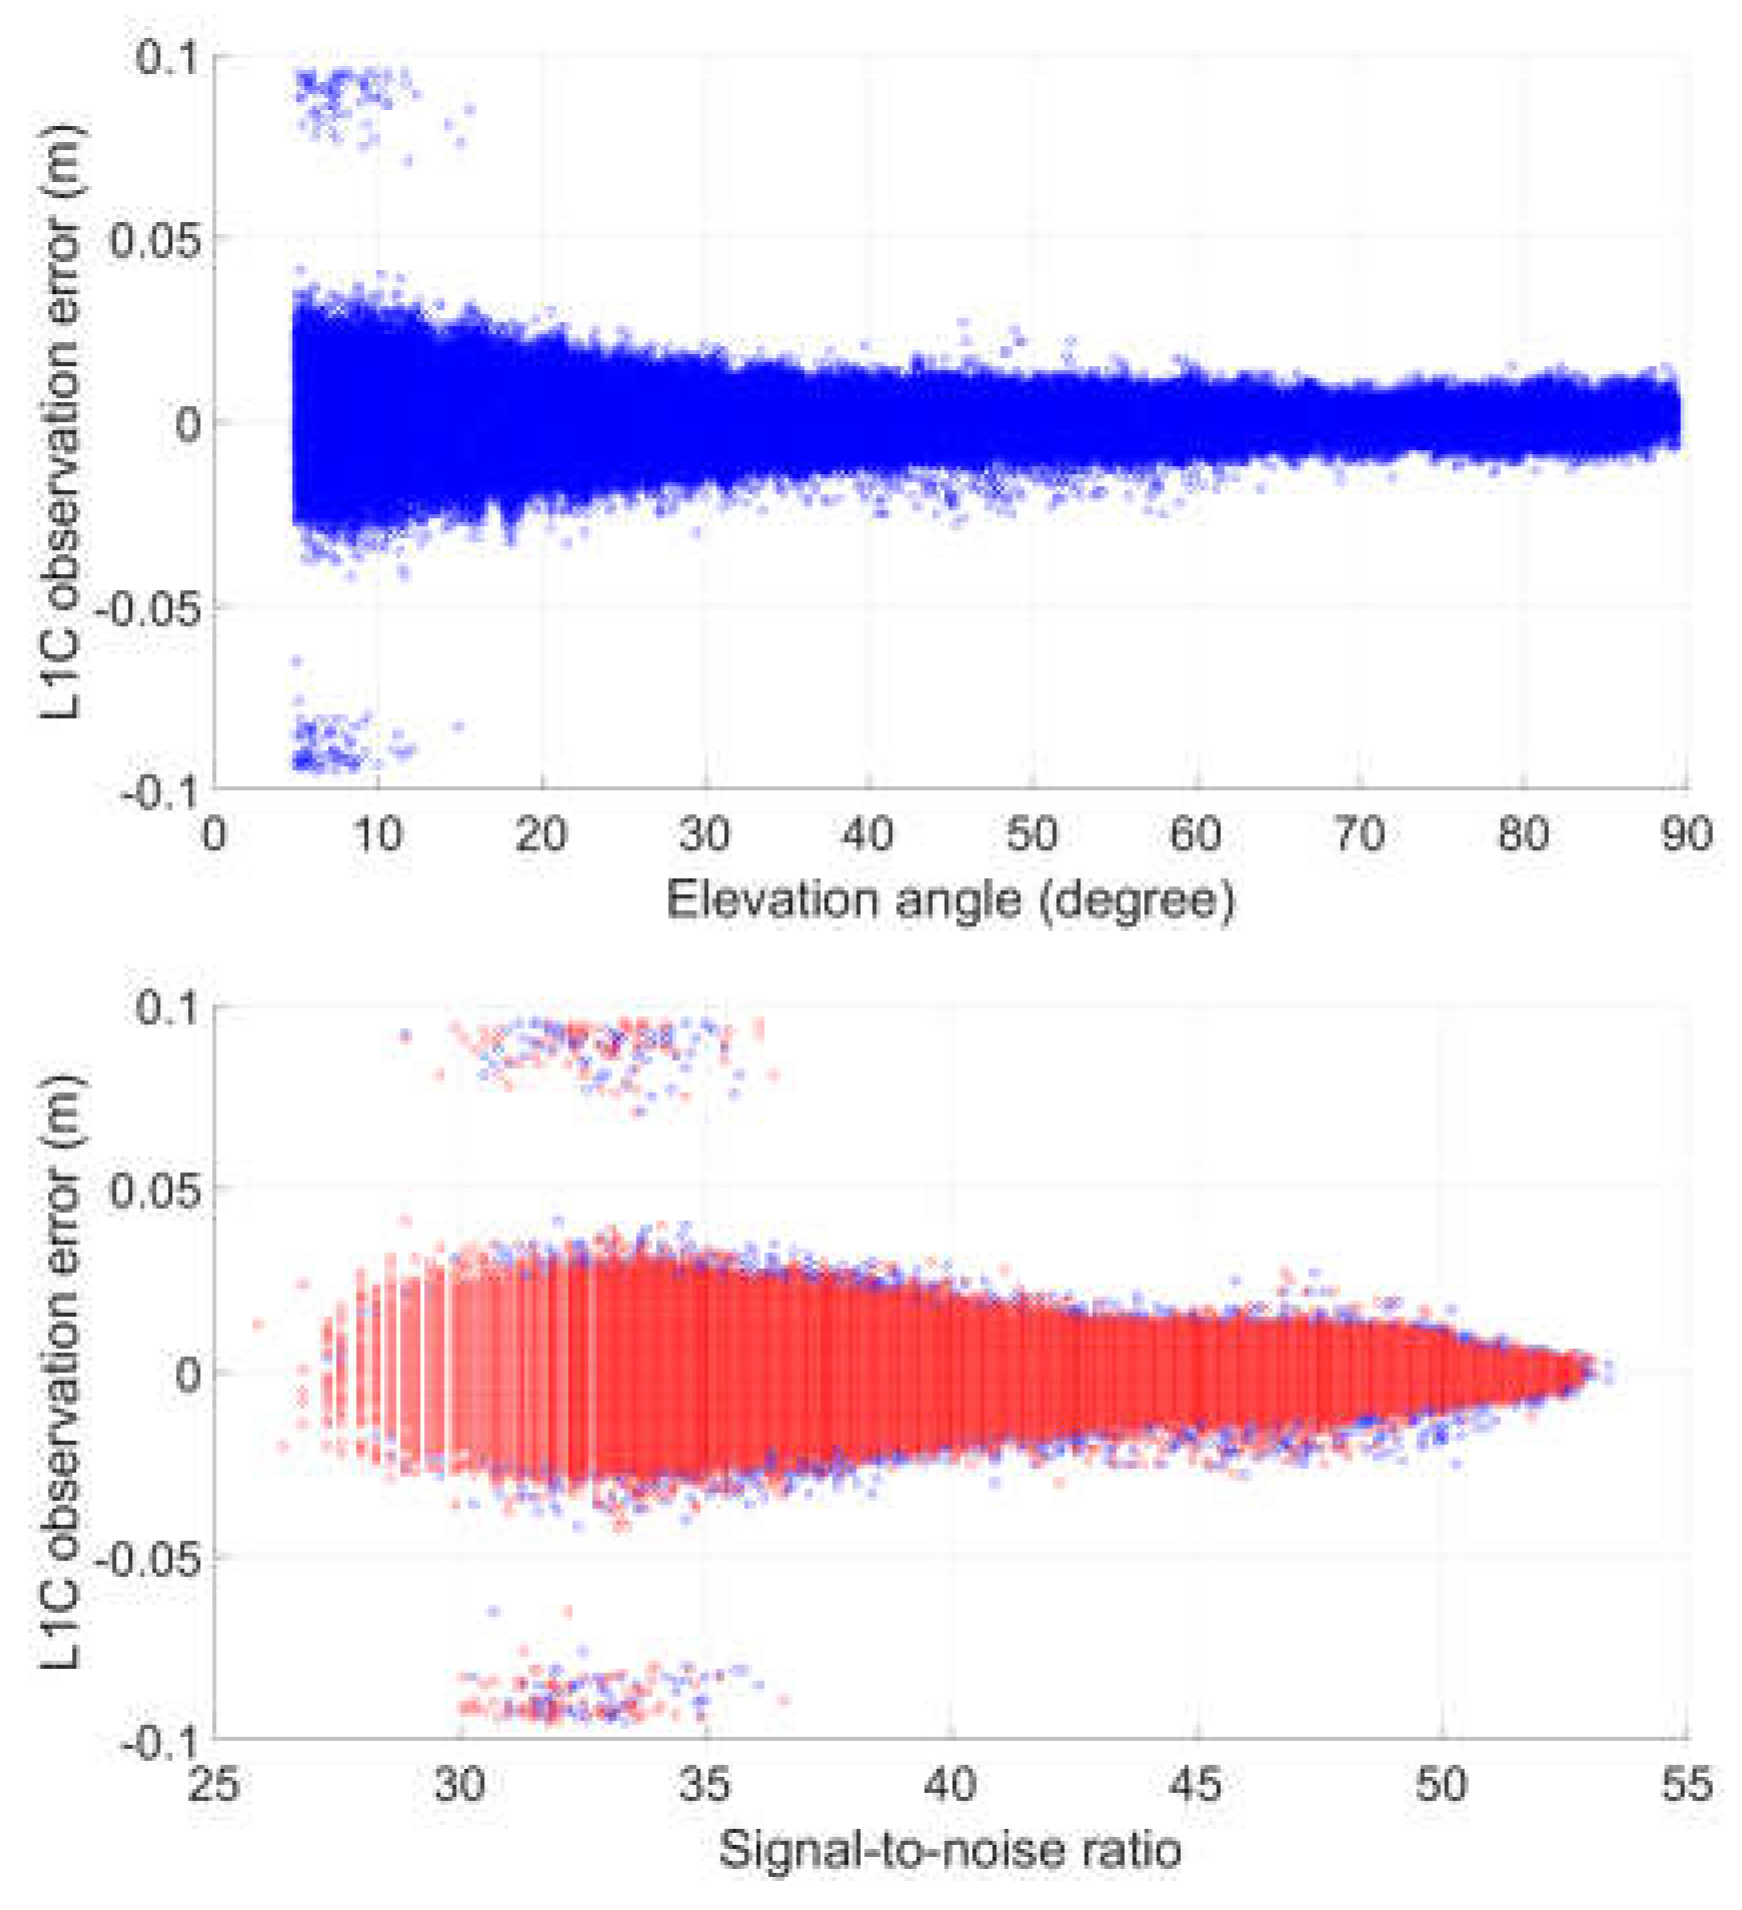
First, the relationship between elevation and observation noise is illustrated with two examples as well as the relationship between SNR and observation noise.
Figure 1 and
Figure 2 are two examples showing the relationships, one is C1C and the other is L1C. It is evident from these examples that both relationships are obvious. Specifically, as the elevation angle or SNR decrease, the STD of the observation error incrementally rises. However, the correlation between elevation and observation noise demonstrates a more consistent or stable pattern. Consequently, employing an elevation-dependent weighting scheme is deemed more suitable for practical applications.
3.2. Code Observation Noise
In this section, we present the detailed numerical results for code observation noise, broken down by each GNSS system and individual frequency bands. A STD is computed for various elevation ranges, specifically: 5°-10°, 10°-15°, 15°-20°, 25°-30°, 35°-40°, 45°-50°, 55°-60°, 60°-65°, 65°-70°, 70°-75°, 75°-80°, 80°-85° and 85°-90°. Additionally, we examine how the relationship between elevation and observation noise compares to the one derived from the commonly utilized elevation-dependent weighting scheme or with a STD of 0.3 m.
3.2.1. GPS
3.2.1.1. C1C
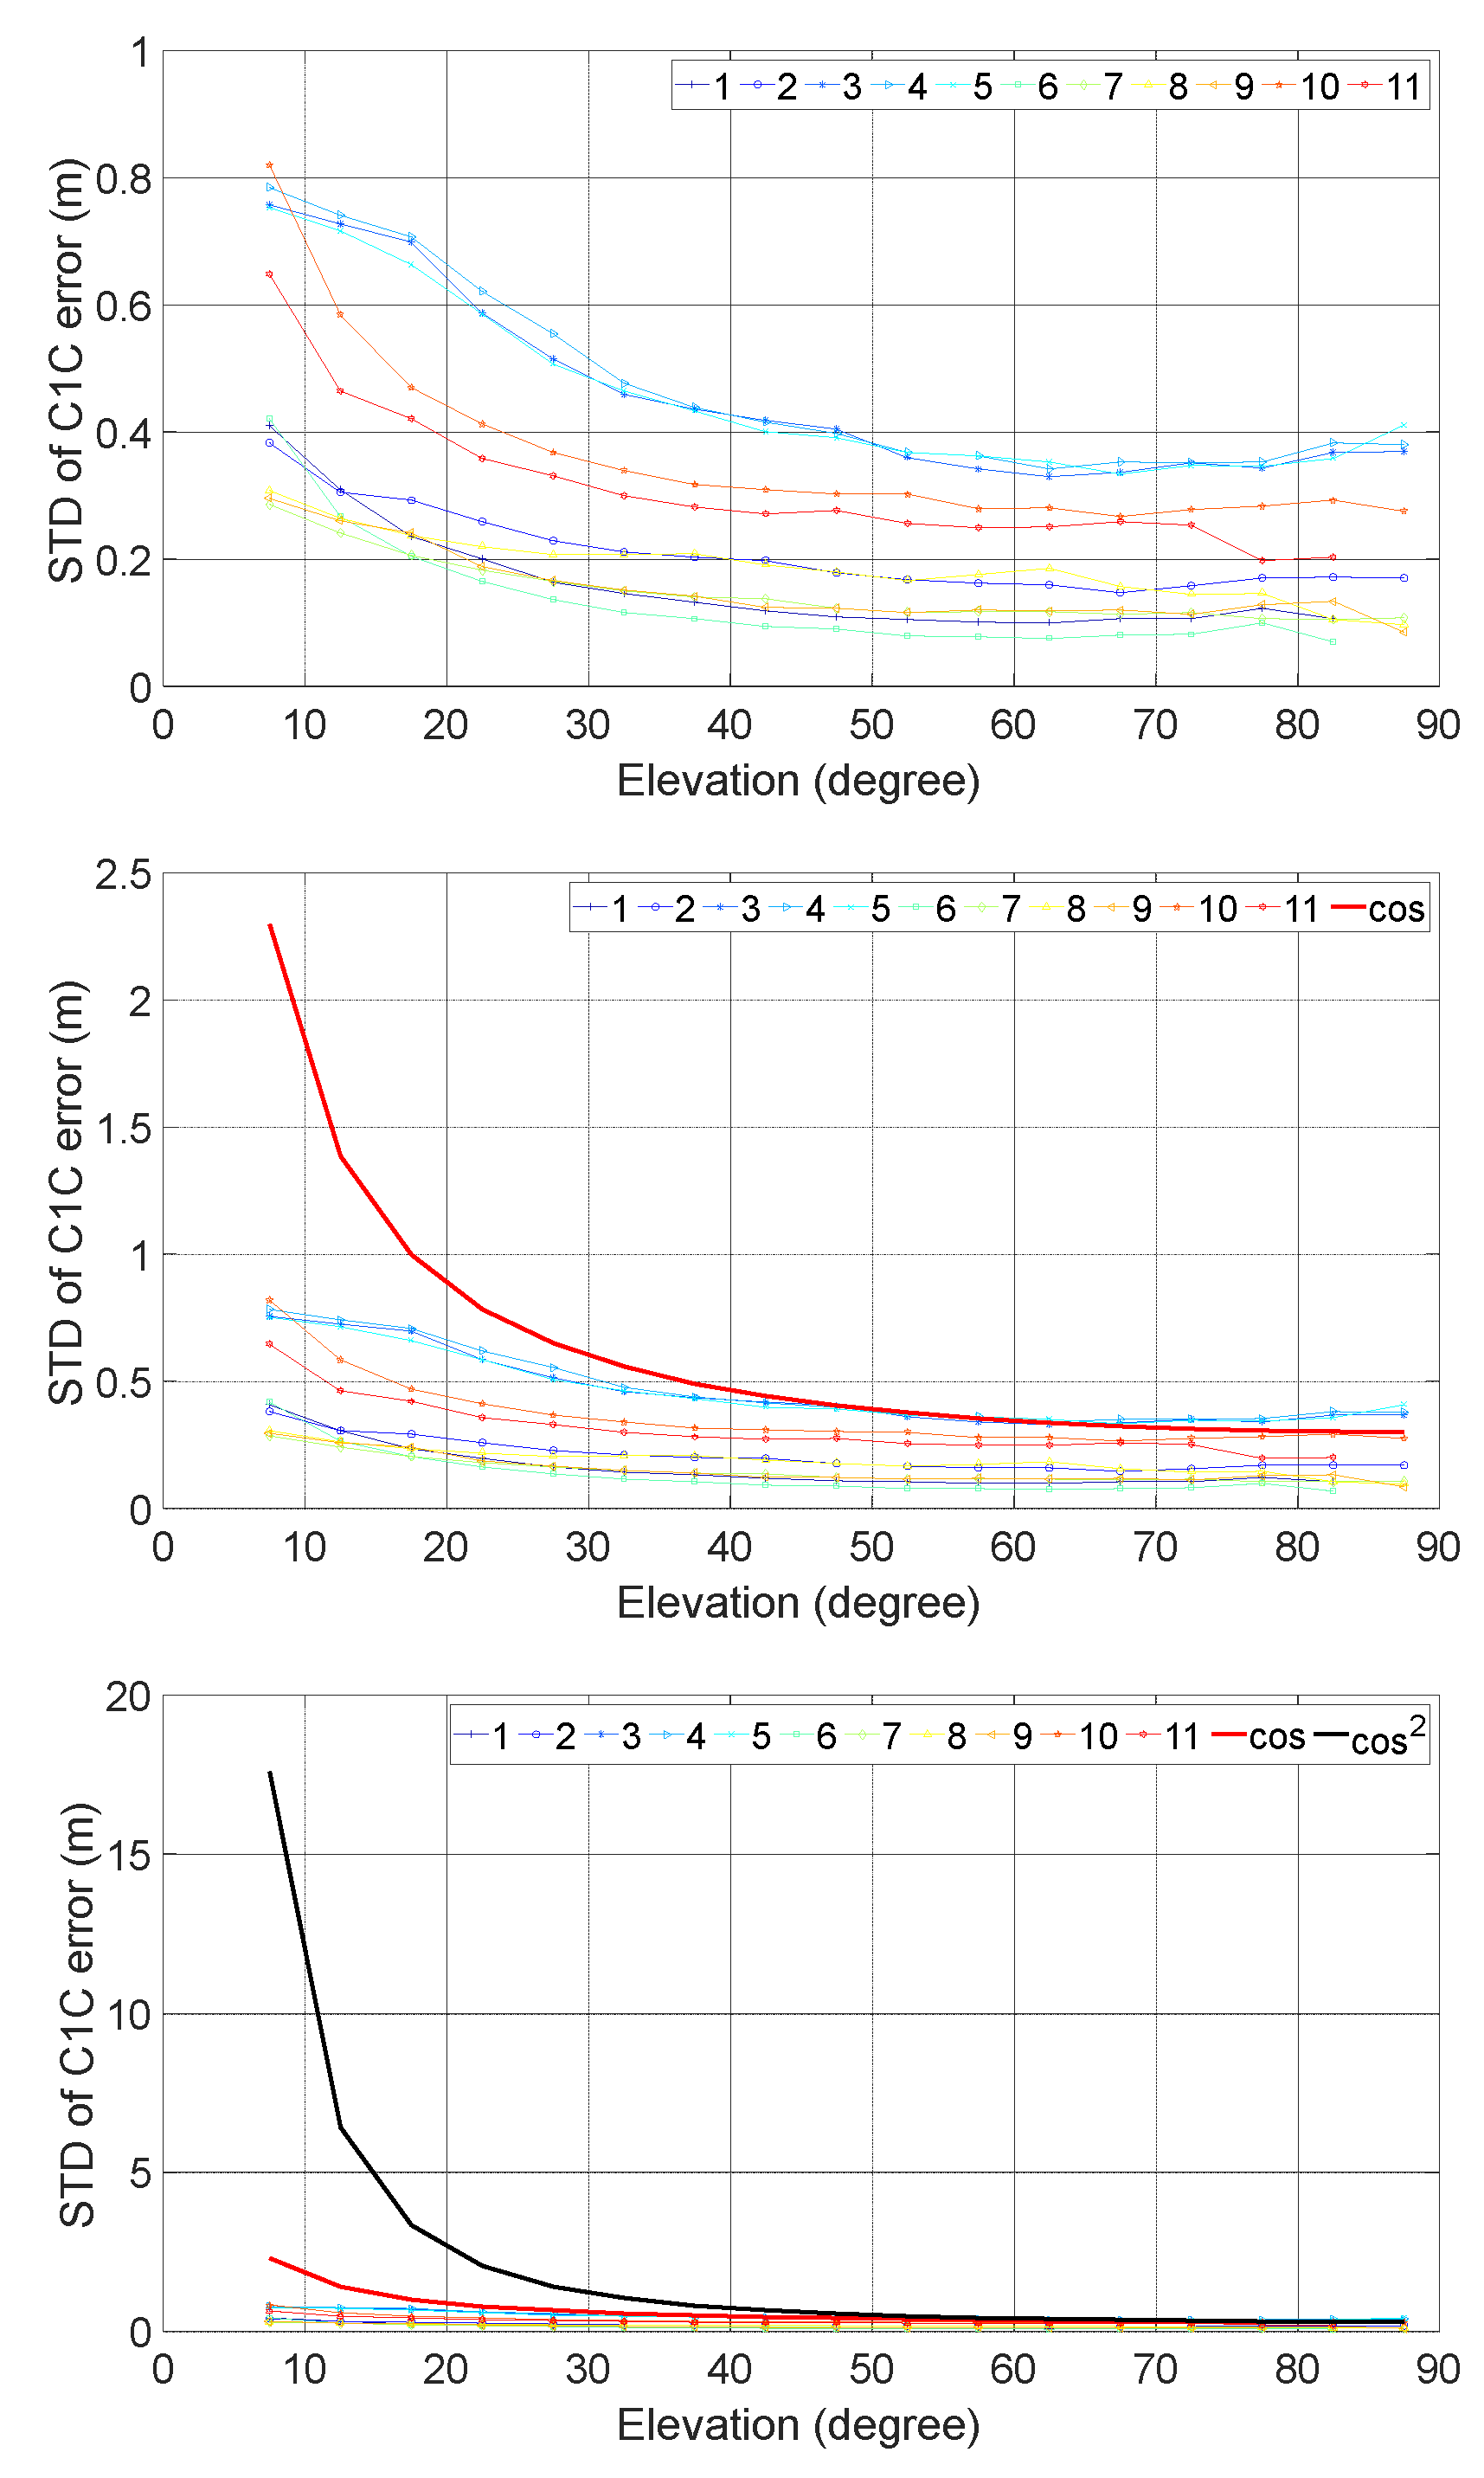
The up section of
Figure 3 illustrates the STD of C1C observation noise for GPS across various elevation angles. And below section compares the relationship between elevation and STD to
(left) and
(right).
It is evident that the STD varies insignificantly among the different baselines tested. At high elevations, the smallest observed STD is approximately 0.1 m, while the largest can reach about 0.4 m. At low elevations, the range extends from a minimum of about 0.3 m to a maximum exceeding 0.8 m. Baselines No. 7, 8, and 9 exhibit the smallest STD, which correspond to receiver types of TRIMBLE ALLOY, SEPT POLARX5, SEPT ASTERX4 and LEICA GR50.
Although the STDs appear similar for elevation > 40°, there is a gradual increase in STD with decreasing elevation, and the rate of increase is consistent across all tested baselines. However, this rate is noticeably less steep than that of , and significantly less than . Consequently, the weighting scheme is not suitable for elevation below 30° and is unsuitable for elevation below 40°.
3.2.1.2. C2W
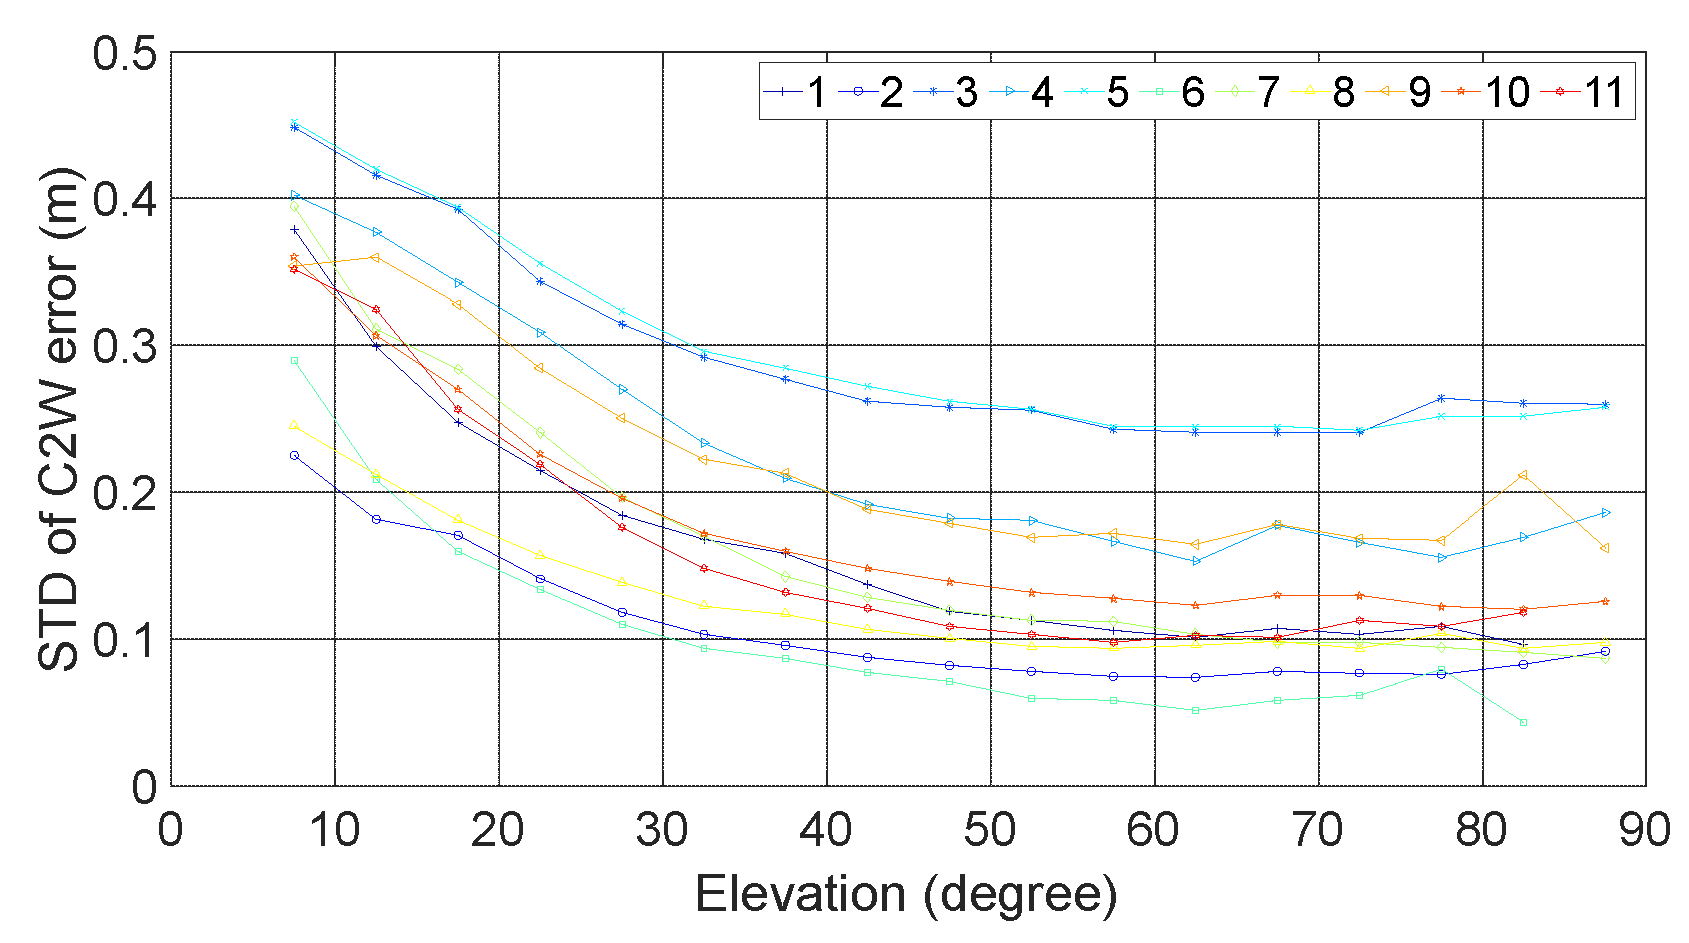
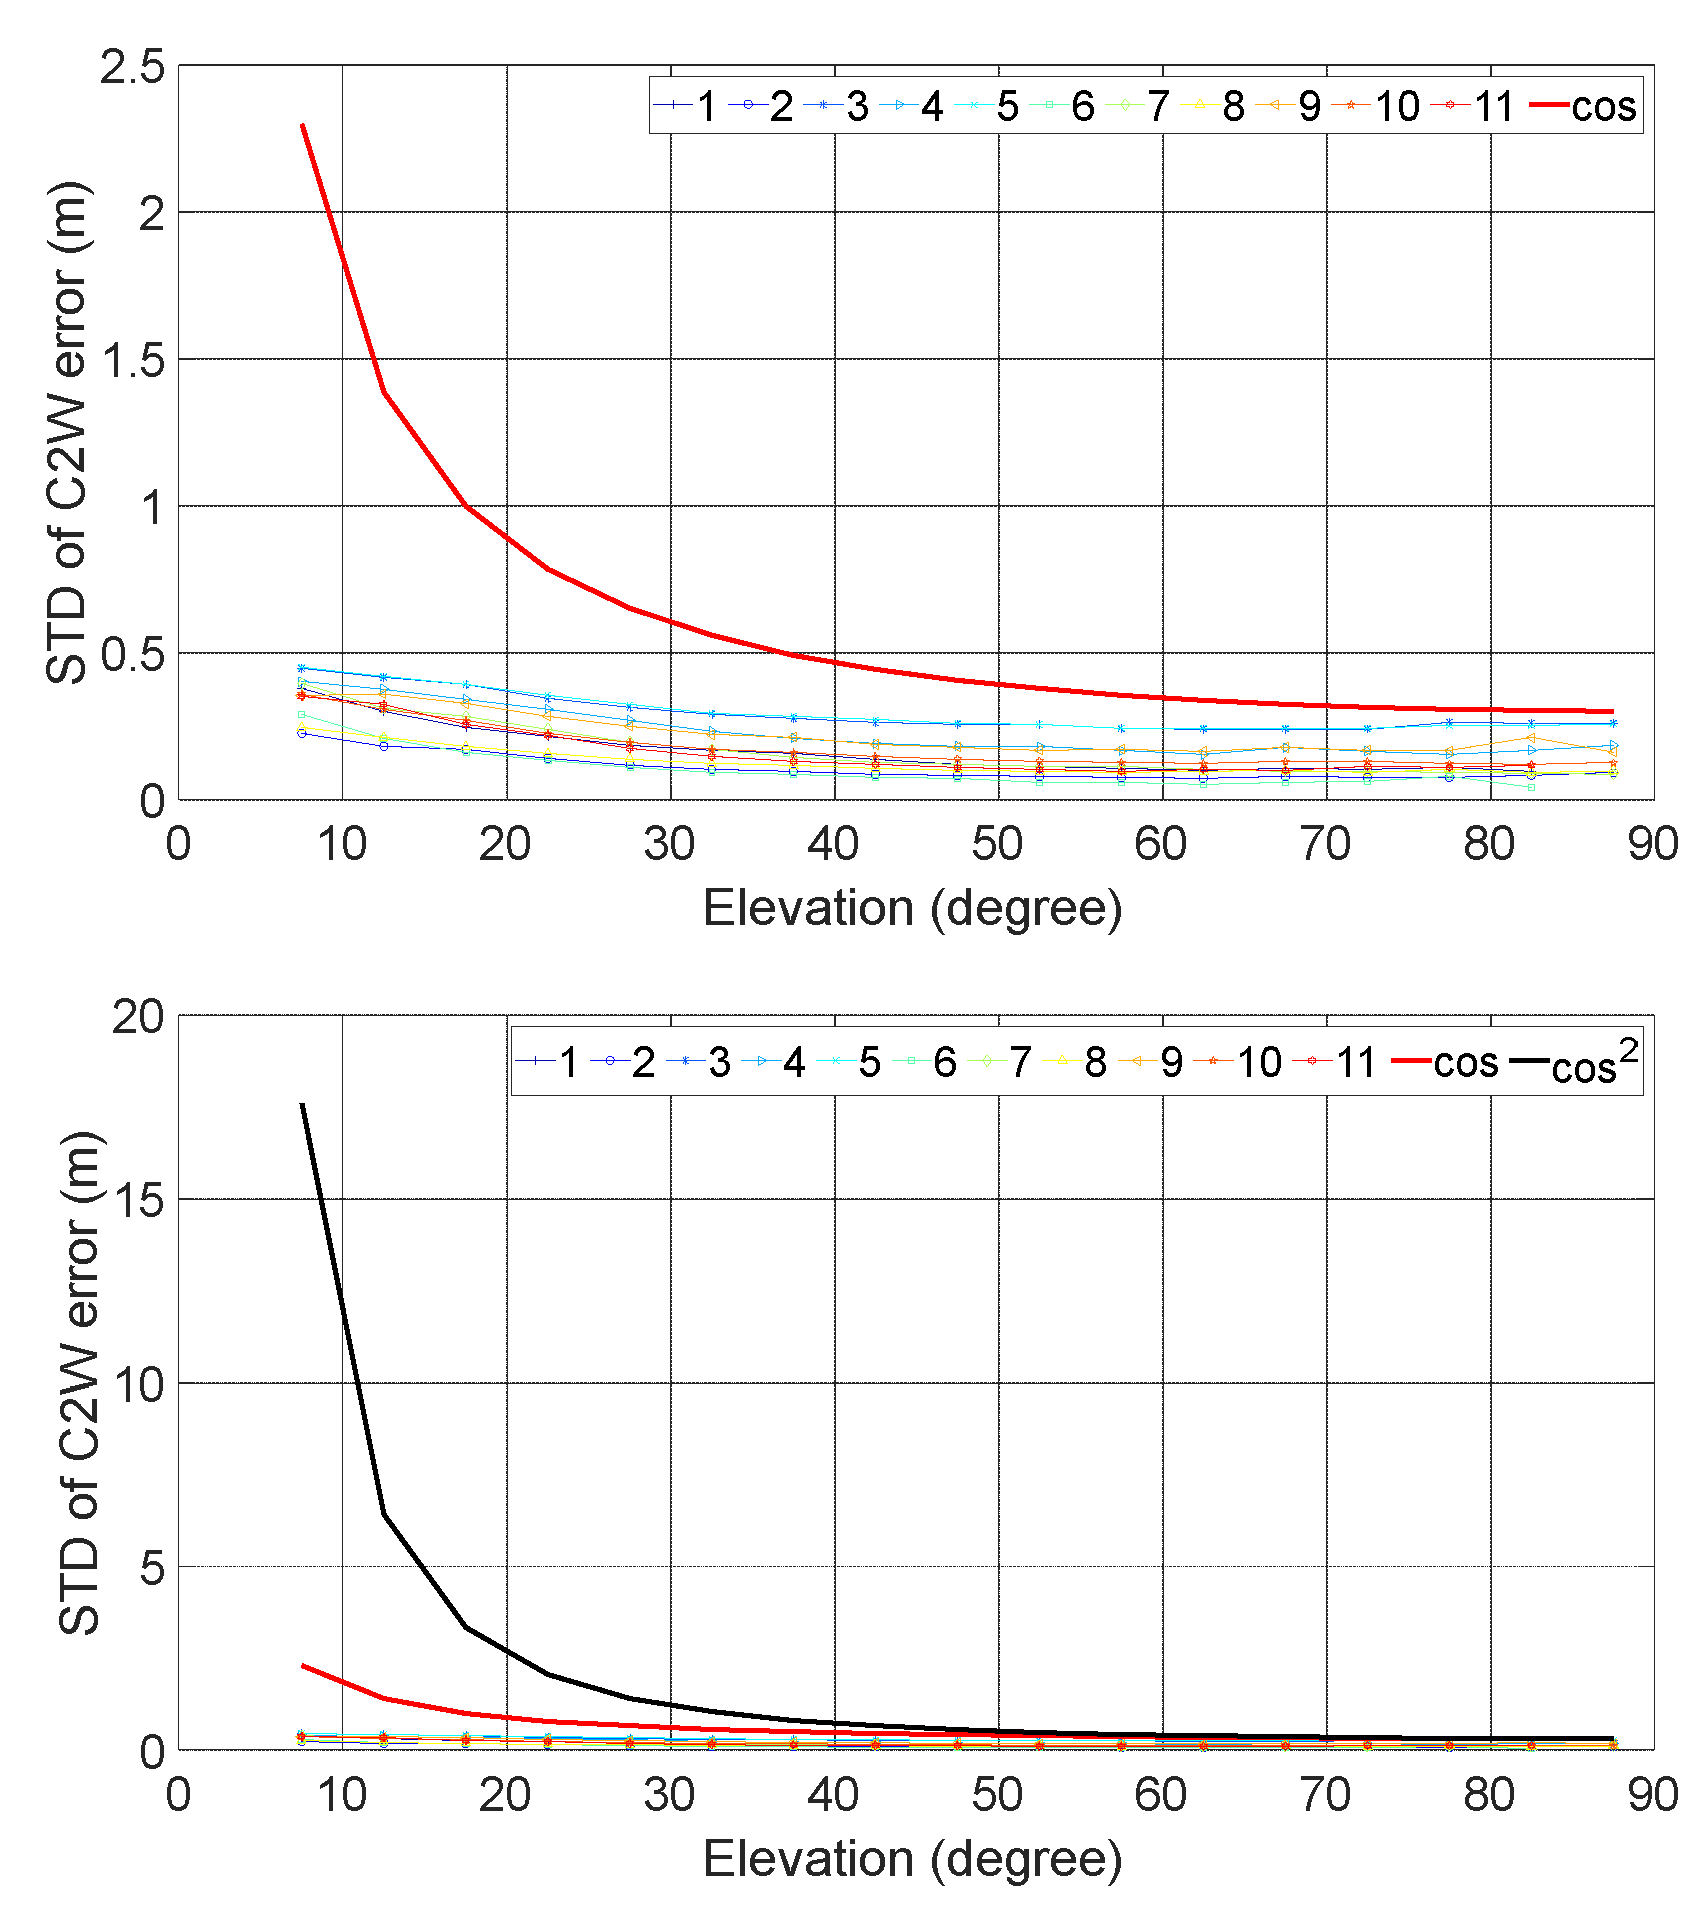
Figure 4 illustrates the results of C2W of GPS. They are like that of C1C with the STD varying insignificantly among the different baselines tested and this rate of increase with decreasing elevation noticeably less steep than that of
.
At high elevations, the smallest observed STD is approximately 0.05 m, while the largest can reach about 0.25 m. At low elevations, the range extends from a minimum of about 0.25 m to a maximum about 0.45 m. Baselines No. 2, 6, and 8 exhibit the smallest STD, which correspond to receiver types of TRIMBLE ALLOY, SEPT POLARX5 and SEPT ASTERX4.
3.2.1.3. C5Q (or C5X)
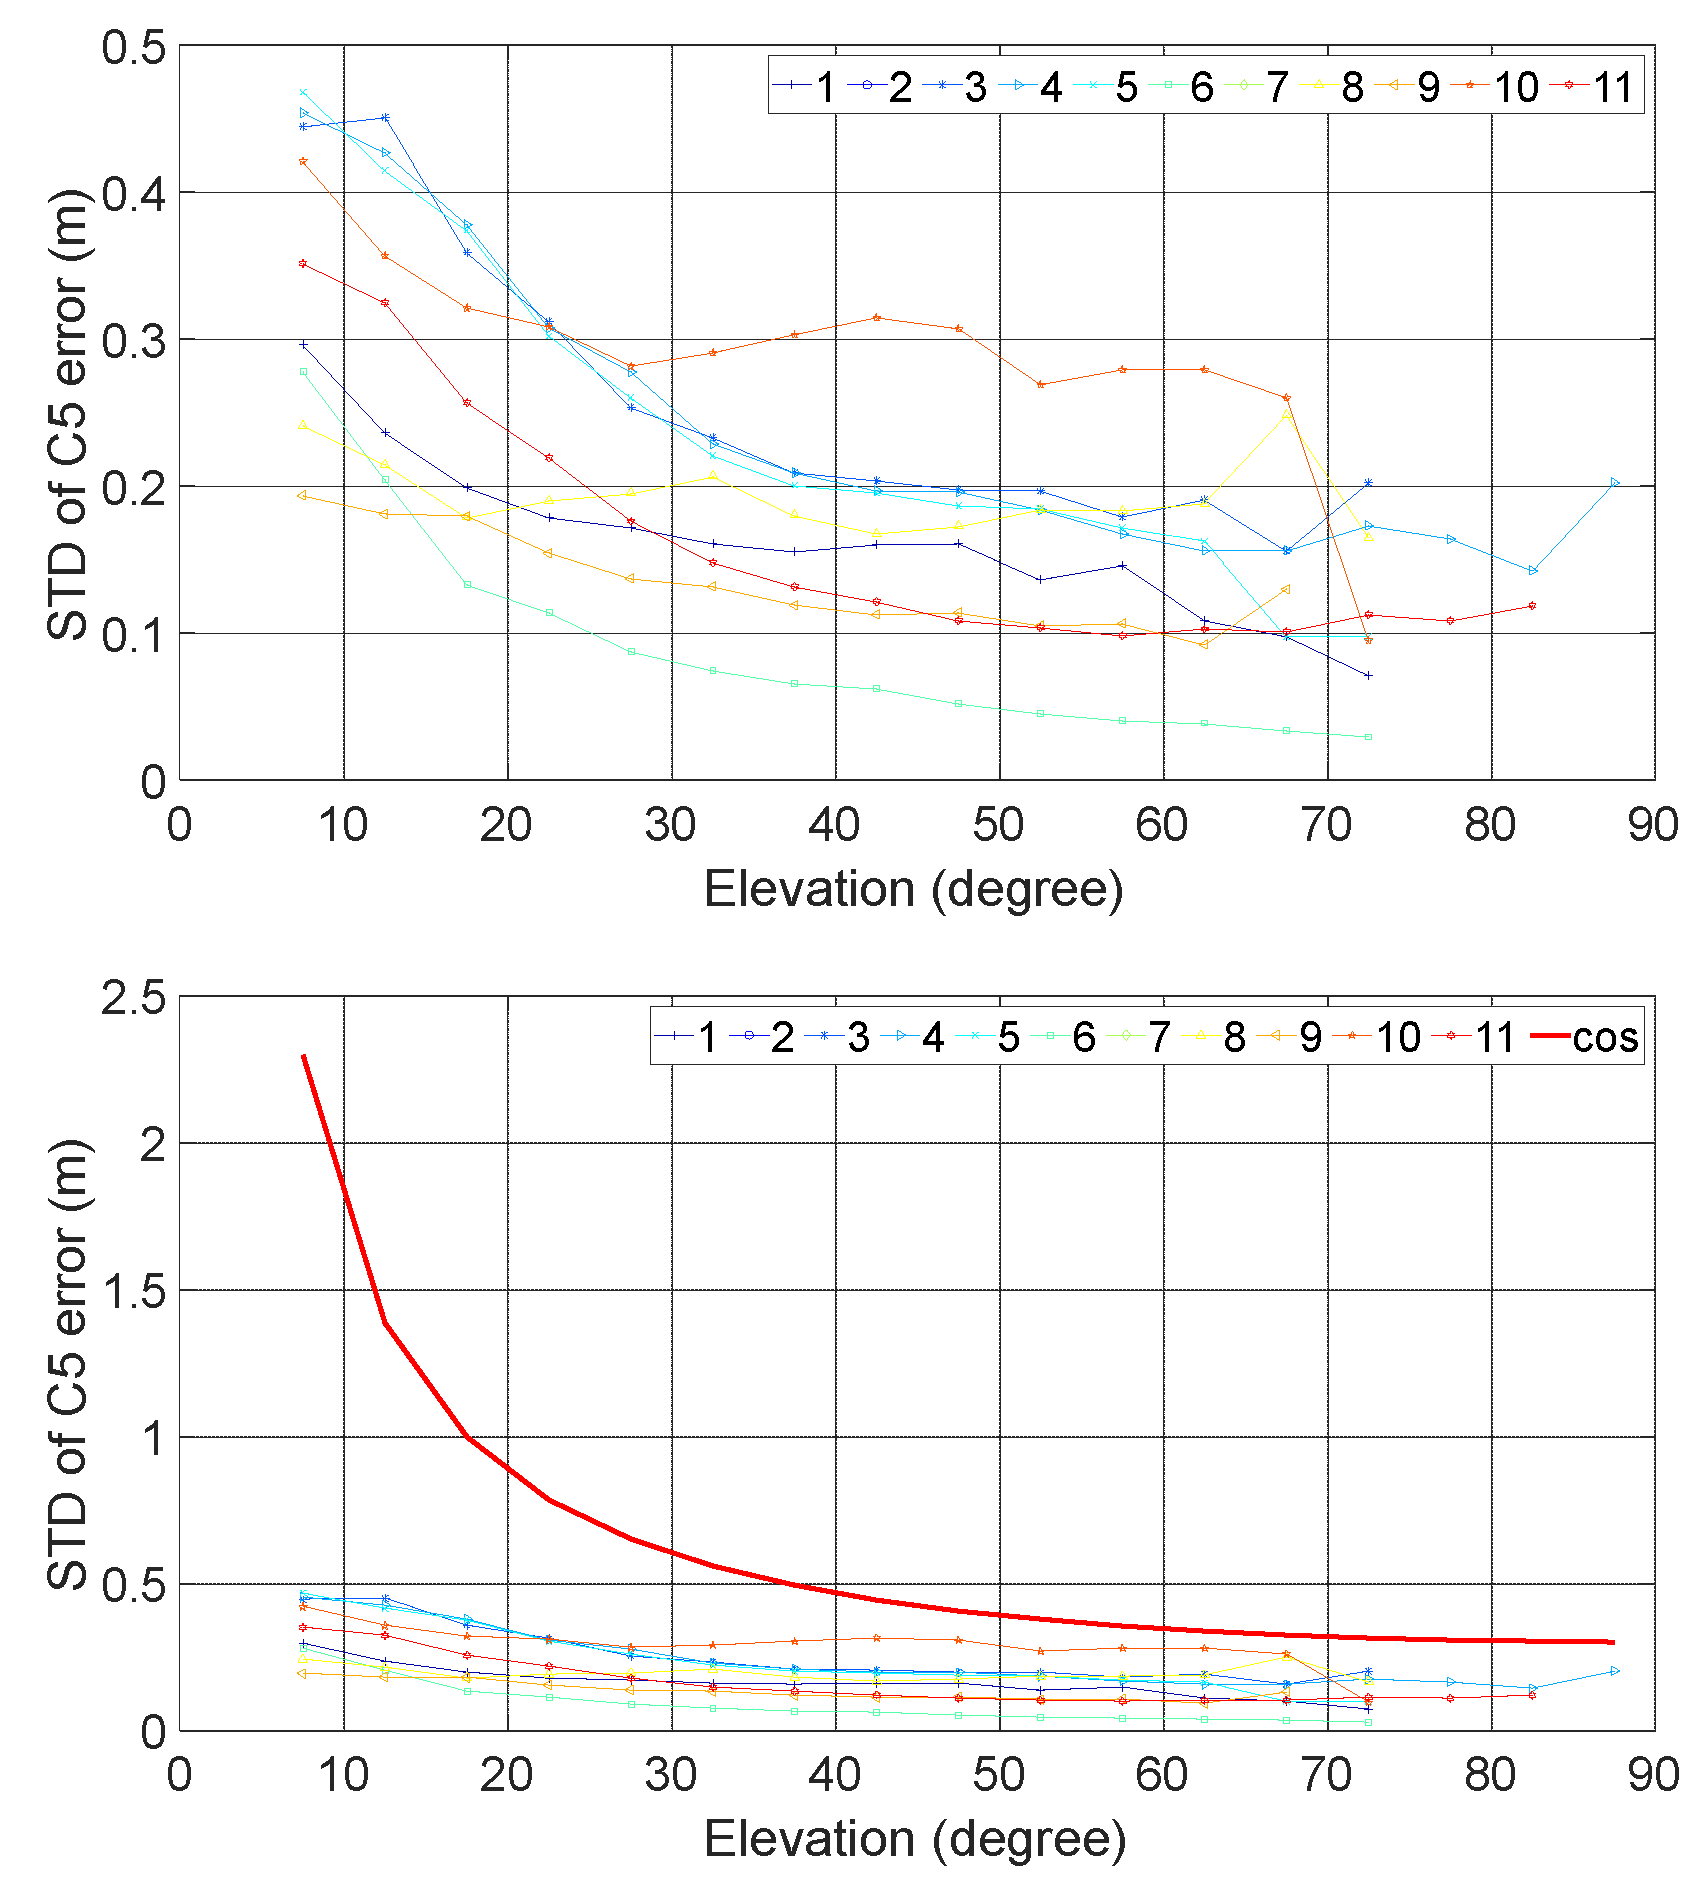
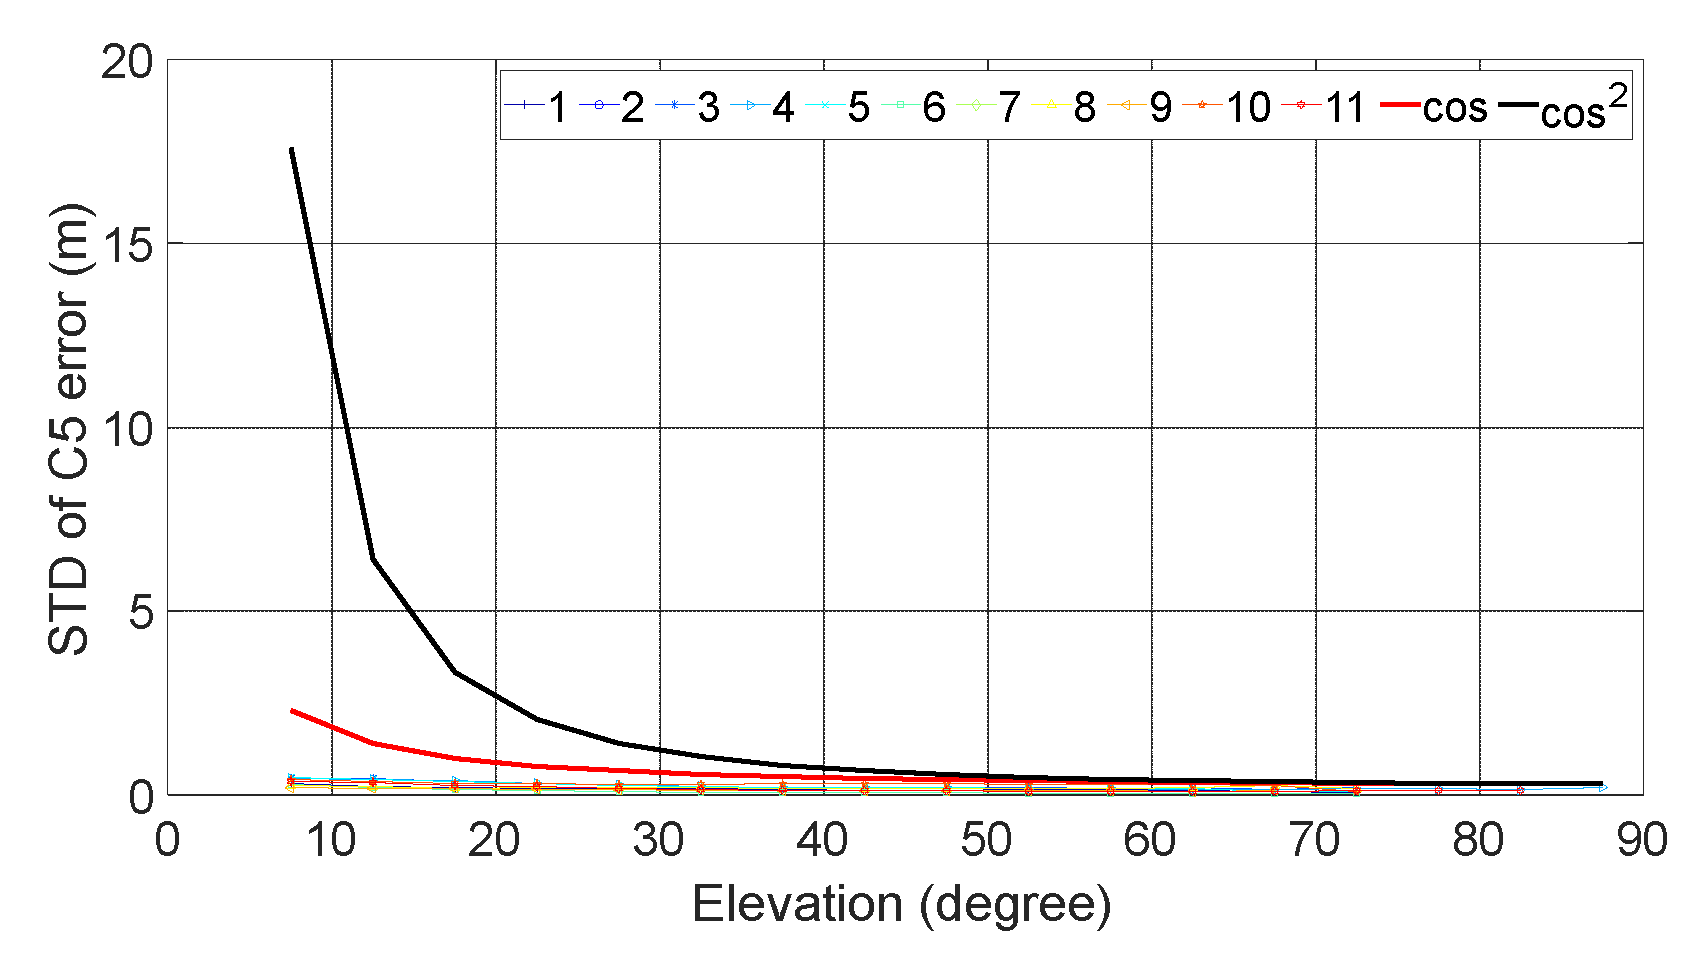
Figure 5 illustrates the results of C5 (C5Q or L5X) of GPS. They are like that of C1C or C2W with the STD varying insignificantly among the different baselines tested and this rate of increase with decreasing elevation noticeably less steep than that of
.
At high elevations, the smallest observed STD is approximately 0.05 m, while the largest can reach about 0.30 m. At low elevations, the range extends from a minimum of about 0.20 m to a maximum about 0.45 m. Baselines No. 6, and 8 exhibit the smallest STD, which correspond to receiver types of TRIMBLE ALLOY, SEPT POLARX5 and SEPT ASTERX4.
3.2.2. Galileo
3.2.2.1. C1X
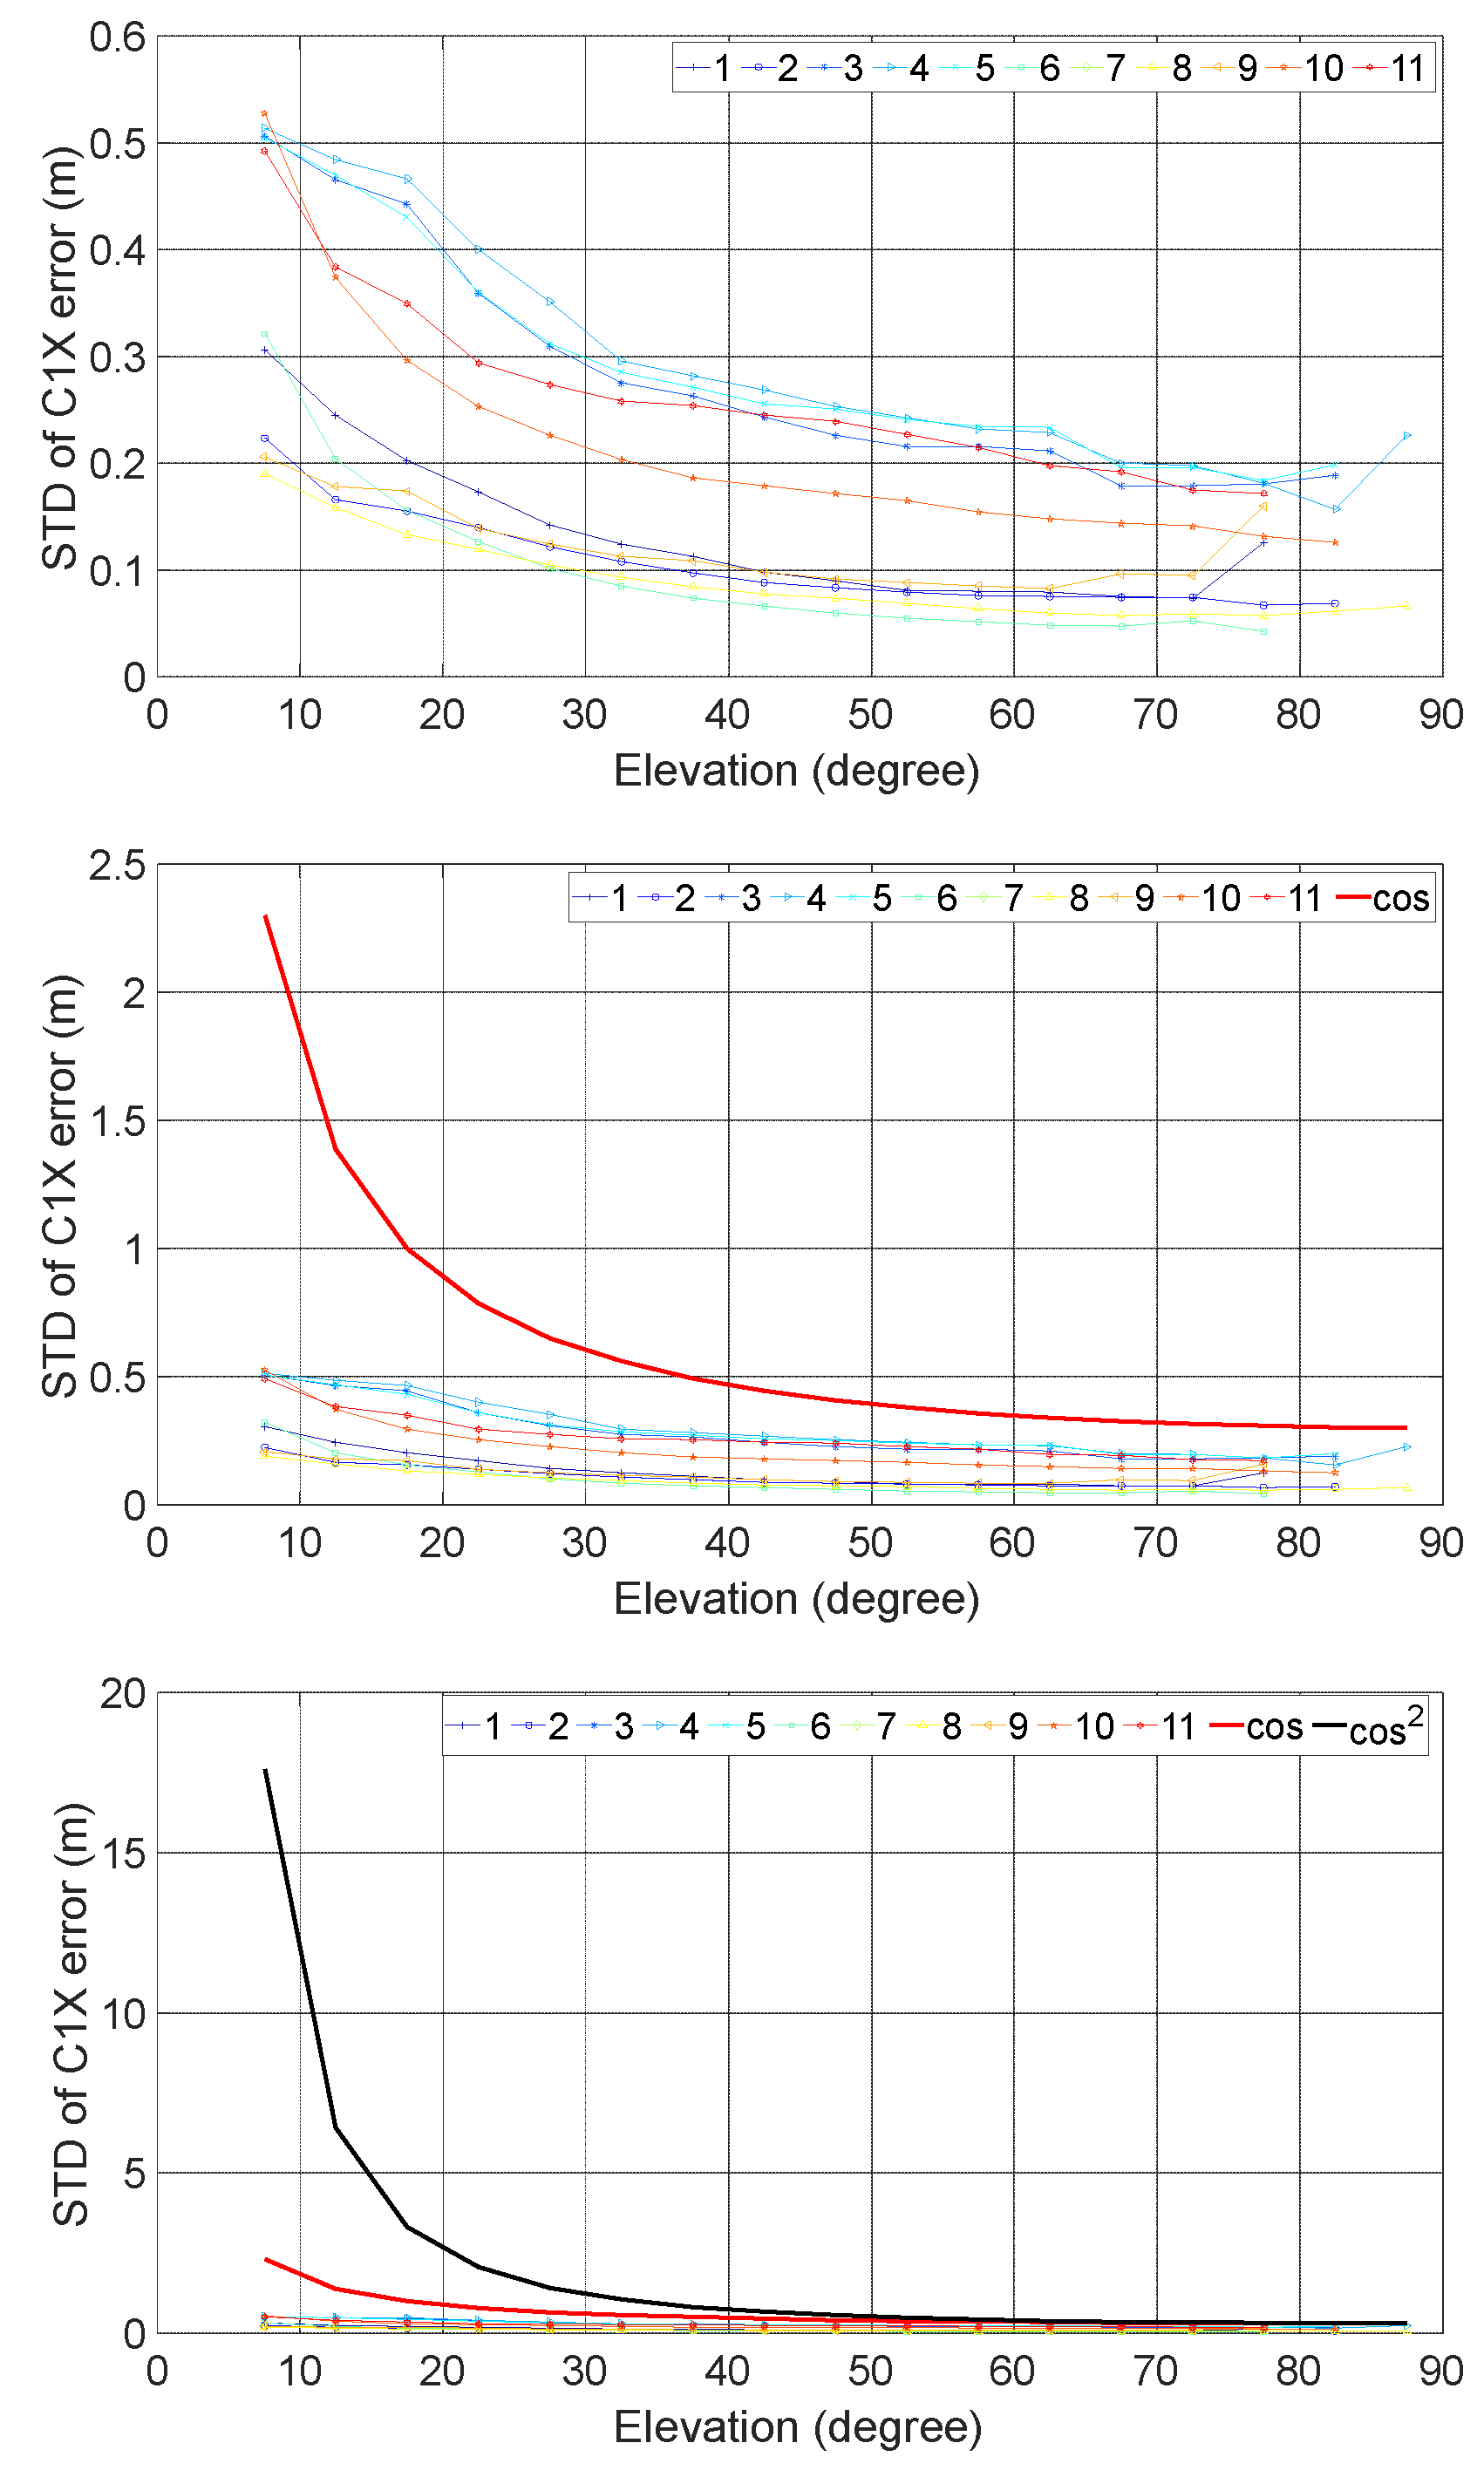
Figure 6 illustrates the results of C1X of Galileo. They are like that of GPS with the STD varying insignificantly among the different baselines tested and this rate of increase with decreasing elevation noticeably less steep than that of
.
At high elevations, the smallest observed STD is approximately 0.05 m, while the largest can reach about 0.30 m. At low elevations, the range extends from a minimum of about 0.20 m to a maximum about 0.45 m. Baselines No. 1, 2, 6, and 8 exhibit the smallest STD, which correspond to receiver types of JAVAD TRE_G3TH, TRIMBLE ALLOY, SEPT POLARX5 and SEPT ASTERX4.
3.2.2.2. C5X
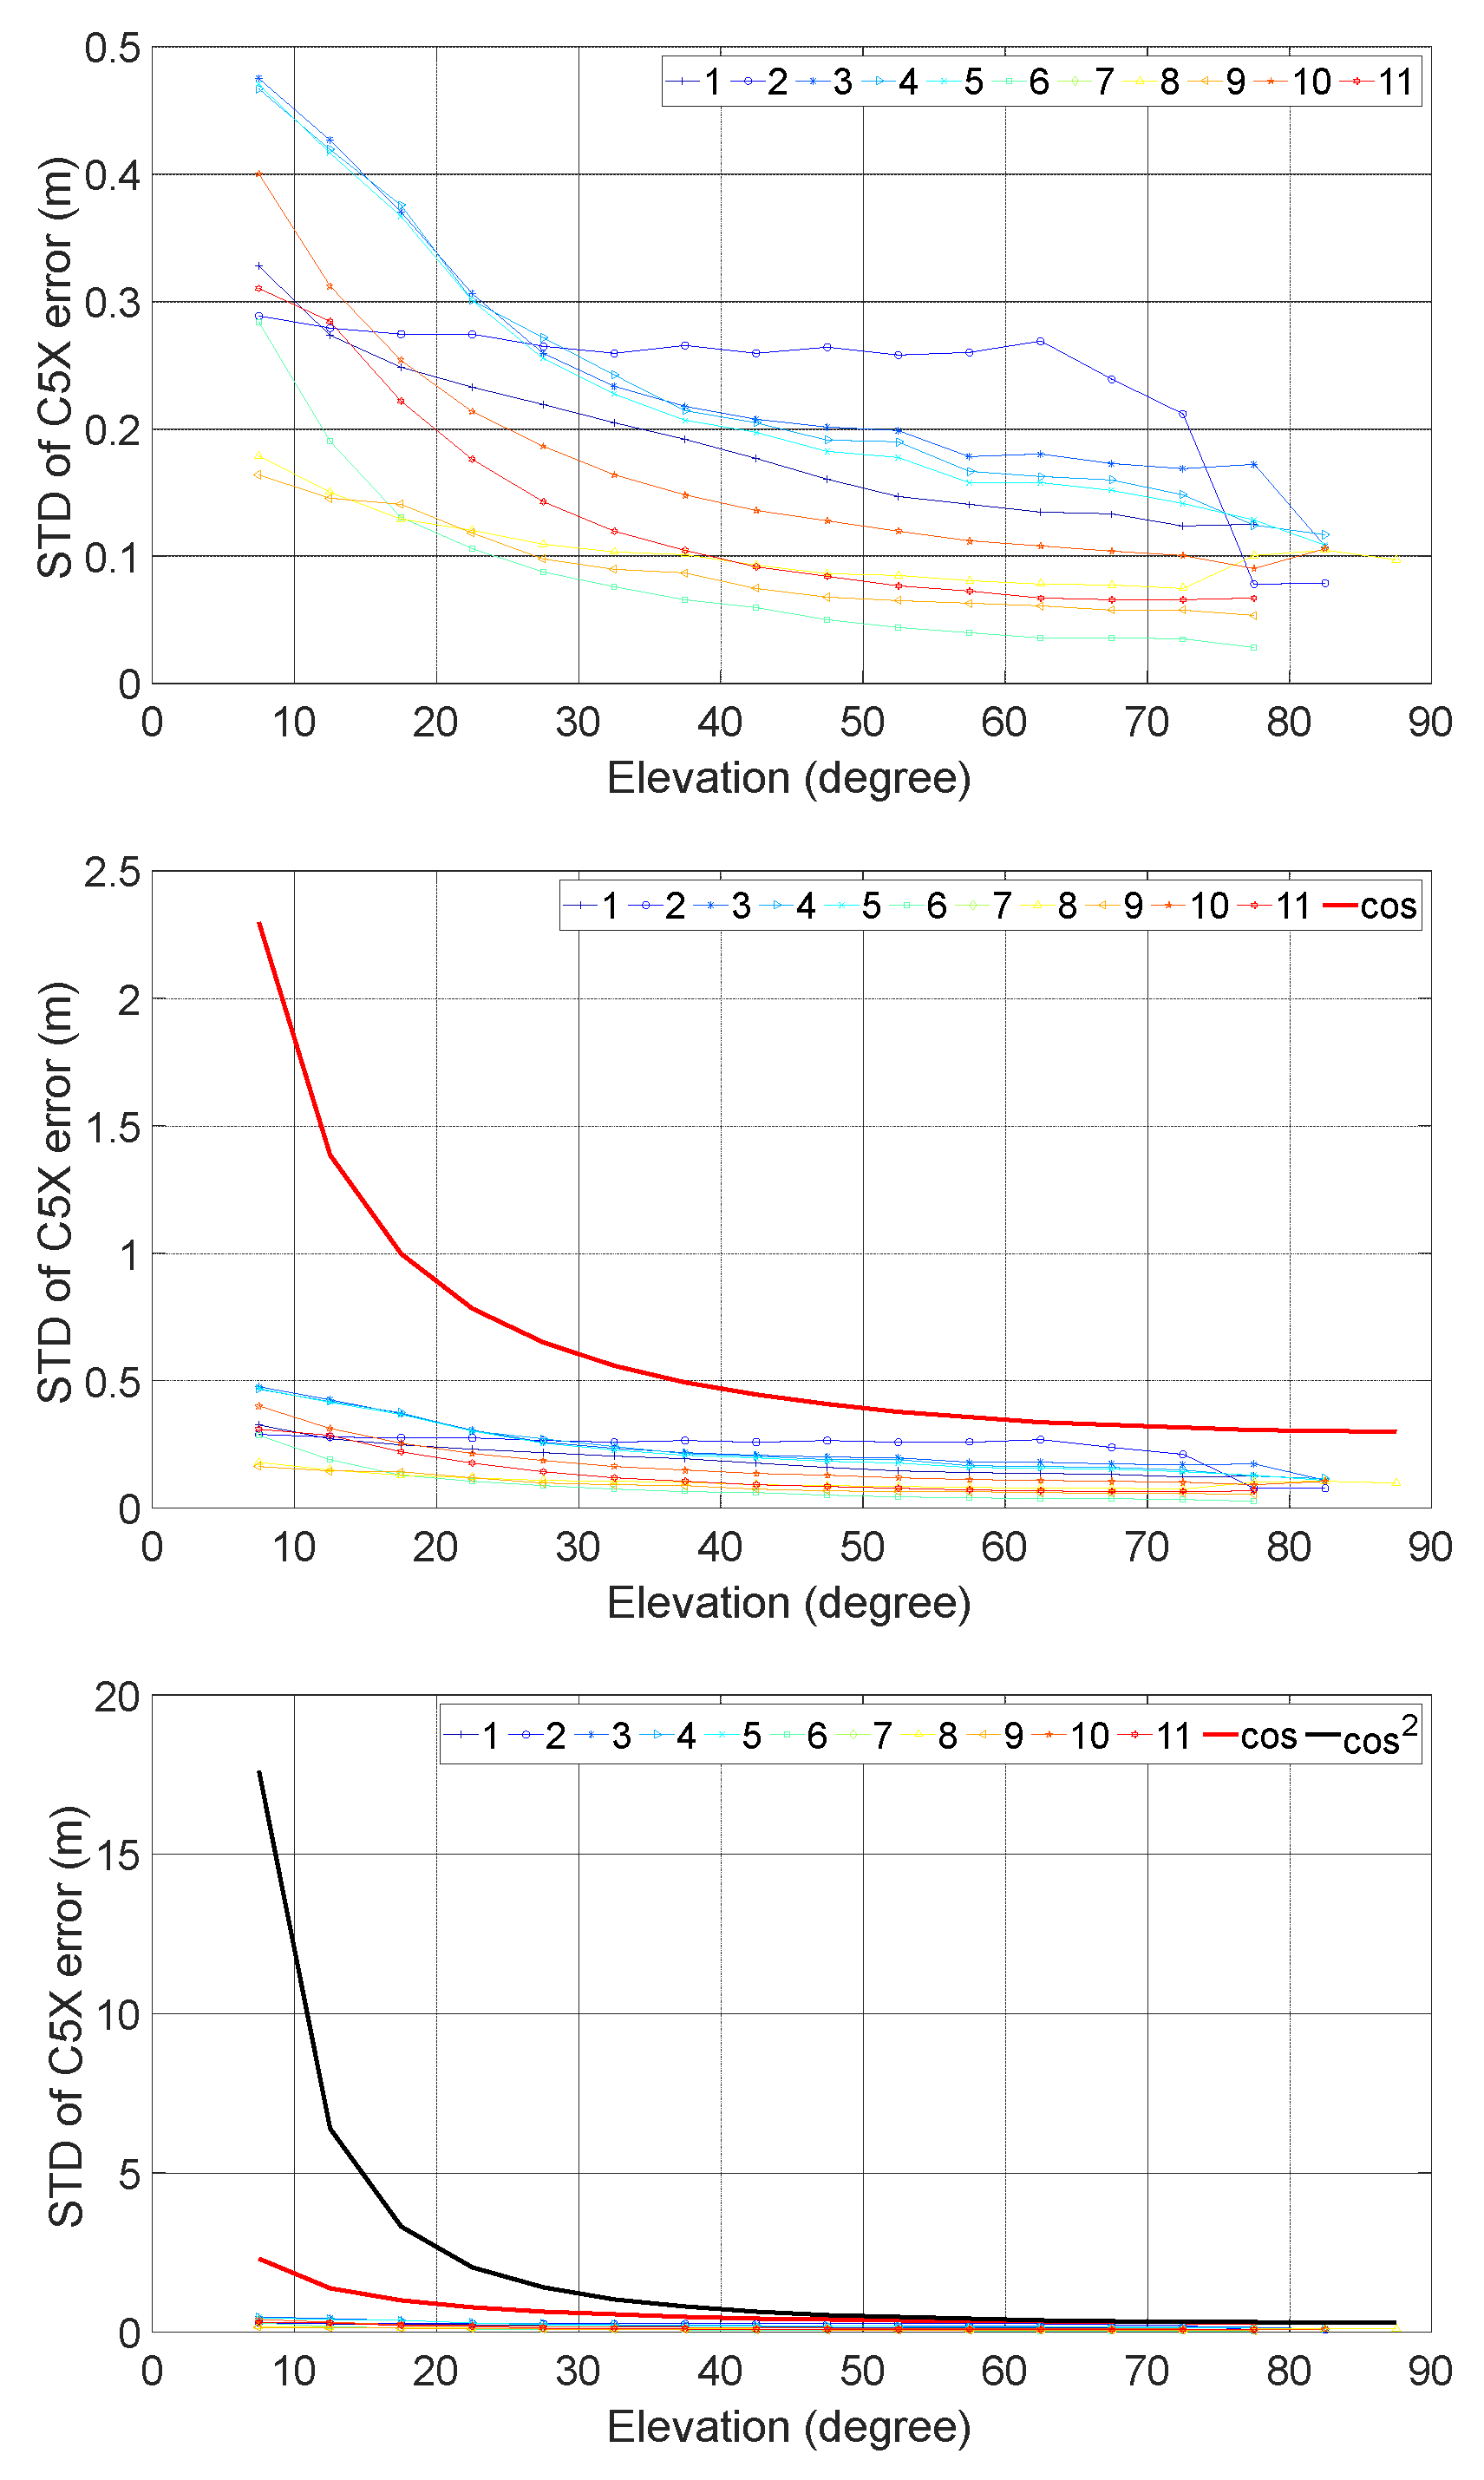
Figure 7 illustrates the results of C5X of Galileo. They are like that of the other code types with the STD varying insignificantly among the different baselines tested and this rate of increase with decreasing elevation noticeably less steep than that of
.
At high elevations, the smallest observed STD is approximately 0.05 m, while the largest can reach about 0.30 m. At low elevations, the range extends from a minimum of about 0.20 m to a maximum about 0.45 m.
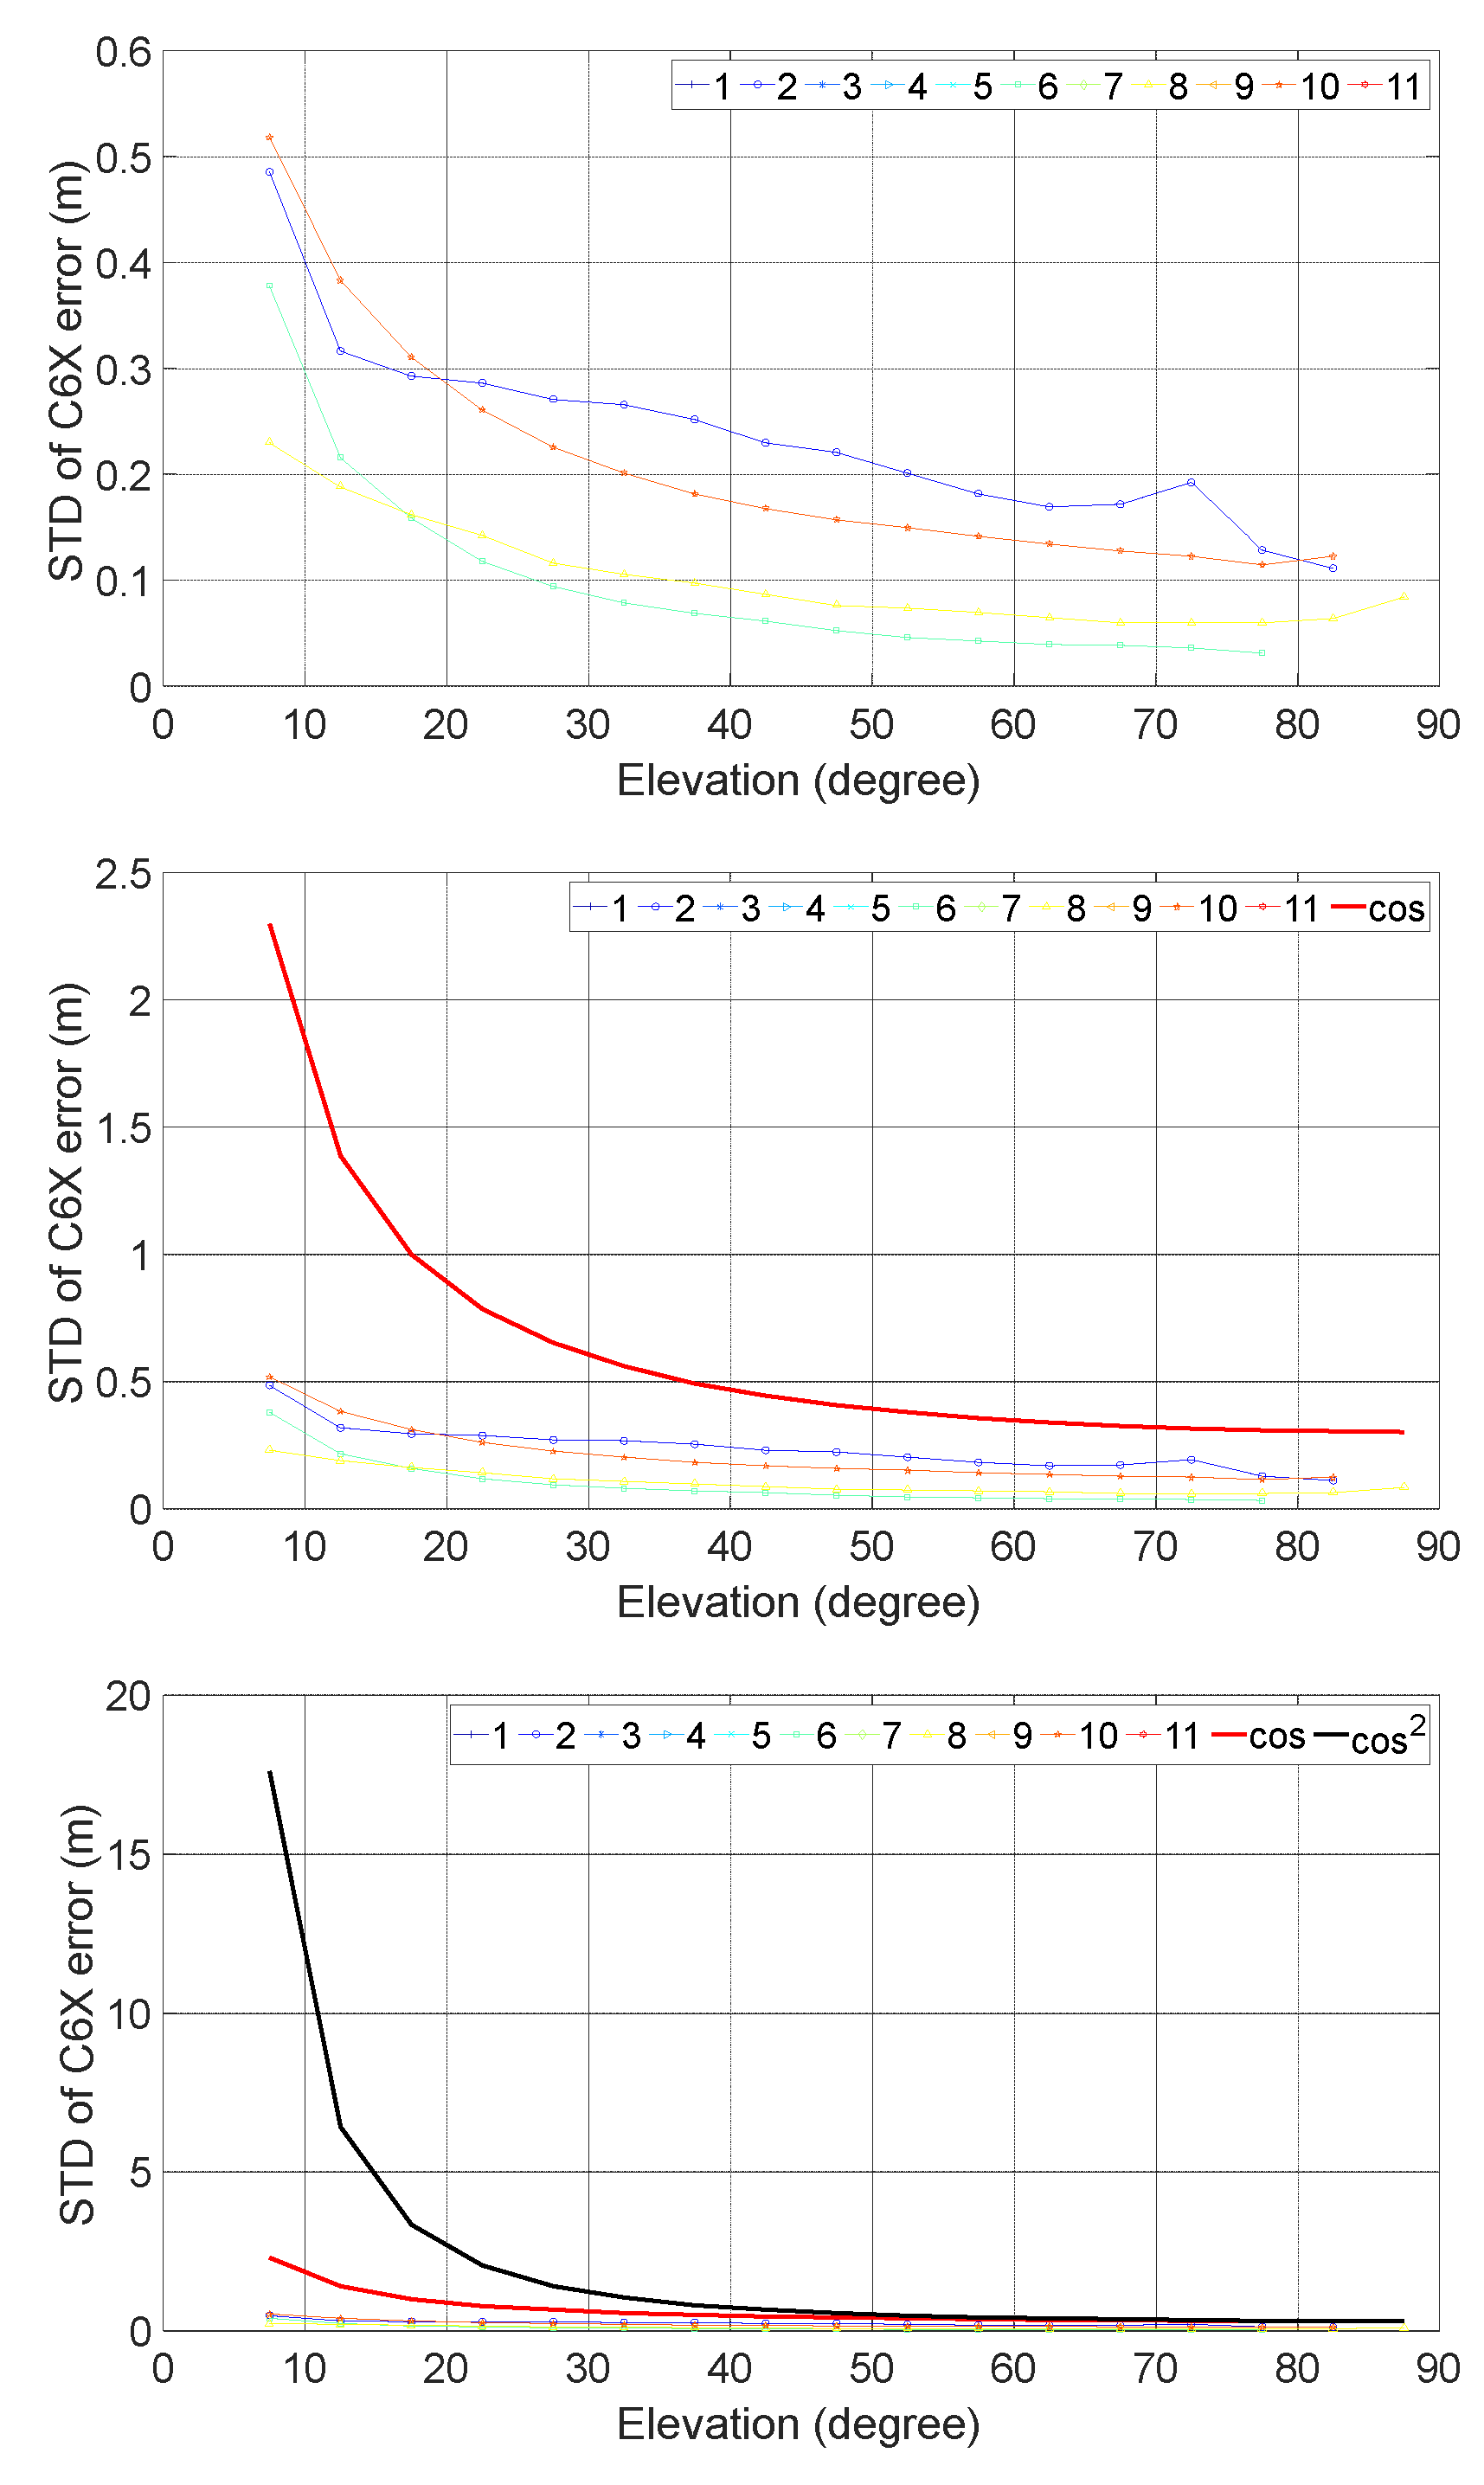
3.2.2.3. C6X
Figure 8 illustrates the results of C6X of Galileo. They are like that of the other code types with the STD varying insignificantly among the different baselines tested and this rate of increase with decreasing elevation noticeably less steep than that of
.
At high elevations, the smallest observed STD is approximately 0.05 m, while the largest can reach about 0.20 m. At low elevations, the range extends from a minimum of about 0.25 m to a maximum about 0.55 m. Baselines No. 6 and 8 exhibit the smallest STD, which correspond to receiver types of TRIMBLE ALLOY, SEPT POLARX5 and SEPT ASTERX4.
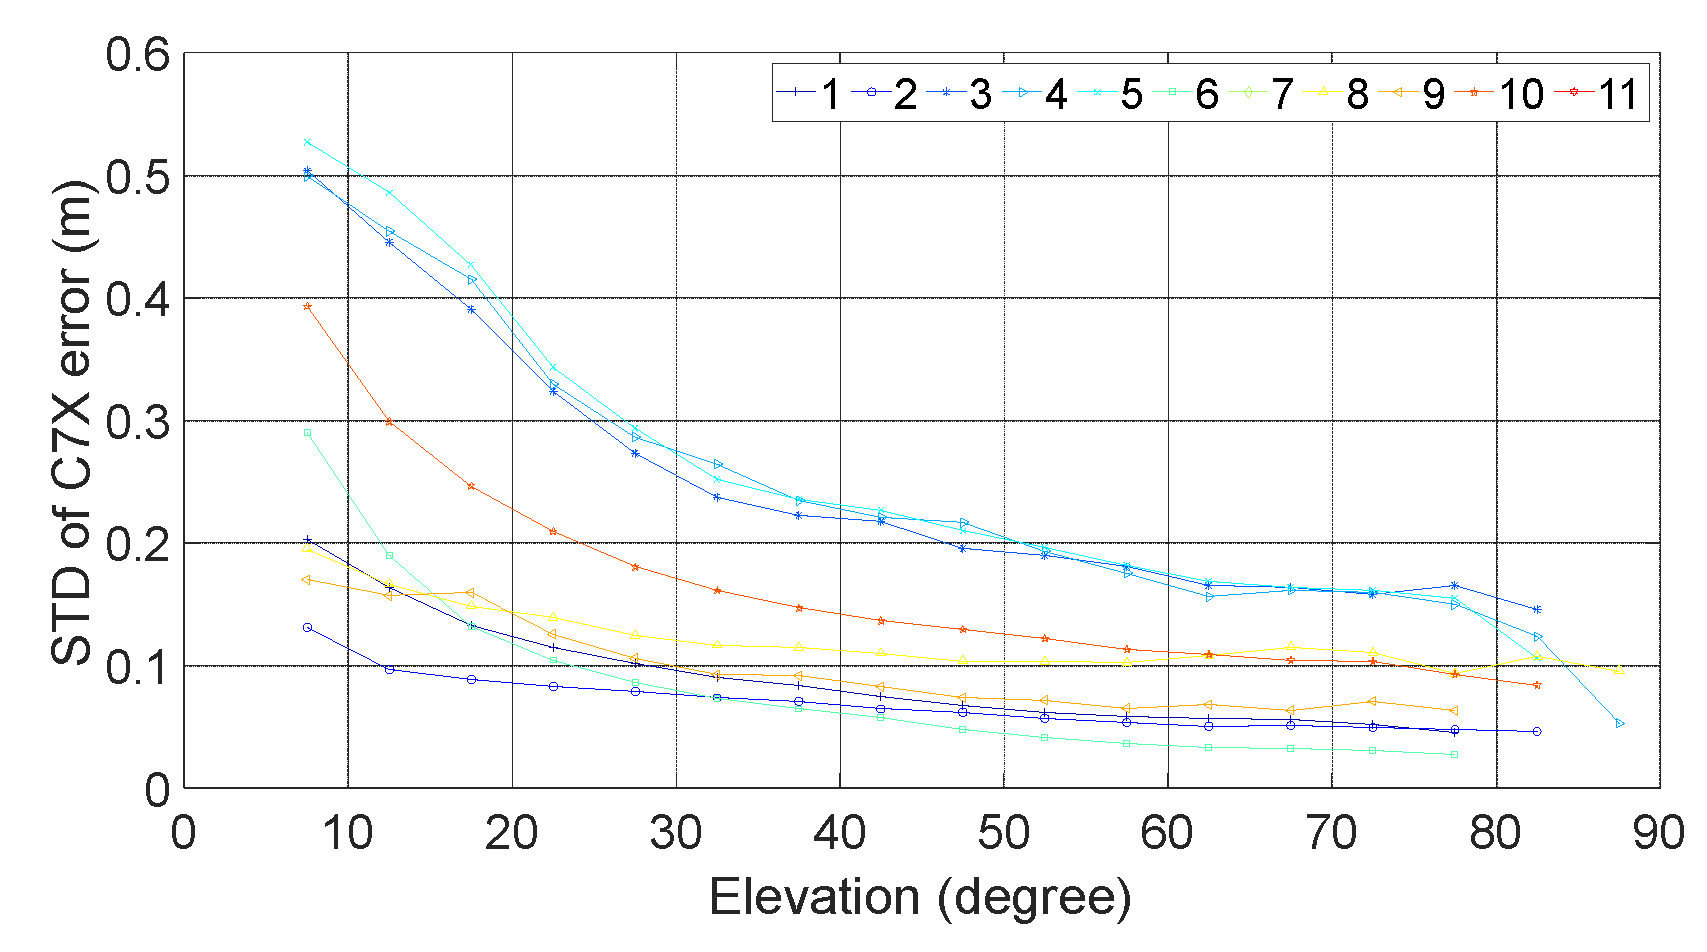
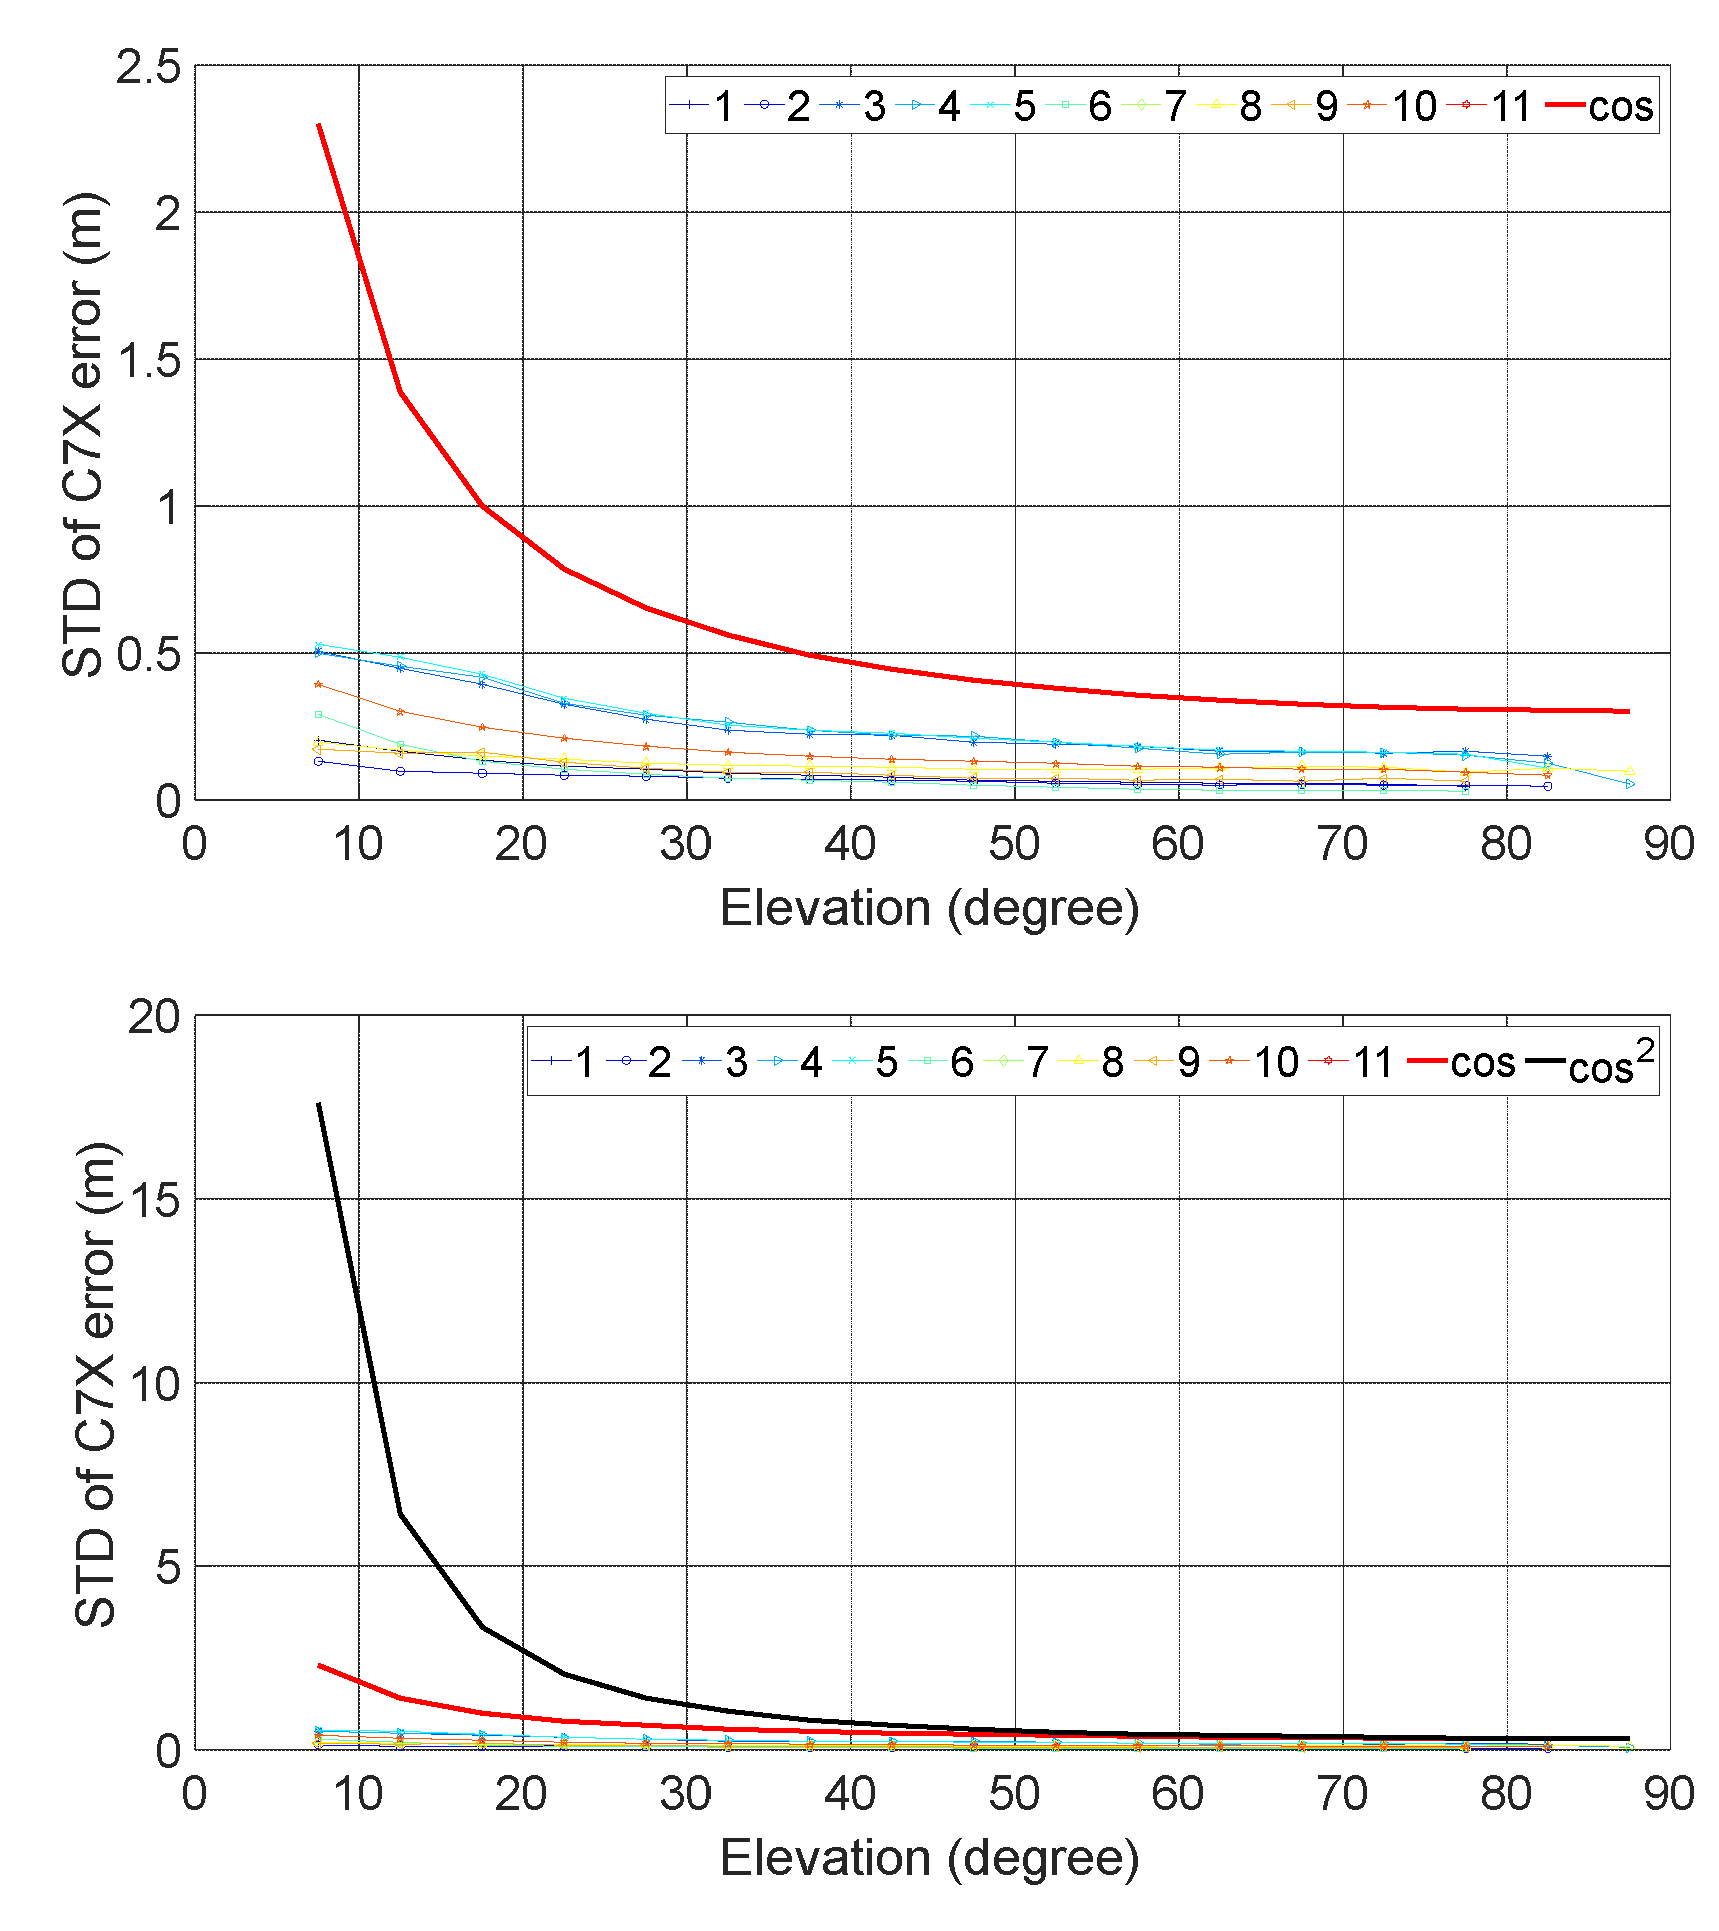
3.2.2.4. C7X
Figure 9 illustrates the results of C7X of Galileo. They are like that of the other code types with the STD varying insignificantly among the different baselines tested and this rate of increase with decreasing elevation noticeably less steep than that of
.
At high elevations, the smallest observed STD is approximately 0.05 m, while the largest can reach about 0.15 m. At low elevations, the range extends from a minimum of about 0.15 m to a maximum about 0.55 m. Baselines No. 2 and 8 exhibit the smallest STD, which correspond to receiver types of SEPT POLARX5 and SEPT ASTERX4.
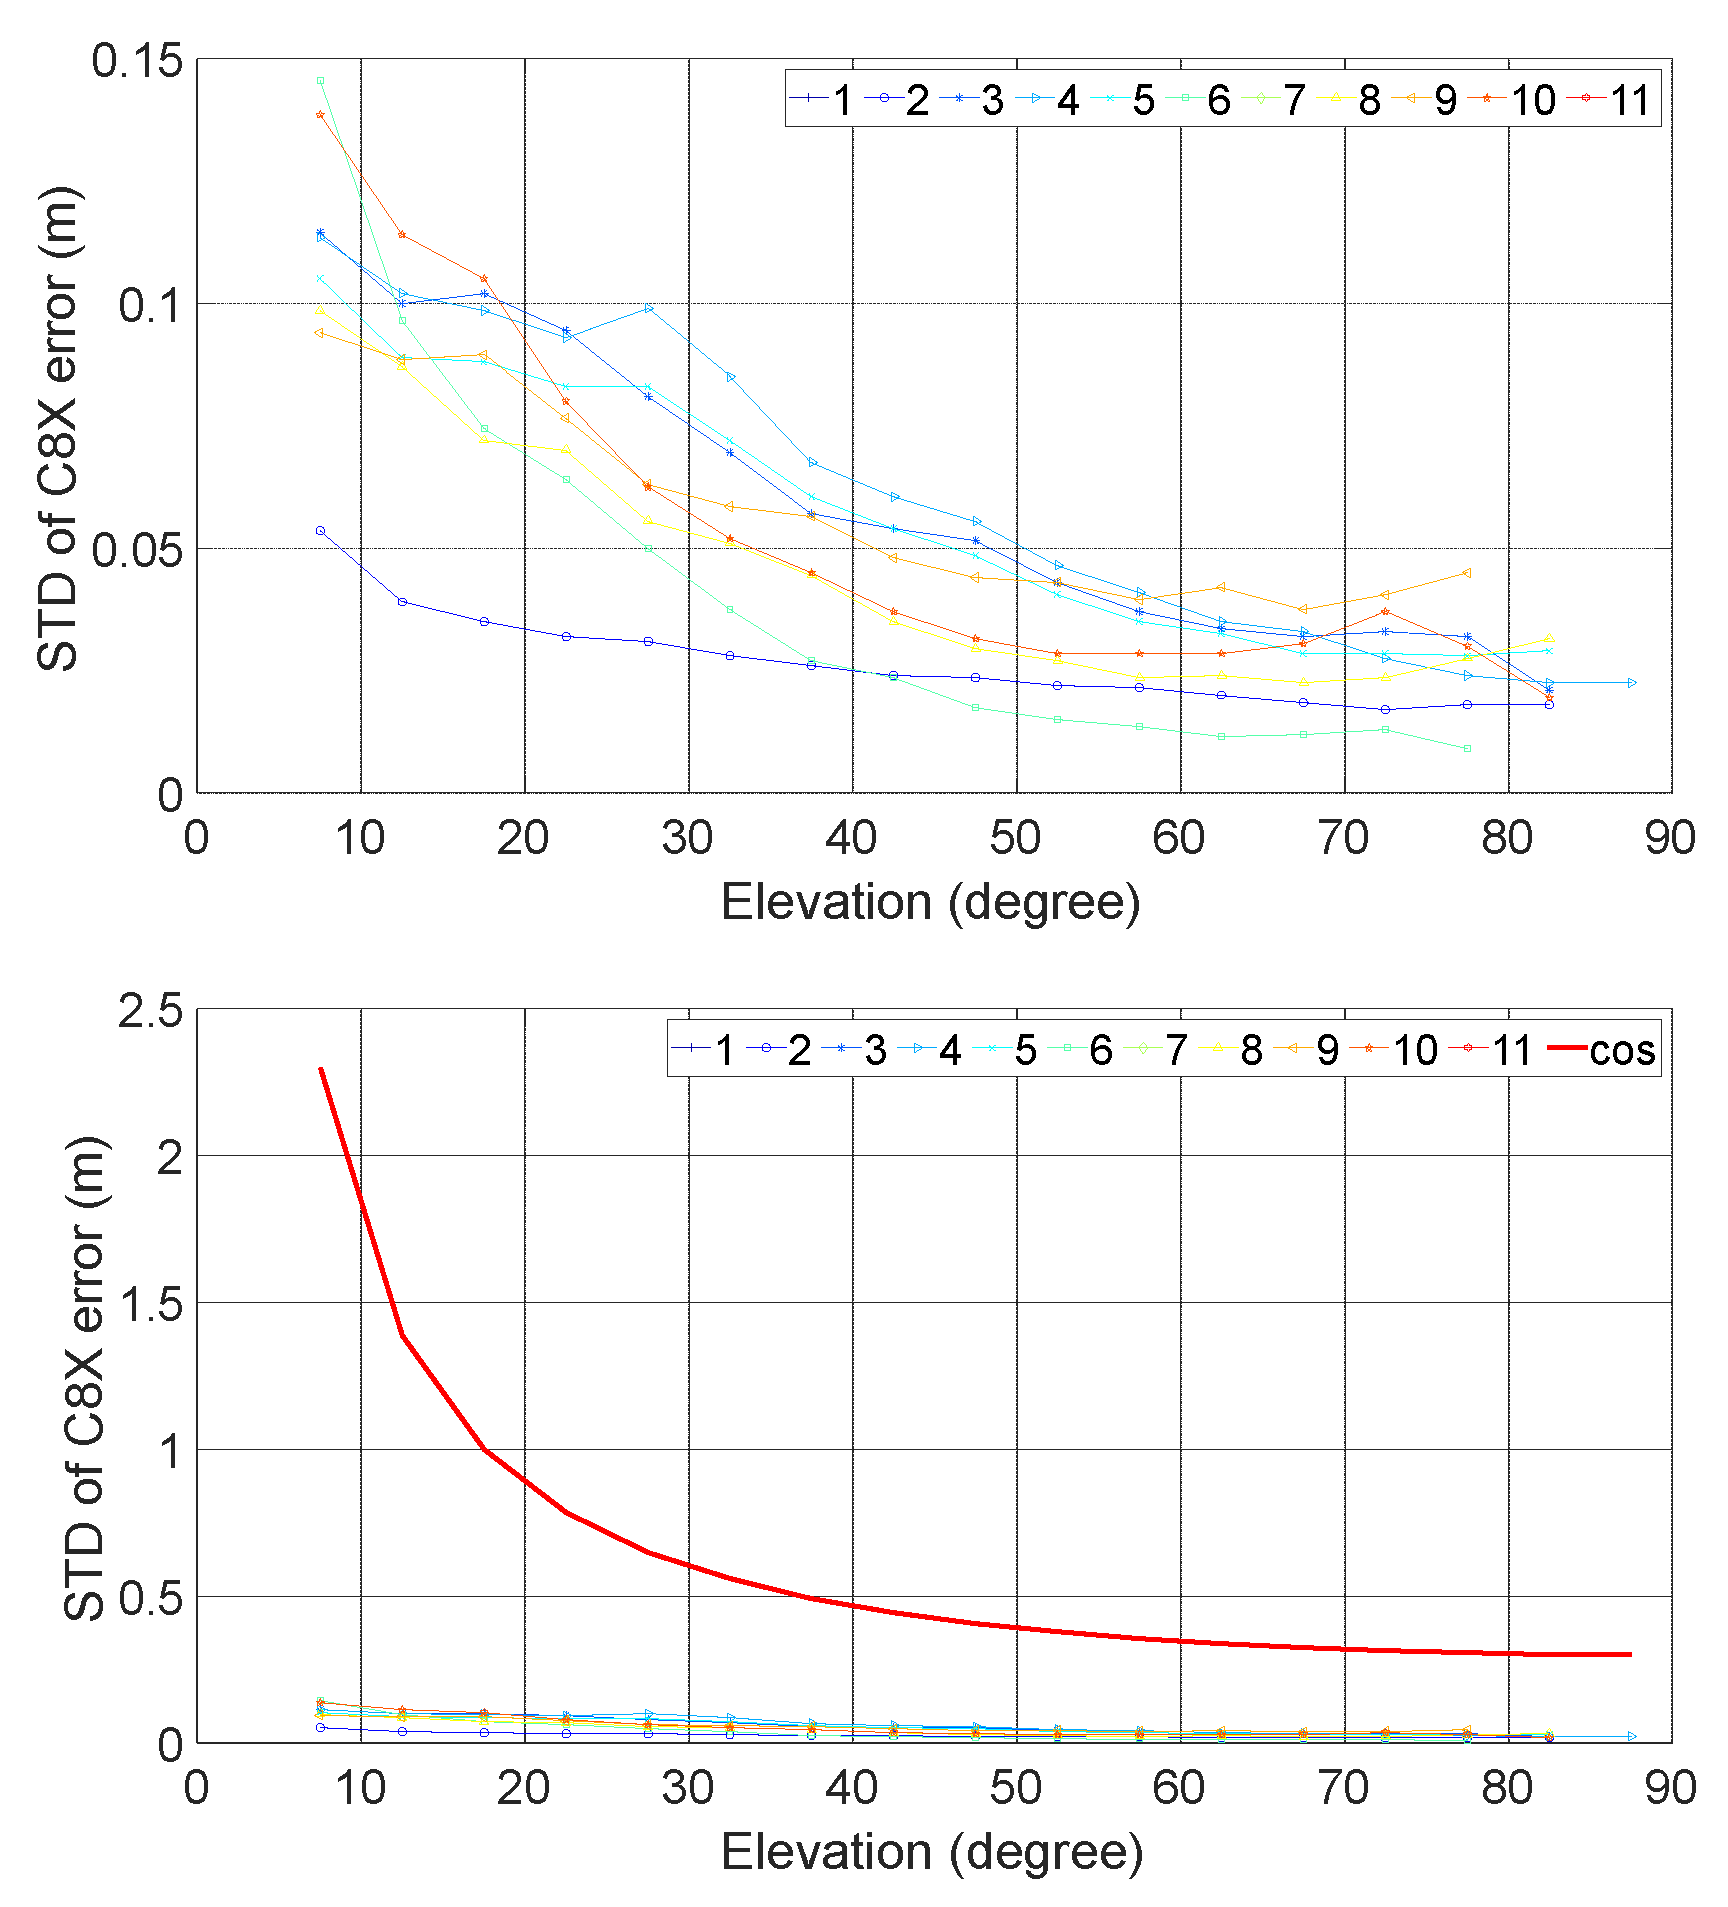
3.2.2.5. C8X
Figure 10 illustrates the results of C8X of Galileo. They are like that of the other code types with the STD varying insignificantly among the different baselines tested and this rate of increase with decreasing elevation noticeably less steep than that of
.
At high elevations, all the observed STD is less than 0.05 m and the smallest one is approximately 0.02 m. At low elevations, the range extends from a minimum of about 0.05 m to a maximum no more than 0.15 m. Baseline No. 6 exhibits the smallest STD, which correspond to a receiver type of SEPT POLARX5.
3.2.3. BeiDou
3.2.3.1. C2I
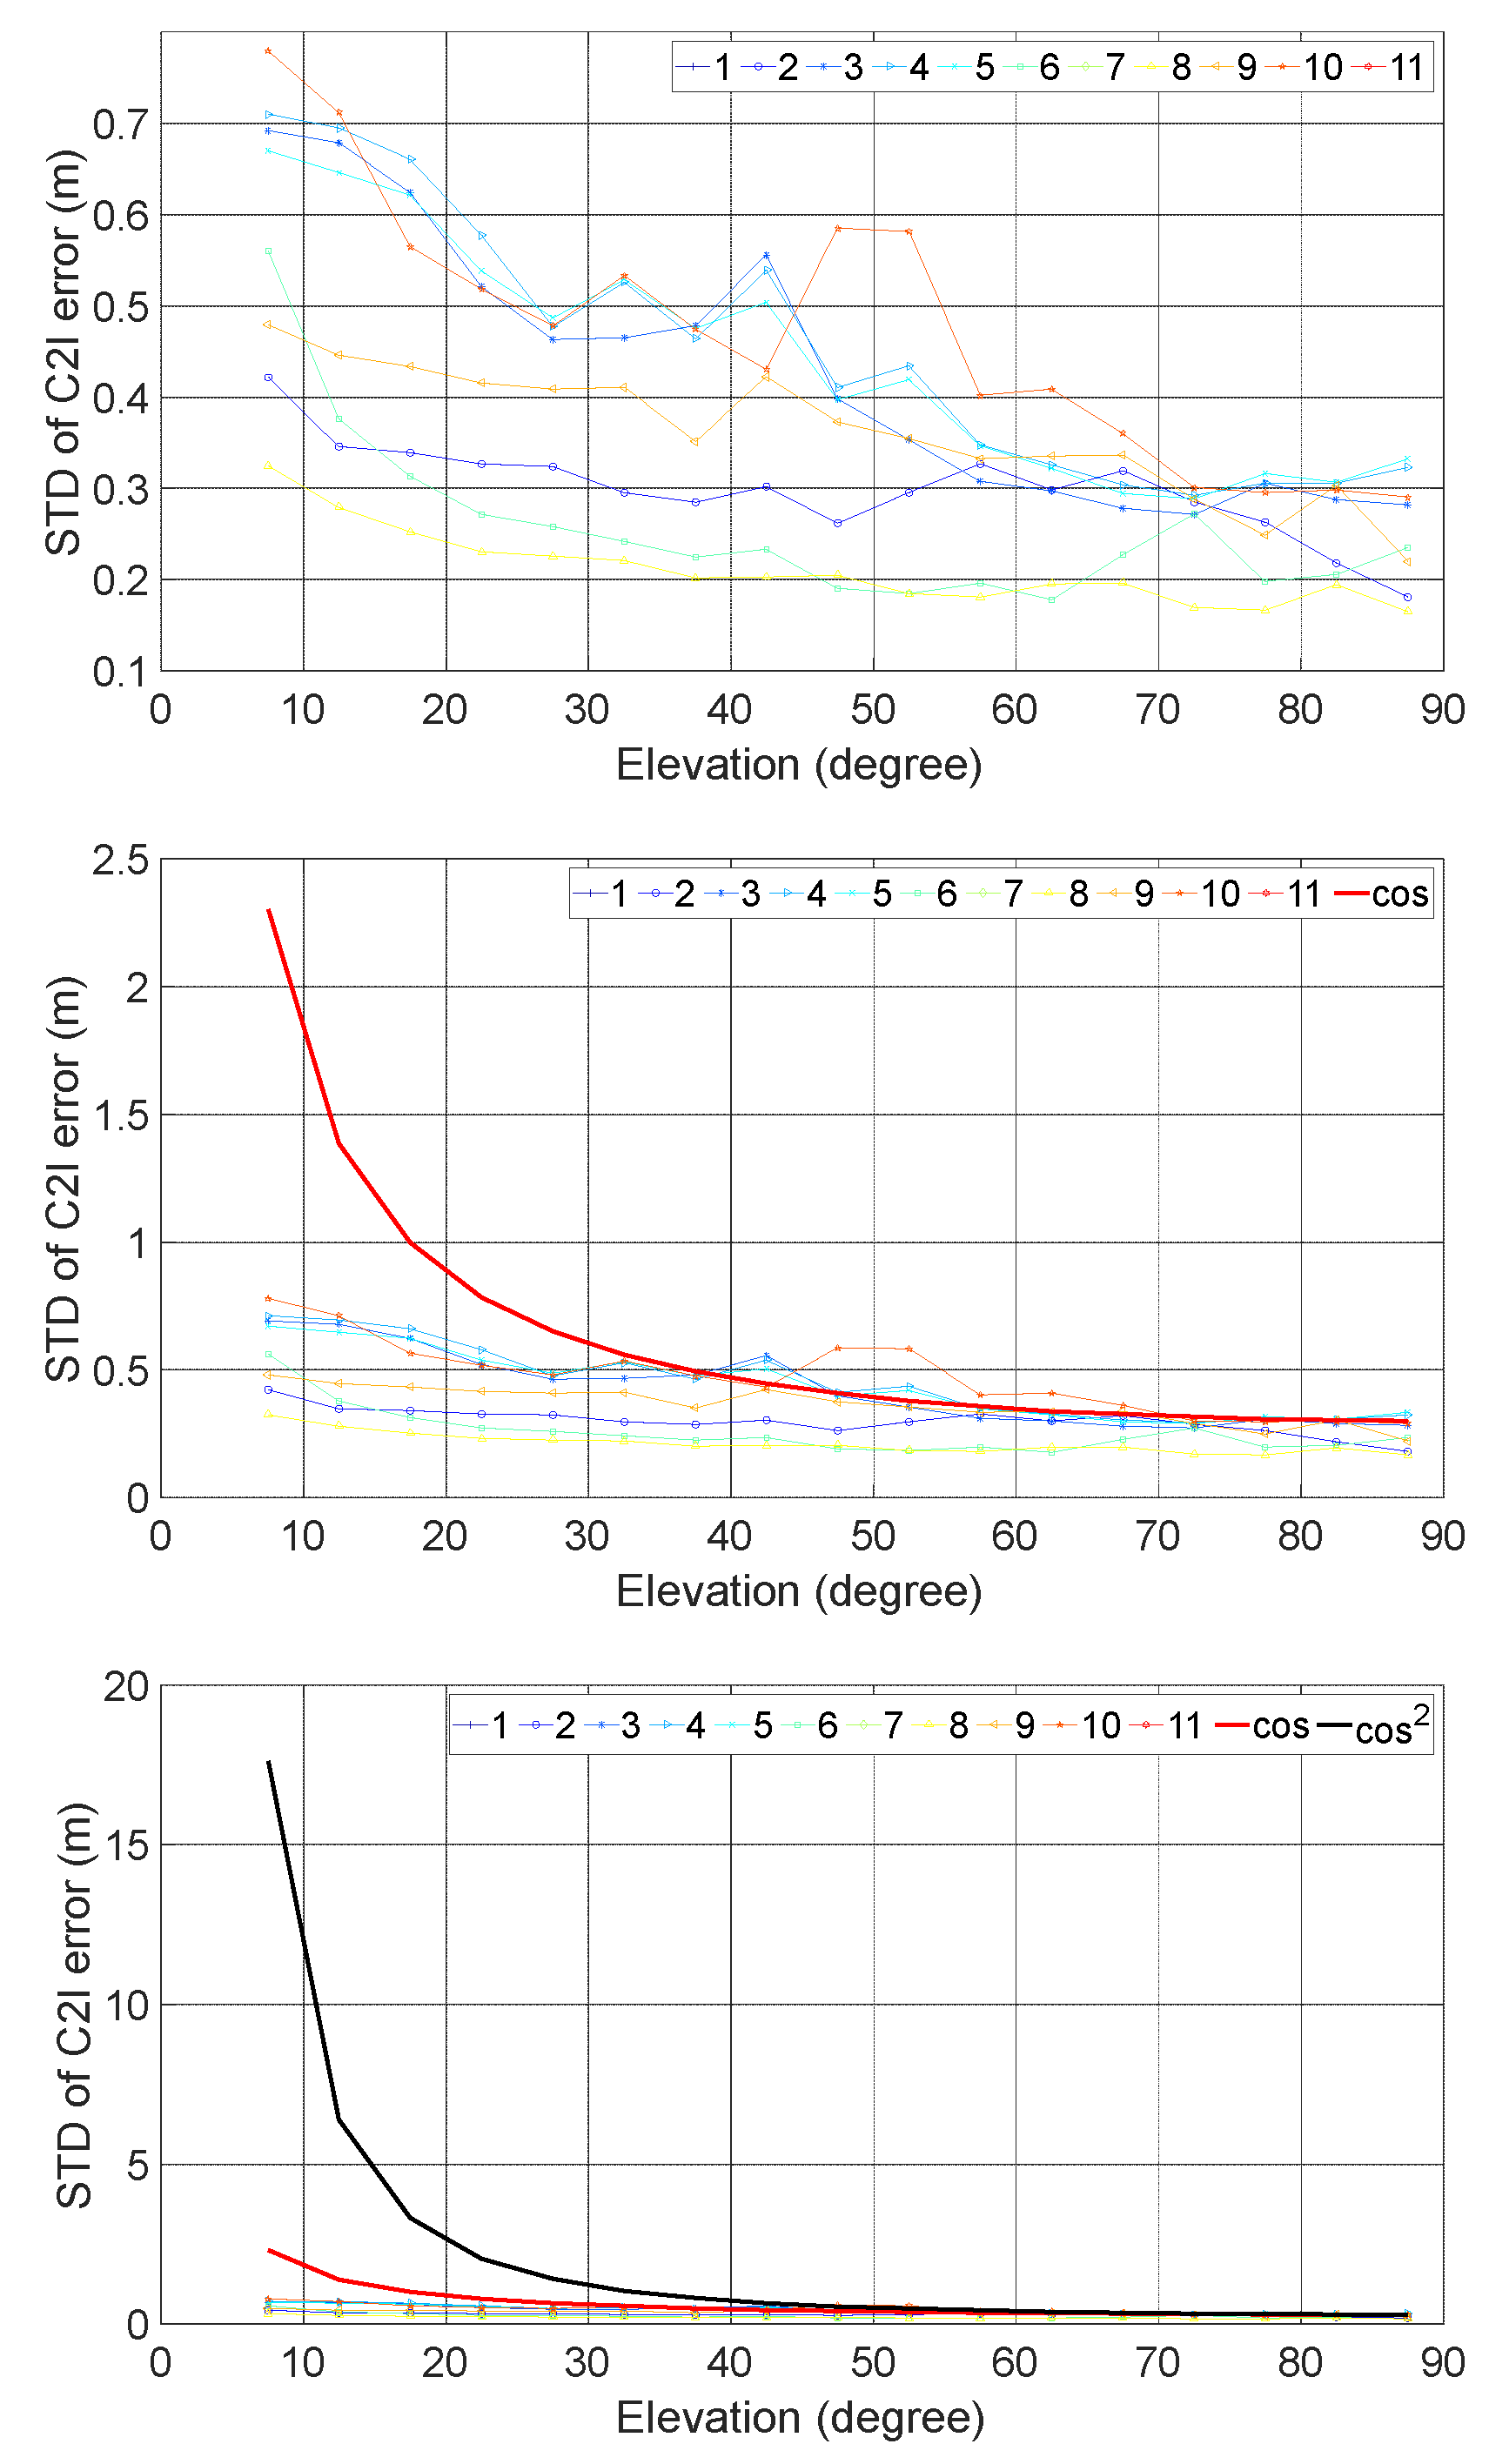
Figure 11 illustrates the results of C2I of BeiDou. They are like that of the other code types with the STD varying insignificantly among the different baselines tested and this rate of increase with decreasing elevation noticeably less steep than that of
.
At high elevations, the smallest observed STD is approximately 0.20 m, while the largest can reach about 0.30 m. At low elevations, the range extends from a minimum of about 0.30 m to a maximum of about 0.80 m. Baseline No. 8 exhibit the smallest STD, which corresponds to a receiver type of TRIMBLE ALLOY and SEPT ASTERX4.
3.2.3.2. C6I
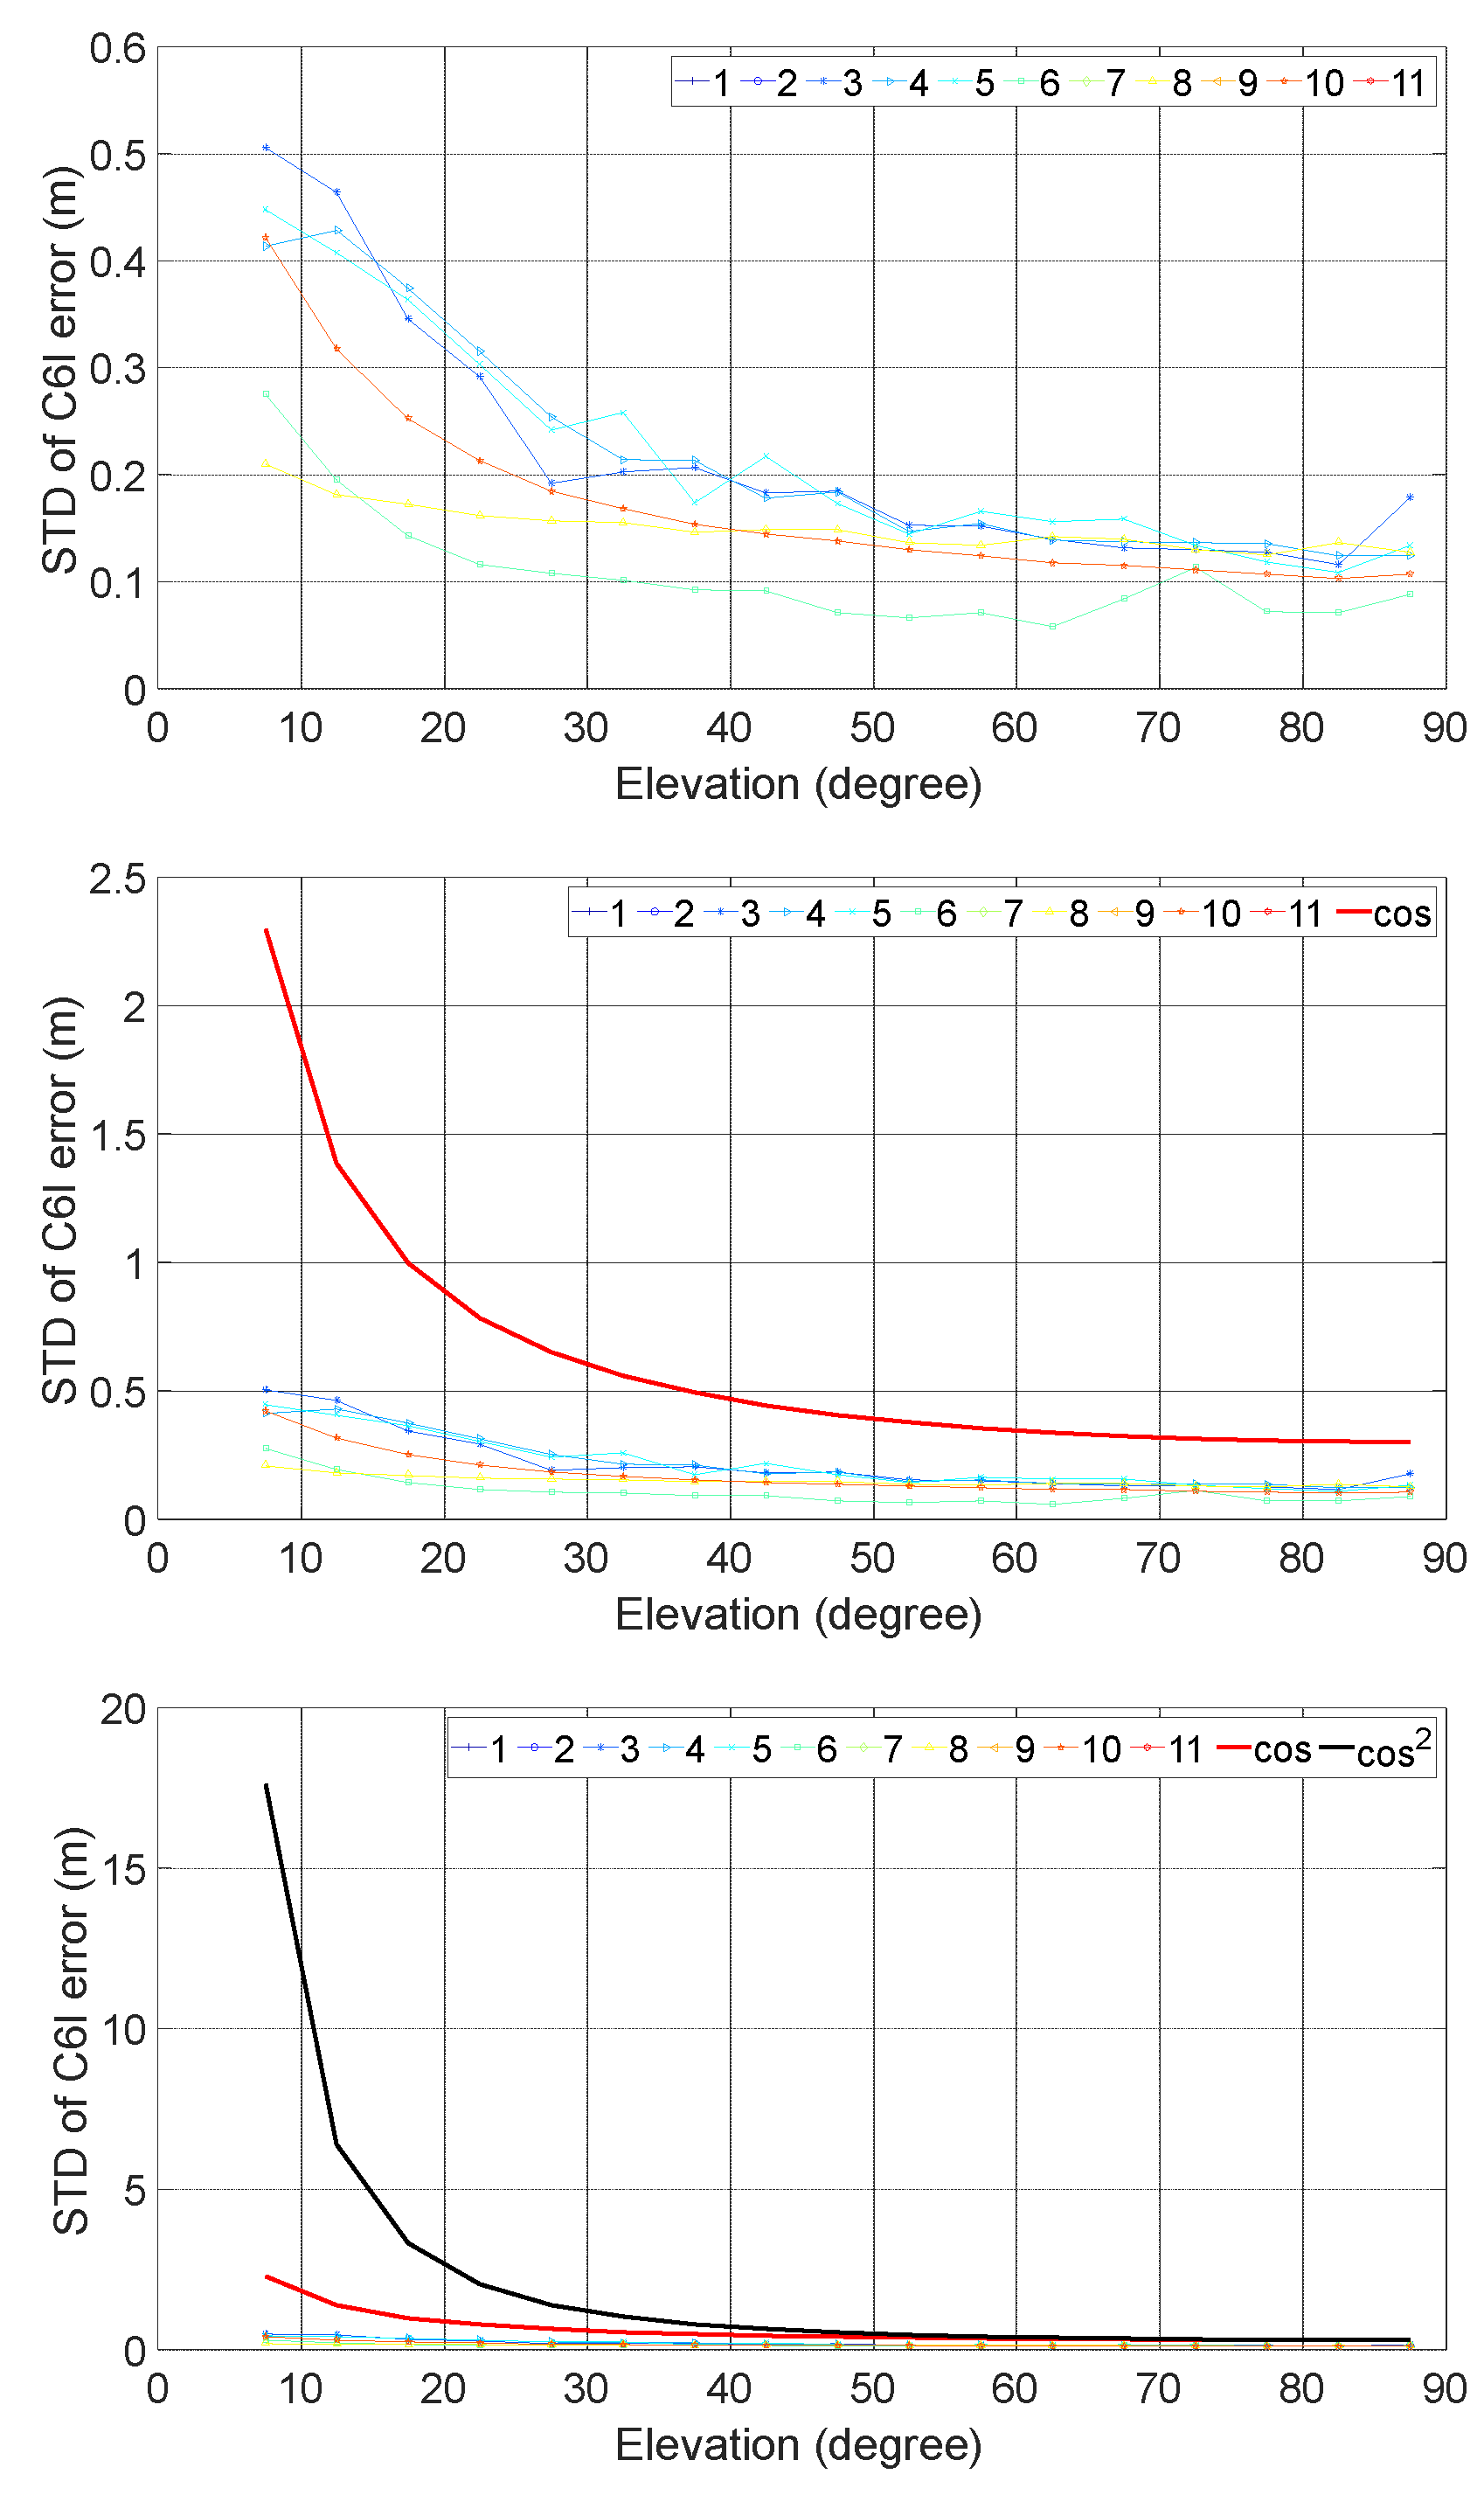
Figure 12 illustrates the results of C6I of BeiDou. They are like that of the other code types with the STD varying insignificantly among the different baselines tested and this rate of increase with decreasing elevation noticeably less steep than that of
.
At high elevations, the smallest observed STD is approximately 0.10 m, while the largest can reach about 0.15 m. At low elevations, the range extends from a minimum of about 0.30 m to a maximum of about 0.50 m. Baseline No. 6 exhibit the smallest STD, which corresponds to a receiver type of SEPT POLARX5.
3.2.3.3. C7I
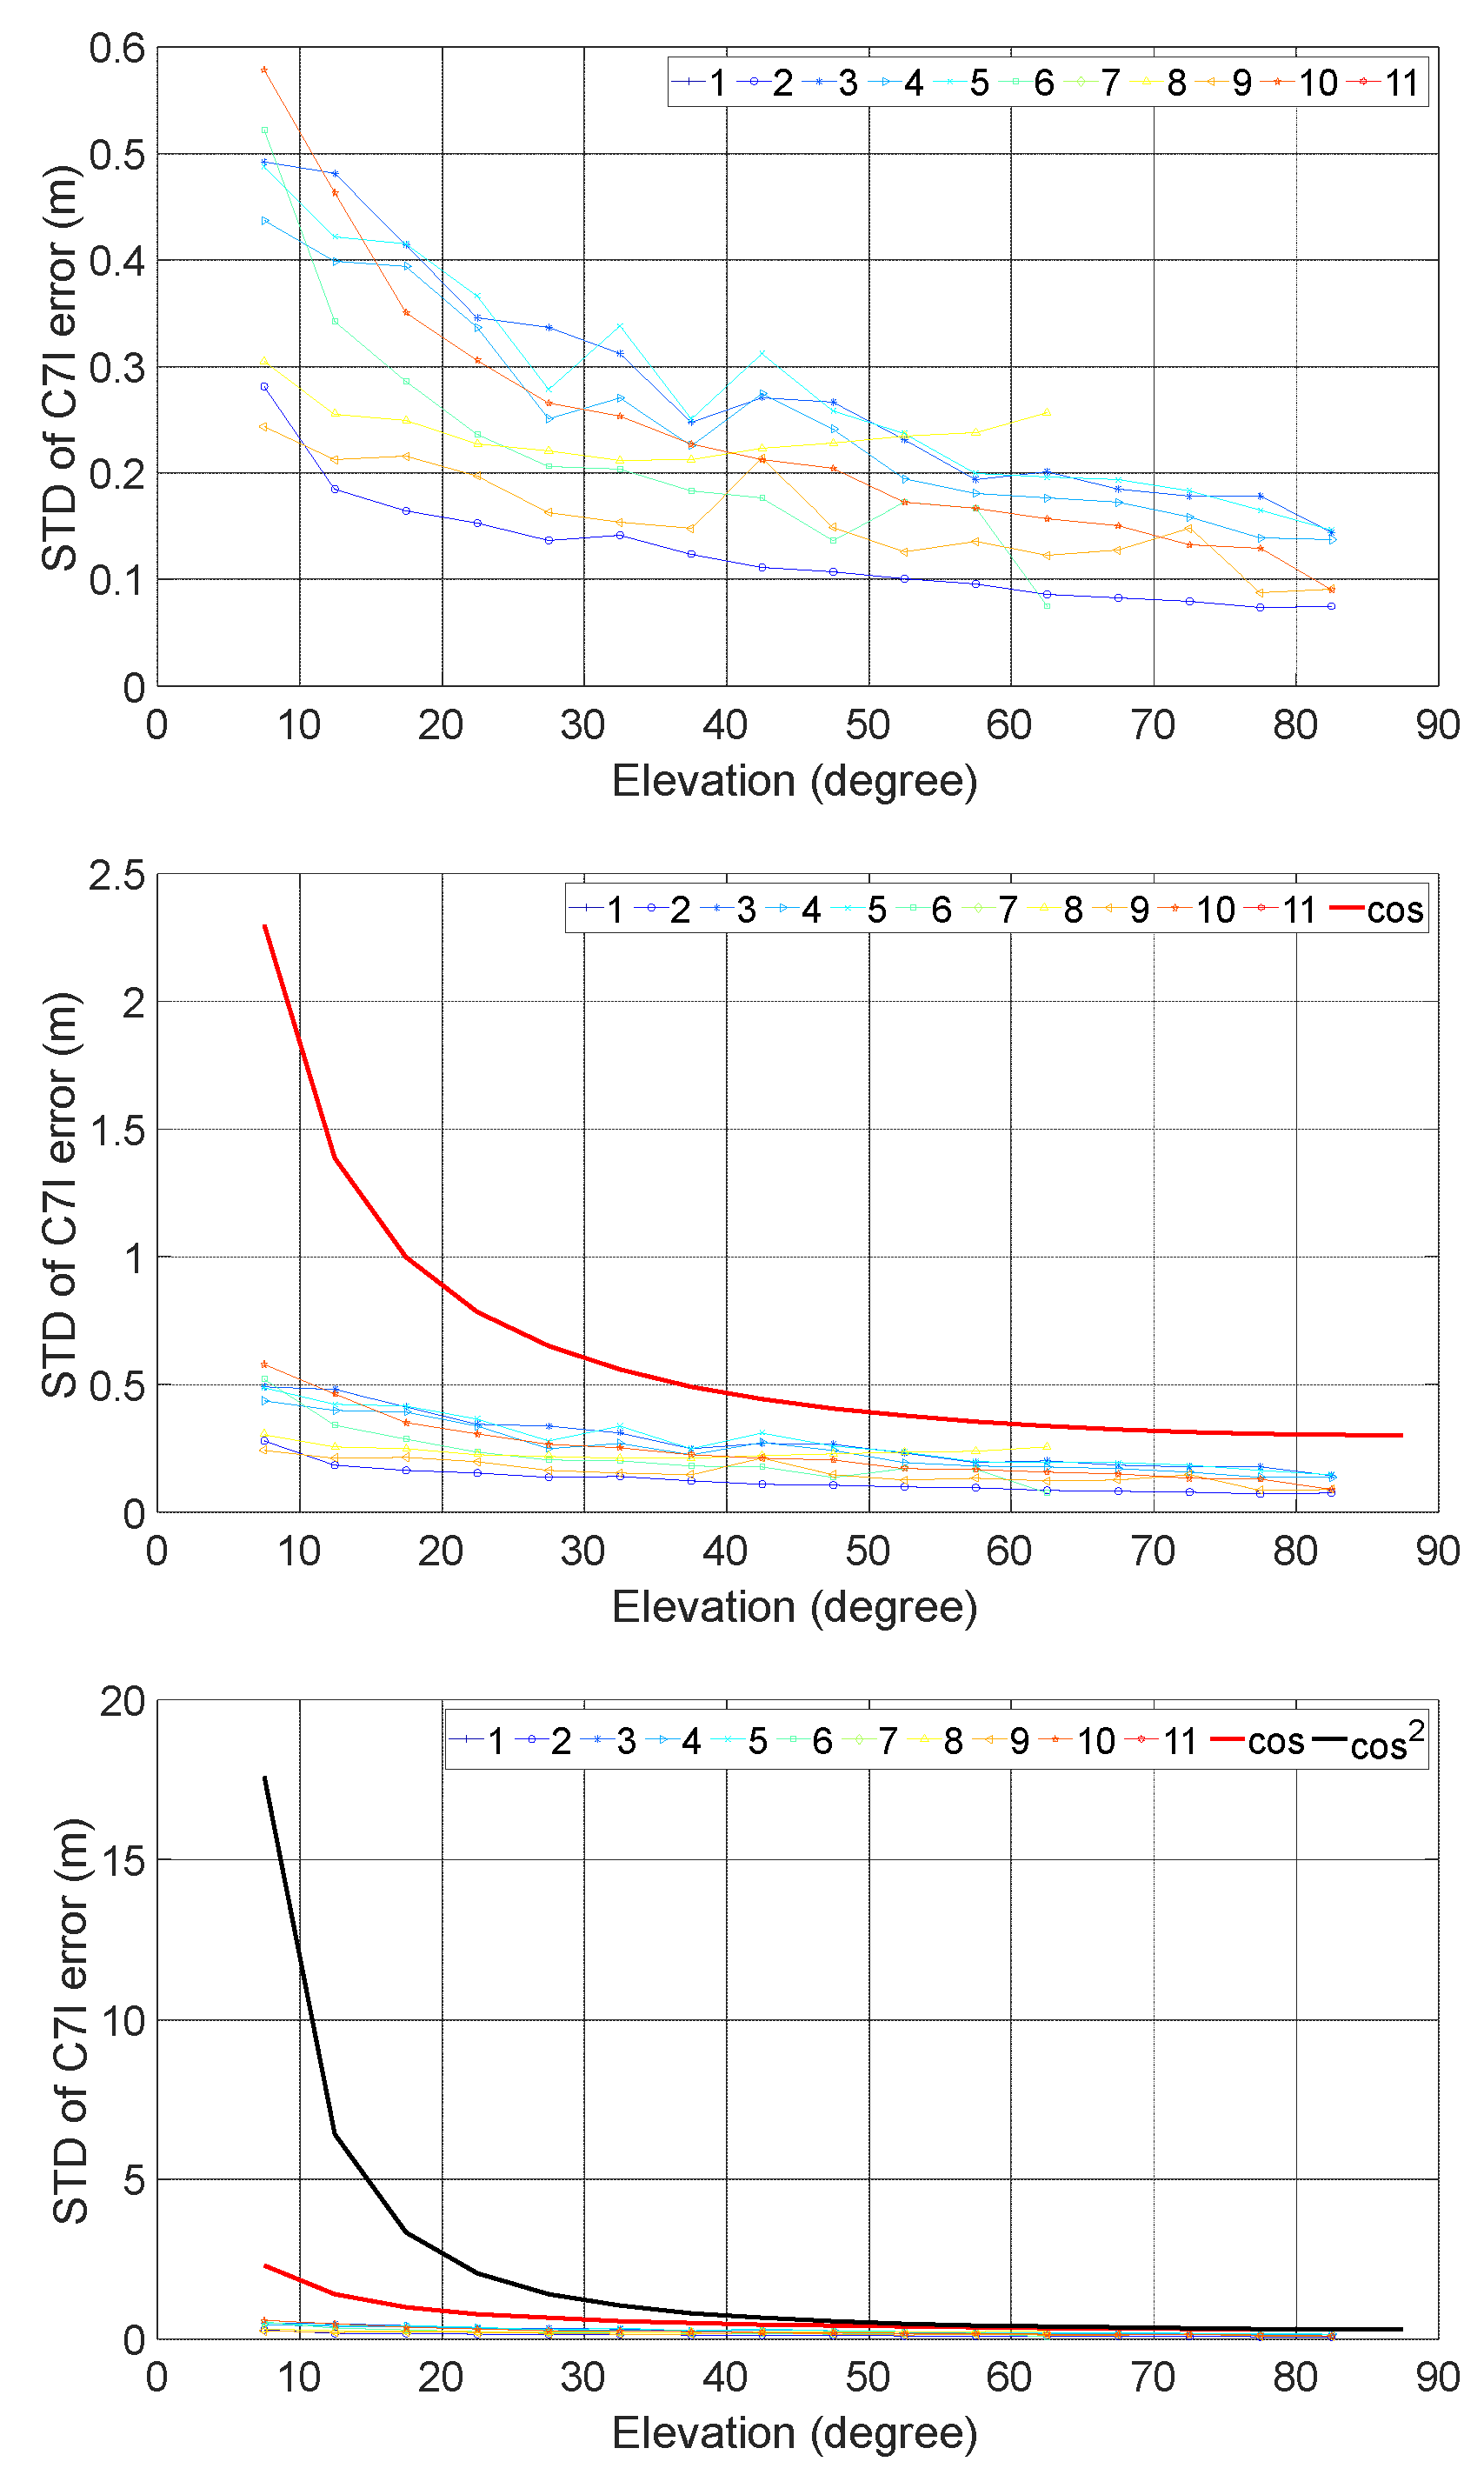
Figure 13 illustrates the results of C7I of BeiDou. They are like that of the other code types with the STD varying insignificantly among the different baselines tested and this rate of increase with decreasing elevation noticeably less steep than that of
.
At high elevations, the smallest observed STD is approximately 0.10 m, while the largest can reach about 0.20 m. At low elevations, the range extends from a minimum of about 0.25 m to a maximum of about 0.60 m. Baseline No. 2 exhibit the smallest STD, which corresponds to receiver types of TRIMBLE ALLOY and SEPT POLARX5.
3.2.3.4. Comparison among different GNSS systems and different frequency bands
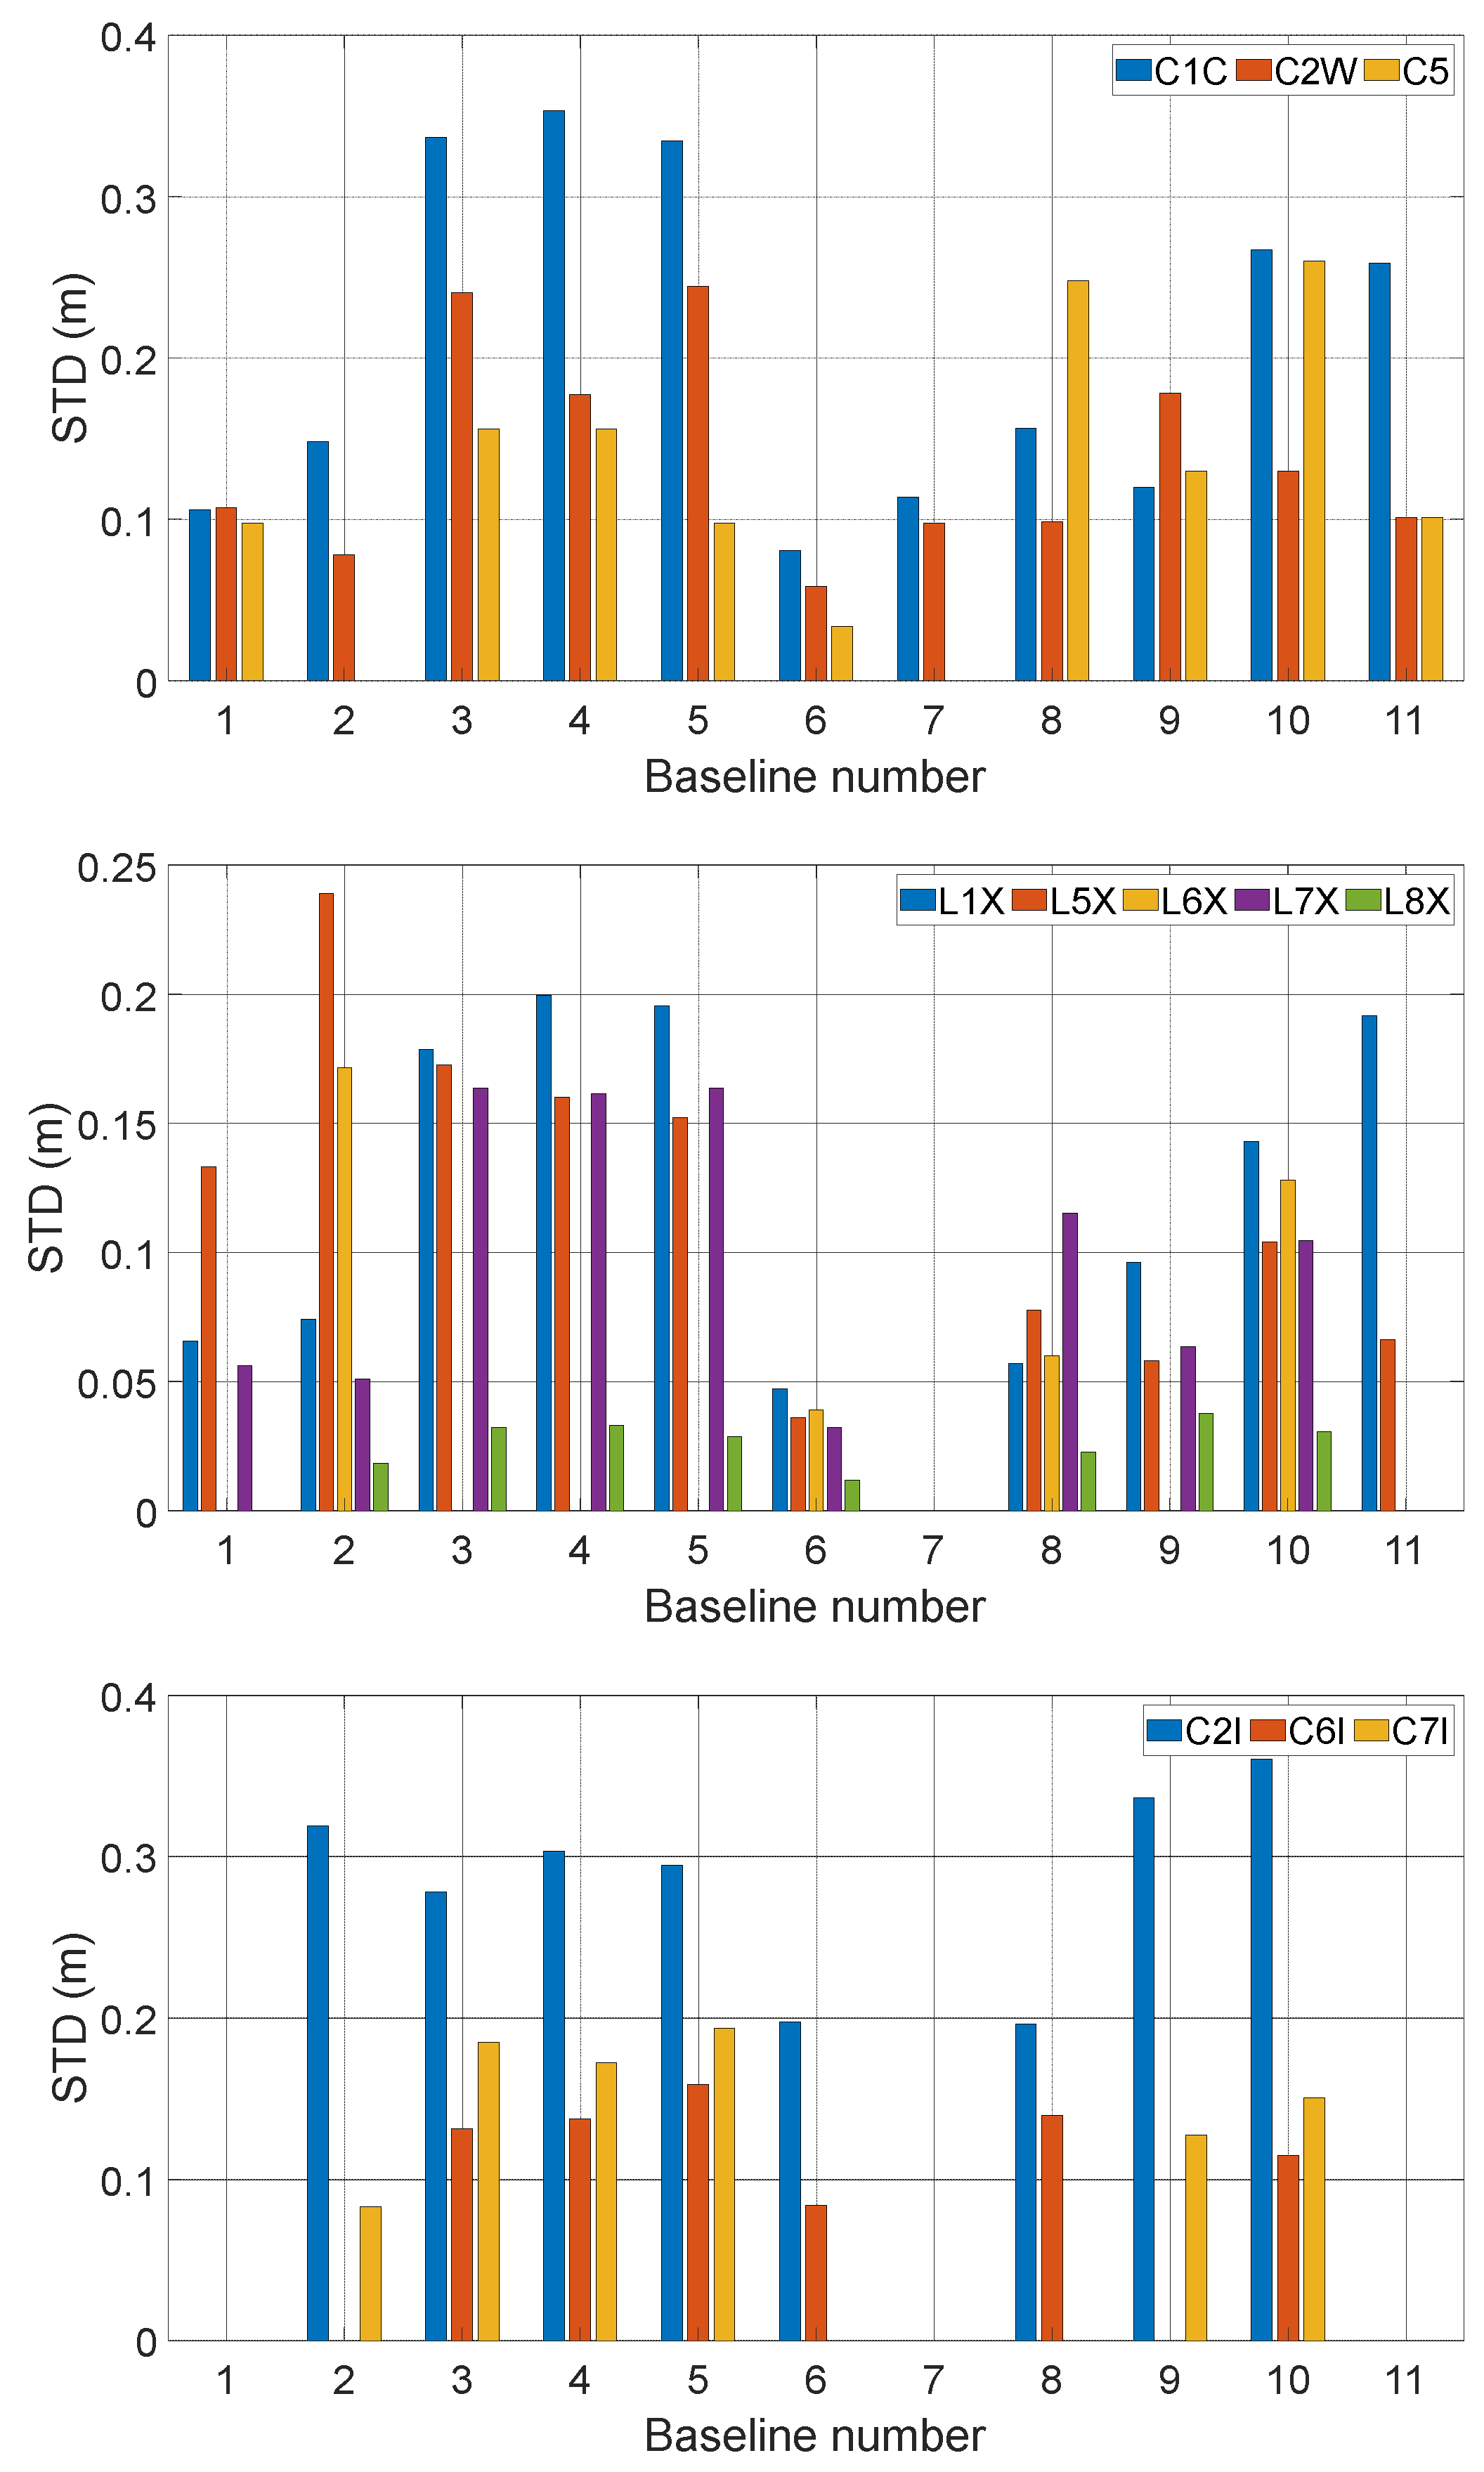
This section is dedicated to comparing the performance across different GNSS systems and their respective frequency bands. The STD may not provide an accurate representation for elevation greater than 70° due to a scarcity of samples. Therefore, the STD within the elevation range of 65° to 70° has been chosen for this comparative analysis.
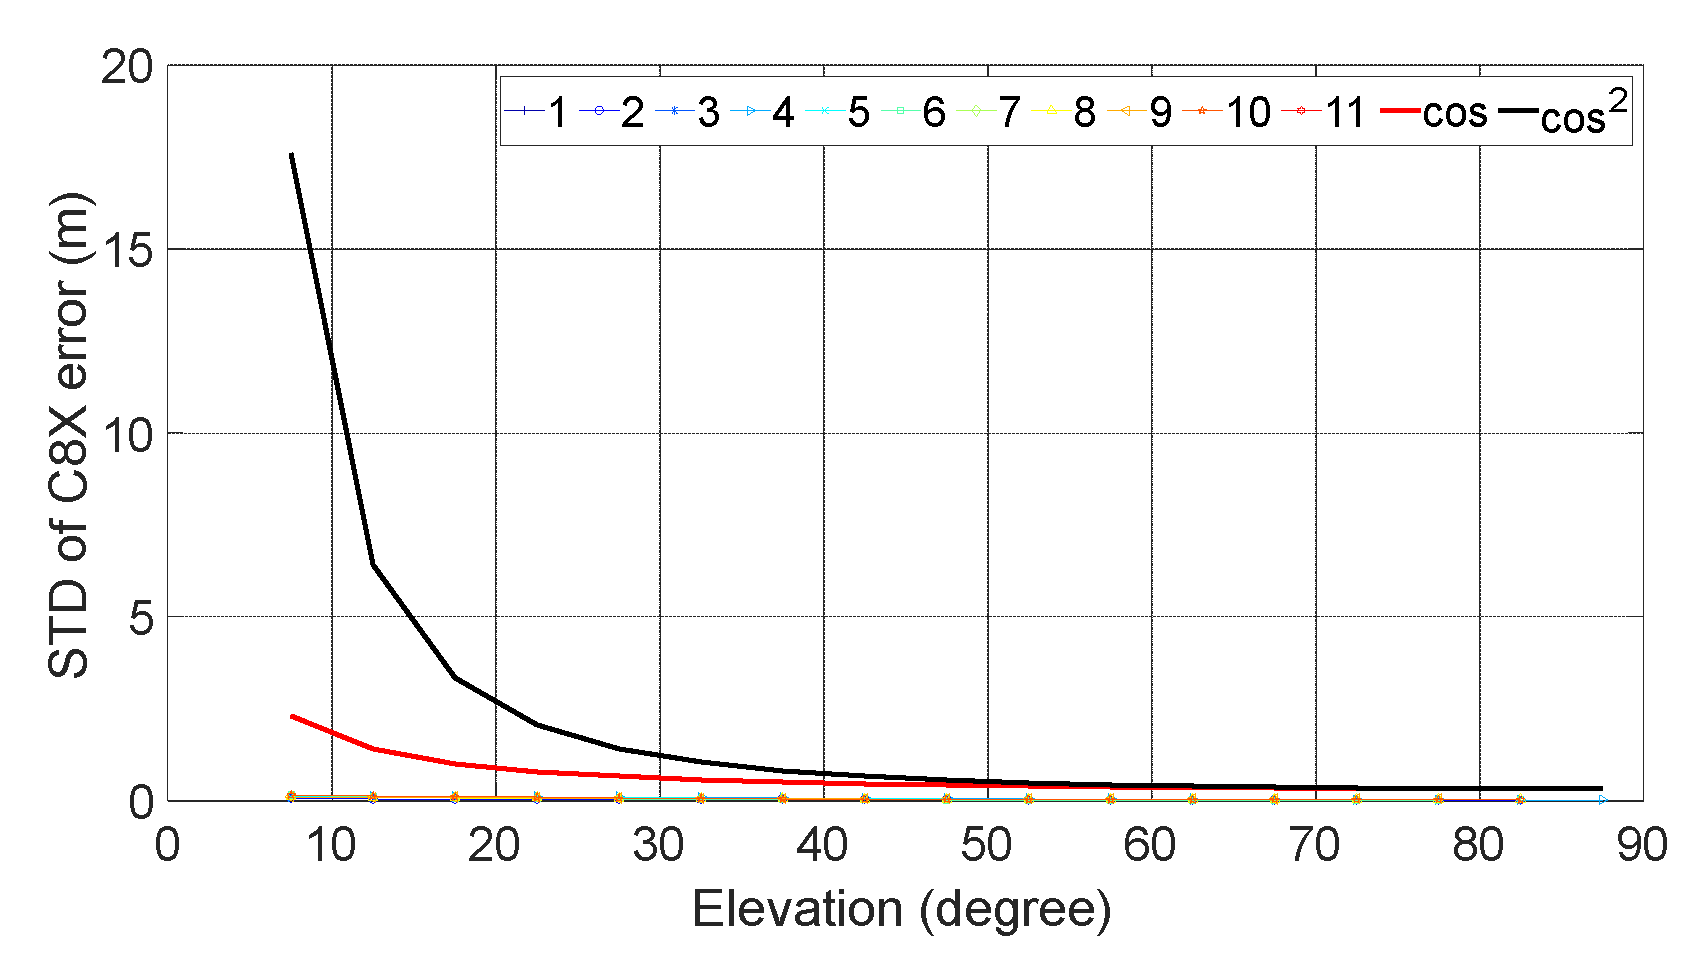
Figure 14 illustrates the STD for various frequency bands of GPS, Galileo and BeiDou systems. For the GPS system, the STD of C1C is typically the largest, around 0.30 m, while the STDs for C2W and C5 are more comparable, around 0.20 m. Within the Galileo system, C8X exhibits the smallest STD, only around 2.5 cm and the STD for the other frequency bands are around 0.15 m. As for the BeiDou system, C2I shows the largest STD, approximately 0.3 m, with the STDs for its other frequency bands around 0.15 m. Consequently, it is evident that the Galileo system demonstrates the lowest code observation noise among the evaluated GNSS systems.
3.2.3.5. Summary
The findings from the analysis reveal two key insights. Firstly, the levels of observation noise differ significantly across various baselines, GNSS systems, and frequency bands. This variability suggests that distinct stochastic models need to be tailored to accommodate the specific characteristics of different receiver types, GNSS systems, and frequency bands. Tailoring these models is essential to accurately reflect the unique noise behavior associated with each configuration.
Secondly, the minimum standard deviation (STD) observed is generally lower than the conventionally accepted code noise standard deviation of 0.3 meters. Furthermore, the rate at which the STD changes with respect to elevation is considerably less pronounced than what is predicted by current elevation-dependent weighting schemes. This discrepancy is particularly noticeable at lower elevation angles, below 30° or 40°. These findings indicate that the traditional assumptions regarding observation noise and its relationship with elevation may require revision to better align with empirical data, thereby enhancing the precision of GNSS navigation and positioning.
3.3. Phase Observation Noise
3.3.1. GPS
3.3.1.1. L1C
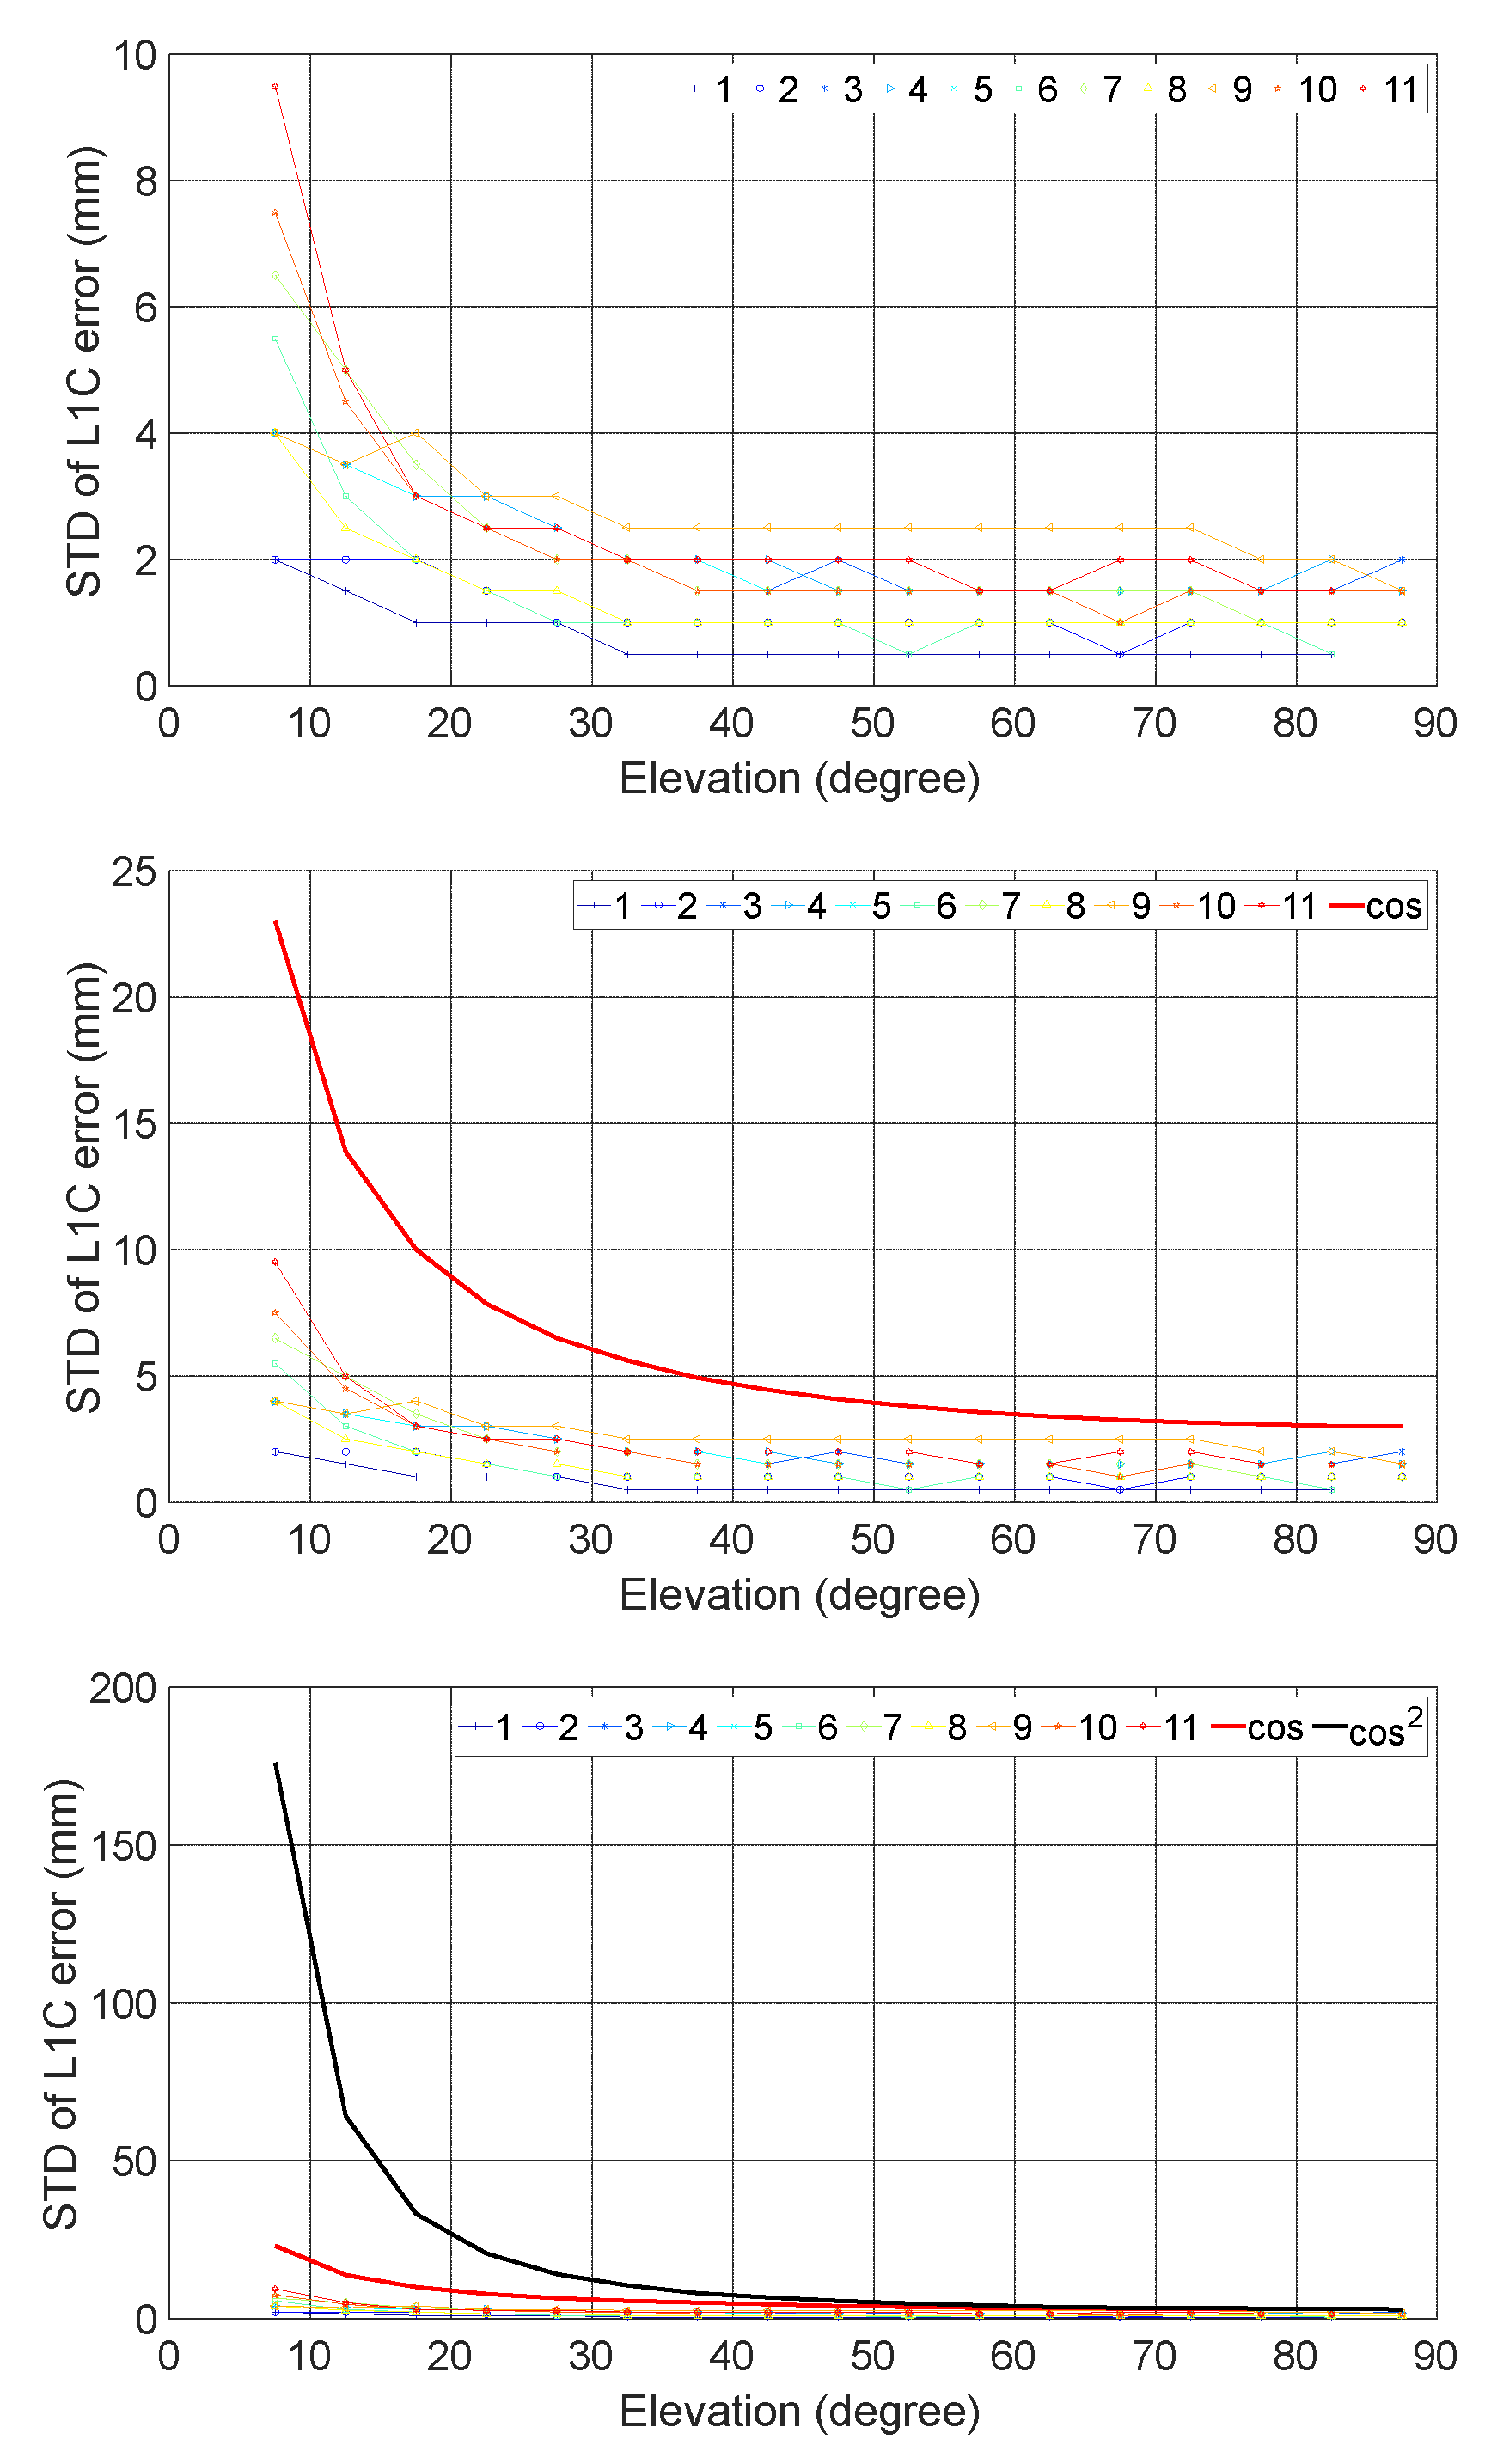
Figure 15 shows the results of L1C of GPS. At high elevation, the minimum one is only 0.5 mm, while the maximum is about 2.5 mm, which means that all STD are less than the popularly used STD of 3 mm. At low elevation, the minimum one is only about 2 mm, while the maximum can reach about 10 mm. Among these baselines, No. 1 has the smallest STD, which used receiver types of SEPT POLARX5TR and JAVAD TRE_G3TH. Also, the gradient is also obviously smaller than
, and much less than
, especially when elevation < 40°.
3.3.1.2. L2W
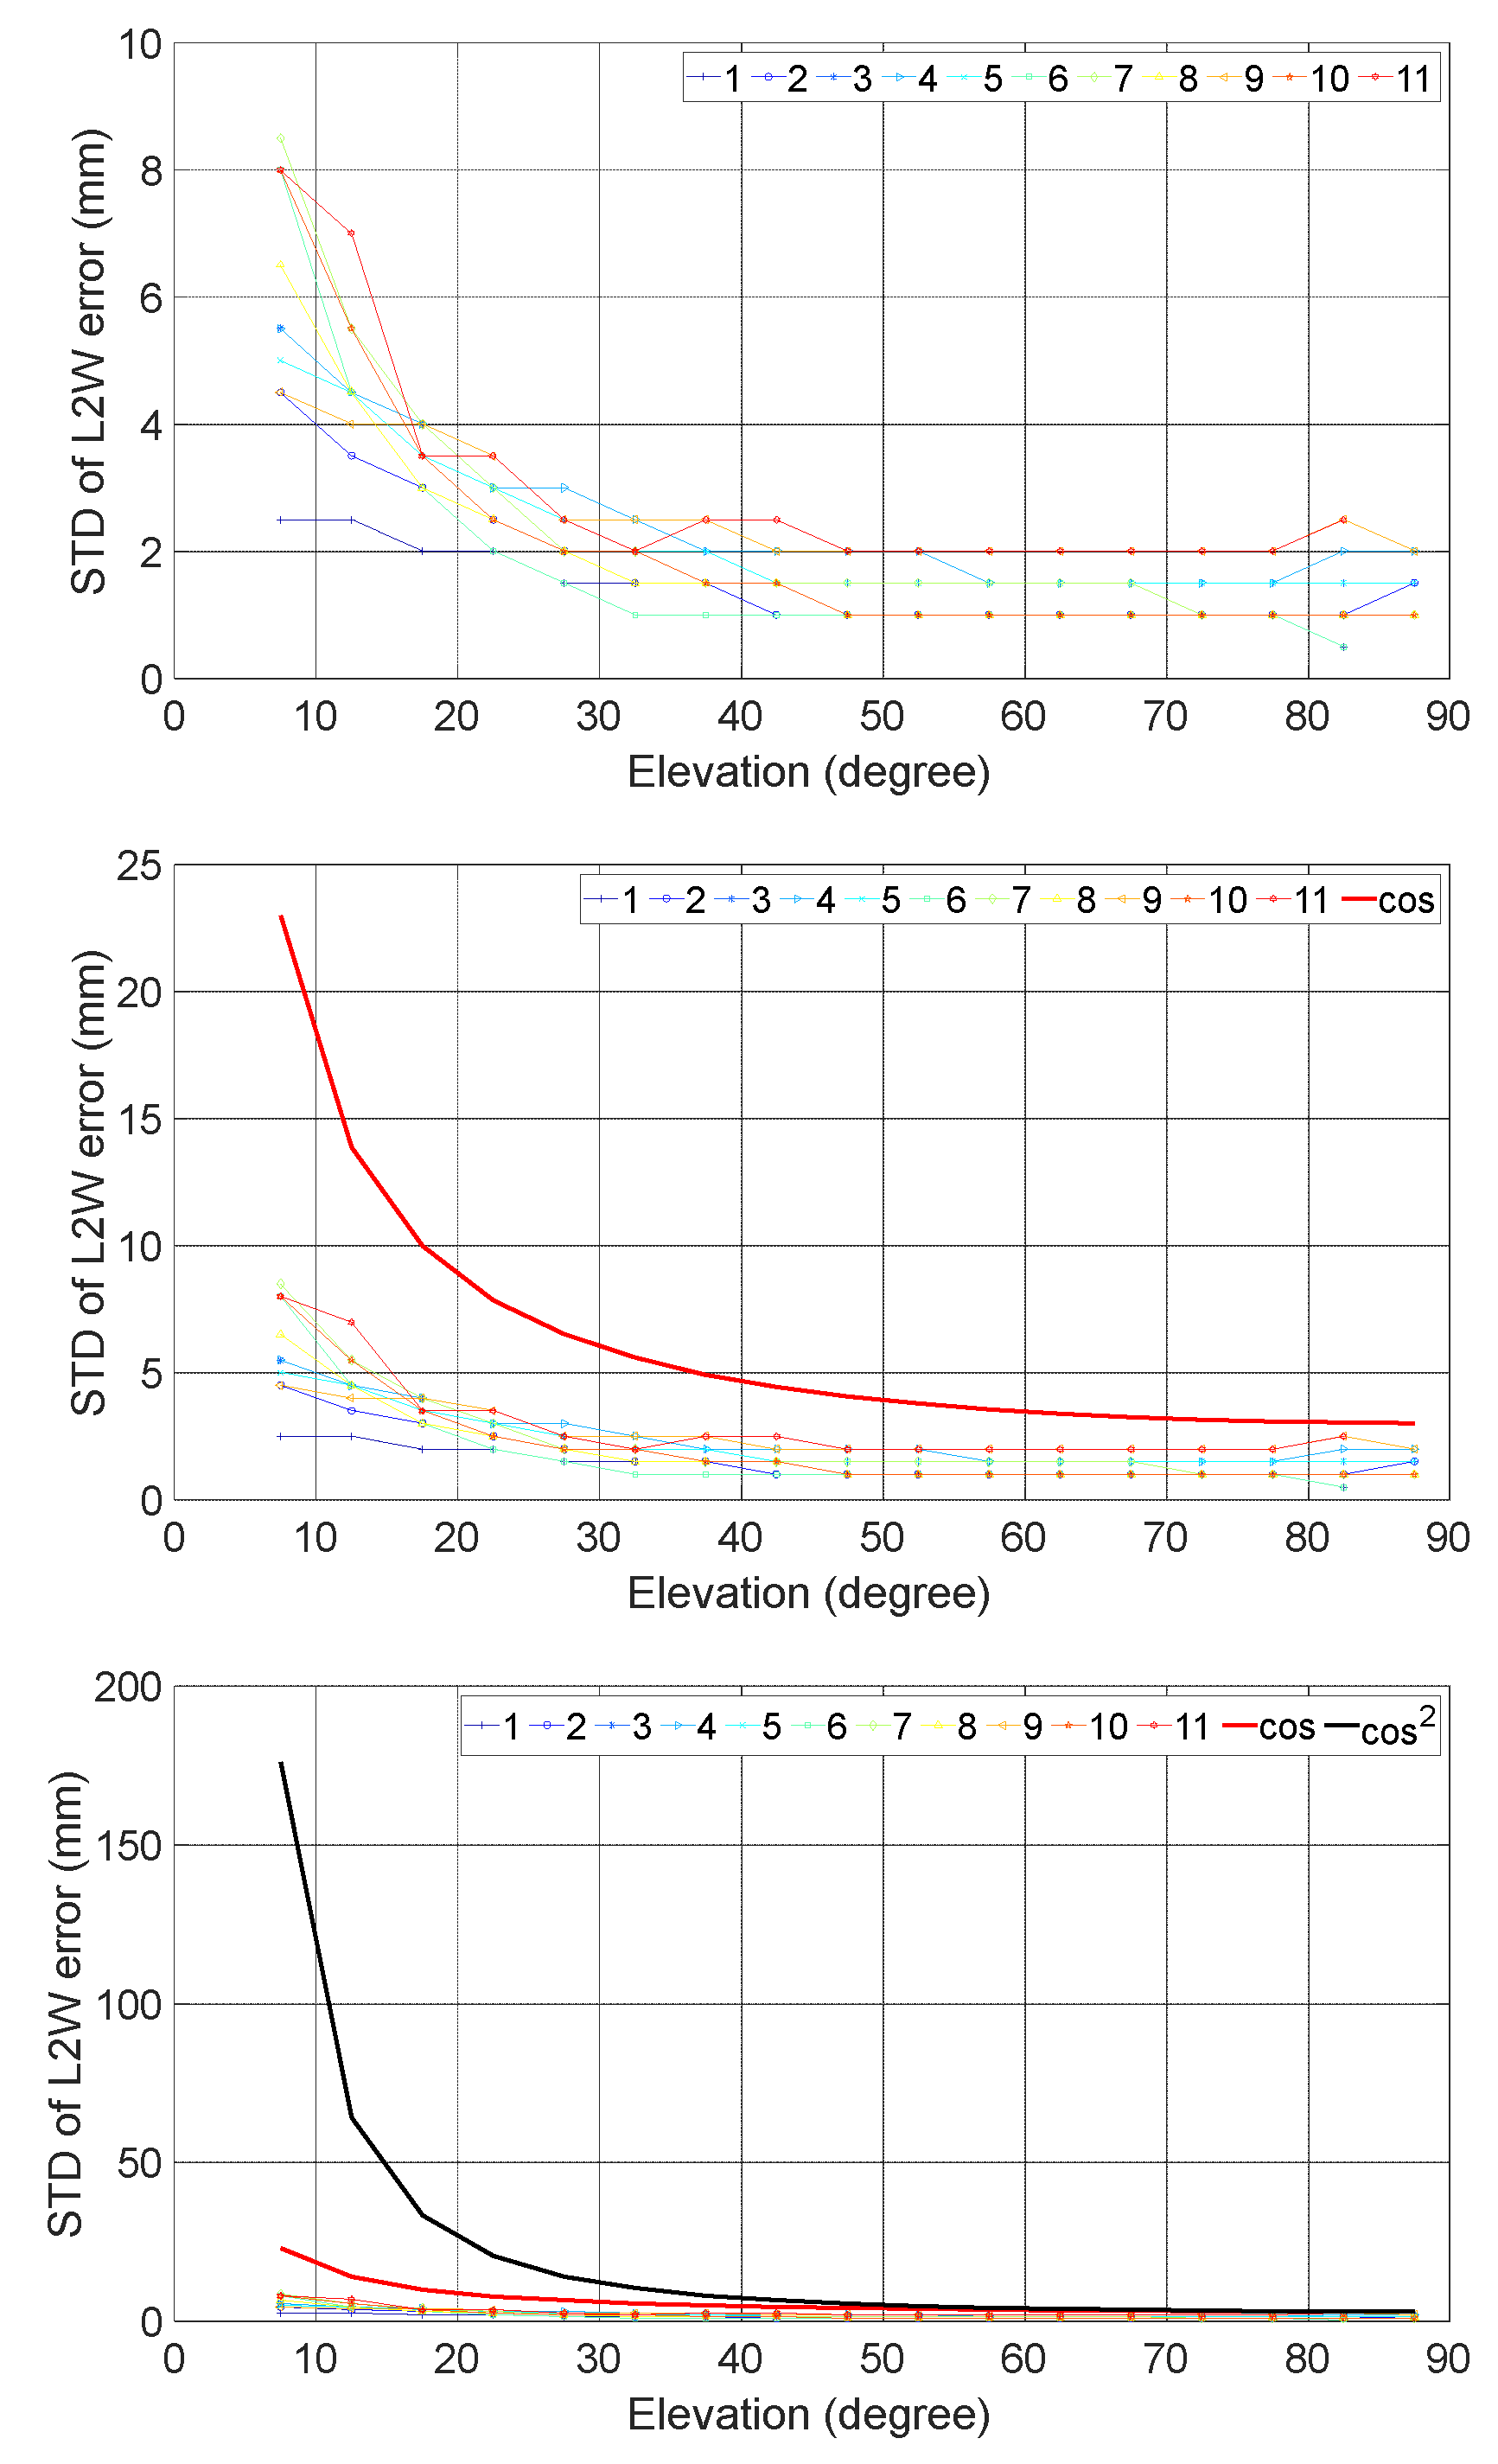
Figure 16 shows the results of L2W of GPS. At high elevation, the minimum one is about 1 mm, while the maximum is about 2 mm, which means that all STD are less than the popularly used STD of 3 mm. At low elevation, the minimum one is only about 2.5 mm, while the maximum can reach more than 8 mm. Among these baselines, No. 1 has the smallest STD, which used receiver types of SEPT POLARX5TR and JAVAD TRE_G3TH. Also, the gradient is also obviously smaller than
, and much less than
, especially when elevation < 40°.
3.3.1.3. L5
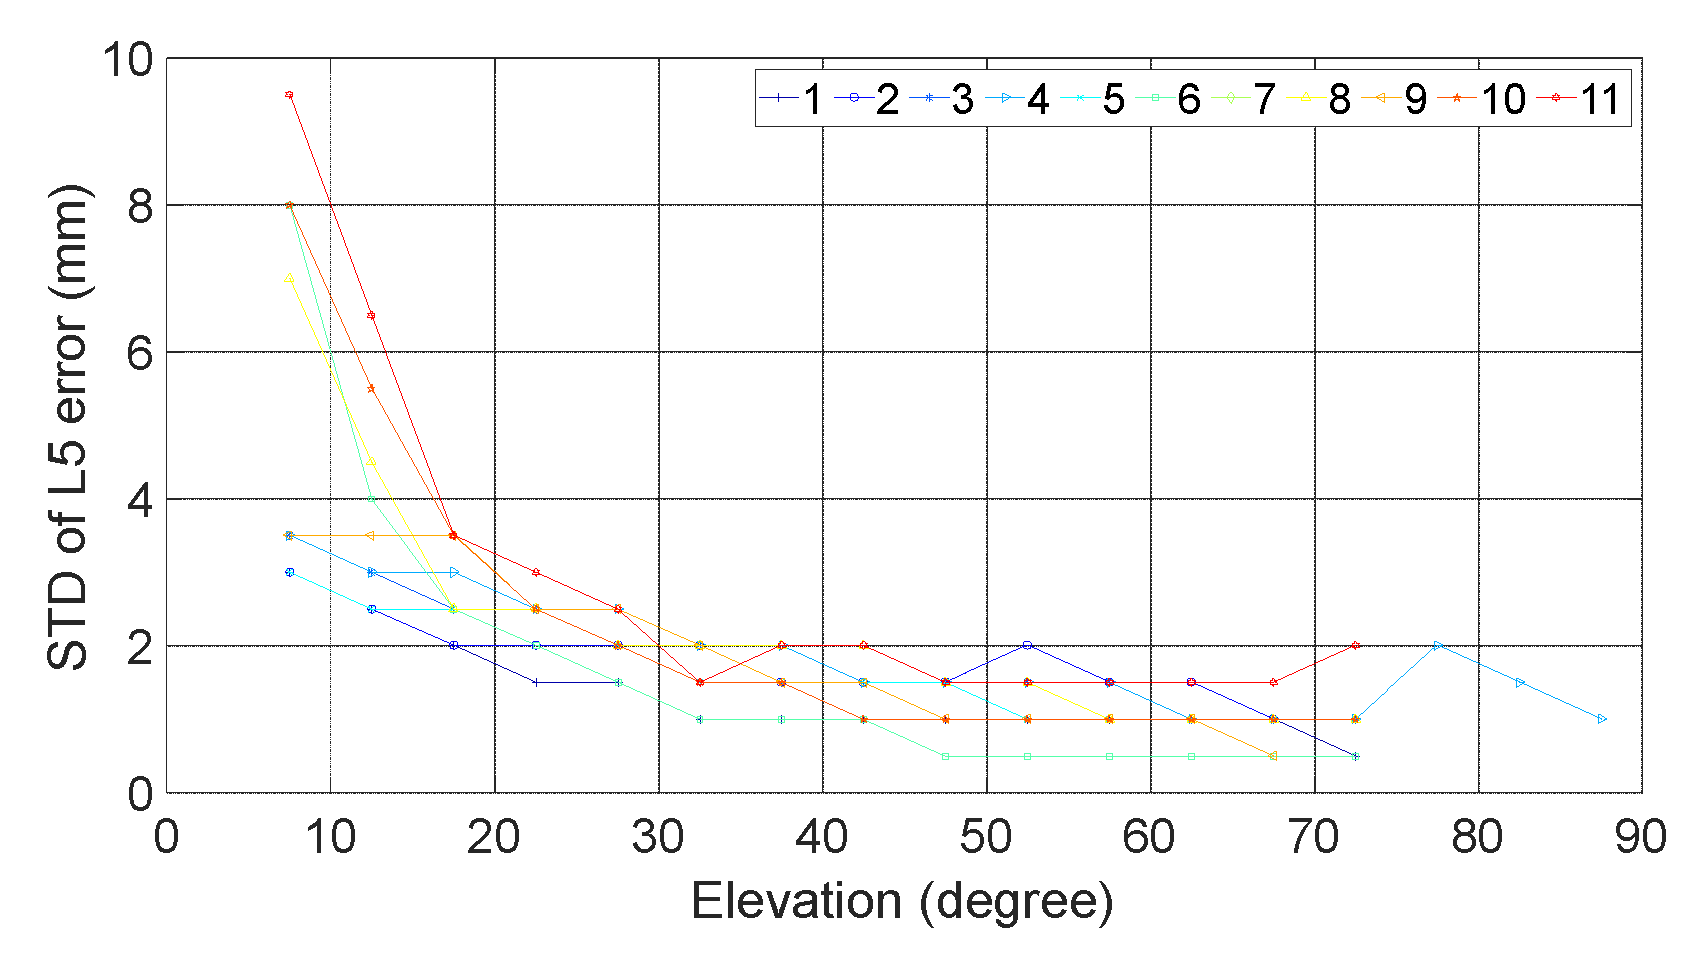
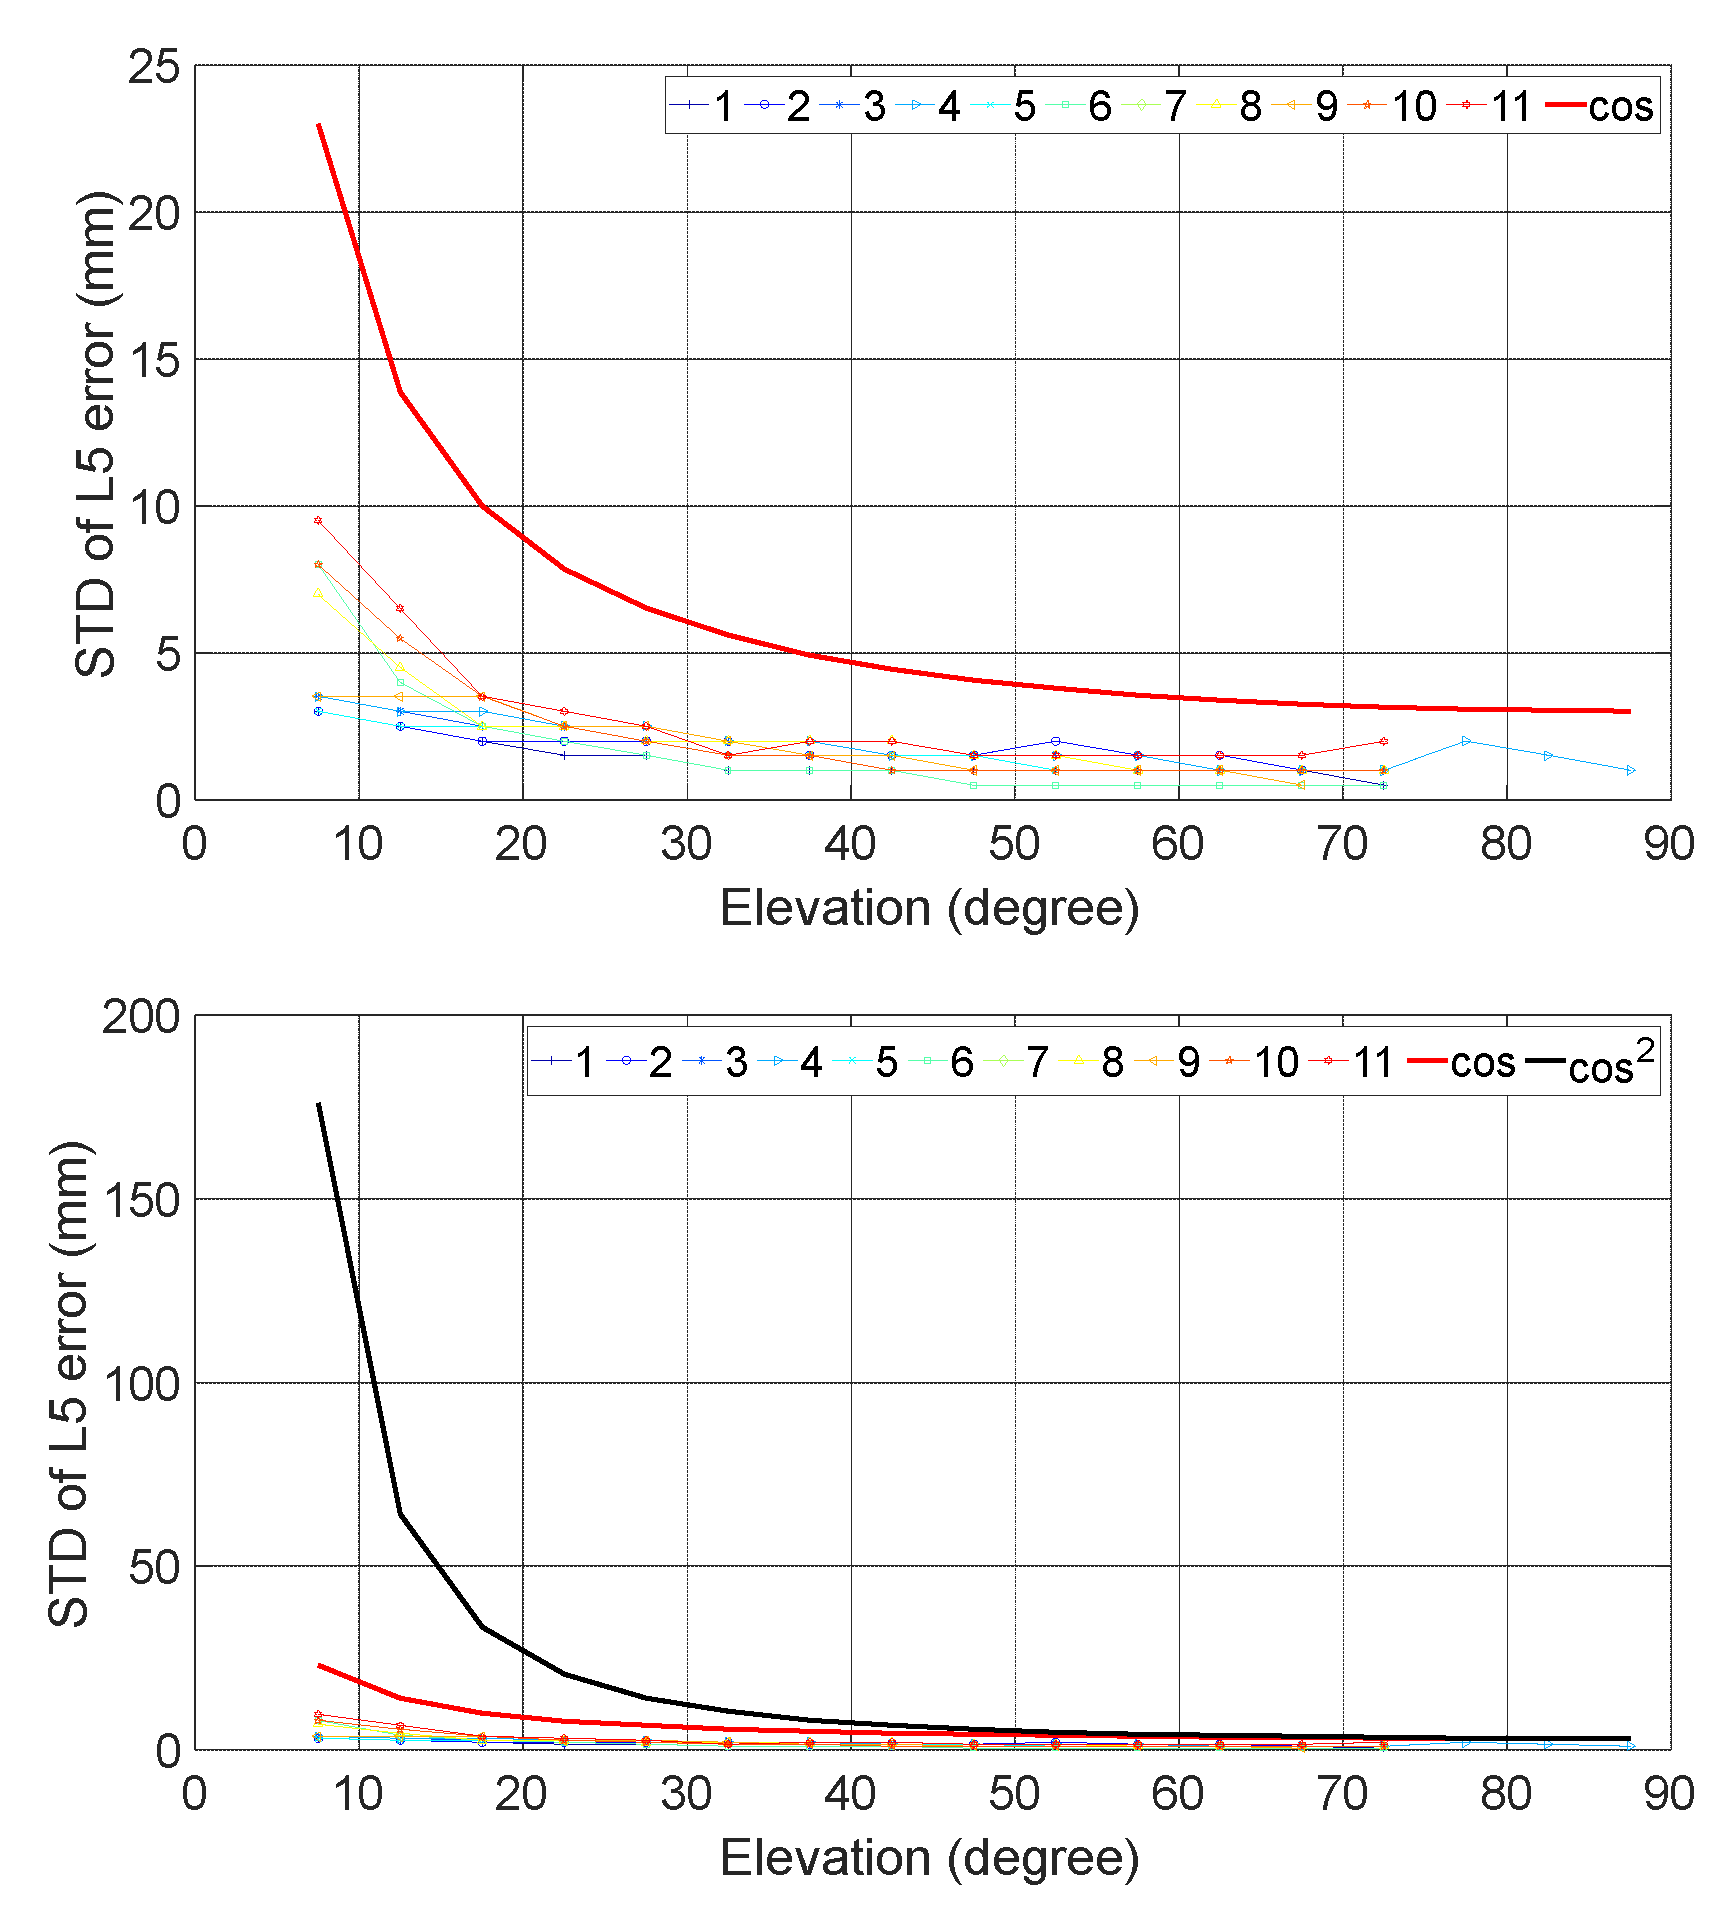
Figure 17 shows the results of L5 (L5Q or L5X) of GPS. At high elevation, the minimum one is only 0.5 mm, while the maximum is about 2 mm, which means that all STD are less than the popularly used STD of 3 mm. At low elevation, the minimum one is only about 3 mm, while the maximum can reach more almost about 10 mm. Among these baselines, No. 1 has the smallest STD, which used receiver types of SEPT POLARX5TR and JAVAD TRE_G3TH. Also, the gradient is also obviously smaller than
, and much less than
, especially when elevation < 40°.
3.3.2. Galileo
3.3.2.1. L1X
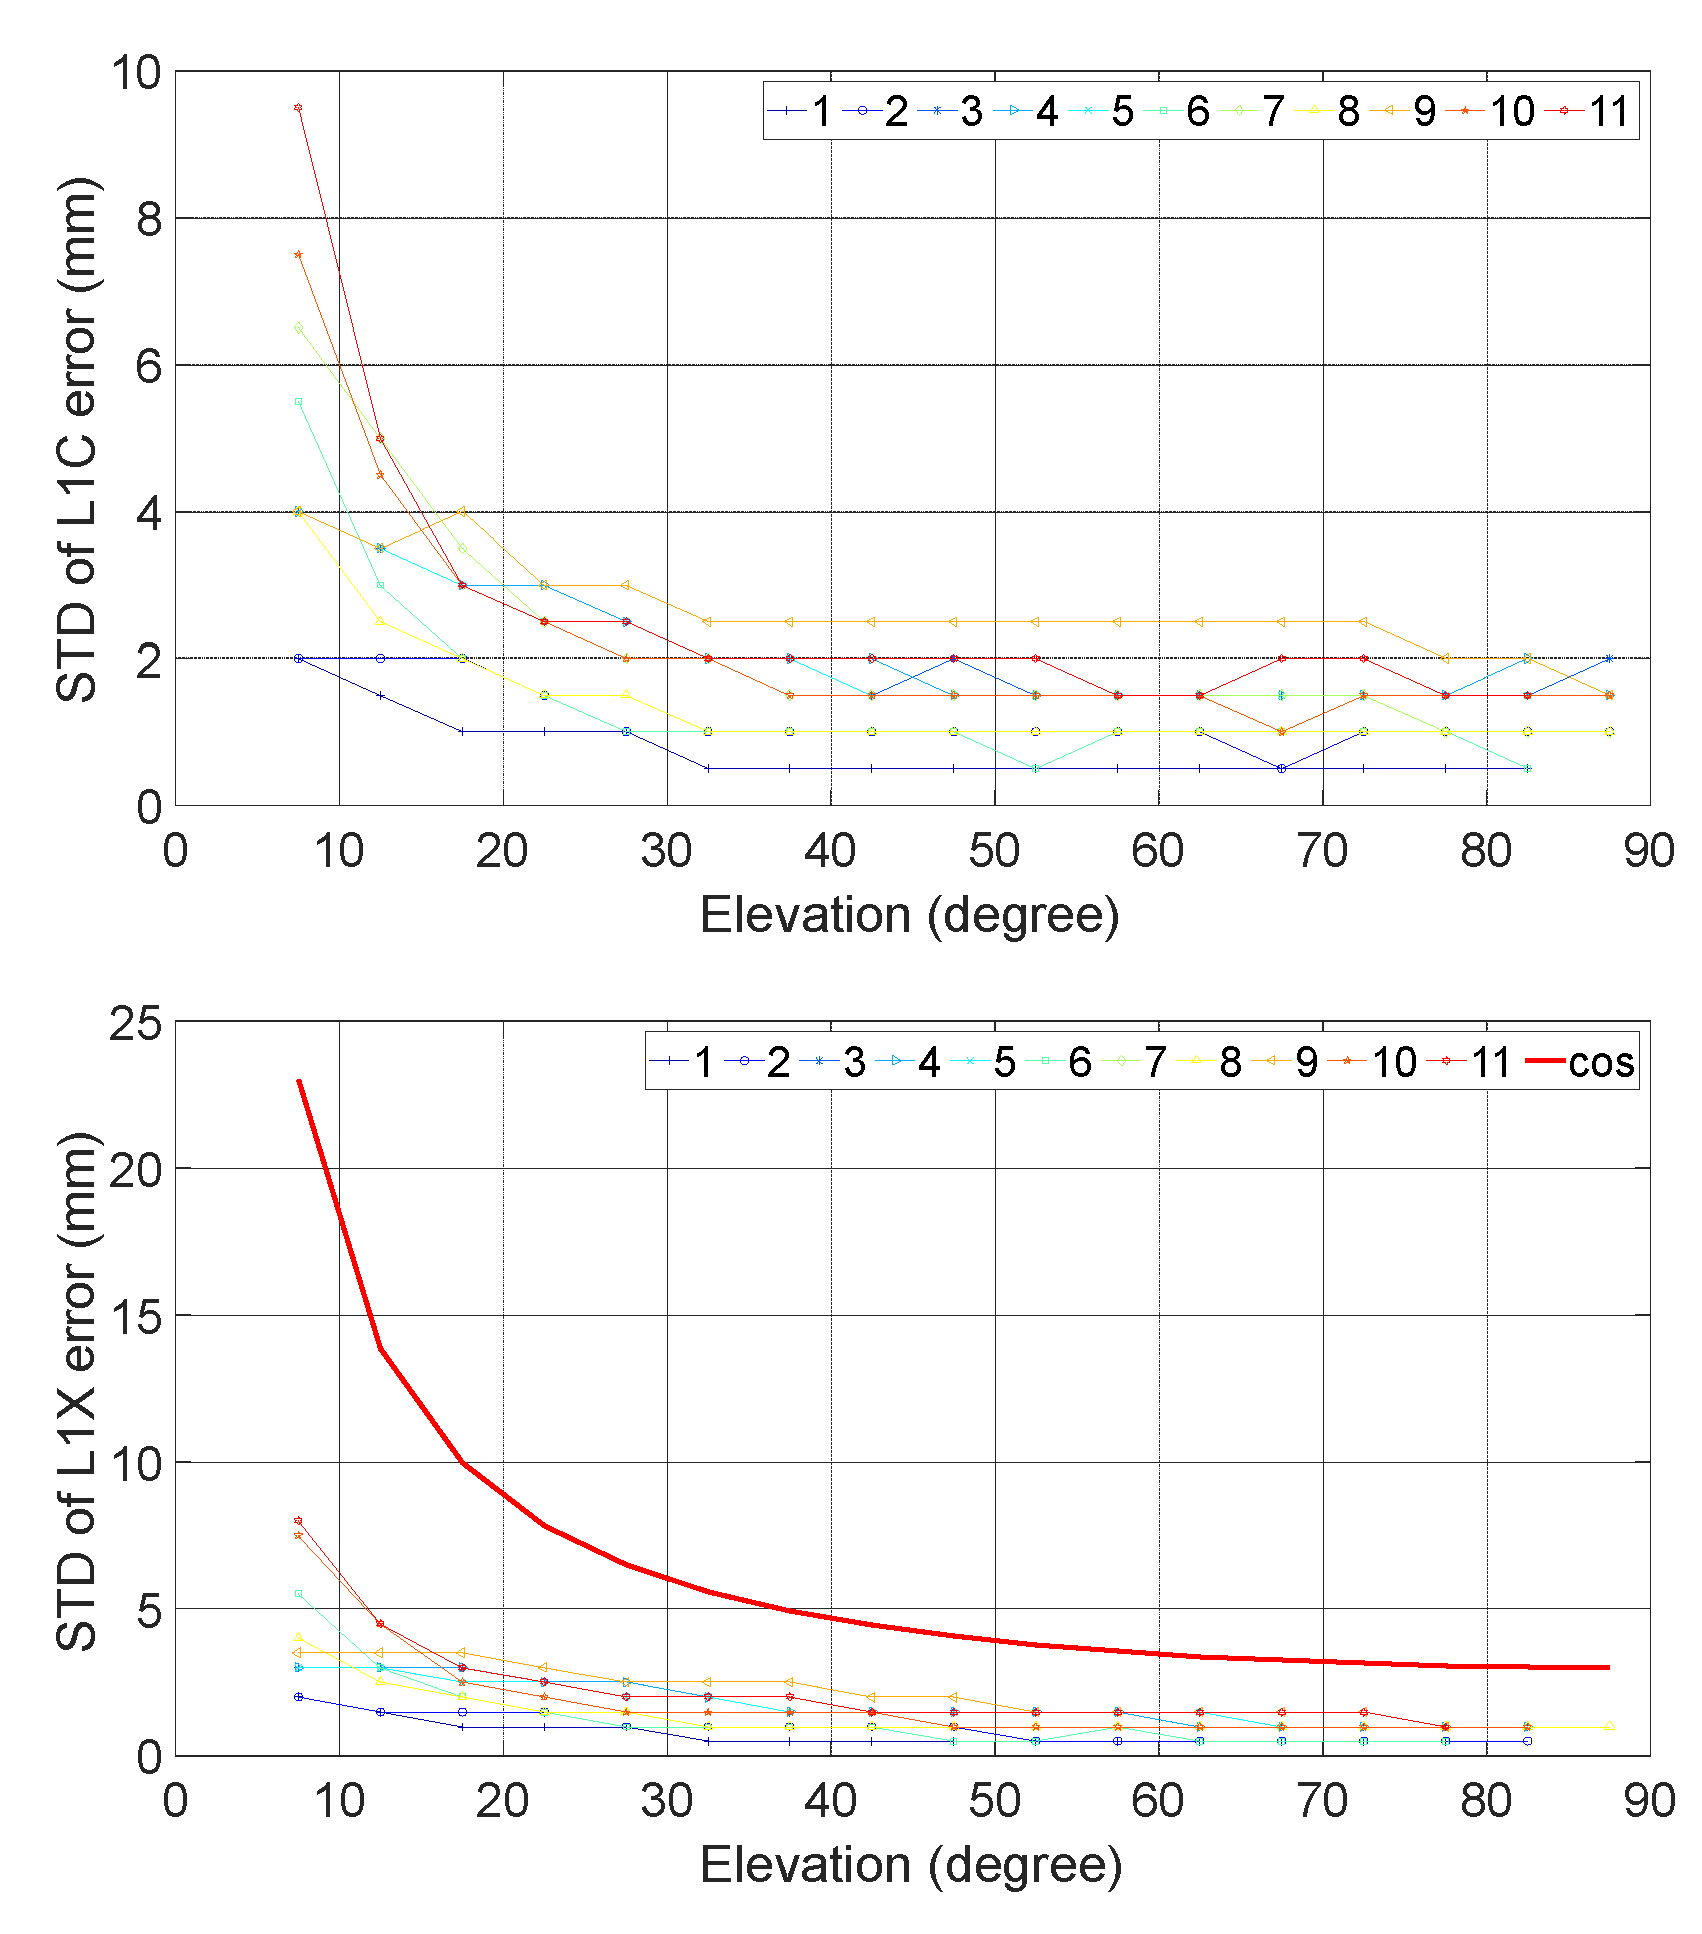
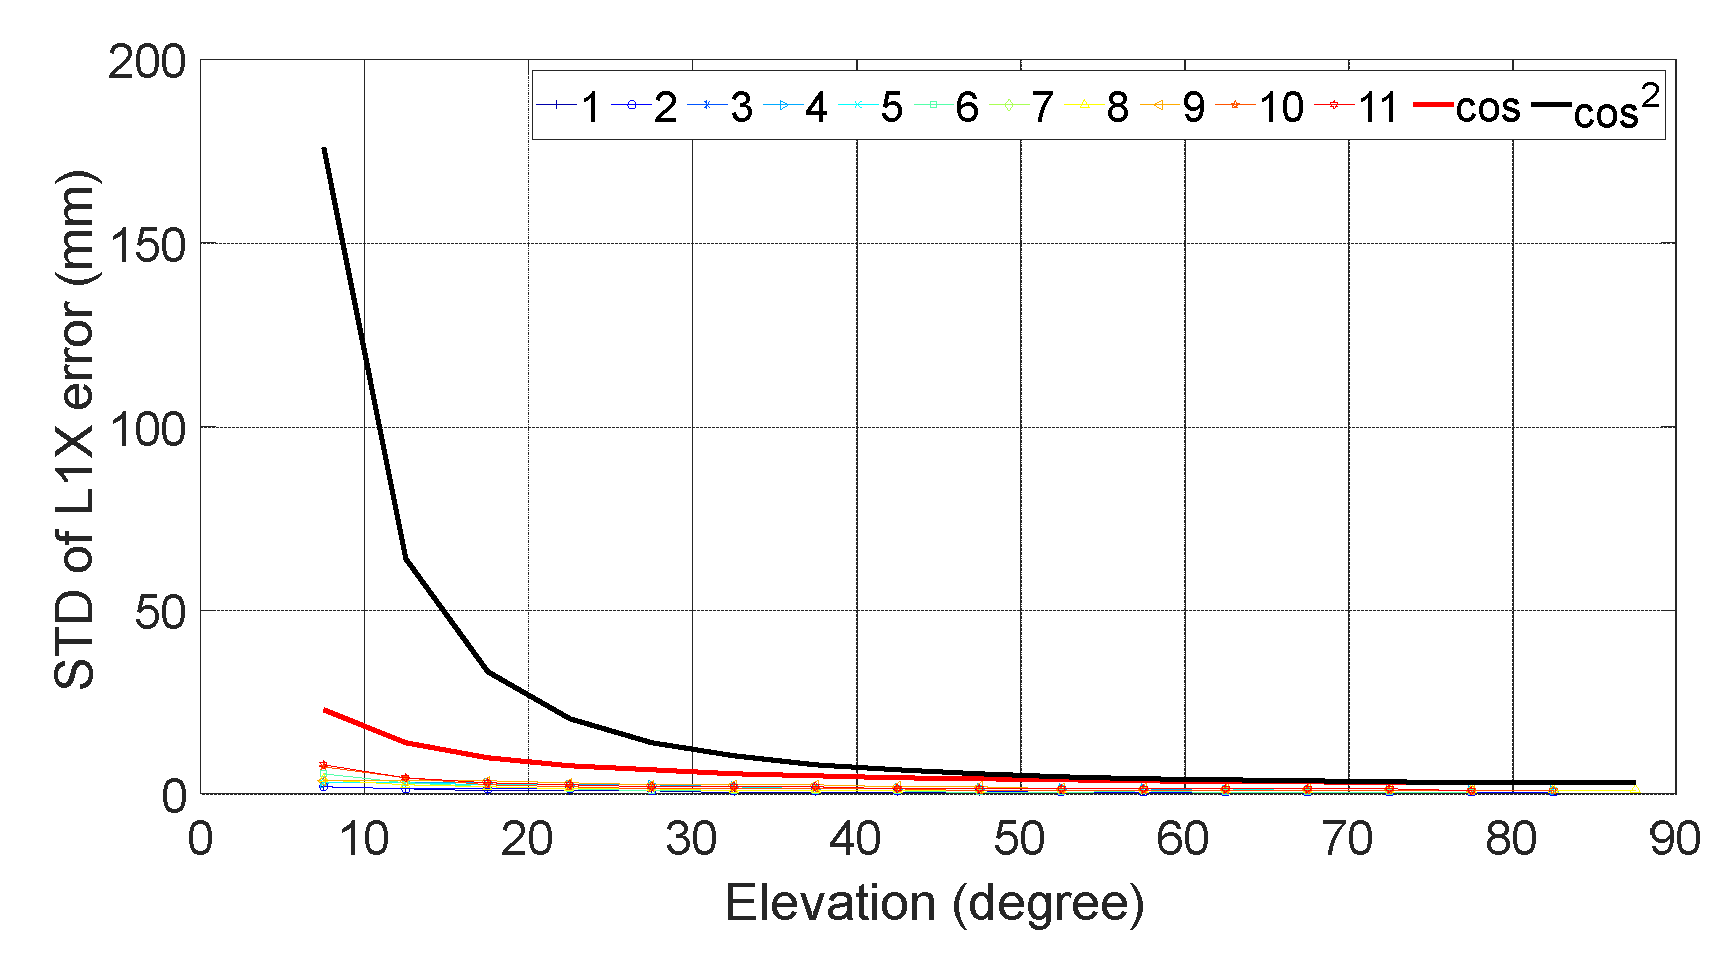
Figure 18 shows the results of L1X of Galileo. At high elevation, the minimum one is only 0.5 mm, while the maximum is about 2.5 mm, which means that all STD are less than the popularly used STD of 3 mm. At low elevation, the minimum one is only about 2 mm, while the maximum can reach almost about 10 mm. Among these baselines, No. 1 and 2 have the smallest STD, which used receiver types of TRIMBLE ALLOY, SEPT POLARX5, SEPT POLARX5TR and JAVAD TRE_G3TH. Also, the gradient is also obviously smaller than
, and much less than
, especially when elevation < 40°.
3.3.2.2. L5X
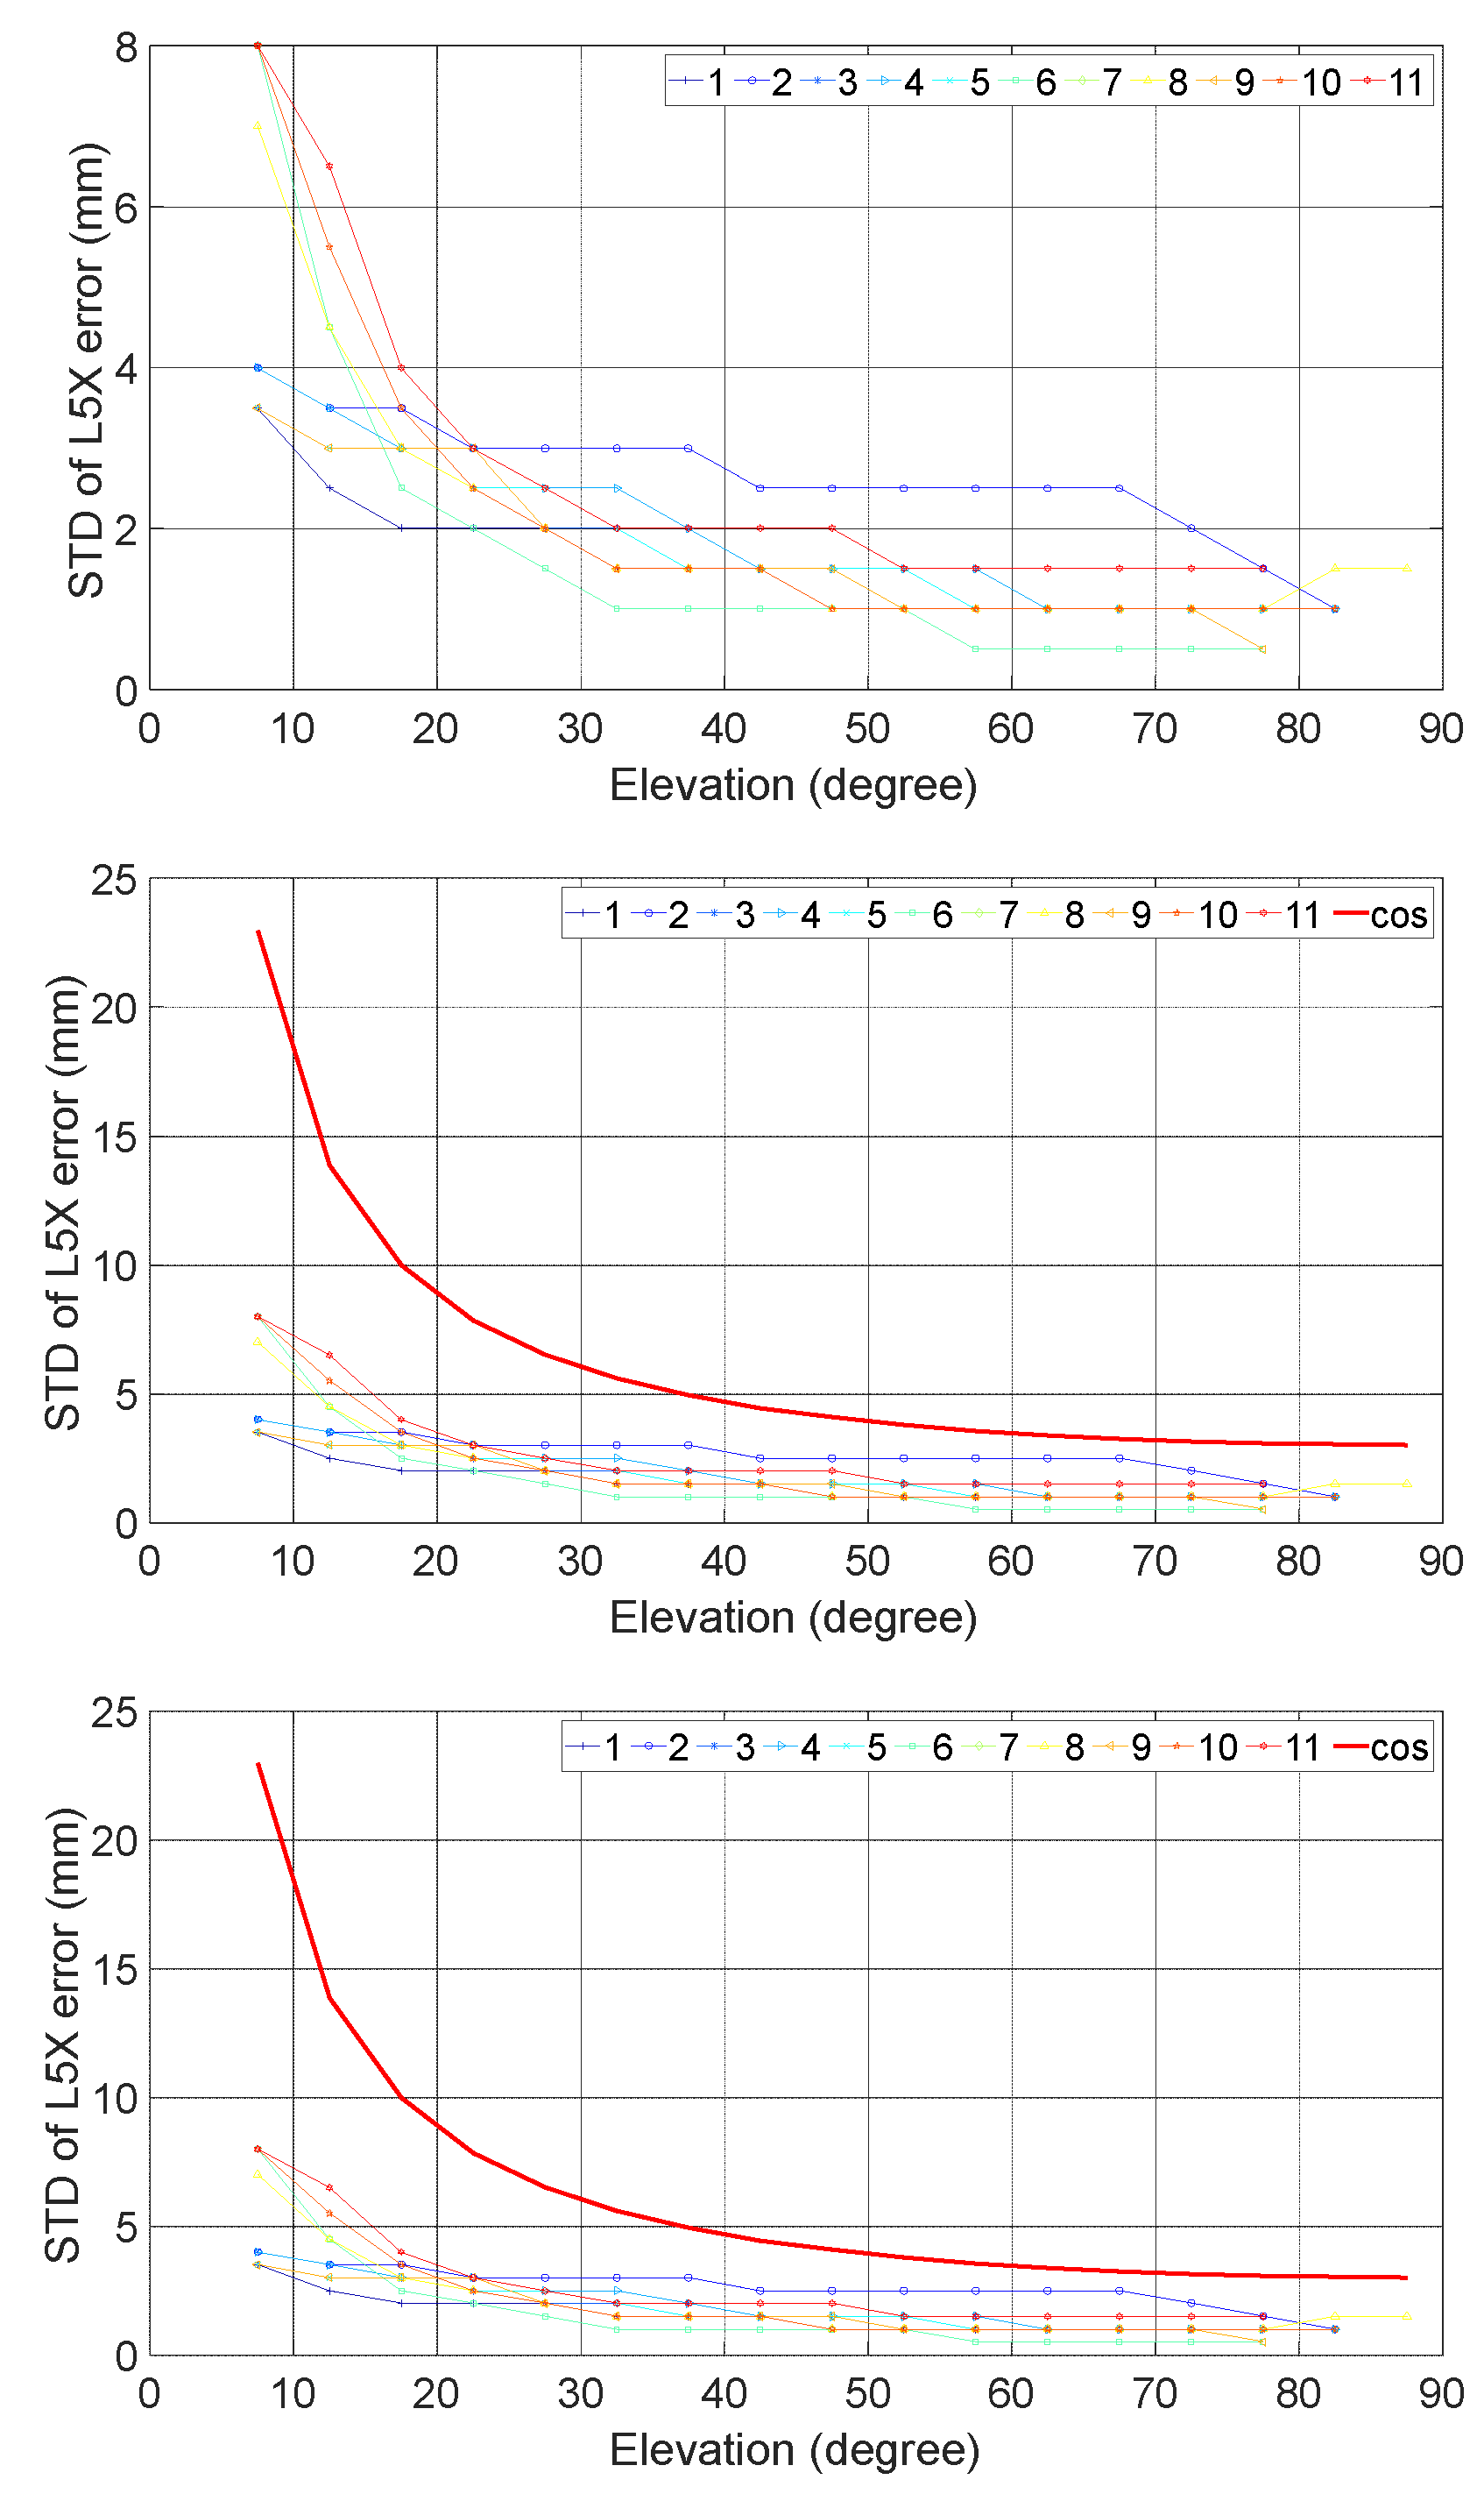
Figure 19 shows the results of L5X of Galileo. At high elevation, the minimum one is only 0.5 mm, while the maximum is about 2.5 mm, which means that all STD are less than the popularly used STD of 3 mm. At low elevation, the minimum one is only about 3.5 mm, while the maximum can reach about 8 mm. Among these baselines, No. 6 has the smallest STD, which used a receiver type of SEPT POLARX5. Also, the gradient is also obviously smaller than
, and much less than
, especially when elevation < 40°.
3.3.2.3. L6X
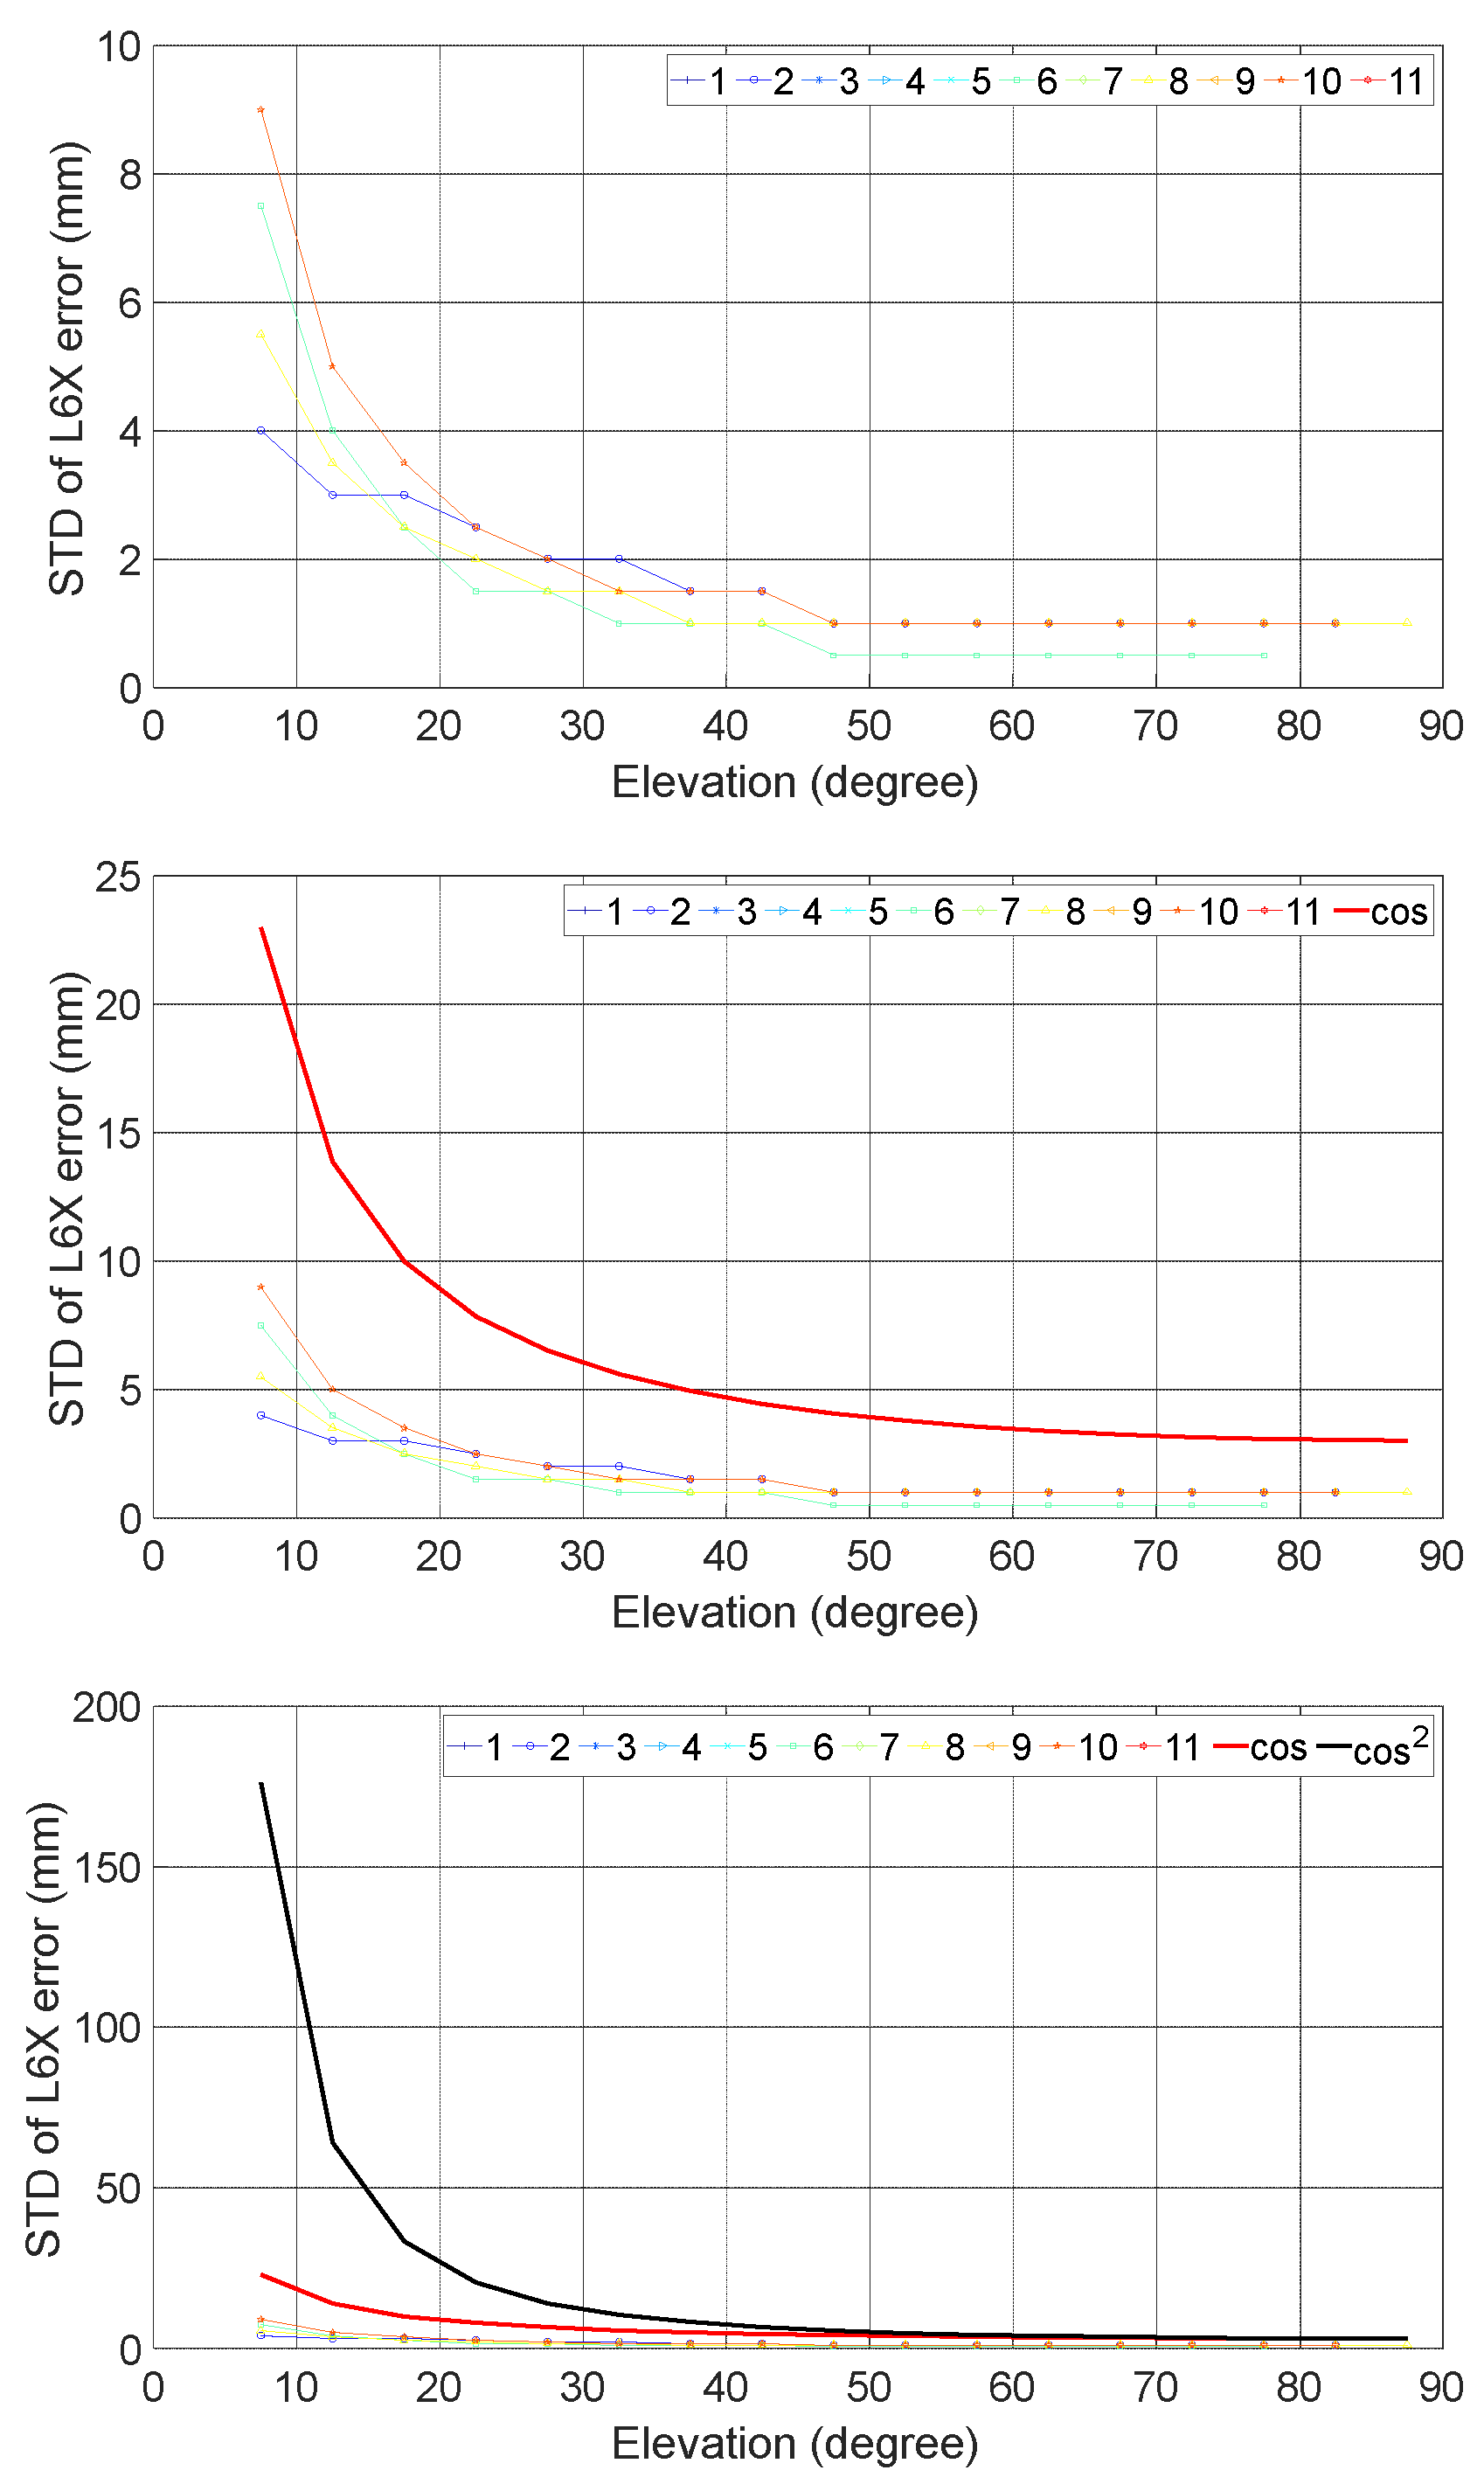
Figure 20 shows the results of L6X of Galileo. At high elevation, the minimum one is only 0.5 mm, while the maximum is 1 mm, which means that all STD are much less than the popularly used STD of 3 mm. At low elevation, the minimum one is only about 4 mm, while the maximum can reach about 9 mm. Among these baselines, No. 6 has the smallest STD, which used a receiver type of SEPT POLARX5. Also, the gradient is also obviously smaller than
, and much less than
, especially when elevation < 40°.
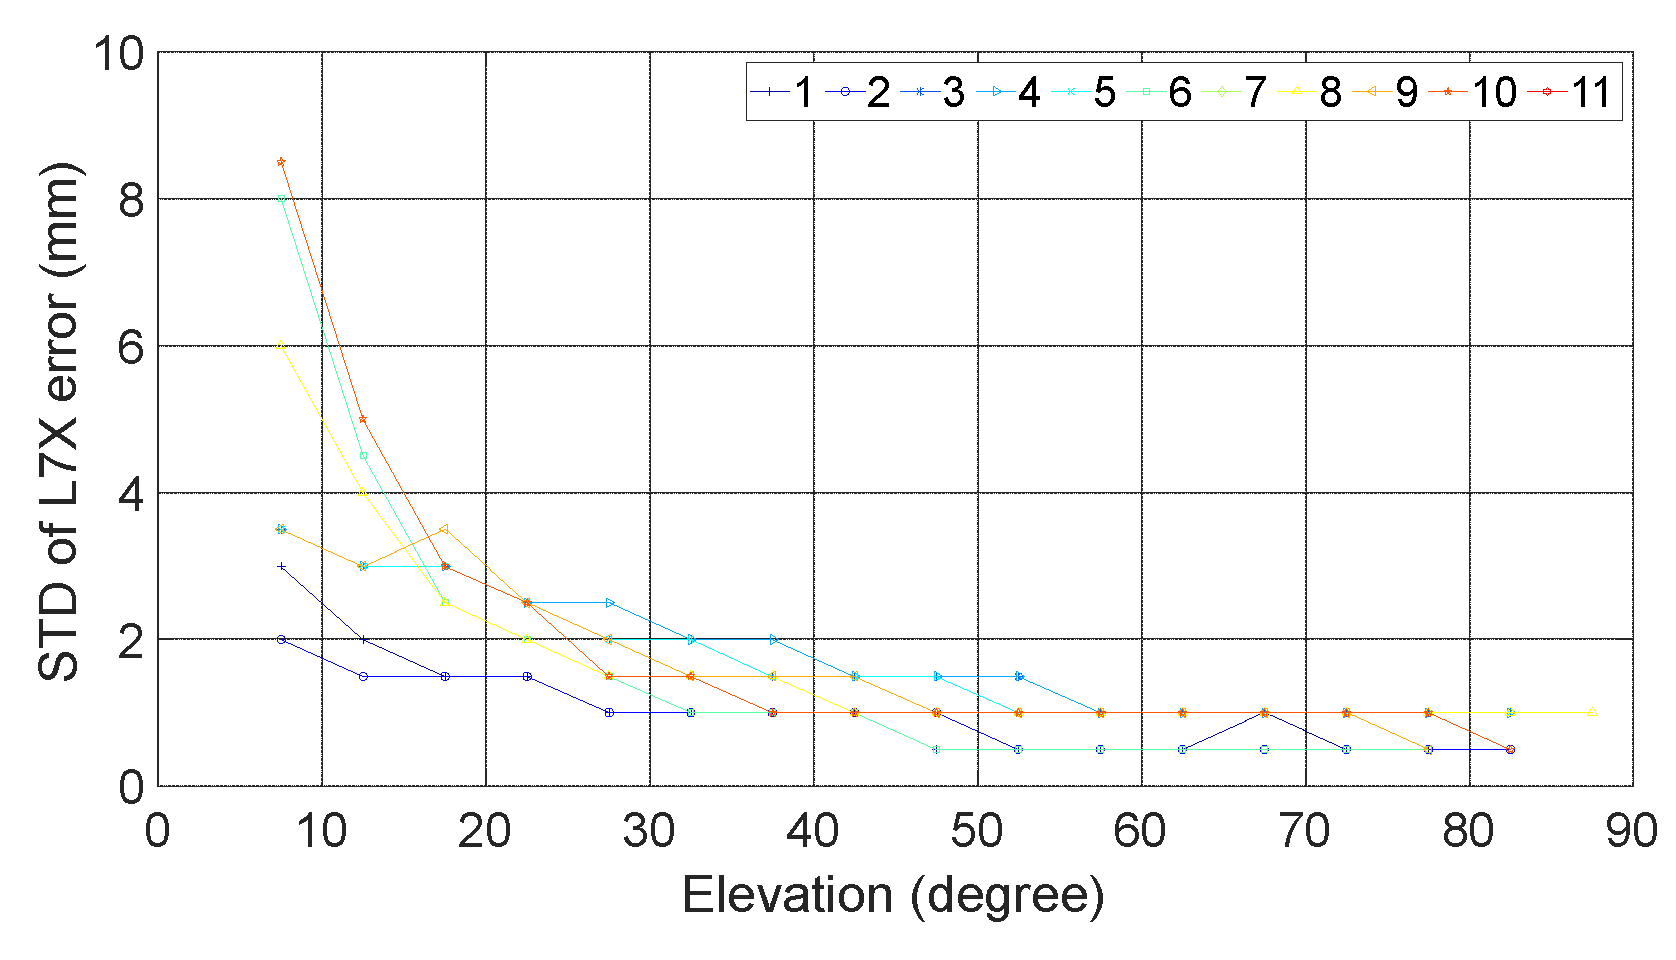
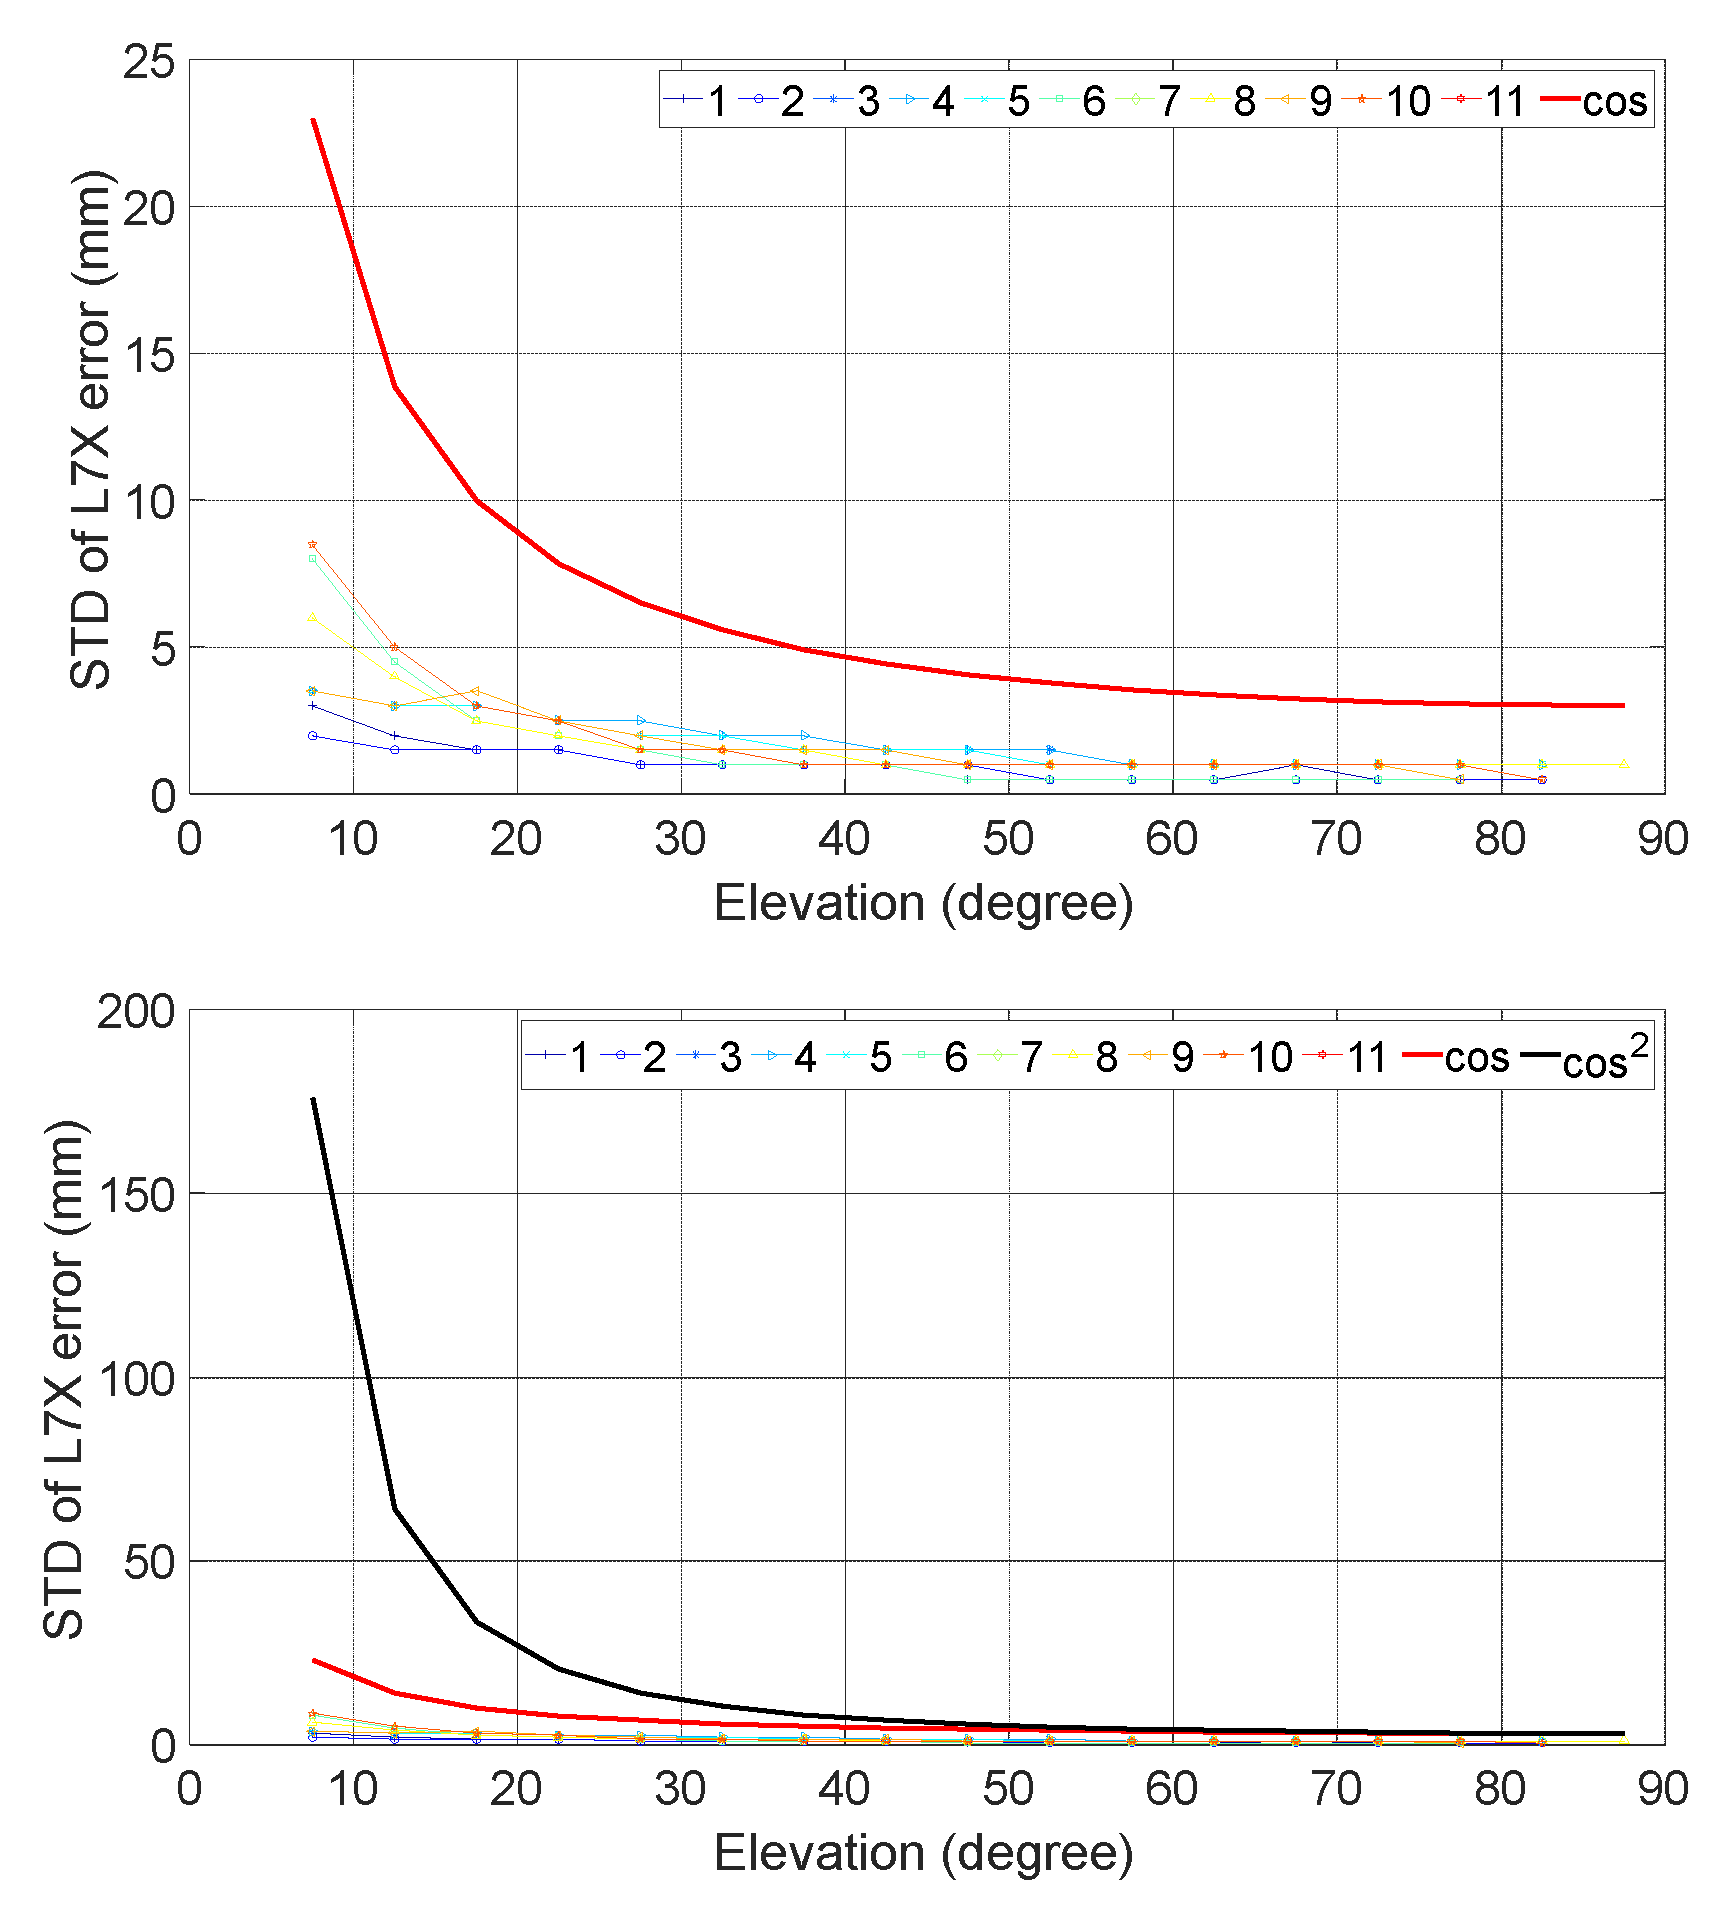
3.3.2.4. L7X
Figure 20 shows the results of L7X of Galileo. At high elevation, the minimum one is only 0.5 mm, while the maximum is about 1 mm, which means that all STD are much less than the popularly used STD of 3 mm. At low elevation, the minimum one is only about 2 mm, while the maximum can reach about 8.5 mm. Among these baselines, No. 6 has the smallest STD, which used a receiver type of SEPT POLARX5. Also, the gradient is also obviously smaller than
, and much less than
, especially when elevation < 40°.
Figure 20.
STD of L7X observation noise (up) and comparison to and (below).
Figure 20.
STD of L7X observation noise (up) and comparison to and (below).
3.3.2.5. L8X
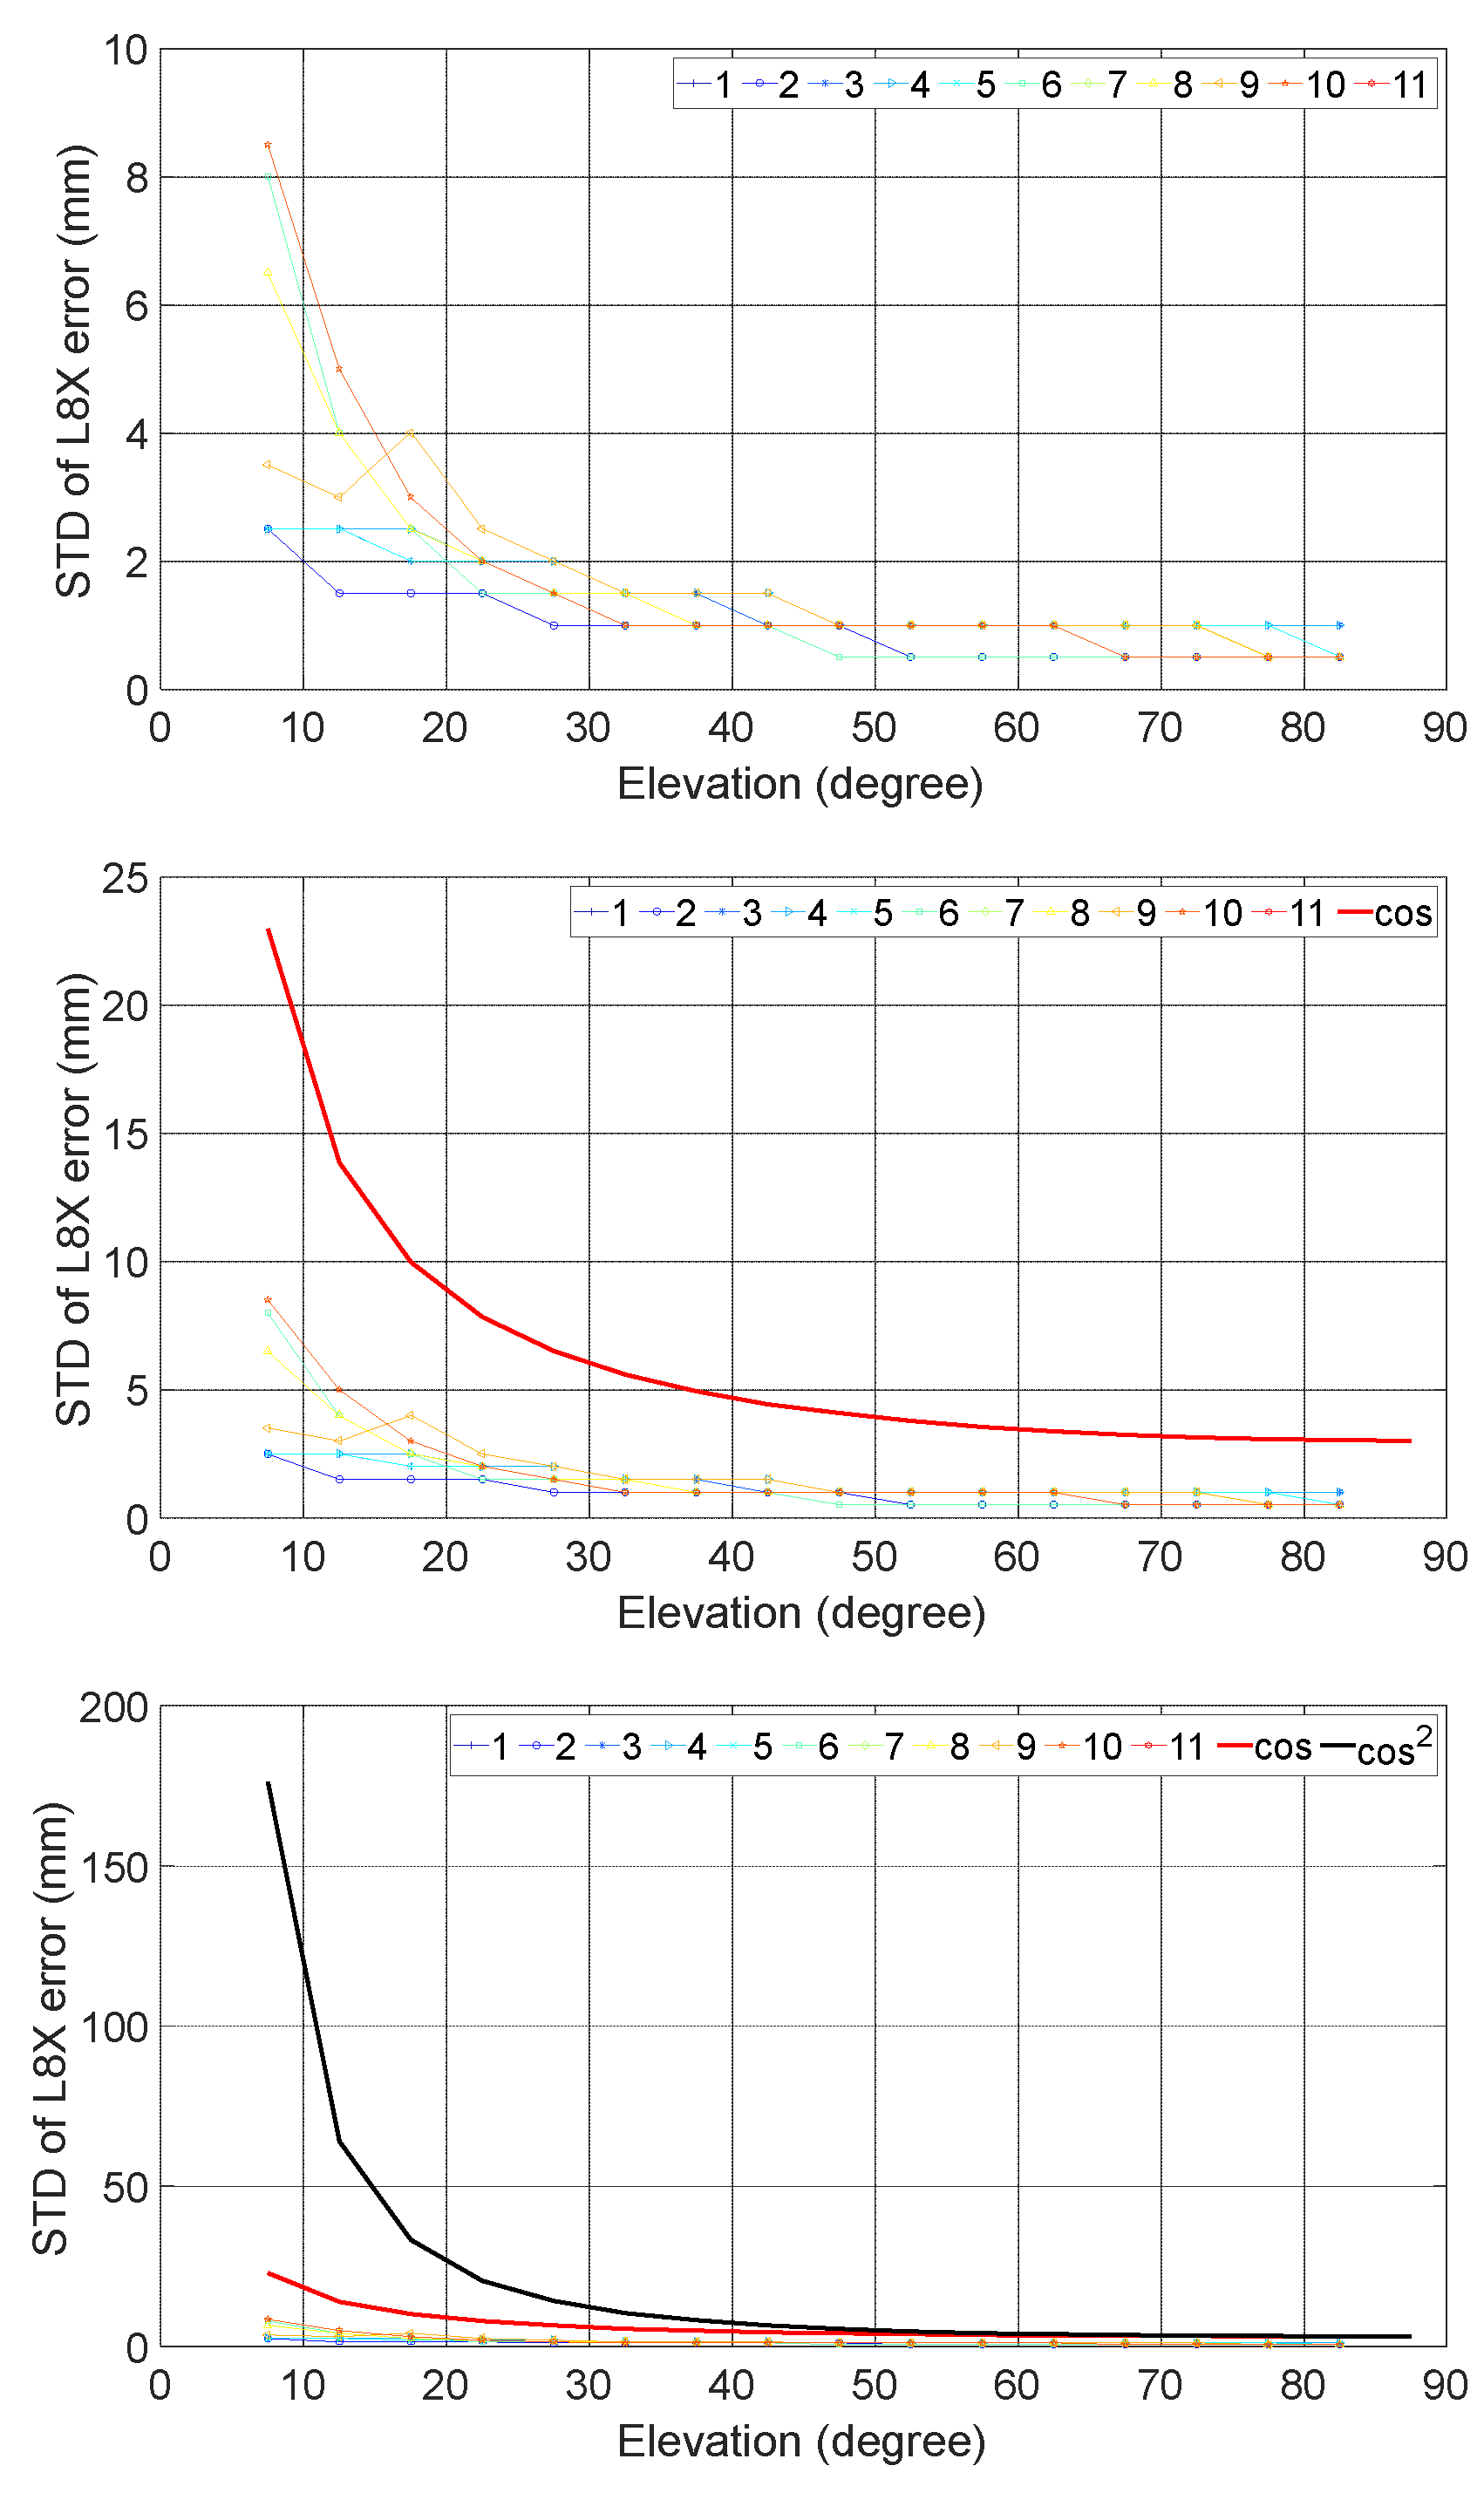
Figure 21 shows the results of L8X of Galileo. At high elevation, the minimum one is only 0.5 mm, while the maximum is about 1 mm, which means that all STD are much less than the popularly used STD of 3 mm. At low elevation, the minimum one is only about 2.5 mm, while the maximum can reach about 8.5 mm. Among these baselines, No. 6 has the smallest STD, which used a receiver type of SEPT POLARX5. Also, the gradient is also obviously smaller than
, and much less than
, especially when elevation < 40°.
3.3.3. BeiDou
3.3.3.1. L2I
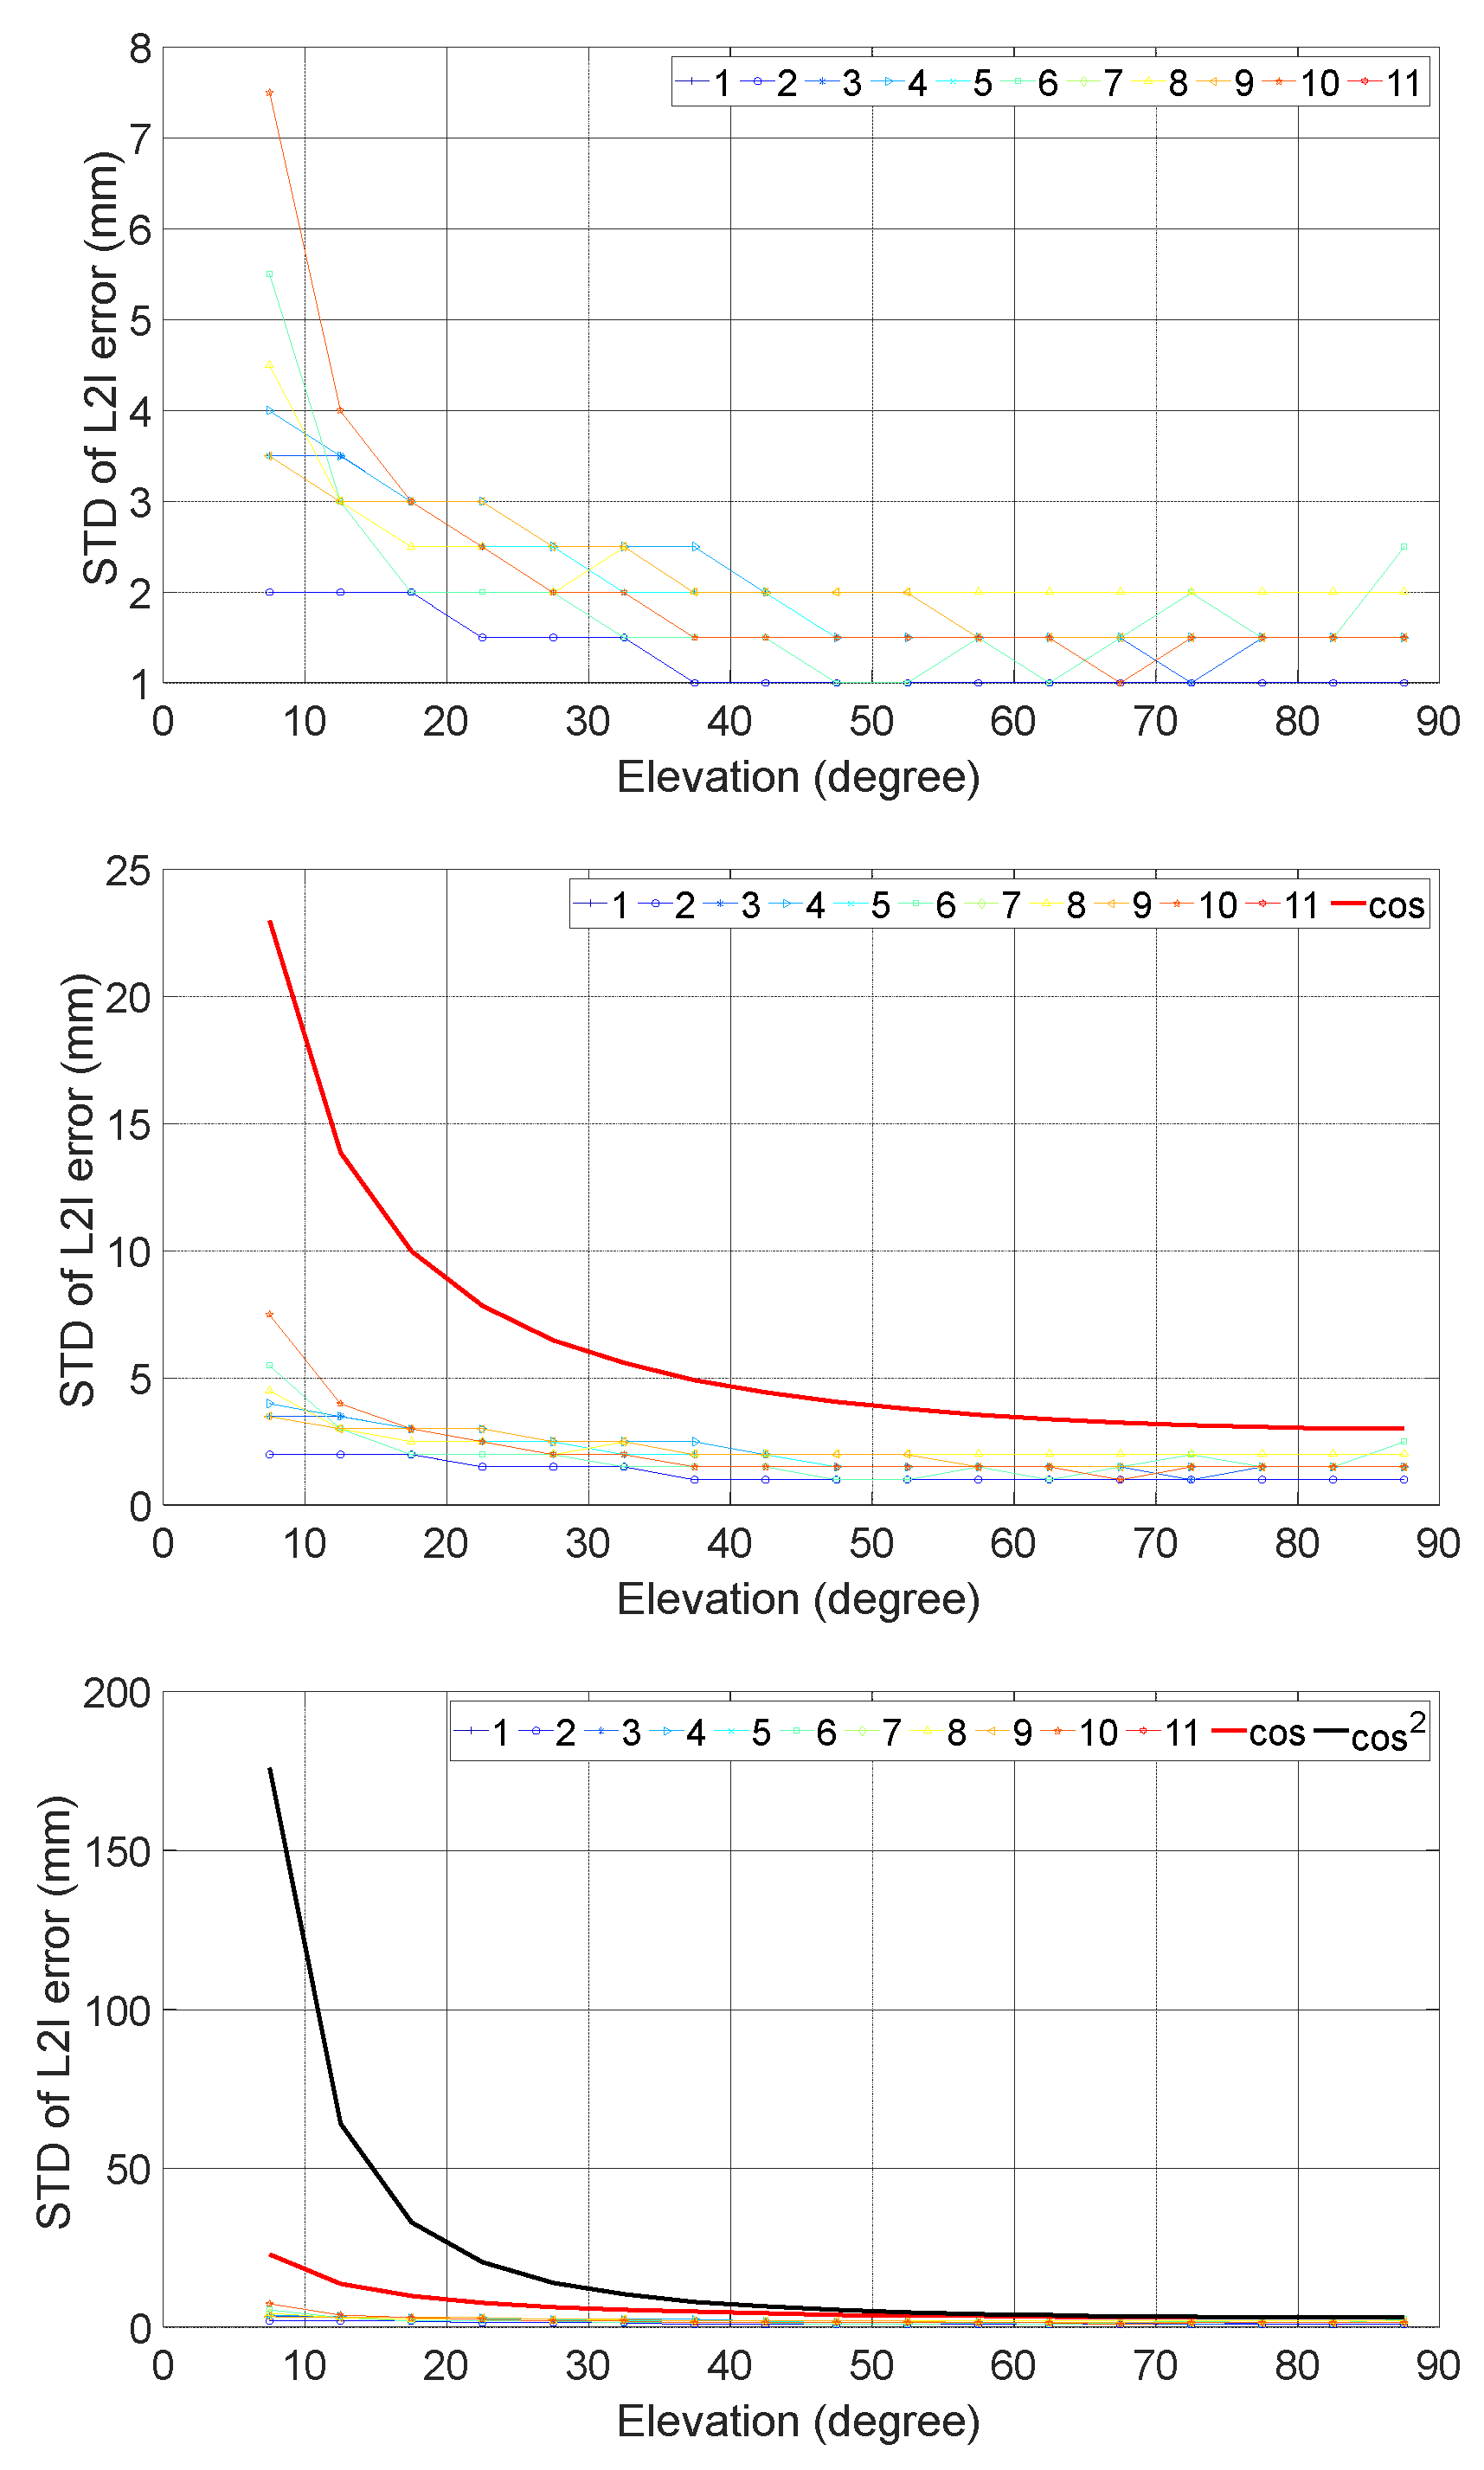
Figure 22 shows the results of L2I of BeiDou. At high elevation, the minimum one is only 1 mm, while the maximum is about 2 mm, which means that all STD are less than the popularly used STD of 3 mm. At low elevation, the minimum one is only about 2 mm, while the maximum can reach about 7.5 mm. Among these baselines, No. 2 has the smallest STD, which used receiver types of TRIMBLE ALLOY and SEPT POLARX5. Also, the gradient is also obviously smaller than
, and much less than
, especially when elevation < 40°.
3.3.3.2. L6I
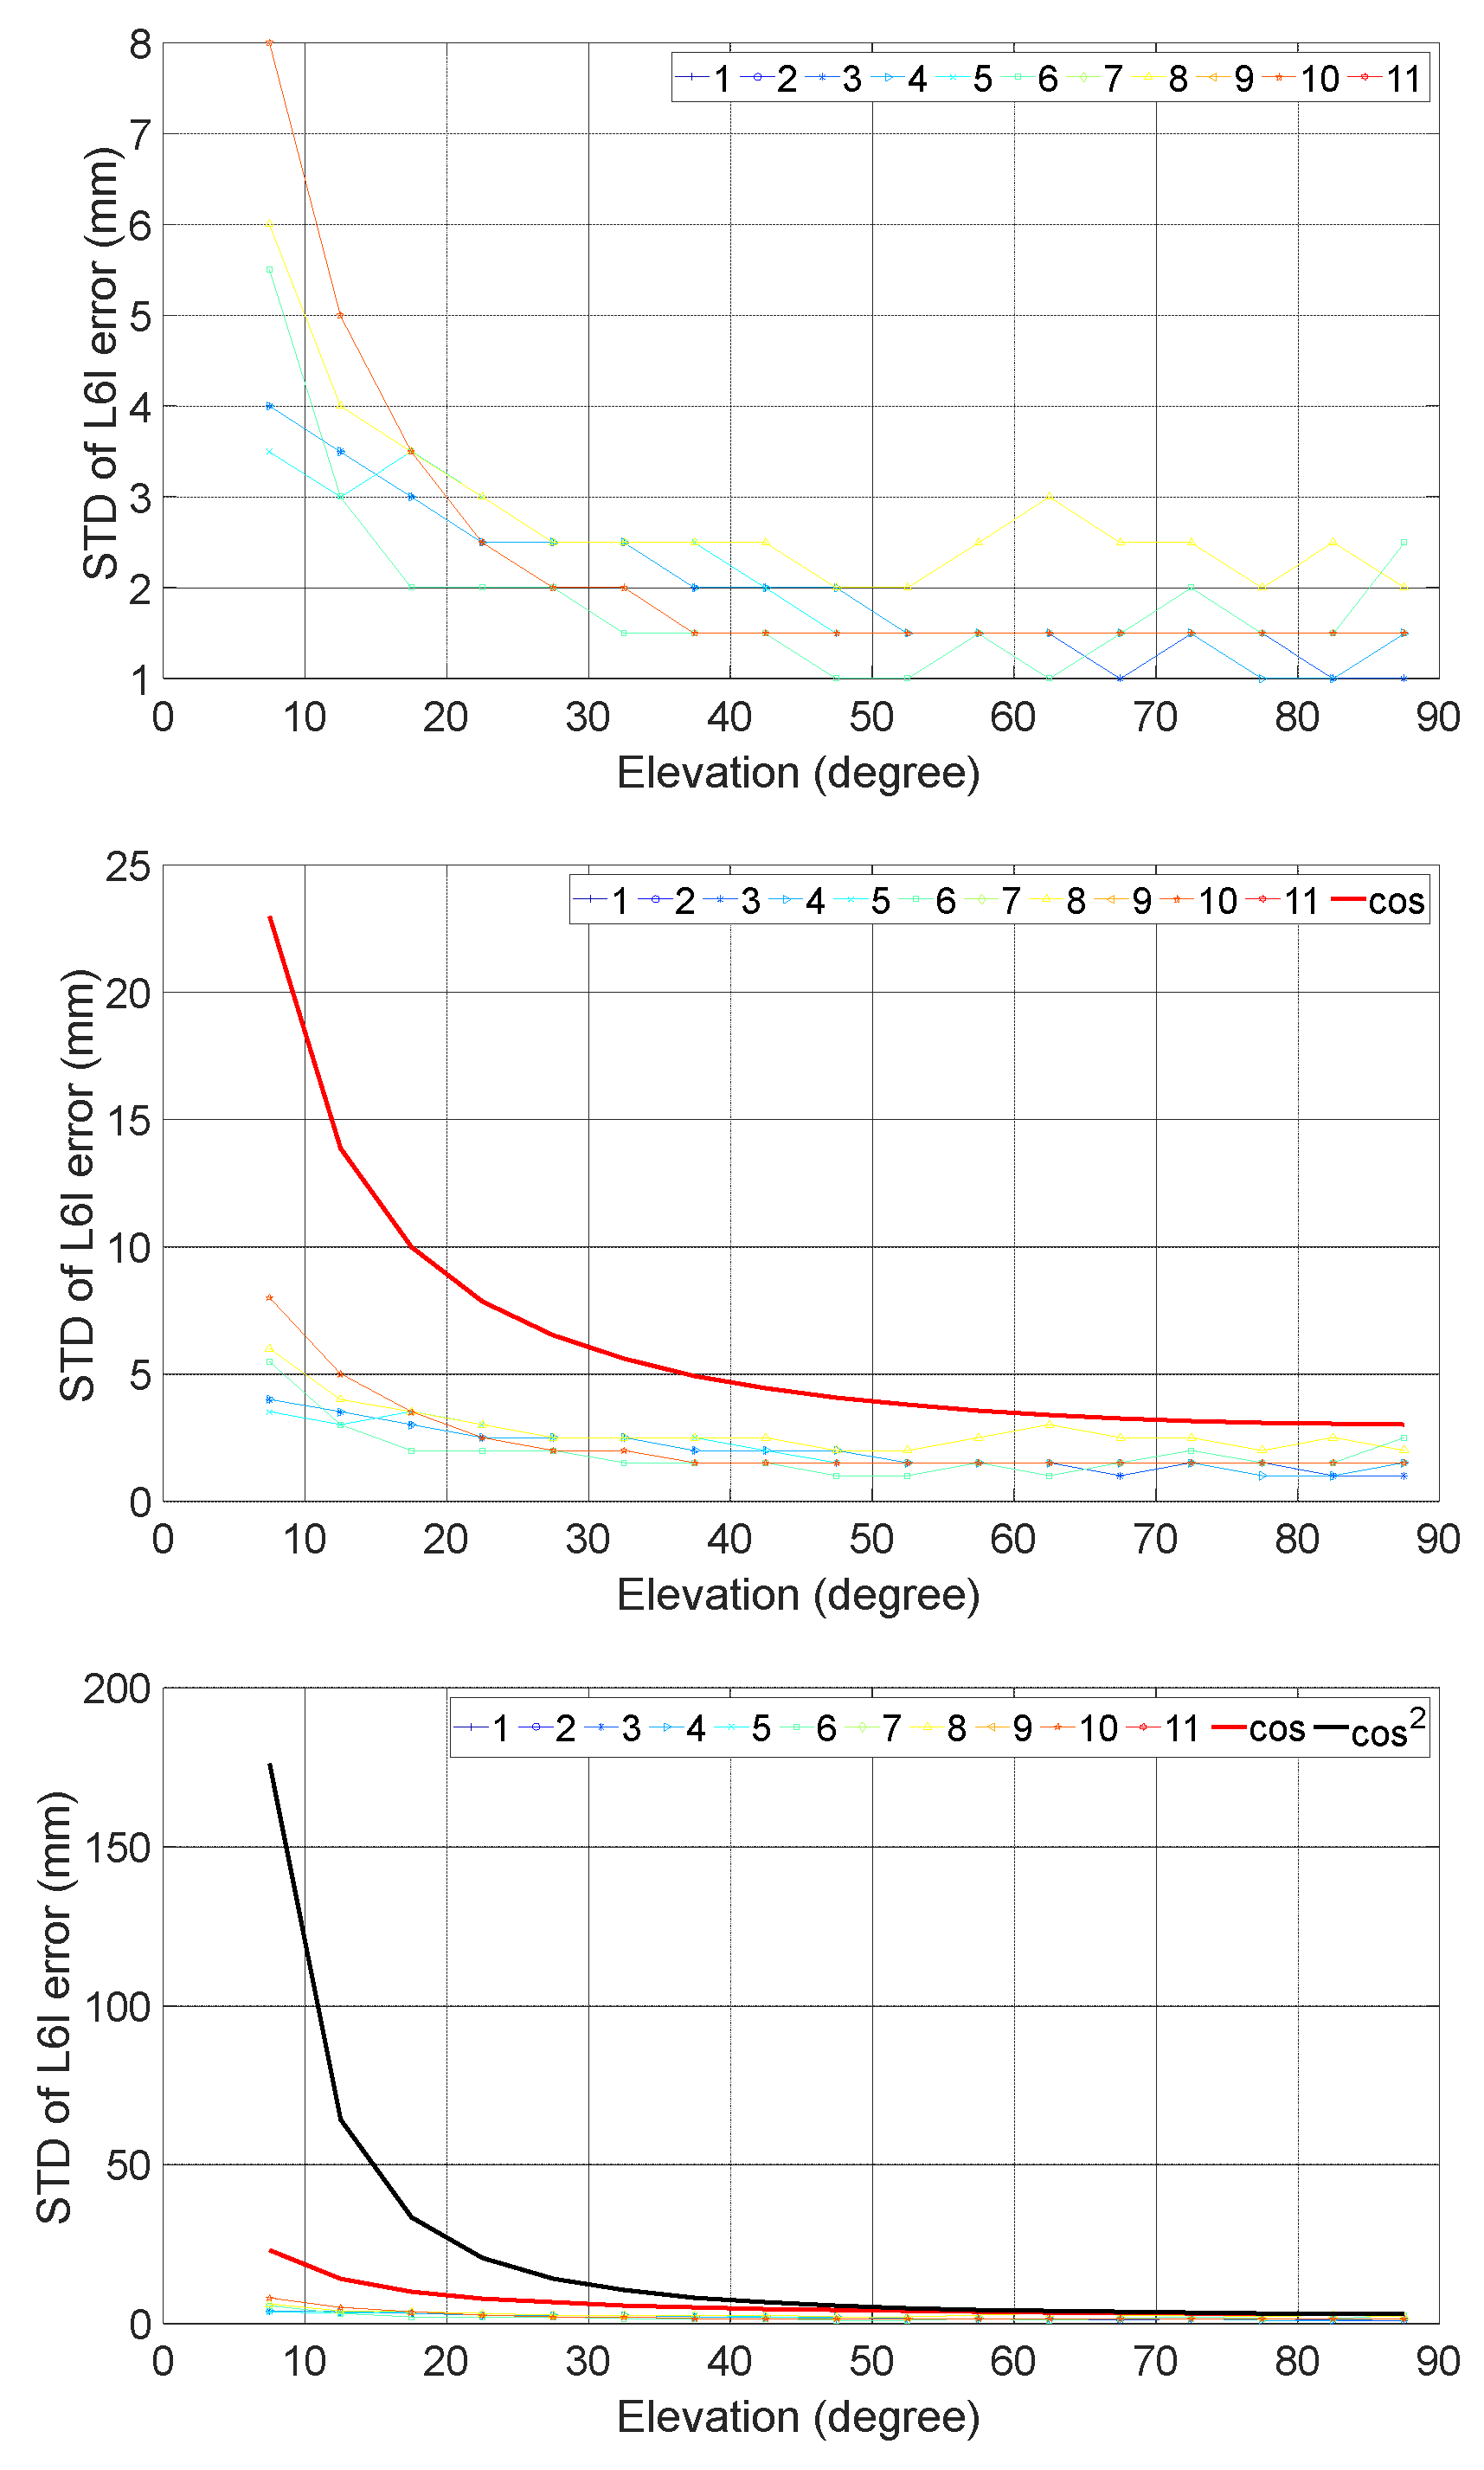
Figure 23 shows the results of L6I of BeiDou. At high elevation, the minimum one is only 1 mm, while the maximum is about 3 mm. At low elevation, the minimum one is only about 3.5 mm, while the maximum can reach about 8 mm. Among these baselines, No. 3, 4 and 5 have the smallest STD, which used a receiver type of TRIMBLE NETR9. Also, the gradient is also obviously smaller than
, and much less than
, especially when elevation < 40°.
3.3.3.3. L7I
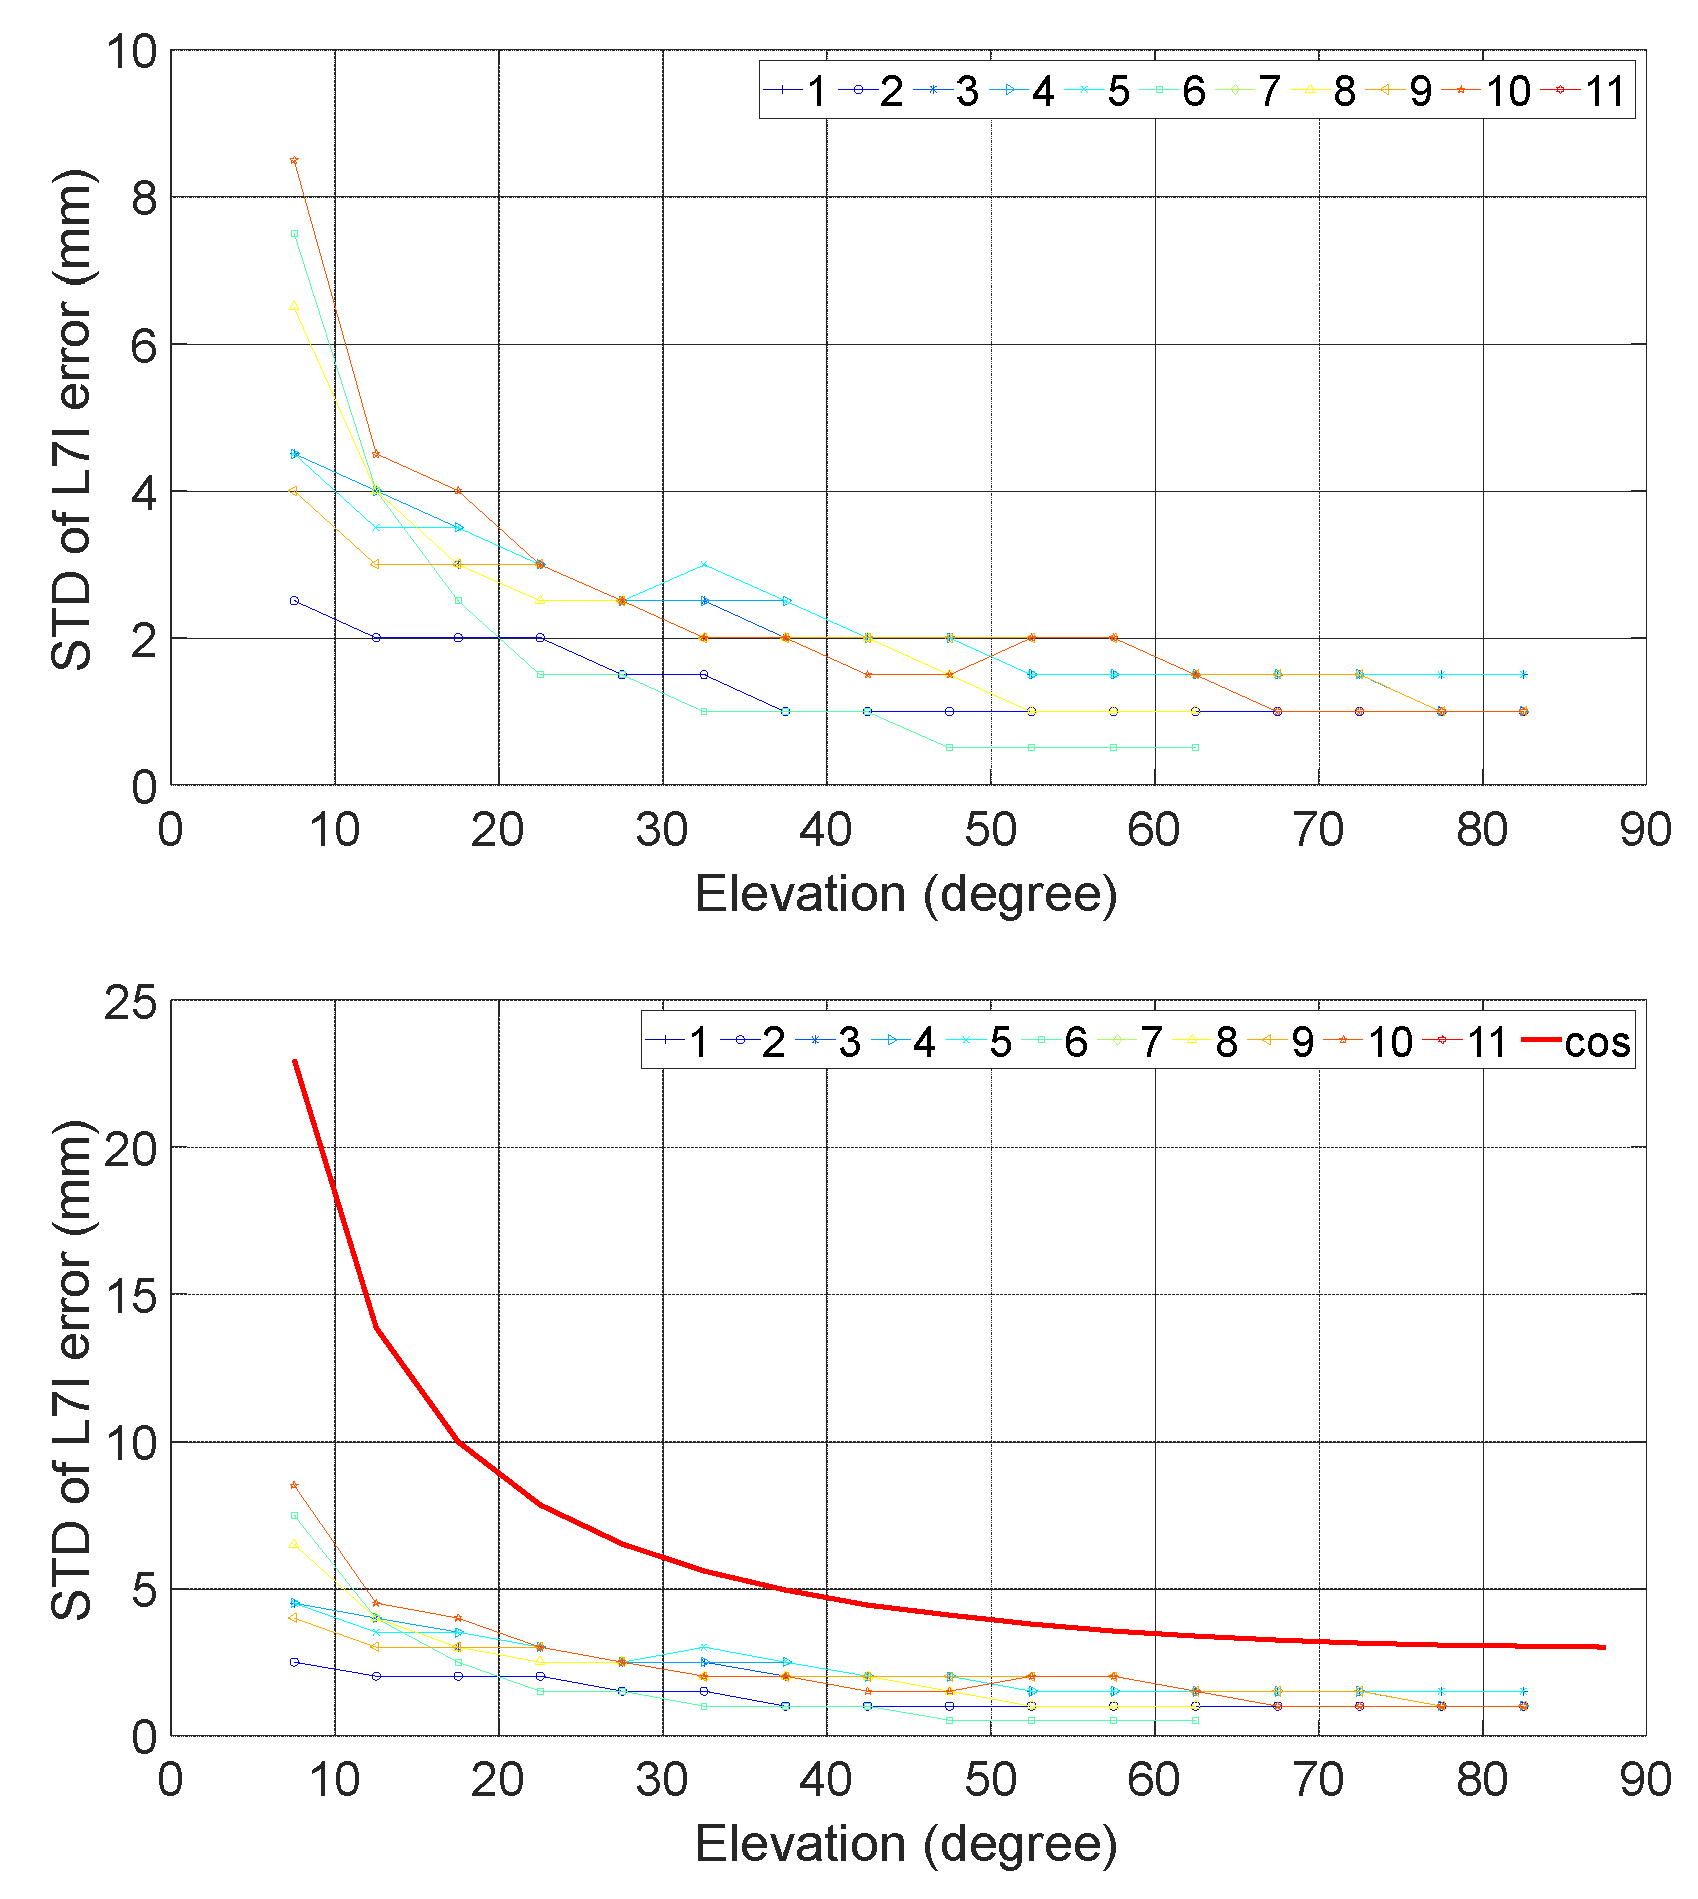
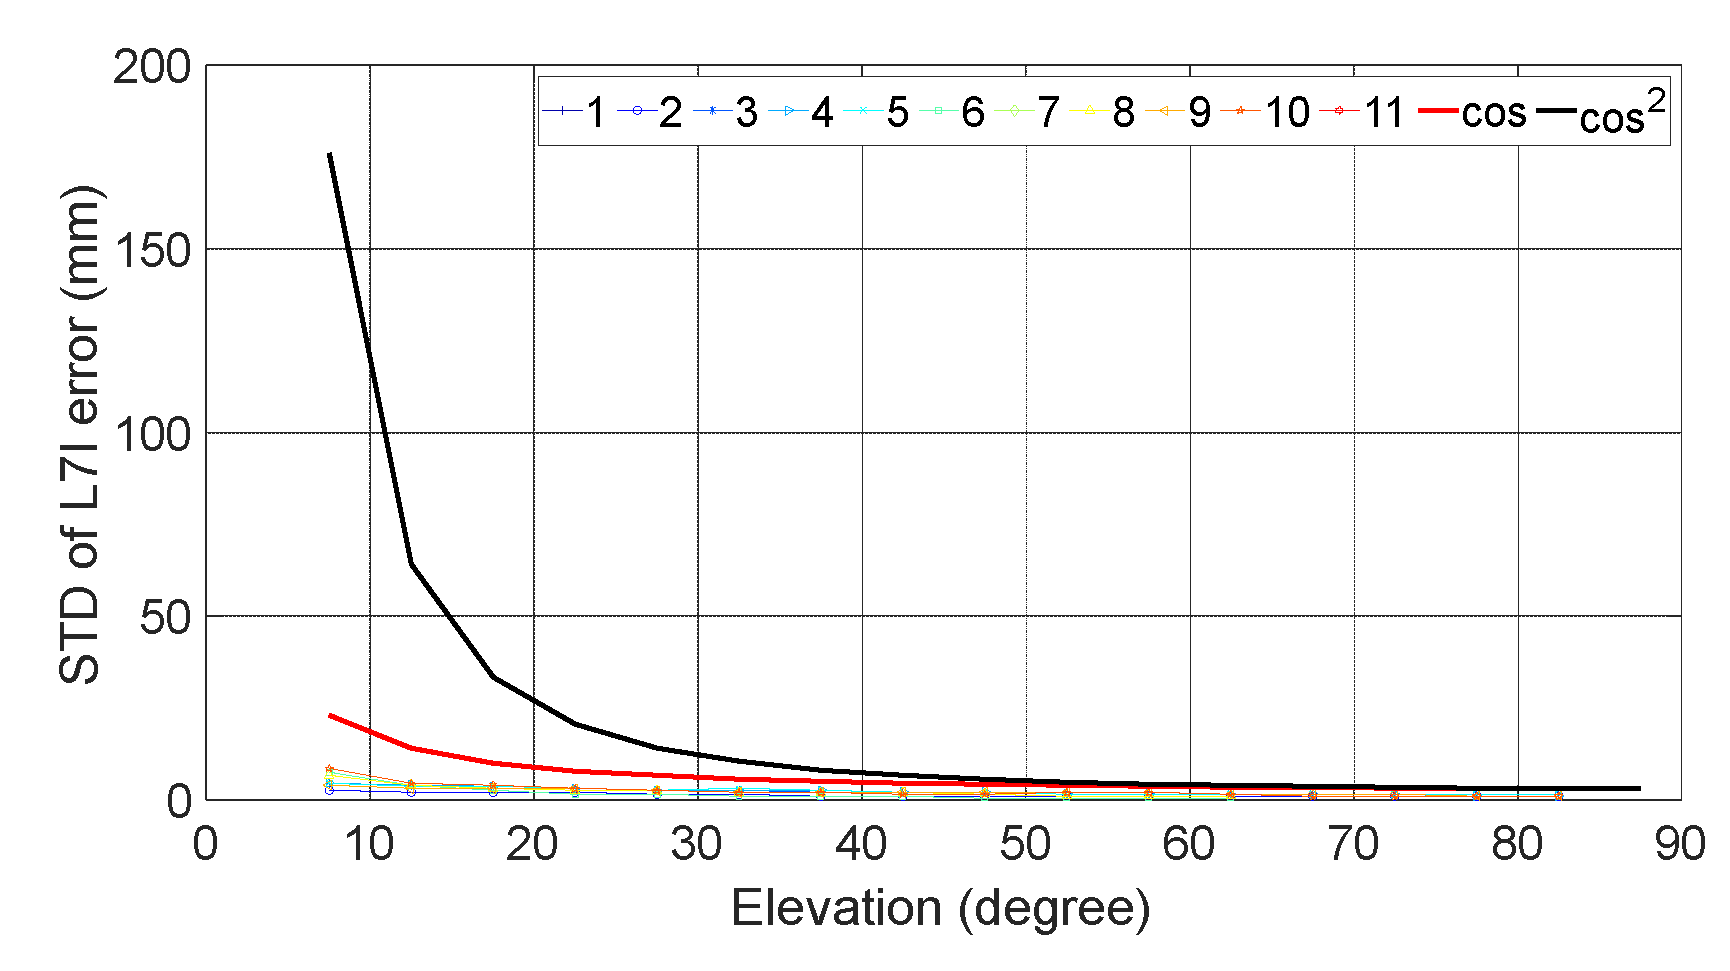
Figure 24 shows the results of L7I of BeiDou. At high elevation, the minimum one is only 0.5 mm, while the maximum is about 1.5 mm, which means that all STD are much less than the popularly used STD of 3 mm. At low elevation, the minimum one is only about 2.5 mm, while the maximum can reach about 8.5 mm. Among these baselines, No. 2 and 6 have the smallest STD, which used receiver types of TRIMBLE ALLOY and SEPT POLARX5. Also, the gradient is also obviously smaller than
, and much less than
, especially when elevation < 40°.
3.3.3.4. Comparison among Different GNSS Systems and Different Frequency Bands
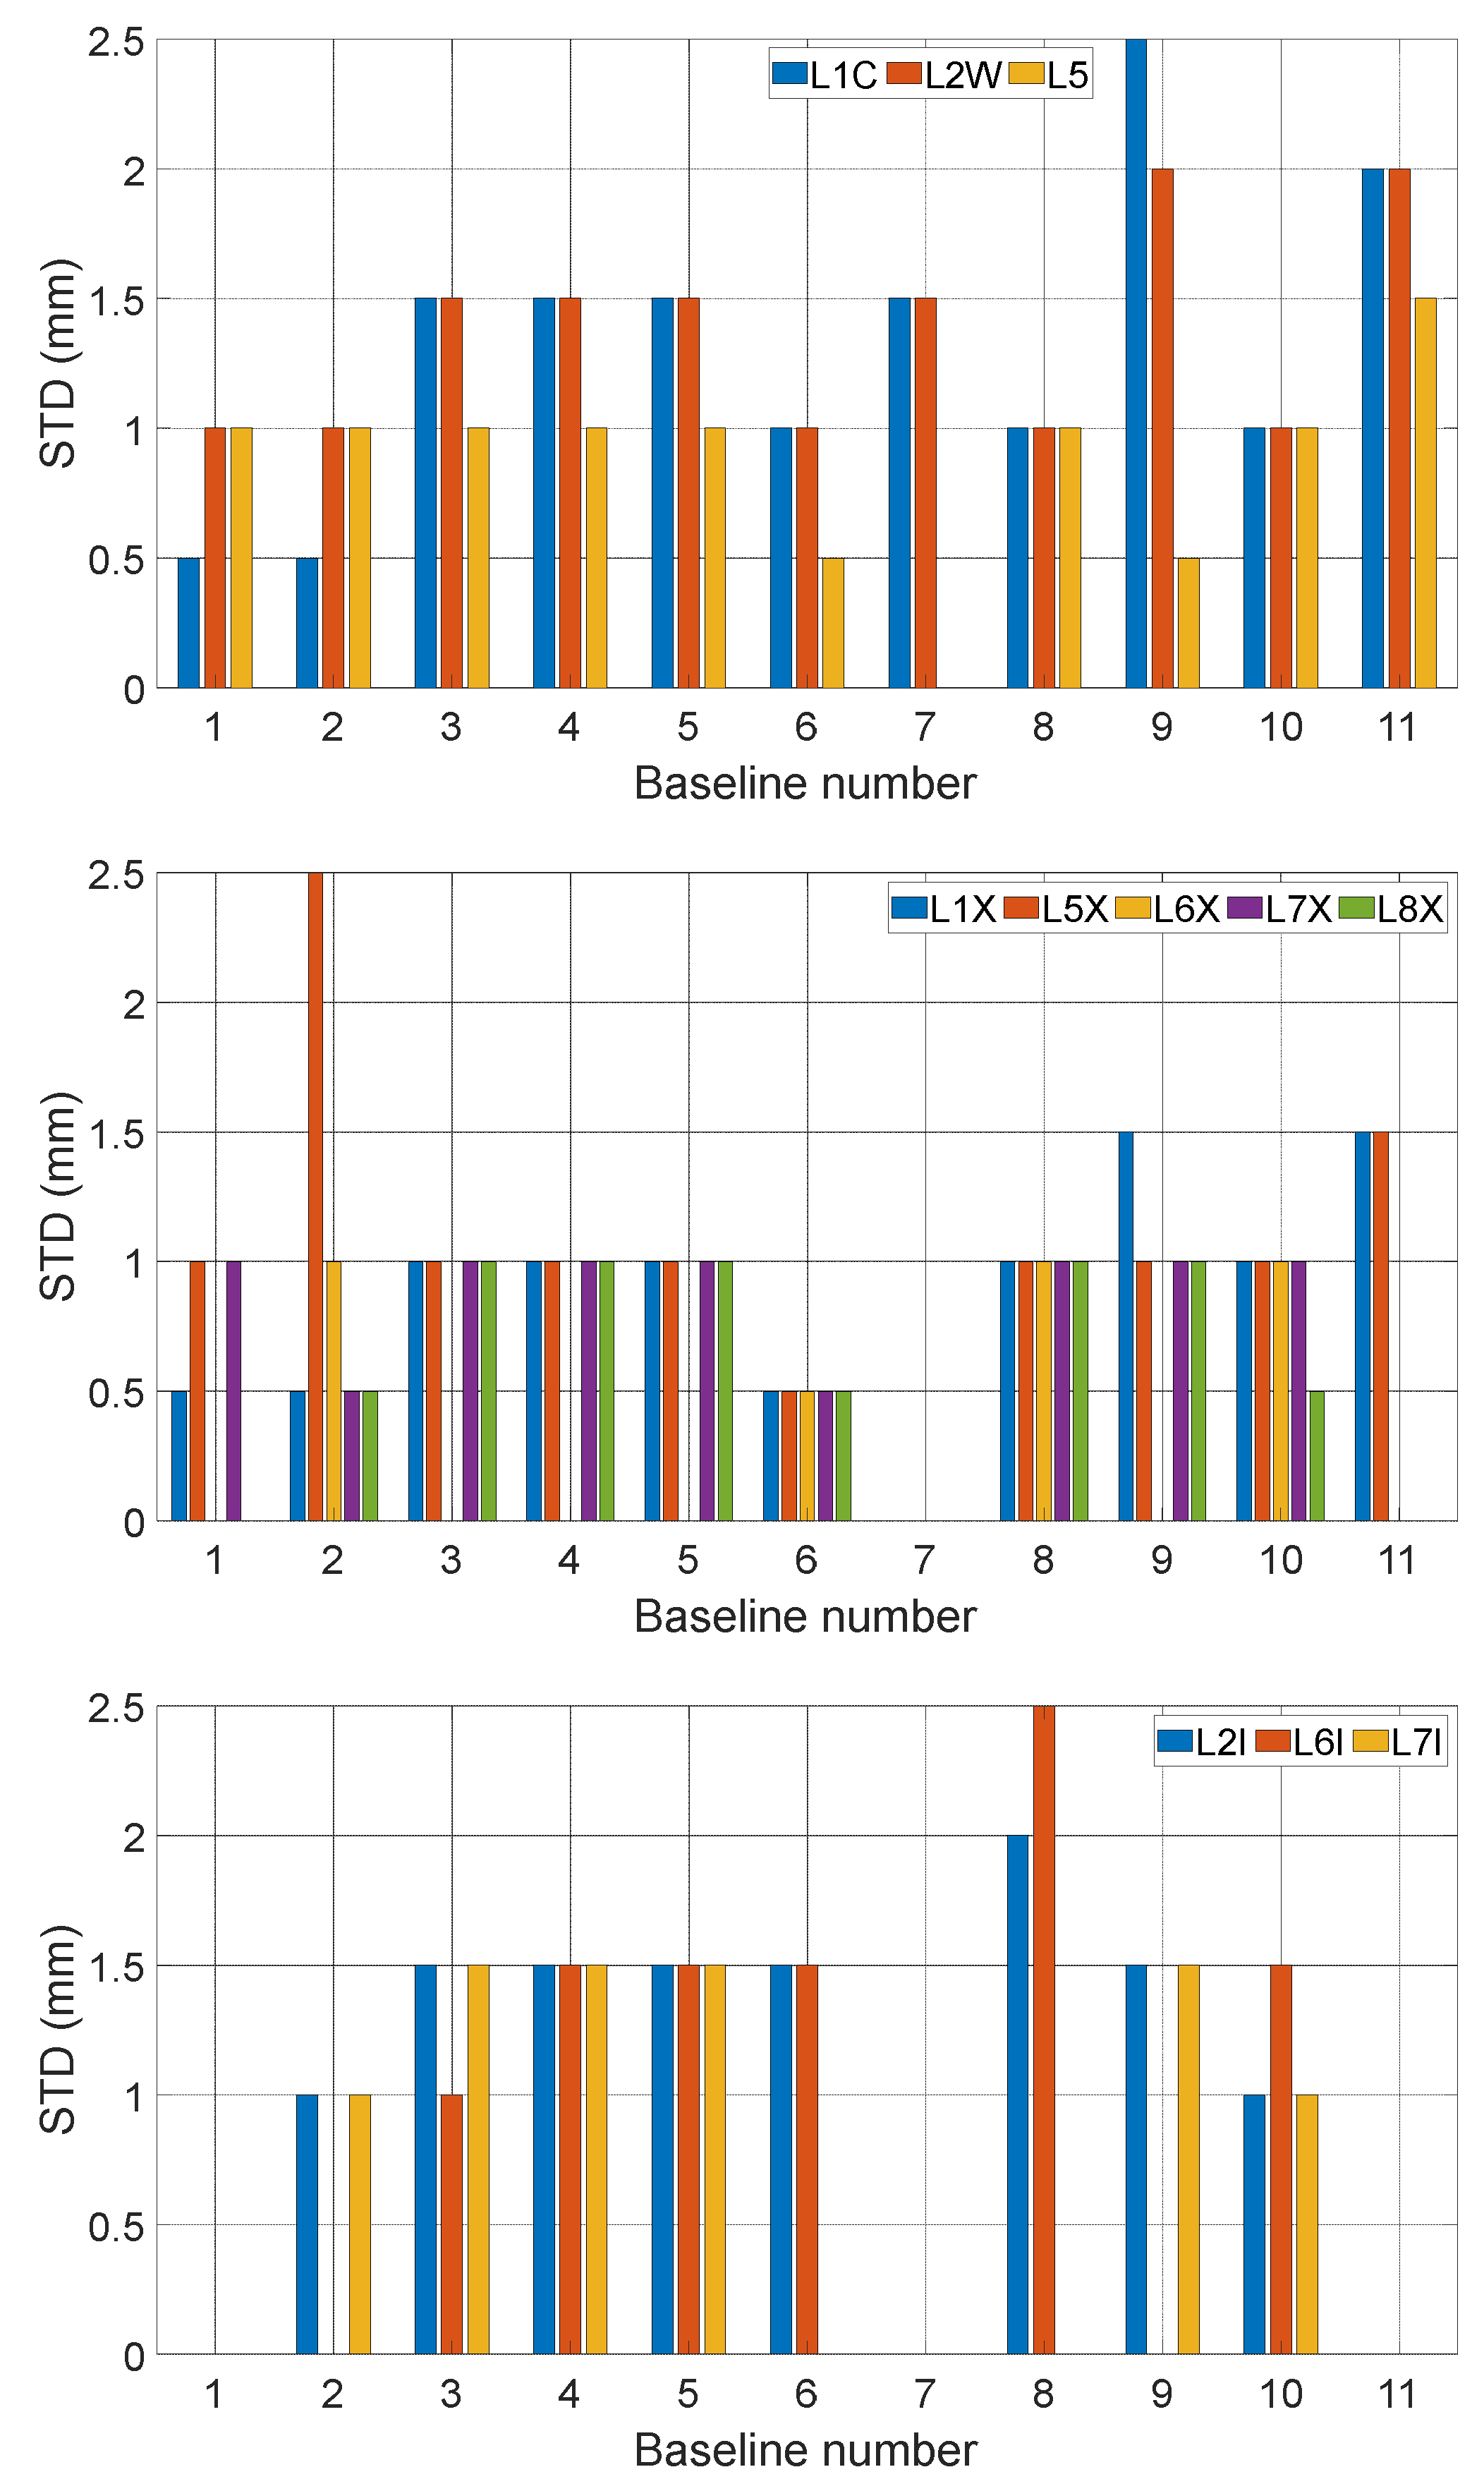
Figure 25 shows STD with elevation between 65° and 70° of different frequency bands of GPS, Galileo and BeiDou. Different from code, the STD of different frequency bands are similar. For both GPS and BeiDou, they are around 1.5mm and for Galileo, it is around 1.0 mm.
3.3.3.5. Summary
From the above results, we can see that for the first, the STD of different baselines can vary greatly, which means that different stochastic models should be established for different types of receivers. For the second, the minimum STD is generally smaller than the traditionally used carrier phase noise standard deviation 3 mm and the actual change speed of the STD with elevation is much slower than the currently used elevation-dependent weighting schemes, especially when elevation < 30° or 40°.
4. Conclusions
In this research, the observation noise levels of both code and carrier phase for different GNSS system, different frequency bands are assessed based on ultra-short baselines formed with different receiver types. And the results are compared to traditionally used elevation-dependent weighting schemes. From the results, we can see that:
The commonly used one sigma of observation noise of code and carrier phase, i.e., 0.3 m and 3 mm, is generally larger than the actual value. The reason may be due to the improvement of receiver technology and the modernization of GNSS system.
The usually used elevation-weighting schemes and are not proper for actual relationships between elevation and observation noise, especially for elevation < 30° or 40°.
The observation noise levels may vary greatly for different types of receivers and antennas. Therefore, it is more reasonable to establish different stochastic model for different types of receivers and antennas.
The code observation noise levels are different for different GNSS system and different frequency band. They can vary greatly, and some can reach cm level.
Different from code, the carrier phase noise levels are similar for different GNSS system and different frequency bands.
Acknowledgments
This research was substantially supported by the National Natural Science Foundation of China (Grant Nos. 42074028, 41704021 and 41701513), the Natural Science Foundation of Shandong Province, China (Grant Nos. ZR2020MD042 and ZR2020MD065).
References
- Amiri-Simkooei, A.; Tiberius, C. Assessing receiver noise using GPS short baseline time series. GPS Solutions 2007, 11, 21–35. [Google Scholar] [CrossRef]
- Gao, C.; Wu, F.; Chen, W.; Wang, W. (2011) An improved weight stochastic model in GPS Precise Point Positioning. Proceedings 2011 international conference on transportation, mechanical, and electrical engineering (TMEE), IEEE (2011, December), pp. 629–632.
- Farzaneh, S.; Safari, A.; Parvazi, K. Evaluation of statistical models of precise point positioning based on satellites elevation angles. Journal of Earth Space Physics 2020, 46, 205–223. [Google Scholar]
- Kamal, P.; Saeed, F.; Abdolreza, S. The mathematical weighting of GNSS observations based on different types of receivers/antennas and environmental conditions. Geodesy and Geodynamics, 2023. [CrossRef]
- Li, B.; Lou, L.; Shen, Y. GNSS elevation-dependent stochastic modeling and its impacts on the statistic testing. Journal of Survey Engineering 2016, 142. [Google Scholar] [CrossRef]
- Li, G.; Geng, J. Characteristics of raw multi-GNSS measurement error from Google Android smart devices. GPS Solutions 2019, 23, 1–16. [Google Scholar] [CrossRef]
- Li, Y.J.; Cai, C.S.; Xu, Z.Y. A Combined Elevation Angle and C/N0 Weighting Method for GNSS PPP on Xiaomi MI8 Smartphones. Sensors 2022, 22, 2804. [Google Scholar] [CrossRef] [PubMed]
- Parvazi, K.; Farzaneh, S.; Safari, A. Role of the RLS-VCE-estimated stochastic model for improvement of accuracy and convergence time in multi-GNSS precise point positioning. Measurement 2020, 165, 108073. [Google Scholar] [CrossRef]
- Satirapod, C.; Luansang, M. Comparing stochastic models used in GPS precise point positioning technique. Survey Review 2008, 40, 188–194. [Google Scholar] [CrossRef]
- Talbot, N. Optimal weighting of GPS carrier phase observations based on the signal-to-noise ratio. In Proceedings of the International Symposia on Global Positioning Systems, Queensland, Australia, 17–19 October 1988; pp. V.4.1–V.4.17. [Google Scholar]
- Tiberius, C.N.; Kenselaar, F. The stochastics of GPS observables. GPS World 1999, 9, 49–54. [Google Scholar]
- Tiberius, C.; Kenselaar, F. Estimation of the stochastic model for GPS code and phase observables. Survey Review 2000, 35, 441–454. [Google Scholar] [CrossRef]
- Wang, J.; Stewart, M.; Tsakiri, M. Stochastic modeling for static GPS baseline data processing. Journal of Survey Engineering 1998, 124, 171–181. [Google Scholar] [CrossRef]
- Wang, J.; Satirapod, C.; Rizos, C. Stochastic assessment of GPS carrier phase measurements for precise static relative positioning. Journal of Geodesy 2002, 76, 95–104. [Google Scholar] [CrossRef]
- Zhang, H.; Ji, S.; Wang, Z.; Chen, W. Detailed assessment of GNSS observation noise based using zero baseline data. Advances in Space Research 2018, 62. [Google Scholar] [CrossRef]
Figure 1.
Relationship between elevation and noise (left) and between SNR and noise (right) of C1C.
Figure 1.
Relationship between elevation and noise (left) and between SNR and noise (right) of C1C.
Figure 2.
Relationship between elevation and noise (left) and between SNR and noise (right) of L1C.
Figure 2.
Relationship between elevation and noise (left) and between SNR and noise (right) of L1C.
Figure 3.
STD of C1C observation noise (up) and comparison to and (below).
Figure 3.
STD of C1C observation noise (up) and comparison to and (below).
Figure 4.
STD of C2W observation noise (up) and comparison to and (below).
Figure 4.
STD of C2W observation noise (up) and comparison to and (below).
Figure 5.
STD of C5 observation noise (up) and comparison to and (below).
Figure 5.
STD of C5 observation noise (up) and comparison to and (below).
Figure 6.
STD of C1X observation noise (up) and comparison to and (below).
Figure 6.
STD of C1X observation noise (up) and comparison to and (below).
Figure 7.
STD of C5X observation noise (up) and comparison to and (below).
Figure 7.
STD of C5X observation noise (up) and comparison to and (below).
Figure 8.
STD of C6X observation noise (up) and comparison to and (below).
Figure 8.
STD of C6X observation noise (up) and comparison to and (below).
Figure 9.
STD of C7X observation noise (up) and comparison to and (below).
Figure 9.
STD of C7X observation noise (up) and comparison to and (below).
Figure 10.
STD of C8X observation noise (up) and comparison to and (below).
Figure 10.
STD of C8X observation noise (up) and comparison to and (below).
Figure 11.
STD of C2I observation noise (up) and comparison to and (below).
Figure 11.
STD of C2I observation noise (up) and comparison to and (below).
Figure 12.
STD of C6I observation noise (up) and comparison to and (below).
Figure 12.
STD of C6I observation noise (up) and comparison to and (below).
Figure 13.
STD of C7I observation noise (up) and comparison to and (below).
Figure 13.
STD of C7I observation noise (up) and comparison to and (below).
Figure 14.
STD of different frequency bands of GPS (up), Galileo (middle) and BeiDou (below).
Figure 14.
STD of different frequency bands of GPS (up), Galileo (middle) and BeiDou (below).
Figure 15.
STD of L1C observation noise (up) and comparison to and (below).
Figure 15.
STD of L1C observation noise (up) and comparison to and (below).
Figure 16.
STD of L2W observation noise (up) and comparison to and (below).
Figure 16.
STD of L2W observation noise (up) and comparison to and (below).
Figure 17.
STD of L5 observation noise (up) and comparison to and (below).
Figure 17.
STD of L5 observation noise (up) and comparison to and (below).
Figure 18.
STD of L1X observation noise (up) and comparison to and (below).
Figure 18.
STD of L1X observation noise (up) and comparison to and (below).
Figure 19.
STD of L5X observation noise (up) and comparison to and (below).
Figure 19.
STD of L5X observation noise (up) and comparison to and (below).
Figure 20.
STD of L6X observation noise (up) and comparison to and (below).
Figure 20.
STD of L6X observation noise (up) and comparison to and (below).
Figure 21.
STD of L8X observation noise (up) and comparison to and (below).
Figure 21.
STD of L8X observation noise (up) and comparison to and (below).
Figure 22.
STD of L2I observation noise (up) and comparison to and (below).
Figure 22.
STD of L2I observation noise (up) and comparison to and (below).
Figure 23.
STD of L6I observation noise (up) and comparison to and (below).
Figure 23.
STD of L6I observation noise (up) and comparison to and (below).
Figure 24.
STD of L7I observation noise (up) and comparison to and (below).
Figure 24.
STD of L7I observation noise (up) and comparison to and (below).
Figure 25.
STD of different frequency bands of GPS (up), Galileo (middle) and BeiDou (below).
Figure 25.
STD of different frequency bands of GPS (up), Galileo (middle) and BeiDou (below).
Table 1.
Selected ultra-short baselines with detailed information.
Table 1.
Selected ultra-short baselines with detailed information.
| No. |
name |
distance |
receiver 1 |
antenna 1 |
receiver 2 |
antenna 2 |
| 1 |
KOKB-KOKV |
0 |
SEPT POLARX5TR |
ASH701945G_M NONE |
JAVAD TRE_G3TH |
ASH701945G_M NONE |
| 2 |
YAR2-YARR |
4 |
TRIMBLE ALLOY |
AOAD/M_T NONE |
SEPT POLARX5 |
LEIAT504 NONE |
| 3 |
CUT0-CUTB |
4 |
TRIMBLE NETR9 |
TRM59800.00 SCIS |
TRIMBLE NETR9 |
TRM59800.00 SCIS |
| 4 |
CUT0-CUTC |
7 |
TRIMBLE NETR9 |
TRM59800.00 SCIS |
TRIMBLE NETR9 |
TRM59800.00 SCIS |
| 5 |
CUT0-CUTA |
8 |
TRIMBLE NETR9 |
TRM59800.00 SCIS |
TRIMBLE NETR9 |
TRM59800.00 SCIS |
| 6 |
AREG-AREQ |
15 |
SEPT POLARX5 |
TRM59800.00 NONE |
SEPT POLARX5 |
JAVRINGANT_DMNONE |
| 7 |
TSK2-TSKB |
36 |
TRIMBLE ALLOY |
TRM159900.00 NONE |
TRIMBLE ALLOY |
AOAD/M_T DOME |
| 8 |
RGDG-RIO2 |
47 |
TRIMBLE ALLOY |
TRM59800.00 SCIS |
SEPT ASTERX4 |
SEPCHOKE_B3E6NONE |
| 9 |
PTAG-PTGG |
54 |
LEICA GR50 |
LEIAR25.R4LEIT |
SEPT POLARX5 |
TRM59800.00 SCIS |
| 10 |
STR1-STR2 |
70 |
SEPT POLARX5 |
ASH701945C_M NONE |
TRIMBLE ALLOY |
LEIAR25.R3NONE |
| 11 |
HRAG-HRAO |
183 |
JAVAD TRE_G3TH |
LEIAR25.R3LEIT |
SEPT POLARX5TR |
ASH701945E_M NONE |
Table 2.
Main settings of data processing.
Table 2.
Main settings of data processing.
| Type |
Processing strategy |
| Code noise standard deviation |
0.3m |
| Phase noise standard deviation |
0.003m |
| Weighting scheme |
|
| Frequency |
multiple |
| Positioning mode |
static |
| Elevation mask |
15° |
| Satellite ephemeris/clock |
broadcast ephemeris |
| Tropospheric delay |
model correction
湿分量:实时估计 |
| Receiver antenna phase center bias |
IGS_20.atx |
| Parameter estimation method |
sequential least squares adjustment filtering |
| Outlier detection and rejection |
Yes |
| Ratio for fix ambiguity |
3.0 |
| |
|
|
Disclaimer/Publisher’s Note: The statements, opinions and data contained in all publications are solely those of the individual author(s) and contributor(s) and not of MDPI and/or the editor(s). MDPI and/or the editor(s) disclaim responsibility for any injury to people or property resulting from any ideas, methods, instructions or products referred to in the content. |
© 2024 by the authors. Licensee MDPI, Basel, Switzerland. This article is an open access article distributed under the terms and conditions of the Creative Commons Attribution (CC BY) license (http://creativecommons.org/licenses/by/4.0/).
