1. Introduction
The Japanese government has outlined a strategy to establish 100 decarbonized pioneering regions by 2025, leveraging renewable thermal energy and unused heat as part of its commitment to achieving carbon neutrality by 2050. The energy policy shift, prompted by the electricity supply shortages following the 2011 Great East Japan Earthquake, emphasizes energy conservation, renewable energy use, and the utilization of unused energy. Most of Japan’s high-demand urban areas are located on alluvial plains, where underground aquifers hold significant thermal utility value. The authors conducted large-scale heat storage experiments in Takasago City, Hyogo Prefecture, in 2016 and in the Umekita district of Osaka City in 2017, assuming practical use, and clarified that a heat recovery rate of more than 70% could be achieved across summer and winter [
1]. By using aquifers as gigantic thermal storage tanks, this technology enables the effective use of seasonal heat, contributing to energy conservation, thermal recycling, water resource preservation, and environmental protection.
The initiation of Aquifer Thermal Energy Storage (ATES) systems dates to the 1960s in Shanghai, China [
2,
3]. Subsequently, the Netherlands has capitalized on its quality aquifer resources, advanced heat source well construction technology, and favorable climate conditions to lead in ATES implementation, accounting for approximately 85% of global share with around 2,500 projects [
4]. Although China saw widespread ATES application across ten cities including Beijing, Hangzhou, and Xi’an by the mid-1960s, the projects stalled from the late 1980s through the early 1990s due to industrial policy shifts, water resource scarcity, and a lack of foundational research on groundwater utilization [
5,
6]. In Japan, extensive groundwater usage during the economic growth period of the 1950s led to land subsidence issues, prompting many regions to implement pumping regulations. Thus, ATES usage in Japan remains limited, with only seven reported cases [
7]. However, if risk assessment is carried out and appropriate use of groundwater is made depending on the mechanical properties of the ground, the risk of land subsidence can be avoided. For example, Takeno et al. pumped groundwater and found that if the groundwater level fluctuation is within 2 m (based on ground conditions in the Umekita area of Osaka City), the effect of subsidence is extremely small and there are no problems in using ATES [
8].
This study reports on the experience of installing and operating ATES for air-conditioning in a centrifugal chiller manufacturing plant. In the target factory, the manufacturing process is concentrated in the wither for summer shipment, so the operation time during winter heating is long and the heating load tends to be larger thanthe cooling load. In ATES, if this is not taken into account, the imbalance in the heat storage volume due to water return and pumping will be reduced, and sustainable ATES utilization is not possible.
To prevent such scenarios, regulations in the Netherlands require accumulated thermal storage to be balanced within 0-15% within 5-10 years. While no specific regulations exist in Japan, balancing annual accumulated thermal storage and pumping volume is crucial for the stable, long-term operation of ATES systems [
9]. Failure to maintain balance can lead to the problems such as those detailed below.
(1) Problems with Imbalance in Annual Pumped Water Volume
If the annual pumped water volume is not balanced, an imbalance in the pumping volume will gradually occur, leading to one of the thermal storage masses expanding significantly. Eventually, this can reach the other heat source well, resulting in a reduced heat recovery rate due to thermal interference. Therefore, it is essential to maintain a balance in the annual pumped water volume.
(2) Problems with an Imbalance in Annual Accumulated Thermal Storage
If the annual accumulated thermal storage is not balanced, the annual average temperature of the aquifer in the thermal storage area will rise or fall. This imbalance can lead to a decrease in the efficiency of thermal source equipment utilizing ATES and thermal pollution of the surrounding aquifers, potentially impacting local ecosystems. If the balance of annual accumulated thermal storage and pumped water volume is maintained, the service life of ATES is generally estimated to between 30 to 50 years.
Hecht-Mendez et al. have conducted simulations in the Netherlands showing that if the balance of thermal storage and pumped water volume is not maintained, the thermal storage and water volume in the ground will diffuse through natural thermal conduction and groundwater flow rates, taking hundreds of thousands of years to return to their original state. The impact of a decommissioned ATES can last longer underground than the lifespan of a building, necessitating the management of underground thermal impacts if the land is to be used for extended periods. Therefore, ATES should be operated in a way that all heat is recovered during use [
10].
Martin Bloemendal et al. have pointed out that even if the location of heat wells is determined with full consideration of thermal equilibrium in the preliminary simulation, thermal interference between hot and cold wells could occur 75 years later. The first step in devising a strategy for thermal balance involves understanding the temperature distribution around the heat wells, although specific methods have not been mentioned [
11].
Bloemendal et al. have proposed installing two heat wells (in the direction of environmental flow) instead of one when the groundwater flow rate exceeds 25m/Y, to prevent heat loss due to the movement of surrounding groundwater and to enhance the heat recovery rate. Specific operational methods, including the distance between heat wells and the sequence of pumping from both wells have been described, but detailed operational methods have not been provided [
12].
Martin Bloemendal et al. analyzed factors affecting the heat recovery rate, such as the maximum heat storage capacity and the extent of heat diffusion due to environmental flow, based on data from 331 low temperature (below 25°C) ATES operations actually installed in the Netherlands, and analyzed the building load-side heat storage required to achieve the maximum heat storage recovery rate [
12]. The conditions for aquifer depth and heat source well distance were analyzed. In the Netherlands, it is possible to install screens according to the load because of the large aquifer thickness, whereas in Japan ATES must be installed even where the aquifer thickness is small. Therefore, it is necessary to install finely divided screens according to the structure of the clay and aquifer so that the aquifer can be utilized without waste and the heat recovery rate can be increased as much as possible.
Mariene Gutierrez-Neri et al. conducted a sensitivity analysis on the heat recovery rate of high-temperature (60°C to 100°C) heat well High-temperature Aquifer Thermal Storage Systems (HTES) [
13]. The thermal storage efficiency correlates with Rayleigh Number, so it is possible to combine parameters such as screen position and length, as well as temperature differences, according to equipment load during basic design, but they do not mention the heat recovery rate of low-temperature heat wells.
This study reports on the heating and cooling performance results of operating ATES near a fault in the complicated geological area of Wadamisaki, Kobe City, Japan, for four years. First, in Chapter 2, we will discuss the operational method for balancing the annual accumulated thermal storage volume and pumped water volume between the low-temperature and high-temperature wells, which are the premises for operating ATES. Next, using operational performance data, we will evaluate the results from two perspectives: the building side and the heat source well side (underground), which will be analyzed in Chapters 3 and 4, respectively. Finally, in Chapter 5, the operation method for the following years is discussed, taking into account the equilibrium of the annual accumulated heat storage and pumping volume in the future.
2. Overview of the Demonstration Equipment and Design
2.1. Basic Design Conditions
The air conditioning system discussed in this research was newly installed in the target factory. The basic design conditions, design procedures, and ATES operational methods are summarized below.
The Design conditions are based on the Building Equipment Design Standards of the Ministry of Land, Infrastructure, Transport, and Tourism (MLIT) of Japan, specifically for the Kobe area.
- (1)
Heat load due to internal heat generation
- (2)
Heat load from windows
- (3)
Heat load from external walls
- (4)
Heat load from internal walls
- (5)
Heat load due to the introduction of outside air
As a result, the peak loads for cooling and heating were determined to be 297RT.
- 2
Setting of Cooling and Heating load Patterns
The cooling and heating load patterns were adjusted referring to the manual for district heating and cooling of commercial facilities in Japan, ensuring the peak load matched the calculated 297RT, and the operational conditions were planned accordingly.
- 3
ATES Operational Plan
As shown in
Table 1, considering Kobe City is in western Japan, the cooling load is greater than the heating load. To ensure long-term and stable operation of ATES, it is crucial to maintain equilibrium in the annual accumulated heat storage throughout the year. Therefore, the factory planned to cover the entire heating load with ATES during the winter, and to use conventional cooling towers for auxiliary operation in June and July when the external air temperature is lower to address the insufficient cooling load. The operational plan for ATES was set to maintain a injection temperature difference of ±5°C relative to the initial groundwater temperature of 19.8°C, planning for a injection temperature of 15°C during heating operation and 25°C during cooling operation.
2.2. Geological Conditions around Wadamisaki Kobe City
Cape Wadamisaki, Kobe, is a coastal area, but is close to a mountainous area, and the strata were formed in an alluvial fan-like deltaic depositional environment. As a result, gravelly, sandy and muddy parts with poor lateral continuity are repeatedly deposited, forming alternating layers up to 1 to 2 m thick, sandwiched between marine clay layers, forming relatively low permeability and unstable aquifers [
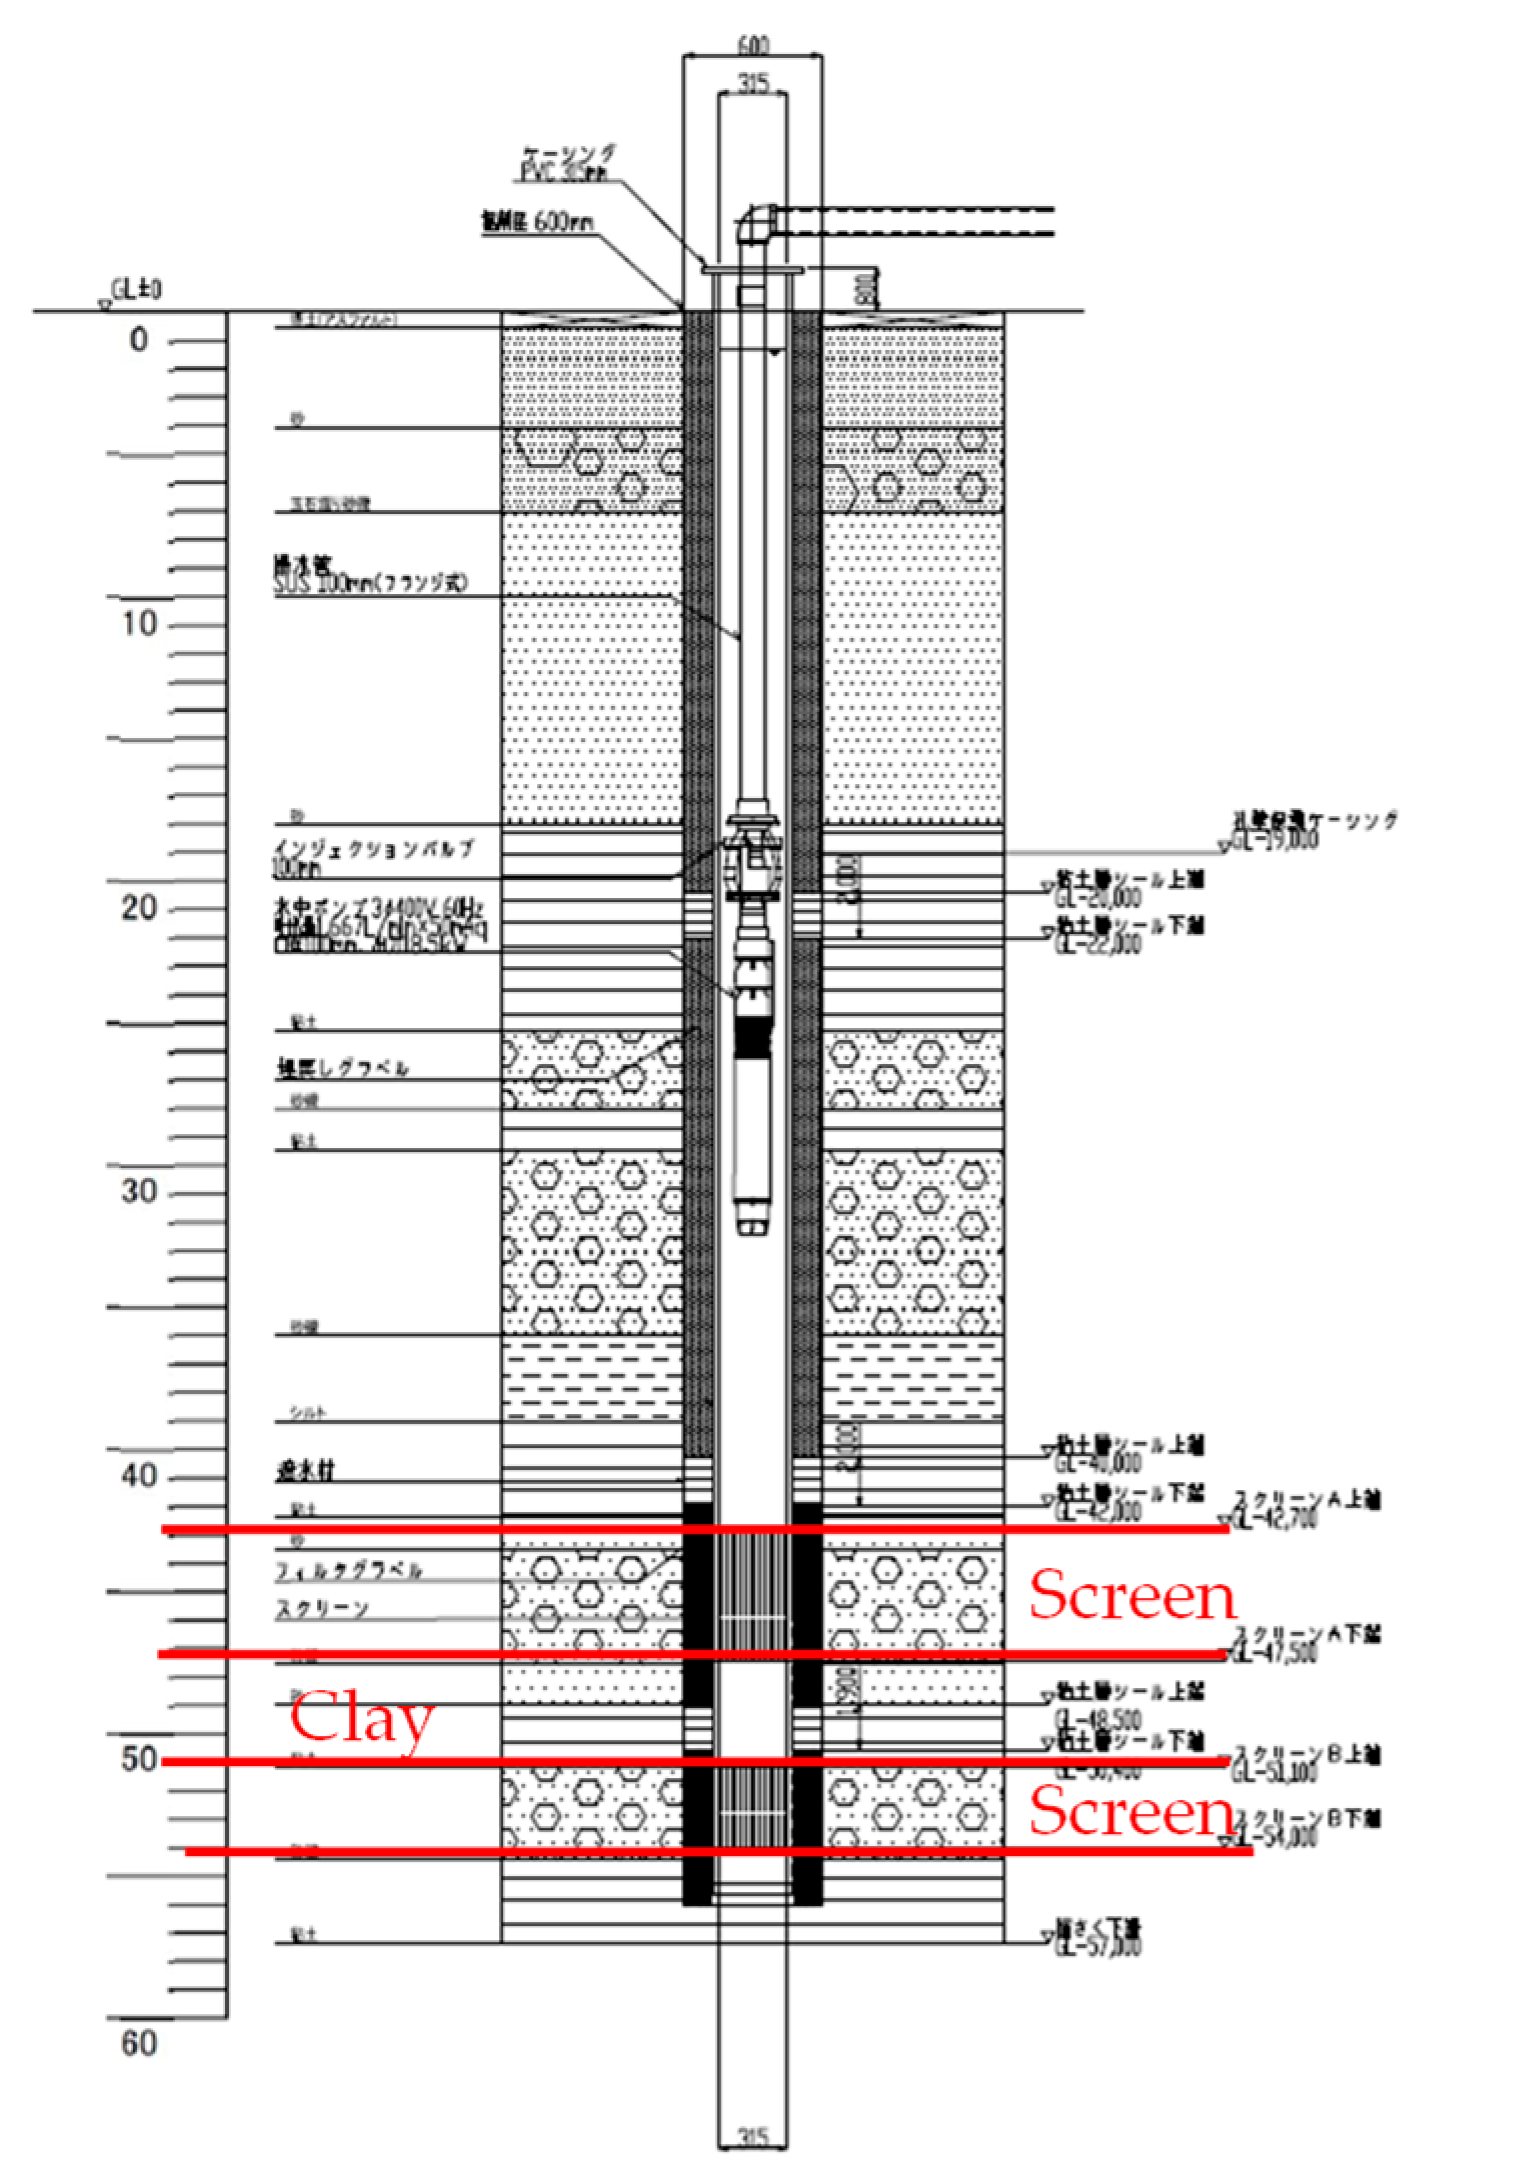
14]. Additionally, the area around Wadamisaki is affected by faults branching from the Osaka Bay Fault running northeast from Awaji Island in the western part of Osaka Bay, leading to deformed strata with larger inclinations compared to other regions, making aquifer layers not horizontally consistent. As illustrated in
Figure 1, the complexity of the ground at the factory site, with clay layers interbedded among aquifers, necessitated careful determination of screen positions to maximize the use of the available aquifer thickness. In contrast, in the Netherlands [
11], as mentioned earlier, ATES systems have been operated for 30 years, utilizing groundwater from depths of 25m to 250m, with aquifer thickness ranging from about 20m to 150m, differing significantly from the geological conditions at the factory.
During the construction of wells at the factory, differences in groundwater conditions between the high-temperature and low-temperature wells became apparent. After the construction of the heat source wells and conducting pumping tests, it was found that while 60m3/h could be pumped from the high-temperature heat source well (Heat Source Well 2), only 30m3/h could be pumped from the low temperature heat source well (Heat Source Well 1). Given the current pumping volumes, it was impossible to meet the heating load, leading to a revision of the initial basic design plan by increasing the temperature difference, adjusting the injection temperature from 15°C to 10°C.
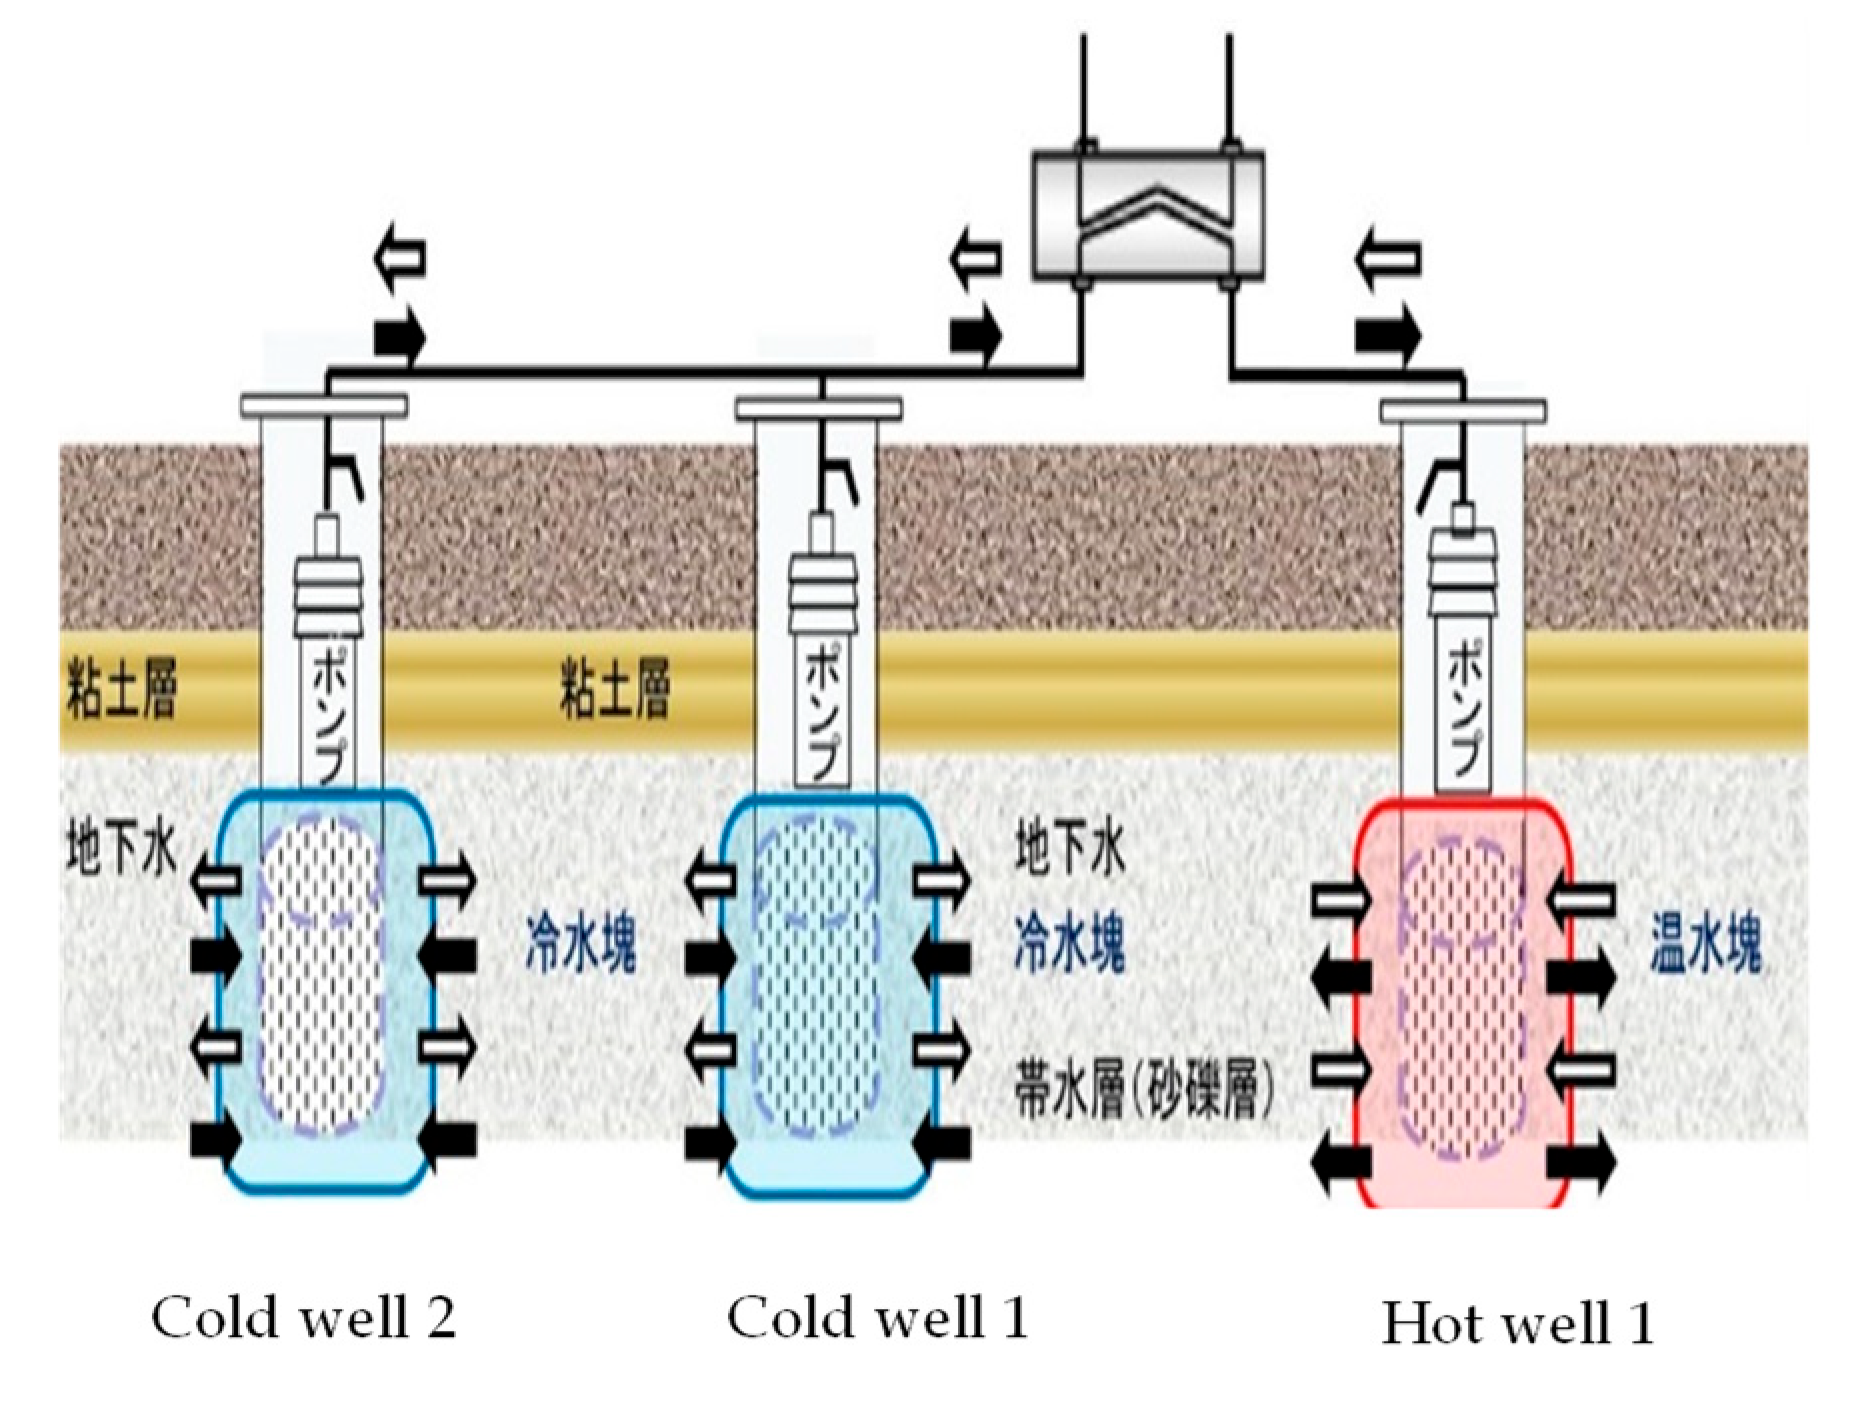
One year after the start of operations, to ensure stable long-term ATES operation and to secure sufficient water volume for factory air conditioning at a level of 700kW, Heat Source Well 3 was constructed at the low-temperature heat source well, changing the operation to three wells in total, as shown in
Figure 2. This experience highlighted the necessity of conducting multiple geological surveys
note1 at potential ATES sites and, if necessary, additional construction work to address areas with poor lateral continuity. After the construction of the three heat source wells, there were no issues with land subsidence or clogging, leading to a decrease in pumping volume.
Note 1: Geological survey refers to the process of understanding the geological overview, structure, sampling analysis through boring surveys, estimating permeability coefficients from particle size distribution, analyzing the impact of land subsidence, evaluating pumping volumes, and creating geological structural diagrams to assess the applicability of ATES.
2.3. Overview of Demonstration Equipment
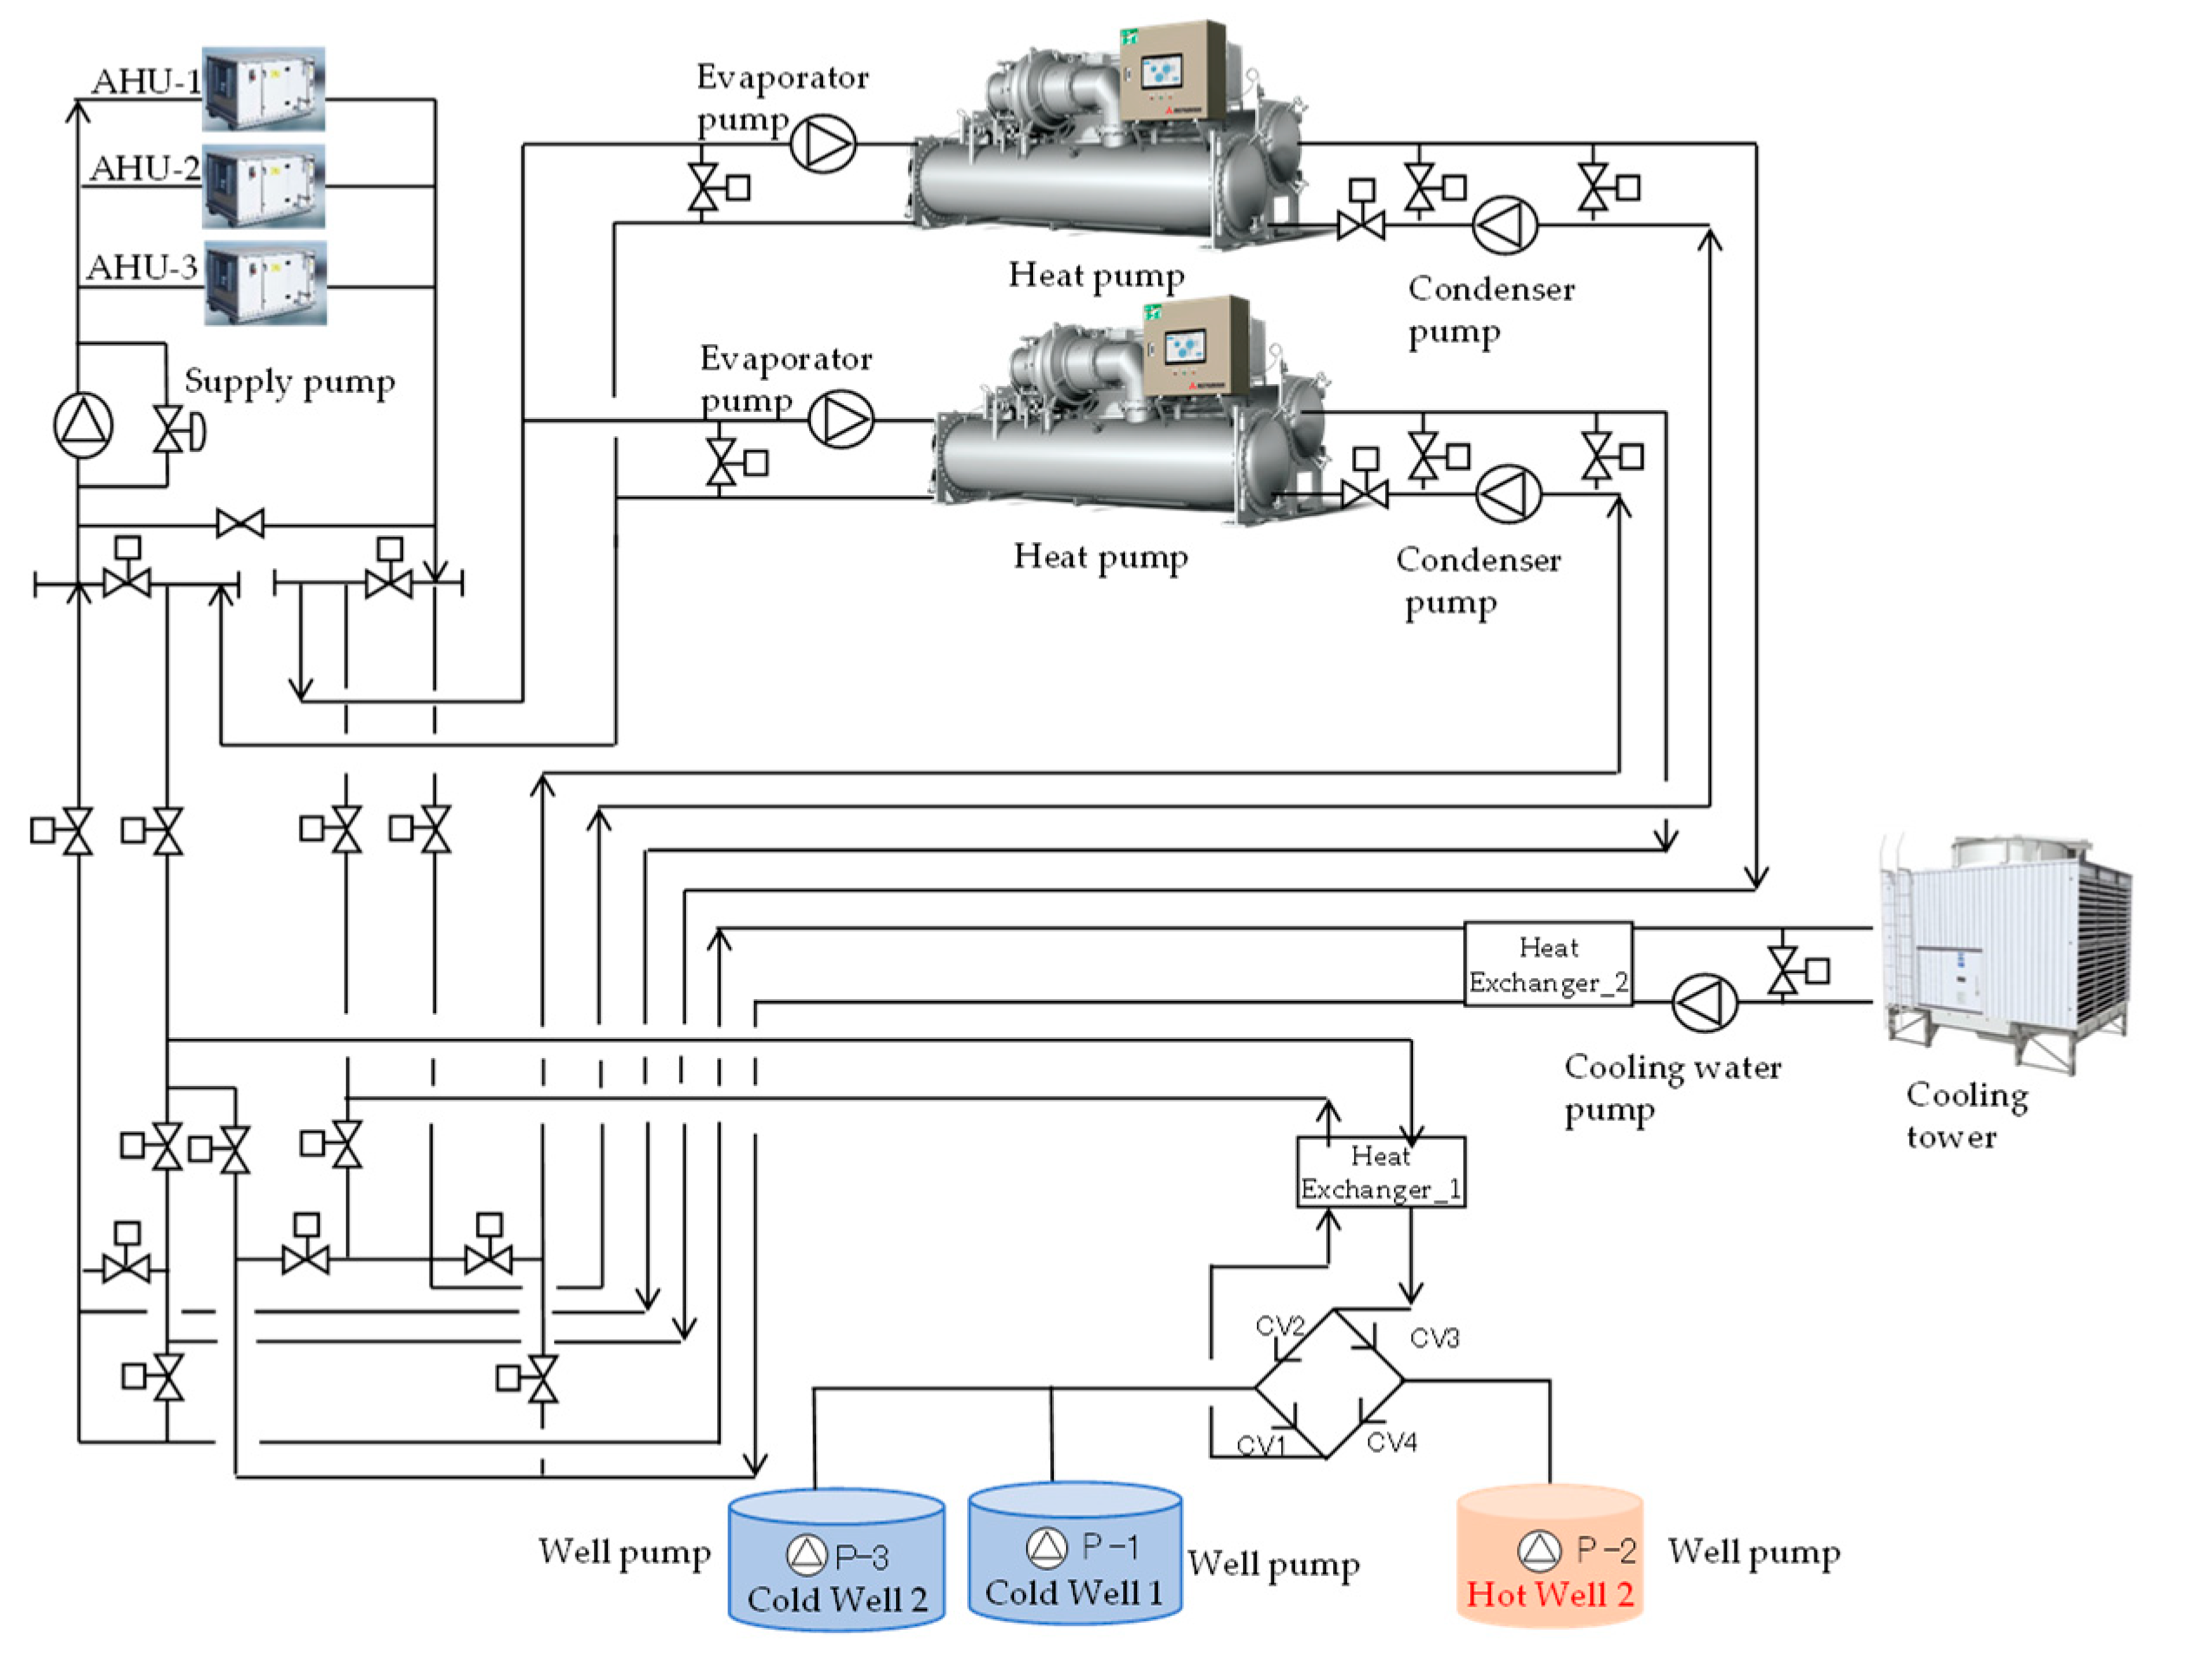
The equipment operates with two centrifugal turbo heat pumps (one serving as a backup), supplying cooling and heating for the entire factory. The overall system diagram is shown in
Figure 3, building overview in
Table 2, and ATES thermal equipment specifications in
Table 3 [
15].
3. Performance Evaluation from the Perspective of the Building Side
The performance evaluation from the building’s perspective, including building cumulative load, Coefficient of Performance (COP) note2, Seasonal Coefficient of Performance (SCOP) note3, accumulated thermal storage, and imbalance of heat quantity, was conducted using data collected at one-minute intervals from the demonstration equipment from December 2019 to October 2023 note4. The definitions of various quantities used in the evaluation of operational performance values are shown in equations (1) to (2).
The thermal storage on the building load side is defined by equation (1). During the summer cooling period, when the thermal storage of warm water occurs, and
,
becomes positive. Conversely, during the winter heating period, when the thermal storage of cold water occurs, and
,
becomes negative. k represents the season number assigned to winter and summer each year. Within the same season, the seasonal cumulative value of the pumping volume
and the seasonal cumulative value of the injection volume
are equal.
Note 2: COP refers to the ratio of building load to power consumption, indicating that a higher value represents greater energy efficiency.
Note 3: SCOP (Seasonal Coefficient of Performance) for building load equals the building load divided by the total power of the equipment. The total power of the equipment is the sum of the power of the centrifugal chiller compressors, various pumps, and cooling tower fans, as shown in
Table 3.
Note 4: From August 23 to September 9, 2020, despite the factory’s heating and cooling supply being operational, there was missing data due to a malfunction in the energy management control system. Therefore, linear interpolation using the data before and after this period was employed.
A summary of the performance results from four years of operational data is presented in
Table 4. Additionally, for a detailed temporal analysis, the transition of daily accumulated loads is shown in
Figure 4, the transition of power consumption, COP, and SCOP of the thermal source equipment in
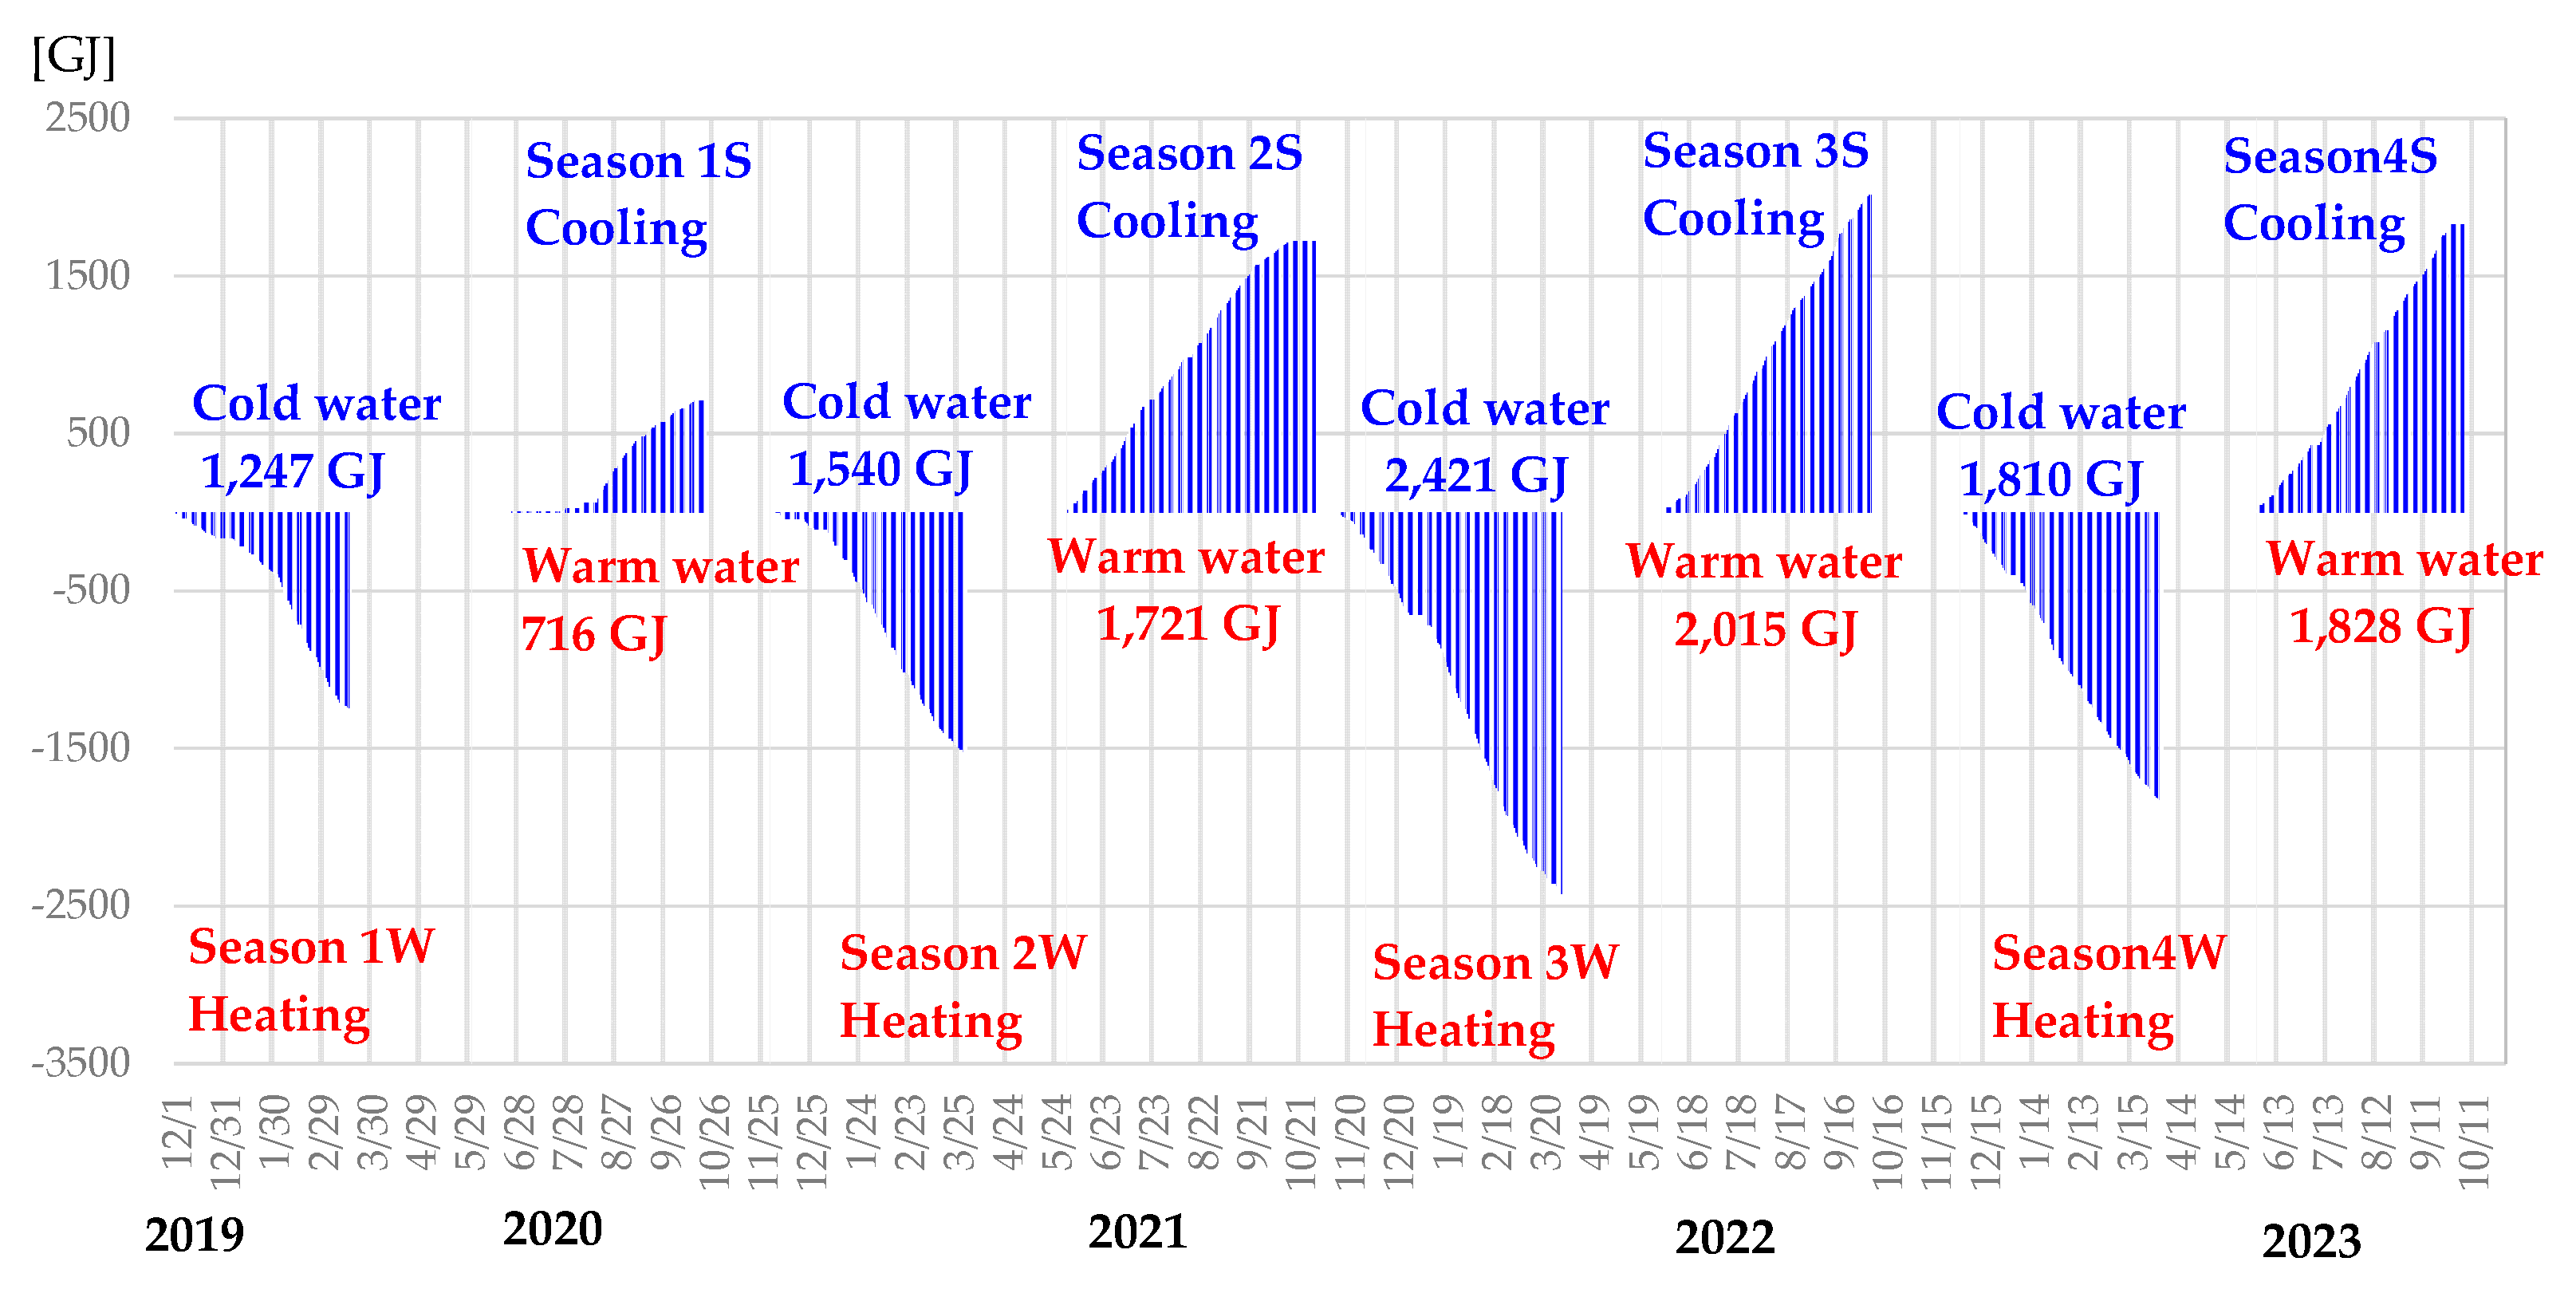
Figure 5, the transition of accumulated thermal storage in
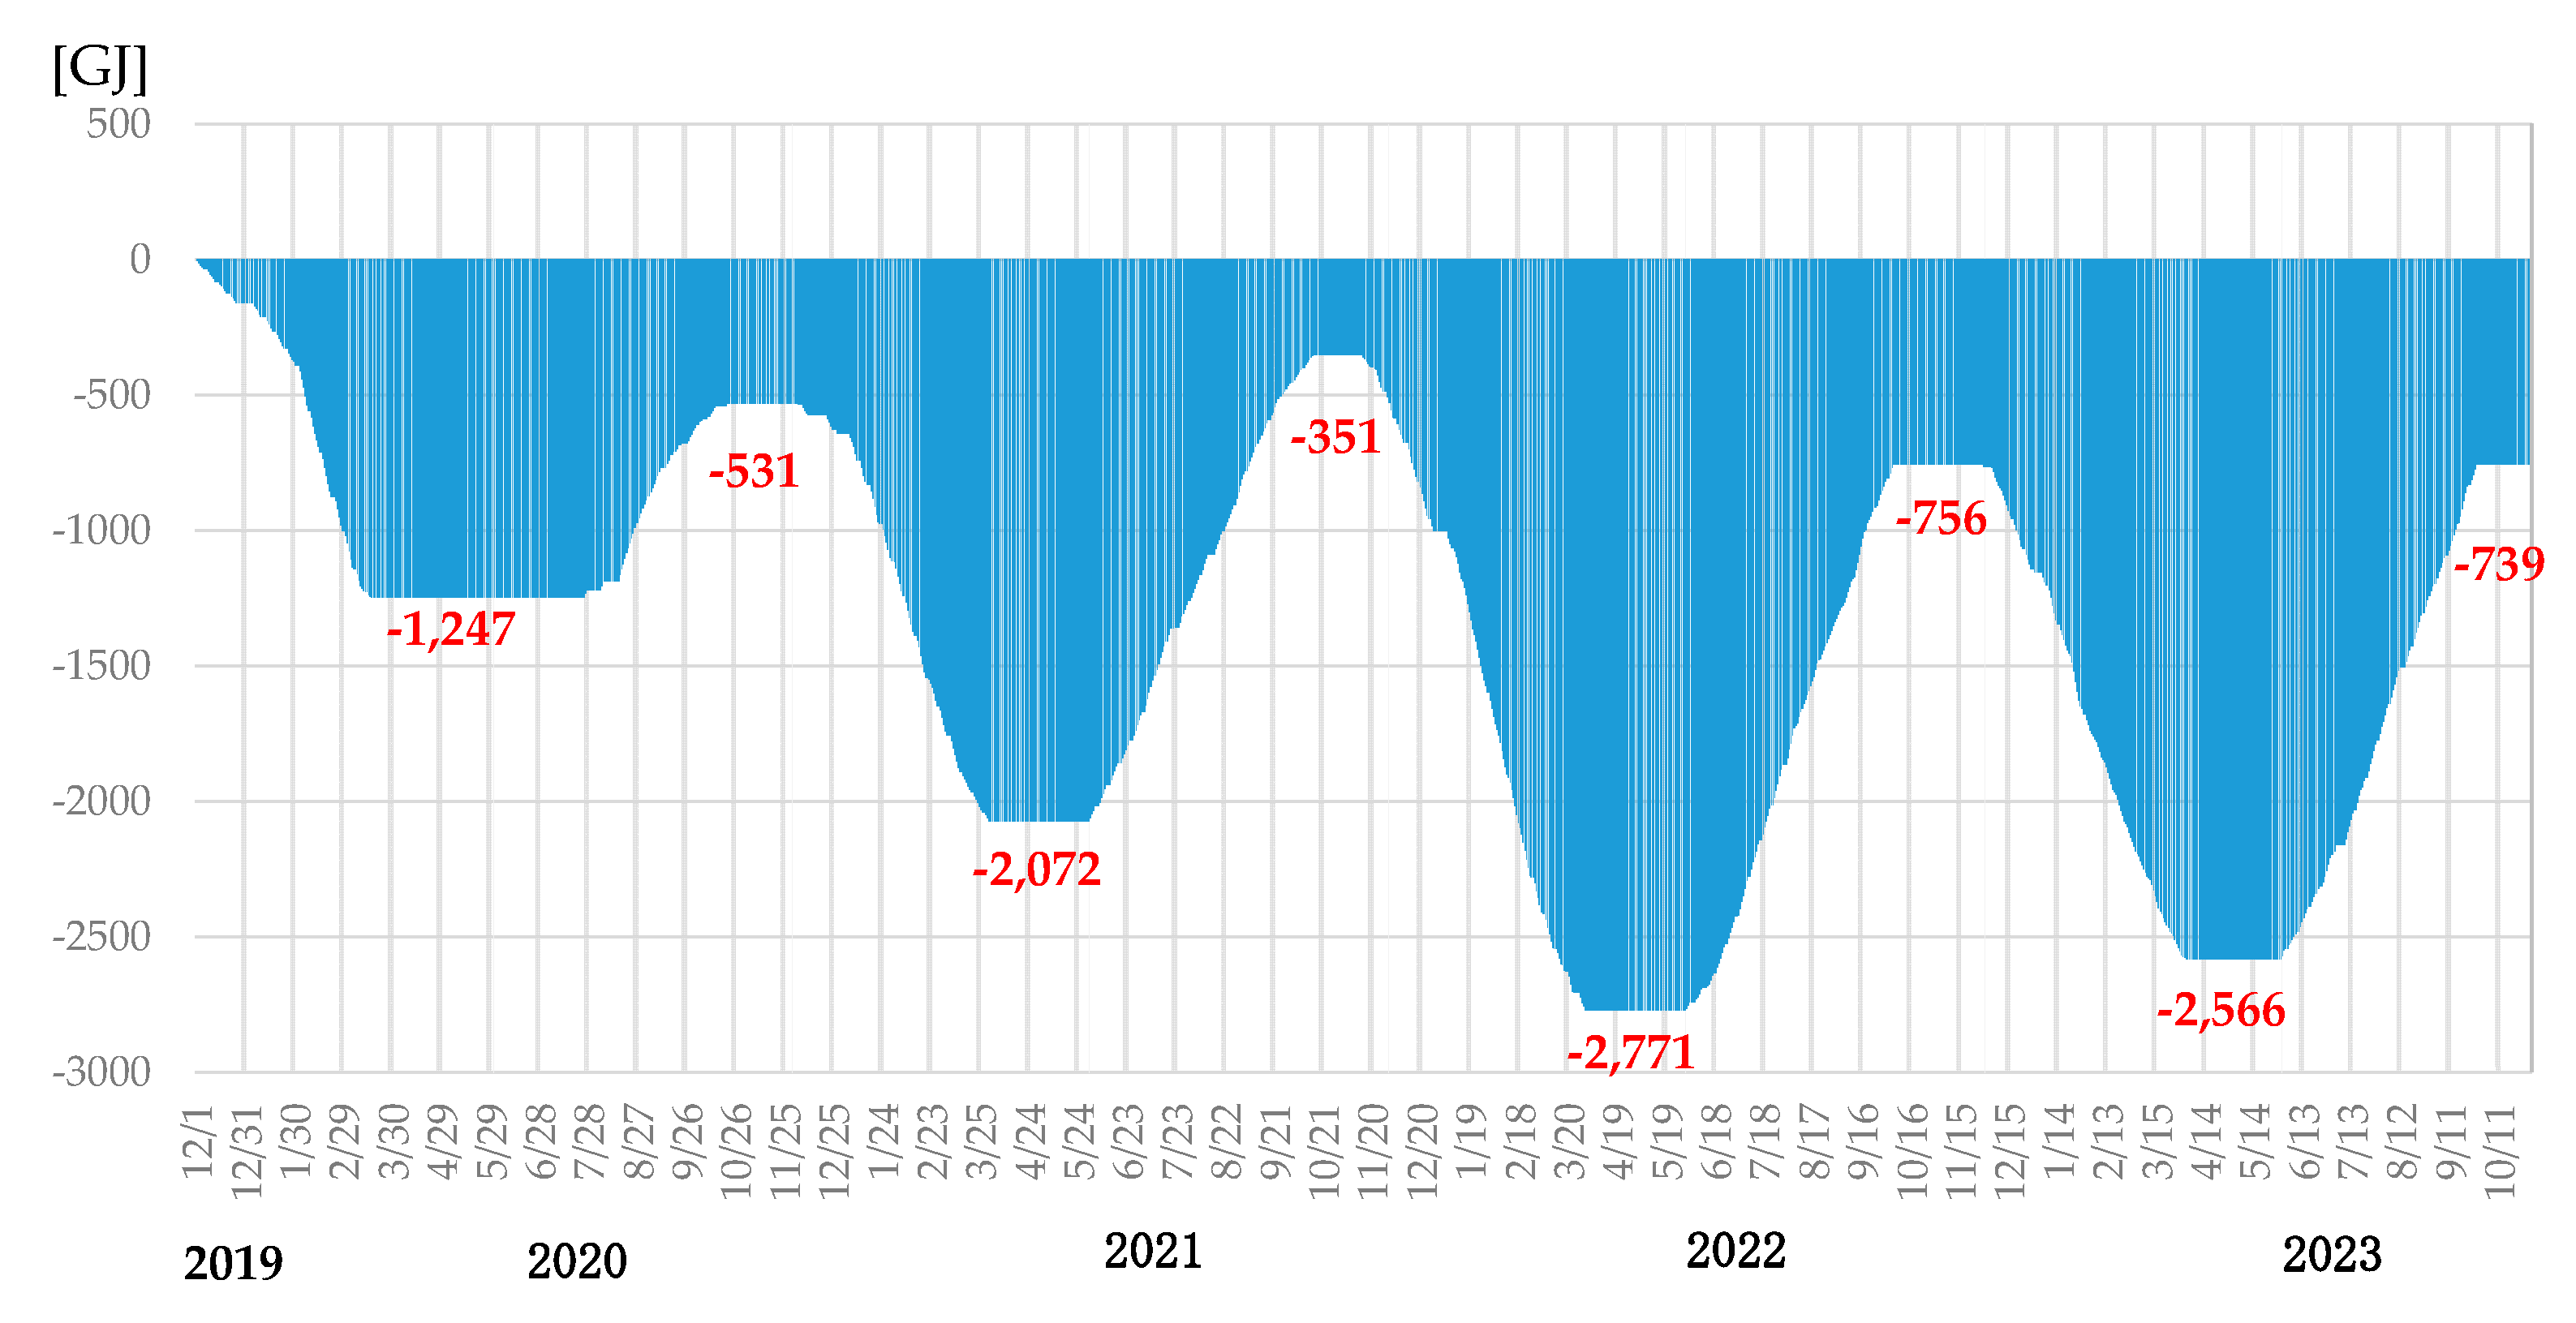
Figure 6, and the transition of the imbalance of heat quantity over the years in
Figure 7.
From
Table 4, the maximum daily accumulated load during cooling is 9,719 kWh, and during heating, it is 11,438 kWh, indicating that the heating load is higher than the cooling load. This is because, during summer, the system operated for continuous 12-hour cooling operations, whereas, in winter, it underwent 21-hour continuous heating operations. The average SCOP for both cooling and heating over the four years is 5.0. It is observed that the average SCOP for heating gradually increased over the four years. Except for the first year, the average SCOP for cooling has been maintained at nearly the same value. The SCOP for the first cycle was 4.9 for cooling, which significantly improved to 6.1 from the second cycle onwards, a substantial increase from the first cycle. This improvement is attributed to not using ATES during June and July of the first cycle and operating with conventional cooling towers instead, which resulted in a higher inlet temperature of cooling water into the centrifugal chillers than when ATES was used, along with the operation of cooling water pumps and cooling tower fans, thereby increasing power consumption.
Furthermore, as shown in
Figure 5, the SCOP for both cooling and heating gradually decreases over time within the same season. The reason for the decrease in SCOP is attributed to the reduction in stored thermal energy over the operational time, leading to an increase (or decrease) in production temperature. Consequently, this resulted in a decrease in the COP of the centrifugal chillers, and thus, SCOP decreased as well. In November, due to the small heating load, the centrifugal turbo heat pump is operated at a low load rate, which is believed to have led to a decrease in performance due to the characteristics of the centrifugal turbo heat pump equipment.
As can be seen from
Table 4, during the first cycle, the accumulated thermal storage of cold water during heating significantly exceeded the thermal storage of warm water during cooling, disrupting the balance of thermal storage.
In Season 1W, thermal storage (cold water) of -1,247 GJ was conducted in the low-temperature heat source well, and in Season 1S, this cold water was pumped out and 716 GJ of thermal storage (warm water) was conducted in the high-temperature heat source well. Since the thermal storage in summer is less than that in winter, it is assumed that the cold water remains in the low-temperature heat source well, not being used as the source water for cooling by the centrifugal chiller during the cooling period. In this study, this is regarded as cold water that can be used in the future, referred to as the imbalance of thermal energy, and quantified as -531 GJ. The reason for the reduced thermal storage of warm water in Season 1S is due to not utilizing ATES during the June and July period, instead operating with conventional cooling towers, which resulted in an inability to store heat in the aquifer.
In Season 1S, thermal storage of warm water was carried out in the high-temperature heat source well, totaling 716 GJ. However, in Season 2W, cold water thermal storage amounted to -1,540 GJ, with the volume of cold water storage exceeding that of warm water. Consequently, it’s inferred that all the warm water stored in the high-temperature heat source well during Season 1S was entirely consumed in Season 2W. Additionally, the deficit was supplemented by pumping groundwater at its original ambient temperature. Thus, under conditions where the difference in thermal energy becomes negative, the imbalance of thermal energy is considered to be zero, and the residual thermal energy in the high-temperature heat source well for Season 2W is also considered to be zero. The imbalance of cold water thermal energy is evaluated independently for the low-temperature and high-temperature heat source wells.
Season 2S improved the operational methods based on the actual performance data from Season 1S. From the beginning of the cooling period, the imbalance of cold water thermal energy stored in the low-temperature heat source well during Season 2W was utilized to perform warm water thermal storage in ATES, amounting to 1,721 GJ. As a result, the warm water thermal storage in Season 2S exceeded the cold water thermal storage of -1,540 GJ from Season 2W, significantly improving the imbalance of cold water thermal energy in the low-temperature well to -351 GJ by the end of Season 2S.
However, in Season 3W, cold water thermal storage of -2,421 GJ was conducted, and when combined with the imbalance of cold water thermal energy of 351 GJ from Season 2S, the total became -2,771 GJ, making it the season with the highest imbalance of cold water thermal energy to date. The reason for the increased imbalance of cold water thermal energy during Season 3W, despite the factory not operating, was due to an operator’s mistake in March 2022, which led to 24-hour heating operation, resulting in unnecessary accumulation of cold water thermal storage.
Repeating the process of thermal storage and discharge of cold and warm water in Seasons 3S, 4W, and 4S, finally in season 4S an imbalance of -739 GJ of cold water thermal energy was left, indicating a need in Season 5W to consider the previous load patterns, adjust heating operation time, and maintain thermal storage balance.
4. Performance Evaluation from the perspective of the heat source well
For the long-term and stable operation of ATES, it is essential to calculate the heat recovery rate based on actual values for each cycle and analyze the parameters that affect the heat recovery rate. Among these parameters, the increase in production temperature significantly impacts the performance of the heat source well. Therefore, this chapter analyzes the heat source well production temperature, heat recovery rate, and thermal storage balance in relation to the original ambient temperature of the heat source well side (underground).
Thermal storage is evaluated based on the original ambient temperature
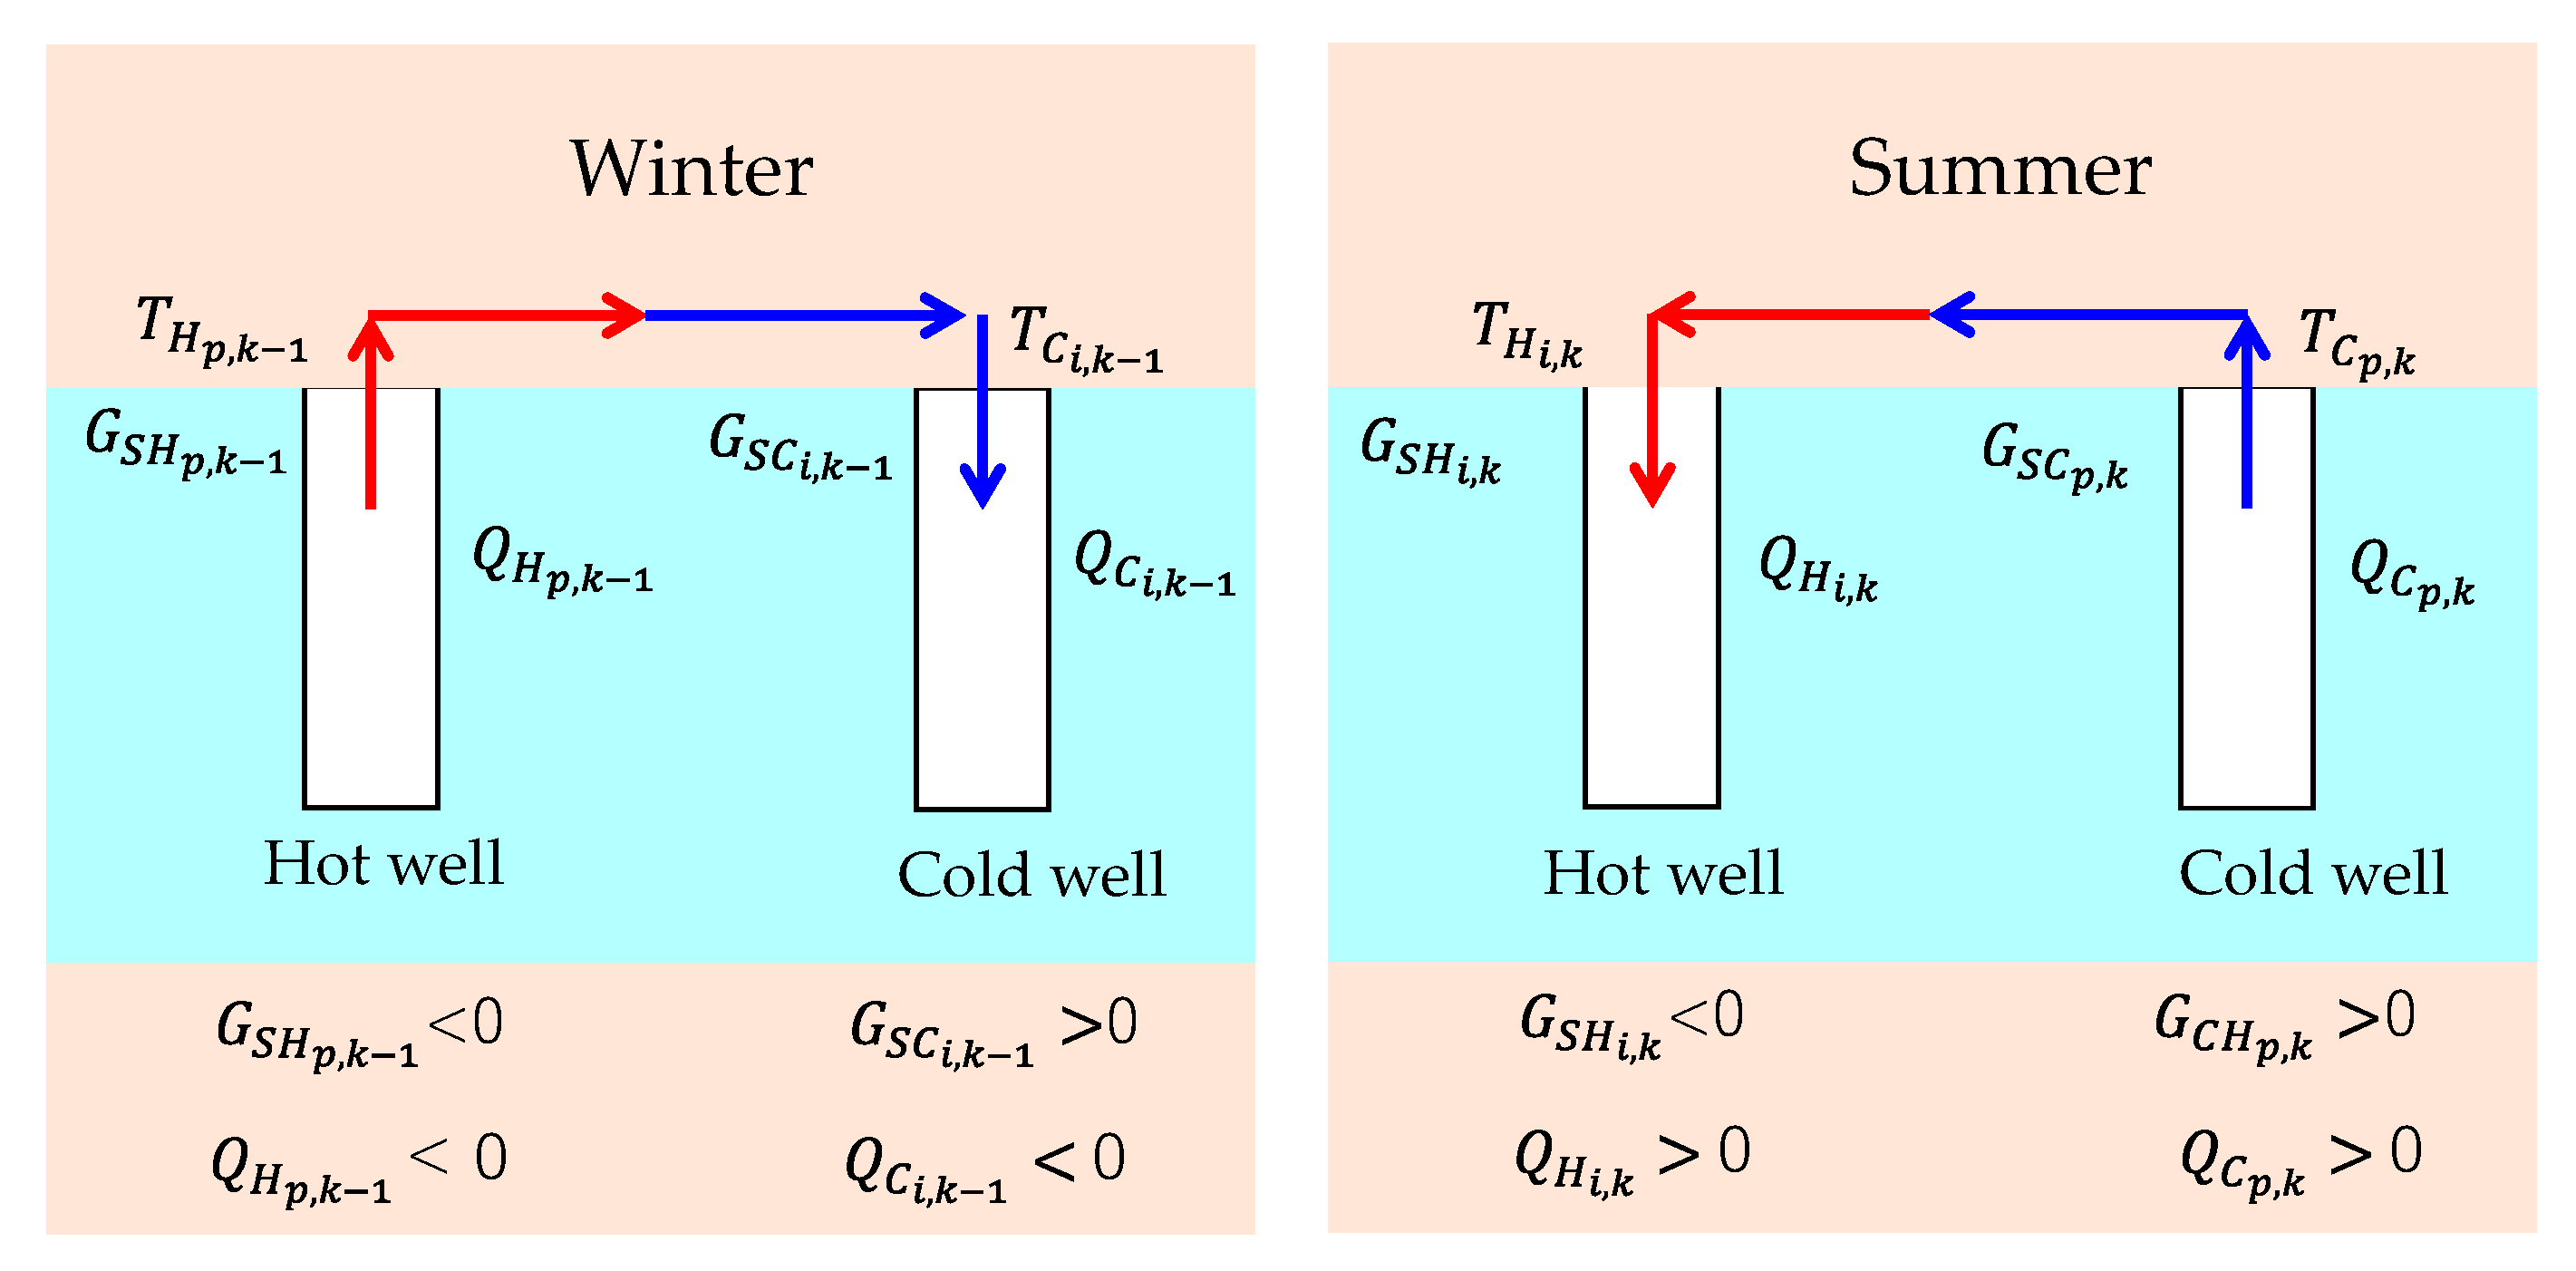
, with the pumped thermal storage by equation (3) to (6). To evaluate against the original ambient temperature of the heat source well side (underground), the explanation includes the positive and negative flows of mass and heat in the formulation will be explained using
Figure 8.
The definition of positive and negative thermal storage is based on the original ambient temperature
as the reference temperature, where temperature difference greater than
are positive, and those less than
are negative. The volume of returned water is set positive for both the hot water and cold water wells, while the volume of pumped water is negative. Thus, based on the flow rate and temperature positivity or negativity, the heat positivity or negativity is determined. The heat inflow to the high-temperature heat source well associated with warm water return becomes positive. The outflow from the high-temperature heat source well associated with warm water pumping is negative, the heat inflow to the low-temperature heat source well associated with cold water return is negative, and the heat outflow from the low-temperature heat source well associated with cold water pumping is positive.
4.1. Production Temperature Prediction Model
Equations (7) to (10) denote either summer or winter as season . A year is divided into a heating season and a cooling season. In the process of determining the equations for accumulated thermal storage and pumping volume balance, season can be assumed to be either summer or winter.
Doughty [
16] defines the heat recovery rate
for each season as the ratio of the produced (extracted) energy to the input energy when an equal amount of water is returned to and then pumped from the aquifer. The amount of water energy is defined based on the original initial temperature
of the aquifer. The heat recovery rate
for season
is shown in equation (7). However, this equation can also be expressed as equation (8) when the accumulated return flow volume
for season
is equal to the pumping volume
for season
, and the average return temperature
is constant during the period of season
. Here, the ambient water temperature
is considered constant throughout the season, and
represents the average production temperature during the pumping period (season
). Under these conditions, the dimensionless production temperature
is defined in equation (9).
Therefore, the heat recovery rate
becomes equal to the average value of the average dimensionless production temperature
, resulting in equation (10).
Doughty et al. conducted a parameter study through simulation of the pumping response after water return, targeting a model of a single heat source well, and presented the dimensionless production temperature. In this study, using the dimensionless production temperature formula (equation (9).) presented by Doughty et al., the evaluation of production temperatures and heat recovery rates is conducted when pumping and returning water using two heat source wells.
Nakao et al. conducted simulations on the production temperature for doublet wells without thermal interference between heat source wells, in line with Doughty et al.’s previous research [
17]. They presented the relationship between the dimensionless production temperature and the heat recovery rate, considering the air conditioning operation period in Japan, and outlined a simplified procedure for determining the production temperature. Furthermore, Nakao et al. considered the thermal interference between two heat source wells to obtain the relationship between dimensionless numbers and changes in production temperature [
18]. They derived a formula for estimating the heat recovery rate based on the ratio of heat relation to the spacing of the heat source wells, especially in areas with limited land like Japan. While Nakao et al. were able to determine the dimensionless production temperature through simulations, they did not describe how to apply this data to practical operations in the future [
17,
18]. Therefore, this study extends their work by calculating the dimensionless production temperature and proposing operational methods for the next fiscal year to achieve thermal balance.
4.2. Evaluation of Actual Production temperature Data
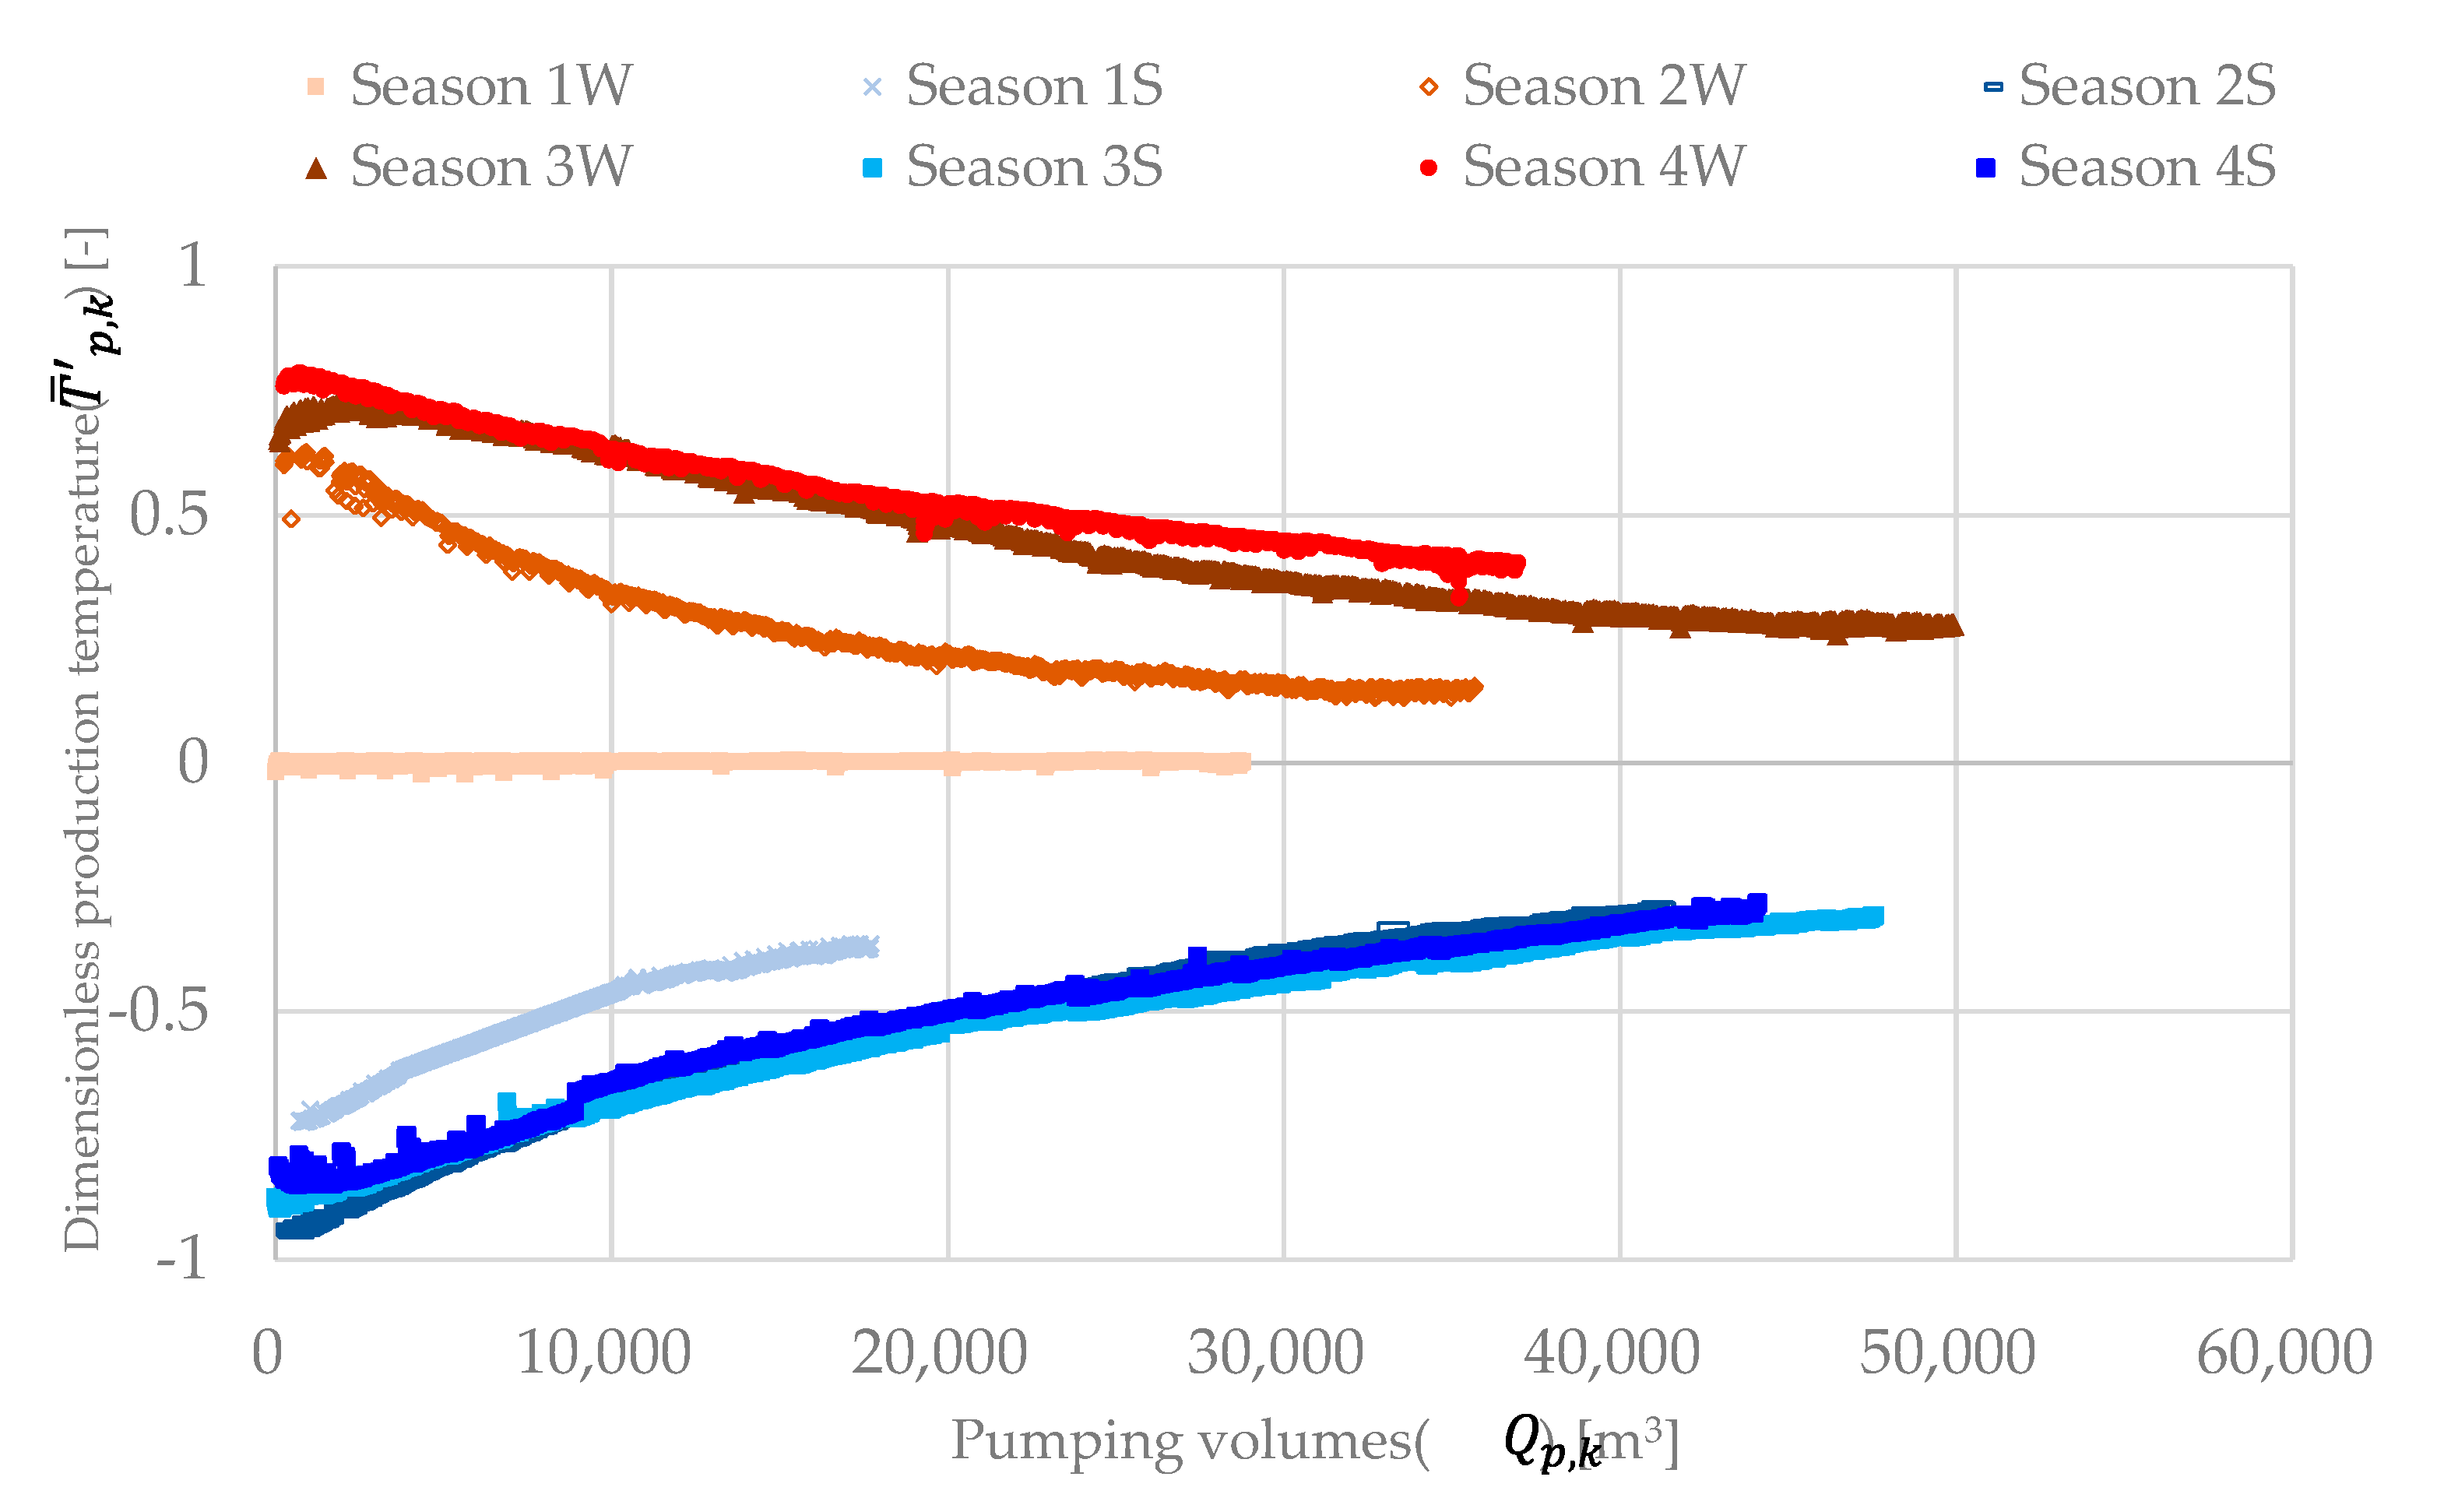
Figure 9 shows the production temperature
from December 2019 to October 2023 for this installation, with the horizontal axis representing the cumulative pumping volume from the start of injection in each season. The operation of ATES began in the winter of 2019, with the initial production temperature set at the original ambient temperature of 19.8°C. From Season 2S onwards, the cold and warm water stored during Season 1W was utilized. The average return temperature of warm water during cooling is set at 25°C, and the return temperature of cold water during heating is set at 10°C. This setting is due to the larger pumping volume from the warm water well compared to the cold water well, as explained in
Section 2.1, which allowed meeting the cooling load sufficiently even with a smaller difference between the original ambient temperature and the return temperature. Conversely, due to the smaller pumping volume from the cold water well, a larger difference between the initial temperature and the return temperature was necessary to meet the heating load. The average starting temperature of pumping in seasons other than Season 1S and 2W is almost the same. The reason for the lower starting temperature in Season 1S, as shown in
Table 4, is due to the late start of ATES operation and a longer rest period. The reason for the lower starting temperature in Season 2W is due to the shorter cooling operation time with ATES in Season 2S and the smaller cumulative pumping volume.
4.3. Dimensionless Production Temperature
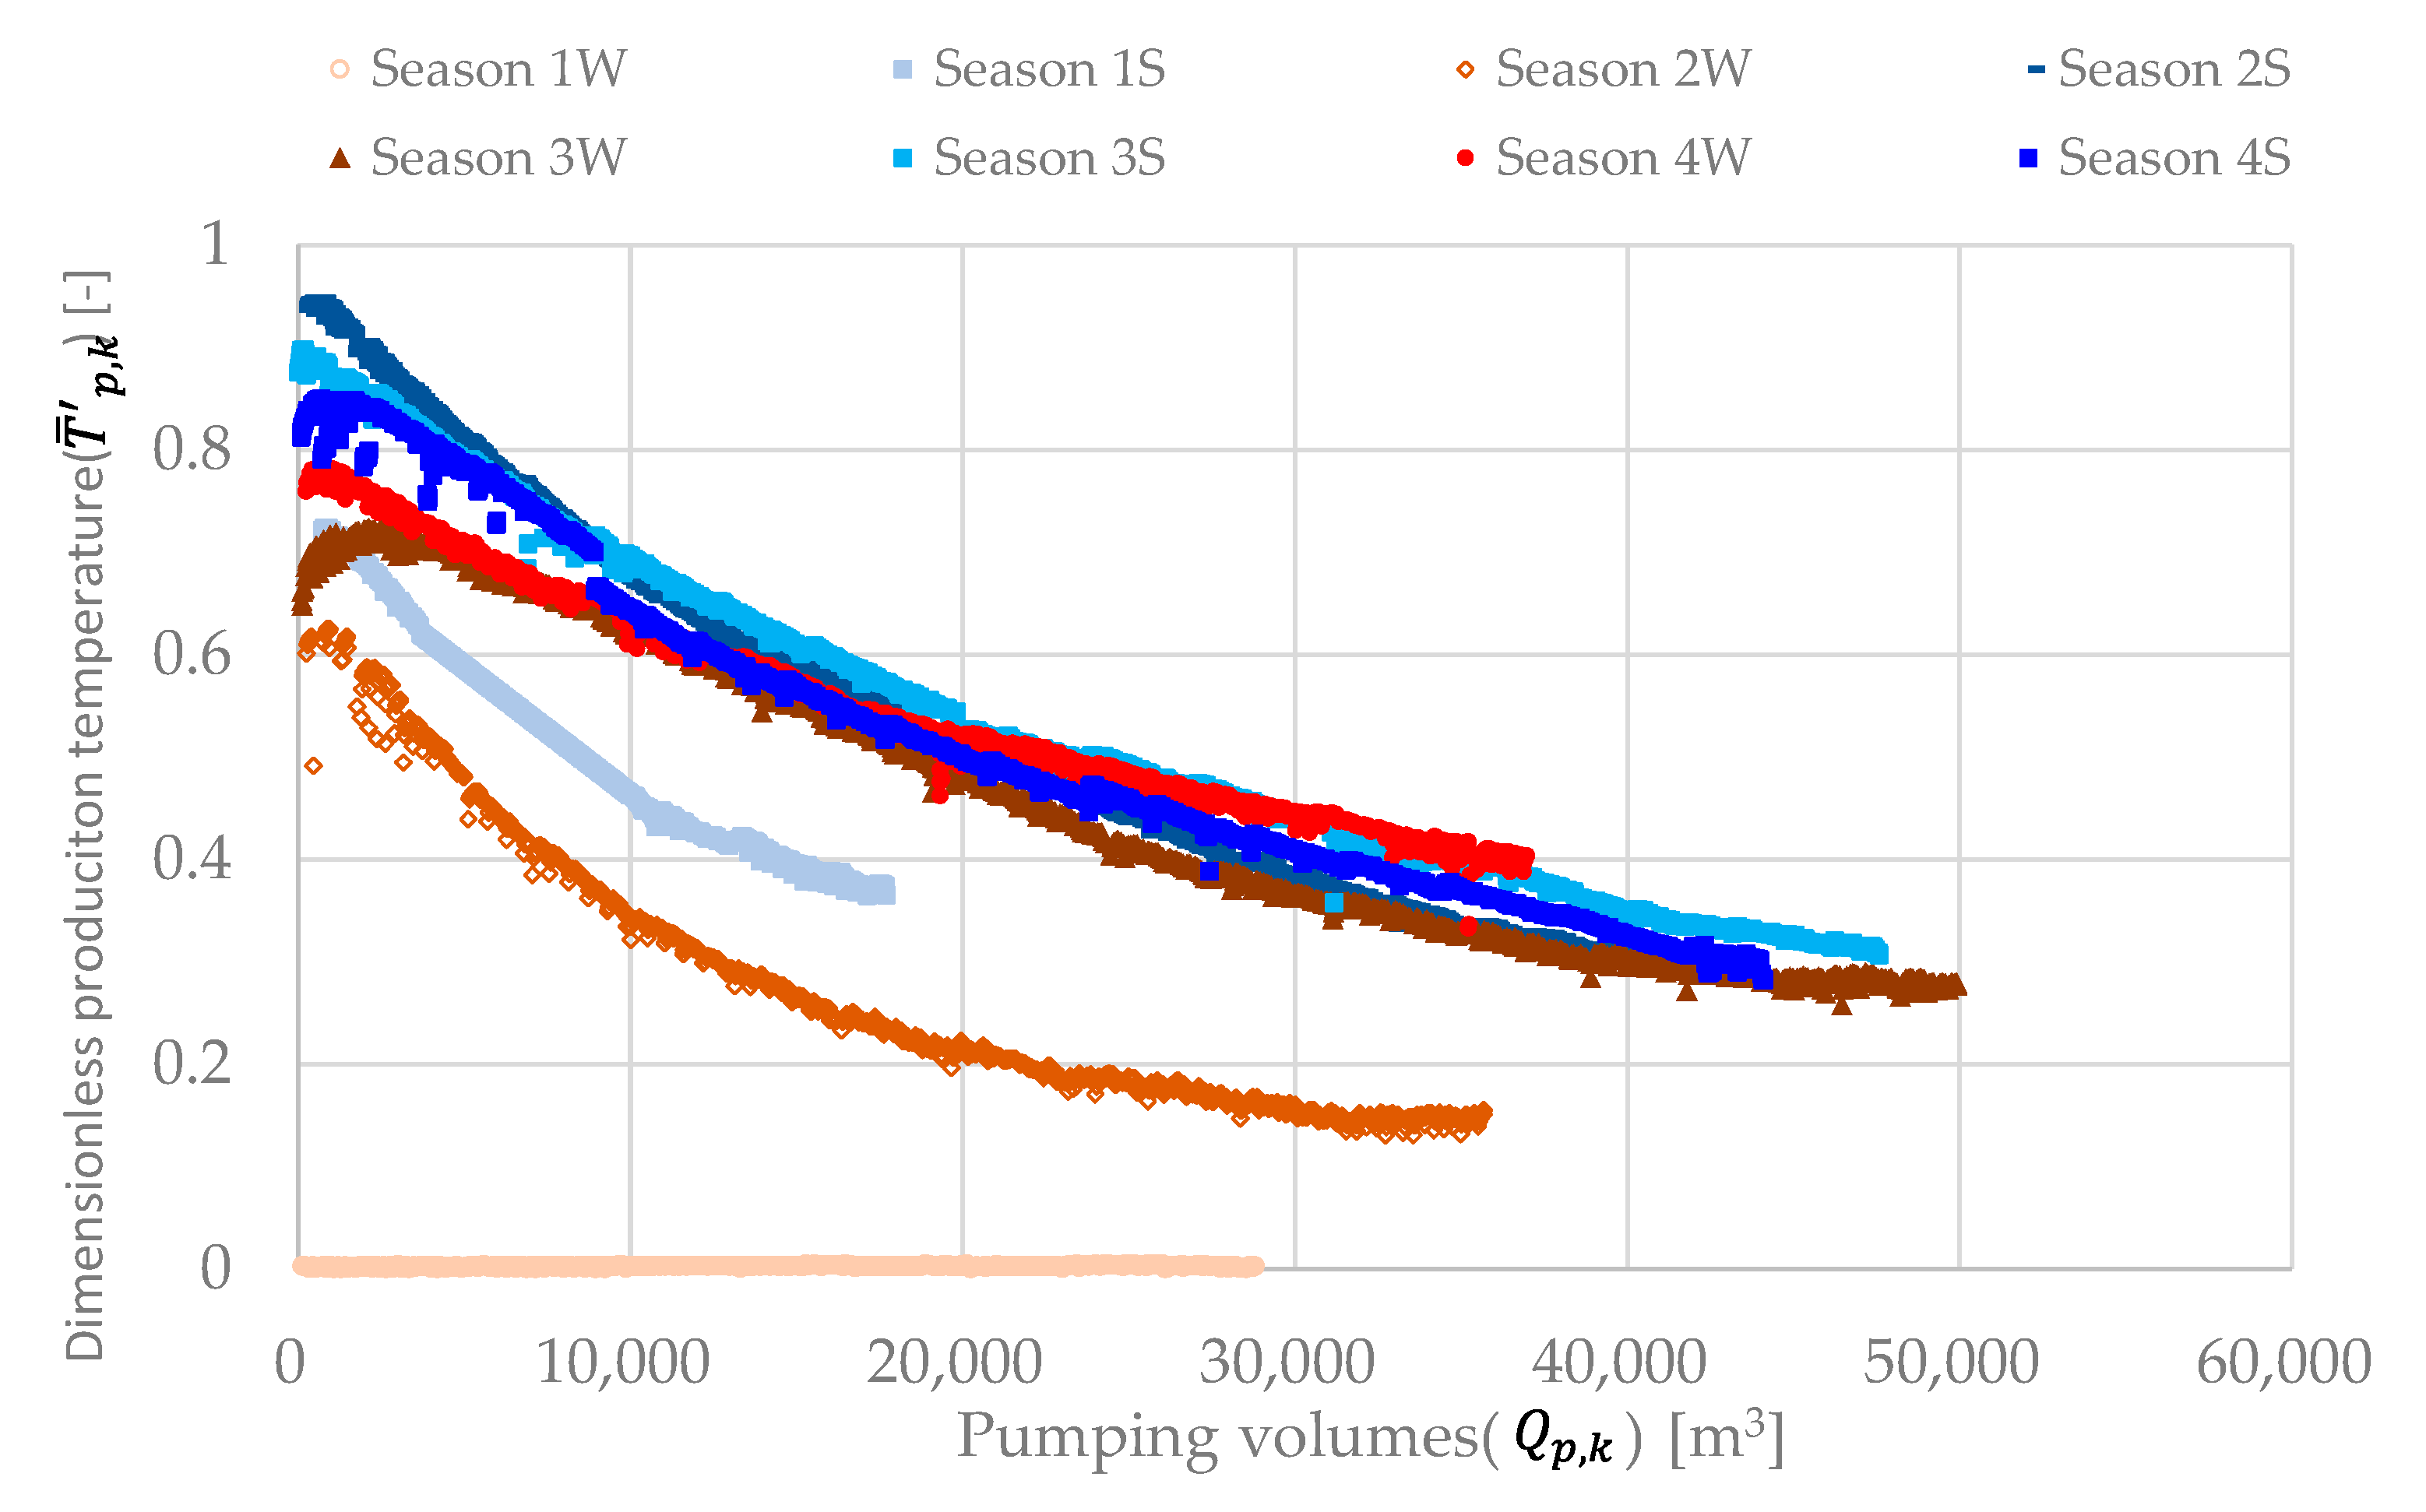
Using the dimensionless production temperature formula (equation 7) defined in 4.1, the dimensionless production temperature data is shown in
Figure 10.
Season 1W, being the first year of operation using ATES, has a dimensionless production temperature of 0. The trend of temperature increases or decrease due to cooling and heating operations in each season (excluding Season 1S and 2W) is largely identical.
From Season 2W to 4W, during the winter heating operation, the initial values of the dimensionless production temperature at the start of pumping are 0.55, 0.69, and 0.74, respectively. These values tend to rise with each cycle, and the response shape is almost the same across these seasons. Notably, the change in response in Season 2W is faster compared to other seasons. This is believed to be primarily due to the smaller volume of injection in the previous Season 1S. Despite the different pumping volumes due to winter heating operations, it’s observed that the dimensionless production temperature increases over the seasons. Comparing Seasons 2W and 4W, which have almost the same pumping volumes, the speed of initial production temperature decrease is faster in Season 2W, but from 10,000m3 onwards, it is almost the same. The reason for the faster initial production temperature decrease in Season 2W is likely due to the smaller volume of warm water pumping in Season 1S compared to Season 3S. Although the slope of the initial production temperature decrease is slightly different in the first stages of all three cycles, it becomes almost the same from the midpoint onwards.
For the summer cooling operations from Season 1S to 4S, the initial values of the dimensionless production temperature at the start of pumping are 0.72, 0.94, 0.88, and 0.81, respectively, showing variation but with similar response shapes across the seasons. It is observed that for all four seasons during summer cooling operations, the slope of the dimensionless production temperature exhibits a consistent trend. Although the initial values of the dimensionless production temperature in Seasons 2S and 3S are lower compared to Season 4S, after 5,000m3, the values become almost the same across all four seasons.
To compare the response shapes of production temperatures between summer and winter using the same indicators, the signs of production temperatures for summer and winter are reversed, and the response shapes of dimensionless production temperatures are compared in
Figure 10. However, based on the above analysis, since the tendencies of Season 1W, 1S, and 2W were found to be different from other seasons, they are excluded from
Figure 11.
From
Figure 11, it is observed that the response shapes of production temperatures for each cycle are almost the same for both summer and winter. Additionally, it is noted that the starting dimensionless production temperatures for summer are higher than for winter. This difference could be influenced by the variations in the ground properties of the warm and cold water wells, as explained in Chapter 2, which might affect the performance of the heat source wells. This assumption is speculated to also reflect differences in the heat recovery rates of the heat source wells, which will be discussed later.
4.4. Thermal Energy Imbalance on the Heat Source Well Side
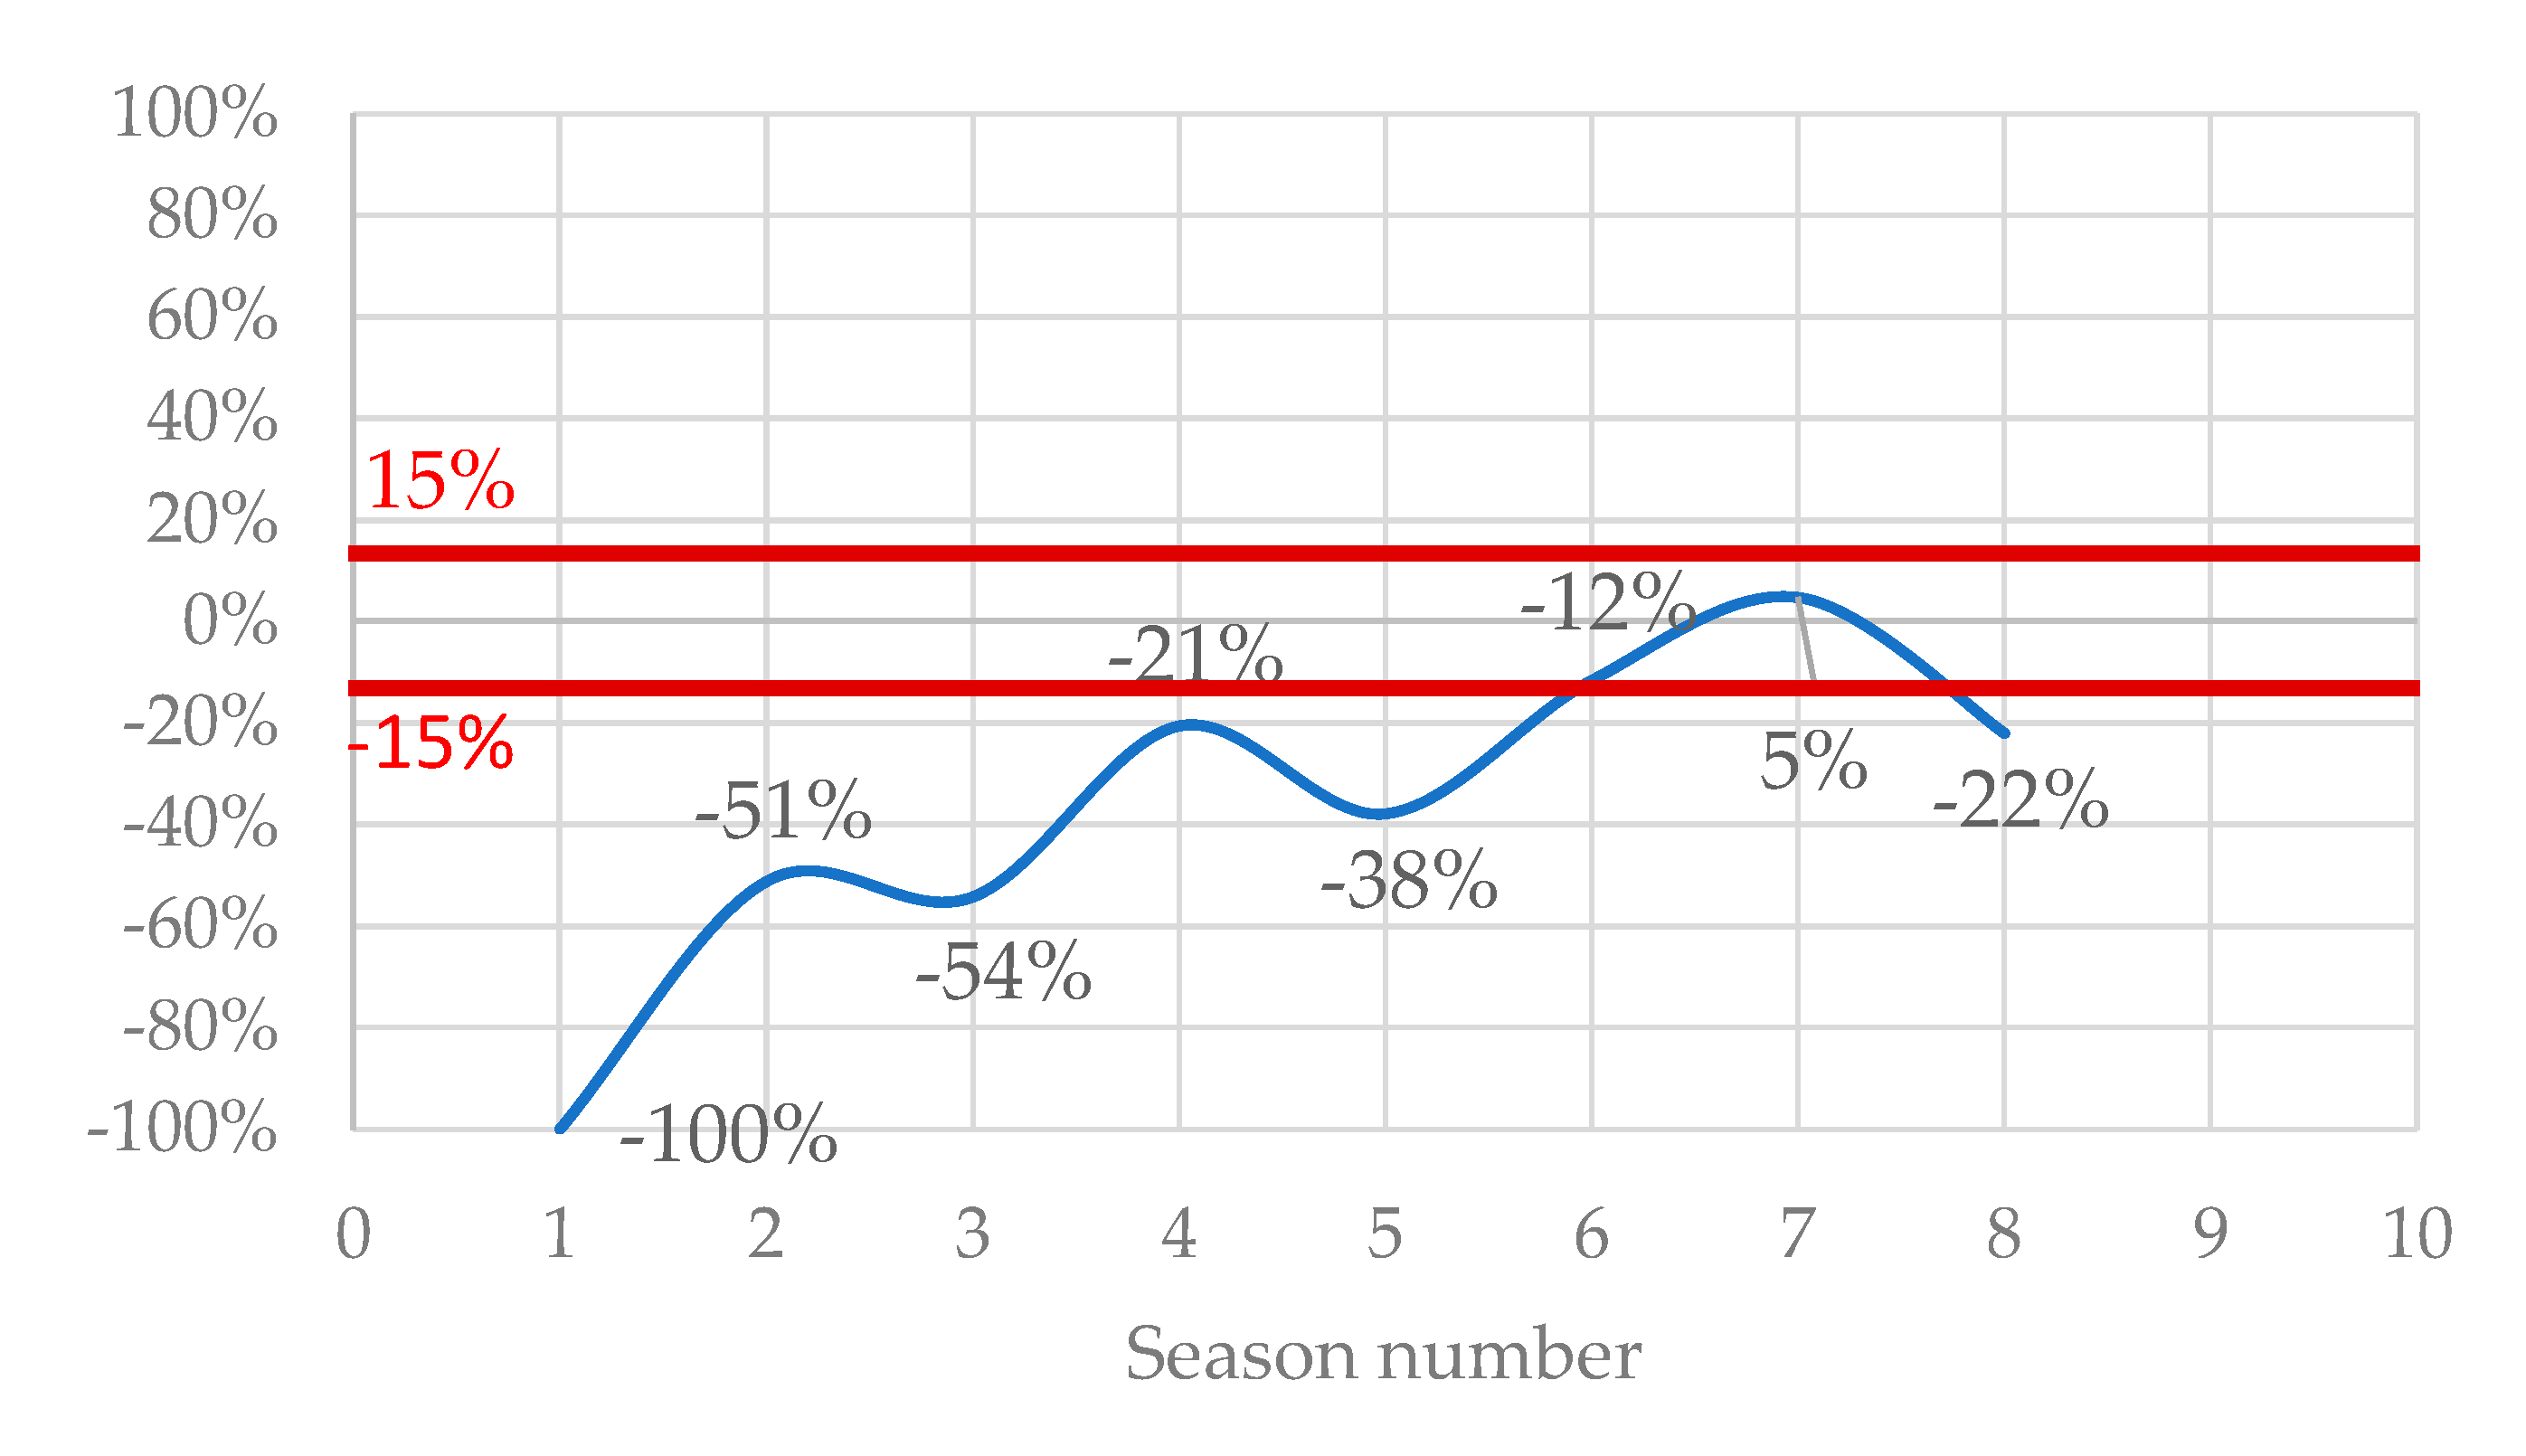
Figure 12 shows the annual thermal storage imbalance ratio on the heat source well side. The thermal energy imbalance for the heat source well is calculated using equation (11). When the thermal energy imbalance is 0%, it indicates that the pumped thermal energy storage
from season
and the environmental thermal energy storage
from season
are equal. The positive or negative value of the thermal energy imbalance indicates an excess of heat or cold, respectively.
As shown in
Figure 12, all seasons except for Season 7 resulted in a negative balance, indicating the occurrence of an excess of cold thermal energy. In the Netherlands, regulations require that the thermal storage balance be kept within ±15% within 5 cycles and within ±10% within 10 cycles. While Japan does not yet have precise regulations in this regard, continuing to operate in such a manner could render the ATES system unusable over the long term. Therefore, a change in operation methods and improvement in thermal storage balance is necessary by the fifth cycle. The approach to this method will be explained in Chapter 5.
4.5. Evaluation of Heat and Mass Balance
Table 5 shows the heat and mass balance status of the low-temperature and high-temperature heat source wells. The underground heat imbalance is calculated using equation (12). The term "underground heat imbalance" refers to the balance of heat input/recovery from the surface facilities to the underground.
During the winter heating operation, Season 1W had the smallest pumping volume of 28,790m3 among the four cycles. Seasons 2W and 4W were almost the same, and Season 3W had the largest volume due to the operator’s error, which led to a month and a half of nighttime operation, as mentioned in section 3.1. Even if the nighttime operation had been stopped during Season 3W, the pumping volume would have been about 43,388m3, which is larger than the other seasons. This was due to the larger factory production load during Season 3W, resulting in longer operating hours. It is estimated that the pumping volume for season 3W would have reached around 36,000m3, similar to Seasons 2W and 4W, if the factory had been operating normally and was no operator error.
In summer cooling and heating operations, Season 1S had the smallest pumping volume of 17,706m3 among the four cycles. Seasons 2S, 3S, and 4S varied slightly due to operation time but all exceeded 40,000m3, averaging about 44,000m3 over three years.
By the end of the fourth cycle of summer operation (4S) for the low-temperature heat source well, the pumping volume was in an imbalanced state, with an imbalance of 655m3. The heat recovery rate for the low-temperature heat source well improved from 38% in the first cycle to 61% in the fourth cycle, As a result of operational improvements aimed at balancing thermal storage and pumped water volumes, an improvement in heat recovery rate was observed.
At the end of (4S) for the high-temperature heat source well, the imbalance in pumping volume was reduced to 474m3, but the state of excess pumping volume from the high-temperature well compared to the low-temperature well was not resolved. The heat recovery rate improved from Season 2W to 3W for the high-temperature heat source well but decreased in Season 4W. This decrease was because, as described in chapter 3, a significant amount of thermal storage was accumulated during Season 3W due to unnecessary operation in winter, and the thermal storage from 3W was not fully utilized in the following Season 3S.
By the end of the fourth cycle of summer operation (4S), the underground heat imbalance amounted to -853 GJ, indicating that the released (or cooled) heat exceeded the input heat. To address the imbalance in thermal storage, a review of operational methods beyond the fifth cycle is necessary to return to an equilibrium state.
5. Improvement Methods for thermal Storage and Pumping Volume
The operational data analysis conducted previously has revealed an imbalance in accumulated thermal storage and pumping volume. By the end of Season 4S, as demonstrated in 3.1, there was an excess cold thermal storage of 739 GJ on the building side and an excess pumping volume of 656m
3. Continuing operations in this condition could increase the thermal storage and pumping volume on the low-temperature side, potentially preventing the long-term sustainable operation of the ATES system. Therefore, it is necessary to review and improve future operational methods. Olaf Van Pruissen et al. have stated that to operate an ATES system efficiently over a long period, it should be used for the smaller of the cooling or heating loads, with the remainder being managed by an air-cooled heat pump [
19]. This approach maintains the thermal storage balance and improves the overall efficiency of the system, although specific operational methods are not detailed. In Japan, Cui et al. have proposed the use of free cooling or a centrifugal turbo heat pump for thermal storage in cases where cooling loads exceed heating loads, but they have not mentioned imbalance measures for cases where heating loads are larger, as occurred in this study [
20]. Therefore, this chapter proposes operational improvement methods using actual data.
Based on the operational data from the past four cycles,
Table 6 summarizes an average operational situation that eliminates the variability in performance across the four cycles. From
Table 6, based on the annual factory operational performance (excluding data such as operator errors), it is understood that on average, the operational duration is 1,519 hours in winter and 1,276 hours in summer. Correspondingly, the pumping volumes are 36,000 m
3 in winter and 44,000 m
3 in summer. The average dimensionless production temperature was used based on the average values from the four cycles of operational data. Regarding the set conditions, with the current factory load conditions, the injection temperatures are set to 10°C in winter and 24.6°C in summer, leading to accumulated thermal storage of 1,865GJ in winter and 1,776GJ in summer, indicating a larger accumulated thermal storage during the heating period in winter.
To improve this imbalanced operational reality and maintain a balance between both pumping volume and accumulated thermal storage moving forward, an improvement proposal for the operational method is presented in the following steps.
Determination of umping volume
To maintain a balance in pumping volume between summer and winter, it’s necessary to align the pumping volumes for these seasons, meaning they should be matched to the lesser volume of the two. In this study, the smaller winter pumping volume is set at 36,000m3, and it is decided that this volume will not change annually and will be operated at a constant value going forward. This requires reducing the summer pumping volume compared to past performance. However, in this case, since the ATES system cannot cover the cooling load with reduced pumping volume, it’s necessary to adjust the injection temperature settings.
Determination of injection temperature
Once the pumping volume is established, the next step is to determine the accumulated thermal storage for summer and winter. In this study, since the total accumulated thermal storage is smaller in summer, the injection temperature for summer is set. When deciding the average injection temperature, the average injection temperature is calculated from equation (13) using the dimensionless production temperature of the previous year. Subsequently, the average injection temperature in winter is set using Equation (14) so that the accumulated thermal storage in winter becomes almost the same as in summer.
As a result of adjusting the two parameters of pumping volume and injection temperature, the operational settings for the following years will be set as follows, according to
Table 7, the winter injection temperature will be adjusted to 12.0°C, the summer injection temperature to 27.3°C, and the pumping volume will be standardized to 36,000m
3 to match the winter volume.
This adjustment leads to the realization that the accumulated thermal storage during winter heating operation will be less than the assumed values 1,865GJ in
Table 6, indicating that ATES alone cannot cover all the heating load. Ideally, the shortfall would be supplemented by an auxiliary heat source (such as an air-cooled heat pump); however, the equipment does not possess an auxiliary heat source capable of heating, necessitating a reduction in heating operation time. Reducing heating operation time would also decrease the pumping volume.
Table 8 summarizes a proposal for the operational method for the next fiscal year if the heating operation time is reduced.
The proposal for the operational methods mentioned above does not consider the thermal energy imbalance left from the past four cycles, so it’s necessary to explore ways to eliminate the previous thermal energy imbalance. By the end of Season 4S, the total cold thermal energy imbalance was 739 GJ, making it challenging to completely neutralize the thermal energy imbalance within the next fiscal year and achieve a balanced accumulated thermal storage. Therefore, this study sets a timeframe of an additional four cycles to balance the accumulated thermal storage, mirroring the duration over which the imbalance initially occurred. Since adjusting the injection temperature is the only method to balance the accumulated thermal storage, the settings are based on the premise that all cooling operations with smaller loads are covered by ATES. Because the thermal energy imbalance will be added to the accumulated thermal storage during heating operations, this necessitates increasing the injection temperature settings accordingly. As a result, an operational method as outlined in
Table 9 will be established, prompting a review for the following years.
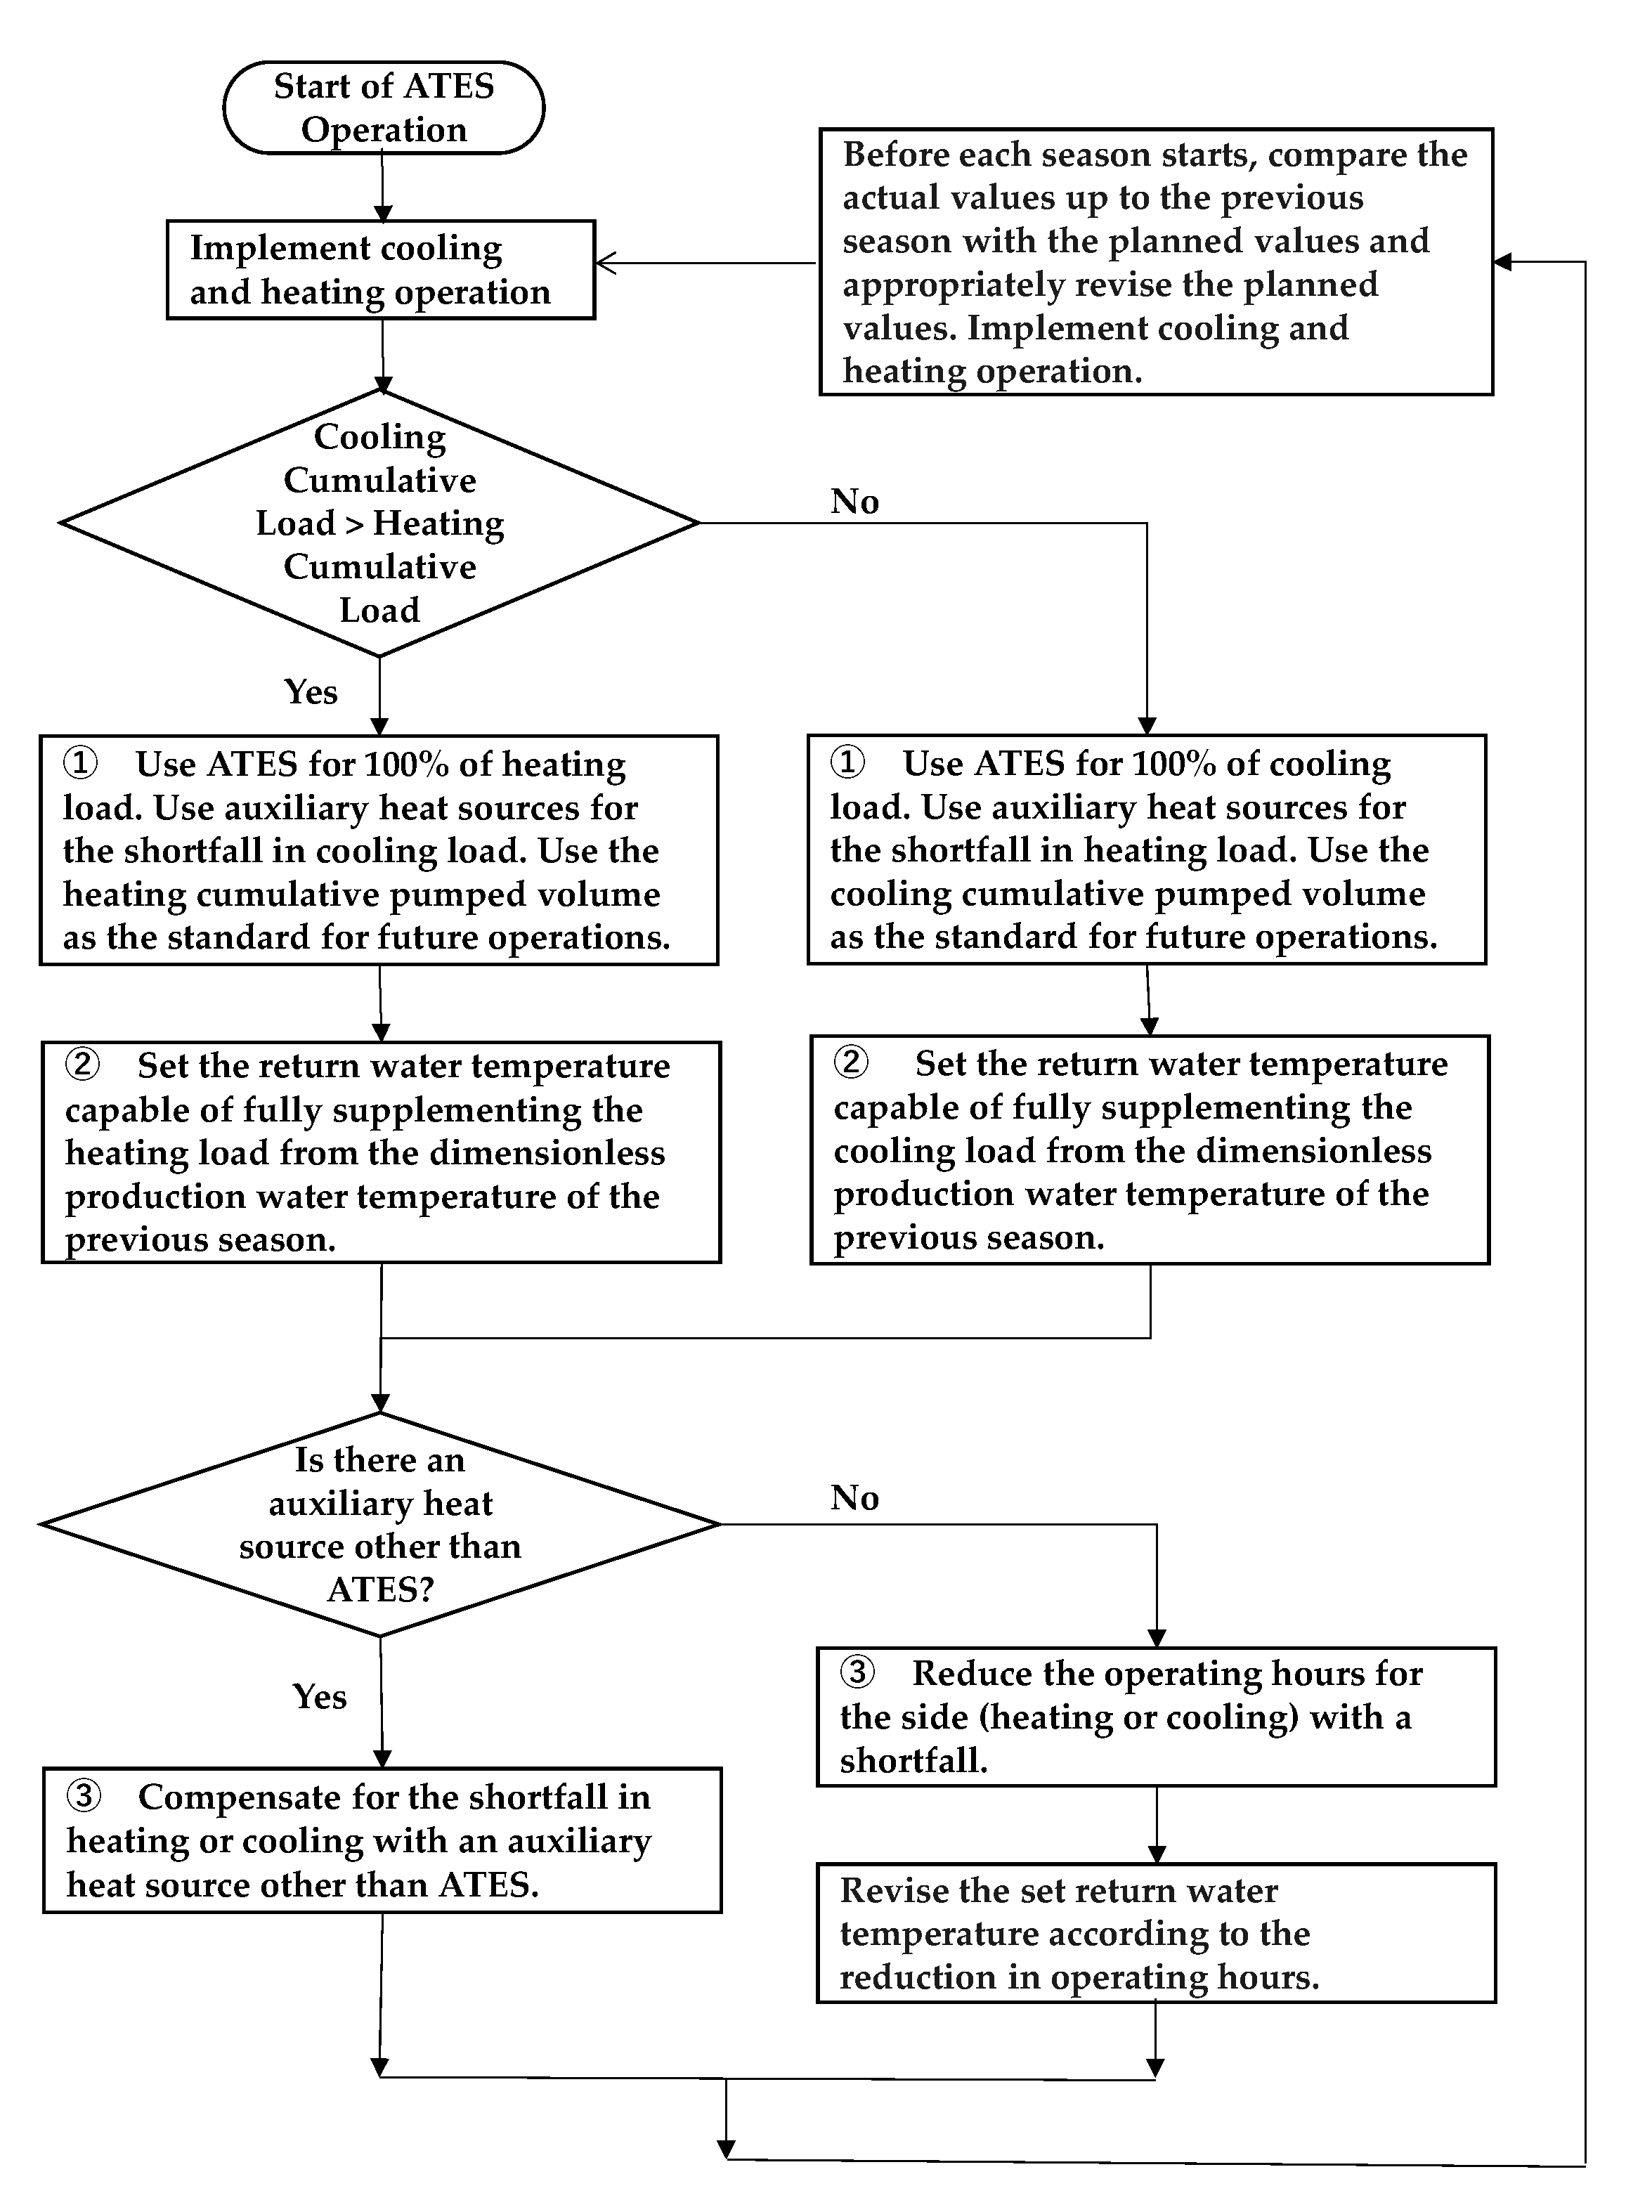
From the results of this research, it is clear that in order to operate ATES over a long period, adherence to the following four items and the ATES Long-term Stable Operation Flowchart shown in
Figure 13 is necessary. At the start of operation, since there is no performance data from the previous season, estimated values must be used to set planned injection temperature. However, from the second cycle onwards, it is possible to determine the planned injection temperatures using the average dimensionless temperature obtained from the previous cycle’s performance data. In this way, from the second cycle onwards, while revising planned injection temperatures and other parameters as appropriate for each season, both the pumping volume and the cumulative thermal storage will be maintained in balance.
(1) Operation of ATES will be based on the lower pumping volume, and planned pumping volumes for each season will be calculated. The smaller of the past pumped volumes will be used for comparison.
(2) From the average dimensionless pumped water temperature of the previous season, the injection temperature for the next season will be set. The injection temperature will be calculated based on the previous season’s average dimensionless pumped water temperature and the cumulative thermal storage and volume of returned water.
(3) For smaller cooling and heating loads, ATES will be utilized without auxiliary heat sources. If auxiliary heat sources are available, they will be used to compensate for the shortfall in the larger load. Without auxiliary heat sources, for larger loads, the entire cooling and heating period will not be operated with ATES, instead, operation will be based on the available thermal storage for a proportionate operating time.
For long-term stable operation of ATES, the initial ground temperature and the temperature difference between cold and hot injection temperatures need to be set the same. However, this condition will naturally be met if rules (1)(2)(3) are followed. The thermal energy imbalance observed in the case study factory was due to reducing the pumping volumes from the initially planned source well flow rate, thereby increasing the temperature difference. To avoid such failures, the temperature difference must be kept the same. Moreover, to avoid operating cooling and heating only for a part of the period as in rule (2), installing auxiliary heat sources is essential.
6. Conclusions
(1) An ATES system was established in Wadamisaki, Kobe City, Japan, an area known for its complex geology and thin aquifer layers. Over four cycles (equating to eight seasons), an analysis was conducted on the performance, thermal storage, and heat recovery rates in relation to the load side and original ambient temperatures. This analysis revealed that the average system COP across the four cycles reached 5.0. Additionally, heat recovery rates for both the low and high-temperature wells (based on initial median temperatures) were studied, indicating that the balance between accumulated thermal storage and pumping volume significantly impacts well performance, highlighting the importance of maintaining this balance.
(2) Using Doughty’s concept of dimensionless production temperature, changes in the dimensionless production temperature for each season were analyzed using actual operational data. Excluding the initial year, the trends were found to be almost the same. It was also discovered that the magnitude of the initial production temperature is influenced by the operational and rest periods of the previous year.
(3) Using the operational data of four cycles, an average operational scenario for the factory was summarized. This led to the proposal of operational improvements for balancing thermal storage volume and flow in following years. It was suggested to determine the cumulative pumping and return volumes based on previous year’s operational data, aligning ATES operation with the lesser of these volumes, and supplementing any shortfall with auxiliary heat sources. It was discovered that adjusting the injection temperature is the only method for maintaining the balance of accumulated thermal storage. A method was proposed to calculate the dimensionless production temperature (Indicative of heat recovery efficiency) from the previous year’s data and use this to set the injection temperature for the next year in advance, thereby maintaining thermal storage balance.
Author Contributions
All authors contributed to the study conception and design; writing-original draft preparation, L.C; writing-review and editing, L.C., M.N3., M.N4 and K.U., Supervision, M.N3., project administration, M.N3., methodology, M.N4., formal analysis M.N3. All authors have read and agreed to the published version of the manuscript.
Funding
This research received no external funding.
Data Availability Statement
Not applicable.
Acknowledgments
We would like to thank Mitsubishi Heavy Industries Thermal Systems, Ltd., for their cooperation in advancing this research.
Conflicts of Interest
The authors declare no conflicts of interest.
Appendix A
The following is a list of symbols used in the text.
| Symbol |
Unit |
Meaning |
Symbol |
Unit |
Meaning |
|
s |
Time step for conduction. |
|
°C |
Original ambient temp |
|
J/(m3・°C) |
Volumetric heat capacity. |
|
s |
Time |
|
% |
Thermal storage imbalance ratio |
|
- |
Heat recovery rate of season k |
|
J |
Geothermal imbalance |
k |
- |
Season number |
|
°C |
Production temp at time t |
|
°C |
Injection temp at time t |
|
°C |
Average dimensionless
production temp at time t |
|
°C |
Average dimensionless
injection temp at season k |
|
°C |
Average production
temp in season k |
|
°C |
Average injection
temp in season k |
|
°C /Season |
Average production temp on the cold well side in season k |
|
°C / Season |
Average injection temp on the cold well side in season k |
|
°C / Season |
Average production temp on the hot well side in season k |
|
°C / Season |
Average injection temp on the hot well side in season k |
|
m3/s |
Pumping volume at time t |
|
m3/s |
Return volume at time t |
|
m3/ Season |
Accumulated pumping
volume in season k |
|
m3/Season |
Accumulated return
volume in season k |
|
m3/ Season |
Accumulated pumping volume
on the cold well side in season k |
|
m3/ Season |
Accumulated return volume
on the cold well side in season k |
|
m3/ Season |
Accumulated pumping volume
on the hot well side in season k |
|
m3/ Season |
Accumulated return volume
on the hot well side in season k |
|
J/ Season |
Accumulated pumping thermal energy storage on the thermal well side
in season k |
|
J/ Season |
Accumulated return thermal energy storage on the thermal well side
in season k |
|
J/ Season |
Accumulated pumping thermal energy storage on the cold well side in season k |
|
J/ Season |
Accumulated return thermal energy storage on the cold well side in season k |
|
J/ Season |
Accumulated pumping thermal energy storage on the hot well side in season k |
|
J/ Season |
Accumulated return thermal energy storage on the hot well side in season k |
|
J/ Season |
Imbalanced thermal energy on the cold well side in season k |
|
J/ Season |
Accumulated thermal energy storage on the building side in season k |
References
- Takeguchi,T.; Nishioka,M.; Nabeshima,M; Nakaso,Y; Nakao,M. Study on aquifer thermal energy storage system for space cooling and heating-(Part2)Experimental valve of heat recovery rate and identified value of thermal dispersion length-.Soc. Heat. Air-Cond. Sanit. Eng. Jpn. 2018, 209-212.
- Wu,X.B; Ma,J.; Bink,B. Chinese ATES Technology and Its Future development. Proceedings, TERRASTOCK 2000, Stuttgart, Germany, 2000.
- Shanghai Hydrogeology Team. Artificial Replenishment of Groundwater. China Geology Press, 1977.
- Paul, F.; Bas, G.; Ingrid, S.; Philipp, B. Worldwide Application of Aquifer Thermal Energy Storage-A Review. Renewable and Sustainable Energy Reviews, 94, 2018, 861-876.
- Wu,X.B.; Ma,J. Aquifer Thermal Energy Storage Technology and Its Development in China. Energy research and Information, Vol.15, No.4, 1999, 8-12.
- Wu,X.B.; Development of ground water loop for ATES and ground water source heat Systems. HV and AC, Vol.34, No.1, 2004, 19-22.
- Nakaso,Y; Oshima,A; Nakao,M; Nishioka,M; Masuda,H; Morigawa,T; Yabuki,A;. Development of High-perfomance Large-Capacity A1uifer Thermal storages System(Part 1): Benefit of developing Pumping and Recharging Switching-Type Thermal Wells and Operational Performance. Japanese Association of Groundwater Hydrology, Japan,2022,7-12.
- Takeno,K.; Oshima,A.; Temma,S.; Nakao,M.; Nakaso,Y. Settlement Prediction Considering Cyclic Consolidation Behavior of Pleistocene Clay layers by Groundwater level Fluctuation of Confined Aquifer at Maishima. Kansai Geo-Symposium,2019,7-12.
- Bozkaya, B.; Zeiler, W. The effectiveness of night ventilation for the thermal balance of an aquifer thermal energy storage. Applied Thermal Engineering 2019, 146, 190–202. [Google Scholar] [CrossRef]
- Heacht-Mendez,J.; Molina-Giraldo,N.; Blum,P.; Bayer,P. Evaluating MT3DMS for heat transport simulation of closed geothermal systems. Ground Water,2010,48(5):741-756.
- Bloemendal,M.; Olsthoorn T.; Boons F. How to achieve optimal and sustainable use of the subsurface for aquifer Thermal Energy Storage. Energy Policy,66,2014,104-114.
- Bloemendal,M.; Hartog N. Analysis of the impact of storage conditions on the thermal recovery efficiency of low-temperature ATES systems. Geothermics,71,2018,306-319.
- Gutierrez-Neri,M; Buik,Nick; Drijver,B; Godschalk,B. Analysis of recovery efficiency in a high-temperature energy storage system. 1e Nationaal Congres Bodemenergie, 2011.
- Kansai Geoinformatics Information Utilization council Geotechnical Research Committee. New Kansai Geotechnical-Kobe and Hanshin,Kansai Geiotechnical information utilization Council,1998,270.
- Cui,L.; Nishioka,M.; Nakao,M.; Mitamura,M.; Ueda,K. Study on Air Conditioning System Utilizing Aquifer Thermal Energy Storage System-Discussion on Actual performance Evaluation and Examination of Operation method. Kansai Geo-Symposium,2022,209-212.
- Doughty,C.; Hellstrom,G.; Tsang,C. A Dimensionless Parameter Approach to the Thermal Behavior of an Aquifer Thermal Energy Storage System. Water resources research, VOL.18, No.3, 1982,571-587.
- Nakao,M.; Nkanishi,K.; Nishioka,M.; Ookuda,T. Production temperature prediction method for planning aquifer thermal energy storage system(Part1) Non-dimensional approaches and problems in previous studies. Heat. Air-Cond. Sanit. Eng. Jpn. 2020, 169-172.
- Nakao,M.; Yoshinobu,R.; Okuda,T.;Tsuji,H. Production temperature prediction method for planning aquifer thermal energy storage system(Part2) Model Considering Thermal Interference between ATES Wells. Heat. Air-Cond. Sanit. Eng. Jpn. 2022, 49-52.
- Pruissen,O.; Kamphuis,R. Multi agent building study on the control of the energy balance of an aquifer. Presented ate IEECB’10-Improving Energy Efficiency in Commercial Buildings. Germany. 2010.
- Cui,L.; Nishioka,M.; Nakao,M.; Ueda K. Study on Thermal Energy Storage Air conditioning System utilizing Aquifer Construction of Model of Cold Storage facility and Comparison between Simulation and Actual Data.Soc. Heat. Air-Cond. Sanit. Eng. Jpn. 2023, No.312, 1-10.
Figure 1.
Heat source well design diagram (Screen position).
Figure 1.
Heat source well design diagram (Screen position).
Figure 2.
Cold wells and Hot well.
Figure 2.
Cold wells and Hot well.
Figure 3.
Diagram of the overall equipment system.
Figure 3.
Diagram of the overall equipment system.
Figure 4.
Transition of daily accumulated load values.
Figure 4.
Transition of daily accumulated load values.
Figure 5.
Power consumption, COP, and SCOP of building side heat source equipment.
Figure 5.
Power consumption, COP, and SCOP of building side heat source equipment.
Figure 6.
Transition of accumulated thermal storage ().
Figure 6.
Transition of accumulated thermal storage ().
Figure 7.
Transition of imbalanced thermal energy over the years ().
Figure 7.
Transition of imbalanced thermal energy over the years ().
Figure 8.
Description of the annual operating cycle of ATES.
Figure 8.
Description of the annual operating cycle of ATES.
Figure 9.
Comparison of actual production temperature responses.
Figure 9.
Comparison of actual production temperature responses.
Figure 10.
Response of dimensionless production temperature.
Figure 10.
Response of dimensionless production temperature.
Figure 11.
Comparison of the response shapes of dimensionless production temperature.
Figure 11.
Comparison of the response shapes of dimensionless production temperature.
Figure 12.
Transition of the proportion of thermal energy imbalanced.
Figure 12.
Transition of the proportion of thermal energy imbalanced.
Figure 13.
Flowchart for determination of pumping volume and injection temperature.
Figure 13.
Flowchart for determination of pumping volume and injection temperature.
Table 1.
Planned Operational Conditions.
Table 1.
Planned Operational Conditions.
| Item |
Operational time (h) |
Date of operation (day) |
Total Load (GJ) |
| Cooling |
11 |
184 |
3,342 |
| Heating |
10 |
151 |
2,750 |
Table 2.
Overview of the building.
Table 2.
Overview of the building.
| Building name |
Mitsubishi Heavy Industries Kobe Shipyard OJ Building |
| Address |
1-1-1, Wadasaki-cho, Hyogo-ku, Kobe, Hyogo, Japan |
| Primary use |
Centrifugal turbo chiller production plan |
| Total floor area |
4,200 m2
|
| Operational time |
Summer: 08:00-20:00(Weekdays and Saturdays)
Winter: 08:00-05:00(Weekdays and Saturdays)
Closed on Sundays and national holidays |
Table 3.
List of heat source equipment
Table 3.
List of heat source equipment
| Item |
Unit |
ATES |
| Heat source machine |
- |
Centrifugal turbo heat pump |
| Refrigerant |
- |
HFO-1233zd |
| Specification |
- |
Cooling |
Heating |
| Capacity |
kW |
703 |
866 |
| Unit |
Unit |
2 |
| Evaporator conditions |
°C,m3/h |
12/7, 121 |
12/7, 121 |
| Condenser conditions |
°C,m3/h |
33/38, 141 |
40/45, 150 |
| Power consumption |
kW |
115 |
128 |
| COP |
- |
6.1 |
6.8 |
| Evaporator pump |
kW |
11.0 |
11.0 |
| Condenser pump |
kW |
18.5 |
18.5 |
| Secondary pump |
kW |
37.0 |
37.0 |
| Cooling water pump |
kW |
22.0 |
- |
| Well pump |
kW |
18.5 |
18.5 |
| Cooling tower fan |
kW |
5.5 |
5.5 |
Table 4.
Summary of operational data performance results over four years.
Table 4.
Summary of operational data performance results over four years.
Table 4.
Summary of operational data performance results over four years.
Table 4.
Summary of operational data performance results over four years.
Table 6.
Summary of operational data performance results over four years.
Table 6.
Summary of operational data performance results over four years.
Table 7.
Proposal for future operational methods (without revising heating operation time).
Table 7.
Proposal for future operational methods (without revising heating operation time).
Table 8.
Proposal for future operational methods (with revised heating operation time).
Table 8.
Proposal for future operational methods (with revised heating operation time).
Table 9.
Proposal for future operational methods (considering remaining cold thermal storage).
Table 9.
Proposal for future operational methods (considering remaining cold thermal storage).
|
Disclaimer/Publisher’s Note: The statements, opinions and data contained in all publications are solely those of the individual author(s) and contributor(s) and not of MDPI and/or the editor(s). MDPI and/or the editor(s) disclaim responsibility for any injury to people or property resulting from any ideas, methods, instructions or products referred to in the content. |
© 2024 by the authors. Licensee MDPI, Basel, Switzerland. This article is an open access article distributed under the terms and conditions of the Creative Commons Attribution (CC BY) license (http://creativecommons.org/licenses/by/4.0/).
