Preprint
Article

Functional Alpha- and Beta-Diversity of Fish Communities and Their Relationship with Environmental Factors in the Huanghe River (Yellow River) Estuary and Adjacent Seas, China

Altmetrics

Downloads

99

Views

31

Comments

0

A peer-reviewed article of this preprint also exists.

Submitted:

09 May 2024

Posted:

10 May 2024

You are already at the latest version

Alerts
Abstract
Fisheries and bottom seawater data were collected in July in 2022 and 2023 from 15 sampling stations in the Huanghe River Estuary and adjacent seas in China. The patterns of functional alpha- and beta-diversity of fish communities in this area and their relationship with environmental factors were studied using trait-based analysis. Five functional classifications, which included 16 functional traits, four functional alpha-diversity indices (functional richness, functional evenness, functional divergence, and community-weighted mean), three functional beta-diversity indices (functional beta-diversity and its turnover and nestedness components), and 14 bottom environmental factors were considered. The dominant traits of fish communities were: benthivorous feeding habits, small and front-facing mouths, high trophic level, demersal, anguilliform, low growth coefficient, medium resilience, low vulnerability, and adapted to warm temperate conditions. The dominant migration traits and types of fish eggs varied by year, and fish abundance was the main factor affecting the dominant traits of the communities. The results of multiple regression on distance matrices and variance partitioning analysis indicated that ammonia nitrogen content, total phosphorus content, and pH were the main environmental factors that affected fish functional diversity. The N/P ratio had an upward control effect on fish functional diversity. Our findings also revealed that high pH gradients and distant geographical distances can inhibit trait turnover in fish communities.
Keywords: 
Subject: Environmental and Earth Sciences  -   Ecology

1. Introduction

Determining biodiversity distribution patterns, maintenance mechanisms, and response mechanisms to environmental change are core issues in community ecology [1,2,3]. In the 1960s, Whittaker divided biodiversity patterns into three scales: alpha-diversity (α), beta-diversity (β), and gamma-diversity (γ) [4,5]. Alpha- and gamma-diversity share the same characteristics, but are applied at different scales. The alpha-diversity scale is the smallest and describes the species diversity of a quadrat. The gamma-diversity scale is the largest and describes the diversity of species in an entire ecosystem or study area. Beta-diversity describes differences in community composition between habitats, or the rate at which species are replaced along environmental gradients. Understanding these three types of diversity patterns can solve many ecological and evolutionary biology problems, and they are extremely important for understanding ecosystem function and effective biodiversity conservation and ecosystem management [6]. However, for a long time, scholars primarily focused on alpha- and gamma-diversity. The beta-diversity decomposition method was proposed in 2010, and beta-diversity-related studies rapidly increased [7].
In terms of diversity research, traditional community ecology mainly focuses on species diversity, such as species composition and quantity. In fact, communities with the same number of species are likely to have substantial differences in living habits, forms, and other aspects [8]. Therefore, traditional taxonomic diversity does not truly reflect the status of species in ecosystems and their impact on ecosystem functions [9,10]. In recent years, ecologists have found that functional diversity based on functional traits of species is more closely related to the environment than taxonomic diversity. This provides a more scientific basis for species conservation and management [11,12]. An increasing number of scholars have proposed that functional diversity should be used instead of species diversity to study communities.
From the perspective of functional diversity, functional alpha-diversity reflects the difference or diversity of functional traits of species within a community. Mason et al. [13] divided functional alpha-diversity into functional richness, functional evenness, and functional dispersion, and proposed a calculation method. Recent studies on the functional alpha-diversity of fishes in China mainly focused on freshwater fishes, and there have been few studies on marine fish communities, with studies only in Haizhou Bay [14], Pipa Island Ocean Ranch [15], and Changdao Island [16] in Shandong, China. The functional traits commonly used in the above studies include feeding, movement, and morphological characteristics, such as feeding, mouth position, habitat position, and migration type.
Unlike functional alpha-diversity, functional beta-diversity describes the changes in the composition of functional diversity between communities under different environmental gradients [17,18]. Recent studies indicated that differing functional beta-diversity between communities is mainly due to two processes—species increase or loss and species replacement or turnover. The former leads to differences in species richness between communities, whereas the latter leads to a decrease in common species and an increase in endemic species between communities [19,20,21]. When a community with fewer species is a subset of a community with more species, it appears as a nested pattern [22,23]. Therefore, functional beta-diversity can be decomposed into the form of the addition of the turnover and nested components [24,25,26]. In China, studies have only been conducted on the functional beta-diversity of marine fishes in Haizhou Bay in Shandong Province [27,28] and offshore of Yantai and Weihai [29].
The Huanghe River is the second largest river in China, and its mouth is located in Bohai Bay, China. Here, water of the river and ocean converge to form a sensitive and complex ecosystem at the Huanghe River Estuary [30,31]. The influx of freshwater creates a low-salinity zone in the estuary. This area provides a suitable shelter for marine life to reproduce and survive. Additionally, the freshwater and sediment of the Huanghe River transport a lot of nutrients to the coastal area of the estuary, which increases primary productivity [32,33]. Therefore, this area is an important spawning, breeding, and feeding ground for fishes in the Yellow and Bohai Seas of China [34]. The unique environmental gradient is an important reason for the high level of biodiversity in the Huanghe River Estuary. According to historical records, there were more than 600 marine species of marine life in the Huanghe River Estuary [35].
Currently, biodiversity conservation in the Huanghe River Estuary faces many challenges. The fish community is an important part of the biodiversity in the Huanghe River Estuary. Most studies on fish communities focus on biological characteristics, resource density, species diversity, and community structure, but there are no reports on functional diversity. Comparative studies of alpha- and beta-diversity on a regional scale represent important research in ecology [36]. The main objectives of this study were to (1) describe the functional alpha- and beta-diversity patterns of fish communities in the Huanghe River Estuary, and (2) identify the relationship between their biodiversity patterns and environmental gradients in the estuary. These results can improve our understanding of estuarine and marine biodiversity and will contribute to their conservation and maintenance.

2. Materials and Methods

2.1. Data Source

Fisheries data were derived from bottom trawl surveys of fishery resources in offshore areas of Shandong Province, China that were conducted in July 2022 and 2023. The survey range was 119°00′–119°08′ E, 37°02′–38°03′ N. Samples were collected from 15 sampling stations (37°20′–38°09′ N, 119°05′–119°40′ E), which were divided into three groups according to the distance from the Huanghe River mouth. Sections A, B, and C were located 15–20, 25–35, and 40–55 km from the estuary mouth, respectively (Figure 1).
The fishing vessel used for surveys was “Luchangyu 60003.” This vessel has a Yuchai MKF56K00018 engine (Guangxi Yuchai Machinery Group Co., Ltd, Yulin, China), which has a power of 260 kW. The vessel was 24.4-m long and 6.0-m wide, and weighed 68 t. A single bottom trawl was used. The trawl mouth had a 30.6-m circumference, 20-mm bag mesh, and ~8-m diameter when towing. The designed average towing speed at each station was 2 kn, and the trawling time was 1 h. The catches were identified on site, counted, and biological parameters (e.g., body length and weight) measured. The bottom-water temperature (TEM), salinity (SAL), depth (DEP), pH, and dissolved oxygen (DO) were recorded using a profiler (YSI EXO Handheld; Yellow Springs Instrument Co., Inc., Yellow Springs, OH, USA). Bottom chemical oxygen demand (COD) was determined using the basic potassium permanganate method. Bottom dissolved inorganic phosphate (DIP) and nitrogen (DIN, including NO3–N, NO2–N, and NH4–N) were analyzed using segmented flow analysis. Bottom total nitrogen (TN) and total phosphorus (TP) were measured using the potassium persulfate oxidation method. Chlorophyll a (Chla) was measured using a fluorescence spectrophotometer. Suspended solids (SS) were measured using the membrane filtration method. Biological and environmental samples were collected simultaneously.

2.2. Methods

2.2.1. Functional Traits

Sixteen functional traits related to fish feeding, motility, reproduction, population dynamics, and ecological adaptation were selected, including 9 taxonomic traits and 7 continuous traits (Table 1). The values or types of functional traits were mainly obtained from the World Fish Database (FishBase) [37] and previous papers [14,15,38,39,40,41,42,43,44,45]. The “species–traits” matrix of fishes is detailed in Appendix Table A1.

2.2.2. Functional alpha-diversity

In this study, four functional diversity indices were used to measure the spatio-temporal variation of functional alpha-diversity in fish communities [46,47].
  • Functional richness, FRic, quantifies the size of the ecological space occupied by a species within a community, reflecting the stability of the community and its ability to buffer environmental disturbances and resist ecological invasion [48]. FRic was calculated as follows. First, a species with an extreme character value was identified and used as the end point of the smallest convex shape in the N-dimensional character space. Then, the endpoints were connected to form a minimum convex polygon. Finally, the area or volume of the minimum convex polygon was calculated [46].
  • Functional evenness, FEve, quantifies the evenness of the abundance of functional traits of species within a community that is distributed in functional space, reflecting the overall utilization of resources by species [48]. FEve was calculated as follows:
    d i s t i , j = ( a i a j ) 2 + ( b i b j ) 2 + + ( m i m j ) 2
    E W l = d i s t i , j / ( w i + w j )
    P E W l = E W l / l = 1 S 1 E W l
    F E v e = l = 1 S 1 m i n P E W l , 1 S 1 1 S 1 1 1 S 1
    where a to m represented the 16 functional traits of species i and j in a multidimensional trait space, dist(i, j) was the Euclidean distance between species i and j, EWl was the branch length, wi and wj were the relative abundances of species i and j, PEWl was the branch length weight, and S was the number of species.
  • Functional divergence, FDiv, quantifies the dispersion of species functional trait abundance within the community in the functional space, reflecting the degree of niche differentiation and resource competition among species within the community [48]. FDiv was calculated as follows:
    g k = 1 S i = 1 S x i k
    d G i = k = 1 T x i k g k 2
    d G ¯ = 1 S i = 1 S d G i
    Δ d = i = 1 S w i × d G i d G ¯
    Δ d = i = 1 S w i × d G i d G ¯
    F D i v = Δ d + d G ¯ Δ d + d G ¯
    where xik was the value of trait k for species I, gk was the centroid of trait k, S was the number of species, T was the number of traits, d G ¯ was the average distance between species i and the centroid, Δd was the dispersion weighted by abundance, and wi was the relative abundance of species i. The usage conditions were S>T.
  • Community-weighted mean, CWM, quantifies the weighted average of functional traits of species within a community, reflecting the changes in dominant trait values of fish communities. CWM is very important for evaluating community dynamics [10]. CWM was calculated as follows:
    C W M = i = 1 S p i × t r a i t i
    where pi represented the relative abundance of species i, traiti was the trait value of species i, and S was the number of species in the community.

2.2.3. Functional Beta-Diversity

Species occurrence and non-occurrence data (i.e., occurrence is 1, non-occurrence is 0) were used to calculate the functional beta-diversity of fish communities. Before calculation, a Gower distance transformation was performed on the species–traits matrix and the trait distance was calculated between species. Then, principal coordinate analysis was used to reduce dimensionality. The first four axes (cumulative explanation rate>90%) were selected as input data for calculating the beta-diversity of functional traits [49]. Using the additive decomposition method proposed by Baselga [24], the Sørensen dissimilarity index and multidimensional functional space were used to calculate the functional beta-diversity of fish communities. This method decomposes functional beta-diversity into the sum of turnover and nested components [46]. Measure the contribution of turnover components to functional beta-diversity by their proportion to functional beta-diversity. A ratio greater than 0.5 indicates that beta-diversity is mainly dominated by turnover components, whereas a ratio less than 0.5 indicates that beta-diversity is mainly dominated by nested components [18]. Functional beta-diversity was calculated as follows:
Fβsor = Fβsim + Fβsne
Fβratio = Fβsim/ Fβsne
where Fβsor represented the functional beta-diversity, Fβsim was the turnover component of functional beta-diversity, Fβsne was the nestedness component of functional beta-diversity, and Fβratio was the proportion of the turnover component to functional beta-diversity.

2.2.4. Data Analysis

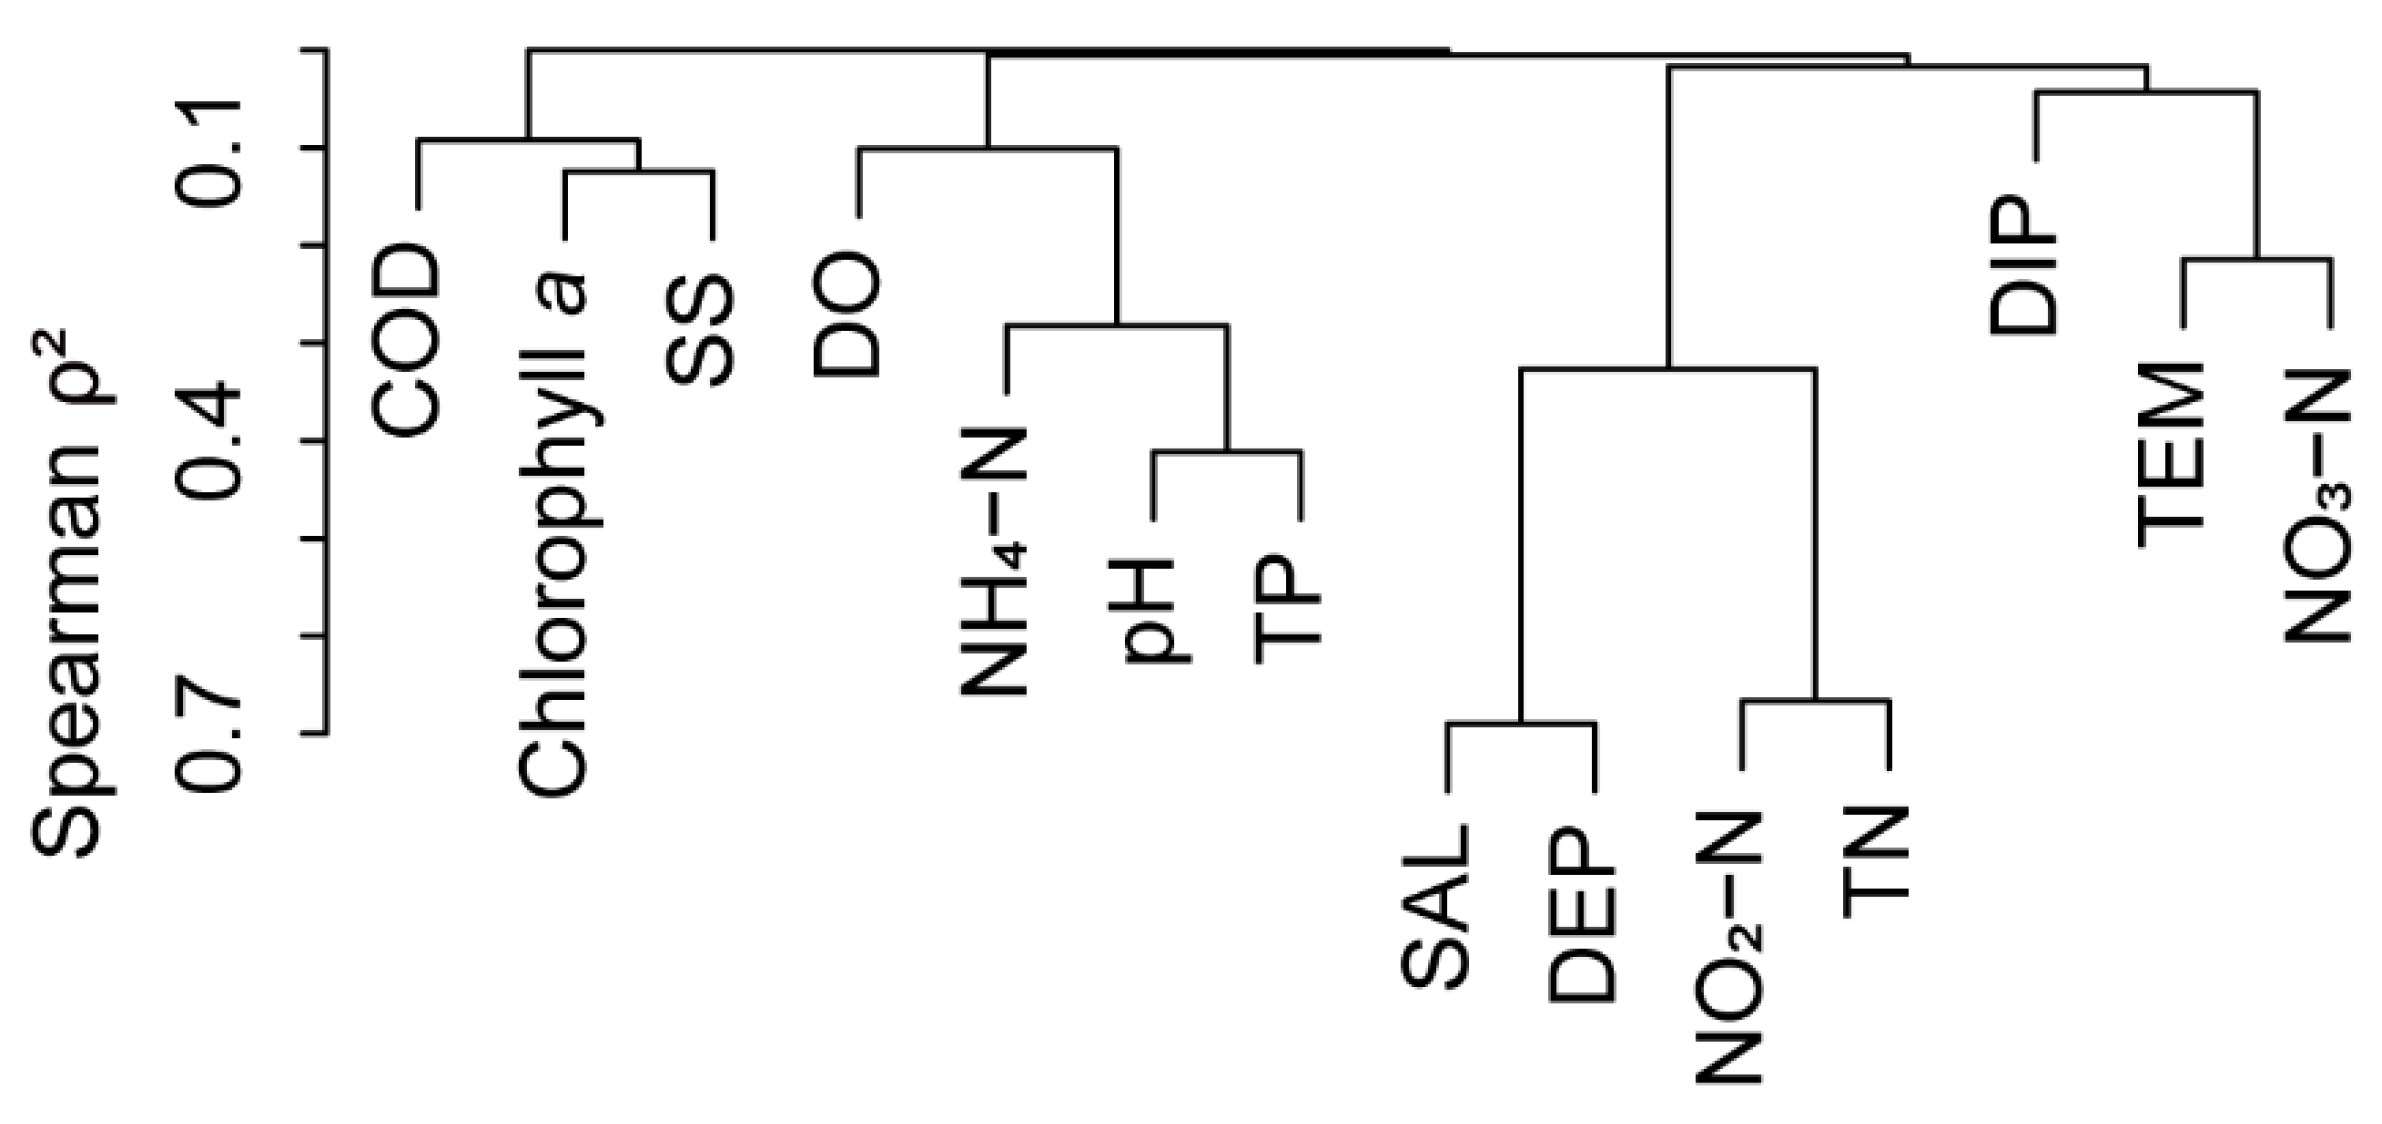
The functional alpha-diversity indices were calculated using the “FD” package. The functional beta-diversity and its components were calculated using the “betapart” package. Multiple regression on distance matrices (MRM) analysis was used to explore the relationship between spatial distance and environmental factors matrices with functional diversity and its components. Environmental factors were tested for correlation using a collinearity test, with correlation indicated by Spearman ρ2<0.7. MRM analysis was performed in the “ecodist” package, and all P-values were obtained by 9999 Mantel tests. The distances between two stations and between each station and river mouth were calculated using the “distm” function of the “geosphere” package based on latitude and longitude. The Euclidean distance matrix of environmental factors was calculated using the “vegdist” function of the “vegan” package. A collinearity test on environmental factors was performed using the “varclus” function of the “Hmisc” package and highly correlated (Spearman ρ2>0.7) environmental factors were excluded. To compare the relative importance of each factor, the “stdize” function in the “MuMIn” package was performed to standardize the Euclidean distance matrix of each factor before running the MRM analysis. Variance partitioning analysis (VPA) was performed to evaluate the contribution of geographic distance and environmental factors to the variance in functional diversity. VPA was performed using the “vegan” package.
All statistical analyses were conducted in R 4.2.2 and SPSS 17.0. Surfer 14 and Origin 2022 were also used to plot data.

3. Results

3.1. Fish Species Composition in the Huanghe River Estuary and Adjacent Seas

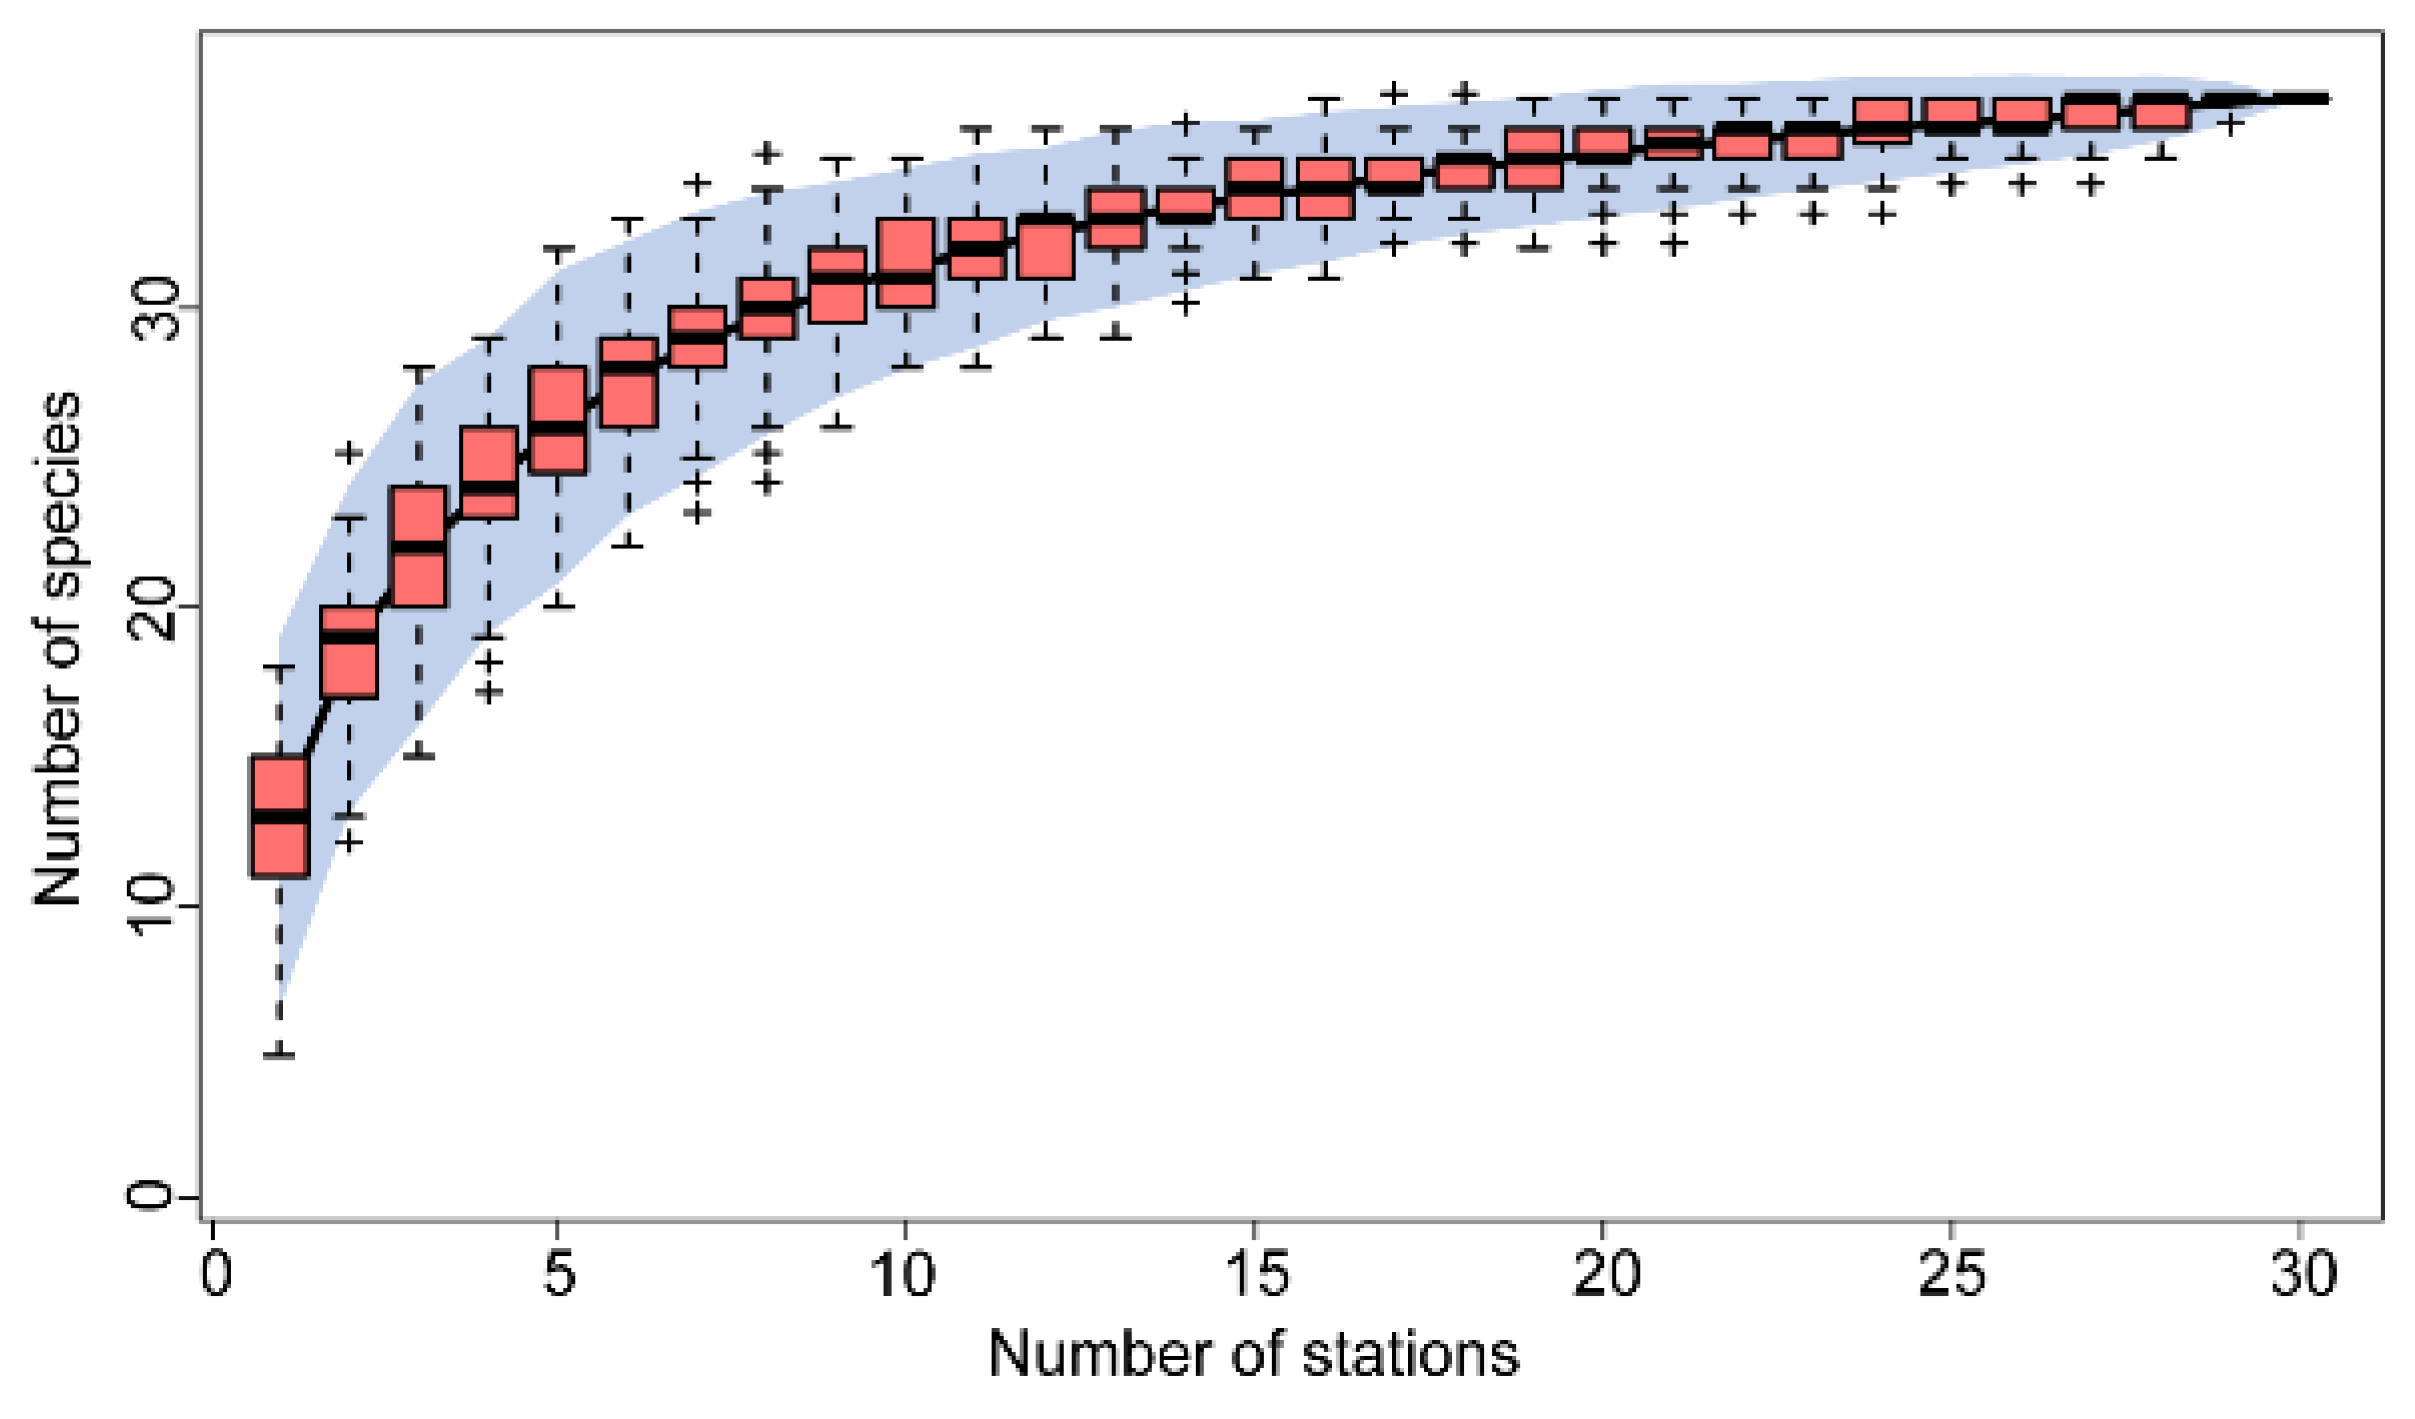
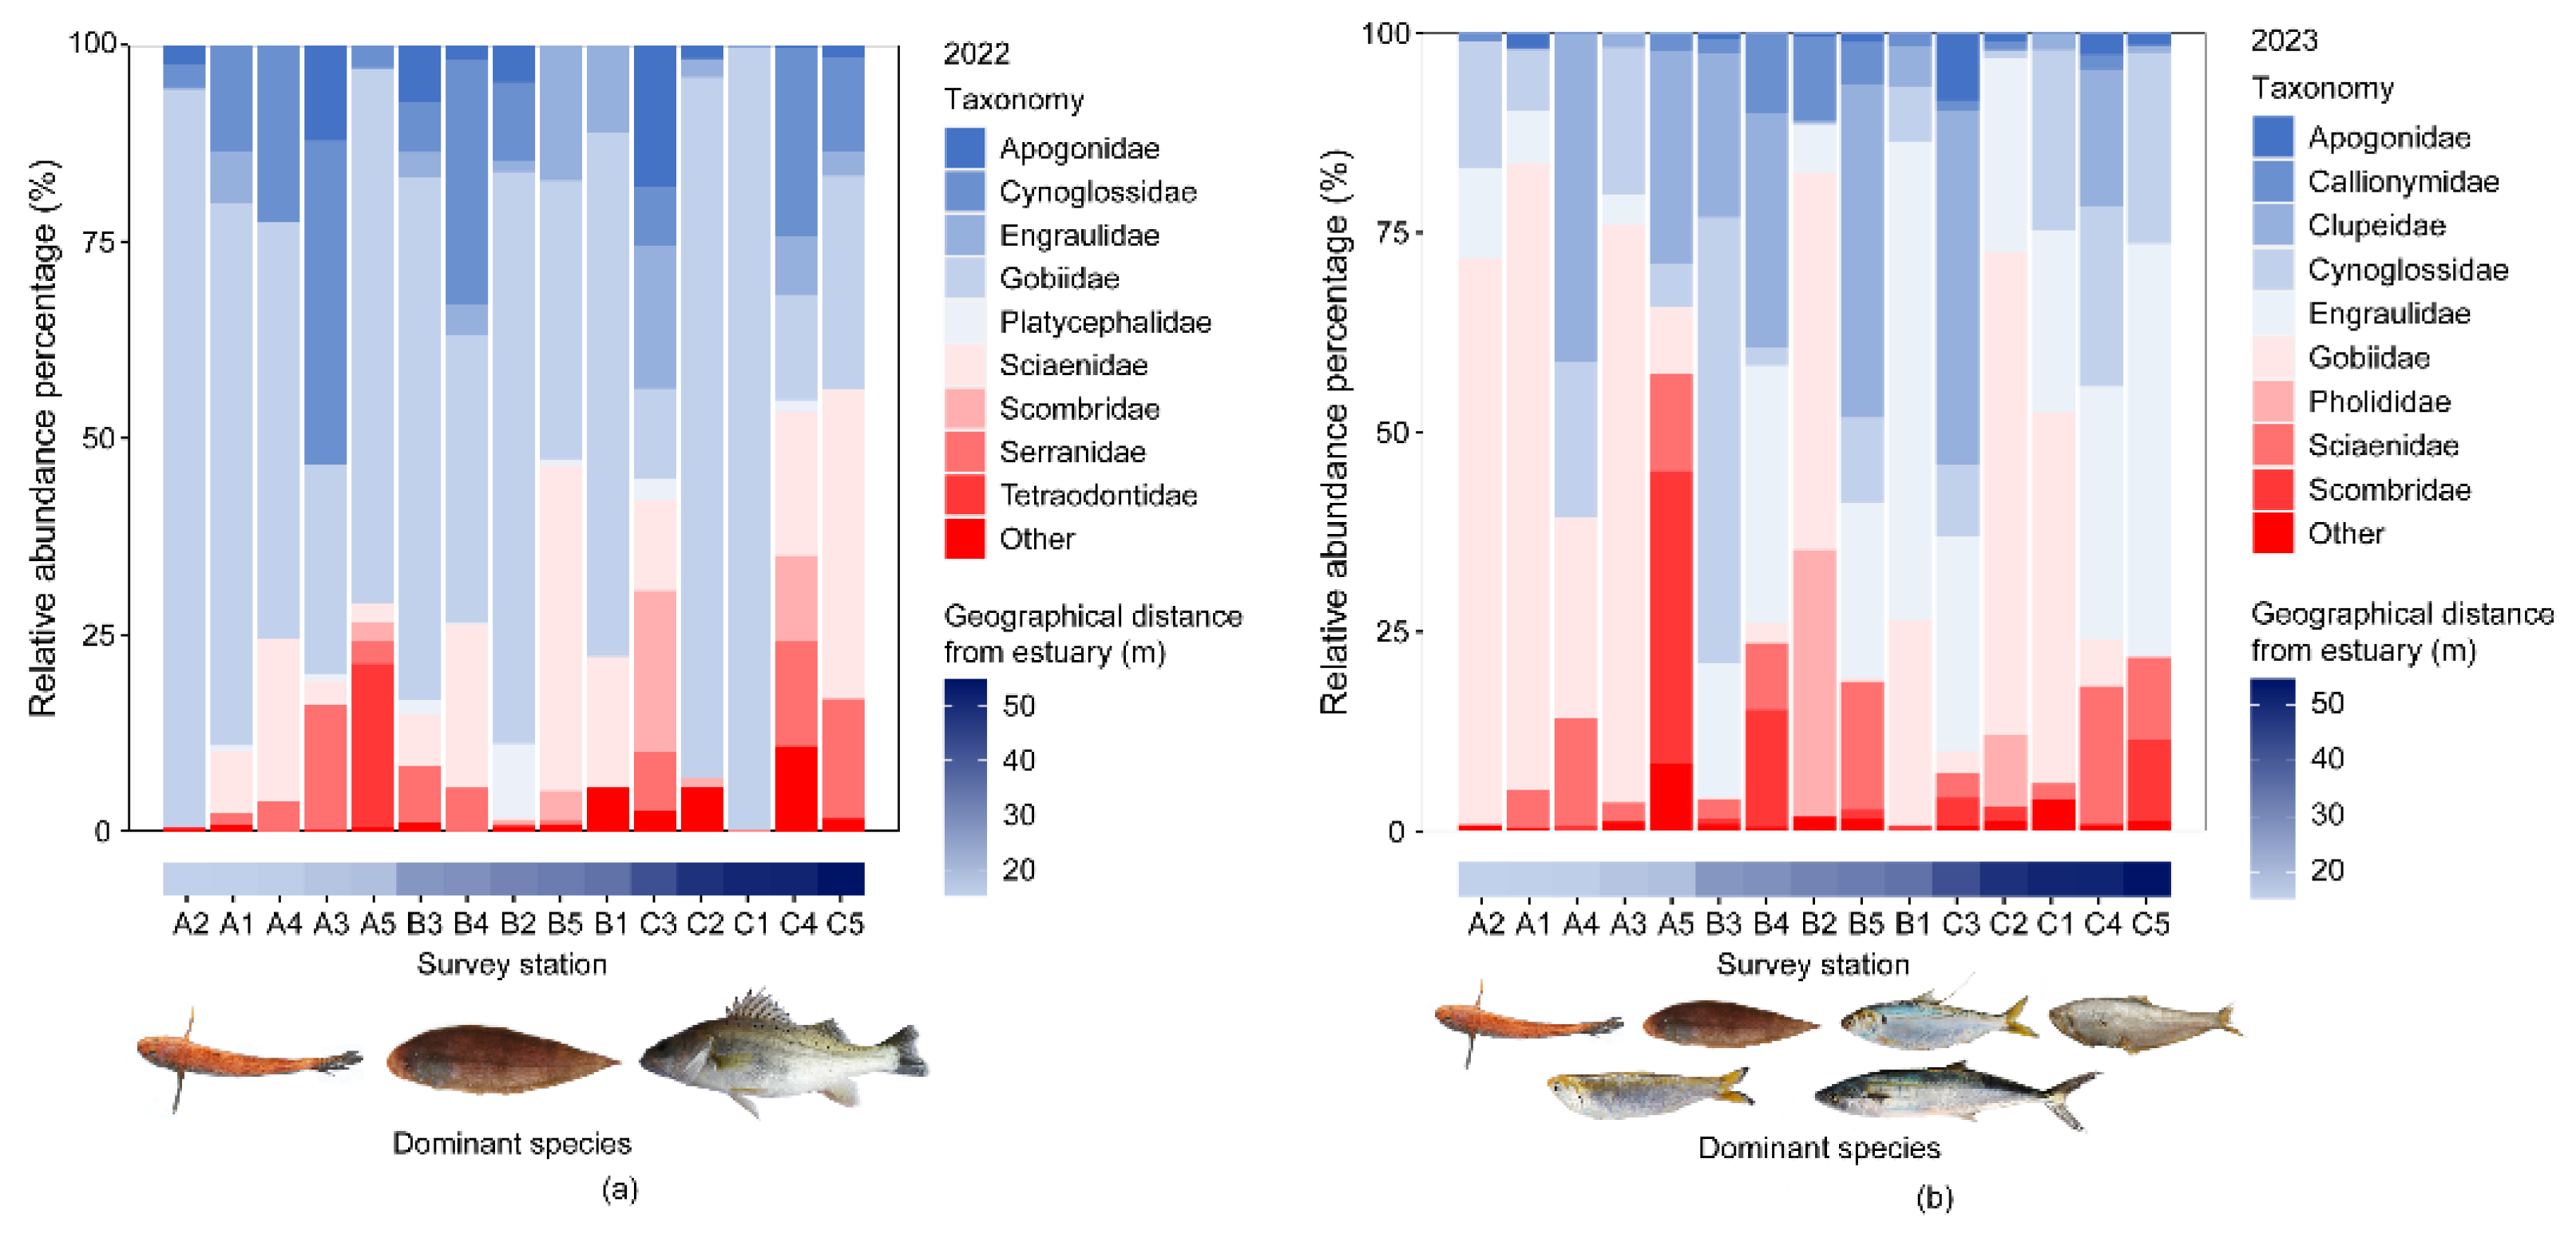
In the two survey cruises, a total of 30 sampling stations were visited. The species accumulation curve showed a stable upward trend and a gradual flattening of the number of samples (Appendix Figure B1). This indicated that the sampling in this study was adequate. In 2022 and 2023, a total of 37 fish species were caught by bottom trawl surveys in the Huanghe River Estuary and adjacent seas; these species belong to 35 genera, 21 families, 9 orders, and 1 class (Appendix Table A1). Among these species, Perciformes accounted for the highest number of species (19). In 2022, the average species count per station was 12±3, and the dominant species were Chaeturichthys stigmatias, Cynoglossus joyeri, and Lateolabrax maculatus. In 2023, the average species count per station was 17±2, and the dominant species were Chaeturichthys stigmatias, Cynoglossus joyeri, Konosirus punctatus, Setipinna taty, Thrissa kammalensis, and Scomberomorus niphonius. The species count at each station in both years followed a normal distribution. A paired T-test revealed a significant difference in species count between the two years (P<0.001). Stacked plots of species abundance percentages (Figure 2) showed that Gobiidae consistently accounted for the highest proportion of species at each station across all years; in 2022 and 2023, it constituted 73.55% and 35.57%, respectively, of the total species abundance. Furthermore, the proportion of Gobiidae was unaffected by the geographical distance between the stations and the estuary.

3.2. Functional Alpha-Diversity and Dominant Community Trait Composition of Fishes in the Huanghe River Estuary and Adjacent Seas

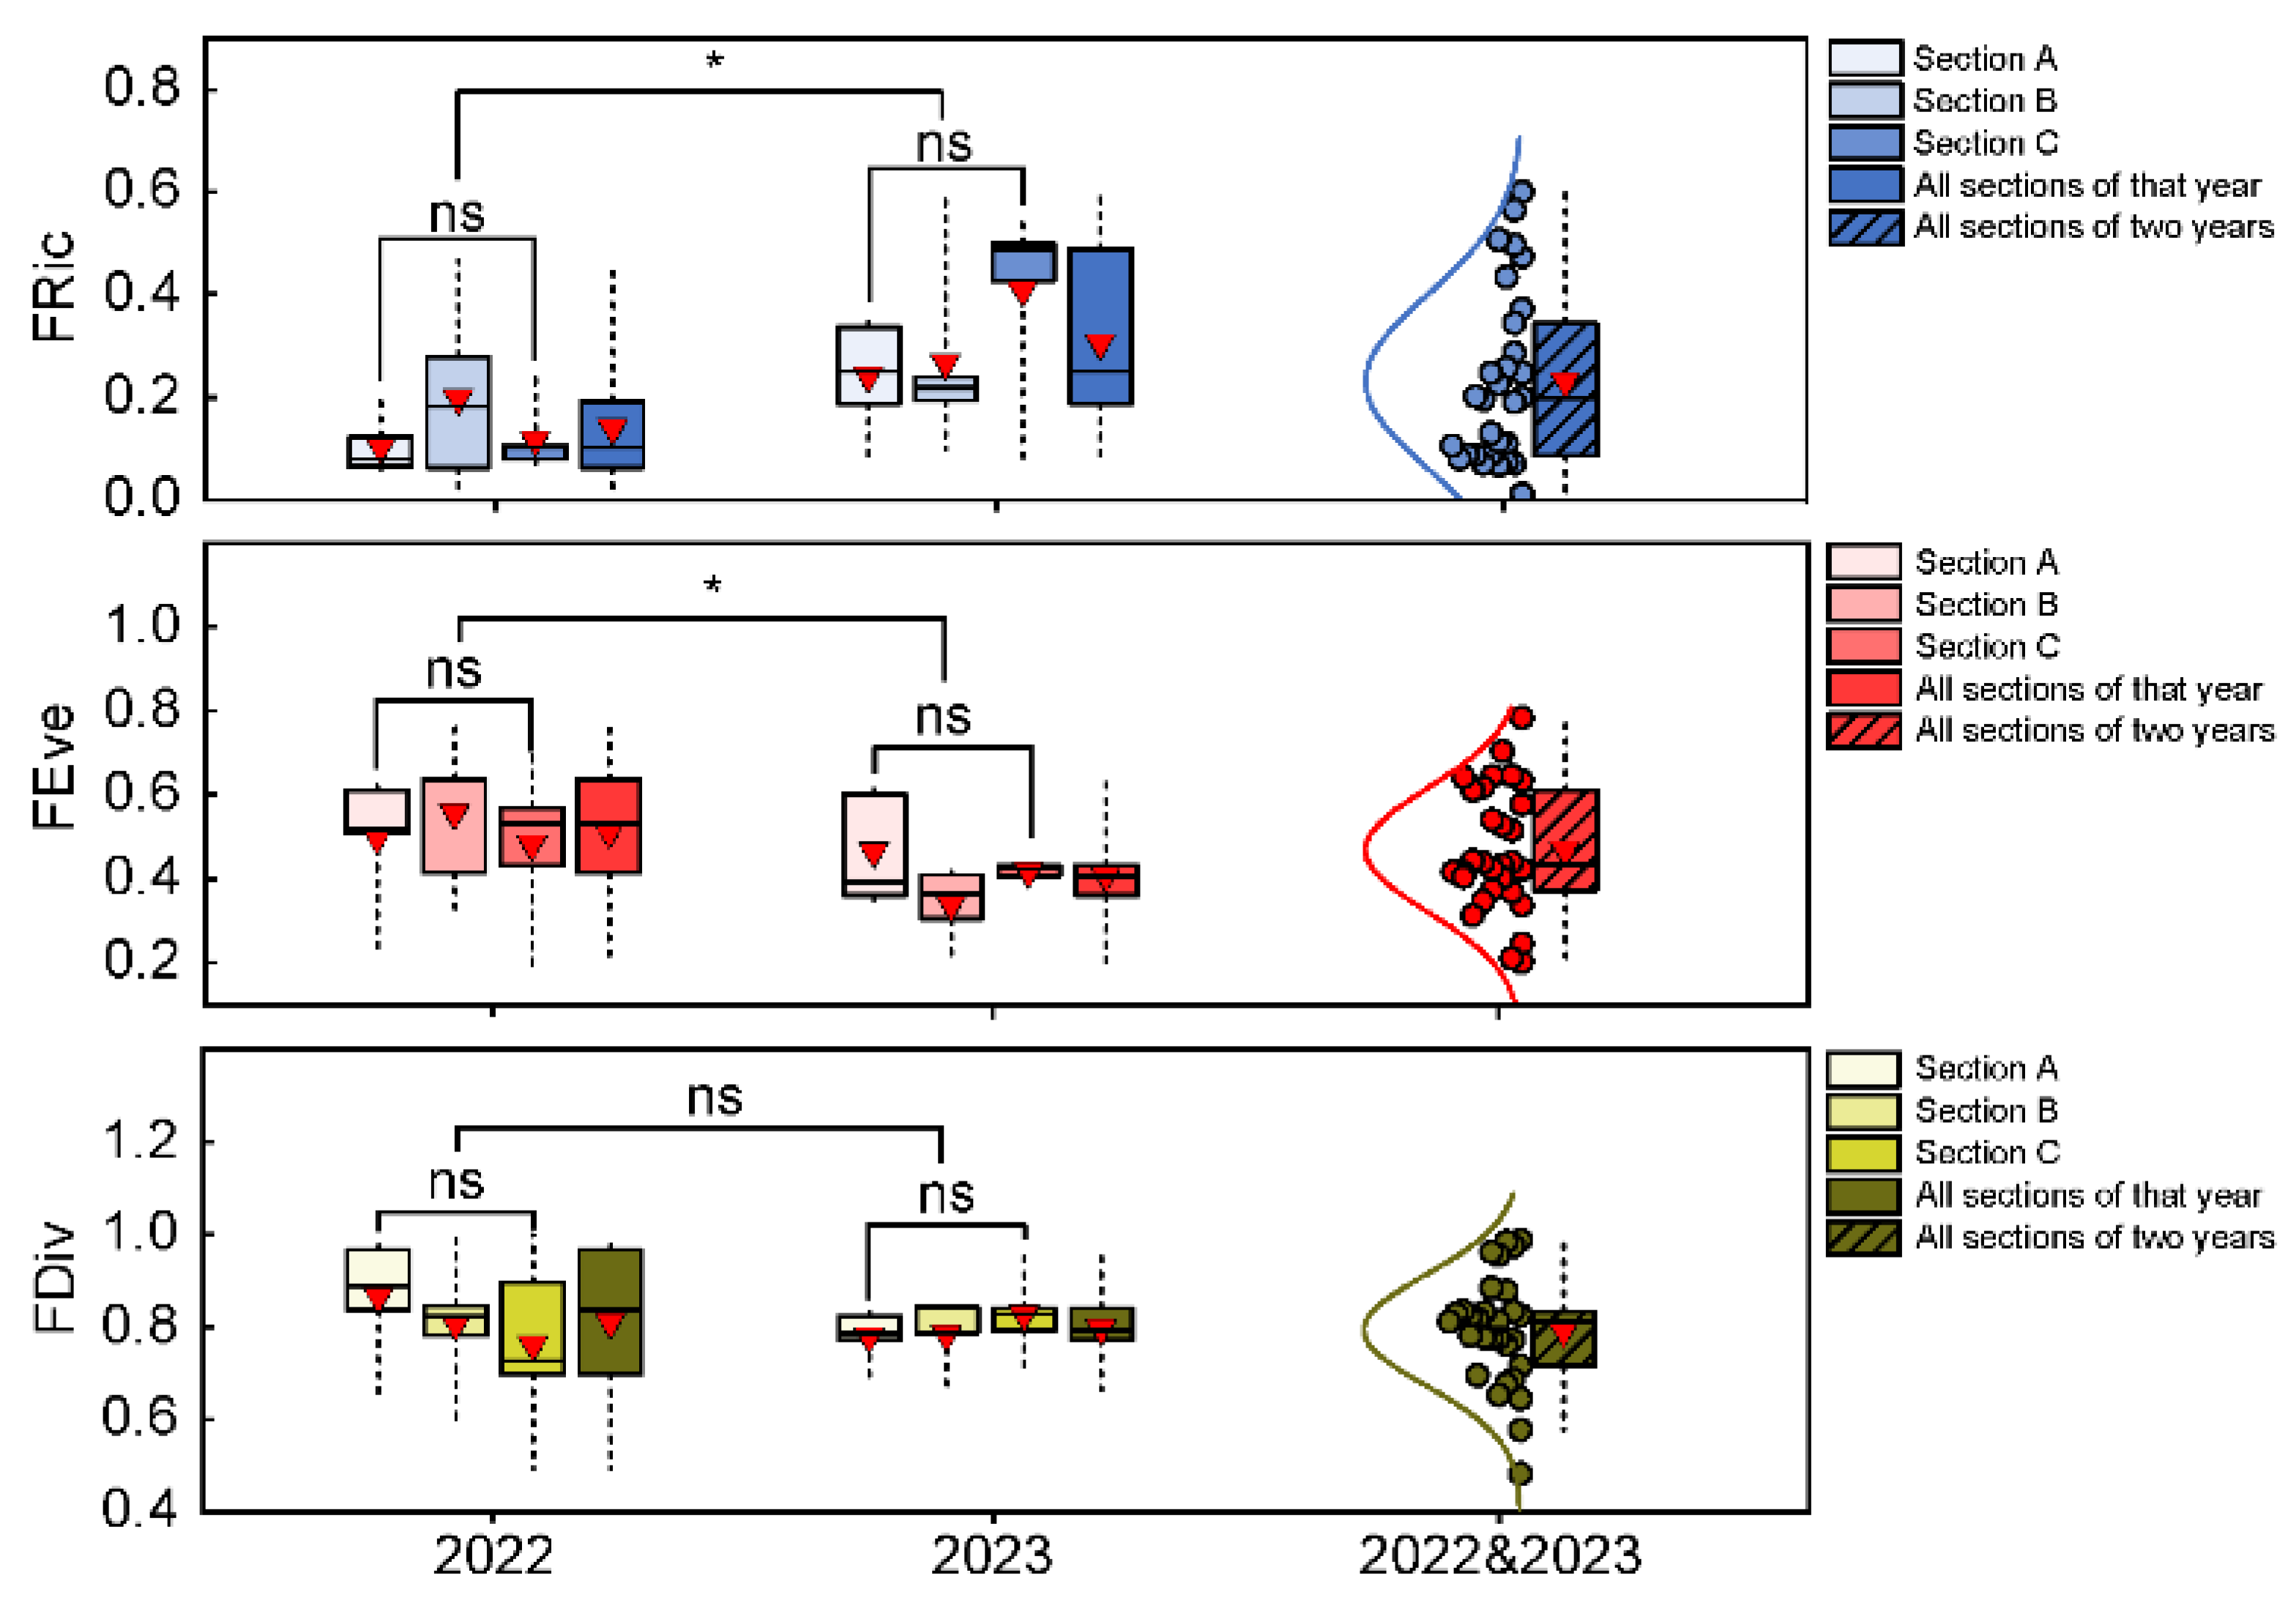
Alpha-diversity analysis of fish communities in the Huanghe River Estuary (Figure 3) revealed that the average FRic index values for 2022, 2023, and the two-year period were 0.140 ± 0.117, 0.307 ± 0.175, and 0.223 ± 0.169, respectively. This indicated that the number of species occupying ecological niches in fish communities significantly increased over the two-year period (P<0.05). The average FEve index values were 0.514 ± 0.166, 0.408 ± 0.104, and 0.461 ± 0.147, respectively, which indicated that the evenness of functional trait abundance distribution among fish species in the multi-dimensional trait space decreased over the two-year period (P<0.05). The average FDiv index values were 0.812 ± 0.155, 0.798 ± 0.075, and 0.805 ± 0.120, respectively, but the differences were not significant (P>0.05). This indicated that the dominant species in the fish community deviated from the center of gravity in the multi-dimensional trait space. The abundance distribution of species’ functional traits exhibited a high level of dispersion during the survey period. There was not a significant difference in functional alpha-diversity indices among different sections across survey years. This indicated that the distribution pattern of functional alpha-diversity was not affected by the distance gradient between sampling stations and the river mouth.
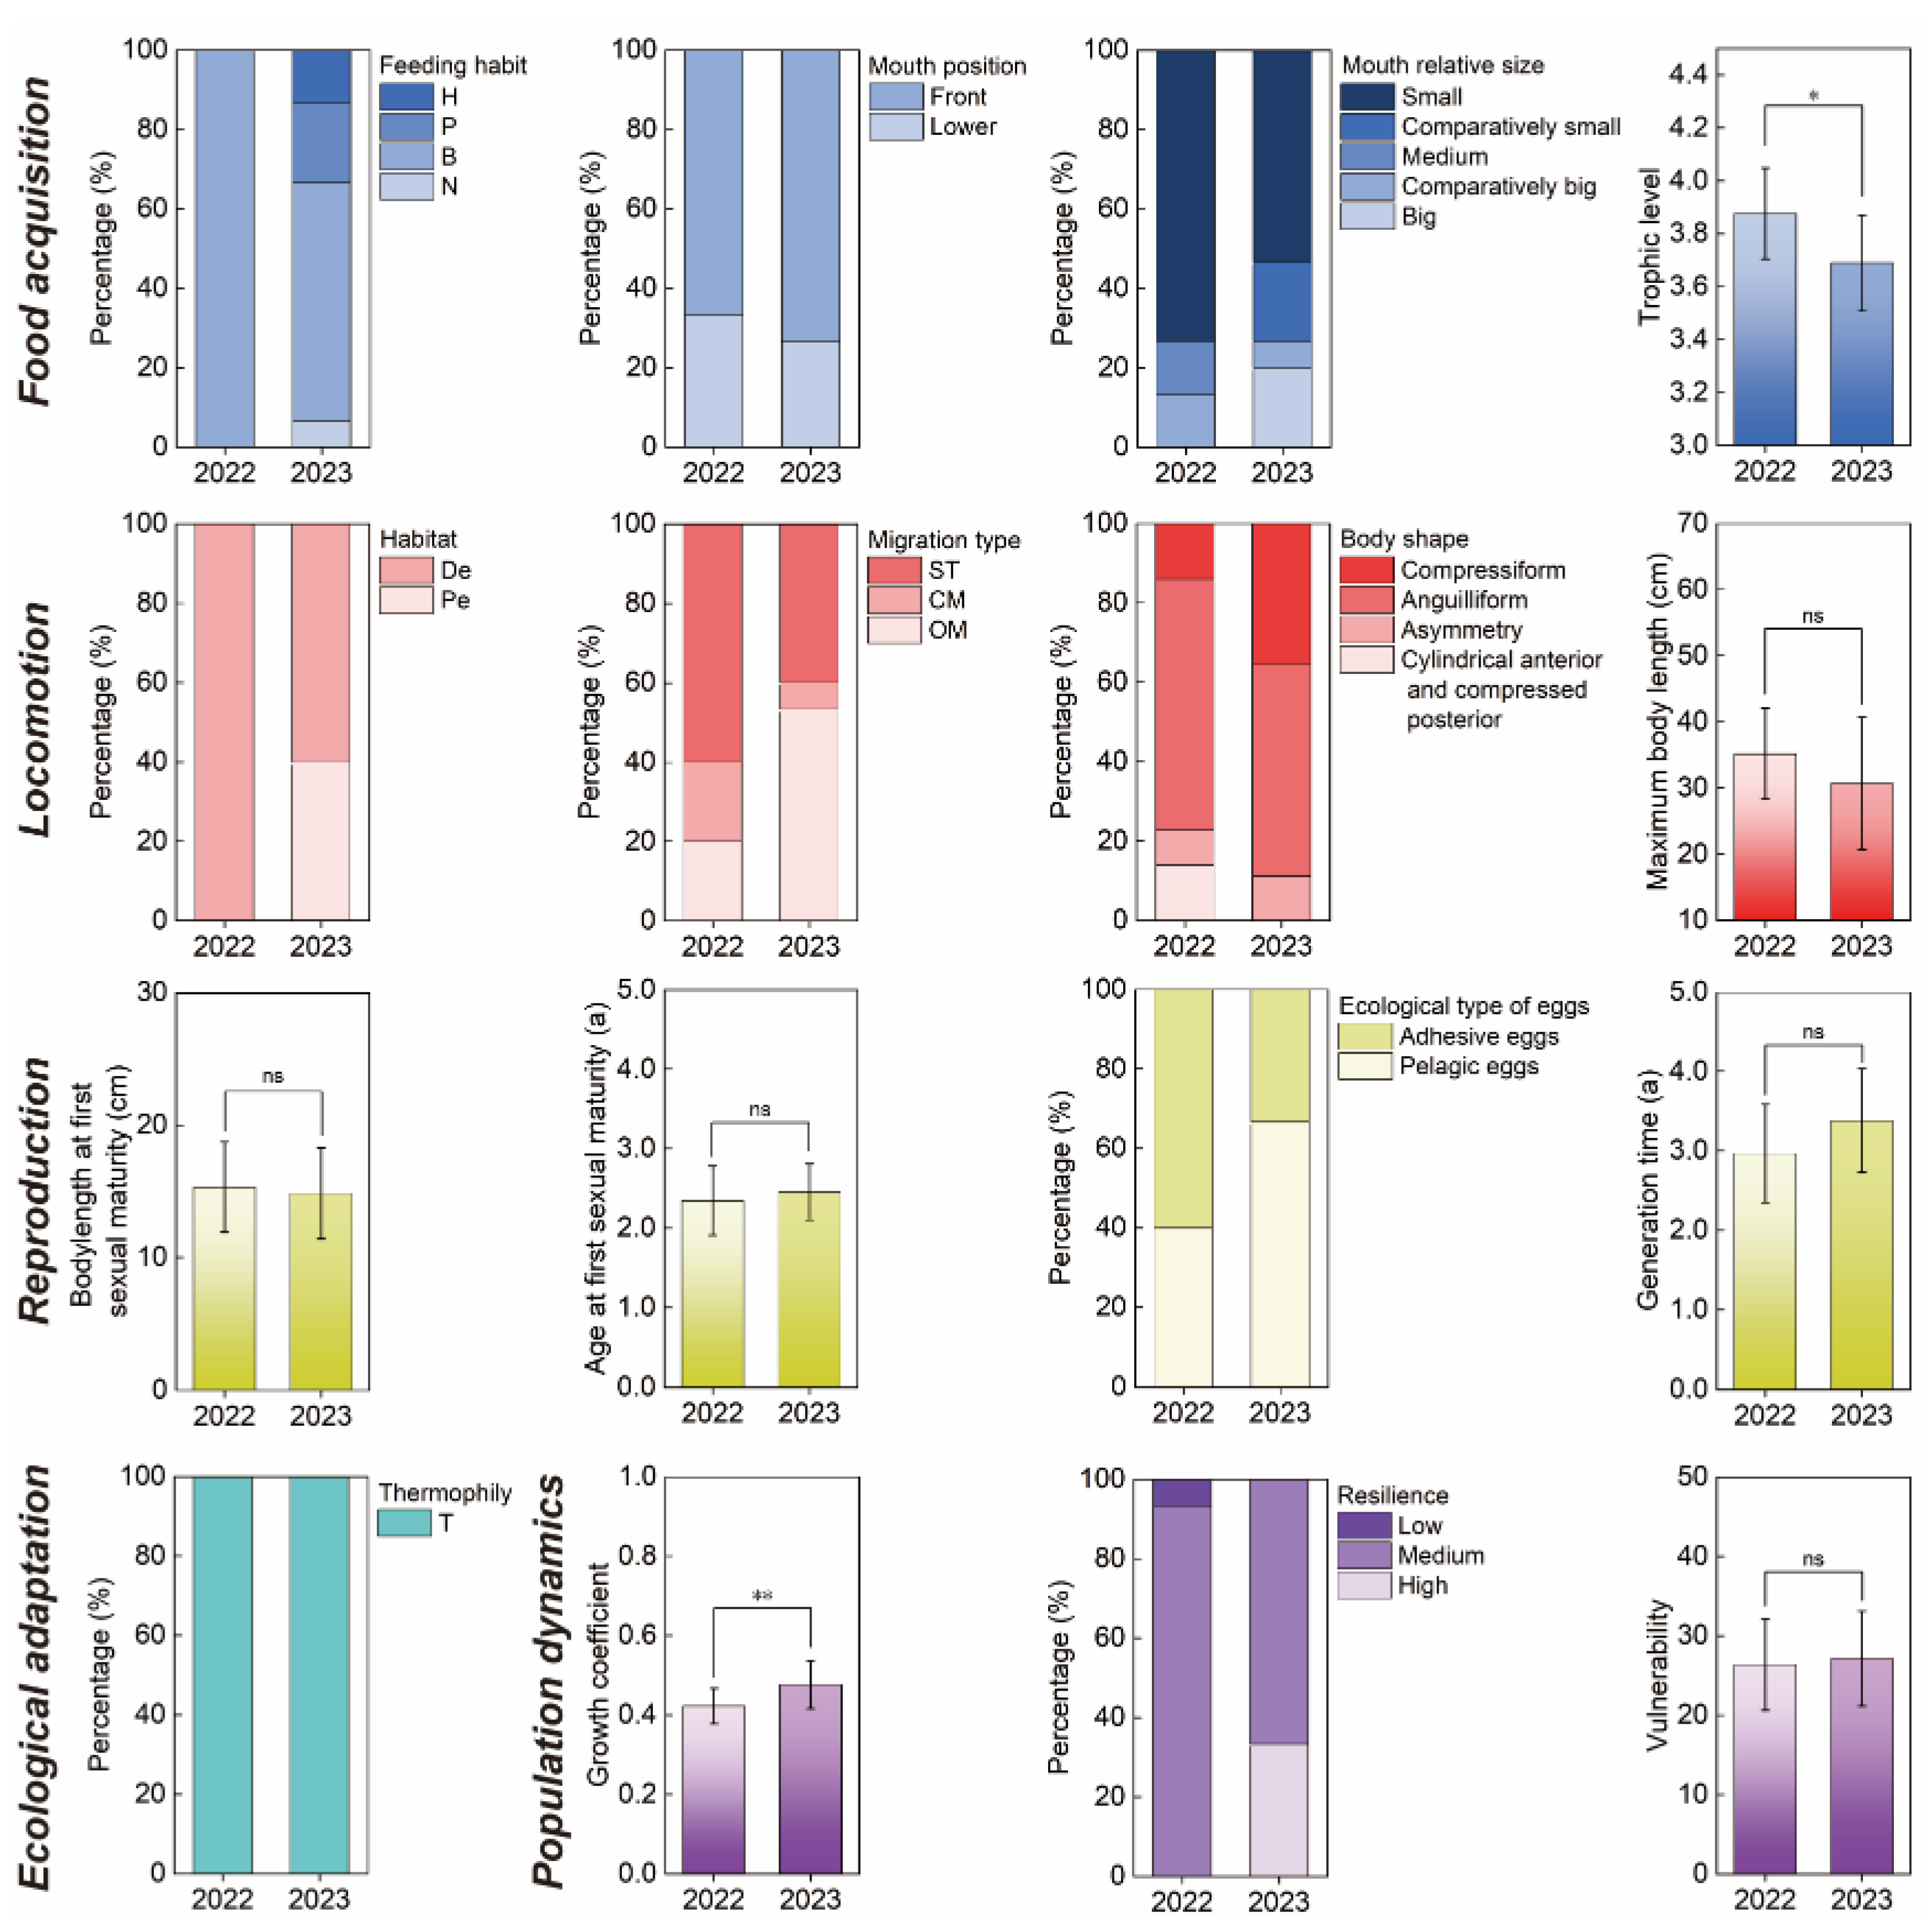
CWM reflected the dominant trait composition pattern of fish communities in the Huanghe River Estuary and adjacent seas (Figure 4). In terms of food acquisition, species with benthivorous feeding habits; small, front-facing mouths; and higher trophic levels were dominant during the survey period. Feeding habits shifted from benthivorous species in 2022 to benthivorous, herbivorous, planktivorous, and nektivorous species in 2023. The trophic levels of dominant species in 2022 and 2023 were 3.876 ± 0.172 and 3.689 ± 0.181, respectively, with significant differences between the two years (P<0.05).
Of the locomotion traits, species that are demersal, anguilliform, and have a maximum body length 30–40 cm were dominant. The dominant migration types shifted from settlement type in 2022 to offshore migratory in 2023. The proportion of species inhabiting pelagic layers also increased. The maximum body lengths of dominant fishes in 2022 and 2023 were 35.21 ± 6.86 cm and 30.70 ± 10.02 cm, respectively, with no significant difference between the two years (P>0.05).
Of the fish reproduction traits, the dominant ecological type of eggs shifted from adhesive eggs in 2022 to pelagic eggs in 2023. The dominant body lengths at first sexual maturity in 2022 and 2023 were 15.09 ± 3.42 cm and 15.09 ± 3.45 cm, respectively. The ages at first sexual maturity were 2.35 ± 0.44 years and 2.46 ± 0.35 years, respectively. Generation times were 2.97 ± 0.62 years and 3.38 ± 0.65 years, respectively. During the survey period, there were no significant differences in body lengths, ages at first sexual maturity, and generation times (P>0.05).
The dominant population dynamics of fish were low growth coefficient, moderate resilience, and low vulnerability during the survey period. The growth coefficients for 2022 and 2023 were 0.423 ± 0.044 and 0.476 ± 0.060, respectively, with a highly significant difference between the two years (P<0.01). The dominant resilience of fish populations shifted from moderate resilience to coexistence of species with moderate and high resilience. The population vulnerabilities were 26.39 ± 5.75 and 27.14 ± 5.98, respectively, with no significant difference between the two years (P>0.05). In terms of thermophily, warm temperate was the dominant trait during the survey period.

3.3. Functional Beta-Diversity of Fishes in the Huanghe River Estuary and Adjacent Seas

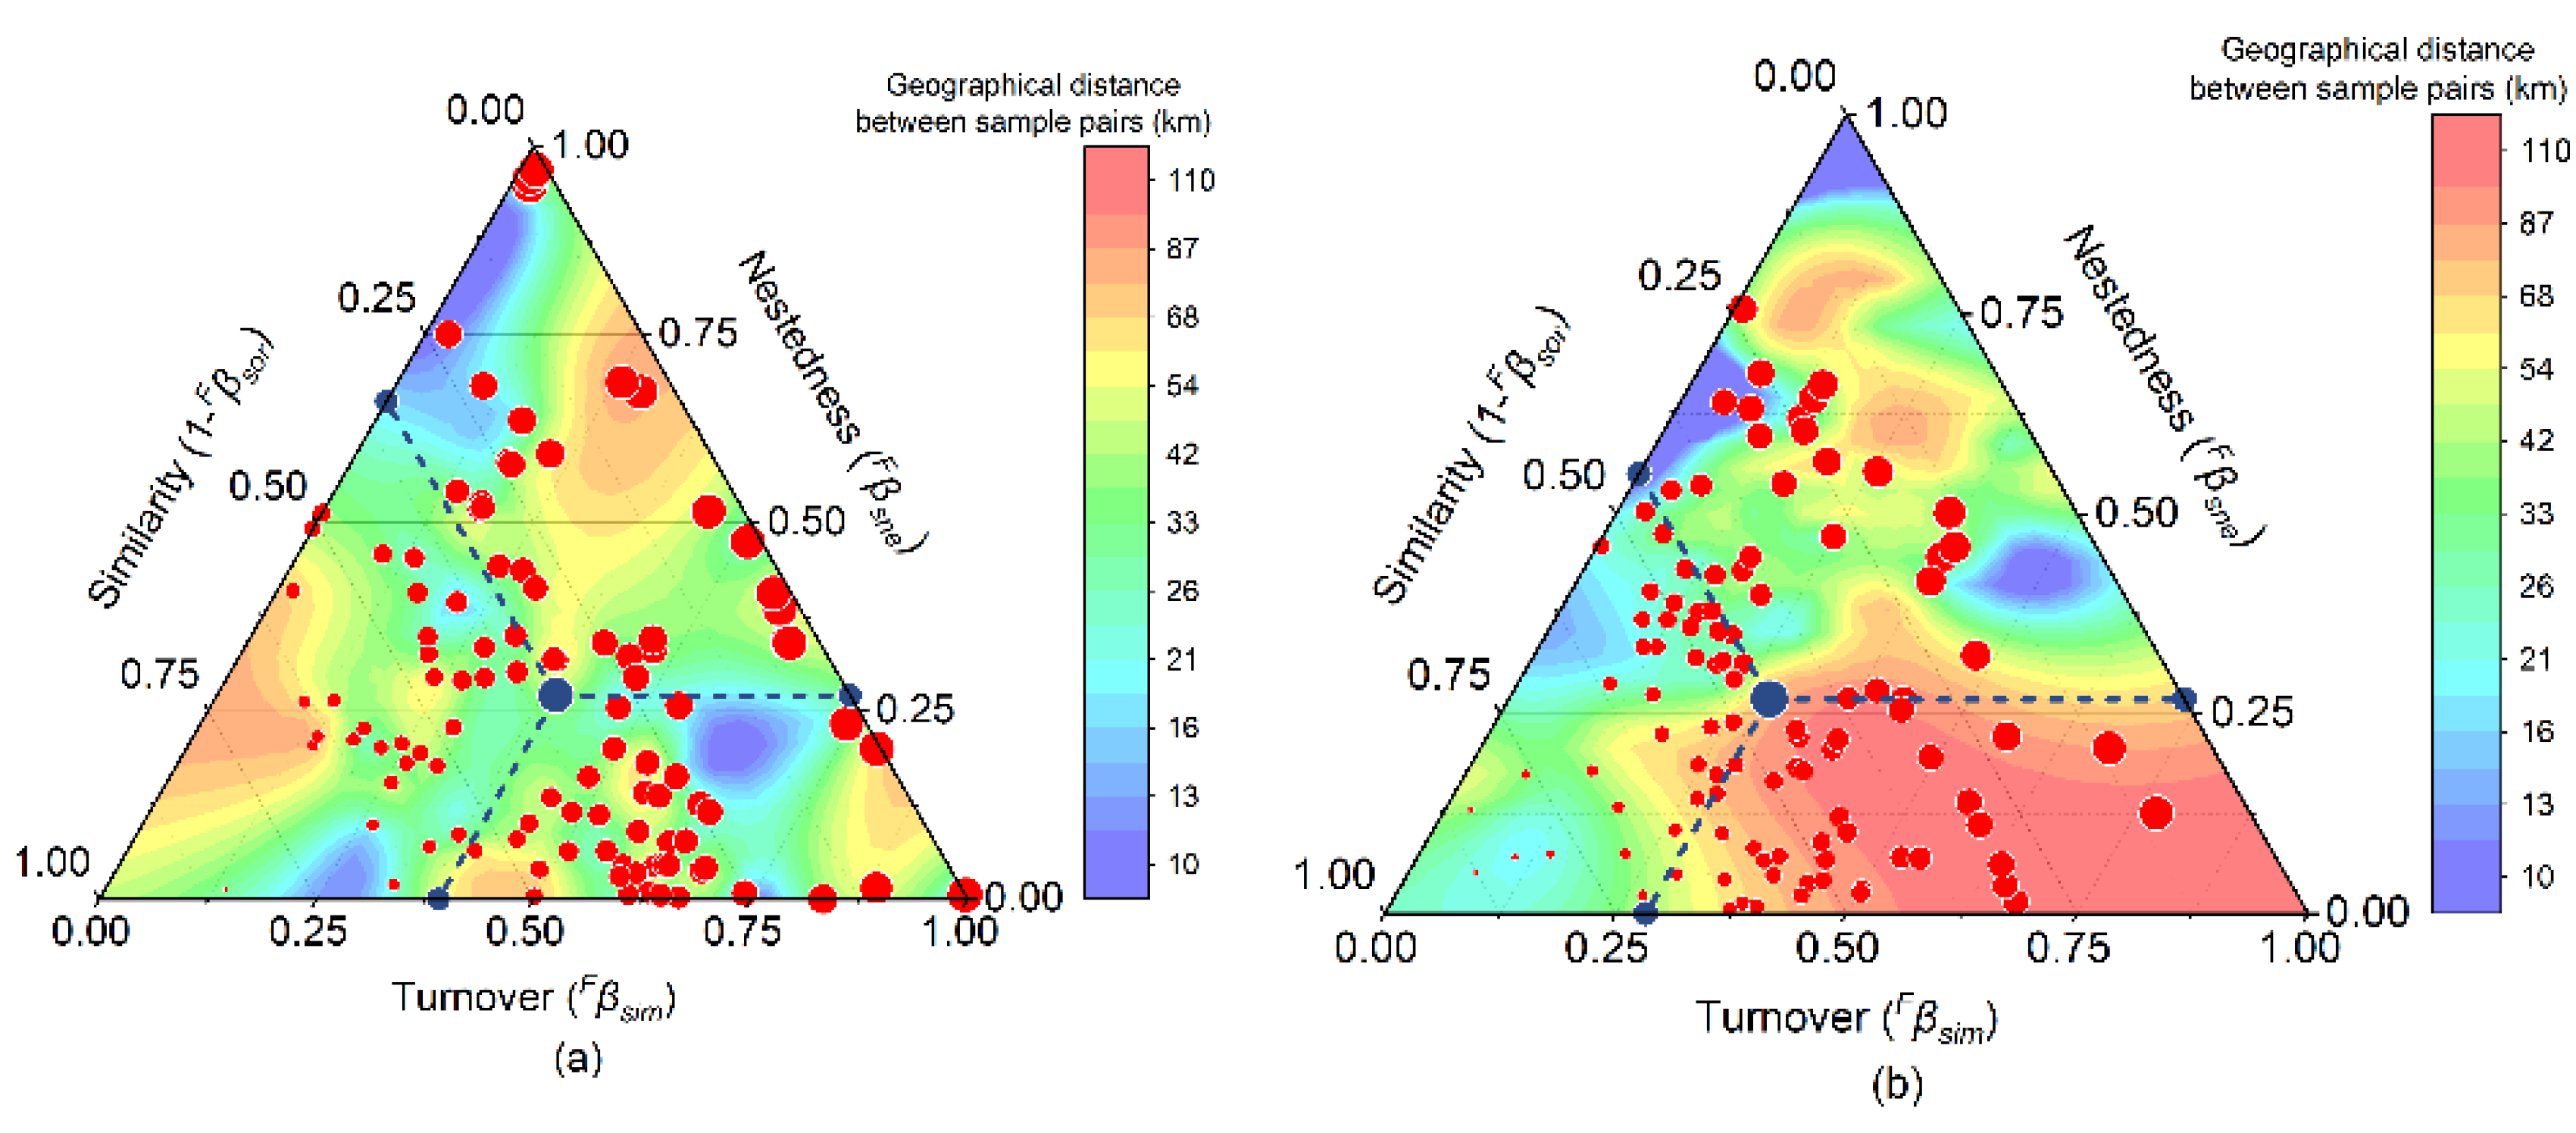
In 2022, the mean values of Fβsor, Fβsim, and Fβsne of fish communities in the study area were 0.661 ± 0.180, 0.391 ± 0.221, and 0.271 ± 0.224, respectively. The turnover component contributed 59.15% to functional beta-diversity. In 2023, the mean values of the three components were 0.661 ± 0.180, 0.391 ± 0.221, and 0.271 ± 0.224, respectively, and Fβsim contributed 51.36%. During the research period, Fβsim dominated functional beta-diversity of the Huanghe River Estuary and adjacent seas, but its contribution showed a declining trend. The results of the two years of surveys were consistent with a normal distribution (P>0.05, single sample K–S test). Single-sample T-test did not show a significant difference between functional beta-diversity and its mean value between 2022 and 2023 (P>0.05, two-tailed test). Paired-sample T-test showed a significant difference in functional beta-diversity among sample pairs between 2022 and 2023 (P<0.001, two-tailed test) (Table 2).
The functional beta-diversity of fishes in the Huanghe River Estuary and adjacent seas and functional beta-diversity components are shown in Figure 5. From 2022 to 2023, the Fβsim center of gravity significantly shifted toward lower values, although there was not a significant change in Fβsne (Figure 5). This caused the similarity values (1−Fβsor) of sample pairs to be pulled toward high values, which led to a reduction in the number of high-value sample pairs for Fβsor. The three-dimensional contour map of geographic distance distribution for sample pairs showed that, during the survey period, the geographic distance among sample pairs significantly increased as the values of Fβsor and Fβsim decreased. Therefore, there may be a negative correlation between fish functional beta-diversity and geographical distance in the Huanghe River Estuary and adjacent seas.

3.4. Relationship between Functional Diversity of Fishes and Environmental Factors in the Huanghe River Estuary and Adjacent Seas

Environmental factors were tested for correlation using a collinearity test, with correlation indicated by Spearman ρ2<0.7 (Appendix Figure C1). Therefore, all environmental factors were incorporated into the MRM model, and geographic distance factors were also included in the analysis. The results indicated that the NH4–N and TP levels were the principal environmental factors that influenced FRic and FEve (P<0.05). There was not a significant correlation between geographical distance and functional alpha-diversity indicators (P>0.05). For Fβsor, only ammonia nitrogen showed a significant positive correlation (P<0.05). Fβsim exhibited a highly significant negative correlation with pH (P<0.01) and a significant negative correlation with geographic distance (P<0.05). Fβsne showed significant positive correlations with TP and pH (P<0.05). Correlation analysis between FRic and Fβsor revealed an extremely significant negative correlation (P<0.001) (Table 3).
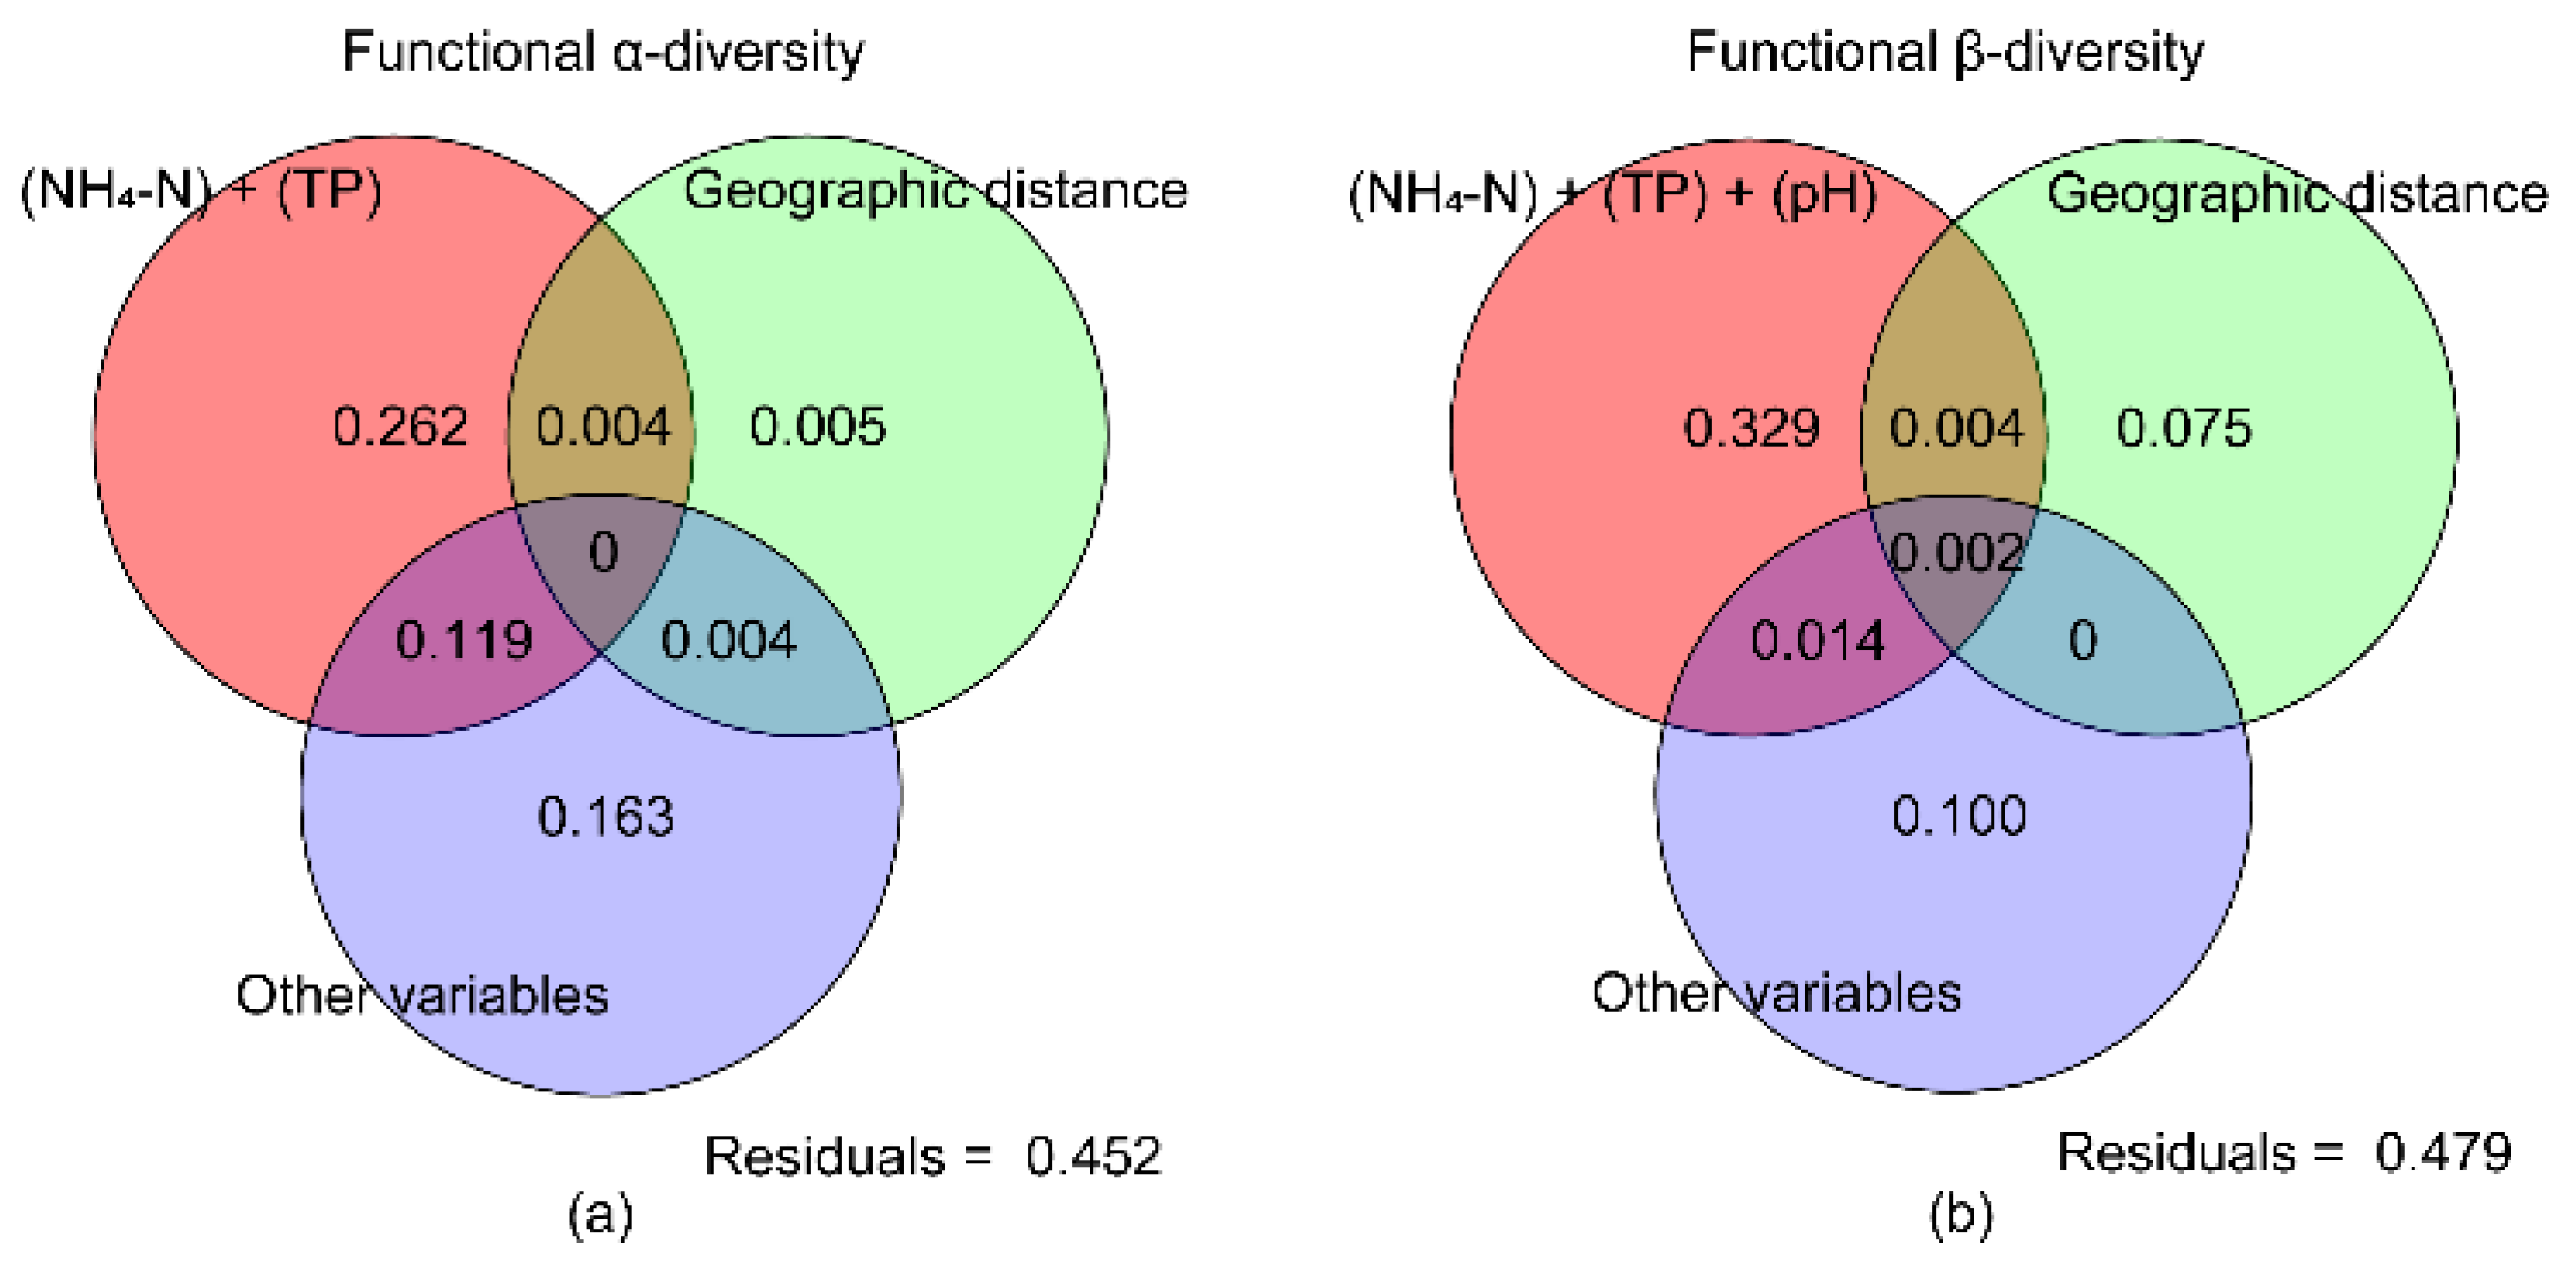
The VPA results showed that NH4–N and TP played more important roles than other variables in determining the functional alpha-diversity of fish communities in the Huanghe River Estuary and adjacent seas. All environmental factors accounted for 54.44% of functional alpha-diversity, of which NH4–N and TP each accounted for 26.22%. However, geographical distance had minimal explanatory power on the distribution pattern of functional alpha-diversity in fish communities. In terms of functional beta-diversity, all environmental factors accounted for 44.31%, of which geographic distance variables accounted for 7.59%. However, the combined explanatory power of alpha- and beta-diversity was relatively low. Of all environmental factors, NH4–N, TP, and pH contributed 32.90% to functional beta-diversity, whereas other environmental factors contributed 10.01% (Figure 6).

4. Discussion

Numerous studies have been conducted on traditional fish species diversity, focusing on indices such as the Margalef richness index and Shannon–Wiener diversity index. These studies primarily compared species number and abundance within communities. This approach was referred to as taxonomic alpha-diversity and has been used to quantify fish diversity. As research progressed, traits were introduced into the study of diversity. Functional diversity research, which is based on “species–trait–abundance”, can more effectively explain various ecological issues than traditional “species–abundance” research.
Factors that influence fish functional diversity include environmental gradients, geographical distance, and functional traits. Construction of a fish functional traits matrix is crucial to elucidating their impacts on fish communities, and functional traits must be selected that are associated with research objectives [36]. The morphological traits of fishes reflect the complex interplay between them and their environment. Existing research on fish functional traits primarily relied on morphological characteristics and focused on freshwater fishes. For example, there are characteristics of motor function that are reflected by ratios of body length to body height and ratios of minimum caudal peduncle height to maximum caudal fin height [50]. Additionally, there are measurements that reflect habitat, such as eye position, eye diameter, and head height [12]. Although morphological characteristics can effectively describe fish traits related to food acquisition, movement, and other functions, and they are the only functional traits that can be reasonably quantified [51], they cannot fully reflect all the roles of fishes in the ecosystem. There are few studies on the functional traits of marine fish [14,15,16]. In this study, in addition to selecting five morphological traits, such as mouth position, size, and body shape, 16 functional traits were also selected according to existing reports. These traits covered five characteristics of fishes, food acquisition, locomotion, reproduction, population dynamics, and ecological adaptation, which comprehensively reflect the functional diversity of fish communities in the Huanghe River Estuary and adjacent seas.
Functional alpha-diversity calculation revealed that FRic was solely associated with the alteration in the “species–traits” matrix and the frequency of species occurrence within communities, and was unaffected by species abundance. However, the influence of species abundance must be considered when calculating FEve, FDiv, and CWM. In this study, 32 species were identified across 2022 and 2023 in the study area. Of these, 27 species were common in both years. However, FRic was significantly higher in 2023 than 2022. This may be attributed to the significant increase in the frequency of various species across all sampling stations in 2023 compared with that in 2022. Moreover, variations in species between the two years may have altered the extreme traits within communities, although this was unlikely to be the primary factor. On the basis of these findings, we infer that the fish community in the Huanghe River Estuary and adjacent seas exhibited greater stability in 2023 compared with that in 2022.
CWM indicated that there were significant changes in the composition of seven dominant traits, including feeding habits, trophic levels, and migration patterns, of the fish communities in the Huanghe River Estuary and adjacent seas during 2022 and 2023. The survey results showed that the average abundance of Chaeturichthys stigmatias declined from 12,205 to 922 ind./h over the two-year period, whereas the average abundance of Acanthogobius ommaturus, which is within the same family, dropped from 140 to 10 ind./h. Over the two years, the influence of various previously dominant traits decreased, including benthivorous feeding habits, settlement migratory type, adhesive eggs, low growth coefficient, and low to medium resilience, and the abundance of Gobiidae also decreased. Conversely, the average abundance of Konosirus punctatus increased from 4 to 365 ind./h, whereas that of Setipinna taty increased from 30 to 284 ind./h. The dominance of herbivorous and planktivorous feeding habits, offshore migratory type, pelagic eggs, and high growth coefficients and resilience of the aforementioned two types were enhanced. Moreover, Engraulidae and Clupeidae primarily occupy the mid- to upper-water layers, whereas Gobiidae primarily occupy the bottom layer; this also contributed to the yearly variations in the habitat traits of the fish communities. A bottom trawl is unlikely to underestimate the amount of pelagic fishes because they tend to remain near the sea bottom during the day [52]. Therefore, we speculated that the significant fluctuation in fish abundance in the study area was a principal factor that influenced the dominant traits of the community.
Previous studies showed that, along a specific environmental gradient, community nestedness and turnover contribute to the spatial variation of beta-diversity, which in turn depends, to a certain extent, on the attributes of functional groups. If environmental factors undergo a continuous gradual change, fish community composition tends to be dominated by nestedness structure [53]. However, if environmental factors undergo a sudden or abrupt shift, fish community composition is dominated by turnover [54]. Studies by Oikonomou et al. [55] and Lansac-Tôha et al. [56] indicated that the beta-diversity of fish communities primarily resulted from species turnover, with a negligible influence of nestedness components. This study revealed that the fish community functional beta-diversity in the Huanghe River Estuary and adjacent seas was dominated by turnover components, which was consistent with existing research findings. However, although the contribution of turnover was comparable to that of nestedness, it was significantly lower than what was observed in other sea areas [28,29,57] and exhibited an annual decline. These findings could differ because the scale of the research area was relatively small. The sampling stations were close to the shore (within a 20-m water depth). Habitat connectivity and fish adaptability to the environment contributed to their relatively strong dispersal ability in the research area. The functional homogeneity of fish communities was previously found to be relatively high in this area [28]. However, fishing pressure and environmental changes may resulted in an increase in the proportion of shared functional traits among fish communities and a decrease in the diversity of functional traits.
Based on the correlation between functional diversity and environmental factors, it was observed that the functional alpha-diversity of fish communities in the Huanghe River Estuary and adjacent seas was negatively correlated with NH4–N and positively correlated with TP. Functional beta-diversity was positively correlated with the NH4–N and TP gradients in sample pairs, which indicated that functional beta-diversity was influenced by an upward control effect of N/P ratio in the environment. Studies showed that increased nitrogen concentration and decreased phosphorus concentration in the Bohai Sea led to decreased dominance of algae susceptible to phosphorus limitation and increased dominance of algae susceptible to nitrogen limitation, which was not beneficial for the growth of high-trophic-level fishery resources [58,59]. We observed that the functional traits of high-trophic-level fish species in the study area were being gradually lost, which will weaken the downward control effect of the population. This may be one of the reasons for the shift toward fish communities with lower trophic levels in the Huanghe River Estuary and adjacent seas. This study further revealed that high pH gradients in the research area suppressed the turnover of functional traits in these fish communities, while promoting the formation of nestedness patterns. The formation of pH gradient may be closely related to the flow of the Huanghe River into the sea and the implementation of a water and sediment regulation project.
Apart from environmental factors, within this small-scale research area, an increase in the geographical distance between communities negatively impacted the turnover of fish functional traits. The geographical distance between communities and distance between communities and estuaries did not have an apparent impact on functional alpha-diversity. Zhang et al. [57] found that a vertical gradient distribution of river fishes had opposite beta- and alpha-diversity patterns, which was consistent with the findings of this study. These differences occur because alpha-diversity describes the current status of the ecological space occupied by species within a community, whereas beta-diversity is used to quantify the extent or differentiation of functional differences between communities. Additionally, different species exhibit different adaptability along one or several environmental gradients. This is reflected in differences in functional traits or abundance. Therefore, these two types of diversity may exhibit different spatial patterns along the same spatial gradient [60].

5. Conclusions

A total of 37 fish species were caught by bottom trawl surveys in the Huanghe River estuary seas during the research period. The number of species was highest for Perciformes, and the abundance was highest for Gobiidae. Common dominant species were Chaeturichthys stigmatias and Cynoglossus joyeri. The average FRic was 0.223 ± 0.169. The dominant traits of the fish communities were: benthivorous feeding habits, small and front-facing mouths, high trophic level, demersal, anguilliform, low growth coefficient, medium resilience, low vulnerability, and adapted to warm temperate conditions. The dominant traits related to migration and ecological type of fish eggs varied by year, and fish abundance was the main factor that affected the dominant traits. Average functional beta-diversity was 0.661 ± 0.180, and it was primarily affected by turnover. Ammonia nitrogen content, total phosphorus content, and pH were the main environmental factors that affected fish functional diversity. The N/P ratio had an upward control effect on fish functional diversity. Within a small-scale research scope, high pH gradients and distant geographical distances can inhibit trait turnover in fish communities.

Author Contributions

S.L., Y.H. and H.M.: methodology, formal analysis and writing—original draft preparation. F.L., Y.L. and W.C.: supervision and project administration. X.Z. and X.W.: data curation. G.C. and T.W.: software and data analysis. All authors have read and agreed to the published version of the manuscript.

Funding

This research was funded by the Shandong Provincial Natural Science Foundation (General program, No. ZR2023MD039), the Science and Technology Innovation Program of the Laoshan Laboratory (No. LSKJ202203803), the Open Fund of Observation and Research Station of Bohai Strait Eco-Corridor (No. BH202301), and the Special Project of Yellow River Water Resources Protection Institute (No. KYY- KYZX-2022-02).

Institutional Review Board Statement

Not applicable.

Data Availability Statement

The datasets that support the findings of this study are available from the corresponding author upon reasonable request.

Conflicts of Interest

The authors declare no conflicts of interest.

Appendix A

Table A1. List of fish species in the Huanghe River Estuary and adjacent seas in 2022 and 2023 and their functional traits.
Family Species Feeding habit Mouth position Mouth relative size Trophic Level Habitat Migration type Body shape Maximum body length (cm) Body length at first sexual maturity (cm) Age at first sexual maturity (a) Generation time (a) Ecological type of eggs Growth coefficient (k) Vulnerability Resilience Thermo-phily
Apogonidae Apogon lineatus B Front CB 3.7 De OM 2 9.00 6.8 0.8 1.0 PAE 0.50 12 Hr WW
Callionymidae Callionymus beniteguri B Front S 3.3 De ST 3 13.96 - - - PE 0.52 13 Hr T
Clupeidae Konosirus punctatus H Front CS 2.9 Pe OM 2 32.00 18.1 2.9 3.2 PE 0.65 36 Hr T
Sardinella zunasi P Front CS 3.4 Pe OM 2 18.00 11.0 1.0 2.2 PE 0.50 22 Hr T
Cottidae Trachidermus fasciatus B-N Front B 3.0 De OM 10 17.00 10.9 1.0 - DAE - 10 Lr CT
Cynoglossidae Cynoglossus joyeri B Lower S 4.3 De CM 5 24.00 17.2 3.8 4.1 PE 0.20 40 Mr T
Cynoglossus semilaevis B Lower S 3.7 De CM 5 61.10 34.6 2.8 3.8 PE 0.26 44 Mr T
Engraulidae Engraulis japonicus P Lower B 3.6 Pe OM 2 18.00 10.0 1.0 4.0 PE 0.79 10 Hr T
Setipinna taty P Lower B 3.6 Pe OM 2 22.20 12.4 1.0 - PE 0.57 17 Hr WW
Thrissa kammalensis P Lower B 3.4 Pe OM 2 18.00 8.9 2.4 3.3 PE 0.56 32 Mr T
Thrissa mystax P Lower B 3.6 Pe OM 2 19.00 13.0 1.0 - PE 0.56 11 Hr WW
Gobiidae Acanthogobius ommaturus B Front CB 3.4 De ST 8 50.00 12.1 1.0 1.0 AE 0.20 50 Lr T
Amblychaeturichthys hexanema B Front S 3.4 De ST 4 17.40 11.4 1.9 2.5 AE 0.70 10 Mr T
Amoya pflaumi B Front CS 3.1 De ST 8 12.00 8.9 1.0 1.4 AE 0.44 10 Hr WW
Chaeturichthys stigmatias B Front S 3.8 De ST 4 28.20 11.8 2.7 2.9 AE 0.45 18 Mr T
Ctenotrypauchen chinensis B Front S 3.8 De ST 2 19.20 - - - AE - 13 Mr T
Myersina filifer B Front CS 3.4 De ST 2 13.20 - - - AE - 10 Hr WW
Odontamblyopus lacepedii B Front CB 3.9 De ST 4 33.40 20.3 3.7 4.2 AE 0.19 31 Mr WW
Tridentiger barbatus B Front S 3.5 De ST 8 10.40 7.3 1.5 2.0 AE 0.56 14 Hr T
Hexagrammidae Hexagrammos otakii P-B Front S 3.8 De OM 2 57.00 11.6 2.0 2.9 AE 0.36 34 Mr CT
Mugilidae Liza haematocheila P Lower S 2.5 De ST 11 80.00 48.0 2.5 8.1 PE 0.31 58 Mr T
Paralichthyidae Paralichthys olivaceus N Front M 4.5 De CM 5 103.00 40.0 2.0 7.3 PE 0.24 60 Mr T
Pholididae Enedrias fangi P-B Front M 3.2 De CM 9 16.80 11.2 1.1 1.5 O 0.61 10 Hr CT
Platycephalidae Platycephalus indicus B-N Front M 3.6 De OM 3 100.00 45.7 1.8 2.5 PE 0.30 35 Mr WW
Pleuronectidae Kareius bicoloratus B Front S 3.7 De CM 5 50.00 31.6 3.7 4.8 PE 0.18 46 Lr CT
Sciaenidae Collichthys niveatus P-B Front CS 3.6 De CM 2 17.00 8.8 1.0 4.0 PE 0.42 17 Hr T
Johnius belengerii B Lower CS 3.3 De OM 2 30.00 12.5 1.3 1.5 PE 0.53 20 Hr WW
Larimichthys polyactis B-N Front M 3.7 De OM 2 40.00 18.1 1.0 3.0 PE 0.45 27 Mr T
Pennahia argentata B Lower M 4.1 De OM 2 40.00 11.1 1.6 2.0 PE 0.42 34 Hr T
Scombridae Scomberomorus niphonius N Front CB 4.8 Pe DM 1 113.00 37.0 1.0 8.5 PE 0.53 34 Mr T
Serranidae Lateolabrax maculatus N Upper M 4.7 De CM 2 102.00 52.7 2.0 5.2 PE 0.42 52 Mr T
Sillaginidae Sillago sihama B Front S 3.4 De OM 6 31.00 16.7 1.4 1.5 PE 0.80 24 Hr WW
Stromateidae Pampus argenteus P Front S 3.3 Pe DM 2 60.00 25.3 1.3 1.5 PE 0.56 31 Mr WW
Syngnathidae Syngnathus acus P Front S 3.3 De ST 7 50.00 16.3 - - O - 40 Mr T
Tetraodontidae Takifugu niphobles P-B Front S 3.4 De OM 6 20.00 11.0 1.0 - DAE 0.31 44 Mr CT
Takifugu pseudommus P-B Front S 3.4 De OM 6 35.00 - - - DAE - 33 Mr T
Trichiuridae Eupleurogrammus muticus B Front CB 4.1 De OM 9 87.00 - - - PE - 48 Hr WW
H: Herbivorous; P: Planktivorous; P–B: Planktivorous and benthivorous; B: Benthivorous; B–N: Benthivorous and nektivorous; N: Nektivorous; S: Small; CS: Comparatively small; M: Medium; CB: Comparatively big; B: Big; De: Demersal; Pe: Pelagic; ST: Settlement type; CM: Coastal migratory; OM: Offshore migratory; DM: Distantly migrating; 1) Fusiform; 2) Compressiform; 3) Depressiform; 4) Anguilliform; 5) Asymmetry; 6) Sub-cylinder; 7) Slightness; 8) Cylindrical anterior part and compressed posterior part; 9) Band shape; 10) Depressed anterior part and compressed posterior part; 11) Sub-cylindrical anterior part and compressed posterior part; PE: Pelagic eggs; AE: Adhesive eggs; DAE: Demersal adhesive eggs; PAE: Pelagic adhesive eggs; O: Ovoviviparous; Lr: Low resilience; Mr: Medium resilience; Hr: High resilience; CT: Cold temperate; T: Warm temperate; WW: Warm water.

Appendix B

Figure B1. Species accumulation curves in the Huanghe River Estuary and adjacent seas.
Preprints 106069 g0b1

Appendix C

Figure C1. Correlation of environmental factors based on a collinearity test.
Preprints 106069 g0c1

References

  1. Niu, K.C.; Liu, Y.N.; Shen, Z.H.; He, F.L.; Fang, J.Y. Community assembly: The relative importance of neutral theory and niche theory. Biodiversity Science 2009, 17, 579–593. [Google Scholar] [CrossRef]
  2. Chen, S.B.; Ouyang, Z.Y.; Xu, W.H.; Xiao, Y. A review of beta diversity studies. Biodiversity Science 2010, 18, 323–335. [Google Scholar] [CrossRef]
  3. Violle, C.; Reich, P.B.; Pacala, S.W.; Enquist, B.J.; Kattge, J. The emergence and promise of functional biogeography. Proceedings of the National Academy of Sciences of the United States of America 2014, 111, 13690–13696. [Google Scholar] [CrossRef] [PubMed]
  4. Whittaker, R.H. Vegetation of the Siskiyou Mountains,Oregon and California. Ecological Monographs 1960, 20, 2799–338. [Google Scholar] [CrossRef]
  5. Whittaker, R.H. Evolution and measurement of species diversity. Taxon 1972, 21, 213–251. [Google Scholar] [CrossRef]
  6. Socolar, J.B.; Gilroy, J.J.; Kunin, W.E.; Edwards, D.P. How should beta-diversity inform biodiversity conservation? Trends in Ecology & Evolution 2016, 31, 67–80. [Google Scholar] [CrossRef] [PubMed]
  7. Si, X.F.; Zhao, Y.H.; Chen, C.W.; Ren, P.; Zeng, D.; Wu, L.B.; Ding, P. Beta-diversity partitioning: Methods, applications and perspectives. Biodiversity Science 2017, 25, 464–480. [Google Scholar] [CrossRef]
  8. Laureto, L.M.O.; Cianciaruso, M.V.; Samia, D.S.M. Functional diversity: An overview of its history and applicability. Natureza & Conservacao 2015, 13, 112–116. [Google Scholar] [CrossRef]
  9. Swenson, N.G.; Erickson, D.L.; Mi, X.C.; Bourg, N.A.; Forero-Montaña, J.; Ge, X.J.; Howe, R.; Lake, J.K.; Liu, X.J.; Ma, K.P.; Pei, N.C.; Thompson, J.; Uriarte, M.; Wolf, A.; Wright, S.J.; Ye, W.H.; Zhang, J.L.; Zimmerman, J.K.; Kress, W.J. Phylogenetic and functional alpha and beta diversity in temperate and tropical tree communities. Ecology 2012, 93, 112–125. [Google Scholar] [CrossRef]
  10. Lavorel, S.; Grigulis, K.; Lamarque, P.; Colace, M.P.; Garden, D.; Girel, J.; Pellet, G.; Douzet, R. Using plant functional traits to understand the landscape distribution of multiple ecosystem services. Journal of Ecology 2011, 99, 135–147. [Google Scholar] [CrossRef]
  11. Higgins, S.N.; Zanden, M.J.V. What a difference a species makes: a metaanalysis of dreissenid mussel impacts on freshwater ecosystems. Ecological Monographs 2010, 80, 179–196. [Google Scholar] [CrossRef]
  12. Villéger, S.; Grenouillet, G.; Brosse, S. Decomposing functional β-diversity reveals that low functional β-diversity is driven by low functional turnover in European fish assemblages. Global Ecology & Biogeography 2013, 22, 671–681. [Google Scholar] [CrossRef]
  13. Mason, N.W.H.; Mouillot, D.; Lee, W.G.; Wilson, J.B.; Setl, H. Functional richness, functional evenness and functional divergence: The primary components of functional diversity. Oikos 2005, 111, 112–118. [Google Scholar] [CrossRef]
  14. Zhang, X.Z.; Wang, J.; Xu, B.D.; Zhang, C.L.; Xue, Y.; Ren, Y.P. Spatio-temporal variations of functional diversity of fish communities in Haizhou Bay. Chinese Journal of Applied Ecology 2019, 30, 3233–3244. [Google Scholar] [CrossRef]
  15. He, Q.; Liu, S.D.; Tang, Y.L.; Dong, X.Q.; Zhao, W.; Feng, J.; Yu, M.J. Species and functional diversity of fish communities in artificial reef area of Pipa Island Sea, Shandong. Journal of Fishery Sciences of China 2023, 30, 1479–1495. [Google Scholar] [CrossRef]
  16. Zhang, Y.X.; Shan, X.J.; Bian, X.D.; Wei, C.; Zhang, W.R.; Cui, P.D. Early life resources community structure and functional diversity to the Osteichthyes in the waters adjacent to the Changdao Islands. Progress in Fishery Sciences 2023, 44, 1–19. [Google Scholar] [CrossRef]
  17. Swenson, N.G.; Anglada-Cordero, P.; Barone, J.A. Deterministic tropical tree community turnover: Evidence from patterns of functional beta diversity along an elevational gradient. Proceedings of the Royal Society B: Biological Sciences 2011, 278, 877–884. [Google Scholar] [CrossRef]
  18. Si, X.F.; Baselga, A.; Leprieur, F.; Song, X.; Ding, P. Selective extinction drives taxonomic and functional alpha and beta diversities in island bird assemblages. Journal of Animal Ecology 2016, 85, 409–418. [Google Scholar] [CrossRef]
  19. Harrison, S.; Ross, S.J.; Lawton, J.H. Beta diversity on geographic gradients in Britain. Journal of Animal Ecology 1992, 61, 151–158. [Google Scholar] [CrossRef]
  20. Williams, P.H. Mapping variations in the strength and breadth of biogeographic transition zones using species turnover. Proceedings of the Royal Society B: Biological Sciences 1996, 263, 579–588. [Google Scholar] [CrossRef]
  21. Lennon, J.J.; Koleff, P.; Greenwood, J.J.D.; Gaston, K.J. The geographical structure of British bird distributions: Diversity, spatial turnover and scale. Journal of Animal Ecology 2001, 70, 966–979. [Google Scholar] [CrossRef]
  22. Greve, M.; Gremmen, N.J.M.; Gaston, K.J.; Chown, S.L. Nestedness of Southern Ocean island biotas: Ecological perspectives on a biogeographical conundrum. Journal of Biogeography 2005, 32, 155–168. [Google Scholar] [CrossRef]
  23. Wang, Y.P.; Bao, Y.X.; Yu, M.J.; Xu, G.F.; Ding, P. Nestedness for different reasons: The distributions of birds, lizards and small mammals on Islands of an inundated lake. Diversity and Distributions 2010, 16, 862–873. [Google Scholar] [CrossRef]
  24. Baselga, A. Partitioning the turnover and nestedness components of beta diversity. Global Ecology and Biogeography 2010, 19, 134–143. [Google Scholar] [CrossRef]
  25. Baselga, A. The relationship between species replacement, dissimilarity derived from nestedness, and nestedness. Global Ecology and Biogeography 2012, 21, 1223–1232. [Google Scholar] [CrossRef]
  26. Podani, J.; Ricotta, C.; Schmera, D. A general framework for analyzing beta diversity, nestedness and related community-level phenomena based on abundance data. Ecological Complexity 2013, 15, 52–61. [Google Scholar] [CrossRef]
  27. Li, X.T.; Xu, B.D.; Xue, Y.; Ren, Y.P.; Zhang, C.L. Variation in the β diversity of fish species in Haizhou Bay. Journal of Fishery Sciences of China 2021, 28, 451–459. [Google Scholar] [CrossRef]
  28. Li, X.T.; Xu, B.D.; Xue, Y.; Ren, Y.P.; Zhang, C.L. β diversity and its components of the fish community in the Haizhou Bay during autumn and the relationships with environmental factors. Haiyang Xuebao 2022, 44, 46–56. [Google Scholar] [CrossRef]
  29. Zhang, X.M; Su, H.X.; Li, S.W.; Yang, Y.Y.; Wang, T.T.; Xu, B.Q.; Li, F.; Wang, X.X. The Driving Factors of β-diversity and its Components Spatial Variation of Fish Community in Coastal Area of Yantai and Weihai. Oceanologia et Limnologia Sinica 2023, 54, 1125–1133. [Google Scholar] [CrossRef]
  30. Wang, J.Y.; Li, H.Y. Temporal and spatial differentiation characteristics of economy in the country Yellow River Basin and its influencing factors. Yellow River 2022, 44, 1–6. [Google Scholar] [CrossRef]
  31. Zhao, J.J.; Liu, Y.; Zhu, Y.K.; Qin, S.L.; Wang, Y.H.; Miao, C.H. Spatiotemporal differentiation and influencing factors of the coupling and coordinated development of new urbanization and ecological environment in the Yellow River Basin. Resources Science 2020, 42, 159–171. [Google Scholar] [CrossRef]
  32. Zhang, M.L.; Yu, G.L.; Wang, F.; Li, B.; Han, H.Z.; Qi, Z.H.; Wang, T.T. Terrestrial dissolved organic carbon consumption by heterotrophic bacterioplankton in the huanghe river estuary during water and sediment regulation. Journal of Oceanology and Limnology 2019, 37, 1062–1070. [Google Scholar] [CrossRef]
  33. Mu, B.; Cui, T.W.; Qin, P.; Gong, J.L.; Xiao, Y.F.; Zheng, R.E. Remote sensing retrieval and temporal-spatial distribution characteristics of particulate organic carbon concentration in seawater near Yellow River estuary. Acta Optica Sinica 2017, 37, 33–43. [Google Scholar] [CrossRef]
  34. Cui, B.S.; Hua, Y.Y.; Wang, C.F.; Liao, X.L.; Tan, X.J.; Tao, W.D. Estimation of ecological water requirements based on habitat response to water level in huanghe river delta, China. Chinese Geographical Science 2010, 20, 318–329. [Google Scholar] [CrossRef]
  35. Gu, Y.Z.; Xu, C.L.; Zhang, Z.H.; Bi, N.S.; Zhao, L.L.; Liu, Y.F.; Zhou, B. Response of fresh water from Yellow River to marine ecological regulation. Yellow River 2019, 41, 68–75. [Google Scholar] [CrossRef]
  36. Zhang, D. Longitudinal pattern and formation mechanism.in α and β diversity of taxonomic and functional of stream fish assemblages in the Xin`an River. Doctor Dissertation, Anhui Normal University, Wuhu, 2018. [Google Scholar]
  37. FishBase. Available online: https://fishbase.se/search.php (accessed on 15 February 2024).
  38. Zhang, J.X.; Wang, J.; Niu, M.X.; Zuo, T.; Chang, W.; Chen, R.S. Biological characteristics of Liza haematocheila in the shallow coastal waters of the Yellow River estuary. Progress in Fishery Sciences 2023, 44, 20–29. [Google Scholar] [CrossRef]
  39. Niu, M.X.; Zuo, T.; Wang, J.; Chen, R.S.; Zhang, J.X. Egg and larval distribution of Liza haematocheila and their relationship with environmental factors in the coastal waters of the Yellow River Estuary. Journal of Fishery Sciences of China 2022, 29, 377–387. [Google Scholar] [CrossRef]
  40. Bi, X.X. Studies on the Morphology and Genetics of Trachidermus fasciatus Populations. Doctor Dissertation, Ocean University of China, Qingdao, 2018. [Google Scholar]
  41. Fan, H.Y.; Ji, Y.P.; Zhang, S.H.; Yuan, C.T.; Gao, T.X. Research of Fishery Biology of the Neritic Fish Synechogobius ommaturus in the Area of the Huanghe Delta. Periodical of Ocean University of China 2005, 35, 733–736. [Google Scholar] [CrossRef]
  42. Zhang, L.C. Study on the community structure and fishery biological characteristics of Gobioidei in Laizhou Bay. Master Dissertation, Shanghai Ocean University, Shanghai, 2019. [Google Scholar]
  43. Mu, X.X.; Zhang, C.; Zhang, C.L.; Xu, B.D.; Xue, Y.; Tian, Y.J.; Ren, Y.P. The fisheries biology of the spawning stock of Scomberomorus niphonius in the Bohai and Yellow Seas. Journal of Fishery Sciences of China 2018, 25, 1308–71316. [Google Scholar] [CrossRef]
  44. Qu, J.Y.; Yang, G.M.M.; Fang, Z.; Chen, X.J. A Review of Research Advancement on Fisheries Biology of Japanese Mackerel Scomberomorus niphonius. Fisheries Science 2021, 40, 643–650. [Google Scholar] [CrossRef]
  45. Xu, S.Y. Study on Morphology and Genetics of Setipinna tenuifilis. Master Dissertation, Ocean University of China, Qingdao, 2014. [Google Scholar]
  46. Han, Q.P.; Wu, Q.; Shan, X.J.; Jin, X.S.; Su, C.C. Stock assessment of Setipinna taty in Shandong inshore waters based on lengthbased model and ensemble model. Journal of Fisheries of China 2024, 1–11. [Google Scholar]
  47. Villeger, S.; Mason, N.W.H.; Mouillot, D. New multidimensional functional diversity indices for a multifaceted framework in functional ecology. Ecology 2008, 89, 2290–2301. [Google Scholar] [CrossRef]
  48. Cornwell, W.K.; Schwilk, D.W.; Ackerly, D.D. A trait-based test for habitat filtering: Convex hull volume. Ecology 2006, 87, 1465–11471. [Google Scholar] [CrossRef] [PubMed]
  49. Shuai, F.M.; Li, X.H.; Chen, F.C.; Li, Y.F.; Yang, J.P.; Li, J.; Wu, Z. Functional diversity of freshwater fishes and methods of measurement. Acta Ecologica Sinica 2017, 37, 5228–5237. [Google Scholar] [CrossRef]
  50. Dong, J.Y.; Sun, X.; Zhan, Q.P.; Zhang, Y.Y.; Zhang, X.M. Patterns and drivers of beta diversity of subtidal macrobenthos community on the eastern coast of Laizhou Bay. Biodiversity Science 2022, 30, 1–10. [Google Scholar] [CrossRef]
  51. Poff, N.L.; Allan, J.D. Functional organization of stream fish assemblages in relation to hydrological variability. Ecology 1995, 76, 606–627. [Google Scholar] [CrossRef]
  52. Langerhans, R.B.; Gifford, M.E.; Joseph, E.O. Ecological speciation in Gambusia fishes. Evolution 2007, 61, 2056–2074. [Google Scholar] [CrossRef]
  53. Yin, M.C. Fish Ecology; China Agriculture Press: Beijing, 1995; pp. 54–96. [Google Scholar]
  54. Taylor, C.M.; Warren, M.L. Dynamics in species composition of stream fish assemblage: environmental variability and nested subsets. Ecology 2001, 82, 2320–2330. [Google Scholar] [CrossRef]
  55. McGarvey, D.J.; Hughes, R.M. Longitudinal zonation of Pacific Northwest (USA) fish assemblages and the species–discharge relationship. Copeia 2008, 2008, 311–321. [Google Scholar] [CrossRef]
  56. Oikonomou, A.; Stefanidis, K. α- and β-diversity patterns of macrophytes and freshwater fishes are driven by different factors and processes in lakes of the unexplored Southern Balkan biodiversity hotspot. Water 2020, 12, 1–16. [Google Scholar] [CrossRef]
  57. Lansac-Tôha, F.M.; Heino, J.; Quirino, B.A.; Moresco, G.A.; Peláez, O.; Meira, B.R.; Rodrigues, L.C.; Jati, S.; Lansac-Tha, F.A.; Velho, L.F.M. Differently dispersing organism groups show contrasting beta diversity patterns in a dammed subtropical river basin. Science of the Total Environment 2019, 691, 1271–1281. [Google Scholar] [CrossRef] [PubMed]
  58. Zhang, J.J.; Li, F.; Lv, Q.M.; Wang, Y.B.; Yu, J.B.; Gao, Y.J.; Ren, Z.H.; Zhang, X.M.; Lv, Z.B. Impact of the water–sediment regulation scheme on the phytoplankton community in the Yellow River estuary. Journal of cleaner production 2021, 294, 40–57. [Google Scholar] [CrossRef]
  59. Xu, S.S. Decline mechanisms of fishery resources in the Bohai Sea under anthropogenic activities. Doctor Dissertation, The Institute of Oceanology, Chinese Academy of Sciences, Qingdao, 2011. [Google Scholar]
  60. Tylianakis, J.M.; Klein, A.M.; Tscharntke, T. Spatiotemporal variation in the diversity of Hymenoptera across a tropical habitat gradient. Ecology 2008, 86, 3296–3302. [Google Scholar] [CrossRef]
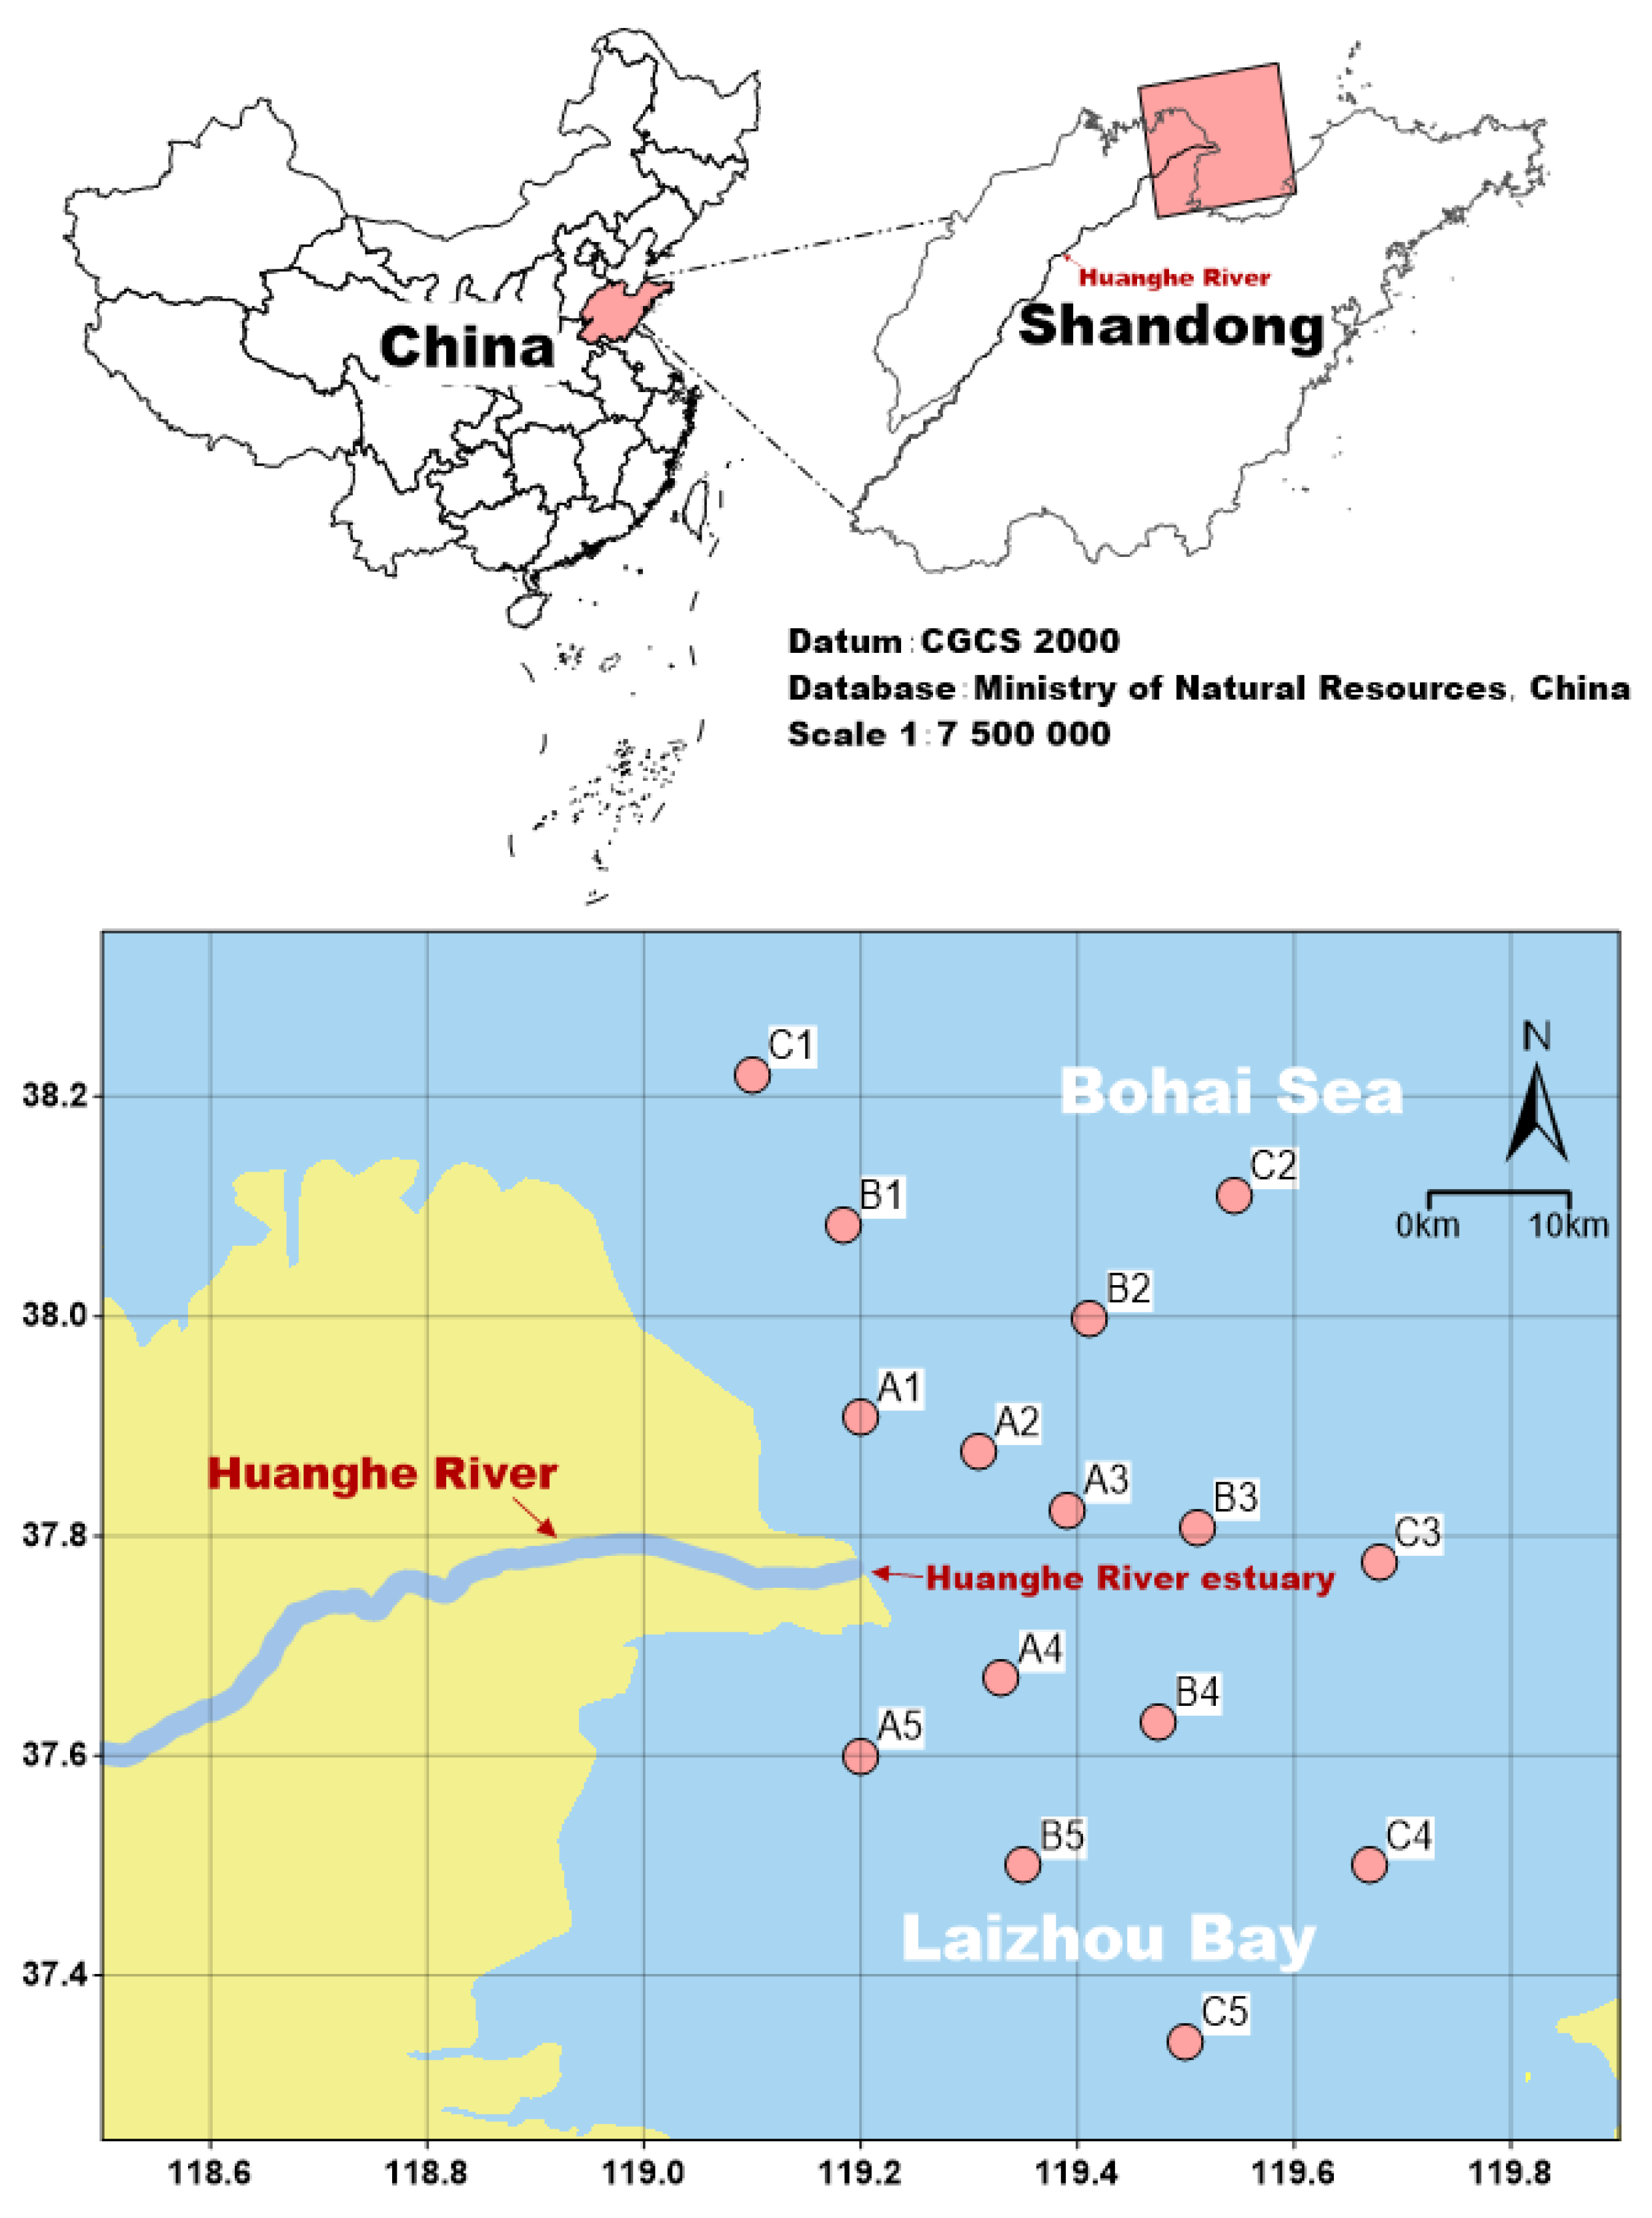
Figure 1. Map showing the study area and locations of the fish sampling stations in the Huanghe River Estuary and adjacent seas in China.
Preprints 106069 g001
Figure 2. Stacking plots of fish species and dominant species in the Huanghe River estuary seas in 2022 (a) and 2023 (b).
Preprints 106069 g002
Figure 3. Functional alpha-diversity of fishes in the Huanghe River Estuary and adjacent seas in 2022 and 2023. Asterisks denote a significant difference (*P<0.05); ns indicates no significant difference.
Preprints 106069 g003
Figure 4. Fish community CWM and variation in the Huanghe River Estuary and adjacent seas. Asterisks denote significant difference (*P<0.05) or highly significant difference (**P<0.01), and ns indicates no significant difference.
Preprints 106069 g004
Figure 5. Functional beta-diversity (Fβsor) and its turnover (Fβsim) and nestedness (Fβsne) components. (a) 2022; (b) 2023. Each red dot in the figure represents the data of one sample pair. The size of the red dot represents the Fβsor value of sample pair. The blue dots represent the mean values of the three components of functional beta-diversity.
Preprints 106069 g005
Figure 6. VPA of the functional diversity explained by environmental factors and geographic distance variables.
Preprints 106069 g006
Table 1. Classification of functional traits and types of fishes in the Huanghe River Estuary and adjacent seas.
Classification of function Type of functional traits Variable type Functional trait
Food acquisition Feeding habits Ordered categorical variables Herbivorous (H), Planktivorous (P), Planktivorous and Benthivorous (P–B), Benthivorous (B), Benthivorous and Nektivorous (B–N), Nektivorous (N)
Mouth position Ordered categorical variables Lower, Front, Upper
Relative mouth size Ordered categorical variables Small (S), Comparatively small (CS), Medium (M), Comparatively big (CB), Big (B)
Trophic level Continuous variable 2.5~4.8
Locomotion Habitat Unordered categorical variable Demersal (De), Pelagic (Pe)
Migration type Ordered categorical variables Settlement type (ST), Coastal migratory (CM), Offshore migratory (OM), Distantly migrating (DM)
Body shape Unordered categorical variable Fusiform (1), Compressiform (2), Depressiform (3), Anguilliform (4), Asymmetry (5), Sub-cylinder (6), Slightness (7), Cylindrical anterior part and compressed posterior part (8), Band shape (9), Depressed anterior part and compressed posterior part (10), Sub-cylindrical anterior part and compressed posterior part (11)
Maximum body length (cm) Continuous variable 9.0~113.0
Reproduction Body length at first sexual maturity (cm) Continuous variable 6.8~52.7
Age at first sexual maturity (a) Continuous variable 0.8~3.8
Generation time (a) Continuous variable 1.0~8.5
Ecological type of eggs Unordered categorical variable Pelagic eggs (PE), Adhesive eggs (AE), Demersal adhesive eggs (DAE), Pelagic adhesive eggs (PAE), Ovoviviparous (O)
Population dynamics Growth coefficient (k) Continuous variable 0.18~0.80
Resilience Ordered categorical variables Low resilience (Lr), Medium resilience (Mr), High resilience (Hr)
Vulnerability Continuous variable 10~60
Ecological adaptation Thermophily Unordered categorical variable Cold temperate (CT), Warm temperate (T), Warm water (WW)
Table 2. Normality test and T-test results for functional beta-diversity in 2022 and 2023.
Year Normality test T-test
Kolmogorov-Smirnov Z P (two-tailed test) T-value df P (two-tailed test)
2022 0.781 0.575 0.009 104 0.993
2023 0.895 0.400 -0.016 104 0.987
2022-2023 - - 4.894 104 <0.001***
Asterisks denote a highly significant difference (***P<0.001).
Table 3. MRM results showing relationships of functional alpha- and beta-diversity indices and components with environmental factors.
Diversity index Fβsor NH4-N TP pH Geographic distance
Coefficient P Coefficient P Coefficient P Coefficient P Coefficient P
FRic -0.1157 0.0001*** -0.1550 0.0371* 0.7977 0.0249* - - - -
FEve - - -0.0400 0.0161* - - - - - -
FDiv - - - - - - - - - -
Fβsor - - 0.0317 0.0376* - - - - - -
Fβsim - - - - - - -0.0393 0.0066** -0.0510 0.046*
Fβsne - - - - 0.1134 0.0318* 0.0301 0.0379* - -
Asterisks denote significant differences (*P<0.05) and highly significant differences (**P<0.01, ***P<0.001).
Disclaimer/Publisher’s Note: The statements, opinions and data contained in all publications are solely those of the individual author(s) and contributor(s) and not of MDPI and/or the editor(s). MDPI and/or the editor(s) disclaim responsibility for any injury to people or property resulting from any ideas, methods, instructions or products referred to in the content.
Copyright: This open access article is published under a Creative Commons CC BY 4.0 license, which permit the free download, distribution, and reuse, provided that the author and preprint are cited in any reuse.
Prerpints.org logo

Preprints.org is a free preprint server supported by MDPI in Basel, Switzerland.

Subscribe

© 2024 MDPI (Basel, Switzerland) unless otherwise stated