1. Introduction
More than 80% of world trade is carried with sea-going vessels [
1]. Waterborne transport is one of the anthropogenic pressures that has environmental impact on aquatic ecosystems [
2]. The Baltic Sea with its area of 370 000 km2, is in a global perspective a small area, but is also one of the world’s largest reservoirs of brackish water which makes it ecologically unique [
3]. The Baltic Sea is also one of the busiest maritime regions globally, with up to 15% of the world’s cargo traffic being handled within its waters. At any given time, approximately 2000 ships are present in the Baltic marine area, with a monthly passage of roughly 3500–5500 vessels through its waters [
4].
The Baltic Sea has all the symptoms of nutrient overload [
5]. Since it is connected with the Atlantic Ocean only via the narrow strait of Denmark, complete water exchange takes around 30 years [
6]. The nine countries that border the Baltic Sea have worked hard to reduce nutrient flows through the Baltic Marine Environmental Protection Commission in Helsinki — also known as the Helsinki Commission (HELCOM) — and, since 2008, through the European Union’s Marine Strategy Framework Directive [
3].
In open sea areas - like the Baltic Sea - eutrophication caused by the extensive input of nutrients leads to excessive algae growth and oxygen depletion [
6]. About 75% of the nitrogen load and at least 95% of the phosphorus load enter the Baltic Sea via rivers or as direct waterborne discharges. The main contributor to the nutrient load is agriculture. Other sources are point sources in the upper parts of rivers, municipal sources and wastewater treatment plants, industry and transport [
7]. About 25% of the nitrogen load comes as atmospheric deposition. Eutrophication is today regarded as the most severe threat to the Baltic Sea [
3]. About 100 million tons of nitrogen and 4,5 million tons of phosphorus has entered the Baltic Sea since the 1850, more than half of it during the last fifty years [
8].
Recent modelling suggests that shipping contributes about 0.3% of the total phosphorus and between 1.25% and 3.3% of the total nitrogen input to the Baltic Sea [
9]. According to various studies [
2,
6,
10,
11,
12], potential sources of nitrogen and phosphorus discharges from shipping activities include loading and unloading of fertilizers, food waste, grey and black water, and possibly bilge and scrubber water and treated ballast water [
13]. Fertilizers are the main contributor to the nutrient input to the Baltic Sea from port and shipping activities [
14]. In 2020, ships’ black water discharges to the Baltic Sea were 0.98 million cubic meters, and input of sewage-based nitrogen was 364 tons. Greywater discharges were estimated at 3.4 million cubic meters. In particular, almost 75% of grey water discharges in European waters come from passenger ships [
11].
This study evaluates the contribution of cargo ships’ wastewaters to the nutrient load of the Baltic Sea and furnishes authorities with pertinent data for environmental regulatory deliberations. Specifically, the study examines the nutrient content of black (sewage) and grey water from cargo ships. Black water comprises human waste from toilets, while grey water encompasses wastewater from sinks, showers, and galleys, excluding sewage. While cruise, passenger, and ro-pax vessels are significant contributors to marine sewage, their discharges are subject to stringent regulations.
We have focused on a Finnish port of HaminaKotka with the aim of evaluating the quantity of nutrient loads of wastewaters from ships that visit this port. Our research questions are as follows
How much phosphorus and nitrogen (in kilograms) has been generated on board cargo ships (from black and grey water) during their voyages in the Baltic Sea to the designated port?
What proportion of the wastewater is discharged into the port?
What are the emission shares from different ship types?
How significant are these emissions in relation to all sources of nitrogen and phosphorus discharges in the area?
To find the answers to the questions, the quantities of nitrogen and phosphorus from black and grey waters were calculated and compared to the amount of waste discharged to port and to previous studies of nitrogen and phosphorus sources in the area. The study provides detailed data on different ship types and illustrates the variability within these categories, recognizing that different ship types - and even specific ships within a type - may contribute differently to nutrient loads. This approach improves the understanding of the contributions by ship type and the variability within and between these types.
This paper is structured as follows:
Section 1 provides an introduction, giving an overview of the study and outlining the research questions. It also presents the background based on a literature review.
Section 2 describes the methodology used to assess onboard nitrogen and phosphorus production. The results are presented in section 3.
Section 4 discusses these results and compares them with the results of other studies. Finally, section 5 presents the conclusions and recommendations for future action and research.
The case study port, HaminaKotka, is the biggest general cargo port in Finland based on cargo traffic volumes [
15]. There are several cargo types handled in the port: dry bulk, liquid bulk, roro, containers, general cargo, gas, project shipments and cruise traffic. The port serves as a hub in the Baltic Sea area and in Europe and there are regular shipping lines to all over the world [
16]. It is part of the Trans-European Transport Network TEN-T core network [
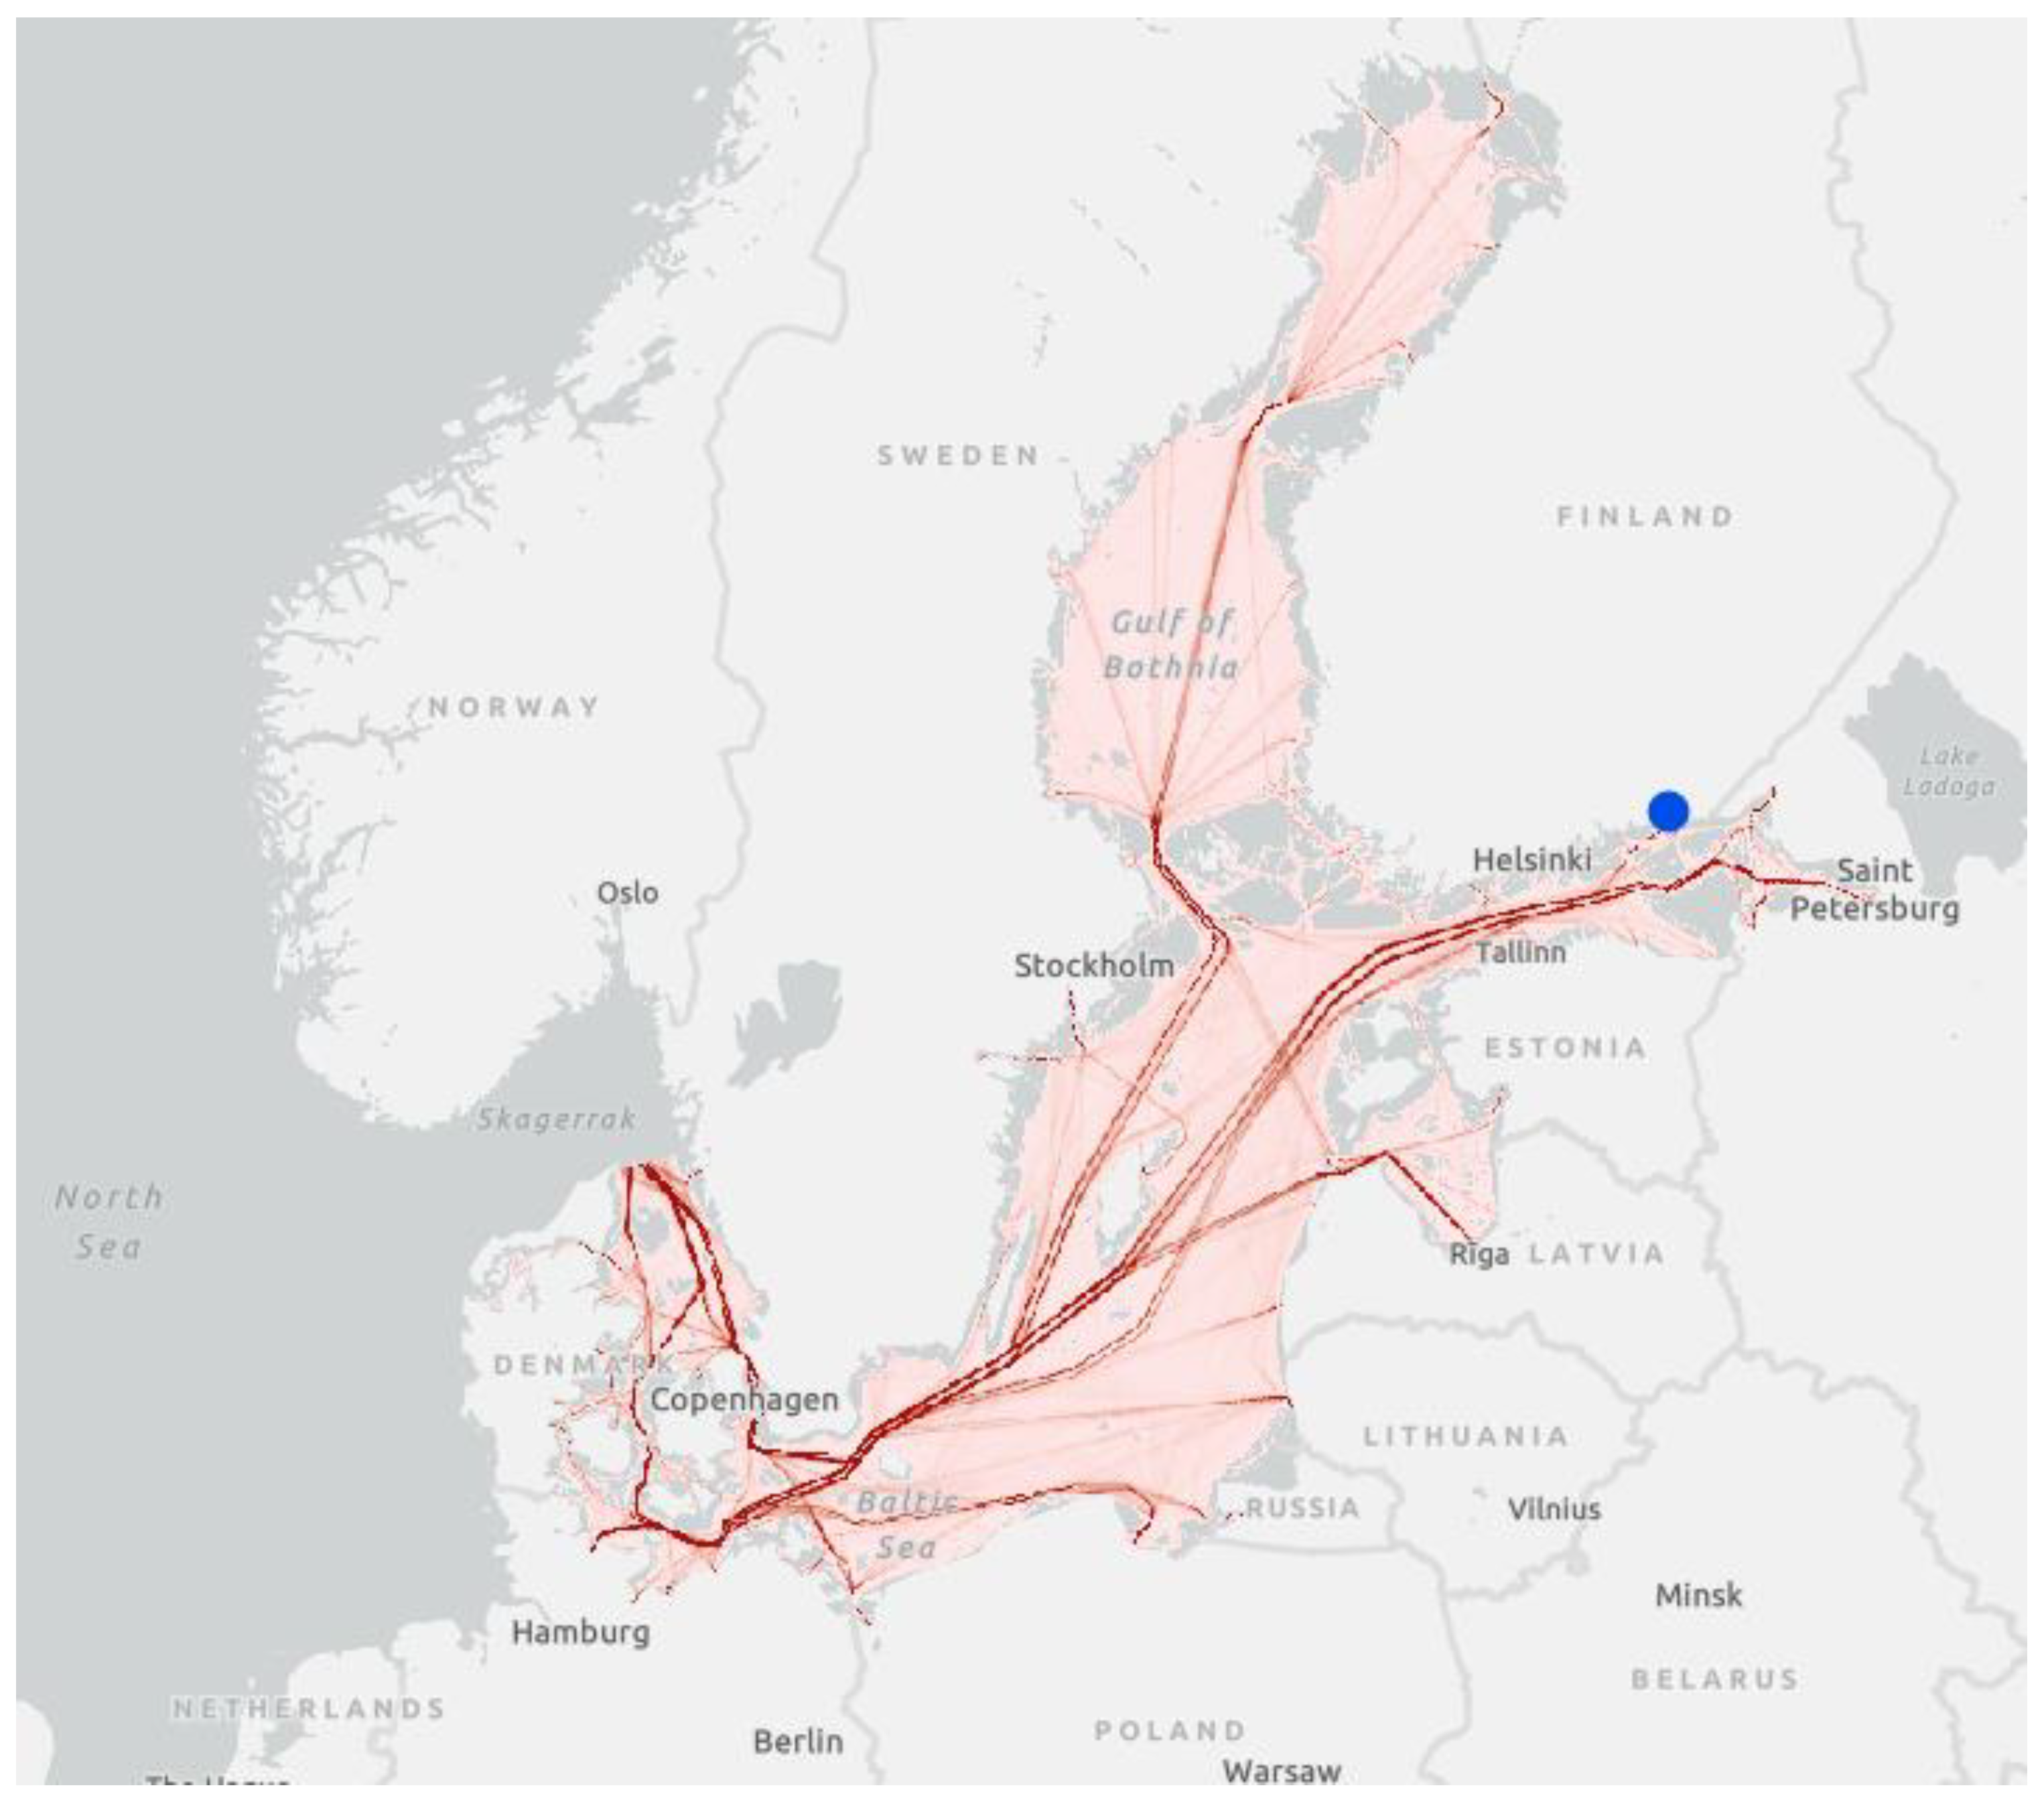
17]. The location of the port and main cargo traffic routes are shown in
Figure 1.
The port is located in the area of Hamina-Kotka-Pyhtää. In this coastal area the main contributors are the local rivers by 6593 tons of nitrogen and 207 tons of phosphorus in 2021. However, the water quality of the Kymijoki River has improved in recent years, with phosphorus concentrations in the river water now lower than those in seawater. The proportion of total loading to this coastal area from the Kymijoki River had increased slightly from the previous year, comprising approximately 73% of phosphorus and 88% of nitrogen in 2021. [
19,
20]
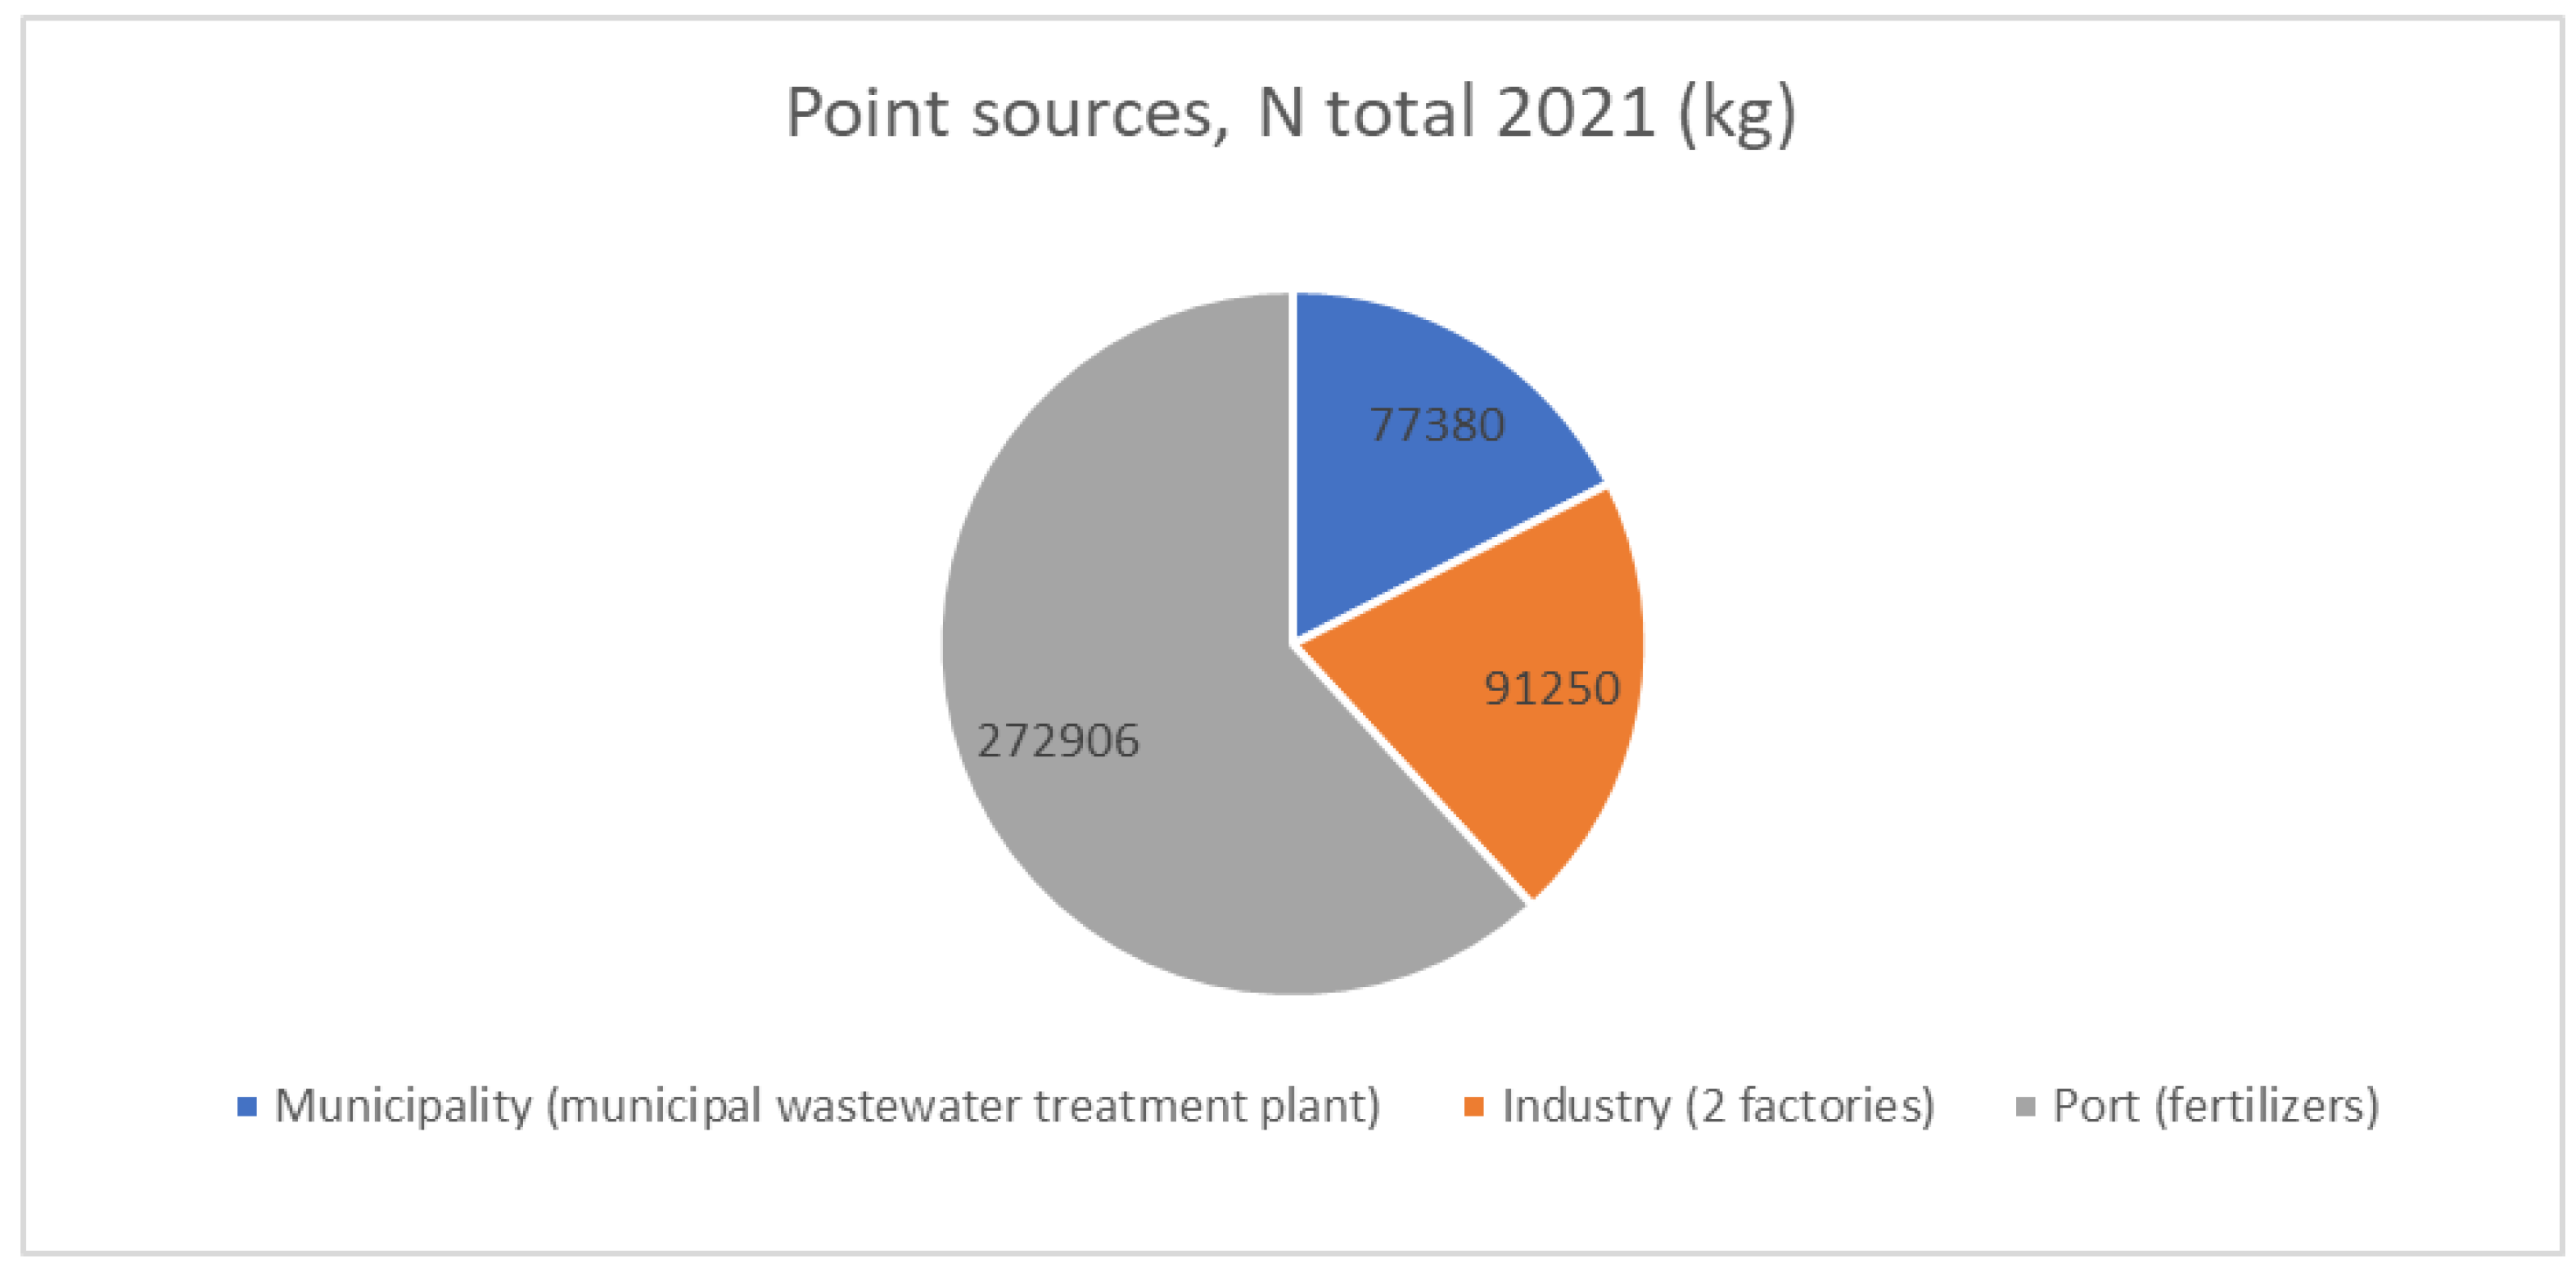
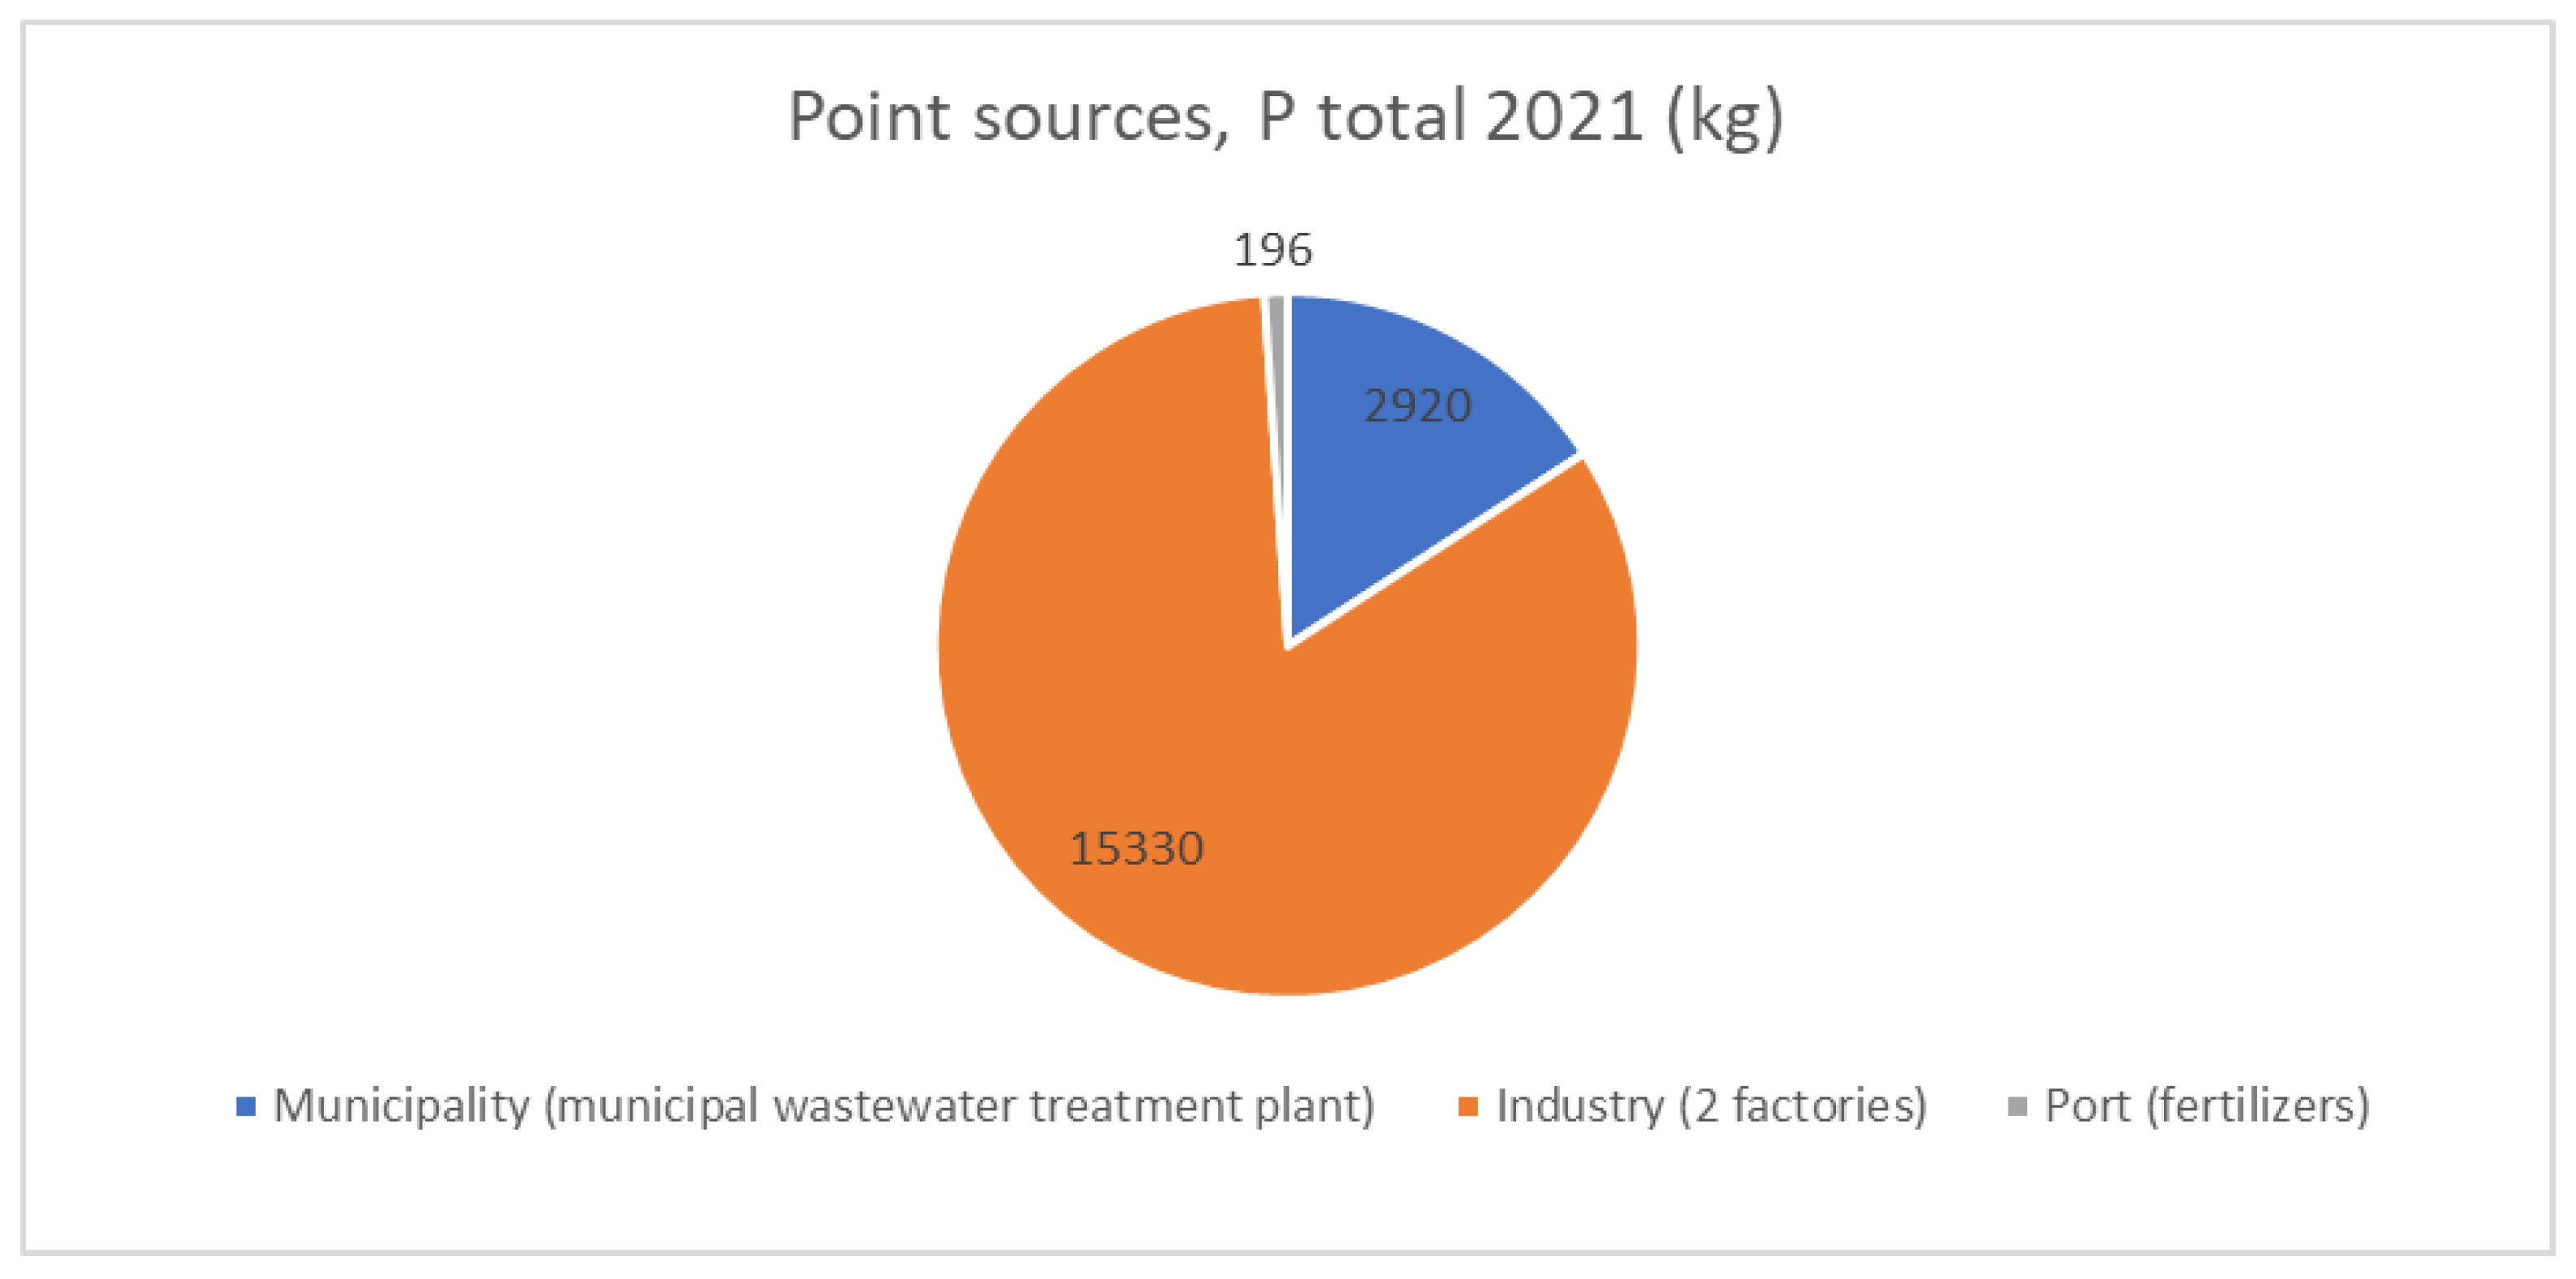
In addition, four significant point sources have been identified in the Hamina-Kotka-Pyhtää area: two forest industry factories, municipal wastewater treatment plant and fertilizer loading at port [
14,
20]. Share of the main point sources of nitrogen and phosphorus in the Hamina-Kotka-Pyhtää area are shown in the
Figure 2 and
Figure 3.
The maximum allowable input (MAI) of nitrogen and phosphorus to the Baltic Sea was agreed in 2013 at the Copenhagen Ministerial Declaration [
21], whereas the MAI in the Gulf of Finland is agreed to be 101 800 tons for nitrogen and 3600 tons for phosphorus from all sources. The most recent assessment, carried out in 2021, showed that the agreed reductions were not being met.
The most important regulation for preventing pollution from ships is the International Convention for the Prevention of Pollution from Ships (MARPOL) - agreement by the International Maritime Organisation (IMO). Marpol Annex IV contains regulations regarding ships’ black waters (sewage) [
22]. There are no regulations concerning grey waters. According to Annex IV cargo ships are allowed to discharge untreated sewage to the Baltic Sea if the distance to nearest land is more than 12 nautical miles. If the sewage is comminuted and disinfected, it may be discharged more than 3 nautical miles from the nearest land, provided that the ship is under way and travelling at a speed of at least 4 knots. If the ship has an approved wastewater treatment system, there are no restrictions for sewage disposal [
6].
For passenger vessels the regulations are stricter. Sewage discharge to the Baltic Sea is only permitted, if the ship has an approved and certified wastewater treatment plant according to IMO resolution MEPC.227(64) which stipulates a reduction of 70% nitrogen and 80% phosphorus levels. Passenger ships not equipped with an onboard sewage treatment facility according to the specifications must discharge the sewage (black water) to a port reception facility [
23].
To ensure that ships can globally comply with MARPOL requirements there are also requirements for port reception facilities [
22]. A port shall have adequate reception facilities for oily wastes, wastes containing noxious liquid substances, sewage, garbage, exhaust gas cleaning residues and cargo residues. However, delivery of sewage to port reception facilities (PRF) is voluntary for the ships.
The "No special fee" system, commonly implemented in most Baltic ports [
24], requires ports to levy a waste fee on ships irrespective of whether they offload any waste at Port Reception Facilities (PRF) or not. This fee remains constant regardless of the quantity of waste discharged at PRF. The aim of this system is to incentivize ships to deposit all waste at the port. By paying the obligatory fee, ships gain permission to dispose of various types of waste, including domestic waste like food waste, oily waste from machinery spaces, and sewage, at the port.
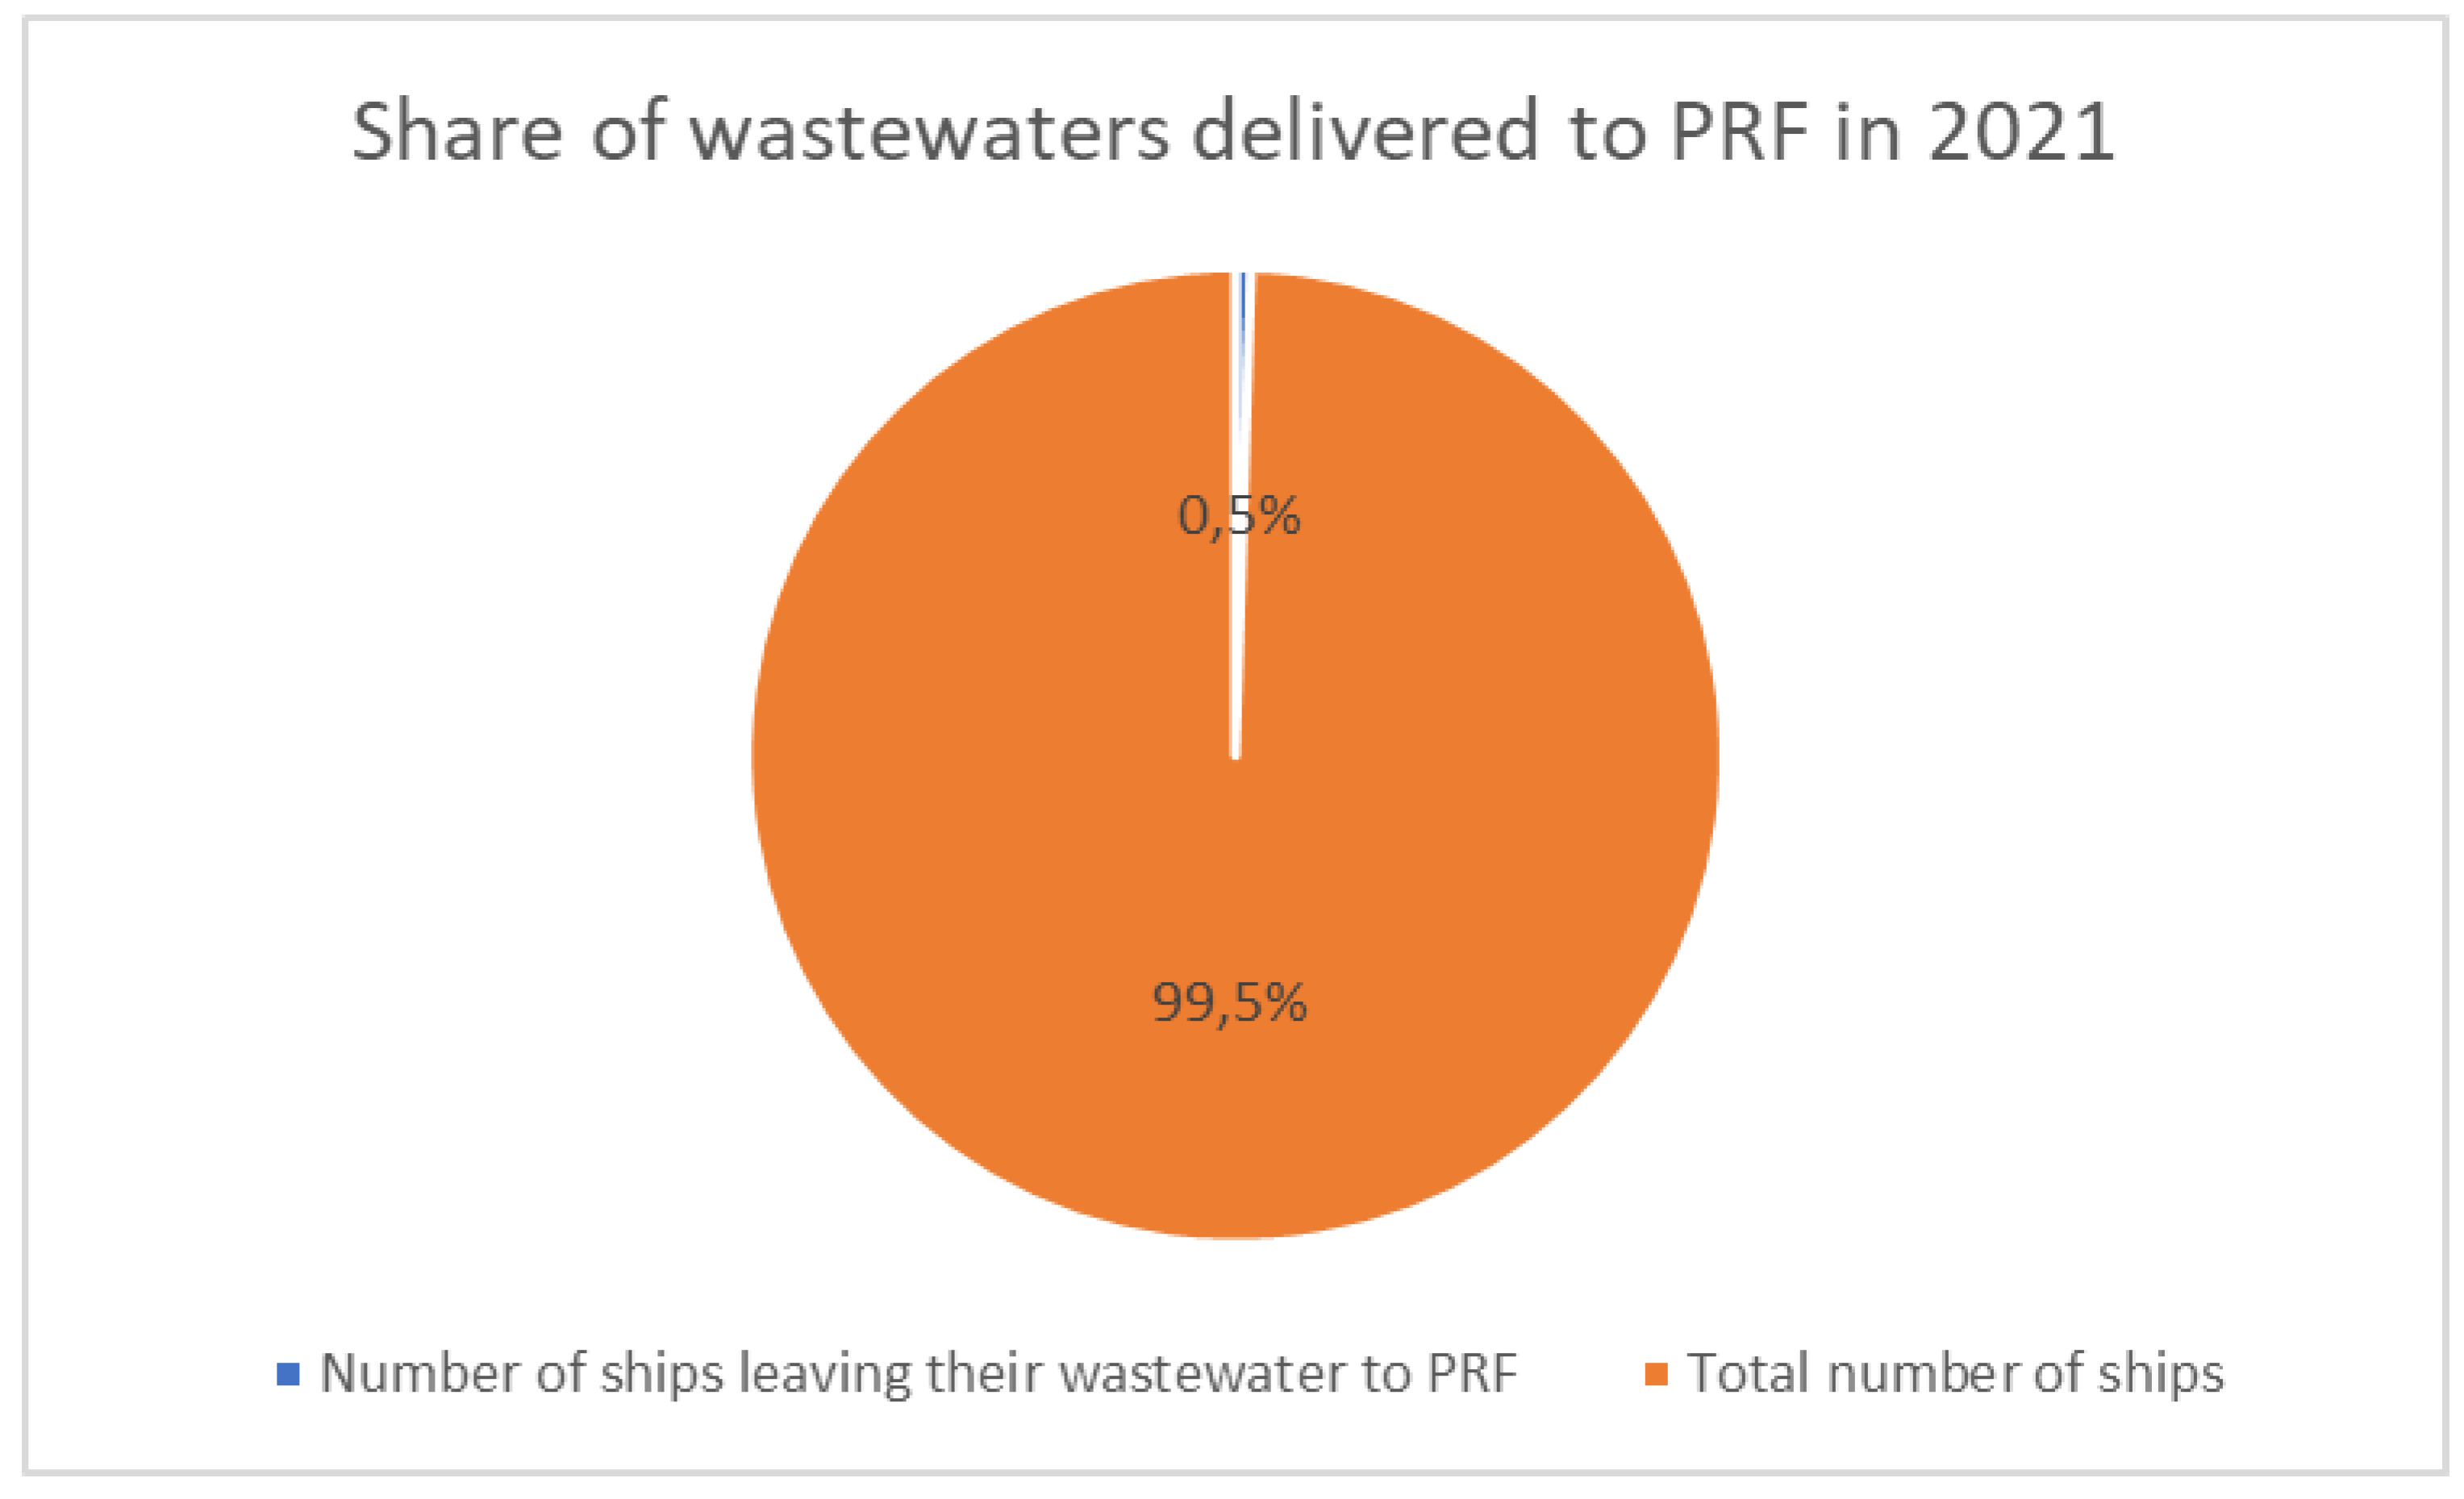
In the port of HaminaKotka, only 13 vessels delivered their wastewaters to PRF in 2021. Considering the total of 2,545 ships that visited the port in that year, this represents only 0.5% of the ships that discharged their sewage in the port (
Figure 4). There are no fixed reception facilities in the port, but the sewage is received from ships by vacuum trucks [
25].
Environmental regulations are becoming stricter. The EU, IMO, national authorities, ports and other organizations are stepping up their efforts to impose further restrictions and improve the monitoring of discharges at sea. For example, as the use of exhaust gas cleaning systems (scrubbers) on ships increases, many countries and ports are restricting their use due to the water pollution they cause [
26]. Nevertheless, certain discharges, such as non-Hazardous Materials to the Environment (non-HME) containing cleaning water and grey water, remain unregulated. Due to the lack of regulations on grey water and the relatively loose regulations on sewage discharges from cargo ships, this study is essential to evaluate the volume of nutrient discharges from these ships in order to assess the severity of the issue.
2. Materials and Methods
This study evaluates the quantities of nitrogen and phosphorus generated during the sea passage by all individuals on board the cargo ships that arrived at the case port in 2021. To perform this calculation, the following data were required:
• Number of vessels and vessel types
• Distance travelled in the Baltic Sea by the vessels before arriving at the port
• Speed of the vessels
• Number of crew members on board
• Daily amount of nitrogen and phosphorus in grey water and black water typically produced per person.
According to vessel statistics provided by the port, there were 2545 cargo ship calls in the case port in 2021. 40% were general cargo vessels, 20% were tankers, 17% container vessels, 16% roro vessels and 6% were bulk carriers. Distance in nautical miles from the previous port in the Baltic Sea was calculated using a calculation tool by Marine Traffic [
27]. If the previous port was outside Baltic Sea, the distance was calculated from the entrance of the Baltic Sea (Skagen). The average speed of each vessel was estimated using the information by Agarwal [
28]. Average travelling time of each ship across the Baltic Sea to the case port was then calculated. Average number of crew onboard the ships was estimated using data by Finnish Transport and Communications Agency [
29] and additional information by the port.
The amount of nitrogen and phosphorus in daily generation of grey water (GW) and black water (BW) per person in different ship types was estimated based on a study by Jalkanen et al. [
10]. The fixed emission factor of 16 g N and 1.6 g P per person and day that was used for black water is comparable to land-based estimates of 12.5 g N and 1.4 g P per person per day [
30]. To verify these estimated figures, several samples were taken in the port of HaminaKotka during 2021-2023 from cargo vessels wastewaters. According to the water sample analysis reports, the nutrient content of wastewater from cargo ships is generally equivalent to that of household waste waters [
31]. The data used in calculation is presented in
Table 1 below.
The equations used in this calculation for each ship were as follows:
- -
Time at the Baltic Sea in days = distance to port / average speed / 24 hours
- -
Amount of N in GW (grams) = 4.4 * number of crew members * time
- -
Amount of P in GW (grams) = 1.9 * number of crew members * time
- -
Amount of N in BW (grams) = 16 * number of crew members * time
- -
Amount of P in BW (grams) = 1.6 * number of crew members * time.
3. Results
The study showed that crew members in 2545 cargo ships calling the case port in 2021 generated a total of 134 kilograms of phosphorus and 781 kilograms of nitrogen in their wastewaters during their voyage from the previous Baltic port to the case port. The results of the calculation of cargo ships’ wastewaters in kilograms are presented in
Table 2.
The average amount of nitrogen produced in wastewaters per ship is 0.3 kg and the average amount of phosphorus produced in wastewaters per ship is 0.05 kg. These nutrient discharges, if discharged in the sea, are not local, as the regulations restrict discharging the wastewater near the shore. These discharges are either discharged to the open sea off the coast somewhere in the Baltic Sea, treated onboard in sewage treatment plant or stored in holding tanks and discharged in port reception facilities.
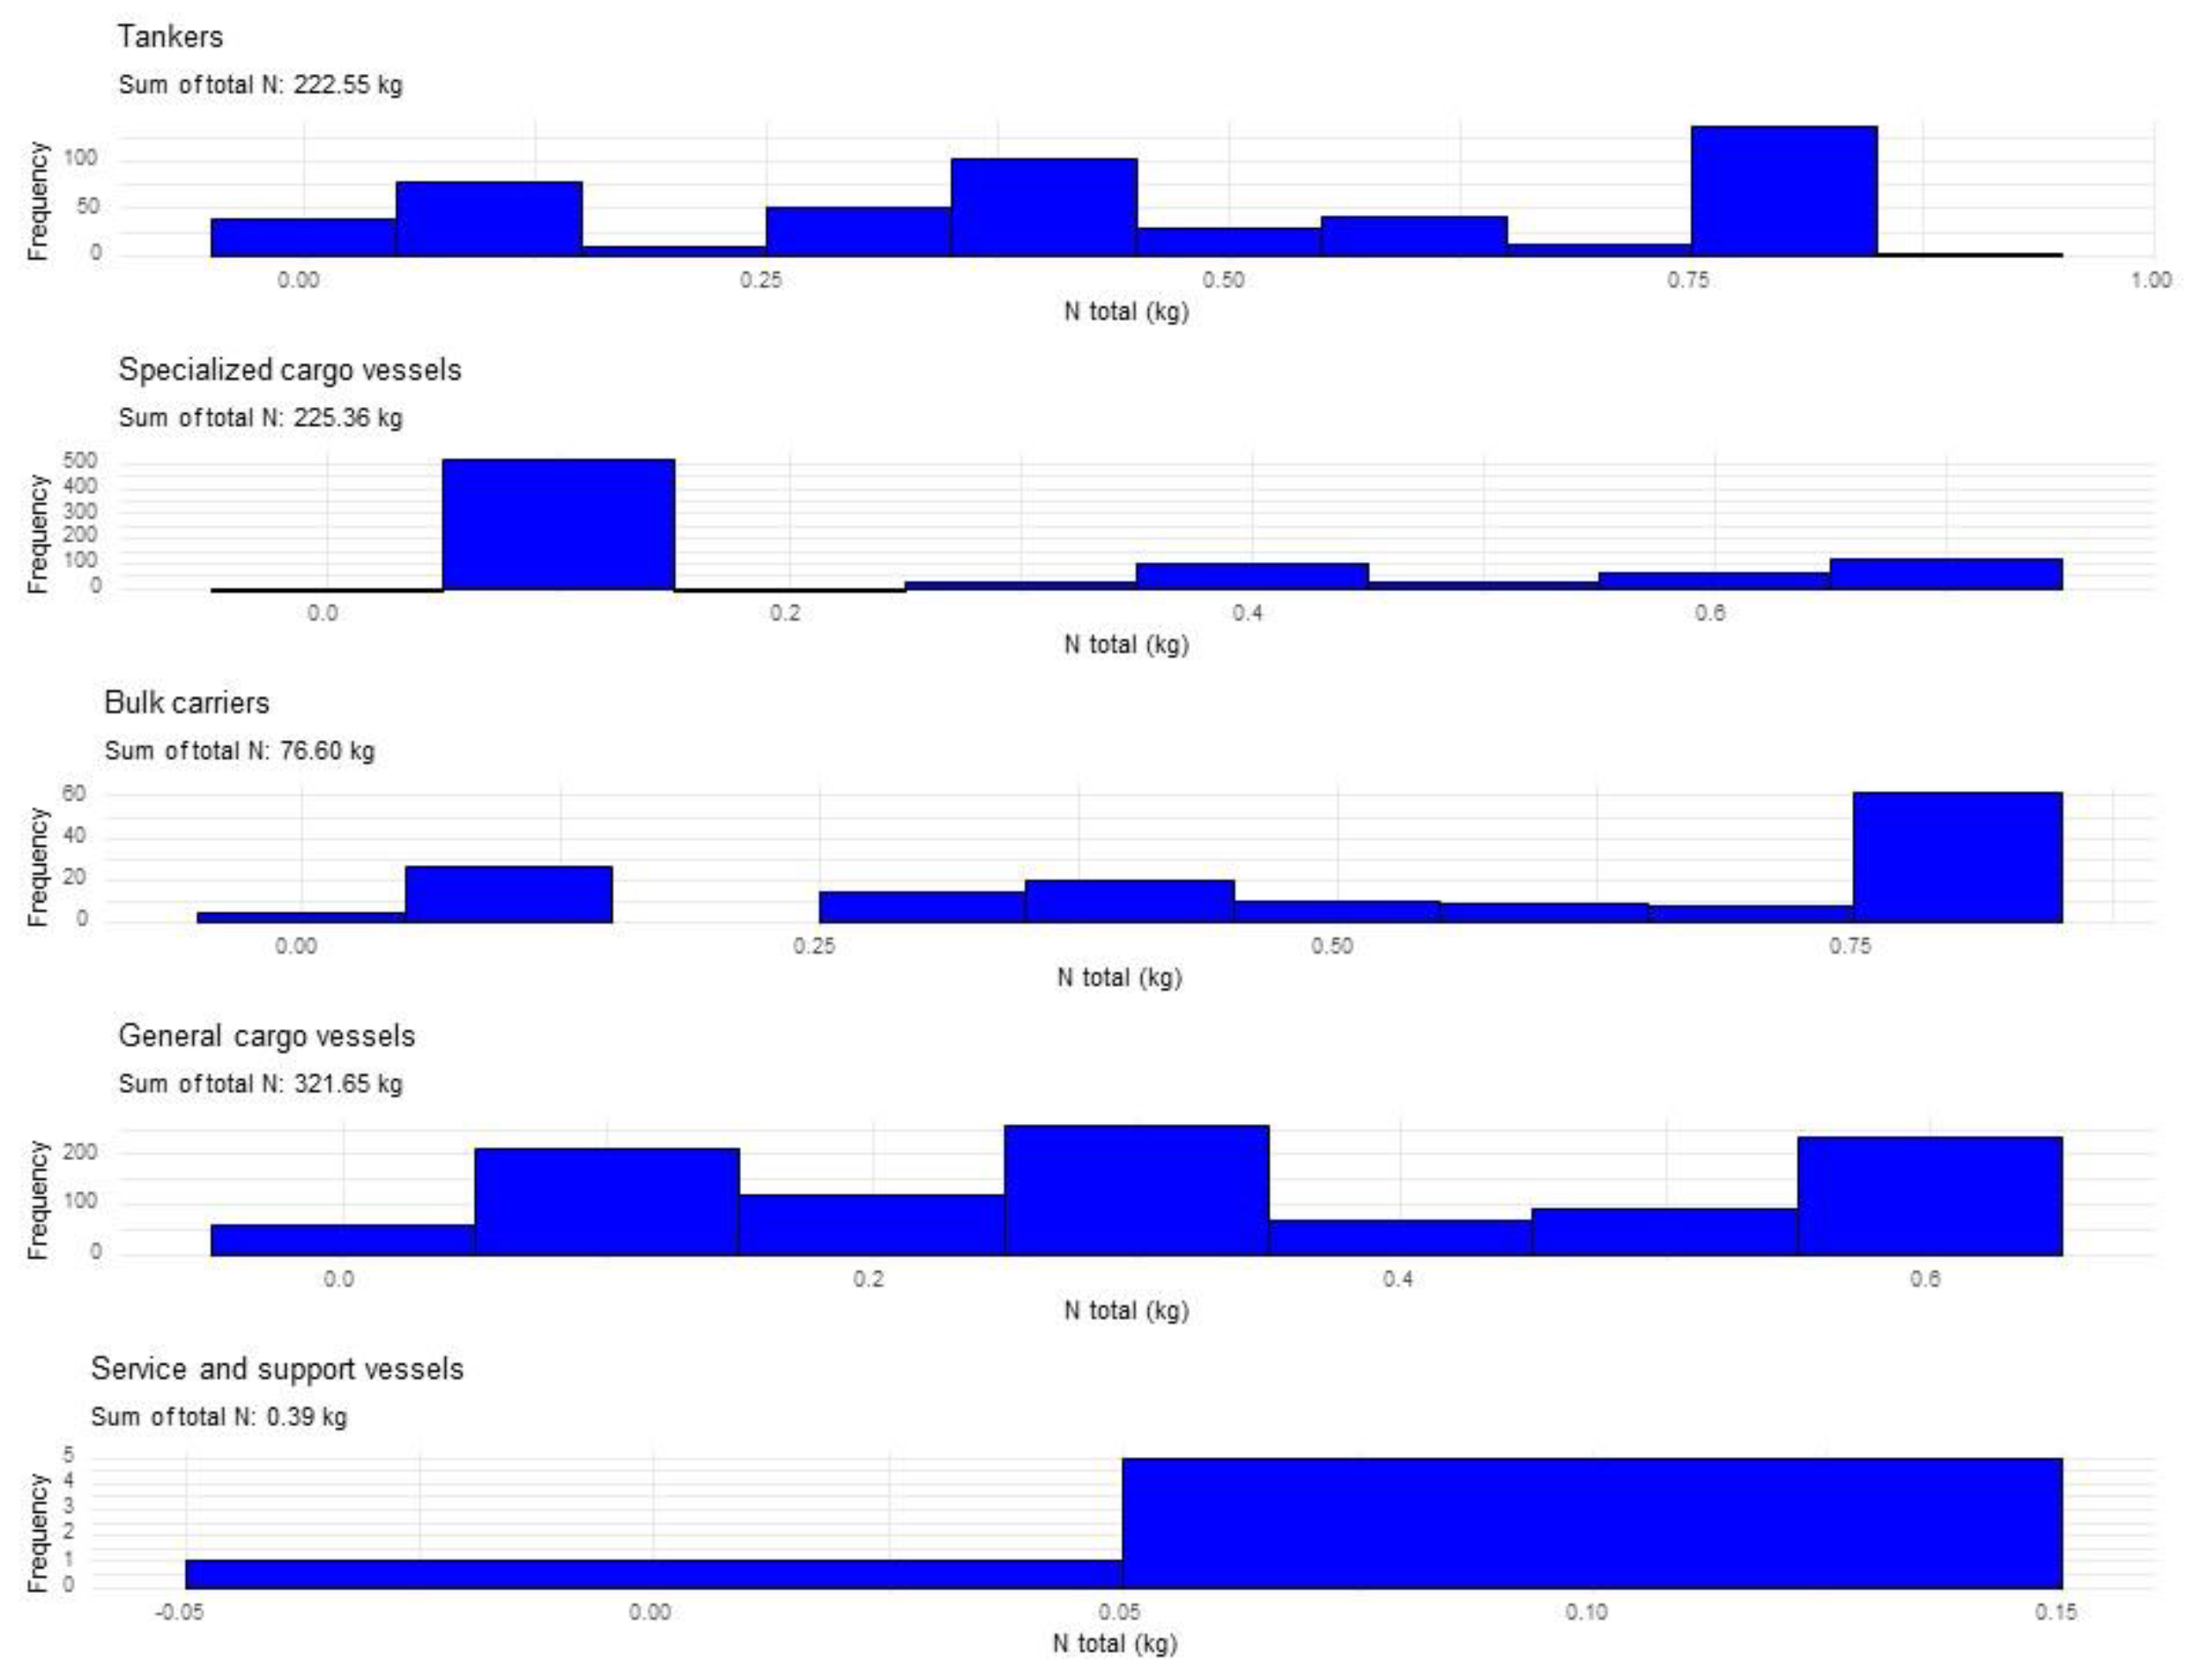
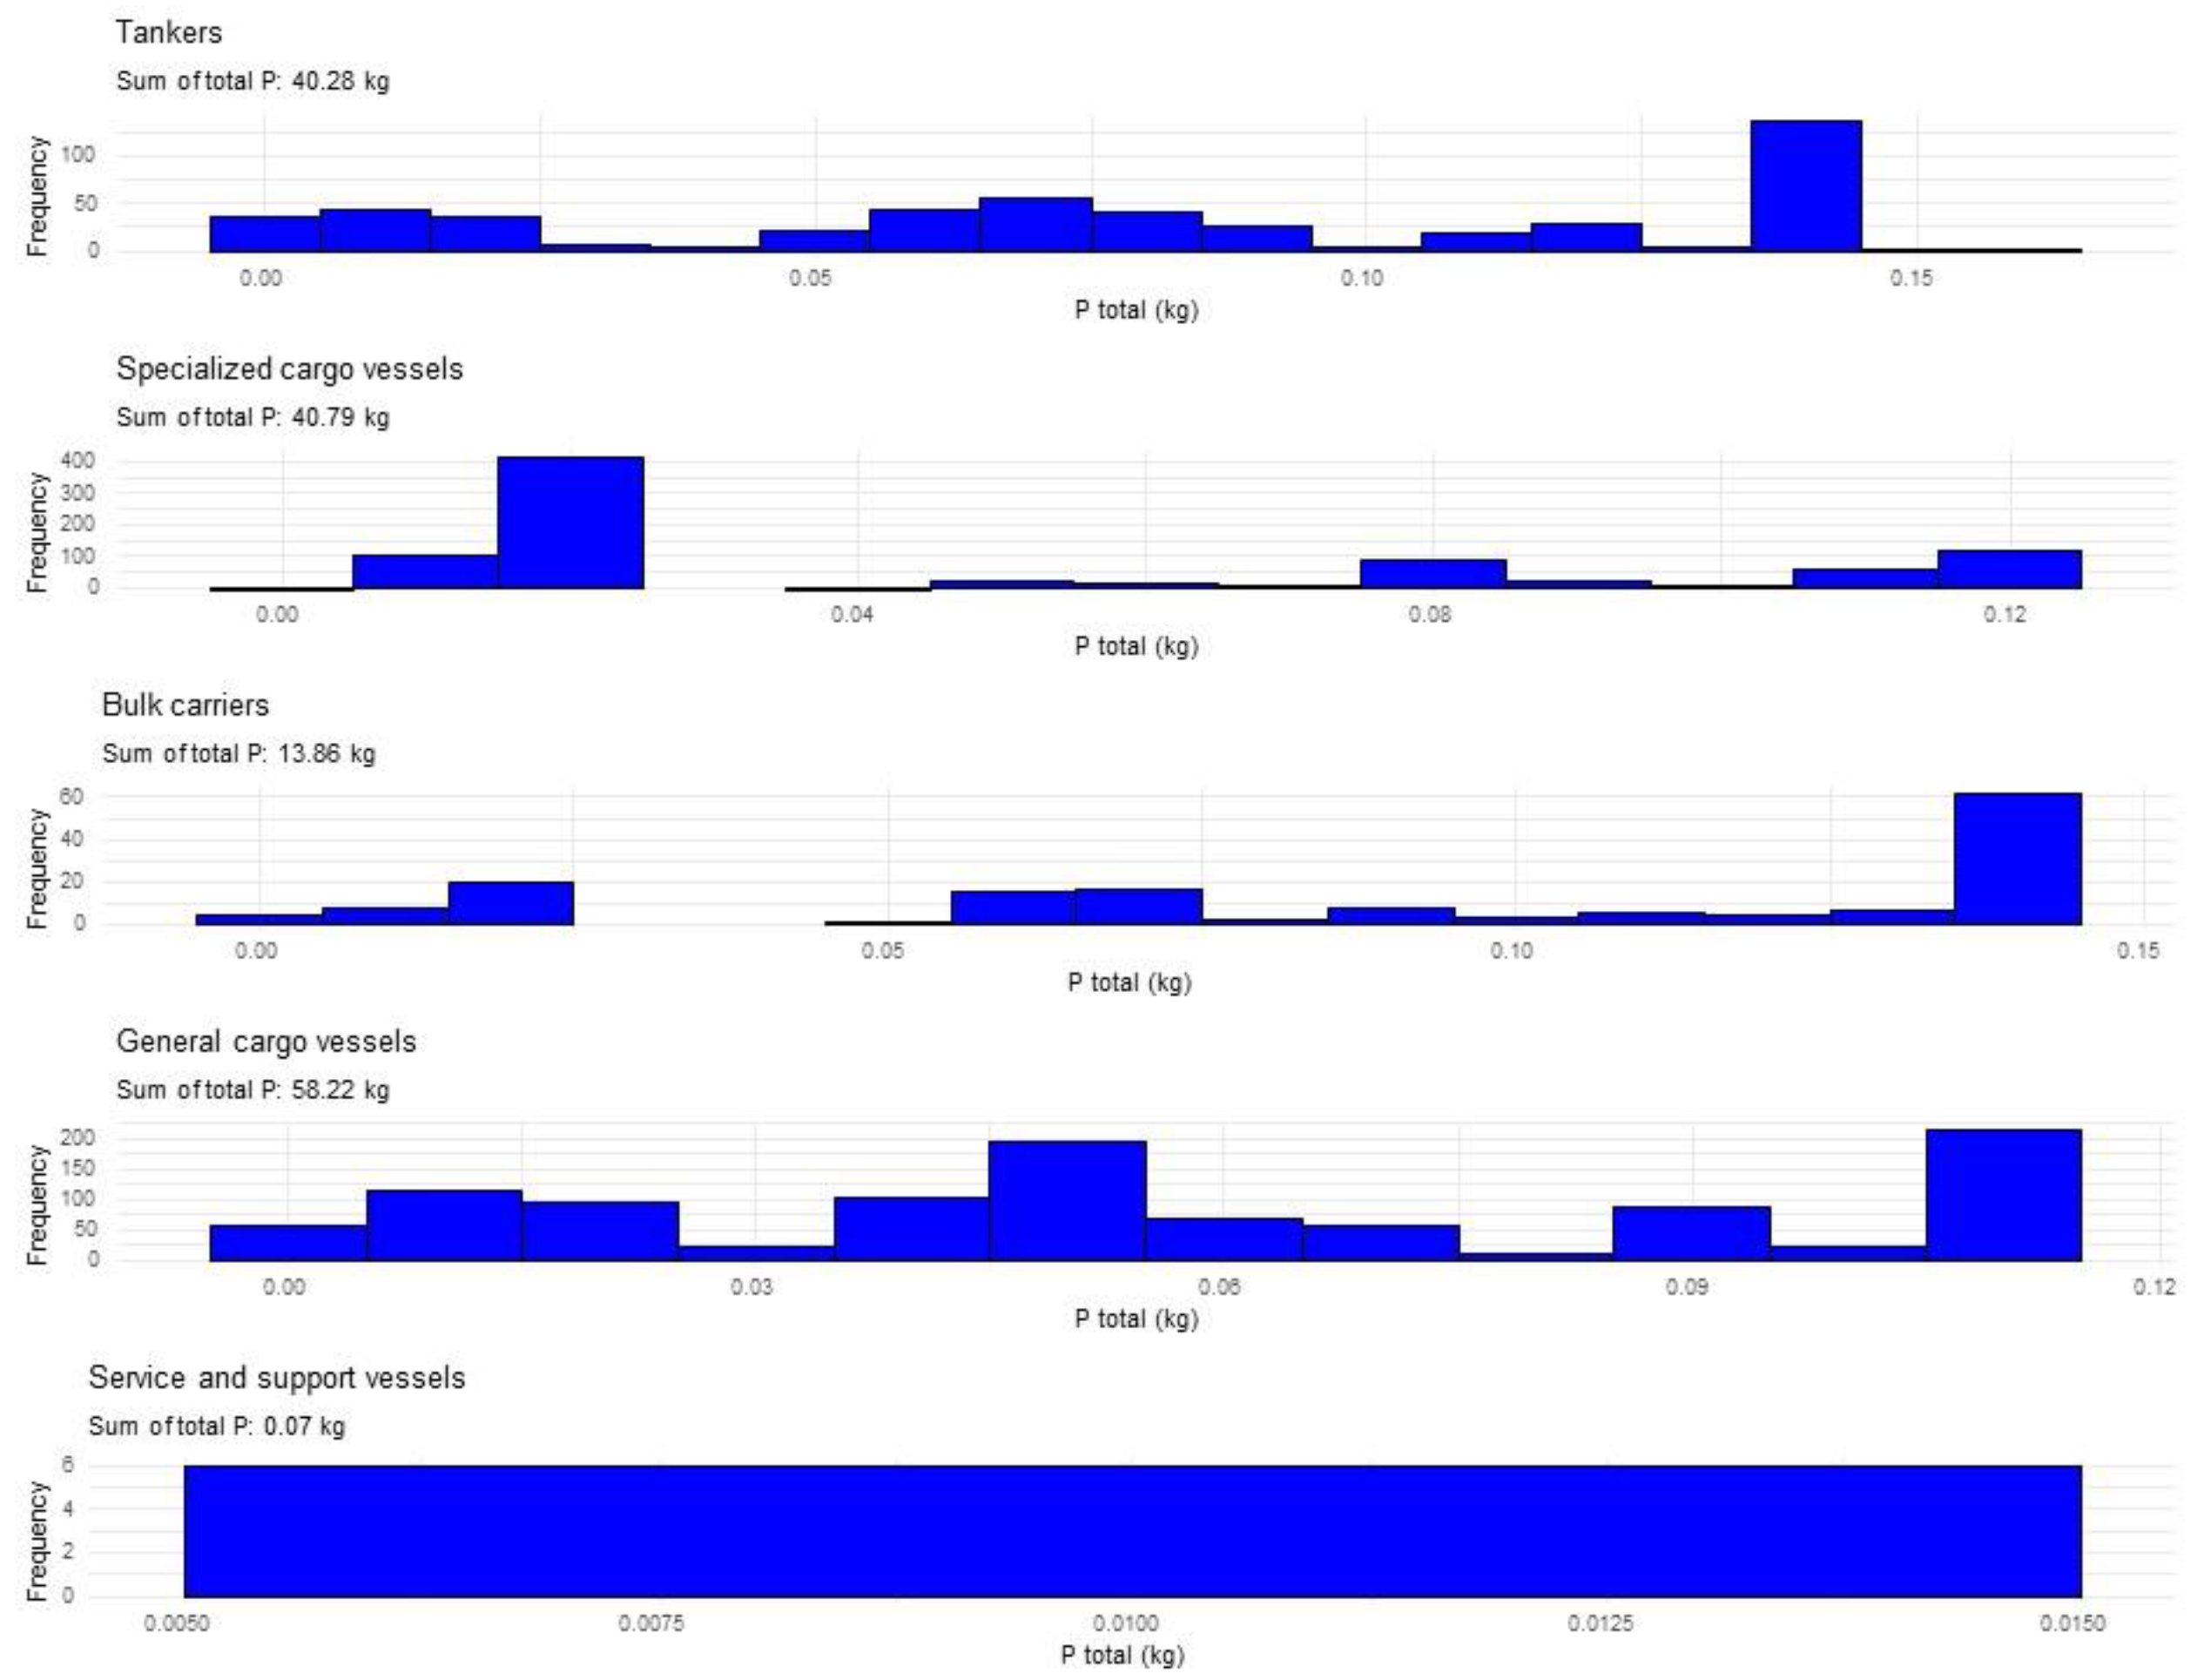
General cargo ships and tankers accounted for the majority of emitting cargo ships. In contrast, specialized cargo ships accounted for relatively few emissions compared to other ship types. In addition, there was considerable variability in emissions within this specific category of ships (
Figure 5 and 6).
4. Discussion
In this study, we estimated the theoretical maximum quantities of nitrogen and phosphorus that could end up in the Baltic Sea by the 2,545 cargo vessels visiting the case study port over one year. It remains unclear whether all these nutrients are actually released into the sea. It remains unknown how many vessels have used sewage treatment onboard, how effective these systems are, how many vessels have used holding tanks to store the wastewaters and how many vessels discharge them to shore reception facilities somewhere else than in the case study port. Only 0.5% of vessels discharged their wastewater at the HaminaKotka port, despite this service being free of charge. This suggests that most ships do not utilize this option. Further investigation is needed to determine whether this is due to operational delays, insufficient port reception facilities, lack of awareness, or other factors.
The results indicate that the main sources of wastewater-based nutrient discharges are general cargo and tanker vessels. However, there is considerable variability in nutrient loads within these groups, suggesting that management strategies should take this variability into account. This approach is crucial both for accurately mapping these sources in different sea regions and for developing targeted measures to reduce these emissions. Moreover, this insight can guide port authorities in allocating resources for the development of new port reception facilities. Using the outcomes of this study, the port can determine specific terminals where investments in port reception facilities for cargo vessels would yield the most significant impact.
In total, nutrient discharges from different sources in the coastal area amounted to 6,761 tons of nitrogen and 225 tons of phosphorus, primarily originating from rivers and four major point sources. The proportion of phosphorus emissions from cargo ships’ wastewater in the area is 0.06%, and nitrogen emissions account for 0.01% of the total load. Additionally, it should be noted that while the loads from fertilizer application, municipal wastewater treatment plants, and industry are localized point sources, the nutrient load from ships’ wastewater is dispersed throughout the open waters of the Baltic Sea during their voyage.
The significance of this study lies in its detailed analysis of nutrient loads from cargo ships, an area that has not been well understood. By estimating the expected emissions from different types of cargo ships and highlighting the variability within these types, the study has shed light on the contribution of such nutrient pollution to the overall nutrient load. In addition, with stricter environmental regulations expected in the near future, the results of this study provide valuable insights. They highlight areas where interventions - such as the development of efficient nutrient treatment systems on board the most polluting ships and the design of future port reception facilities - can be effectively implemented to minimise nutrient discharges. In addition, the methodology used in this study can be adapted and applied in other ports and regions, providing a scalable solution for assessing and managing nutrient emissions from cargo ships on a wider scale. This approach not only enhances local environmental protection efforts, but also contributes to a more comprehensive understanding of maritime environmental impacts globally.
This study is partly based on calculations and estimations. There may be inaccuracies due to limited number of samples or generic data that is used as source for calculations. The ships’ speed and number of crew are estimates based on literature. While there may be variations in the actual number of crew and speed, the overall magnitude of the results remains consistent. The estimated production and concentrations of nitrogen and phosphorus have been verified by analysis of actual samples.
5. Conclusions
This study addressed important questions about the generation and discharge of phosphorus and nitrogen from cargo ships in the Baltic Sea. In particular, it focused on quantifying the amounts of these nutrients contained in black and grey water and assessing the proportion of wastewater discharged in a given port. It also looked at the contribution of different types of ships and assessed the significance of these emissions in relation to other sources of nutrient discharges in the area.
It was found out that the proportion of emissions from cargo ship effluent is only a small fraction of the total nutrient load in the area. Although nutrient discharges from ships may appear small compared to other sources, it remains important for ports to encourage ships to discharge their sewage and waste on land. Alternatively, cargo ships should be equipped with certified sewage treatment plants to treat the water before it is discharged into the sea, thus ensuring a holistic approach to managing maritime environmental impacts in the Baltic Sea region. Furthermore, the distributional nature of wastewater impacts across the Baltic Sea, similar to the variability of point load impacts between different ports, underlines the need for localized strategies.
In conclusion, this study not only contributes to local environmental protection efforts but also provides a scalable solution for managing nutrient emissions from cargo ships at ports. By addressing this aspect of maritime environmental impact, it advances efforts towards achieving sustainable shipping practices and preserving the ecological integrity of marine ecosystems.
Further research is warranted to assess the effectiveness of onboard sewage treatment systems in mitigating nitrogen and phosphorus discharge into the sea, as well as to quantify the proportion of treated versus untreated effluent. However, this is not straightforward since these facilities vary significantly, making it challenging to assess their effectiveness. Additionally, the composition and environmental impact of other contaminants present in wastewaters, such as bacteria and traces of medication, require further investigation.
The effectiveness of port reception facilities (PRF) in facilitating wastewater discharge to shore is essential, yet current PRF availability and infrastructure vary significantly among ports, ranging from fixed to mobile facilities, with occasional absence or high costs. Hence, the development of PRF merits thorough examination. It should be kept in mind, that the passenger vessels are the main producers of wastewaters at sea. These emissions are strictly regulated and generally passenger terminals are equipped with fixed PRF accordingly.
Municipal treatment plants contribute to local nutrient discharge into the sea. This prompts a need to assess the feasibility of transporting treated sewage waters of ships to local ports and municipal treatment plants. This consideration is important to study if transporting the wastewaters to the port leads to increased local nutrient load compared to even distribution directly into the sea throughout the voyage.
Author Contributions
Conceptualization, S.L.; methodology, S.L. and J.K.; validation, S.L., U.T. and J.K.; formal analysis, S.L., U.T. and J.K.; investigation, S.L.; data curation, S.L., U.T. and J.K.; writing—original draft preparation, S.L. and U.T.; writing—review and editing, S.L., J.K. and U.T.; visualization, S.L.; supervision, U.T. and J.K.; project administration, U.T. All authors have read and agreed to the published version of the manuscript.
Funding
This research received no external funding.
Institutional Review Board Statement
Not applicable.
Informed Consent Statement
Not applicable.
Data Availability Statement
The main data used in this study are available from public sources. Ship speed, average number of crew per ship type and nutrient production per person can be found in the literature. Detailed information on port-specific ship calls, information on the ships that delivered their waste water to the case port or the results of the analysis of waste water samples in the case study port are not publicly available. The authors of this article do not have permission to publish these data as such. Data on ship calls can be obtained from Traficom or the Port of HaminaKotka. Sample analysis results can be obtained from the Baltic Sea Action Group.
Acknowledgments
Writing of this research was supported by the INTERREG Central Baltic Sea Region project “Sustainable Flow”, grant number CB0100021.
Conflicts of Interest
The authors declare no conflicts of interest.
References
- United Nations. Review of Maritime Transport 2021. eISSN: 2225-3459.
- Jägerbrand, A.K.; Brutemark, A.; Svedén, J.B.; Gren, I-M. A review on the environmental impacts of shipping on aquatic and nearshore ecosystems. Science of The Total Environment. 2019, 695, 133637. [CrossRef]
- Madjidian, J. Clean Baltic Sea shipping. ResearchGate, 2013. Available online https://www.researchgate.net/publication/291338320_Clean_Baltic_Sea_Shipping (accessed 30 April 2024).
- Helsinki Commission (HELCOM). Reinforcing oil spill response capacity in the Baltic. Baltic Marine Environment Protection Commission 2009.
- Conley, D.J. Save the Baltic Sea. Nature 2012, 486(7404), 463–464. [CrossRef]
- Nellesen, T.; Broeg, K.; Dorgeloh, E.; Joswig, M.; Heitmüller, S. A Technical Guidance for the Handling of Wastewater in Ports of the Baltic Sea Special Area under MARPOL Annex IV. Helsinki Commission – HELCOM. Baltic Marine Environment Protection Commission 2020.
- Helsinki Commission (HELCOM). Baltic Sea Action Plan 2021 update.
- Savchuk, O.P.; Eilola, K.; Gustafsson, B.G.; Medina, M.R.; Ruoho-Airola, T. Long-term reconstruction of nutrient loads to the Baltic Sea, 1850-2006 (Technical Report No. 6).
- Raudsepp, U.; Maljutenko, I.; Kõuts, M.; Granhag, L.; Wilewska-Bien, M.; Hassellöv, I.-M.; Eriksson, K.M.; Johansson, L.; Jalkanen, J.-P.; Karl, M.; Matthias, V.; Moldanova, J. Shipborne nutrient dynamics and impact on the eutrophication in the Baltic Sea. Science of The Total Environment. 2019, 671, 189–207. [CrossRef]
- Jalkanen, J.-P.; Johansson, L.; Wilewska-Bien, M.; Granhag, L.; Ytreberg, E.; Eriksson, K.M.; Yngsell, D.; Hassellöv, I.-M.; Magnusson, K.; Raudsepp, U.; Maljutenko, I.; Styhre, L.; Winnes, H.; Moldanova, J. Modeling of discharges from Baltic Sea shipping. Preprint. Surface/Numerical Models/Baltic Sea/Transports/cycling (nutrients, C, O, etc.)/Oceanic pollution. [CrossRef]
- Jalkanen, J.-P.; Johansson, L.; Wilewska-Bien, M.; Granhag, L.; Ytreberg, E.; Eriksson, K.M.; Yngsell, D.; Hassellöv, I.-M.; Magnusson, K.; Raudsepp, U.; Maljutenko, I.; Winnes, H.; Moldanova, J. Modelling of discharges from Baltic Sea shipping. Ocean Sci. 2021, 17, 699–728. [CrossRef]
- European Environment Agency; European Maritime Safety Agency. European maritime transport environmental report 2021. Publications Office. Available online https://data.europa.eu/doi/10.2800/3525 (accessed 12 April 2024).
- Moldanová, J.; Hassellöv, I.-M.; Matthias, V.; Fridell, E.; Jalkanen, J.-P.; Ytreberg, E.; Quante, M.; Tröltzsch, J.; Maljutenko, I.; Raudsepp, U.; Eriksson, K.M. Framework for the environmental impact assessment of operational shipping. Ambio 2022, 51(3), 754–769. [CrossRef]
- Lappalainen, S-T.; Kotta, J.; Tombak, M-L.; Tapaninen, U. Using Machine Learning Methodology to Model Nutrient Discharges from Ports: A Case Study of a Fertilizer Terminal. J. Mar. Sci. Eng. 2024, 12(1), 143. [CrossRef]
- StatFin. International sea transport by port and commodity group by Commodity group. Statistics Finland’s free-of-charge statistical database (accessed 20 April 2024).
- HaminaKotka. The biggest universal port in Finland. Available online: https://www.haminakotka.com/about-port/biggest-universal-port-finland (accessed 21 April 2024).
- Finnish Transport Infrastructure Agency. Trans-European Transport Network TEN-T. 11.8.2020. Available online: https://vayla.fi/en/transport-network/transport-system/ten-t (accessed 11 April 2024).
- HELCOM Map and Data Service. Available online: https://maps.helcom.fi/website/mapservice/index.html (accessed 11 April 2024).
- Anttila-Huhtinen, M. Water Monitoring in Kotka Port Areas in 2020. Research Report no. 514/2021. Water and Environment Association of the River Kymijoki.
- Nakari, H.; Anttila-Huhtinen, M. Monitoring report of Waters at Pyhtää-Kotka-Hamina Sea Area. Report no. 311/2022. Water and Environment Association of the River Kymijoki. ISSN 2670-2177.
- Helsinki Commission (HELCOM). Copenhagen Ministerial Declaration, Taking Further Action to Implement the Baltic Sea Action Plan - Reaching Good Environmental Status for a healthy Baltic Sea, 3 October 2013, Copenhagen, Denmark. Available online https://helcom.fi/wp-content/uploads/2019/08/2013-Copenhagen-Ministerial-Declaration-w-cover-1.pdf (accessed 25 April 2024).
- International Maritime Organization (IMO). MARPOL Annex IV, Regulations for the Prevention of Pollution by Sewage from Ships, 2022 Edition.
- International Maritime Organization (IMO). MEPC.227(64) resolution, 2012 Guidelines on Implementation of Effluent Standards and Performance Tests for Sewage Treatment Plants.
- Wilewska-Bien, M.; Anderberg, S. Reception of sewage in the Baltic Sea – The port´s role in the sustainable management of ship wastes. Mar. Policy 2018, 93, 207–213. [CrossRef]
- HaminaKotka. Sewage from cargo ships turned into biogas. News from the port. Available online: https://www.haminakotka.com/news-from-the-port/sewage-cargo-ships-turned-biogas (accessed 13 April 2024).
- International Council on Clean Transportation (ICCT). Policy Update, © 2023.
- MarineTraffic. Distance calculation tool. Available online www.marinetraffic.com (accessed 11 April 2024).
- Agarwal, M. What is The Speed of a Ship at Sea? Marine Insight, 26 April 2019.
- Holmberg, J. Study Of Grey Water Samples from Cargo and Passenger Ships and an Assessment of the Impacts of Wastewater on the Marine Environment. Research Report no. 519/2021. Water and Environment Association of the River Kymijoki. ISSN 2670-2185.
- Jönsson, H.; Baky, A.; Jeppsson, U.; Hellström, D.; Kärrman, E. Composition of Urine, Feaces, Greywater and Biowaste for Utilisation in the URWARE Model. 2005. Available online: https://www.iea.lth.se/publications/Reports/LTH-IEA-7222.pdf (accessed 1 May 2024). .
- Baltic Sea Action Group (BSAG). Available online: https://www.bsag.fi/ajankohtaista/rahtialusten-jatevedet-kertovat/ (accessed 20 April 2024).
|
Disclaimer/Publisher’s Note: The statements, opinions and data contained in all publications are solely those of the individual author(s) and contributor(s) and not of MDPI and/or the editor(s). MDPI and/or the editor(s) disclaim responsibility for any injury to people or property resulting from any ideas, methods, instructions or products referred to in the content. |
© 2024 by the authors. Licensee MDPI, Basel, Switzerland. This article is an open access article distributed under the terms and conditions of the Creative Commons Attribution (CC BY) license (http://creativecommons.org/licenses/by/4.0/).
