Submitted:
09 May 2024
Posted:
10 May 2024
You are already at the latest version
Abstract
Keywords:
1. Introduction
2. Materials and Methods
2.1. Materials
2.2. Thermal Properties
2.3. Printing Force Measurements
2.4. Printing
2.5. Debinding and Sintering
2.5. Characterization
3. Results and Discussion
3.1. Thermal Properties
3.1.1. DSC Analysis
3.1.2. TGA Analysis
3.2. Force Measurement Analysis
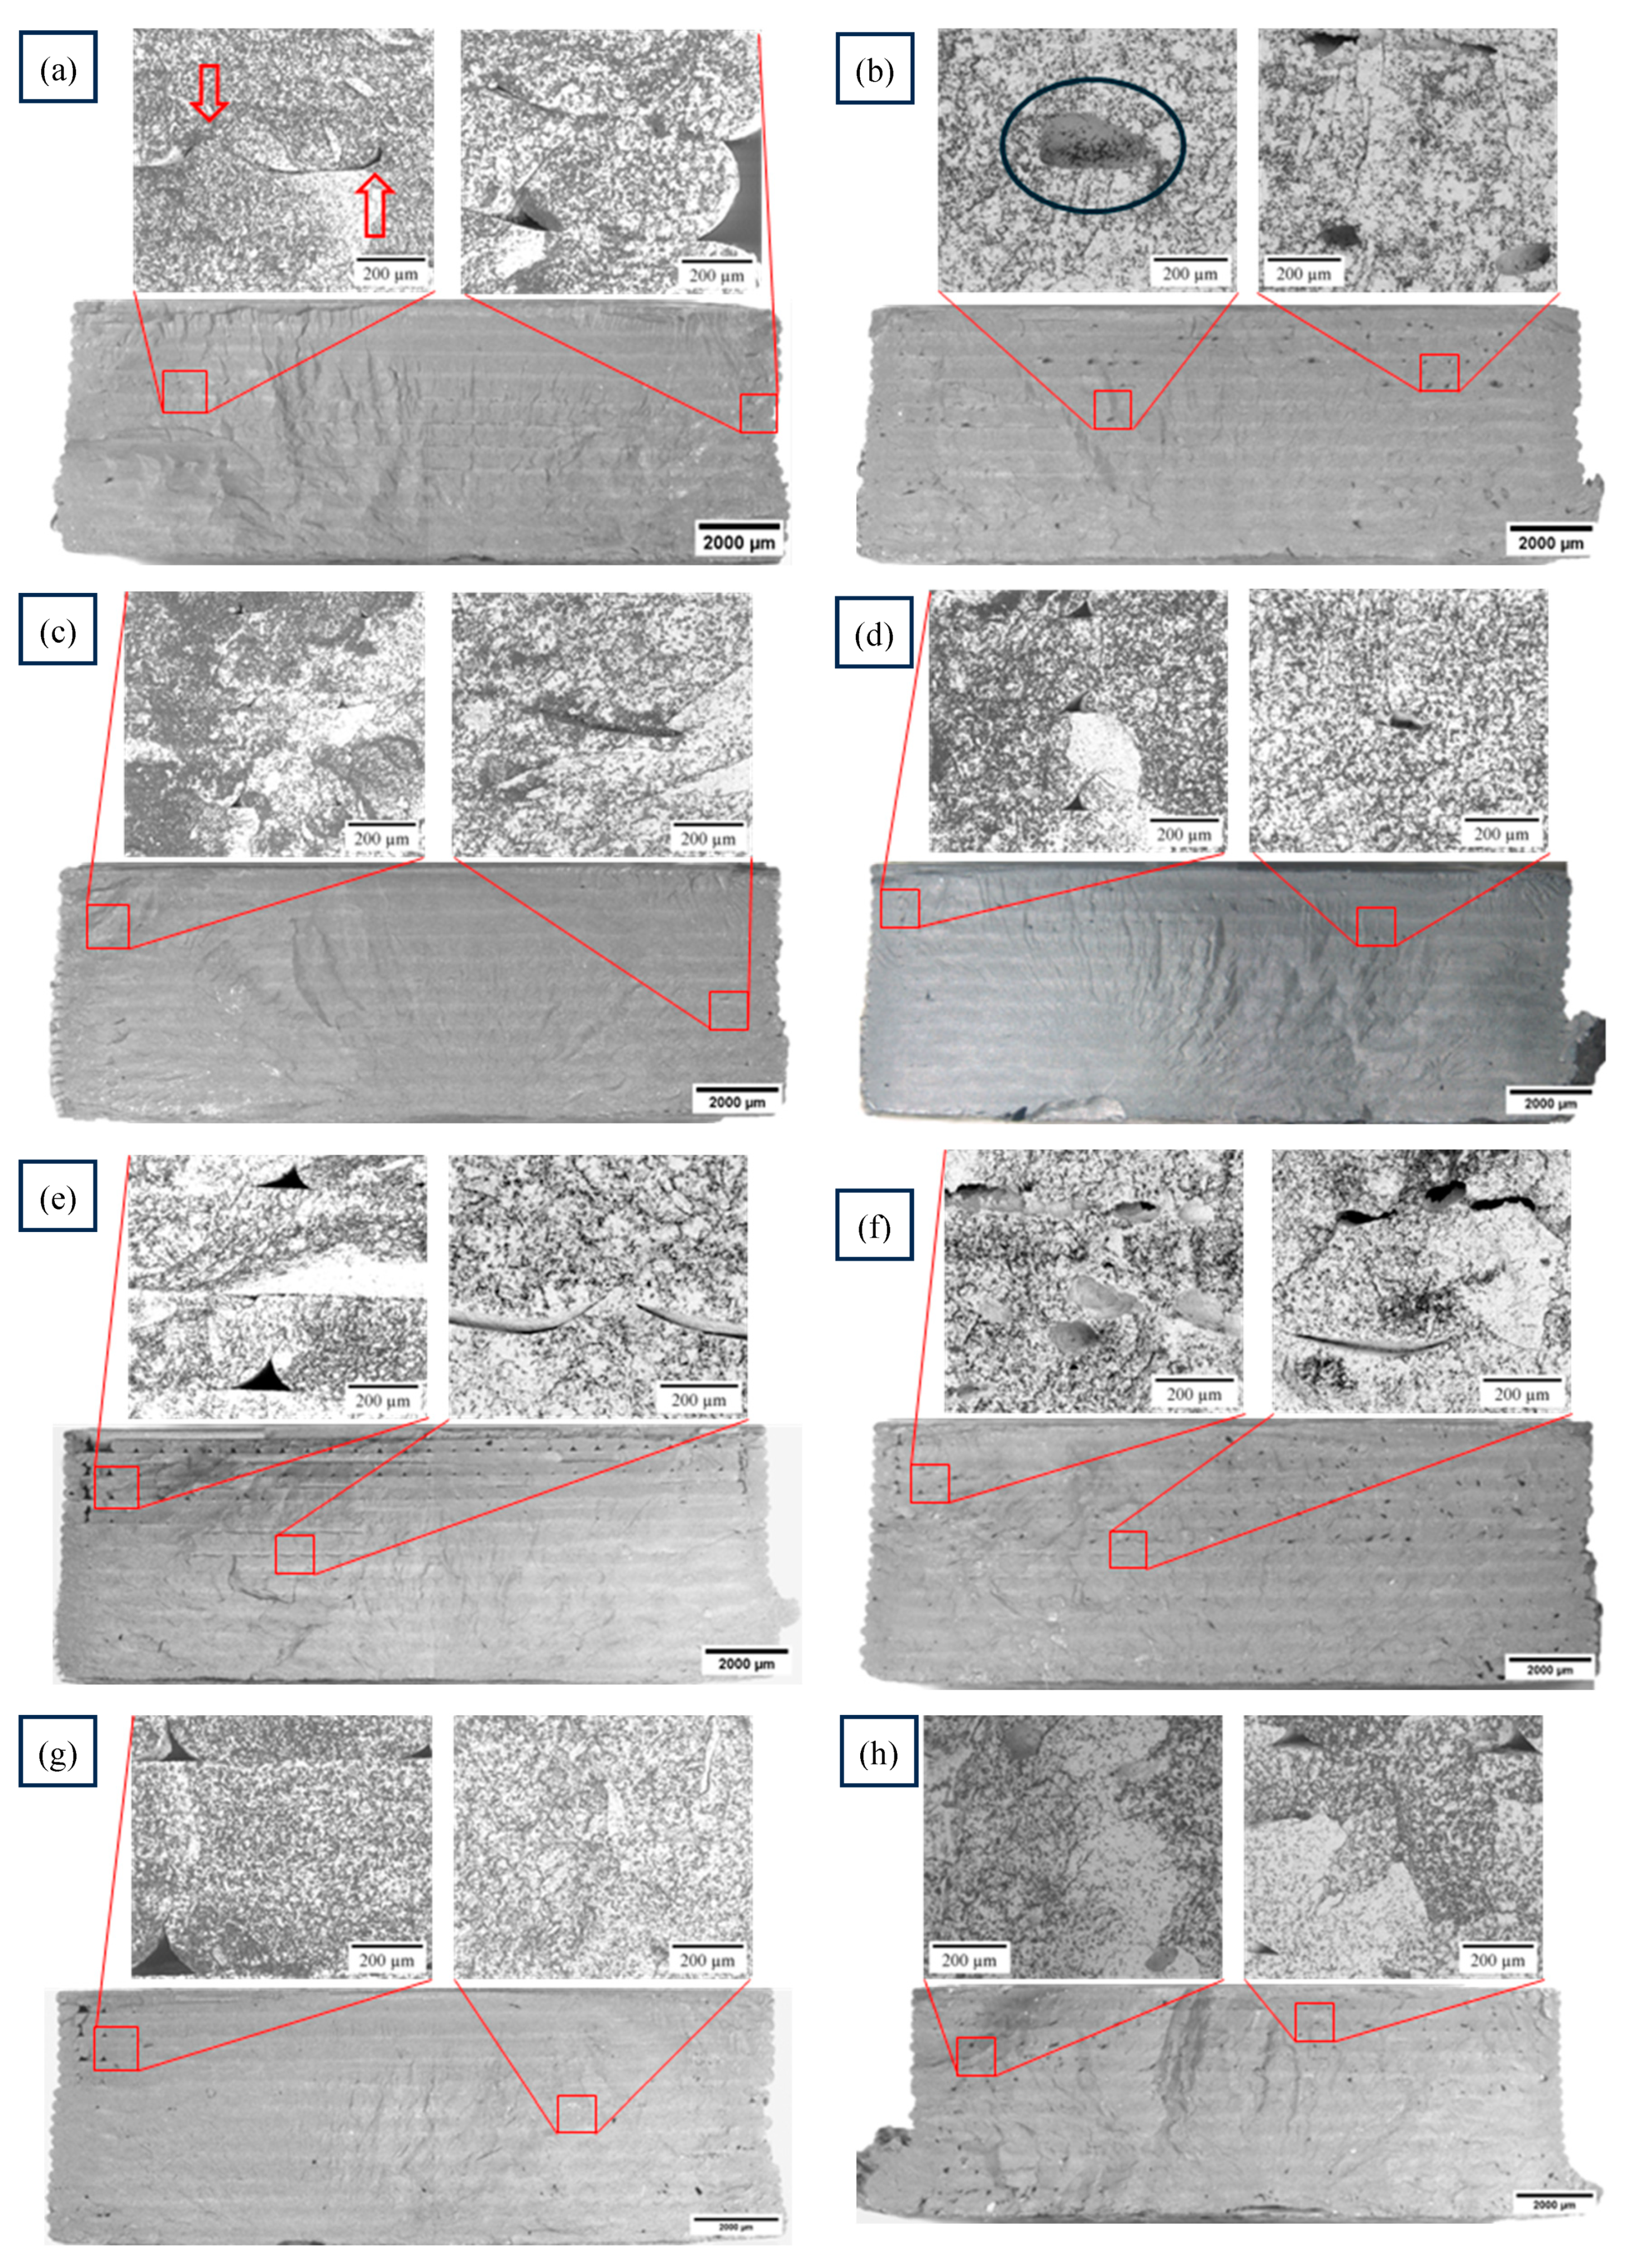
3.4. Samples Printed at 10 mm/s and Different Temperatures.
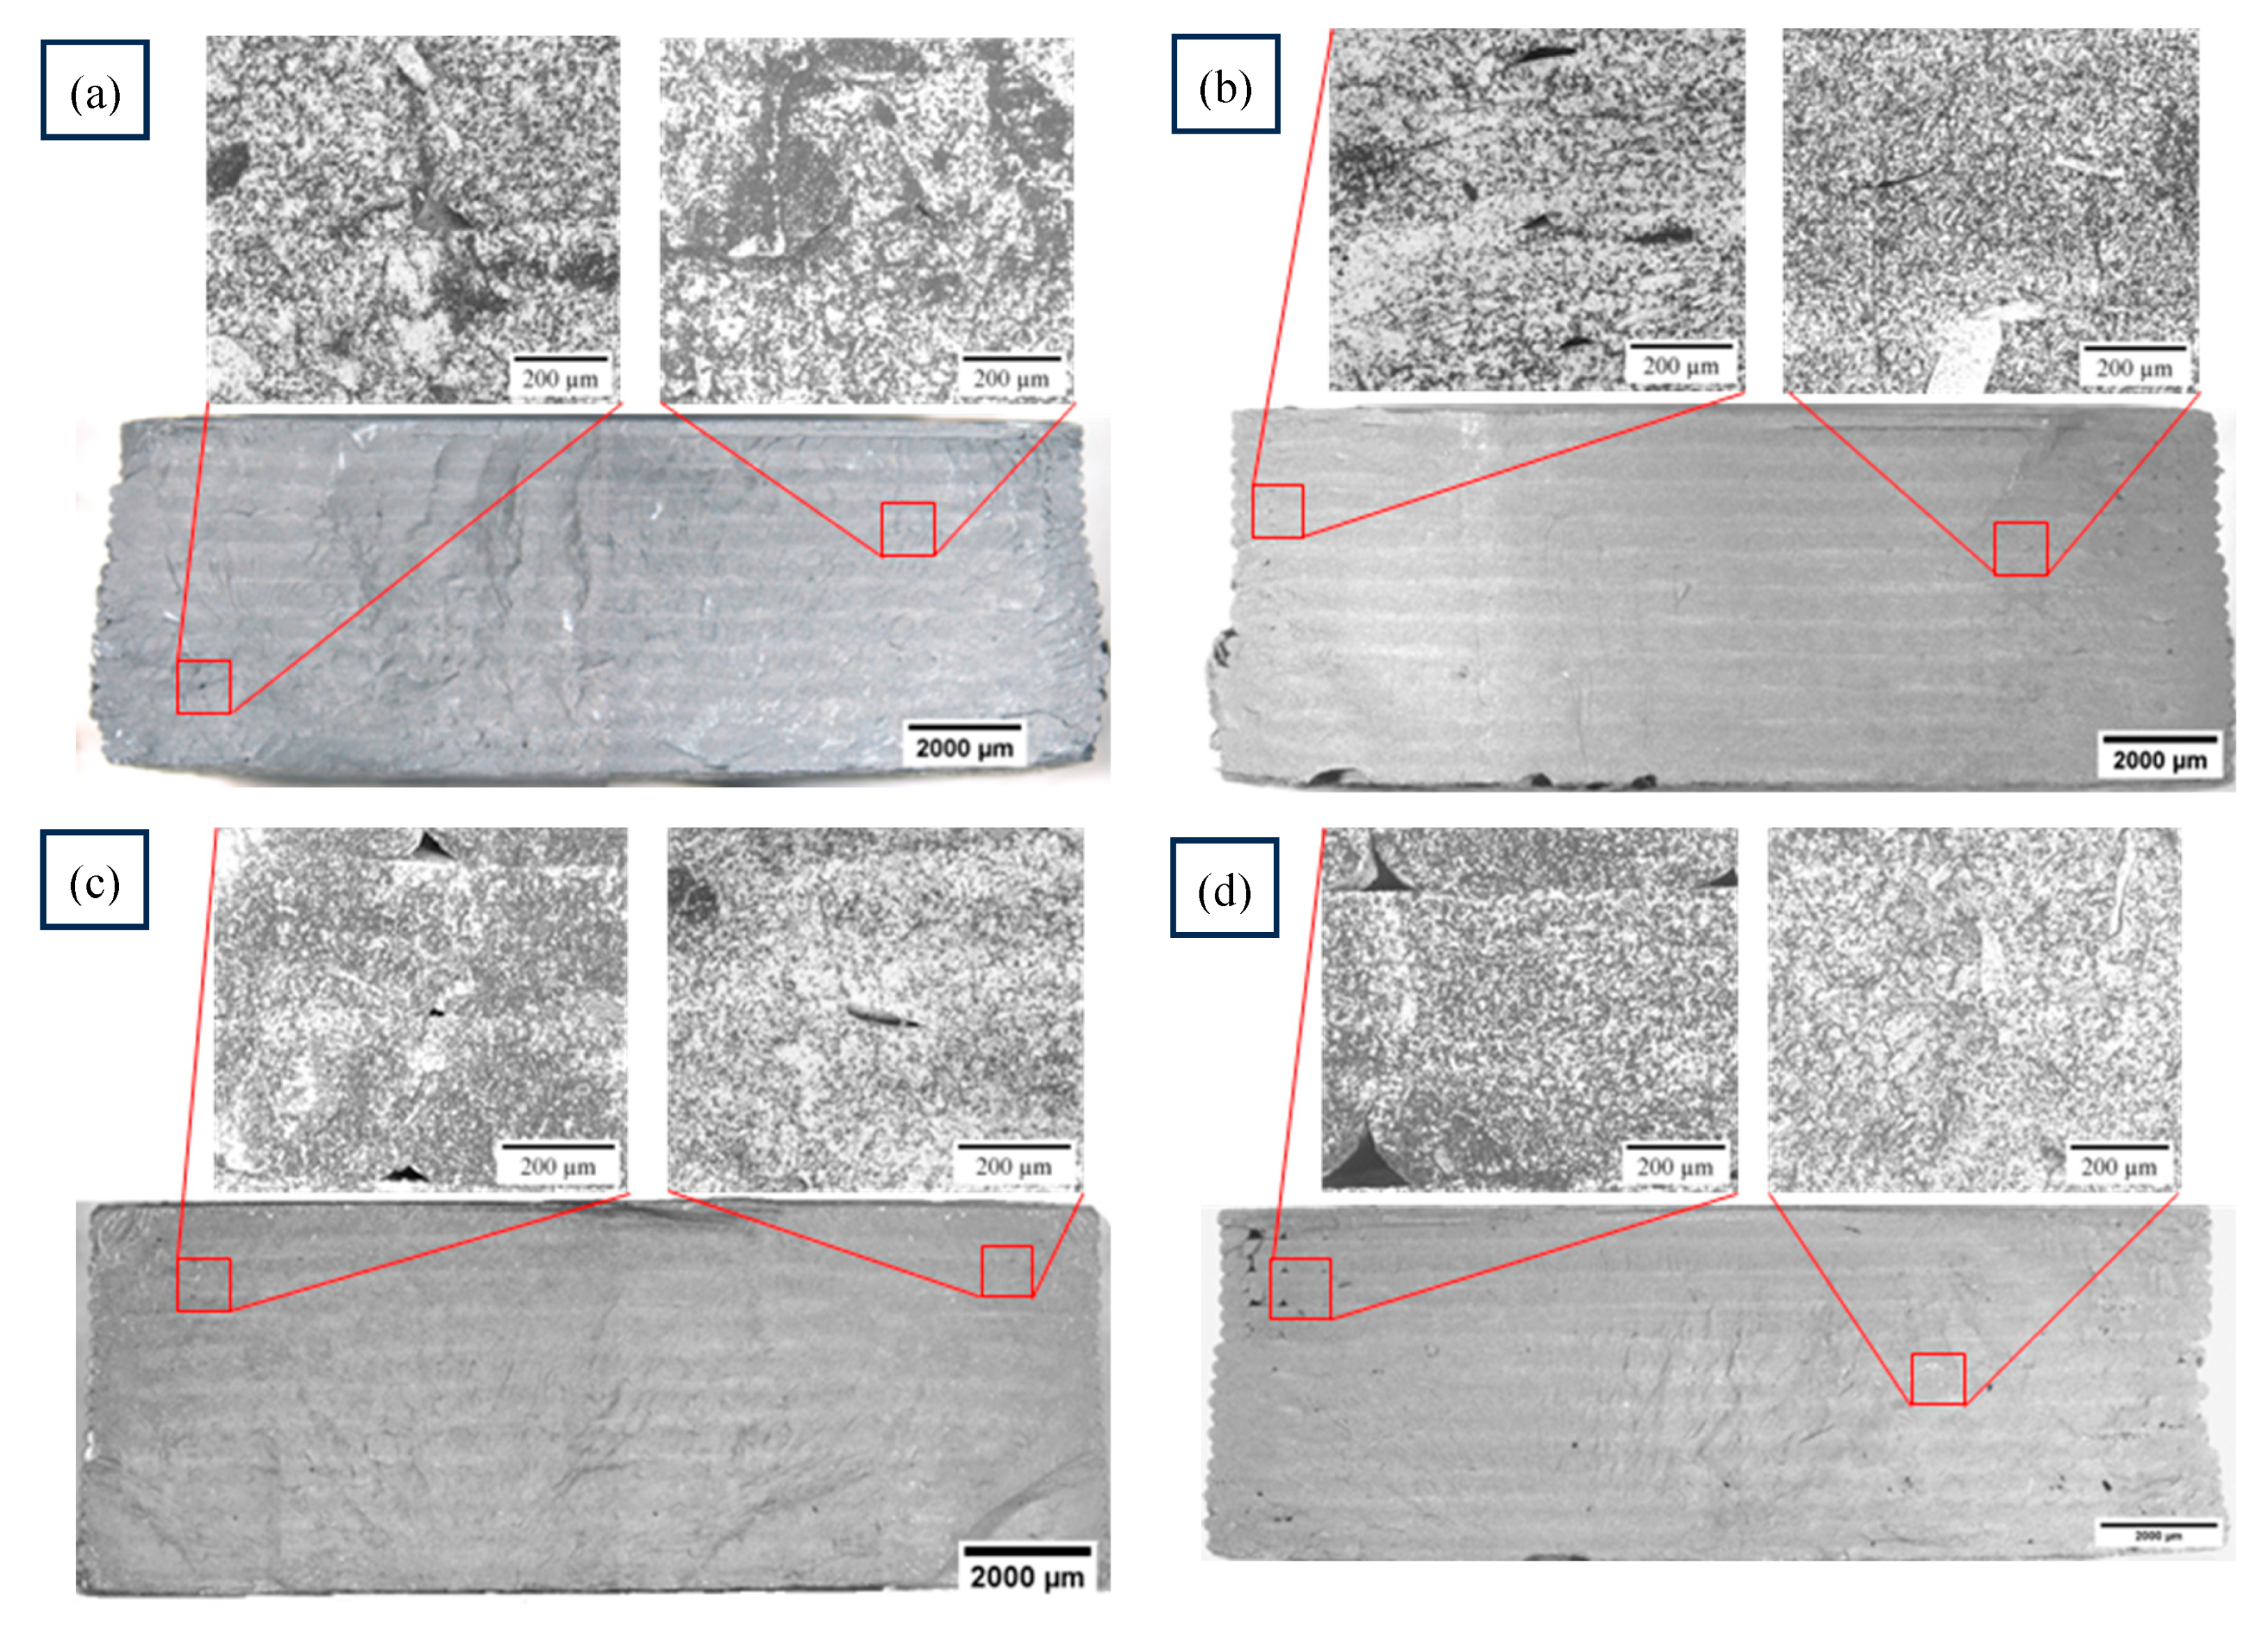
3.5. Samples Printed at 7.5
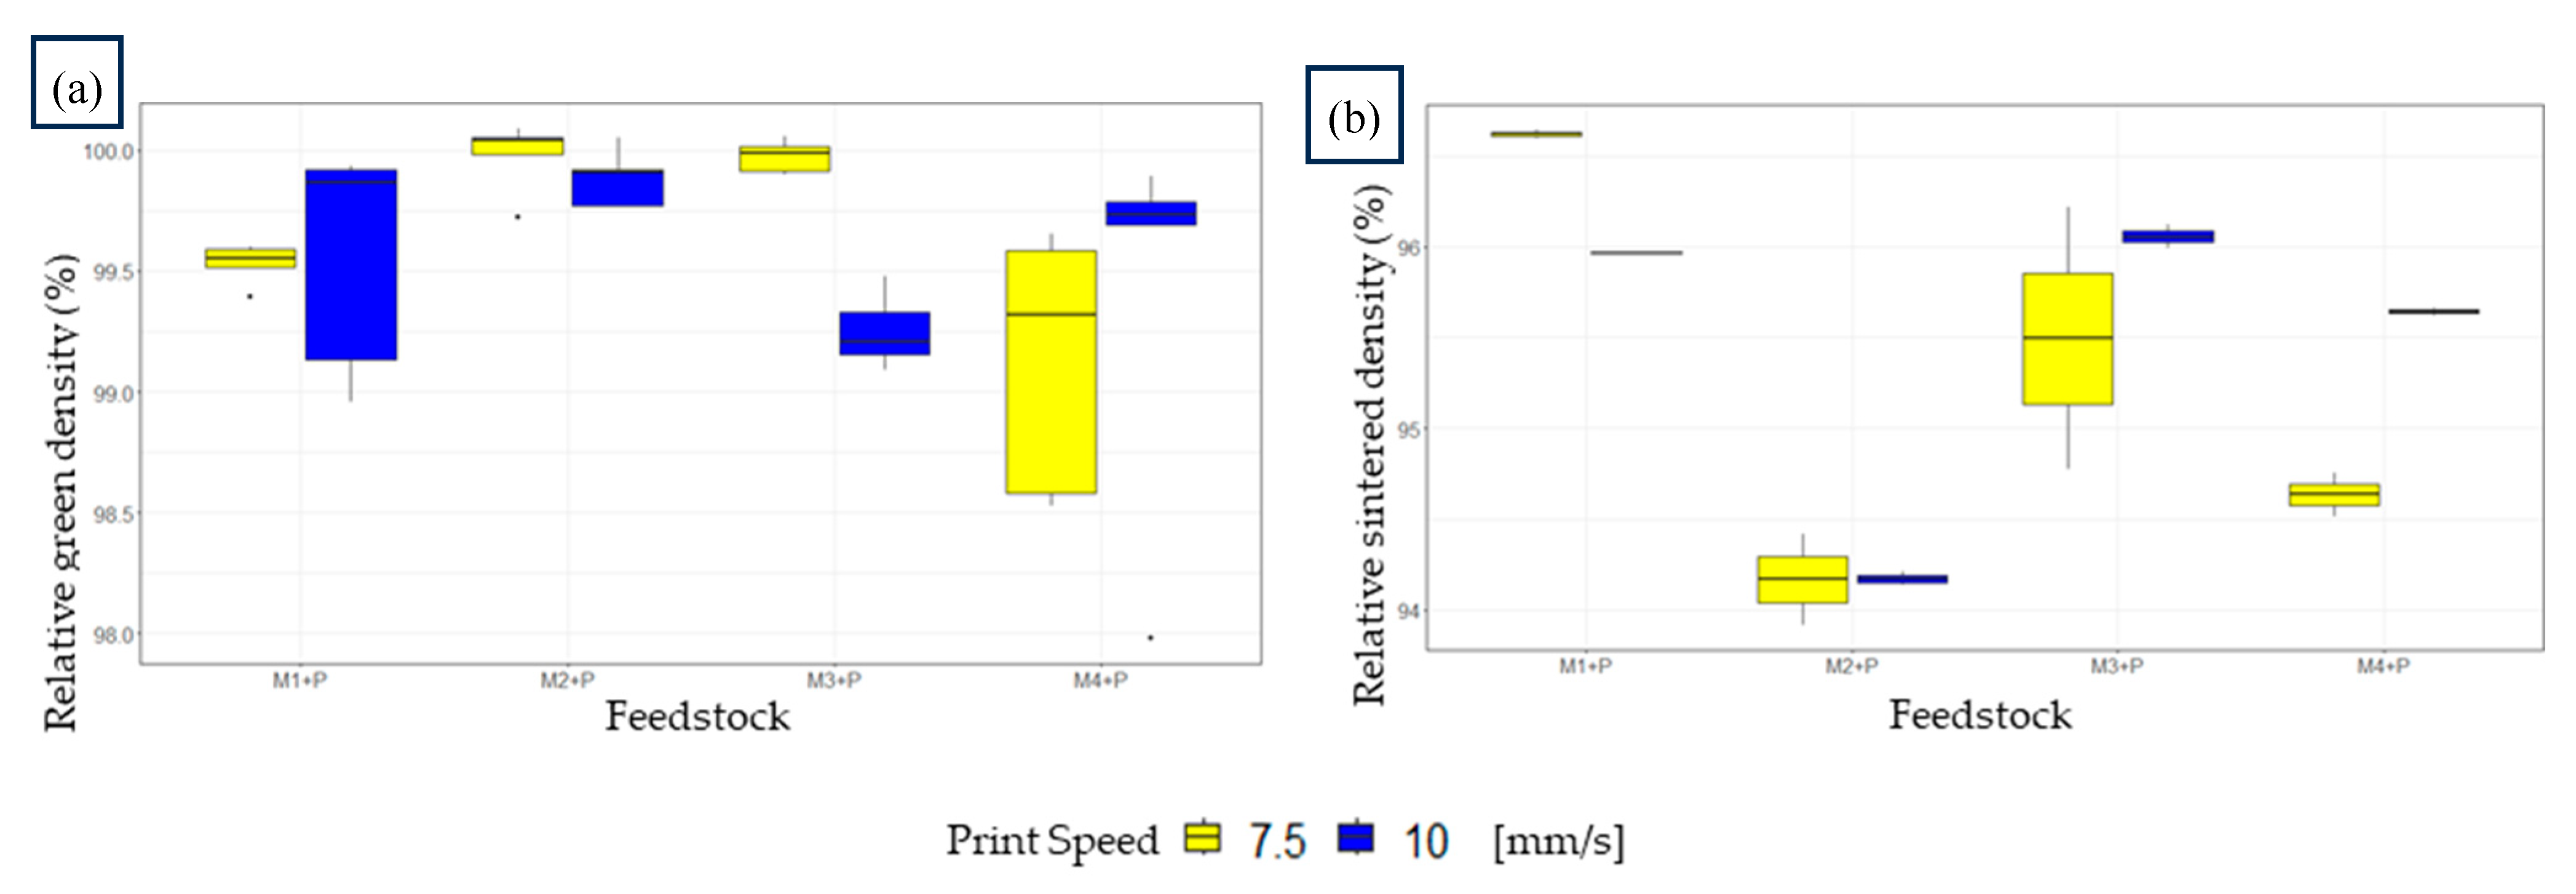
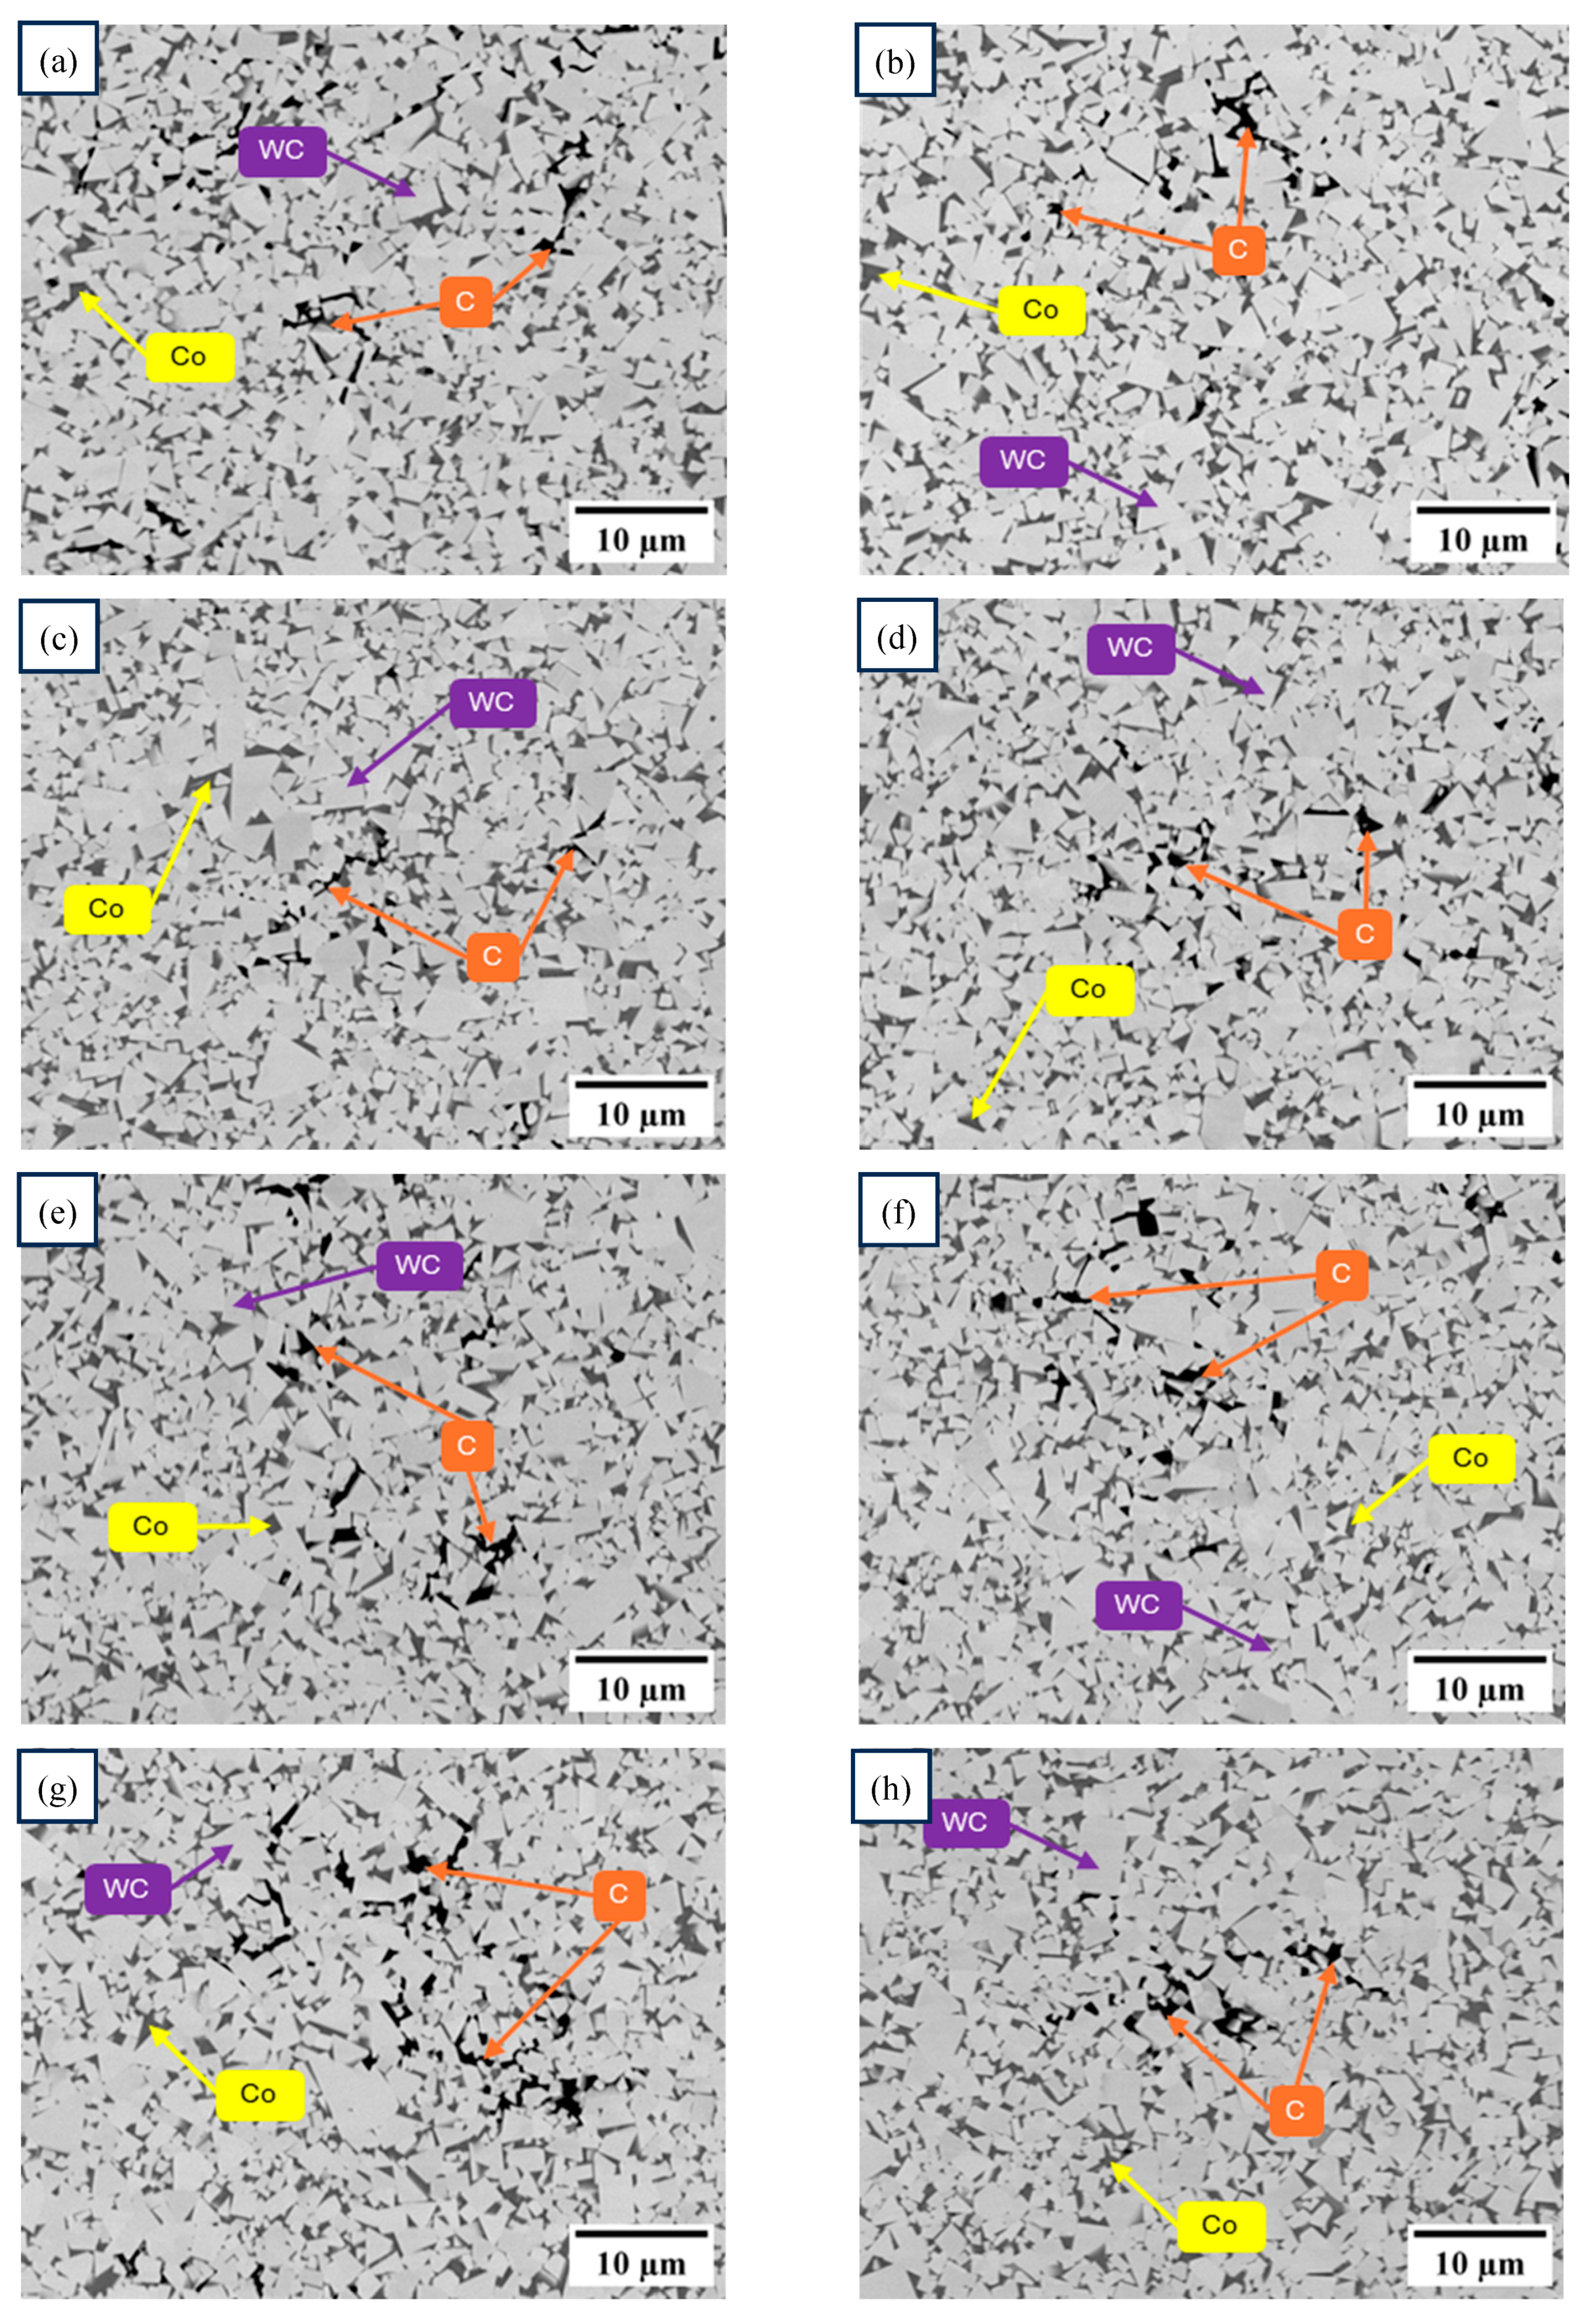
3.5. Sintered Samples.
5. Conclusions
Author Contributions
Funding
Conflicts of Interest
References
- Mahmoodan, M.; Aliakbarzadeh, H.; Gholamipour, R. Sintering of WC-10%Co Nano Powders Containing TaC and VC Grain Growth Inhibitors. Trans. Nonferrous Met. Soc. China (English Ed. 2011, 21, 1080–1084. [Google Scholar] [CrossRef]
- Farag, S.; Konyashin, I.; Ries, B. The Influence of Grain Growth Inhibitors on the Microstructure and Properties of Submicron, Ultrafine and Nano-Structured Hardmetals – A Review. Int. J. Refract. Met. Hard Mater. 2018, 77, 12–30. [Google Scholar] [CrossRef]
- Rubiano Buitrago, J.D.; Gil Plazas, A.F.; Herrera Quintero, L.K. Influence of TiC and Cr3C2 Additions on the Mechanical Properties of a (W-Ti-Cr)C-Co Sintered Hardmetal. J. Mater. Res. Technol. 2019, 8. [Google Scholar] [CrossRef]
- Upadhyaya, G.S. Classification and Applications of Cemented Carbides. In Cemented Tungsten Carbides; William Andrew Publishing: Westwood, NJ, 1998; ISBN 978-0-8155-1417-6. [Google Scholar]
- Quinlan, H.E.; Hasan, T.; Jaddou, J.; Hart, A.J. Industrial and Consumer Uses of Additive Manufacturing: A Discussion of Capabilities, Trajectories, and Challenges. J. Ind. Ecol. 2017, 21, S15–S20. [Google Scholar] [CrossRef]
- Xiong, Y.; Smugeresky, J.E.; Schoenung, J.M. The Influence of Working Distance on Laser Deposited WC-Co. J. Mater. Process. Technol. 2009, 209, 4935–4941. [Google Scholar] [CrossRef]
- Li, Y.; Bai, P.; Wang, Y.; Hu, J.; Guo, Z. Effect of Ni Contents on the Microstructure and Mechanical Properties of TiC-Ni Cermets Obtained by Direct Laser Fabrication. Int. J. Refract. Met. Hard Mater. 2009, 27, 552–555. [Google Scholar] [CrossRef]
- Zong, G.; Wu, Y.; Tran, N.; Lee, I.; Bourell, D.L.; Beaman, J.J.; Marcus, H.L. Direct Selective Laser Sintering of High Temperature Materials. Proc. Solid Free. Fabr. Symp. 1992, 72–85. [Google Scholar]
- Kumar, S.; Czekanski, A. Optimization of Parameters for SLS of WC-Co. Rapid Prototyp. J. 2017, 23, 1202–1211. [Google Scholar] [CrossRef]
- Uhlmann, E.; Bergmann, A.; Bolz, R.; Gridin, W. Application of Additive Manufactured Tungsten Carbide Tool Electrodes in EDM. Procedia CIRP 2018, 68, 86–90. [Google Scholar] [CrossRef]
- Vaezi, M.; Drescher, P.; Seitz, H. Beamless Metal Additive Manufacturing. Materials (Basel). 2020, 13. [Google Scholar] [CrossRef]
- Gonzalez-Gutierrez, J.; Cano, S.; Schuschnigg, S.; Kukla, C.; Sapkota, J.; Holzer, C. Additive Manufacturing of Metallic and Ceramic Components by the Material Extrusion of Highly-Filled Polymers: A Review and Future Perspectives. Materials (Basel). 2018, 11. [Google Scholar] [CrossRef]
- Aramian, A.; Razavi, S.M.J.; Sadeghian, Z.; Berto, F. A Review of Additive Manufacturing of Cermets. Addit. Manuf. 2020, 33, 101130. [Google Scholar] [CrossRef]
- Leary, M. Directed Energy Deposition; 2020; ISBN 9780128167212.
- S. Scott APPARATUS AND METHOD FOR CREATING THREE-DIMENSIONAL OBJECTS. Bunseki Kagaku 1992, 28, 195–196. [Google Scholar]
- Sells, E.; Bailard, S.; Smith, Z.; Bowyer, A.; Olliver, V. RepRap: The Replicating Rapid Prototyper: Maximizing Customizability by Breeding the Means of Production. Handb. Res. Mass Cust. Pers. 2009, 568–580. [Google Scholar] [CrossRef]
- Kukla, C.; Gonzalez-gutierrez, J.; Cano, S.; Hampel, S. Fused Filament Fabrication (FFF) of PIM Feedstocks. Proc. VI Congr. Nac. Pulvimetalurgia y I Congr. Iberoam. Pulvimetalurgia 2017. [Google Scholar]
- Suwanpreecha, C. A Review on Material Extrusion Additive Manufacturing of Metal and How It Compares with Metal Injection Moulding. 2022.
- Agarwala, M.K.; Bandyopadhyay, A.; Van Weeren, R. Fused Deposition of Ceramics (FDC) for Structural Silicon Nitride Components. Proc. Solid Free. Fabr. Symp. 1996, 336–344. [Google Scholar]
- Agarwala, M.K.; Weeren, R. Van; Bandyopadhyay, A.; Safari, A.; Danforth, S.C.; Priedeman, W.R. Filament Feed Materials for Fused Deposition Processing of Ceramics and Metals. In Proceedings of the Proceedings ofthe Solid Freeform Fabrication Symposium; pp. 1996451–458.
- Venkataraman, N.; Rangarajan, S.; Matthewson, M.J.; Harper, B.; Safari, A.; Danforth, S.C.; Wu, G.; Langrana, N.; Guceri, S.; Yardimci, A. Feedstock Material Property - Process Relationships in Fused Deposition of Ceramics (FDC). Rapid Prototyp. J. 2000, 6, 244–252. [Google Scholar] [CrossRef]
- Hwang, K.S.; Lin, H.K.; Lee, S.C. Thermal, Solvent, and Vacuum Debinding Mechanisms of PIM Compacts. Mater. Manuf. Process. 1997, 12, 593–608. [Google Scholar] [CrossRef]
- Kukla, C.; Cano, S.; Kaylani, D.; Schuschnigg, S.; Holzer, C.; Gonzalez-Gutierrez, J. Debinding Behaviour of Feedstock for Material Extrusion Additive Manufacturing of Zirconia. Powder Metall. 2019, 62, 196–204. [Google Scholar] [CrossRef]
- Elkins, K.; Nordby, H.; Janak, C.; Gray, R.W.; Bohn, J.H.; Baird, D.G. Soft Elastomers for Fused Deposition Modeling. In Proceedings of the Solid Freeform Fabrication Proceedings, September 1997; 1997; pp. 441–448. [Google Scholar]
- Gil-Plazas, A.-F. , Rubiano-Buitrago, J.-D., Boyacá-Mendivelso, L.-A., & Herrera-Quintero, L.-K. Solid-State and Super Solidus Liquid Phase Sintering of 4340 Steel SLM Powders Shaped by Fused Filament Fabrication. Rev. Fac. Ing. 2022, 31, e13913. [Google Scholar] [CrossRef]
- Godec, D.; Cano, S.; Holzer, C.; Gonzalez-Gutierrez, J. Optimization of the 3D Printing Parameters for Tensile Properties of Specimens Produced by Fused Filament Fabrication of 17-4PH Stainless Steel. Materials (Basel). 2020, 13. [Google Scholar] [CrossRef]
- Coelho, S.; Magro, A.; Texeira, P.; Ferreira, N.; Pereira, P.; Rodrigues, F.; Jorge, H.; Sacramento, J. Development of Formulations of WC-Co Filament for Fused Filament Fabrication.; 2020.
- Cano, S.; Gonzalez-Gutierrez, J.; Sapkota, J.; Spoerk, M.; Arbeiter, F.; Schuschnigg, S.; Holzer, C.; Kukla, C. Additive Manufacturing of Zirconia Parts by Fused Filament Fabrication and Solvent Debinding: Selection of Binder Formulation. Addit. Manuf. 2019, 26, 117–128. [Google Scholar] [CrossRef]
- McNulty, T.F.; Mohammadi, F.; Bandyopadhyay, A.; Shanefield, D.J.; Danforth, S.C.; Safari, A. Development of a Binder Formulation for Fused Deposition of Ceramics. Rapid Prototyp. J. 1998, 4, 144–150. [Google Scholar] [CrossRef]
- Cano, S.; Gooneie, A.; Kukla, C.; Rieb, G.; Holzer, C.; Gonzalez-Gutierrez, J. Modification of Interfacial Interactions in Ceramic-Polymer Nanocomposites by Grafting: Morphology and Properties for Powder Injection Molding and Additive Manufacturing. Appl. Sci. 2020, 10. [Google Scholar] [CrossRef]
- Momeni, V.; Shahroodi, Z.; Gonzalez-Gutierrez, J.; Hentschel, L.; Duretek, I.; Schuschnigg, S.; Kukla, C.; Holzer, C. Effects of Different Polypropylene (PP)-Backbones in Aluminium Feedstock for Fused Filament Fabrication (FFF). Polymers (Basel). 2023, 15. [Google Scholar] [CrossRef]
- Lengauer, W.; Duretek, I.; Fürst, M.; Schwarz, V.; Gonzalez-Gutierrez, J.; Schuschnigg, S.; Kukla, C.; Kitzmantel, M.; Neubauer, E.; Lieberwirth, C.; et al. Fabrication and Properties of Extrusion-Based 3D-Printed Hardmetal and Cermet Components. Int. J. Refract. Met. Hard Mater. 2019, 82, 141–149. [Google Scholar] [CrossRef]
- Mukesh K., Agarwala; Vikram R., Jamalabad; Noshir, A. Langrana; Ahmad Safari; Philip J. Whalen and; Stephen C. Danforth Structural Quality of Parts Processed by Fused Deposition. Rapid Prototyp. J. 1996, 2, 4–19. [Google Scholar]
- Agarwala, M.K.; Weeren, R. Van; Bandyopadhyayl, A.; Whalen, P.J.; Safari, A.; Danforth, S.C. Fused Deposition of Ceramics and Metals : An Overview. In Proceedings of the Proceedings of Solid Freeform Fabrication Symposium; pp. 1996385–392.
- Fayyaz, A.; Muhamad, N.; Sulong, A.B.; Yunn, H.S.; Amin, S.Y.M.; Rajabi, J. Micro-Powder Injection Molding of Cemented Tungsten Carbide: Feedstock Preparation and Properties. Ceram. Int. 2015, 41, 3605–3612. [Google Scholar] [CrossRef]
- Yang, M.J.; German, R.M. Nanophase and Superfine Cemented Carbides Processed by Powder Injection Molding. Int. J. Refract. Met. Hard Mater. 1998, 16, 107–117. [Google Scholar] [CrossRef]
- Percoco, G.; Arleo, L.; Stano, G.; Bottiglione, F. Analytical Model to Predict the Extrusion Force as a Function of the Layer Height, in Extrusion Based 3D Printing. Addit. Manuf. 2021, 38, 101791. [Google Scholar] [CrossRef]
- Mbow, M.M.; Marin, P.R.; Pourroy, F. Extruded Diameter Dependence on Temperature and Velocity in the Fused Deposition Modeling Process. Prog. Addit. Manuf. 2020, 5, 139–152. [Google Scholar] [CrossRef]
- Tarani, E.; Arvanitidis, I.; Christofilos, D.; Bikiaris, D.N.; Chrissafis, K.; Vourlias, G. Calculation of the Degree of Crystallinity of HDPE/GNPs Nanocomposites by Using Various Experimental Techniques: A Comparative Study. J. Mater. Sci. 2023, 58, 1621–1639. [Google Scholar] [CrossRef]
- Wunderlich, B. Thermal Analysis of Polymeric Materials; Springer-Verlag: Berlin/Heidelberg, 2005; ISBN 3-540-23629-5. [Google Scholar]
- Gonzalez-Gutierrez, J.; Duretek, I.; Kukla, C.; Poljšak, A.; Bek, M.; Emri, I.; Holzer, C. Models to Predict the Viscosity of Metal Injection Molding Feedstock Materials as Function of Their Formulation. Metals (Basel). 2016, 6. [Google Scholar] [CrossRef]
- Singh, P.; Balla, V.K.; Tofangchi, A.; Atre, S. V.; Kate, K.H. Printability Studies of Ti-6Al-4V by Metal Fused Filament Fabrication (MF3). Int. J. Refract. Met. Hard Mater. 2020, 91, 105249. [Google Scholar] [CrossRef]
- Ghasemi-Mobarakeh, L.; Cano, S.; Momeni, V.; Liu, D.; Duretek, I.; Riess, G.; Kukla, C.; Holzer, C. Effect of Increased Powder–Binder Adhesion by Backbone Grafting on the Properties of Feedstocks for Ceramic Injection Molding. Polymers (Basel). 2022, 14. [Google Scholar] [CrossRef] [PubMed]
- German, R.M.; Suri, P.; Park, S.J. Review: Liquid Phase Sintering. J. Mater. Sci. 2009, 44, 1–39. [Google Scholar] [CrossRef]
- García, J.; Collado Ciprés, V.; Blomqvist, A.; Kaplan, B. Cemented Carbide Microstructures: A Review. Int. J. Refract. Met. Hard Mater. 2019, 80, 40–68. [Google Scholar] [CrossRef]
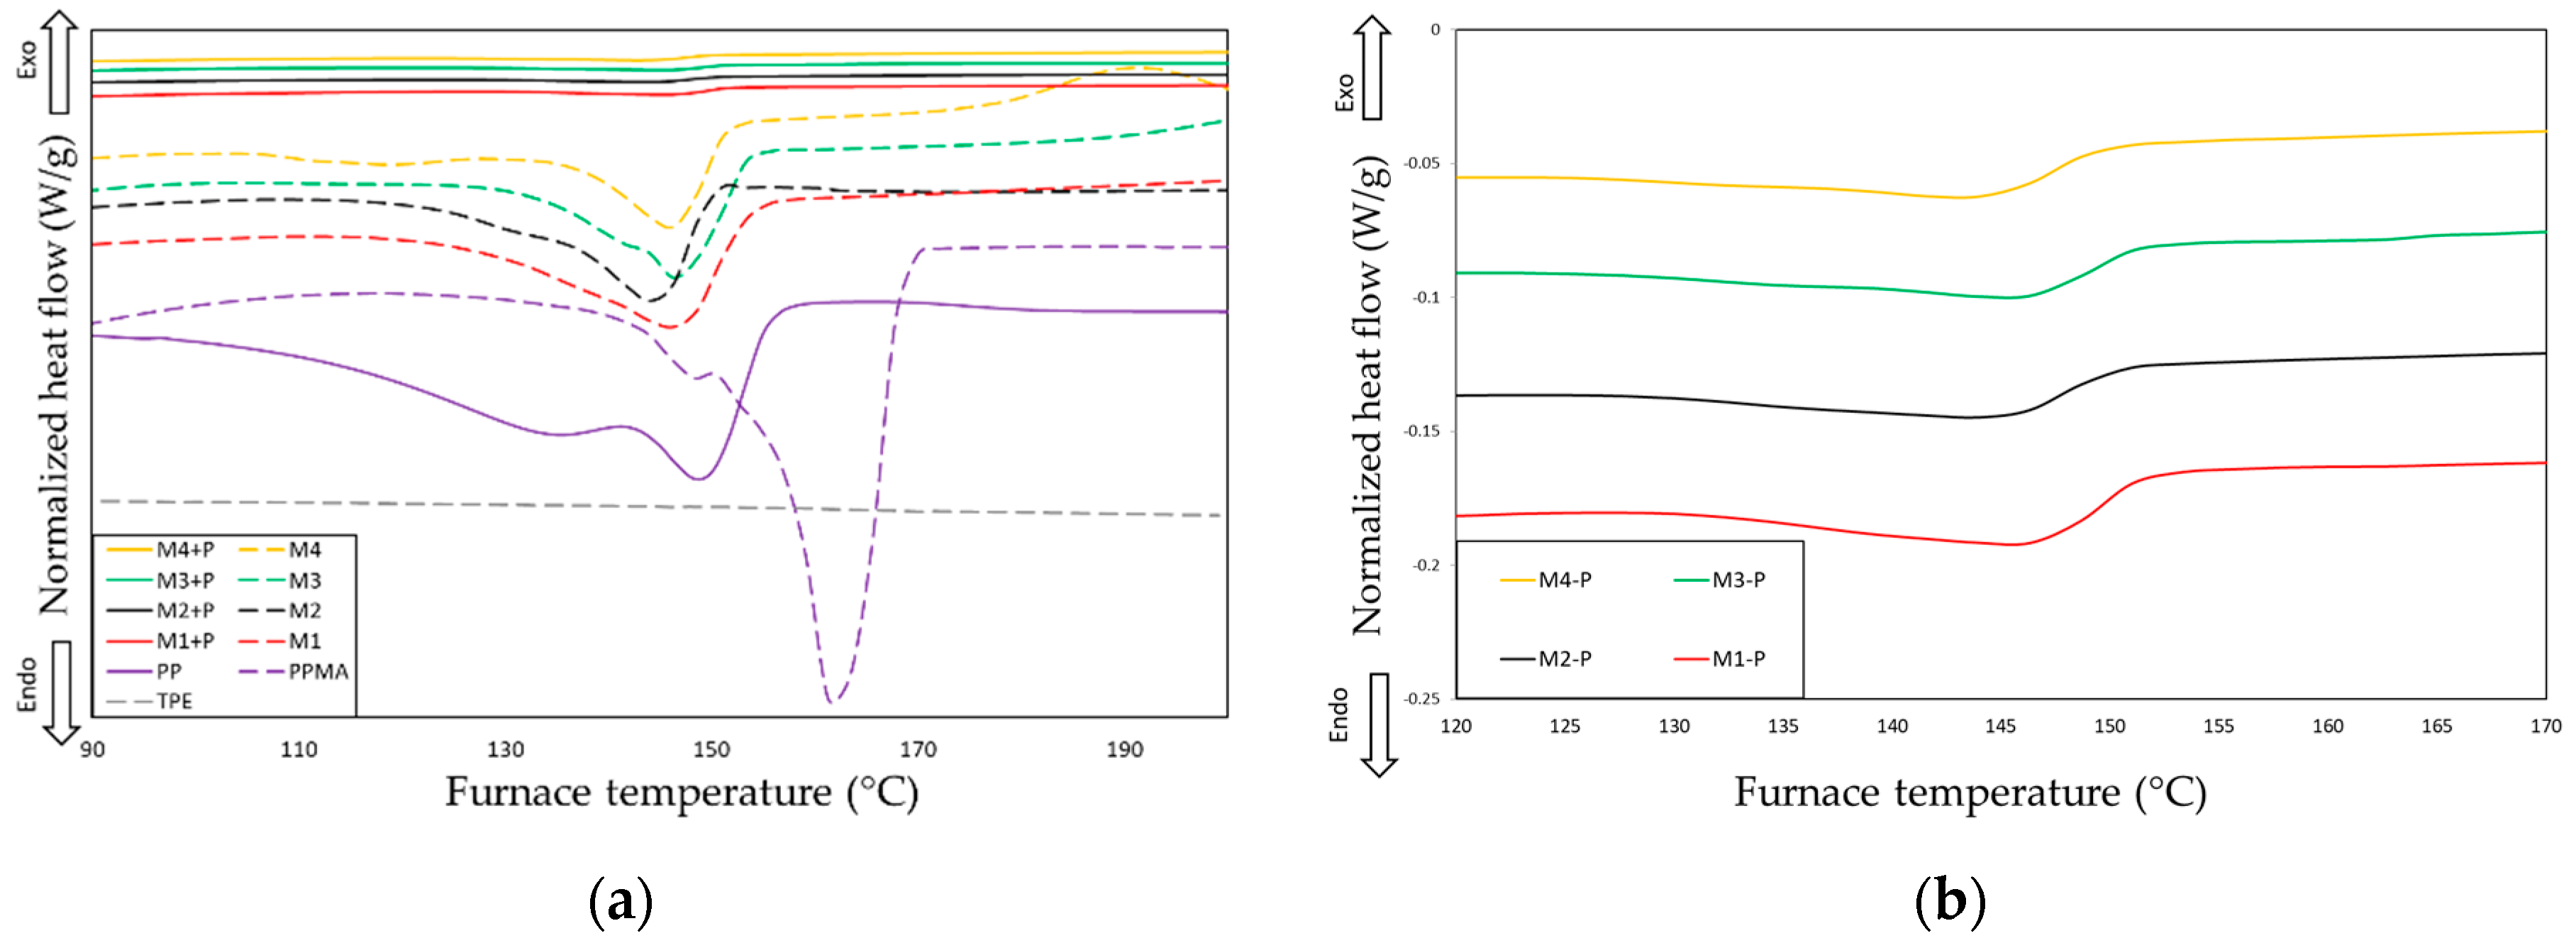
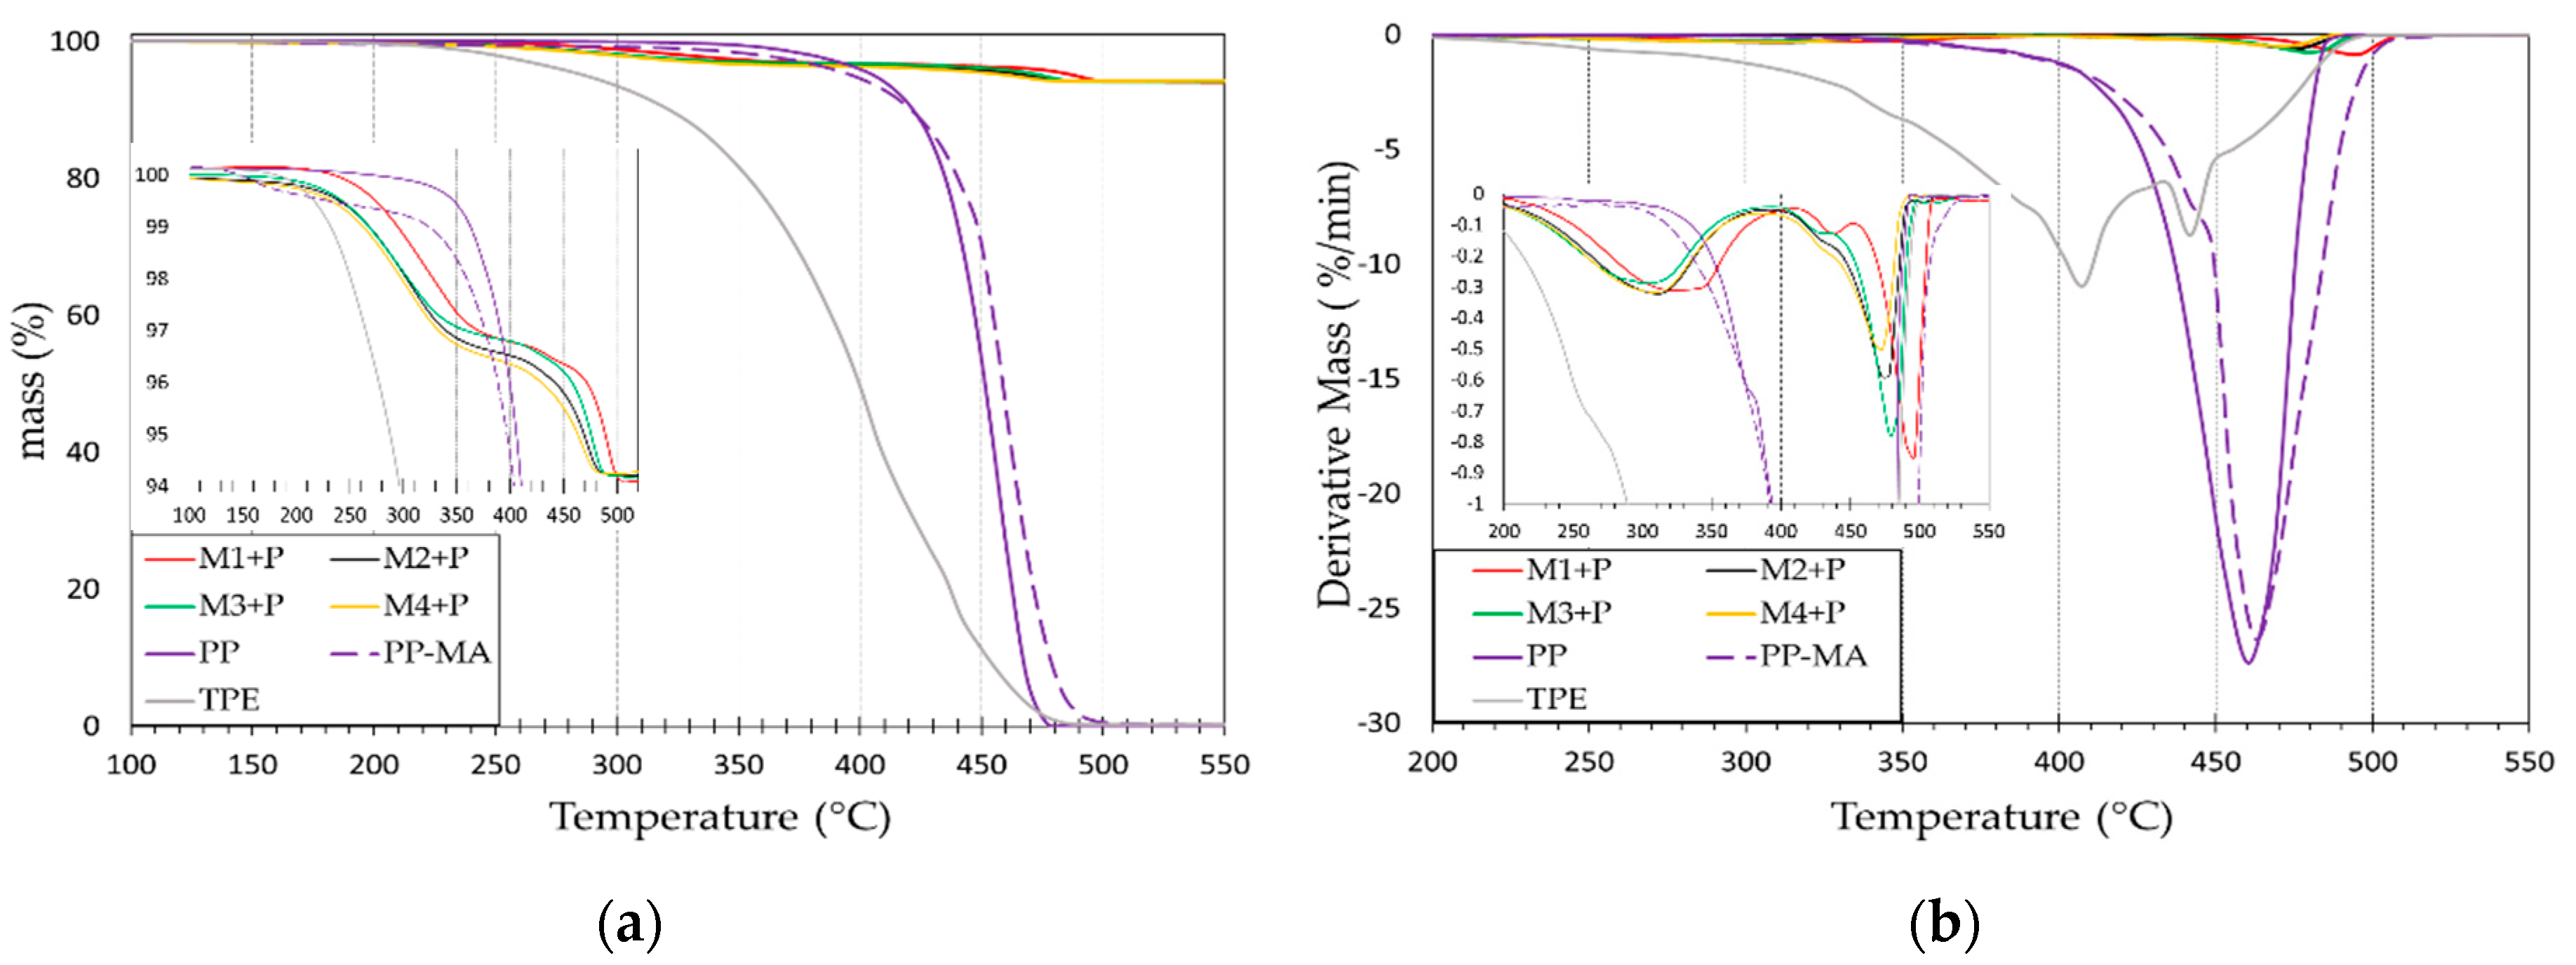
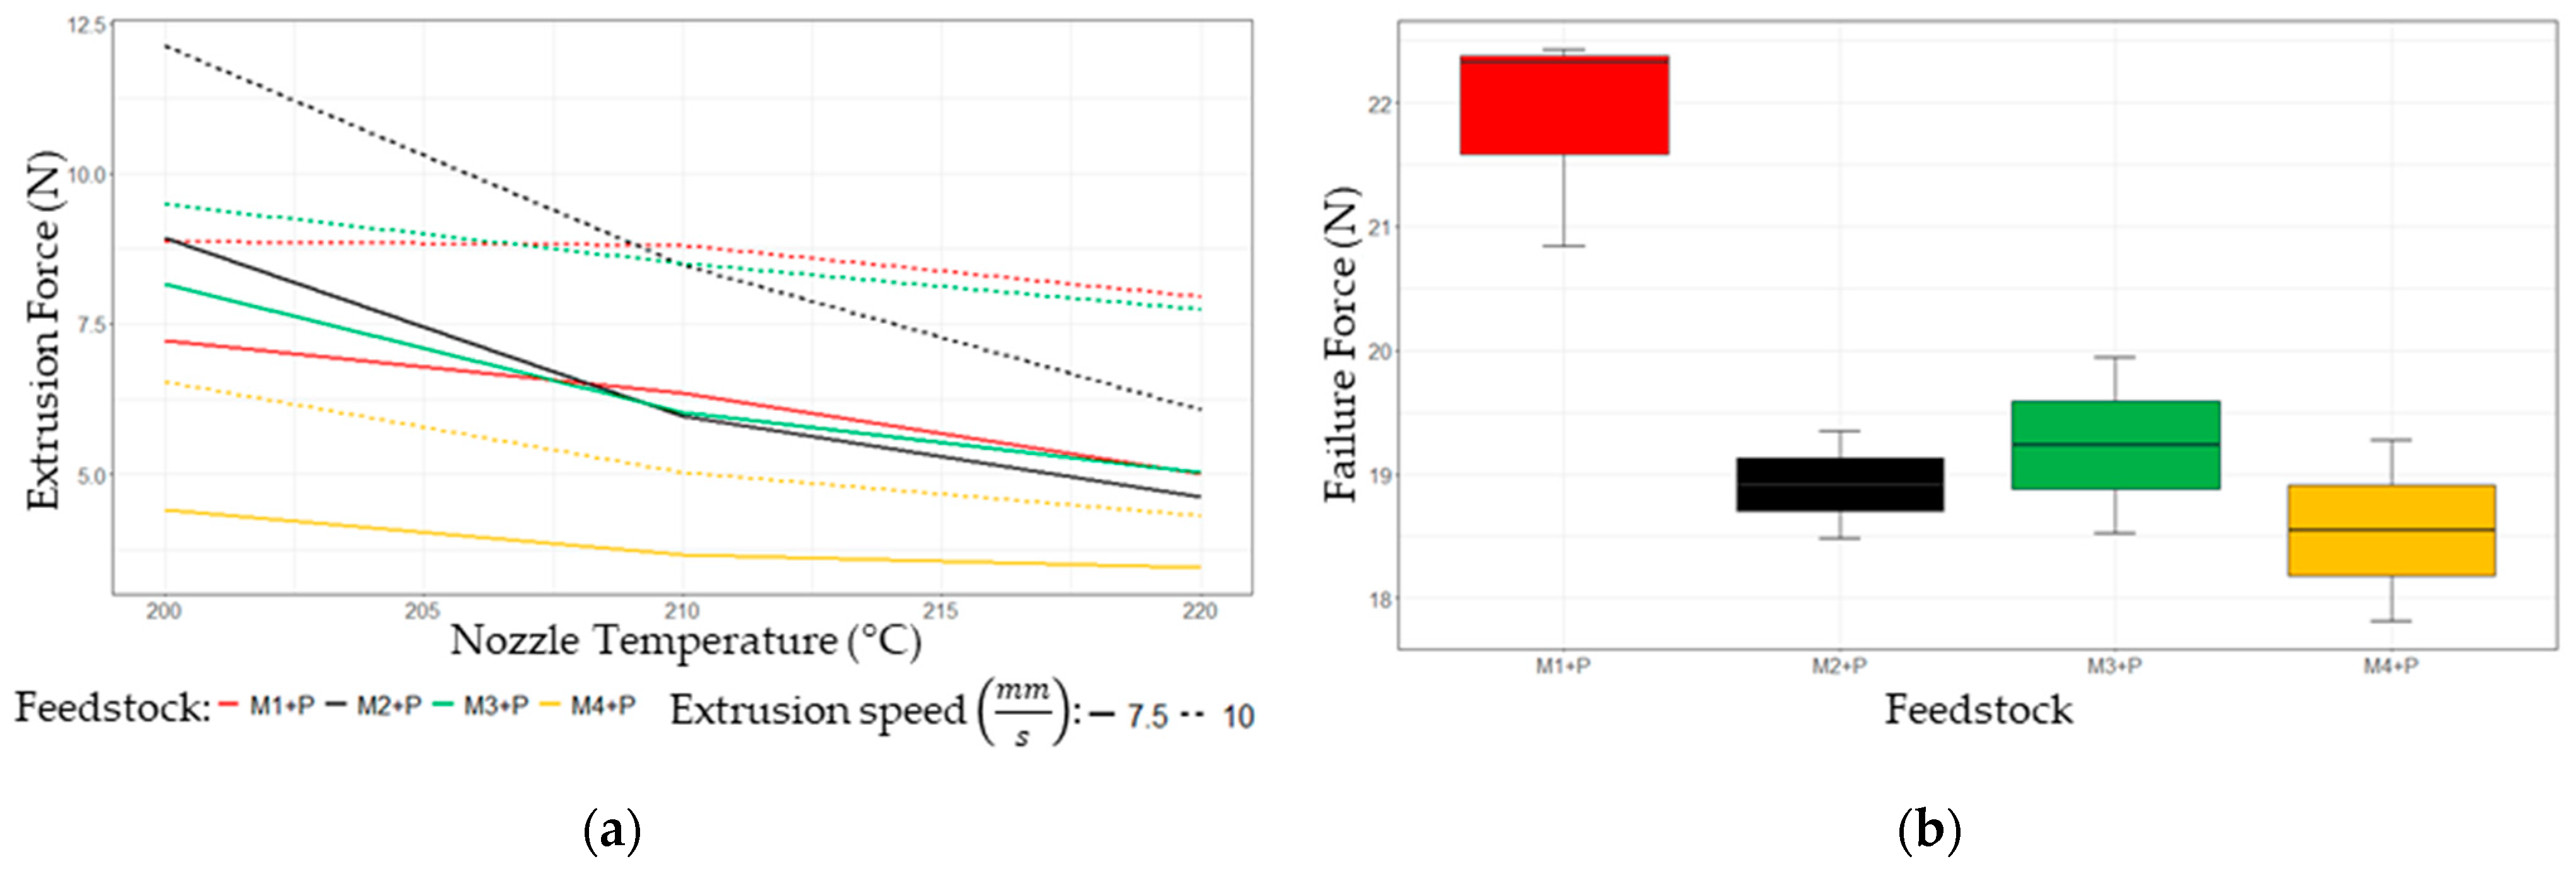
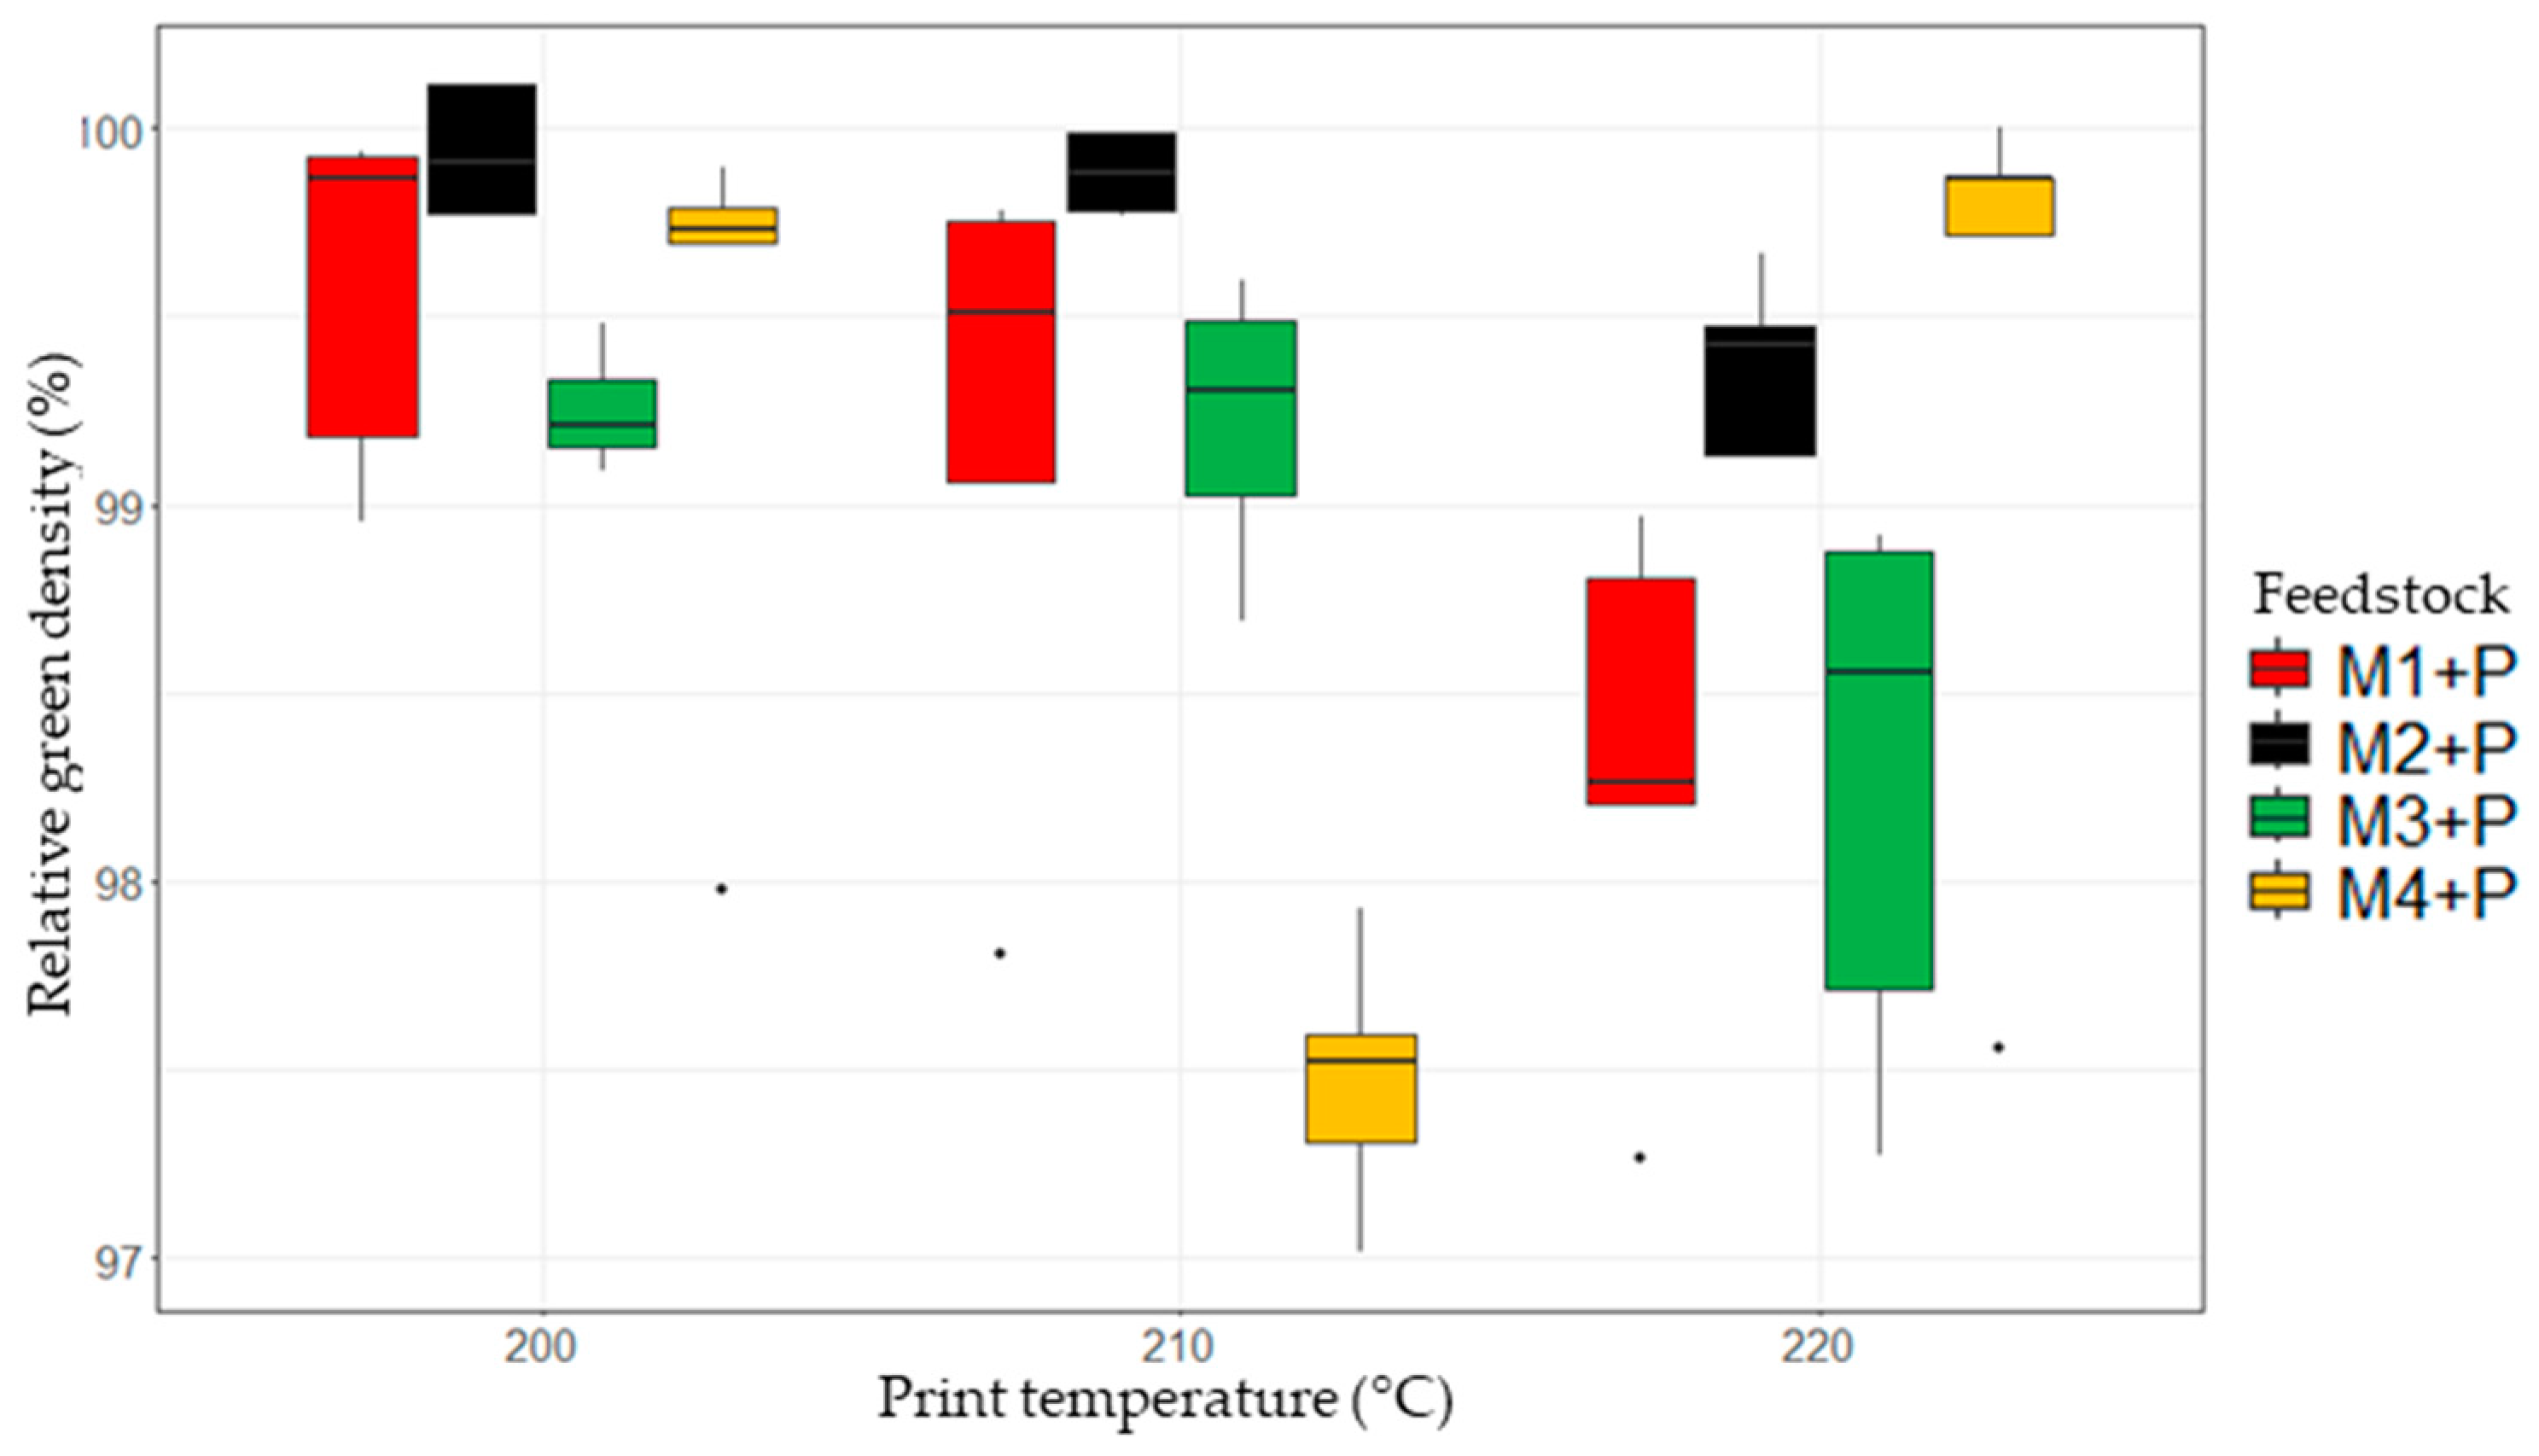


| Binder | PP-MA | PP | TPE | PW | SA |
|---|---|---|---|---|---|
| %wt. | %wt. | %wt. | %wt. | %wt. | |
| M1 | 18.62 | 12.42 | 46.56 | 18,00 | 4.40 |
| M2 | 15.60 | 10.40 | 51.60 | 18.00 | 4.40 |
| M3 | 12.42 | 18.62 | 46.56 | 18.00 | 4.40 |
| M4 | 10.40 | 15.60 | 51.60 | 18.00 | 4.40 |
| Infill Pattern | Number of External Lines |
Infill Overlap | Retraction | Bed Temperature | Cooling fan |
| Lines | 1 | 50% | No | 95 °C | Off |
| Description | T onset | T endset | |||
|---|---|---|---|---|---|
| PP | 148.59 | 133.5 | 155.7 | 91.03 | 43.98% |
| PP-MA | 161.05 | 153.7 | 168.5 | 105.18 | 50.81% |
| TPE | - | - | - | ||
| M1 | 145.93 | 123.76 | 153.54 | 41.19 | 54.32% |
| M1+P | 145.63 | 128.18 | 151.51 | 1.72 | 43.20% |
| M2 | 144.22 | 130.40 | 149.86 | 29.33 | 46.24% |
| M2+P | 144.43 | 123.42 | 150.32 | 1.04 | 31.20% |
| M3 | 145.76 | 135.56 | 153.74 | 32.46 | 45.25% |
| M3+P | 145.69 | 125.76 | 151.48 | 0.88 | 22.07% |
| M4 | 146.06 | 133.25 | 151.68 | 18.23 | 28.76% |
| M4+P | 143.59 | 126.31 | 149.55 | 0.83 | 24.77% |
| Source of Variation | Degrees of Freedom |
Sum Sq | Mean Sq | P Value |
|---|---|---|---|---|
| Temperature | 2 | 5.88 | 8.78 | 5.65e-4 |
| Feedstock | 3 | 8.38 | 8.33 | 1.46e-4 |
| Temperature: Feedstock | 6 | 15.18 | 7.55 | 9.89e-6 |
| Residuals | 48 | 16.09 |
| Source of Variation | Degrees of Freedom |
Sum Sq | Mean Sq | P Value |
|---|---|---|---|---|
| Velocity | 1 | 0.156 | 0.1563 | 0.32372 |
| Feedstock | 3 | 2.183 | 0.7277 | 0.00806 |
| Velocity: Feedstock | 3 | 1.372 | 0.4572 | 0.04800 |
| Residuals | 32 | 4.978 | 0.1556 |
| Source of Variation | Degrees of Freedom |
Sum Sq | Mean Sq | P Value |
|---|---|---|---|---|
| Velocity | 1 | 17672 | 3.782 | 0.0696 |
| Feedstock | 3 | 47619 | 10.192 | 0.0005 |
| Velocity: Feedstock | 3 | 5685 | 1.217 | 0.3358 |
| Residuals | 16 | 4672 |
Disclaimer/Publisher’s Note: The statements, opinions and data contained in all publications are solely those of the individual author(s) and contributor(s) and not of MDPI and/or the editor(s). MDPI and/or the editor(s) disclaim responsibility for any injury to people or property resulting from any ideas, methods, instructions or products referred to in the content. |
© 2024 by the authors. Licensee MDPI, Basel, Switzerland. This article is an open access article distributed under the terms and conditions of the Creative Commons Attribution (CC BY) license (http://creativecommons.org/licenses/by/4.0/).


