1. Introduction
The gut microbiome is a diverse ecosystem that consists of bacteria, archaea, eukaryotes, fungi, and viruses that live in the host’s digestive tract [
1,
2,
3]. Microorganisms residing in the digestive tract comprise a micro-ecosystem displaying established principles of ecosystem dynamics [
4]. Like any ecosystem, gut microbes both compete and cooperate for limited resources [
5]. Dietary macronutrients [
6,
7,
8] and micronutrients [
9] can rapidly change the gut microbial composition. Non-digestible complex carbohydrates and types of fermentable fiber, for example, are dietary substrates selectively utilized by host microorganisms that can rapidly alter the gut microbiome and the fecal metabolome and positively impact host health. In 2017, the International Scientific Association for Dietary Probiotics and Prebiotics released a consensus report defining prebiotics as substrates selectively utilized by host microorganisms conferring health benefits [
10]. The complex changing dynamics in gut microbial composition after introducing dietary prebiotics have seldom been examined because doing so requires repeated sampling across time and costly sequencing of large numbers of samples.
Despite substantial evidence supporting the efficacy of prebiotics for promoting host health, there is a paucity of literature replicating prebiotic impacts on bacteria and bacterial-modified metabolites across time [
11,
12,
13,
14]. The failure to reproduce findings could be due, in part, to multiple bacterial taxonomy databases, ongoing taxonomic revisions, differences in sample storage, DNA extraction and sequencing, and analytic pipelines [
15,
16]. In addition, commonly overlooked are the influences of environmental factors on the gut microbiome, including geographic location and elevation [
17,
18,
19,
20], and animal source [
21,
22].
GOS and PDX increase the relative abundances of the bacterial species
Parabacteroides distasonis and
Clostridium leptum [
23,
24], decrease microbially modified secondary bile acids like deoxycholic and lithocholic acid [
23,
24,
25,
26], and reduce the adverse effects of stress exposure on host sleep physiology [
23,
24,
27,
28,
29,
30]. To make progress towards elucidating the mechanisms for the stress-protective impact on host sleep physiology [
23,
24,
29,
30,
31,
32,
33], the effects of prebiotics on the gut microbiota and metabolome must be sufficiently robust to resist any potential environmental and methodological influences.
Here, we present results from two dietary prebiotic animal studies conducted at Northwestern University (NW) in Evanston, Illinois, and the University of Colorado Boulder (CU) in Boulder, Colorado. The two sites have several environmental differences, including different research personnel, vivarium facilities, elevations (182 m vs. 1624 m), and animal sources (Envigo vs. Harlan). To reduce the impact of other factors, NW and CU adhered to standardized fecal sample collection and storage protocols, DNA extraction and sequencing, as well as untargeted LC-MS/MS metabolomics protocols.
The first goal of this project was to determine if consumption of the same dietary prebiotics tested at different universities, in different locations across the country, and at different times of the year, would produce similar dynamic changes in the gut microbial composition and microbial-modified bile acids. A second goal of the study was to explore the potential functional metabolic pathways and networks impacted by prebiotic diet. We hypothesize that the consumption of GOS/PDX by rats at NW and CU produces robust changes across time in the gut microbiome, fecal metabolome, functional metabolic pathways, and networks.
2. Materials and Methods
Male Sprague Dawley rats were tested. Female rats were not tested in these experiments because this study was supported by funding from the Office of Naval Research (ONR MURI N00014-15-1-2809), and ~80-90% of submariners are male, making males a priority for ONR’s limited funding. Some data presented here were included in previously published work from the more extensive ONR study, which demonstrated that diets enriched in prebiotics (galactooligosaccharides and polydextrose) facilitate host sleep/circadian recovery both during and after stressor exposure [
23,
24].
Northwestern (NW) Study
Animals (
N = 64, Envigo Laboratories, Madison, WI, USA) were singly housed in controlled temperature (23
+ 2
oC) and humidity. All protocols were approved by the Northwestern Institutional Animal Care and Use Committee as previously described [
23,
34]. Animals weighed 40-50 g upon arrival at postnatal day (PND) 23 and were maintained on a 12:12 h light/dark cycle. On arrival, all rats were housed in Nalgene Plexiglas cages and were placed on a control or prebiotic diet (ad libitum).
University of Colorado at Boulder (CU) Study
Animals (
N = 82, Harlan Laboratories, Indianapolis, IN, USA) were singly housed with controlled temperature (23
+ 2
oC) and humidity. All procedures were approved by the University of Colorado Boulder Institutional Animal Care and Use Committee as previously described [
24,
29,
30]. Briefly, animals weighed 40-50 g upon arrival at PND 23 and were maintained on a 12:12 h light/dark cycle. On arrival, all rats were housed in Nalgene Plexiglas cages and were placed on a control or prebiotic diet (ad libitum).
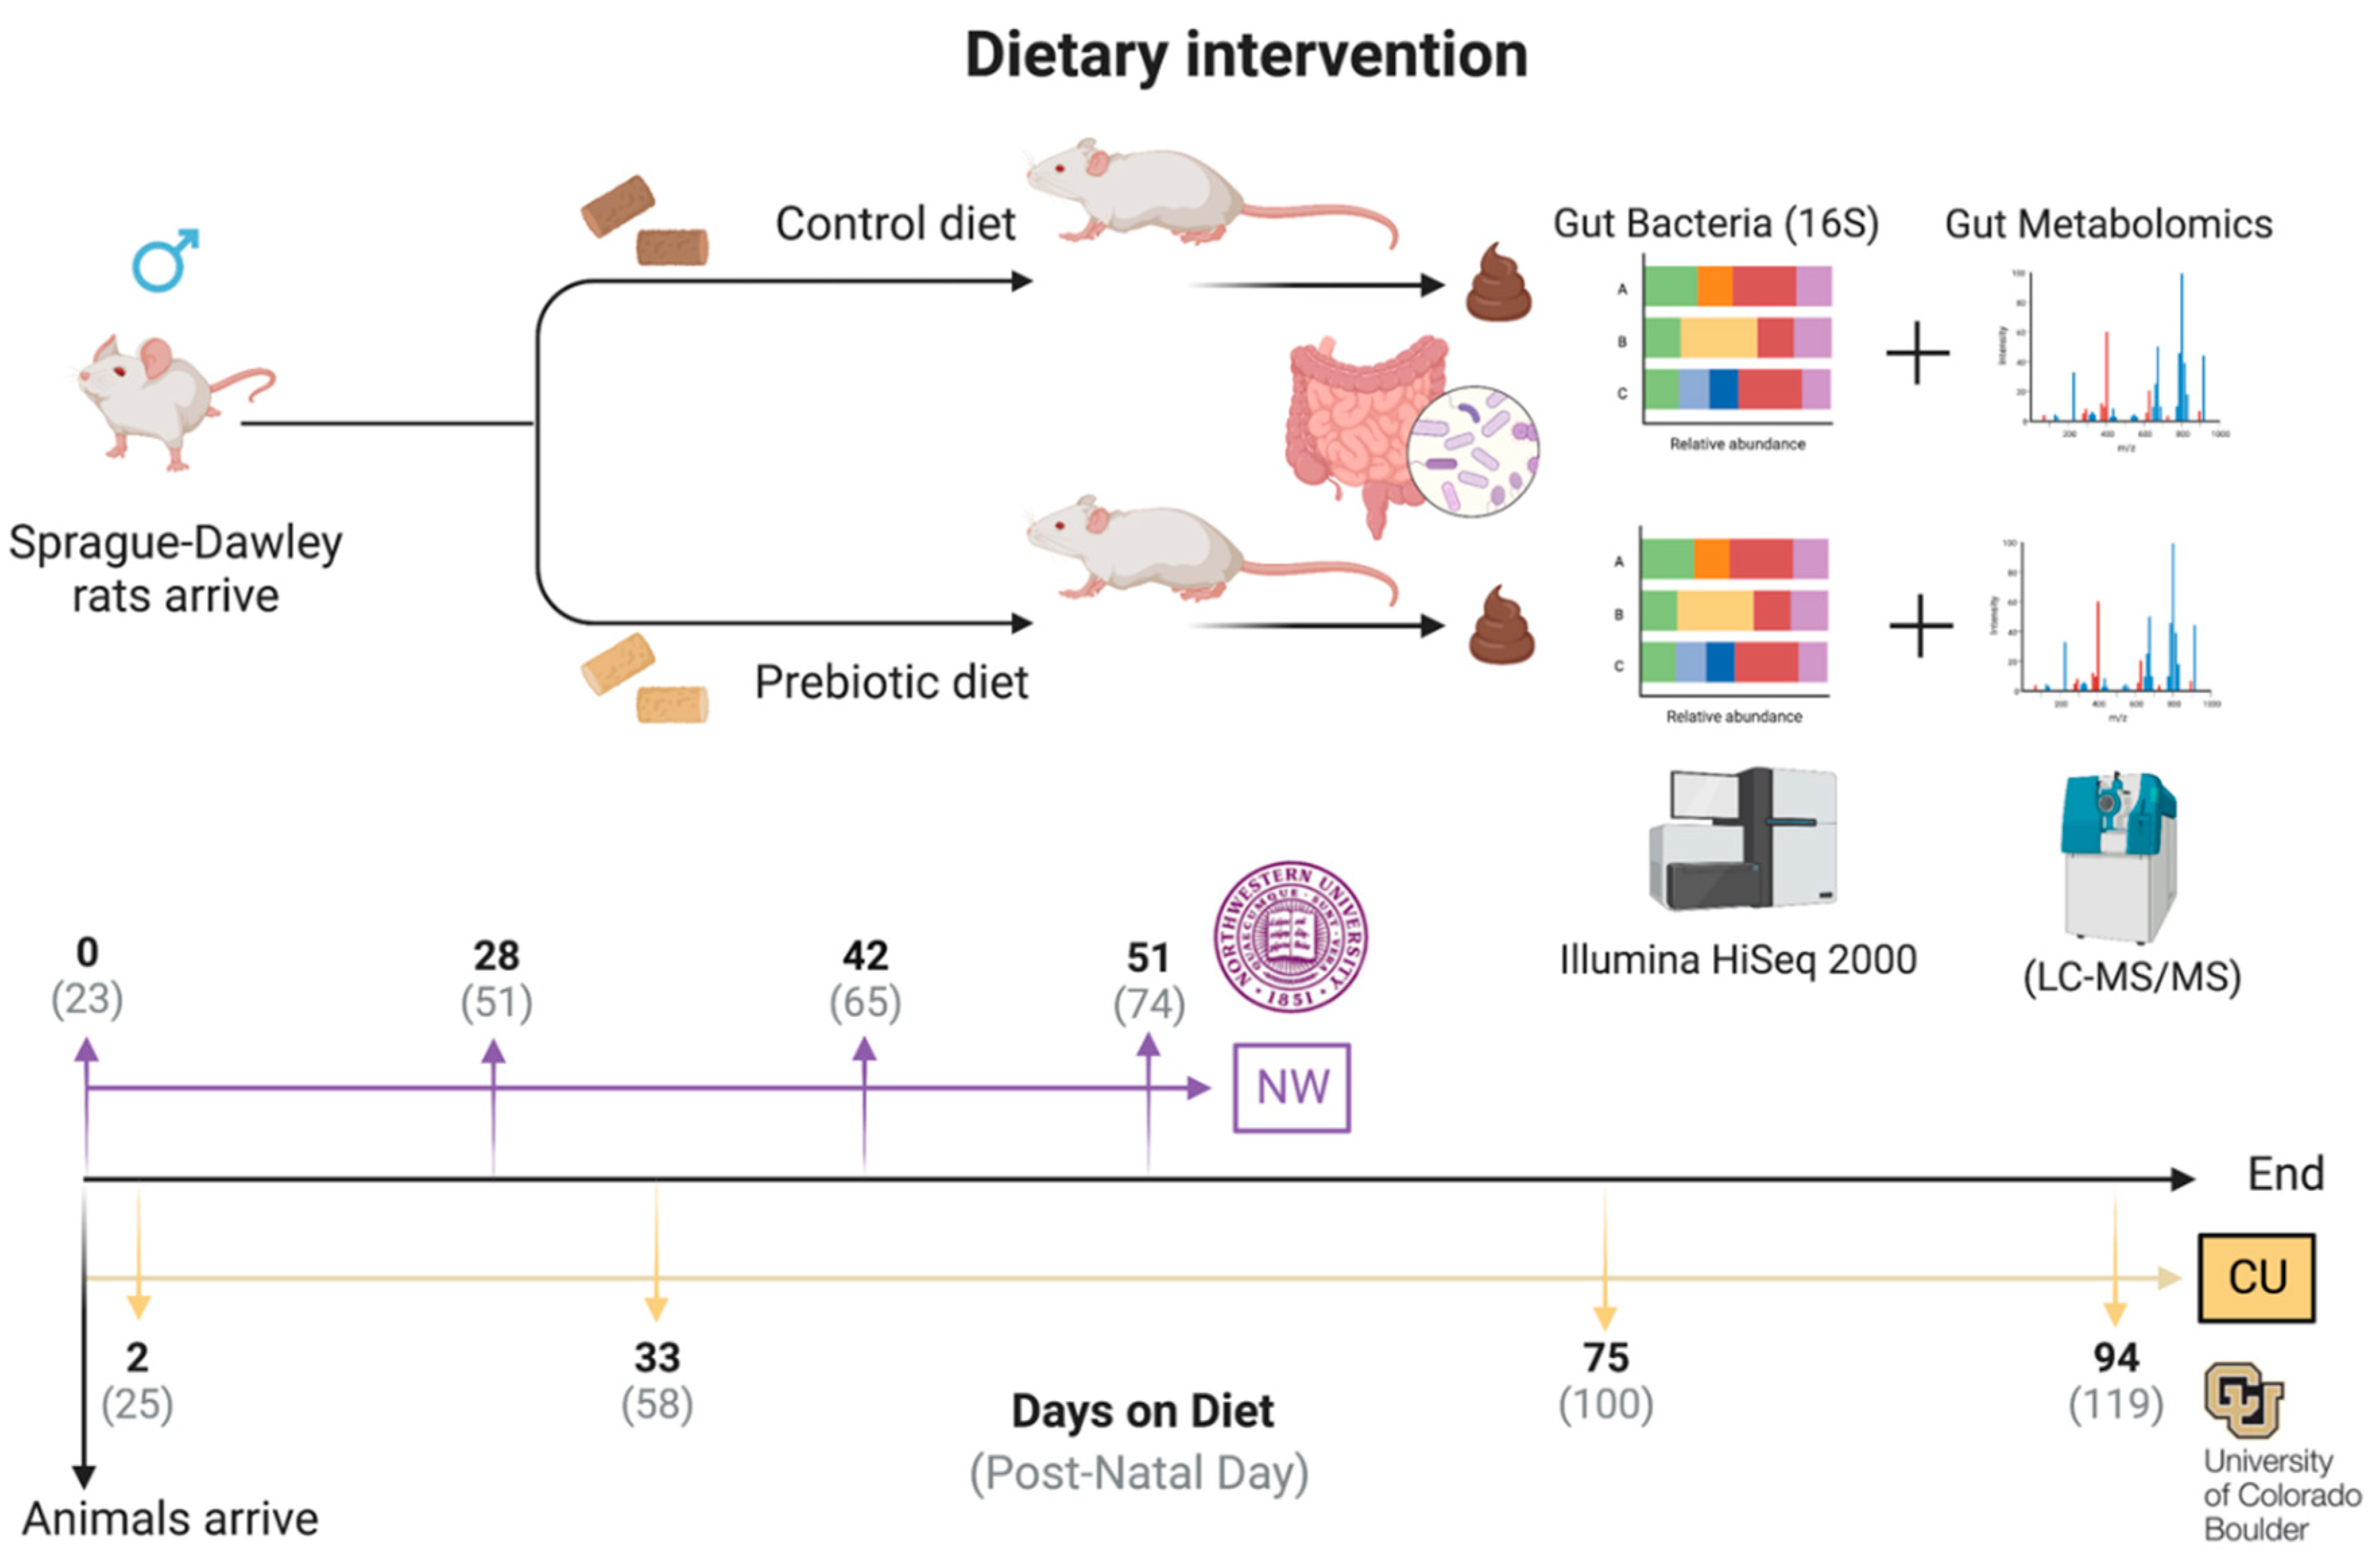
Rats arrived at NW on PND 23 and were randomly placed on either a control or prebiotic diet for the duration of the study (
Figure 1). Animal numbers for the NW microbiome data were control (
n = 30) and prebiotic diet (
n =3 2), while the animal numbers for the NW metabolome data were control (
n = 31) and prebiotic diet (
n = 32). Rats arrived at CU on PND 23 and were immediately placed on either control or prebiotic diet for the duration of the study (
Figure 1). Animal numbers for the CU microbiome data were control (
n = 37) and prebiotic diet (
n = 37), while the animal numbers for the CU metabolome data were control (
n =40) and prebiotic diet (
n = 42). Only samples present for all time points with viable data (i.e., useable fecal samples, high-quality sequencing; quality feature detection, etc.) were included in the final analysis.
At NW, fecal samples were collected on experimental days 0, 28, 42, and 51. At CU, fecal samples were collected on experimental days 2, 33, 75, and 94 (
Figure 1). The days chosen for fecal collection differed between sites due to other goals of the larger ONR project. The repeated sample collection across time allows one to capture any changes in the microbiome and metabolome due to aging (i.e., adolescence to young adulthood). The two experiments were conducted on Sprague Dawley rats eating identical diets and thus give us unique insight into how the gut microbiome and gut metabolome change from adolescence to young adulthood between study sites in response to a prebiotic diet (
Figure 1). Any missing sample data from either the microbiome or metabolome for any time point for both studies were automatically excluded from the final analysis.
Rats at both facilities had
ad libitum access to control or prebiotic diets immediately upon arrival on PND 23. The control and prebiotic diets fed to rats at NW and CU were the same formulation. The diets were initially formulated by Mead Johnson Nutrition (MJN, Evansville, IN, USA) based on AIN-93G specifications, were custom-made by Envigo Teklad (TD.110889; now Inotiv, Lafayette, IN, USA), and were isocaloric with similar carbohydrate, protein, fat, vitamin, and mineral levels, details of which have been previously published [
29,
30,
31]. The prebiotic diet contained the following prebiotic substrates, which were absent from the control diet: galactooligosaccharides (GOS, 24.14g/Kg (7.0 g active); FrieslandCampina, Zwolle, The Netherlands), polydextrose (PDX, 7.69g/Kg (7.0 g active); Danisco, Terre Haute, IN, USA).
Fecal samples were collected and prepared as previously described [
24,
34,
35,
36] and were collected after cage change. Sterile forceps (100% ethanol) were used to obtain each sample, which was then placed in 1.5 mL sterile screw cap tubes (USA Scientific, Ocala, FL, USA) and put in liquid nitrogen. Samples were then transferred and stored at -80°C for later analyses. Weekly fecal samples were collected in the light cycle (~0900-1100 hrs.) shortly after cage changes. Investigators collected rat fecal samples immediately after rats defecated in the new bedding, i.e., within ~10-30 minutes. At each collection time point, duplicate samples of bedding, water, food, and blank tubes were also collected to control for potential environmental influences on the microbiome and metabolome data. For both study sites, fecal samples were cut in half lengthwise to ensure each animal’s microbiome and metabolomics data were generated from the same fecal pellet [
37].
For both study sites, DNA was extracted from fecal samples and the V4 region of the 16S rRNA gene was amplified using the 515f/806r primer pair with the barcode on the forward read [
38] and sequenced as previously described [
39]. Samples were purified and precipitated to remove polymerase chain reaction (PCR) artifacts; samples were sequenced in multiplex on an Illumina HiSeq 2000. All target gene sequence processing was done with Quantitative Insights Into Microbial Ecology (QIIME2) [
40,
41] via Qiita [
42]. Raw sequencing data were trimmed and demultiplexed at 150 bases. Amplicon sequence variants (ASVs) were generated using the deblur algorithm [
43]. Phylogeny was created via SEPP [
44] within the QIIME2 fragment insertion plugin using default parameters. Taxonomy classification was done via the QIIME2 feature classifier plugin [
45] and based on Silva [
46]. The resulting ASV table was filtered to remove mislabeled samples with a probability above 0.20 using the sample type field, as described in the Human Microbiome Project [
47,
48]. The resulting table was then rarefied at 10,000 sequences/sample to correct for uneven sequencing depth due to amplification differences between samples.
Beta diversity was examined with principal coordinate analysis (PCoA) using unweighted UniFrac distances (sensitive to rarer taxa) and weighted UniFrac distances (sensitive to abundances of taxa) which are the best ways to visualize the microbiome between treatments as a whole [
49]. For analysis, PERMANOVA was used on each time point in QIIME2. Alpha diversity is a within samples measure and was examined using Evenness, observed OTU’s, and Faith’s Phylogenetic Diversity [
50,
51]. Differential abundance was assessed on the ASVs using analysis of the composition of microbiomes (ANCOM) [
52] as implemented in QIIME2 and matched with the SILVA database. Consistent with current recommended best practices [
53], we refer to the taxonomy assignments as they are designated in the SILVA database since it is updated annually [
46,
54], and is based on ASVs, not the construction of molecular operational taxonomic units (OTUs) [
53].
PICRUSt2 (
https://github.com/picrust/picrust2) was performed in the conda environment for both studies to identify functionally enriched signaling pathways due to prebiotic diet consumption [
55].
Fecal and environmental samples were transferred overnight via dry ice to the University of California San Diego and processed for metabolomic analysis. Fecal samples were stored in 1.5 mL centrifuge tubes at -80°C prior to extractions. Sample IDs were uploaded into an electronic spreadsheet and subsequently used to assign filenames during LC-MS/MS data acquisition. All solvents used for the metabolomic analysis were of LC-MS grade.
This method was adapted from a previously published protocol [
56]. Fecal pellets were weighed to 50.0 +/- 2 mg wet weight and transferred to 2.0 mL round bottom microcentrifuge tubes (Qiagen Catalog# 990381) for metabolite extractions. A clean stainless-steel bead (Qiagen Catalog# 69989) and 1.5 mL chilled extraction solvent (50% MeOH) were added to each sample. The samples were then homogenized for 5 min at 25 Hz using a TissueLyser II system (Qiagen Catalog# 85300) and incubated for 20 min at -20 °C. The fecal homogenates were centrifuged at 14000 rpm for 15 min at 4°C. 1.2 mL aliquots were then transferred into Nunc 2.0 mL DeepWell plate (Thermo Catalog# 278743) and frozen at -80 °C before lyophilization using a FreeZone 4.5 L Benchtop Freeze Dryer with Centrivap Concentrator (Labconco). Wells were resuspended with 200 µL of resuspension solvent (50% MeOH spiked with 2.0 µM sulfadimethoxine), vortexed for 30 secs, and centrifuged at 2000 rpm for 15 min at 4°C. 150 µL of the supernatant was transferred into a 96-well plate and maintained at 4°C before LC-MS analysis. A resuspension solvent QC and a six-standard mix QC (50% MeOH spiked with 1.0 µM sulfamethazine, 1.0 µM sulfamethizole, 1.0 µM sulfachloropyridazine, 1.0 µM amitrypline, and 1.0 µM coumarin 314) was run every 12
th sample to assess sample background, carry over, chromatography behavior, peak picking, and plate effects.
Fecal extracts were analyzed using an ultra-high performance liquid chromatography system (Vanquish, Thermo Fisher Scientific) coupled to a hybrid quadrupole-Orbitrap mass spectrometer (Q-Exactive, Thermo) fitted with a HESI probe. Reverse phase chromatographic separation was achieved using a Kinetex C18 1.7 µm, 100 Å, 50 x 2.1 mm column (Phenomenex, Torrance, CA, USA) held at 40 °C with a 0.5 mL/min flow rate. 5.0 µL aliquots were injected per sample/QC. The mobile phase used was (A) 0.1% formic acid in water and (B) 0.1% formic acid in acetonitrile. The elution gradient was: 5% B for 1 min, increased to 100% B in the next 8 min, held at 100% B for 2 min, returned to 5.0% B in 0.5 min, and equilibrated at 5.0% B for 2 min. Positive electrospray ionization parameters were: sheath gas flow rate of 52 (arb. units), aux gas flow rate of 14 (arb. units), sweep gas flow rate of 3 (arb. units), spray voltage of 3.5 kV, capillary temperature of 270 °C, S-Lens RF level of 50 (arb. units), and aux gas heater temperature of 435 °C. Negative electrospray ionization parameters were: sheath gas flow rate of 52 (arb. units), aux gas flow rate of 14 (arb. units), sweep gas flow rate of 3 (arb. units), spray voltage of 2.5 kV, capillary temperature of 270 °C, S-Lens RF level of 50 (arb. units), and aux gas heater temperature of 435 °C. MS data were acquired using a data dependent acquisition method with a resolution of 35,000 in MS1 and 17,000 in MS2. An MS1 scan from 100-1500 m/z was followed by an MS2 scan, produced by collision-induced disassociation, of the five most abundant ions from the prior MS1 scan.
Feature tables were generated for samples of the control and prebiotic diets. To annotate features with a level 1 metabolome standard initiative (MSI) level of confidence, mass and retention time were aligned and MS/MS fragmentation pattern was compared between features and 20 purified bile acid reference standards as previously described in detail [
30,
34]. Primary, secondary, conjugated, and unconjugated bile acids were purchased (Cayman Chemical, Ann Arbor, MI, USA) and used to identify Level 1 bile acid identification in fecal metabolomics samples. Standards were solubilized to a final concentration of 10 μM in 50% MeOH before LC-MS/MS injection.
All untargeted mass spectrometry data can be found in the online mass spectrometry repository Massive (
http://massive.ucsd.edu) using the following accession numbers for NW: MSV000083073; and for CU: MSV000080628.
Data were analyzed using R statistics version 4.2.2 GUI 1.79 Big Sur ARM build (8160). Data depicted in the figures were made in Prism (version 9.3.1). For gut microbiome analysis of Unifrac distance matrices, permutation multivariate analysis of variance (PERMANOVA) was used at each time point [
57,
58]. Measures of alpha diversity were analyzed separately using repeated measures ANOVA. To investigate differential abundances of genera level taxa between control and prebiotic diets, a first-level analysis of the composition of the microbiome (ANCOM) was performed on ASVs [
52] to reveal reliable changes. ANCOM analysis will correct for multiple comparisons of ASVs identified in the sequencing data. ASVs that were undefined/unclassified to the genera level were excluded from the final analysis. Once taxonomy was assigned, we performed a second level of analysis on genus-level taxonomy assignments using the Nonparametric Tests for Repeated Measures Data in Factorial Designs (nparLD) package. Importantly, only genera that were significantly changed by prebiotic diet based on ANCOM analysis are presented in this manuscript. Lower relative abundance genera were non-normally distributed; therefore, these data were analyzed using the nonparametric test for longitudinal data or nparLD package. The bile acid data were log-transformed as previously described [
24,
30] and analyzed using the nparLD package. Multiple significant
p-values in bile acid data were adjusted using the Holm method. Pathways output from PICRUSt2 was analyzed via DESeq2 (version 1.14.1) using the Bioconductor R package as previously described [
23] and Volcano Plot analysis by time point. Pathways affected by prebiotic diet between study sites and across time were analyzed using nparLD. Tukey’s post hoc analysis was used when appropriate using the Nparcomp: Nonparametric relative contrasts effects (nparcomp) package for relative abundances of the genera, bile acids, and pathway data. Network analyses examining relationships between functionally significant pathways and bile acids were performed using the corrr package. The two-tailed alpha level was set at
p < 0.05.
3. Results
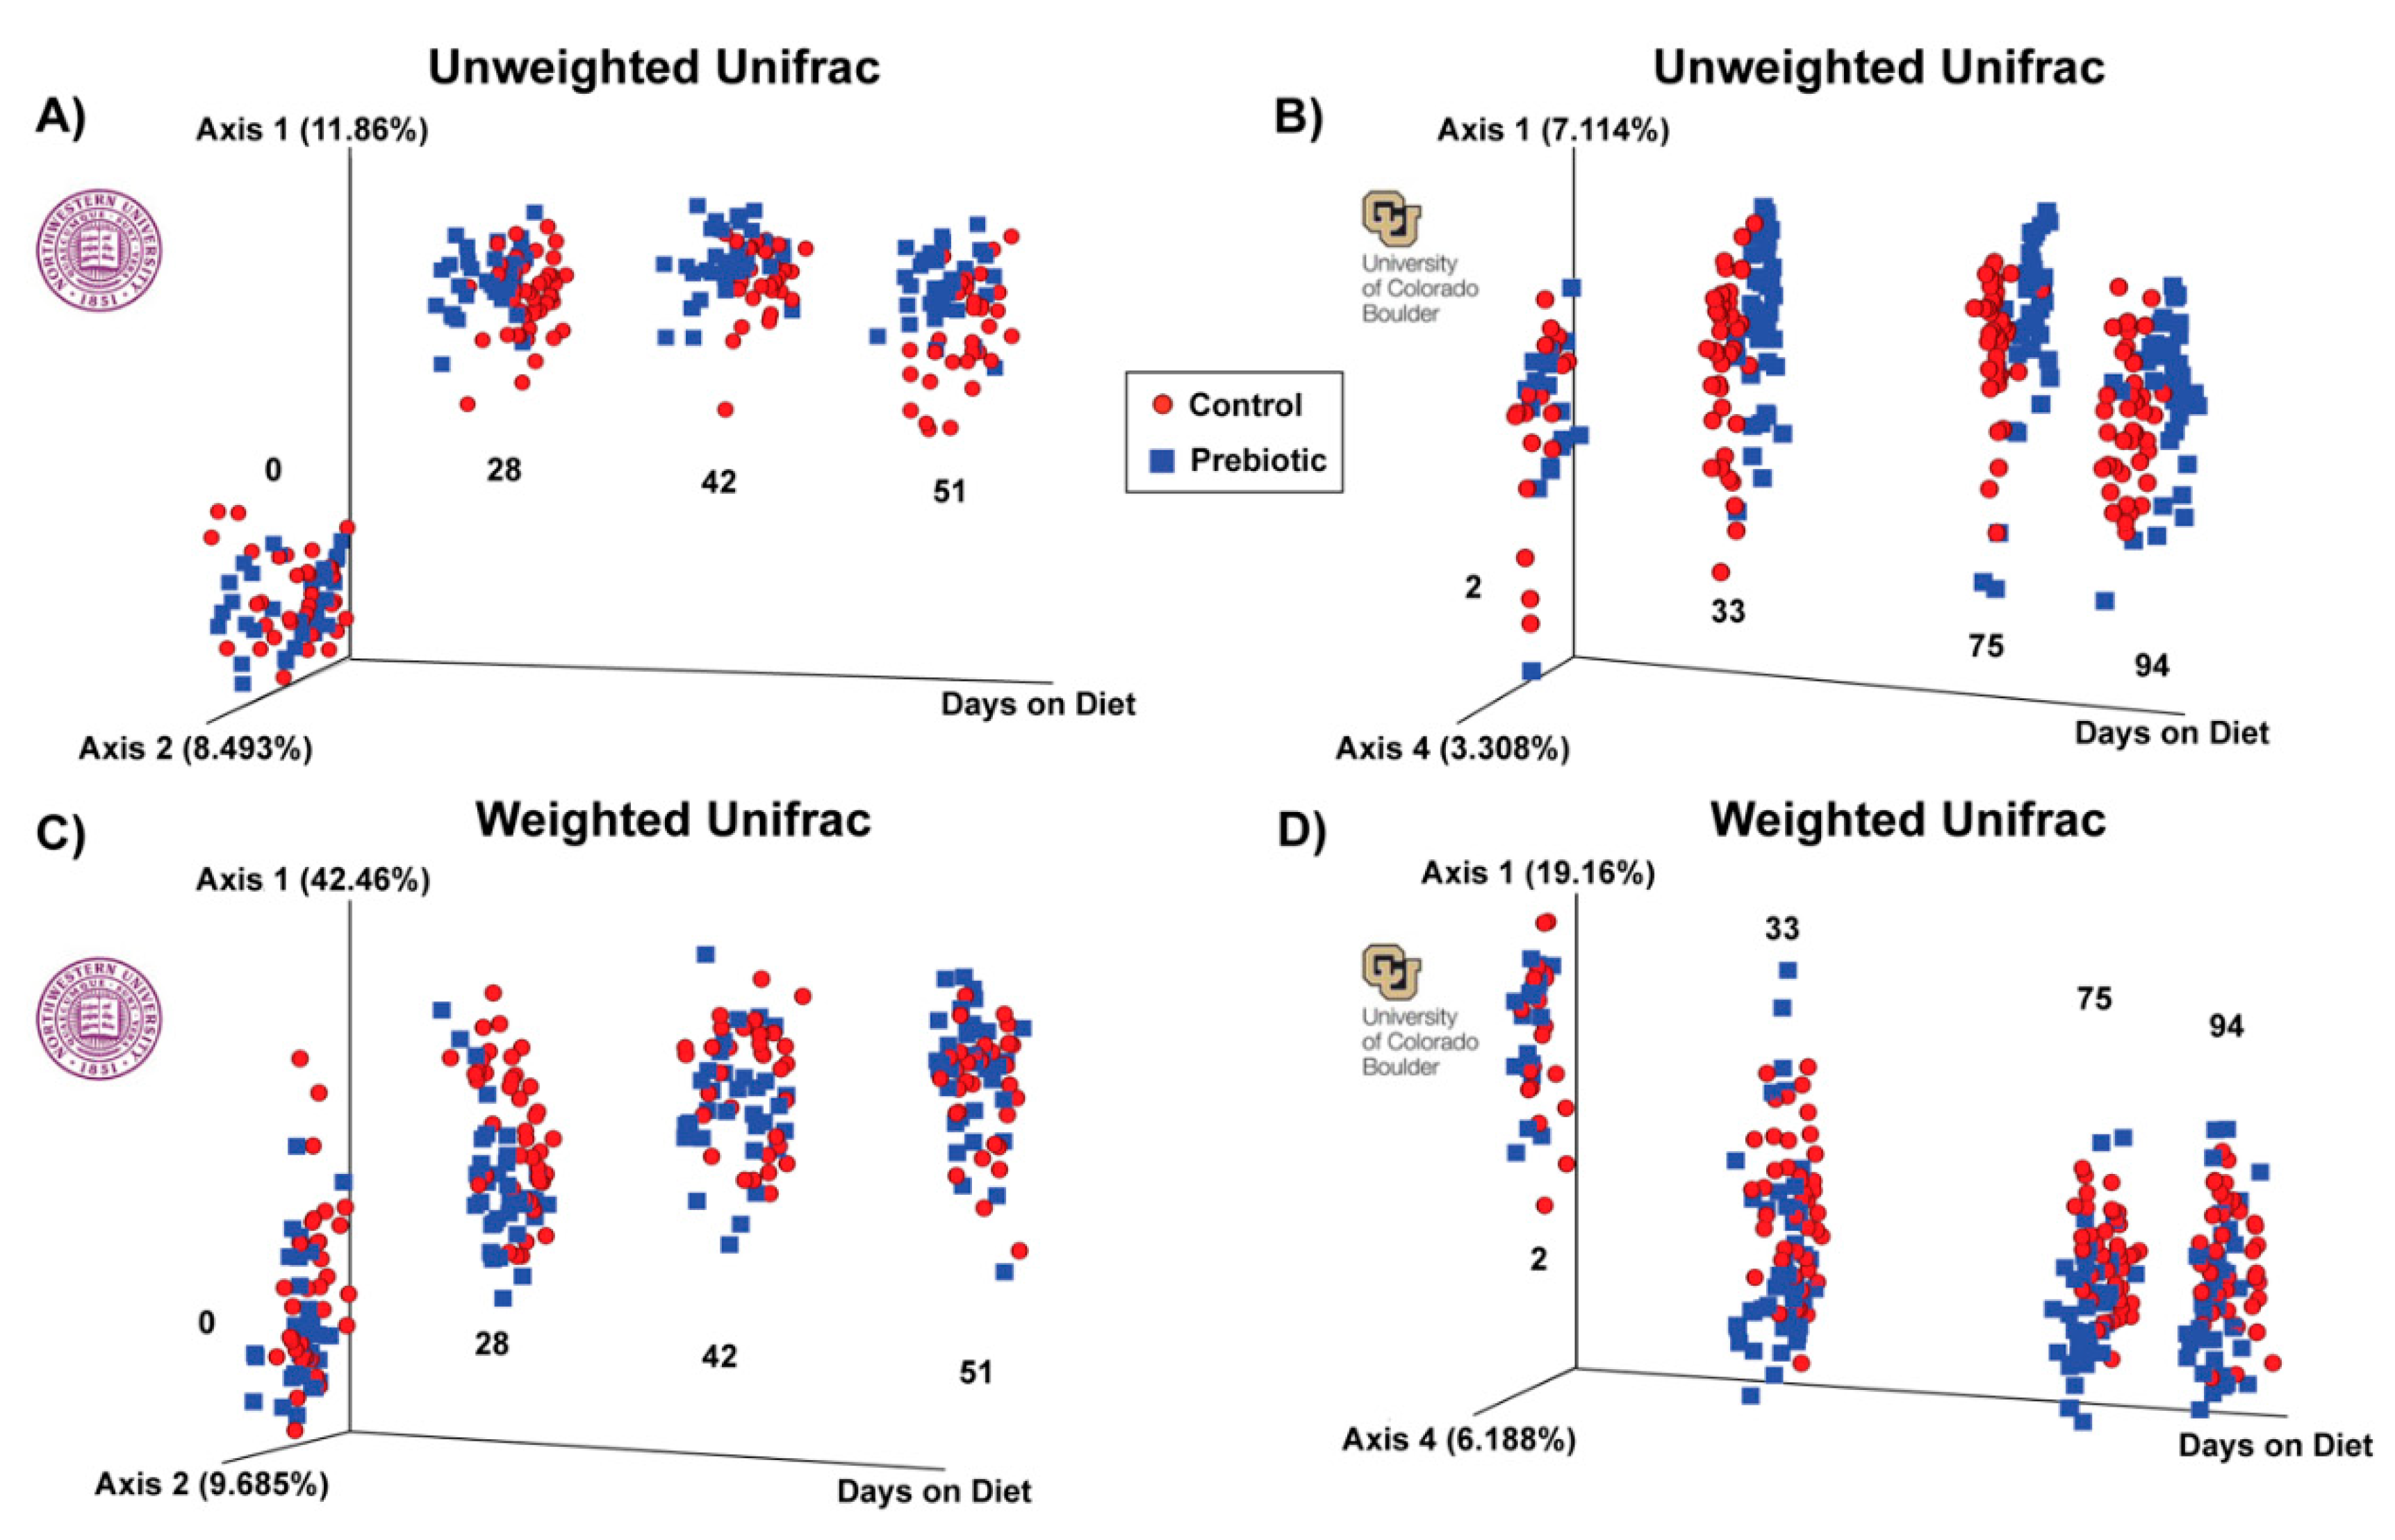
A prebiotic diet significantly changed beta diversity of the gut microbiome at both study sites (
Figure 2).
Table 1 denotes the significant effects of prebiotic diet on weighted and unweighted UniFrac distance. The prebiotic diet had no effect at 0 days on diet on weighted or unweighted UniFrac distance (NW). There was a significant effect of prebiotic at 2 days on diet on weighted UniFrac distance (CU). The prebiotic diet significantly impacted both weighted and unweighted UniFrac distance on all remaining days on diet at both study sites (
Figure 2,
Table 1).
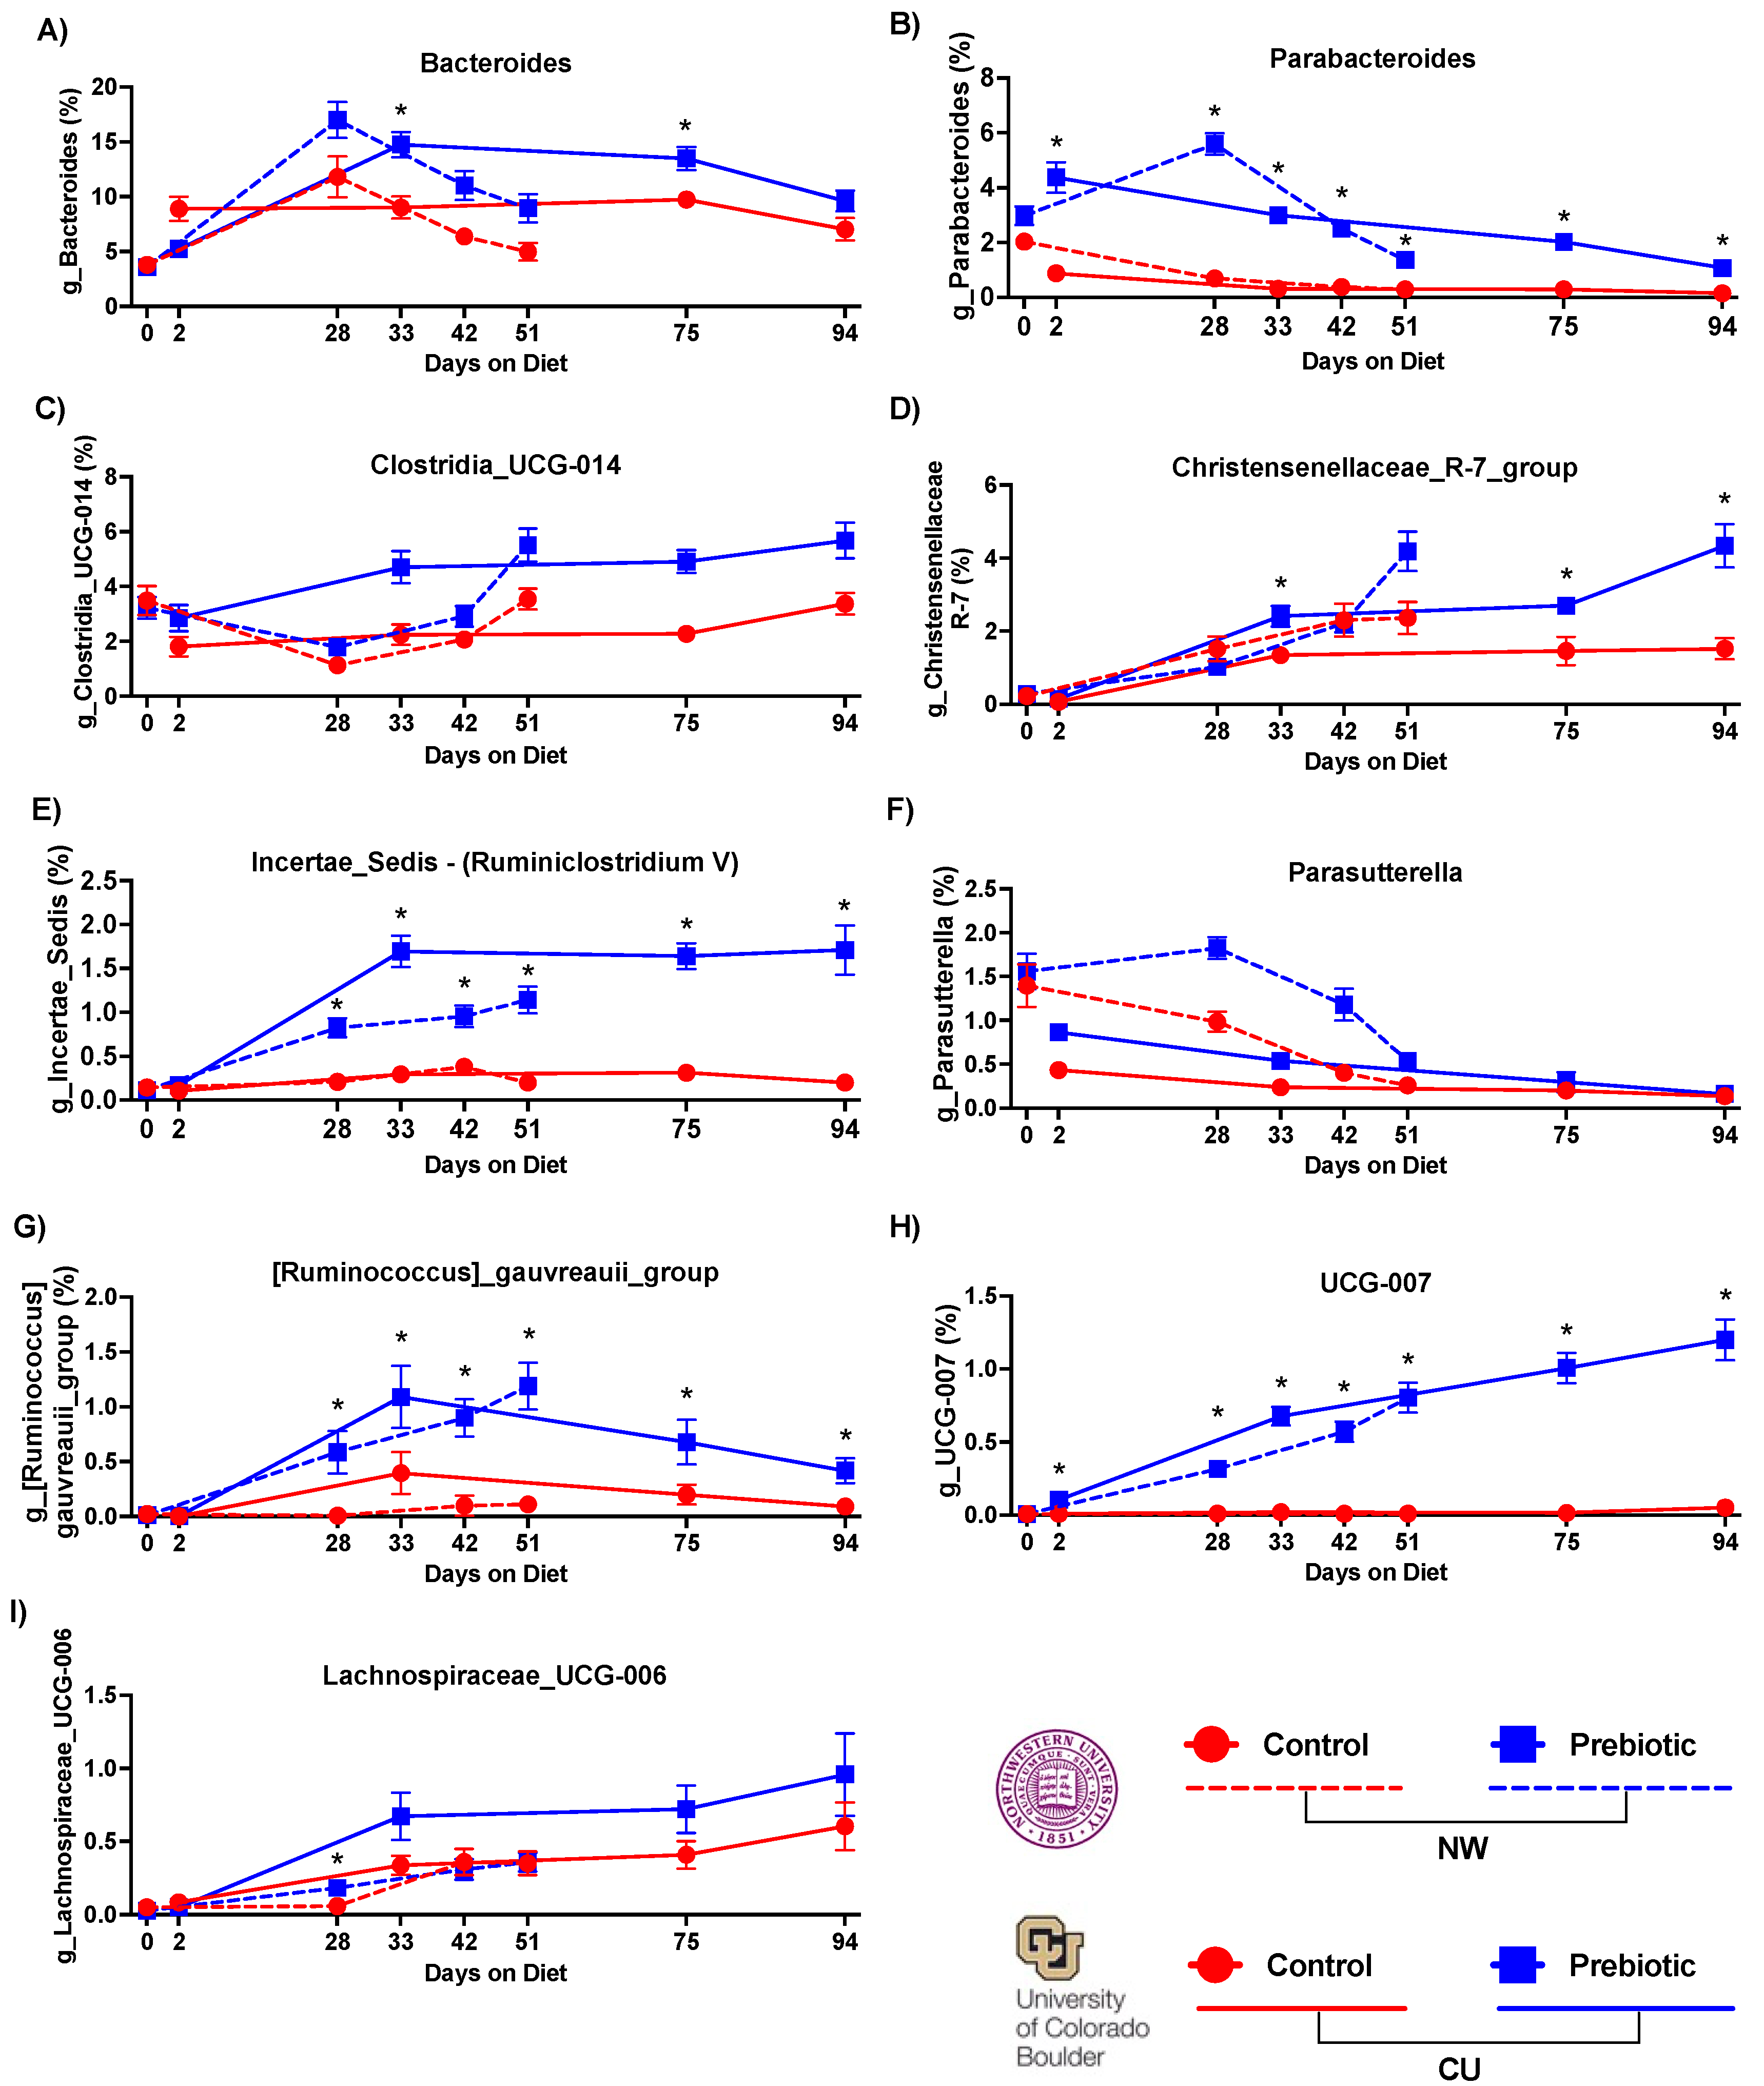
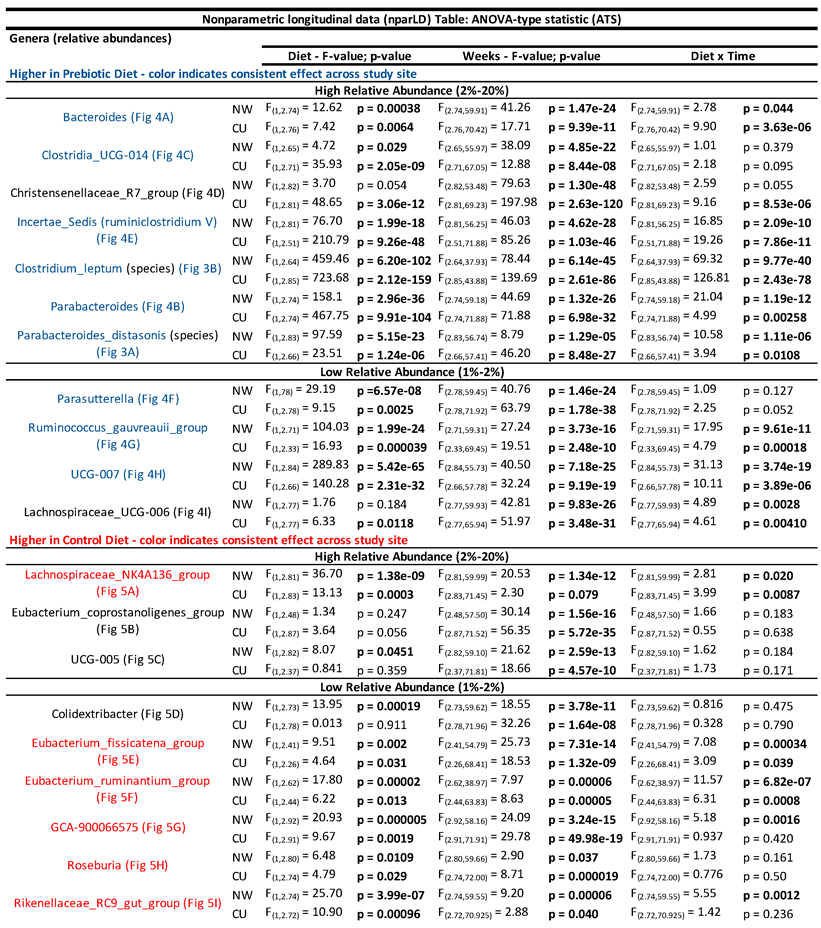
The top nine most abundant genera increased by prebiotic diet, when compared to the control diet, are shown in
Figure 3. Prebiotic diet increased relative abundances of the genera
Bacteroides (
Figure 3A),
Parabacteroides (
Figure 3B),
Clostridia_UCG_014 (
Figure 3C),
Incertae_Sedis (formerly known as
Ruminiclostridium V) (
Figure 3E),
Parasutterella (
Figure 3F),
Ruminococcus_gauvreauii_group (
Figure 3G), and
UCG-007 (
Figure 3H) at both study sites. See
Table 2 and
Figure 3 for complete statistical and post hoc analysis results. There were differing effects between study sites in
Christensenellaceae_R-7_group (
Figure 3D) and
Lachnospiraceae_UCG-006 (
Figure 3I) such that prebiotic diet increased these genera in the CU study but not in the NW study. However, there was a diet-by-time interaction in
Lachnospiraceae_UCG-006 at NW (see
Figure 3I for results of post hoc analysis).
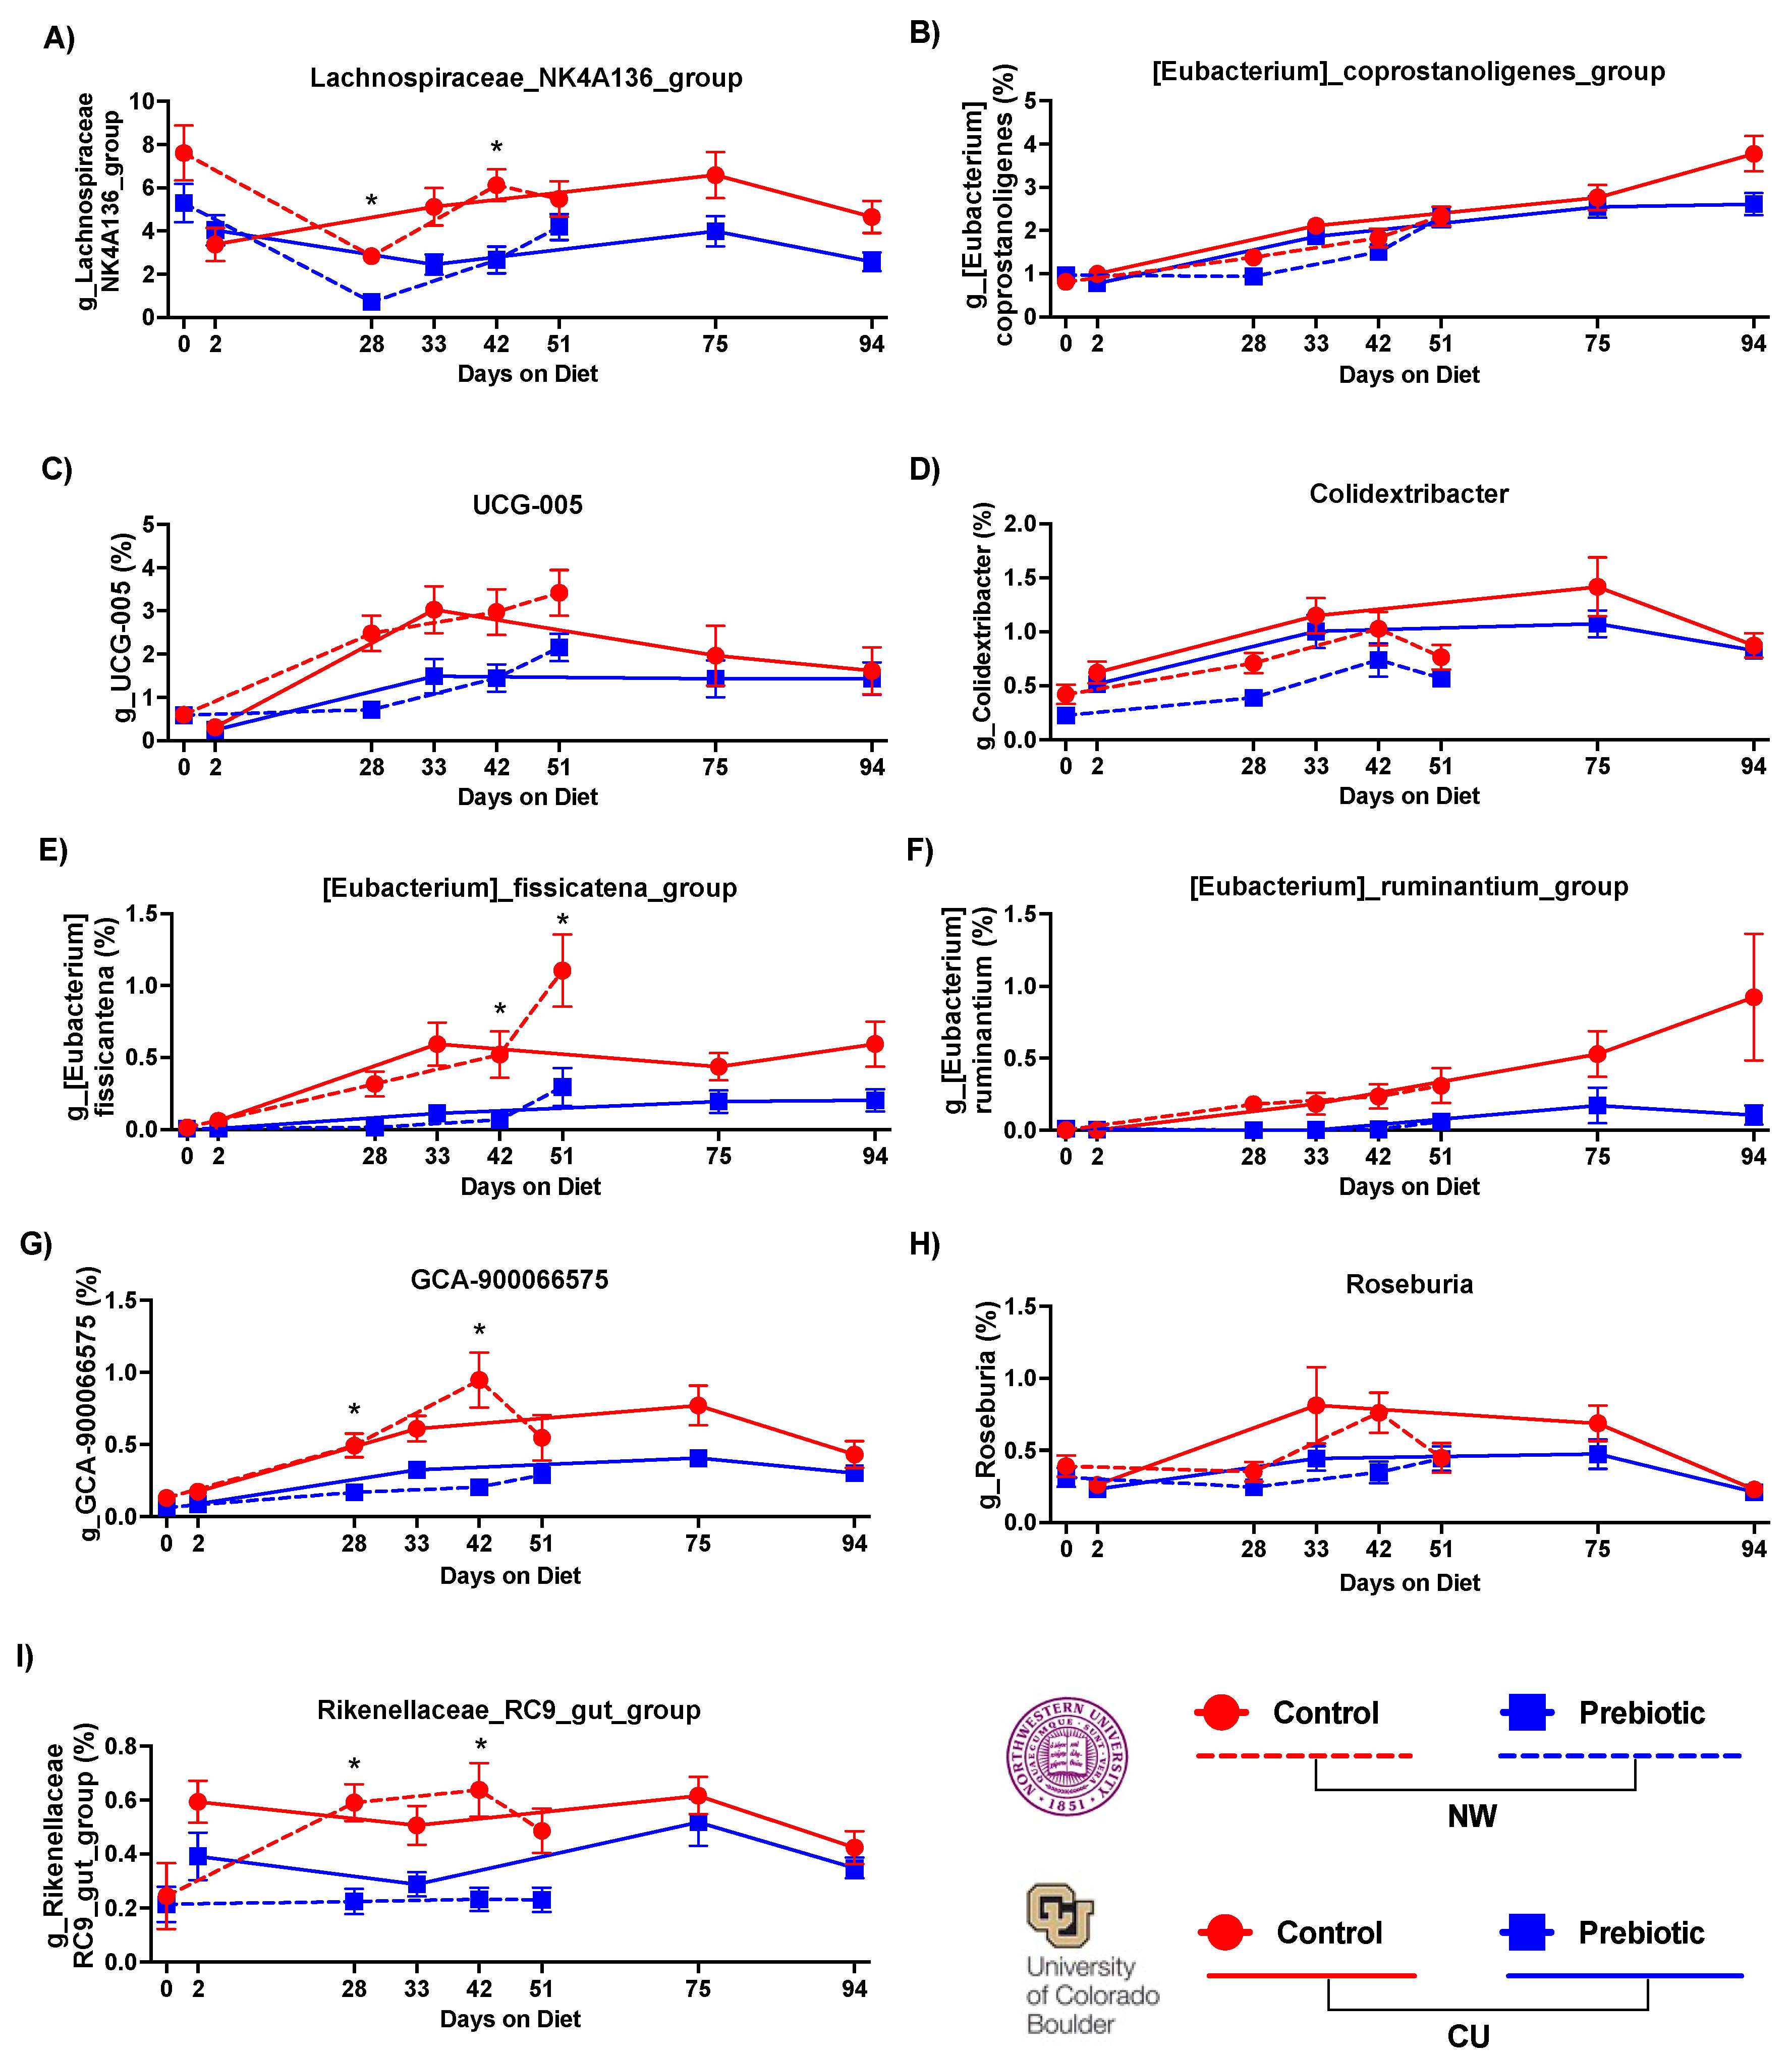
The top 6 (out of 9) most abundant genera that were consistently lower in the prebiotic diet group, when compared to the control diet, are shown in
Figure 4.
Lachnospiraceae_NK4A136_group (
Figure 4A),
Eubacterium_fissicatena_group (
Figure 4E),
Eubacterium_ruminantium_group (
Figure 4F),
GCA-900066575 (
Figure 4G),
Rosburia (
Figure 4H), and
Rikenellaceae_RC9_gut_group (
Figure 4I) were consistently lower in the prebiotic diet group, when compared to the control diet groups, at each study site (see
Table 2 for statistical analysis; see
Figure 4 for results of post hoc tests).
Colidextribacter (
Figure 4D) and
UCG-005 (
Figure 4C) were lower in the prebiotic diet group in the NW study, but not the CU study (
Table 2). The prebiotic diet had no significant effects on
Eubacterium_coprostanoligenes_group at either site (
Figure 4B).
Supplemental
Figure 1 depicts the additional ultra-low abundance genera (less than 1% relative abundance). Supplemental
Table 1 contains the corresponding statistics. Overall, the impacts of a prebiotic diet on ultra-low relative abundances (<1%) genera were less consistent between study sites, except for the genus
Tuzzerella.
Tuzzerella was lower in the prebiotic diet groups at both study sites (Suppl
Figure 1, Supp
Table 1). Finally, the prebiotic diet impacted 6 genera with opposite effects between study sites, although these were not statistically significant once corrected via Tukey’s post-hoc analysis (Suppl
Figure 2, Supp
Table 2). One interesting finding was the difference in relative abundance in the genus
Muribaculaceae between study sites. The relative abundance of this genus was higher in the NW versus the CU microbiome data. This large inherent environmental difference present in the genus
Muribaculaceae may have played a role in the contrasting effects of the prebiotic diet in the alpha diversity results between study sites.
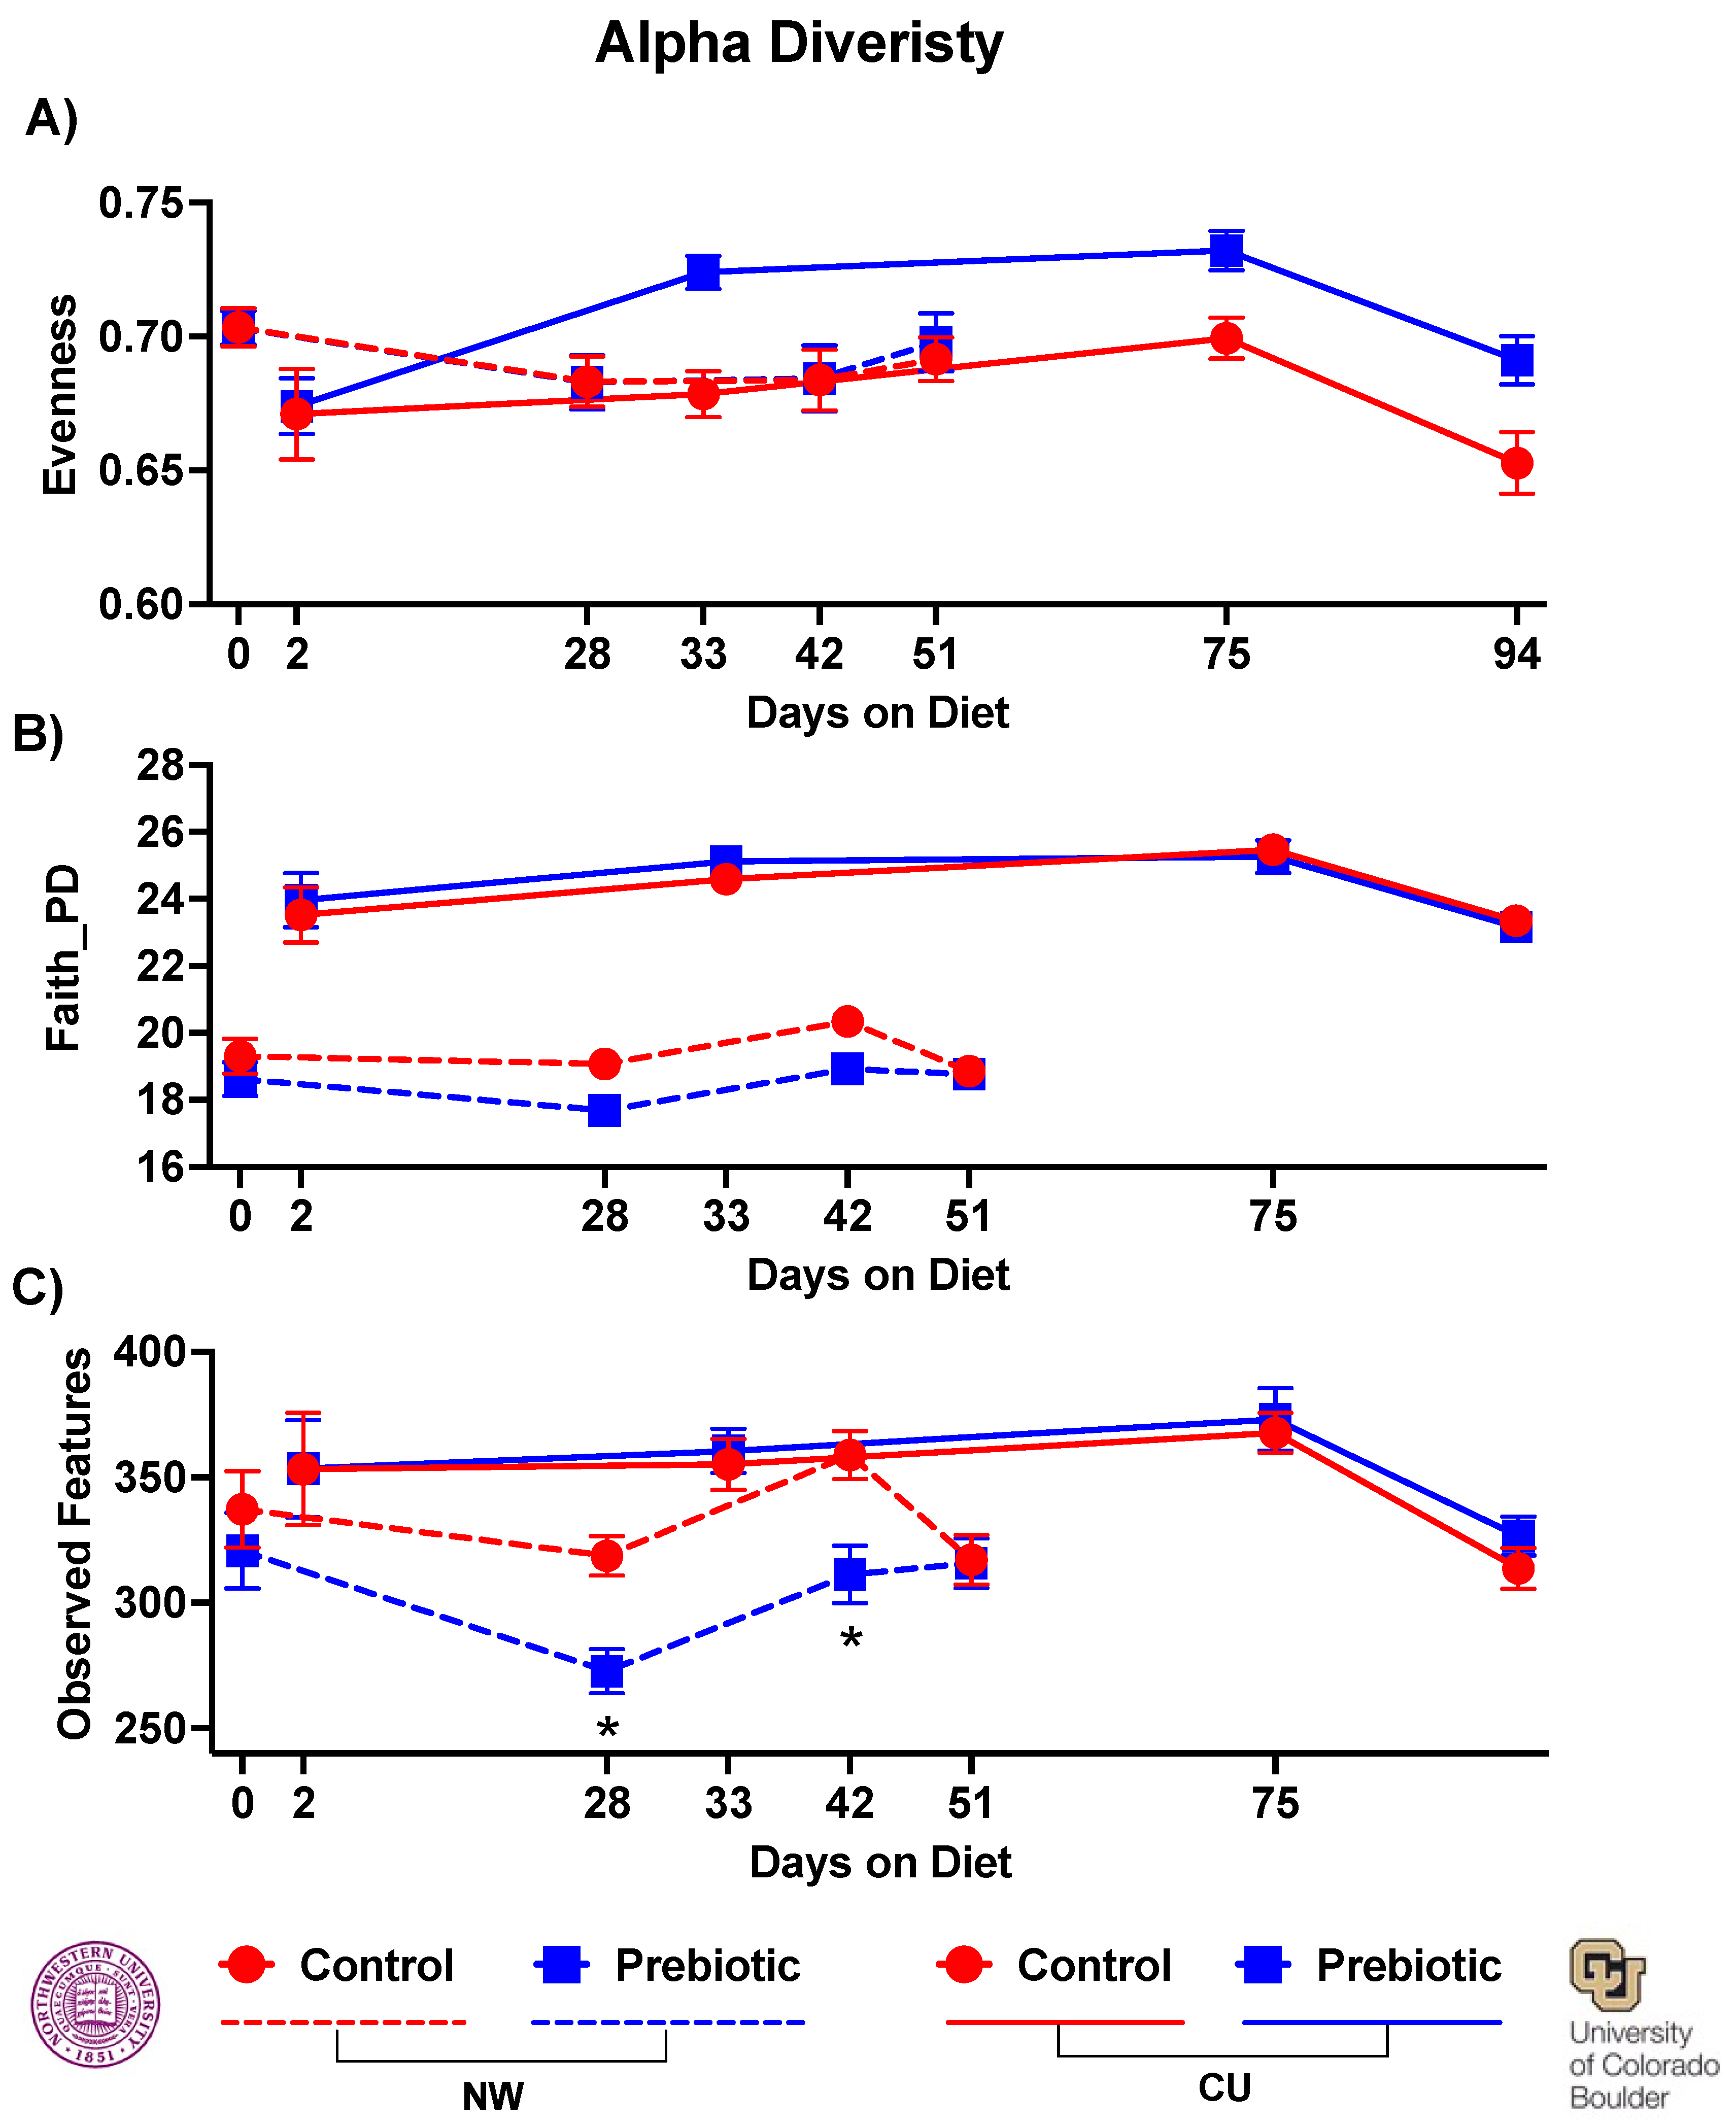
Dietary prebiotics inconsistently altered alpha diversity at both study sites. In the NW study, there was no effect of the prebiotic diet on evenness (
Figure 5A); however, in the CU study the prebiotic diet increased overall evenness (
F(1,3) = 12.27; p = 0.00084;
Figure 5A). In the NW study, there was a significant decrease in faith_pd due to prebiotic diet (
F(1,3) = 5.82; p = 0.021), while no effects were found due to prebiotic diet in faith_pd in the CU study (
Figure 5B). The observed features were lower due to prebiotic diet at NW (
F(1,3) = 6.25; p = 0.017), and there was a significant diet by time interaction (
F(1,3) = 2.95; p = 0.035), but prebiotic diet did not affect observed features in the CU study (
Figure 5C).
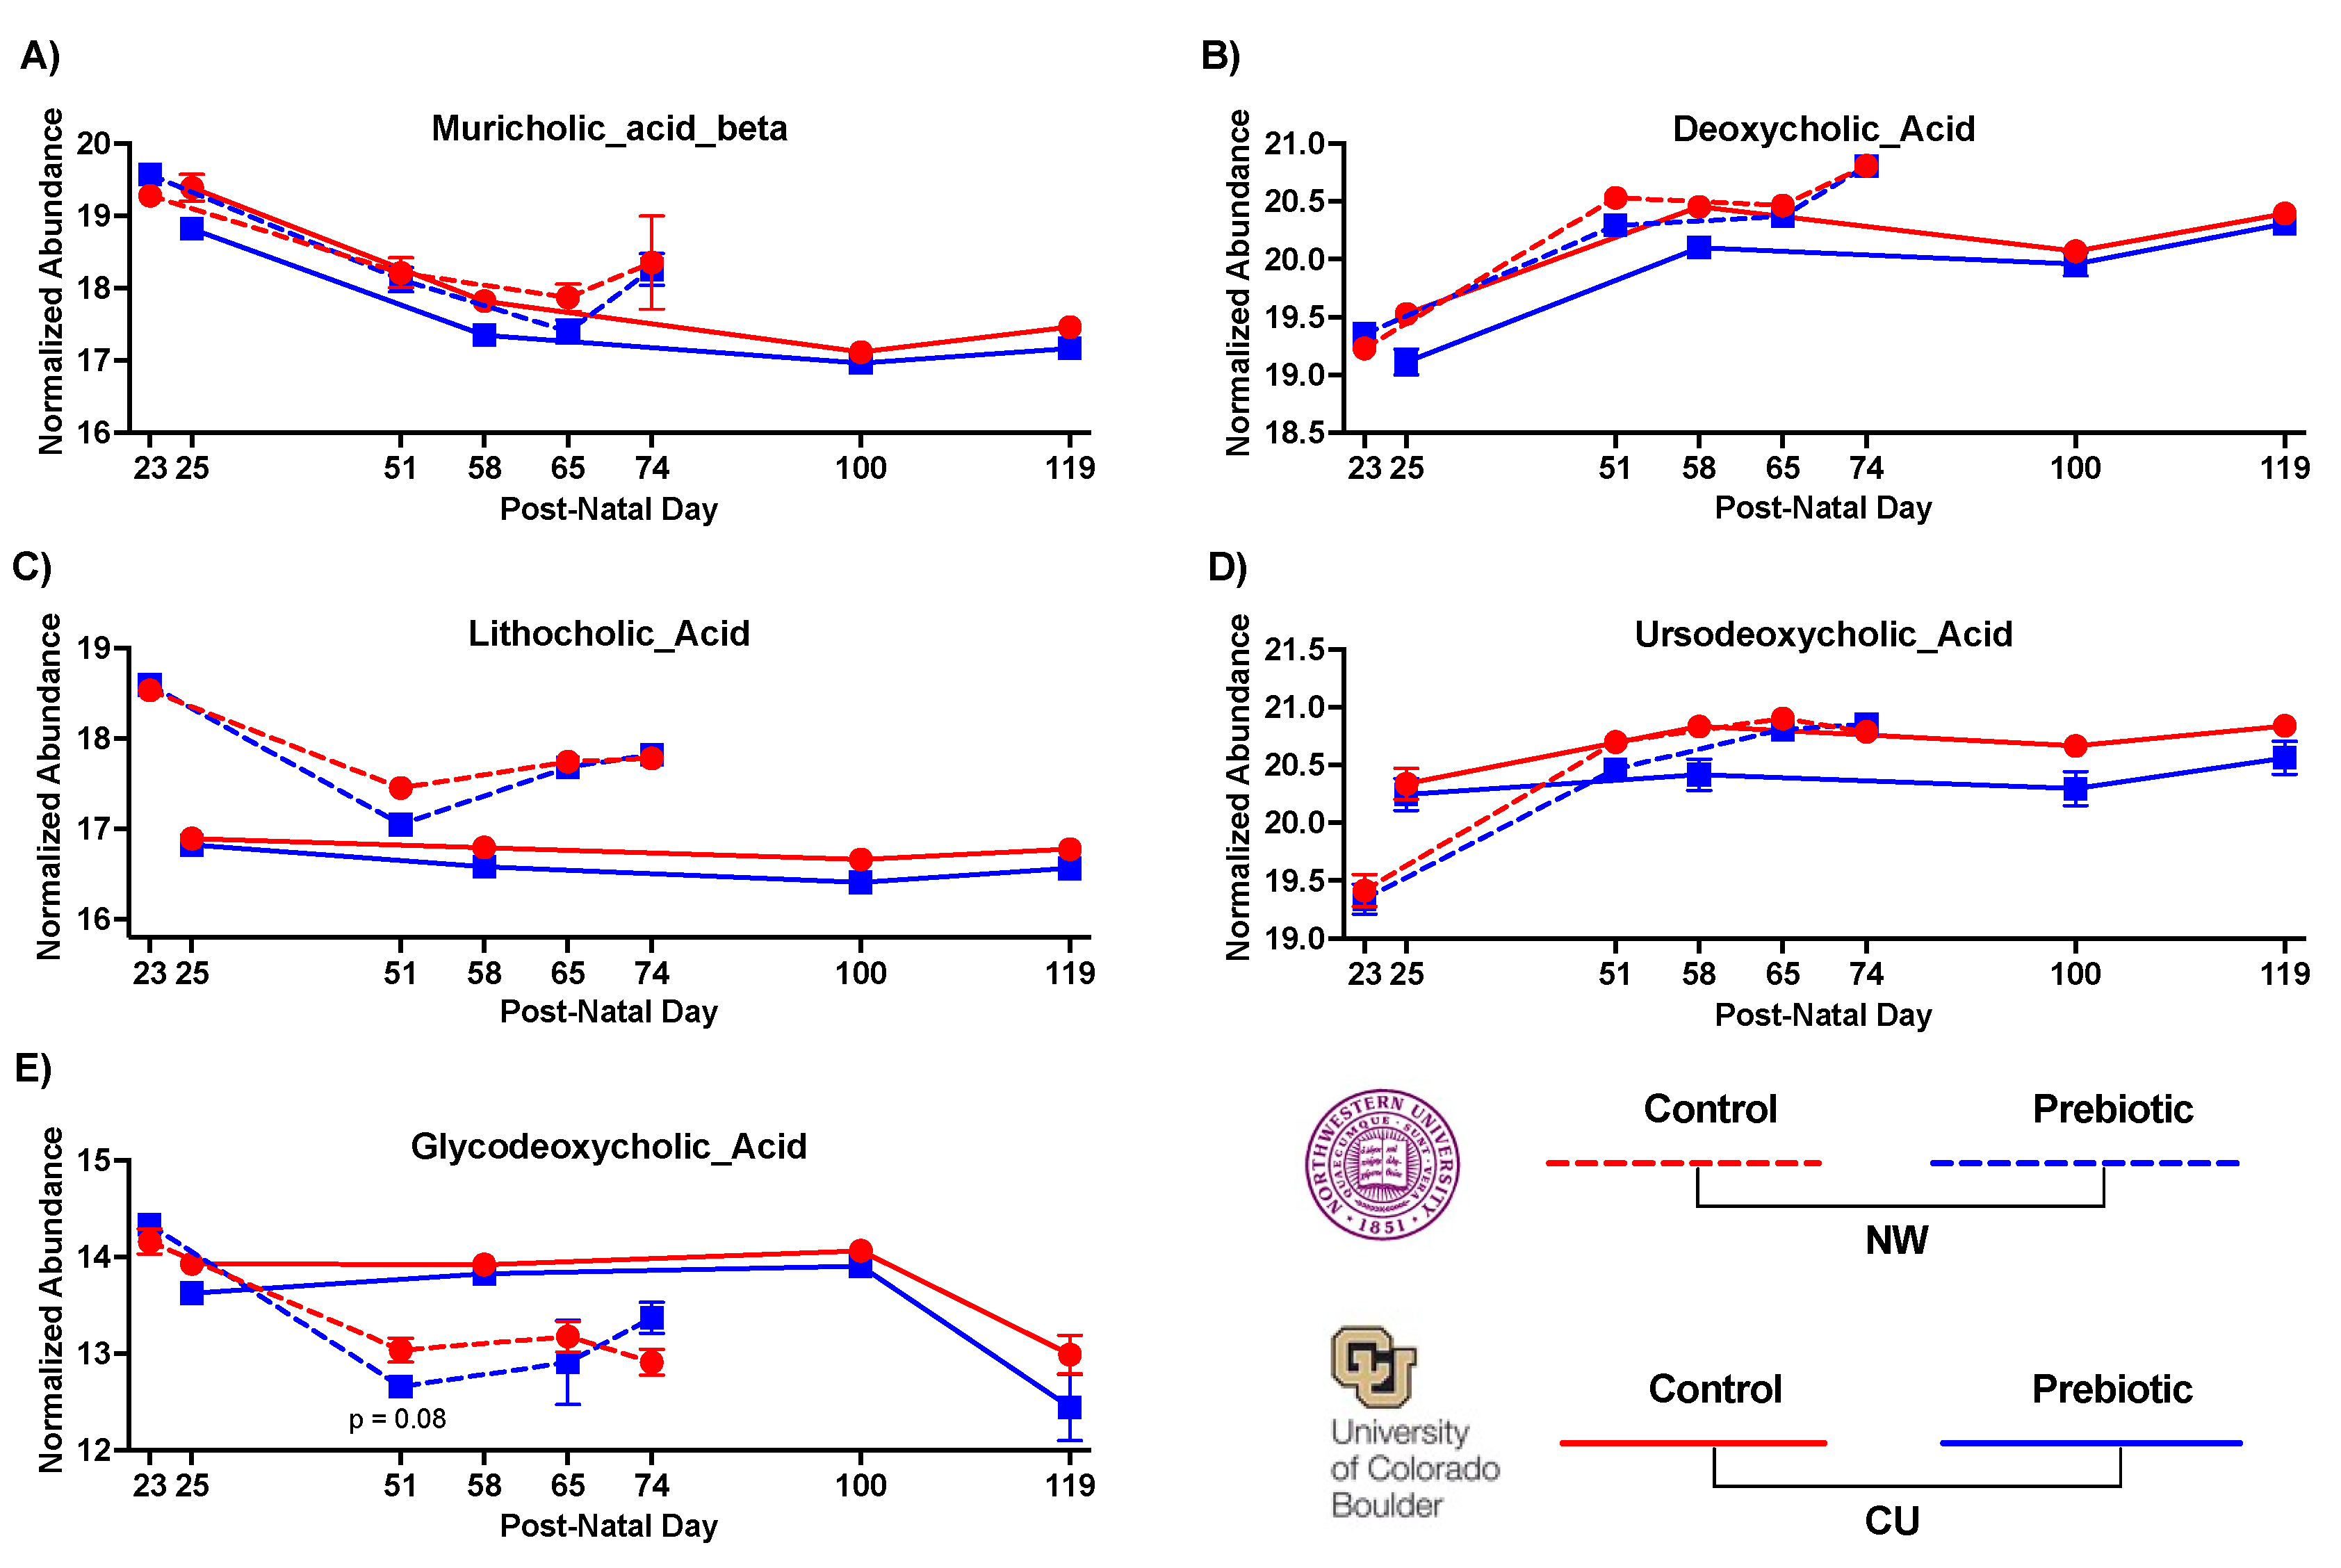
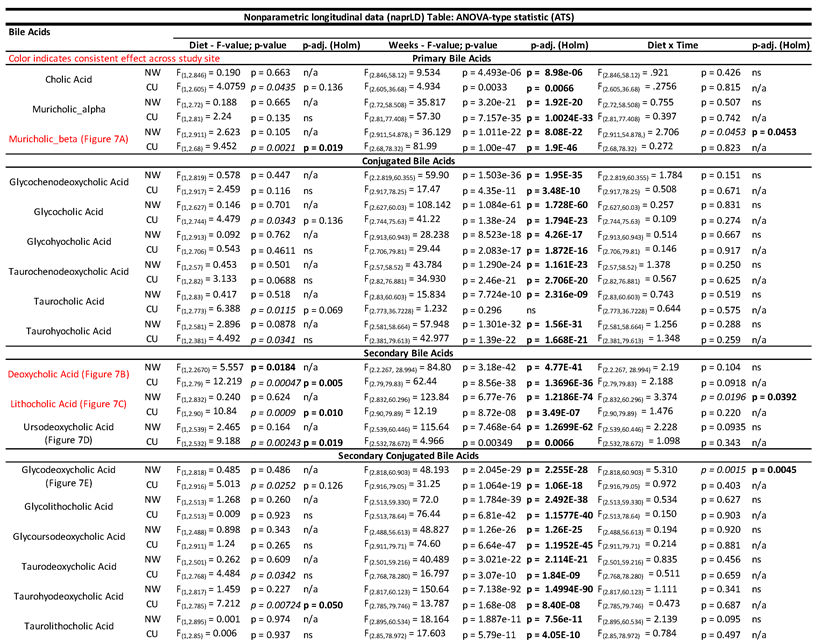
Overall, the relative abundances of several bile acids were lower in the prebiotic diet groups compared to control diet groups and these results were directionally consistent across study sites (
Figure 6; see
Table 3 with statistics for all bile acids identified). Specifically, the primary bile acid muricholic beta was lower in prebiotic diet groups in both studies (
Figure 6A; significant main effect at CU, significant interaction at NW). The secondary bile acids deoxycholic acid (
Figure 6B; significant main effects) and lithocholic acid (
Figure 6C; significant main effect at CU, significant interaction at NW) were lower in the prebiotic diet groups between study sites. In the CU study, ursodeoxycholic acid was also lower in the prebiotic diet group (significant main effect) but was unaffected in the NW study (
Figure 6D; see
Table 3). Finally, the secondary conjugated bile acid glycodeoxycholic acid was impacted by the prebiotic diet in the NW study and unaffected in the CU study (see
Figure 6E for results of post-hoc analyses).
Table 3 lists the bile acids not affected by prebiotic diet when corrected for multiple comparisons.
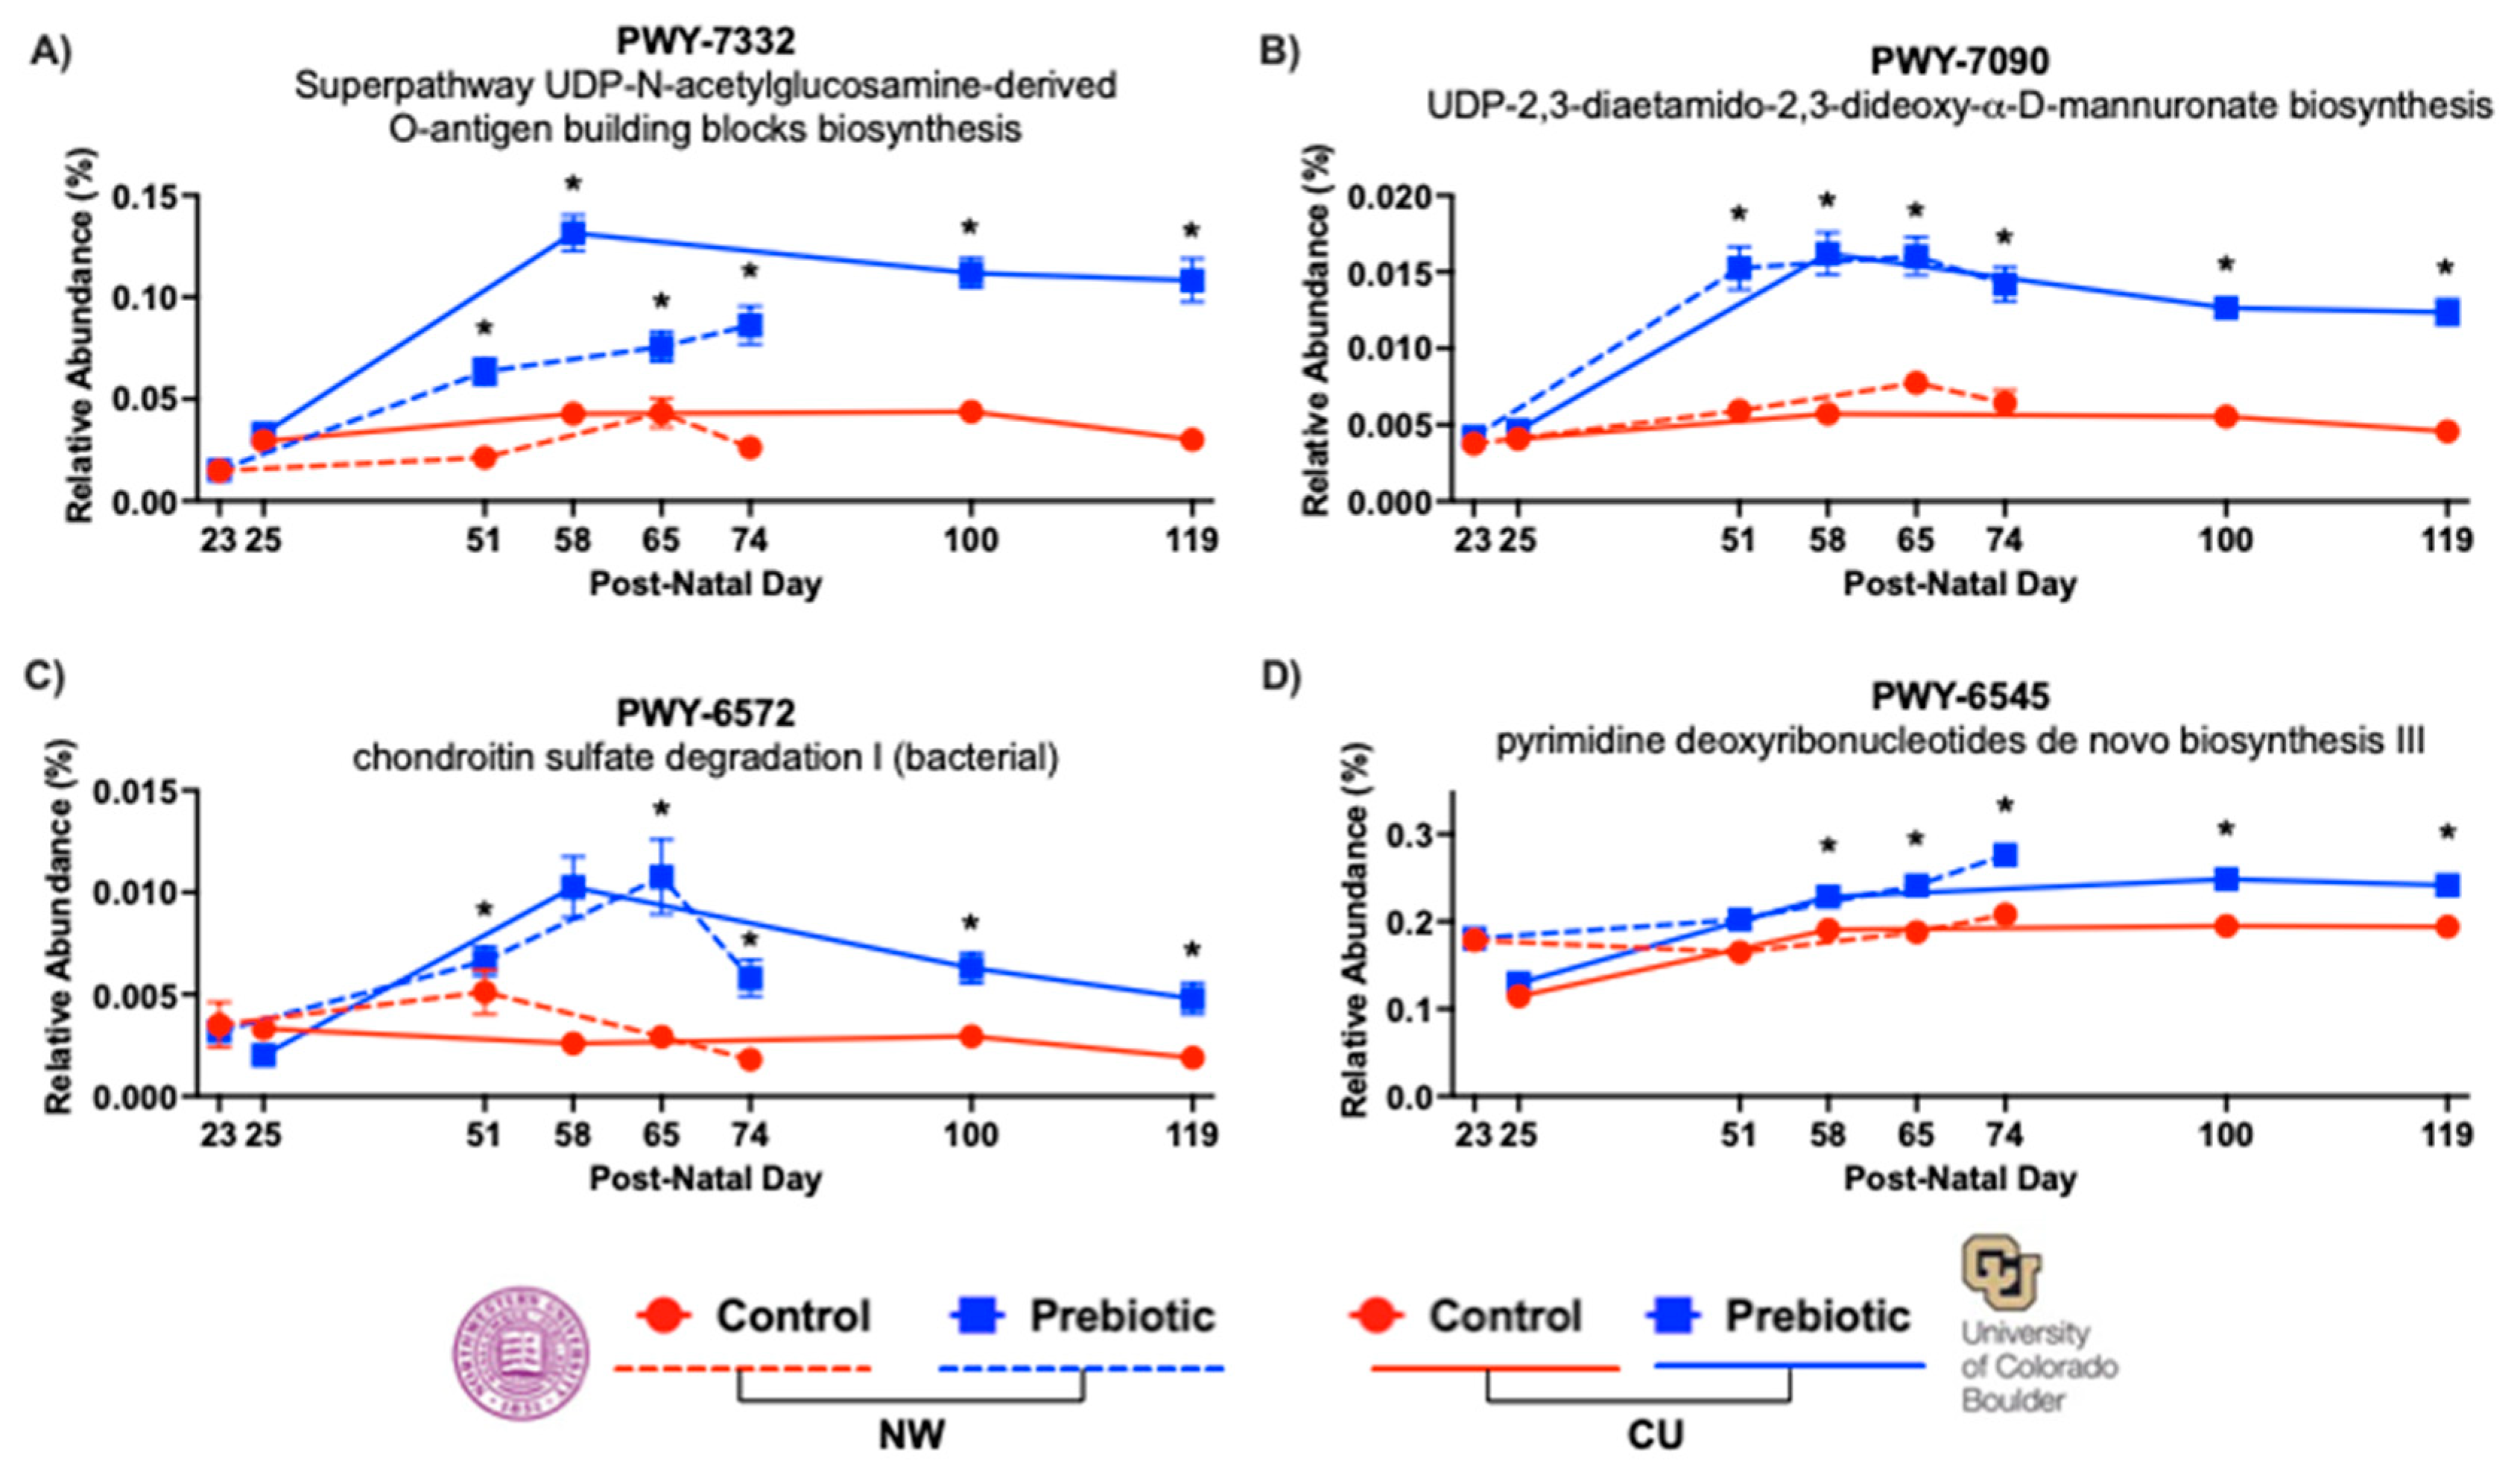
In both studies, prebiotic diet consistently affected the inferred functional metabolic pathways PWY-7332, PWY-7090, PWY-6572, and PWY-6545 across time (
Figure 7). The superpathway UDP-N-acetylglucosamine-derived O-antigen building blocks biosynthesis or PWY-7332 was significantly higher in the prebiotic diet in the NW study (
F(2.71, 59.49) = 60.04; p < 0.0001;
Figure 7A) and in the CU study (
F(1, 2.62) = 182.60; p < 0.0001;
Figure 7A). The UDP-2,3-diaetamido-2,3-dideoxy-α-D-mannuronate biosynthesis or PWY-7090 was significantly higher in prebiotic diet in the NW study (
F(1, 2.81) = 71.76; p < 0.0001;
Figure 7B) and in the CU study (
F(1, 2.47) = 132.21; p < 0.0001;
Figure 7B). The chondroitin sulfate degradation I (bacterial) or PWY-6572 was also significantly higher in the prebiotic diet in the NW study (
F(1, 2.79) = 56.76; p < 0.0001;
Figure 7C) and in the CU study (
F(1, 2.80) = 43.33; p < 0.0001;
Figure 7C). Finally, the prebiotic diet increased the pyrimidine deoxyribonucleotides de novo biosynthesis III or PWY-6545 in the NW study (
F(1, 2.87) = 17.29; p < 0.0001;
Figure 7D) and in the CU study (
F(1, 2.74) = 30.10; p < 0.0001;
Figure 7D). There was also significant diet by time interactions for PWY-7332 in the NW study (
F(2.71, 59.49) = 11.90; p < 0.0001; see
Figure 7A for results of post hoc comparisons) and the CU study (
F(2.62, 69.98) = 16.90; p < 0.0001; see
Figure 7A for results of post hoc comparisons); for PWY-7090 in the NW study (
F(2.81, 57.58) = 9.13; p < 0.0001; see
Figure 7B for results of post hoc comparisons) and the CU study (
F(2.47, 62.56) = 15.61; p < 0.0001; see
Figure 7B for results of post hoc comparisons); for PWY-6572 in the NW study (
F(2.79, 58.32) = 4.05; p = 0.008; see
Figure 7C for results of post hoc comparisons) and the CU study (
F(2.80, 67.23) = 12.36; p < 0.0001; see
Figure 7C for results of post hoc comparisons); and for PWY-6545 in the NW study (
F(2.87, 57.55) = 3.47; p = 0.017; see
Figure 7D for results of post hoc comparisons) and the CU study (
F(2.74, 69.77) = 16.90; p < 0.0001; see
Figure 7D for results of post hoc comparisons).
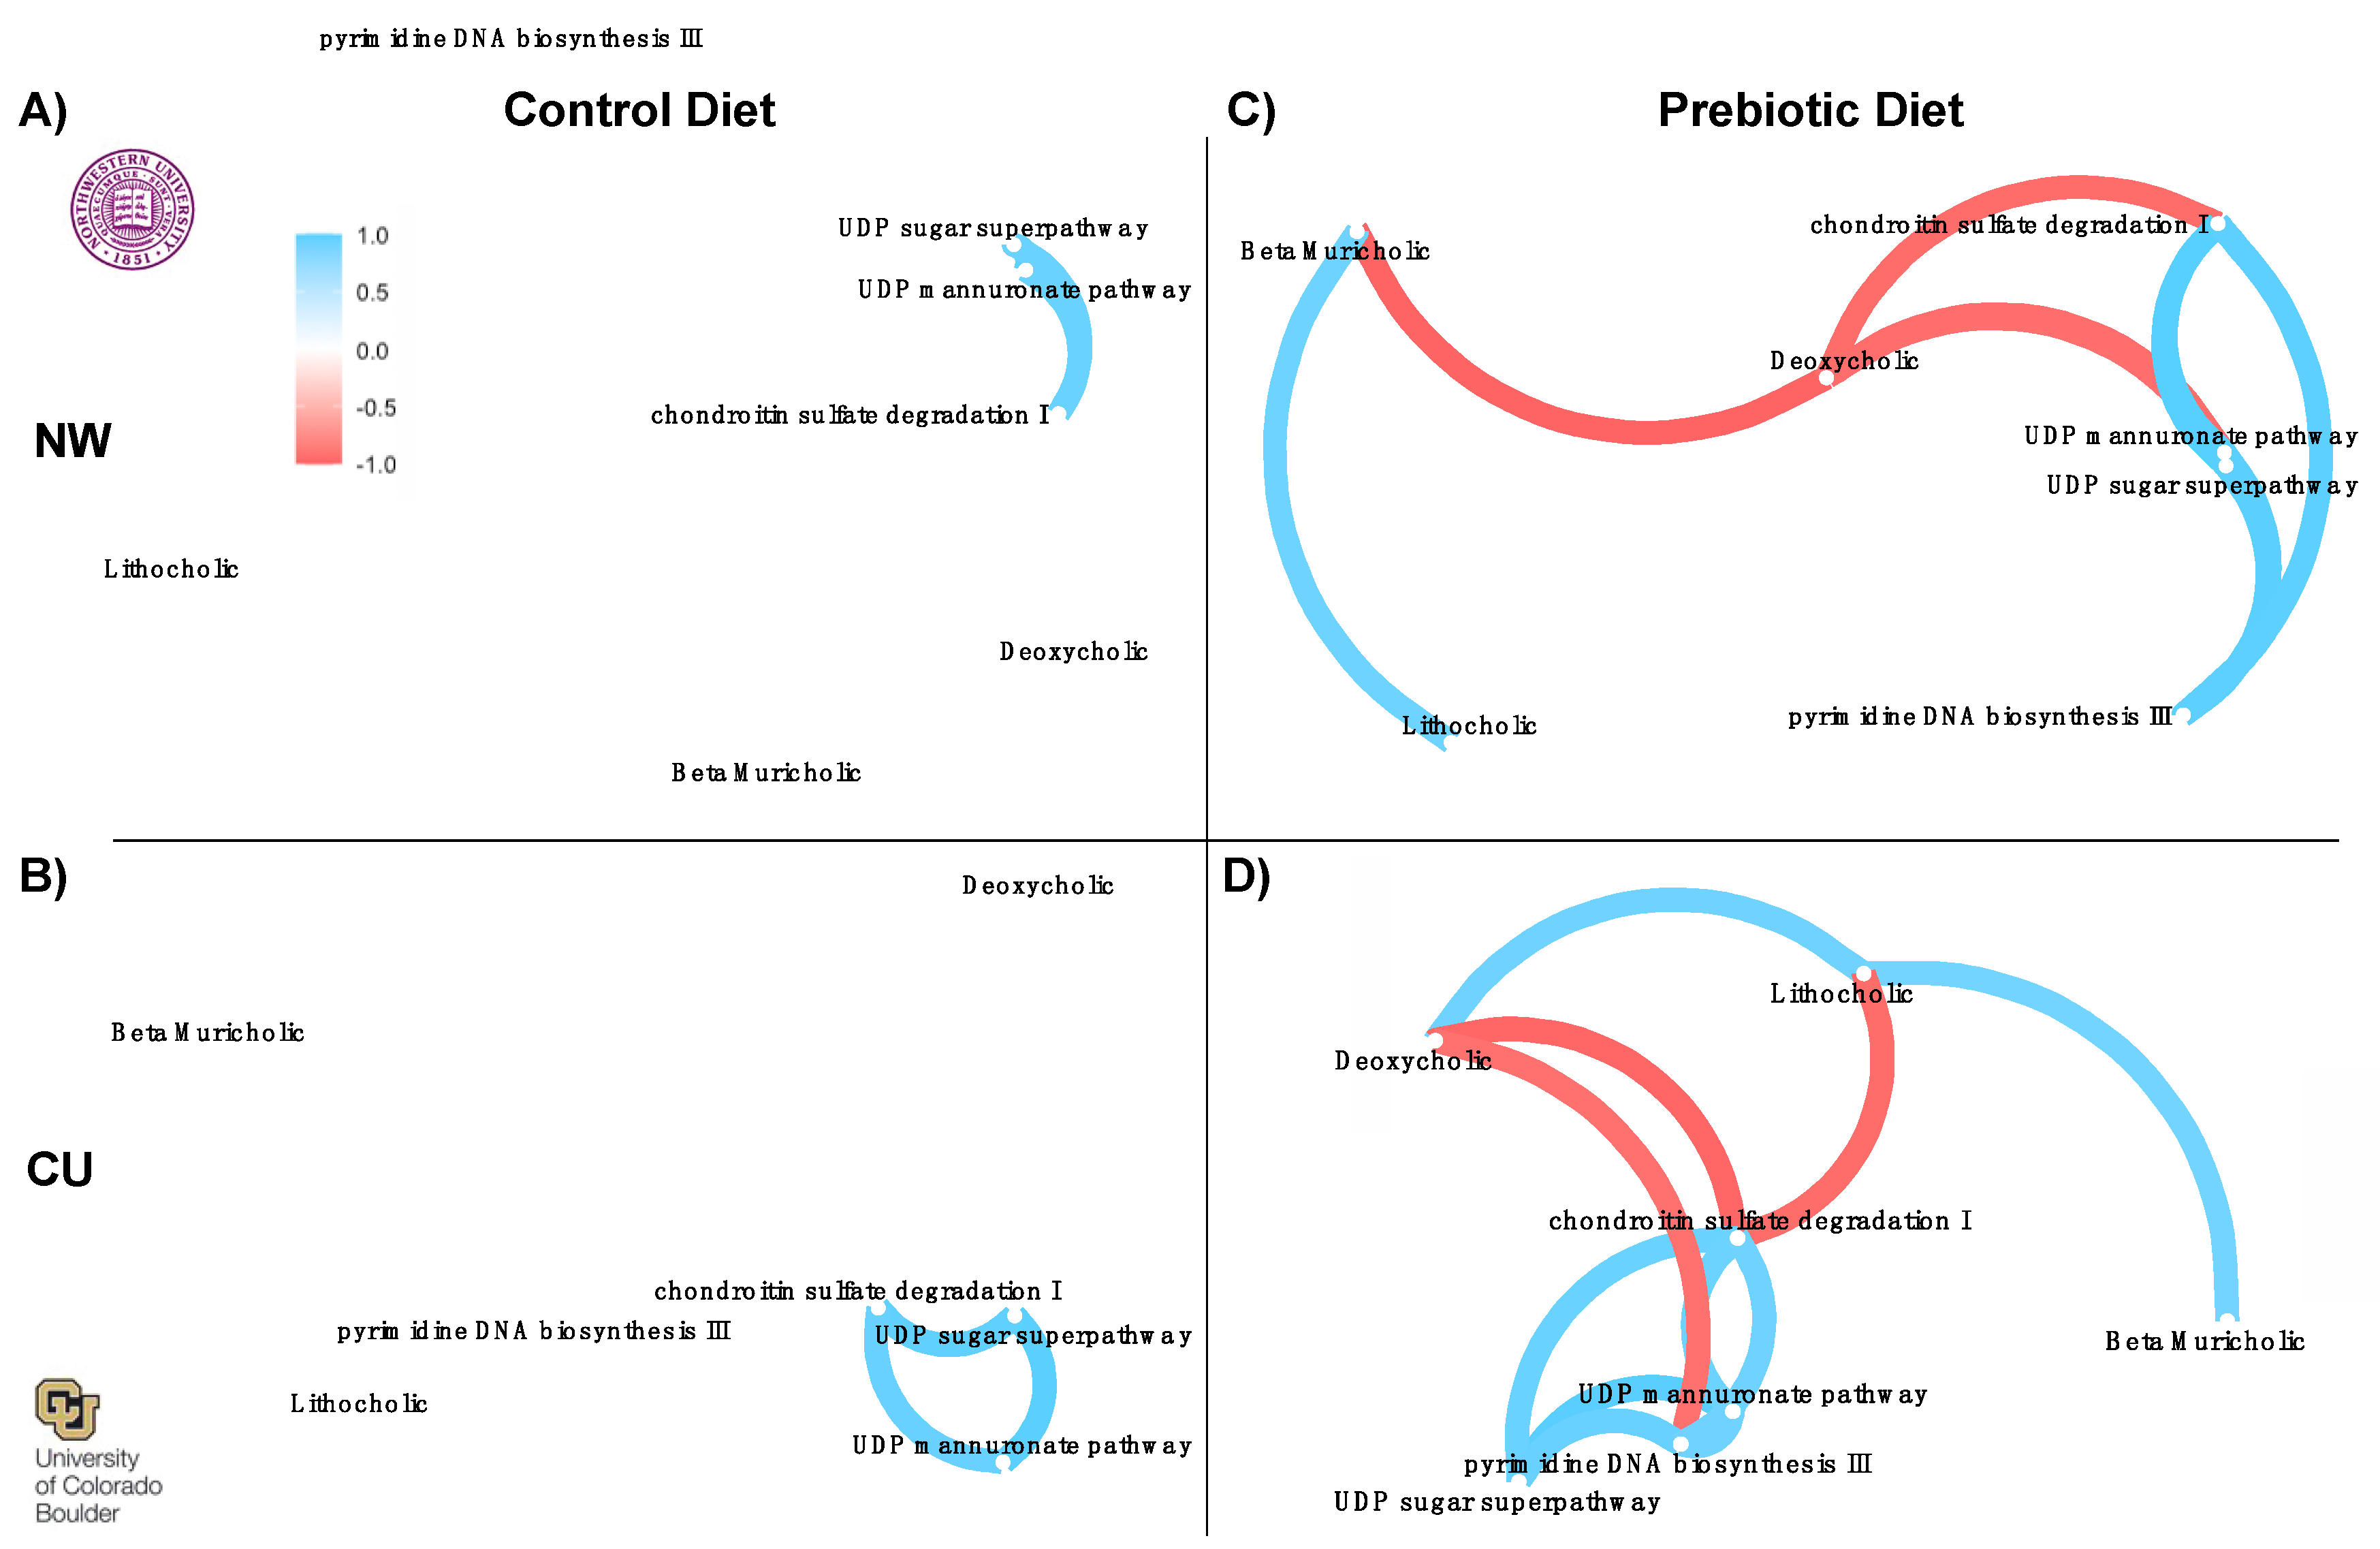
Correlation network analysis was performed to examine similarities in prebiotic diet effects between study sites with output from the network analyses shown in
Figure 8. Input to the networks were bile acids (
Figure 6) and inferred pathways (
Figure 7) significantly affected by prebiotic diets between study sites. There were no consistent correlations between pathways and bile acids in the control diets across studies (
Figure 8A,B). In contrast, there were consistent correlation networks between inferred pathways and the bile acid data in prebiotic diet groups (
Figure 8C,D). The prebiotic diet groups had consistent negative correlations between deoxycholic acid and the four inferred pathways (
Figure 8). There was also a consistent positive correlation between lithocholic acid and beta muricholic acid beta between study sites in prebiotic diet groups. One difference, however, was a negative correlation between deoxycholic acid and lithocholic acid at NW (
Figure 8C) but a positive correlation between these two bile acids at the CU study site (
Figure 8D).
4. Discussion
Ingestion of a diet enriched in GOS/PDX produces dynamic and robust changes in the gut microbial composition and microbial-dependent bile acids. Despite differences in research personnel, animal facilities, geographic locations, elevations, and animal sources, the temporal pattern of microbial changes, bacterial-dependent metabolites, and functional metabolic pathways was replicated between study sites. The prebiotic diet also modulated relative abundances of several genera, reduced microbial-modified bile acids, and altered networks between inferred functional microbial pathways and microbial-modified gut bile acids. Importantly, these changes were sufficiently robust to overcome potential environmental differences between the studies.
Based on measures of β-diversity (UniFrac distance), which take into account phylogenetic relationships [
59], dietary prebiotics changed both weighted and unweighted UniFrac distance at both study sites, similar to prior studies [
23,
24]. In the CU study, weighted UniFrac distance was altered after 2 days on a prebiotic diet, suggesting rapid growth of higher abundance genera. Dietary prebiotics produced significant compositional changes in α-diversity metrics (Evenness, Faith_PD, Observed Features) at both study sites; however, the metrics of induced changes were different. In the NW study, prebiotics reduced Faith_PD and Observed Species, whereas in the CU study, prebiotics increased Evenness. These variable impacts of prebiotic diet on α-diversity between study sites could reflect inherent differences in the starting microbiomes between study sites.
Consumption of a diet enriched in GOS/PDX at NW and CU increased the relative abundance of the
Bacteroides genus. Based on the ASV and prior shotgun sequencing data from a subset of these samples,
Bacteroides uniformis, a member of the
Bacteroides genus, was also significantly increased (p = 0.0003) by GOS/PDX [
24]. Ingestion of
Bacteroides uniformis produces metabolic, immune, and exercise endurance benefits [
60,
61]. These studies support the idea that increased relative abundance of specific taxa within the Bacteroides genus may be health-promoting.
Consumption of a diet enriched in GOS/PDX also increased the relative abundance of the
Parabacteroides genus. The
Parabacteroides genus has been shown to be decreased on a high-fat diet and increased with exercise [
62].
Parabacteroides distasonis is a species within the
Parabacteroides genus. GOS/PDX supplementation increases
Parabacteroides distasonis and restores disturbed sleep and circadian rhythm [
23,
24]. Based on these studies, increases in
Parabacteroides may be health-promoting. Importantly, however,
Parabacteroides growth left unchecked or not kept in balance could be detrimental to the gut microbial ecosystem [
63].
Additional changes to the gut microbial ecosystem include prebiotic-induced increases in the genera
Incertae_Sedis (formerly known as
Ruminiclostridium V based on ASV) and
Ruminococcus gauvreauii group. Increases in levels of
Ruminiclostridium V subsequent to administration of PDX are associated with improved cognitive performance [
64]. And, in contrast, low levels of
Ruminiclostridium V have been reported for people with kidney stones [
65] and rats with acute necrotizing pancreatitis [
66]. Consistent with our data, the genera
Ruminococcus gauvreauii group is increased by fructoooligosaccharides [
26], and this genus is lower in individuals with obesity [
67], coronary artery disease [
68] and Parkinson’s disease [
69]. These findings taken together, therefore, suggest that the genera
Incertae_Sedis (formerly known as
Ruminiclostridium V based on ASV) and
Ruminococcus gauvreauii group may be health-promoting.
The genus
UCG-007 was also increased across time quite similarly between studies but little is known about it other than that it varies seasonally [
70]. The genera
Clostridia_UCG-014,
Christensenellaceae_R-7_group,
Parasutterella, and
Lachnospiraceae_UCG-006 were also all elevated due to prebiotic diet, but the temporal effects on these genera were less consistent between study sites.
In addition to increases in relative abundances of health promoting genera, several genera were reduced by prebiotic diet. Most notably, the genus
Lachnospiraceae_NK4A136_group was consistently lower in prebiotic diet groups at both study sites and has recently been implicated in gut mucous membrane function [
71]. The genus
UCG-005, within the Oscillospiraceae family, was lower in prebiotic diet groups. This lower relative abundance of
UCG-005 may be health-promoting given that
UCG-005 is elevated in diabetes patients and is associated with elevated uric acid [
72]. The genus
Eubacterium_fissicatena_group was lower in prebiotic diet groups and is potentially harmful to bone mineral density [
73] and correlates with obesity in a high-fat diet model [
74]. Prebiotic diet also lowered
Eubacterium_ruminantium_group,
GCA-900066575, and
Rikenellaceae_RC9_gut. Less is known about how and if these genera relate to host health.
Not only did prebiotics change the microbial composition of the gut microbiome, but they also impacted specific features of the gut metabolome. The sequencing data were analyzed using PICRUSt2 and annotated with the MetaCyc metabolic pathway database. These analyses identified four inferred functional metabolic pathways that were changed by prebiotic diet. Importantly, prebiotic diet impacted the same pathways between study sites with remarkably similar time courses (
Figure 7). The first pathway, UDP sugar superpathway (PWY-7332), is involved in building the O-antigen polysaccharide for gram-negative bacteria, including
Parabacteroides distasonis, which is a component of lipopolysaccharide. The second pathway, the UDP mannuronate biosynthesis pathway (PWY-7090), was identified for both study sites and is involved in UDP-sugar metabolism. Clearly, the consumption of dietary prebiotics affected the UDP-sugar pathway. The third pathway affected by prebiotics, chondroitin sulfate degradation I (PWY-6572), is involved in the degradation of chondroitin sulfate, which is a sulfated glycosaminoglycan that can affect the gut microbiome composition [
75] and increase fecal butyrate levels in stressed mice [
76]. The fourth pathway was pyrimidine DNA biosynthesis III (PWY-6545), which is involved in the biosynthesis of the activated precursors of DNA/RNA.
While the significance of how the gut metabolome and host physiology are affected by changes in these inferred pathways cannot be deduced from the PICRUSt2 analysis, there is evidence that consumption of GOS/PDX facilitated host sleep/circadian recovery after stressor exposure [
23,
24]. Clearly, consumption of GOS/PDX consistently affected these four functional metabolic pathways between study sites similarly across time. These findings support the idea that dietary prebiotics consistently and similarly altered the micro-ecosystem of the gut microbiome.
A prebiotic diet changes specific gut metabolites with bioactive potential, including microbial modified secondary bile acids [
23,
24,
34]. Prebiotic diet consumption produced similar decreases in fecal deoxycholic acid and lithocholic acid between study sites. It has been demonstrated that consumption of a diet enriched in isomaltulose [
25] and fructooligosaccharide [
26] prebiotics, also reduces fecal lithocholic and deoxycholic acid. In contrast, a high-fat diet increases both fecal deoxycholic acid and intestinal inflammation [
77]. Here we report that GOS/PDX reduces fecal deoxycholic acid and lithocholic acid and this finding was consistent at both study sites. The current data and prior studies support the conclusion that consumption of prebiotic diet reduces fecal bile acids and changes the micro-ecosystem of the gut similarly.
Our findings indicate that consumption of a prebiotic diet consistently affects functional metabolic pathways and fecal bile acid profiles. We conducted network correlation analyses between functional metabolic pathways and fecal bile acids to determine if these changes are related. Correlational networks between pathways and bile acids were not observed in the control diet groups. However, network correlations were found in the prebiotic groups. Specifically, bile acids were significantly correlated with the functional metabolic pathways. The network correlations in both prebiotic diet groups were remarkably similar between study sites with what appears to be a network hub at deoxycholic acid. Based on these findings and previous work [
23,
24], we hypothesize that decreases in deoxycholic acid may be a key metabolic feature underlying the potential health promoting effects of GOS/PDX. Deoxycholic acid can bind to the Takeda G protein-coupled receptor 5 (TGR5), which is specific for bile acids and is known to activate several intracellular signaling pathways [
78,
79].
We demonstrate that dietary GOS/PDX produces robust and reproducible changes in the microbial composition of the gut micro-ecosystem sufficient to overcome unforeseen environmental impacts, addressing a gap in the literature [
11,
12,
13,
14]. Although some variations between the Northwestern study and the Colorado studies exist, the consistent pattern of taxonomic changes across time and impacts on functional metabolic pathways are similar. We identified consistent correlational networks associating the changes in bile acids and functional pathways, which supports the robust nature of the effects. Notable, the networks were found in the prebiotic groups and not the control diet groups, supporting the conclusion that the changes are driven by prebiotics. Finally, these key findings were reproduced at both study sites. Overall, prebiotic diet increases and decreases the relative abundances of several genera, which may support a health-promoting gut micro-ecosystem.
Figure 1.
–Experimental timeline detailing methods and fecal sampling events. In both studies, animals arrived on postnatal day 23 and were immediately placed on either control diet or prebiotic diet. In the Northwestern study fecal samples were taken on experimental (postnatal) days 0 (23), 28 (51), 42 (65), and 51 (74) while in the CU study fecal samples were taken on experimental days 2 (25), 33 (58), 75 (100), and 94 (119).
Figure 2.
– Unweighted and weighted UniFrac distance examining β-diversity of the fecal microbiome between studies. A) In the NW study, unweighted UniFrac distance at experimental day 0 was not different between control and prebiotic diets but was on subsequent days 28, 42, and 51. B) In the CU study, unweighted UniFrac distance at experimental day 2 was not different between control and prebiotic diets but was on subsequent days 33, 75, and 94. C) In the NW study weighted UniFrac distance was not different on day 0 between control and prebiotic diets but was on the remaining days examined. D) In the CU study weighted UniFrac distance was significantly different on day 2 between control and prebiotic diets, an effect that persisted for days 33, 75, and 94.
Figure 3.
– Consumption of prebiotic diet produced increases in 9 higher abundance genera between studies. There were consistent increases across time due to prebiotic diet in A) Bacteroides, B) Parabacteroides, E) Incertae_Sedis (Ruminiclostridium V), G) Ruminococcus_gauvreauii_group, and H) UCG-007. While there were prebiotic diet induced increases in C) Clostridia_UCG-014, D) Christensenellaceae_R-7_group, F) Parasutterella, and I) Lachnospiraceae_UCG-006, these genera had less consistent increases across time between studies. * p < 0.05 when compared to control diet.
Figure 4.
– Consumption of prebiotic diet led to decreases in 6 higher abundance genera between studies. There were consistent decreases across time due to prebiotic diet consumption in A) Lachnospiraceae_NK4A136_group, C) UCG-005, E) Eubacterium_fissicatena_group, F) Eubacterium_ruminantium_group, G) GCA-900066575, and I) Rikenellaceae_R9-gut_group. There were less consistent effects due to diet between studies in B) Eubacterium_ coprostanoligenes_group, D) Colidextribacter, H) Roseburia. * p < 0.05 when compared to prebiotic diet.
Figure 5.
– There was a significant main effect of prebiotic diet increasing A) Evenness of alpha diversity in the CU study. In contrast, there were significant main effects of prebiotic diet decreasing both B) Faith_PD and C) Observed Features of alpha diversity in the NW study. There were no significant time by diet interactions in measures of alpha diversity.
Figure 6.
– Consumption of dietary prebiotics affected fecal bile acids between studies including A) muricholic acid beta, B) deoxycholic acid, and C) lithocholic acid. D) ursodexoycholic acid was decreased in the CU study, and E) glycodeoxycholic acid was decreased in the NW study.
Figure 6.
– Consumption of dietary prebiotics affected fecal bile acids between studies including A) muricholic acid beta, B) deoxycholic acid, and C) lithocholic acid. D) ursodexoycholic acid was decreased in the CU study, and E) glycodeoxycholic acid was decreased in the NW study.
Figure 7.
– Functional metabolic pathways affected by prebiotic diet annotated with the MetaCyc metabolic pathway database. Consumption of dietary prebiotics altered the A) superpathway UDP-N-acetylglucosamine-derived O-antigen building blocks biosynthesis (PWY-7332) or the UDP sugar superpathway, the B) UDP-2,3-diaetamido-2,3-dideoxy-α-D-mannuronate biosynthesis (PWY-7090) or UDP mannuronate pathway, the C) chondroitin sulfate degradation I (bacterial) pathway (PWY-6572), and the D) pyrimidine deoxyribonucleotides de novo biosynthesis III pathway (PWY-6545) when compared to control diet. These effects were consistent between study sites and across time. * p < 0.05 when compared to control diet.
Figure 8.
– Network correlations from both study sites demonstrating consistent networks between inferred functional metabolic pathways and bile acids in prebiotic diet groups. There were no consistent correlation networks present in the control diet groups between study sites (A, B). The consistent correlation networks in the prebiotic diet groups C) at NW and D) at CU imply that the microbially modified secondary bile acid, deoxycholic acid, could be an important component underlying the beneficial effects of dietary prebiotics.
Table 1.
– PERMANOVA table demonstrating significant effects of prebiotic diet by time point at both study sites. Numbers represent days on diet.
Table 1.
– PERMANOVA table demonstrating significant effects of prebiotic diet by time point at both study sites. Numbers represent days on diet.
| PERMANOVAs (pseudo-F) |
|---|
| |
Northwestern |
| |
0 |
28 |
42 |
51 |
| Unweighted |
F(2,68) = 1.24; p = 0.154 |
F(2,80) = 7.68; p = 0.001
|
F(2,66) = 5.60; p = 0.001
|
F(2,69) = 5.87; p = 0.001
|
| Weighted |
F(2,68) = 2.19; p = 0.053 |
F(2,80) = 9.31; p = 0.001
|
F(2,66) = 4.26; p = 0.001 |
F(2,66) = 4.34; p = 0.001
|
| |
University of Colorado Boulder |
| |
2 |
33 |
75 |
94 |
| Unweighted |
F(2,48) = 1.31; p = 0.053 |
F(2,78) = 4.89; p = 0.001
|
F(2,83) = 3.84; p = 0.001
|
F(2,84) = 4.16; p = 0.001
|
| Weighted |
F(2,48) = 3.97; p = 0.006
|
F(2,78) = 10.99; p = 0.001
|
F(2,83) = 7.39; p = 0.001
|
F(2,84) = 3.93; p = 0.001
|
Table 2.
– Nonparametric longitudinal data (nparLD) Table: ANOVA-type statistic (ATS) showing the similar significant effects of a prebiotic diet across time on genera identified through ANCOM between study sites.
Table 2.
– Nonparametric longitudinal data (nparLD) Table: ANOVA-type statistic (ATS) showing the similar significant effects of a prebiotic diet across time on genera identified through ANCOM between study sites.
Table 3.
– Nonparametric longitudinal data (nparLD) Table: ANOVA-type statistic (ATS) showing significant effects of a prebiotic diet across time on all identified bile acids between study sites.
Table 3.
– Nonparametric longitudinal data (nparLD) Table: ANOVA-type statistic (ATS) showing significant effects of a prebiotic diet across time on all identified bile acids between study sites.
