1. Introduction
In Taiwan, cerebrovascular diseases are the leading cause of death worldwide and have been ranked fifth among the top ten causes of death in 2022 [
1]. Approximately 10% of the 795,000 strokes that occur annually in the United States are intracerebral hemorrhages (ICH)[
1]. In Taiwan, data from stroke registration indicates that ICH constitutes 15.9% of all stroke cases and is associated with a 30-day mortality rate of 19.8% and a 1-year mortality rate of 29.6% [
2]. The incidence of ICH incidence is higher in Taiwan than in Western populations. An analysis of the Taiwan National Health Insurance Research Database from 2011 to 2014, revealed that the odds of death for those with ICH were significantly higher, with an adjusted odds ratio of 5.80 compared to 2.07 for ischemic stroke [4]. Spontaneous intracerebral hemorrhage (ICH) remains one of the most serious subtypes of stroke, characterized by a high mortality rate, higher medical costs, and often resulting in poor functional outcomes[
2,
3].
Nutritional status is associated with mortality, length of hospitalization, and clinical outcomes with cerebrovascular diseases [
4,
5,
6]. Previous research has also indicated that acute ICH patient with poor outcomes had a greater degree of undernutrition compared to those without (p<0.001)[
7]. A low level of serum albumin can increase the risk of infections and mortality in critically ill patients [10,11]. Hypoalbuminemia is a simple marker of malnutrition that is a major cause of impaired immune response and serves as a reliable predictor of hospital-acquired infections [12]. Previous reports suggested a relationship between hypoalbuminemia and increased mortality in patients with ICH[
8,
9]. Furthermore, admission lymphopenia is associated with an increased risk of infection and unfavorable outcome in patients with spontaneous ICH[
10].
The prognostic nutritional index (PNI) is an objective and convenient biological marker that could
evaluate the immunological nutritional status by calculating the serum albumin concentration and the total number of peripheral blood lymphocytes.
Thus, PNI is more feasible in clinical work. In recent studies, the lower PNI has been shown to be associated with the worse New York Heart Association classification of coronary heart disease patients [
11]. Yang et al. found that PNI was an independent predictor of 30-day, 90-day, and 1-year mortality in critically ill stroke patients [
12]. An observational study revealed that preoperative PNI could be associated with the occurrence of postoperative pneumonia in patients with aneurysmal subarachnoid hemorrhage (aSAH) [
13].
However, the association and predictive value of PNI in the prognosis of patients with spontaneous intracerebral hemorrhage have not been reported. Therefore, our study aimed to explore the association between PNI and prognosis in patients with spontaneous intracerebral hemorrhage (ICH).
2. Materials and Methods
2.1. Study Populations
This retrospective study was conducted between January 2015 and December 2022, enrolling all patients admitted with spontaneous intracerebral hemorrhage (ICH) who received medical or surgical treatment in our medical unit at Changhua Christian Hospital, Taiwan. The diagnosis of ICH was initially confirmed by brain computed tomography (CT) scans at admission. The institutional review board waived the requirement of informed consent, since no intervention was performed and no personally identifiable information was disclosed.
2.2. Inclusion/Exclusion Criteria
Patients were included if they had spontaneous intracerebral hemorrhage. We excluded (1) patients < 20 years, (2) patients> 100 years, (3) patients with missing vital sign data, or (4) patients with incomplete biochemical data from this study.
2.3. Data Collection and Definition
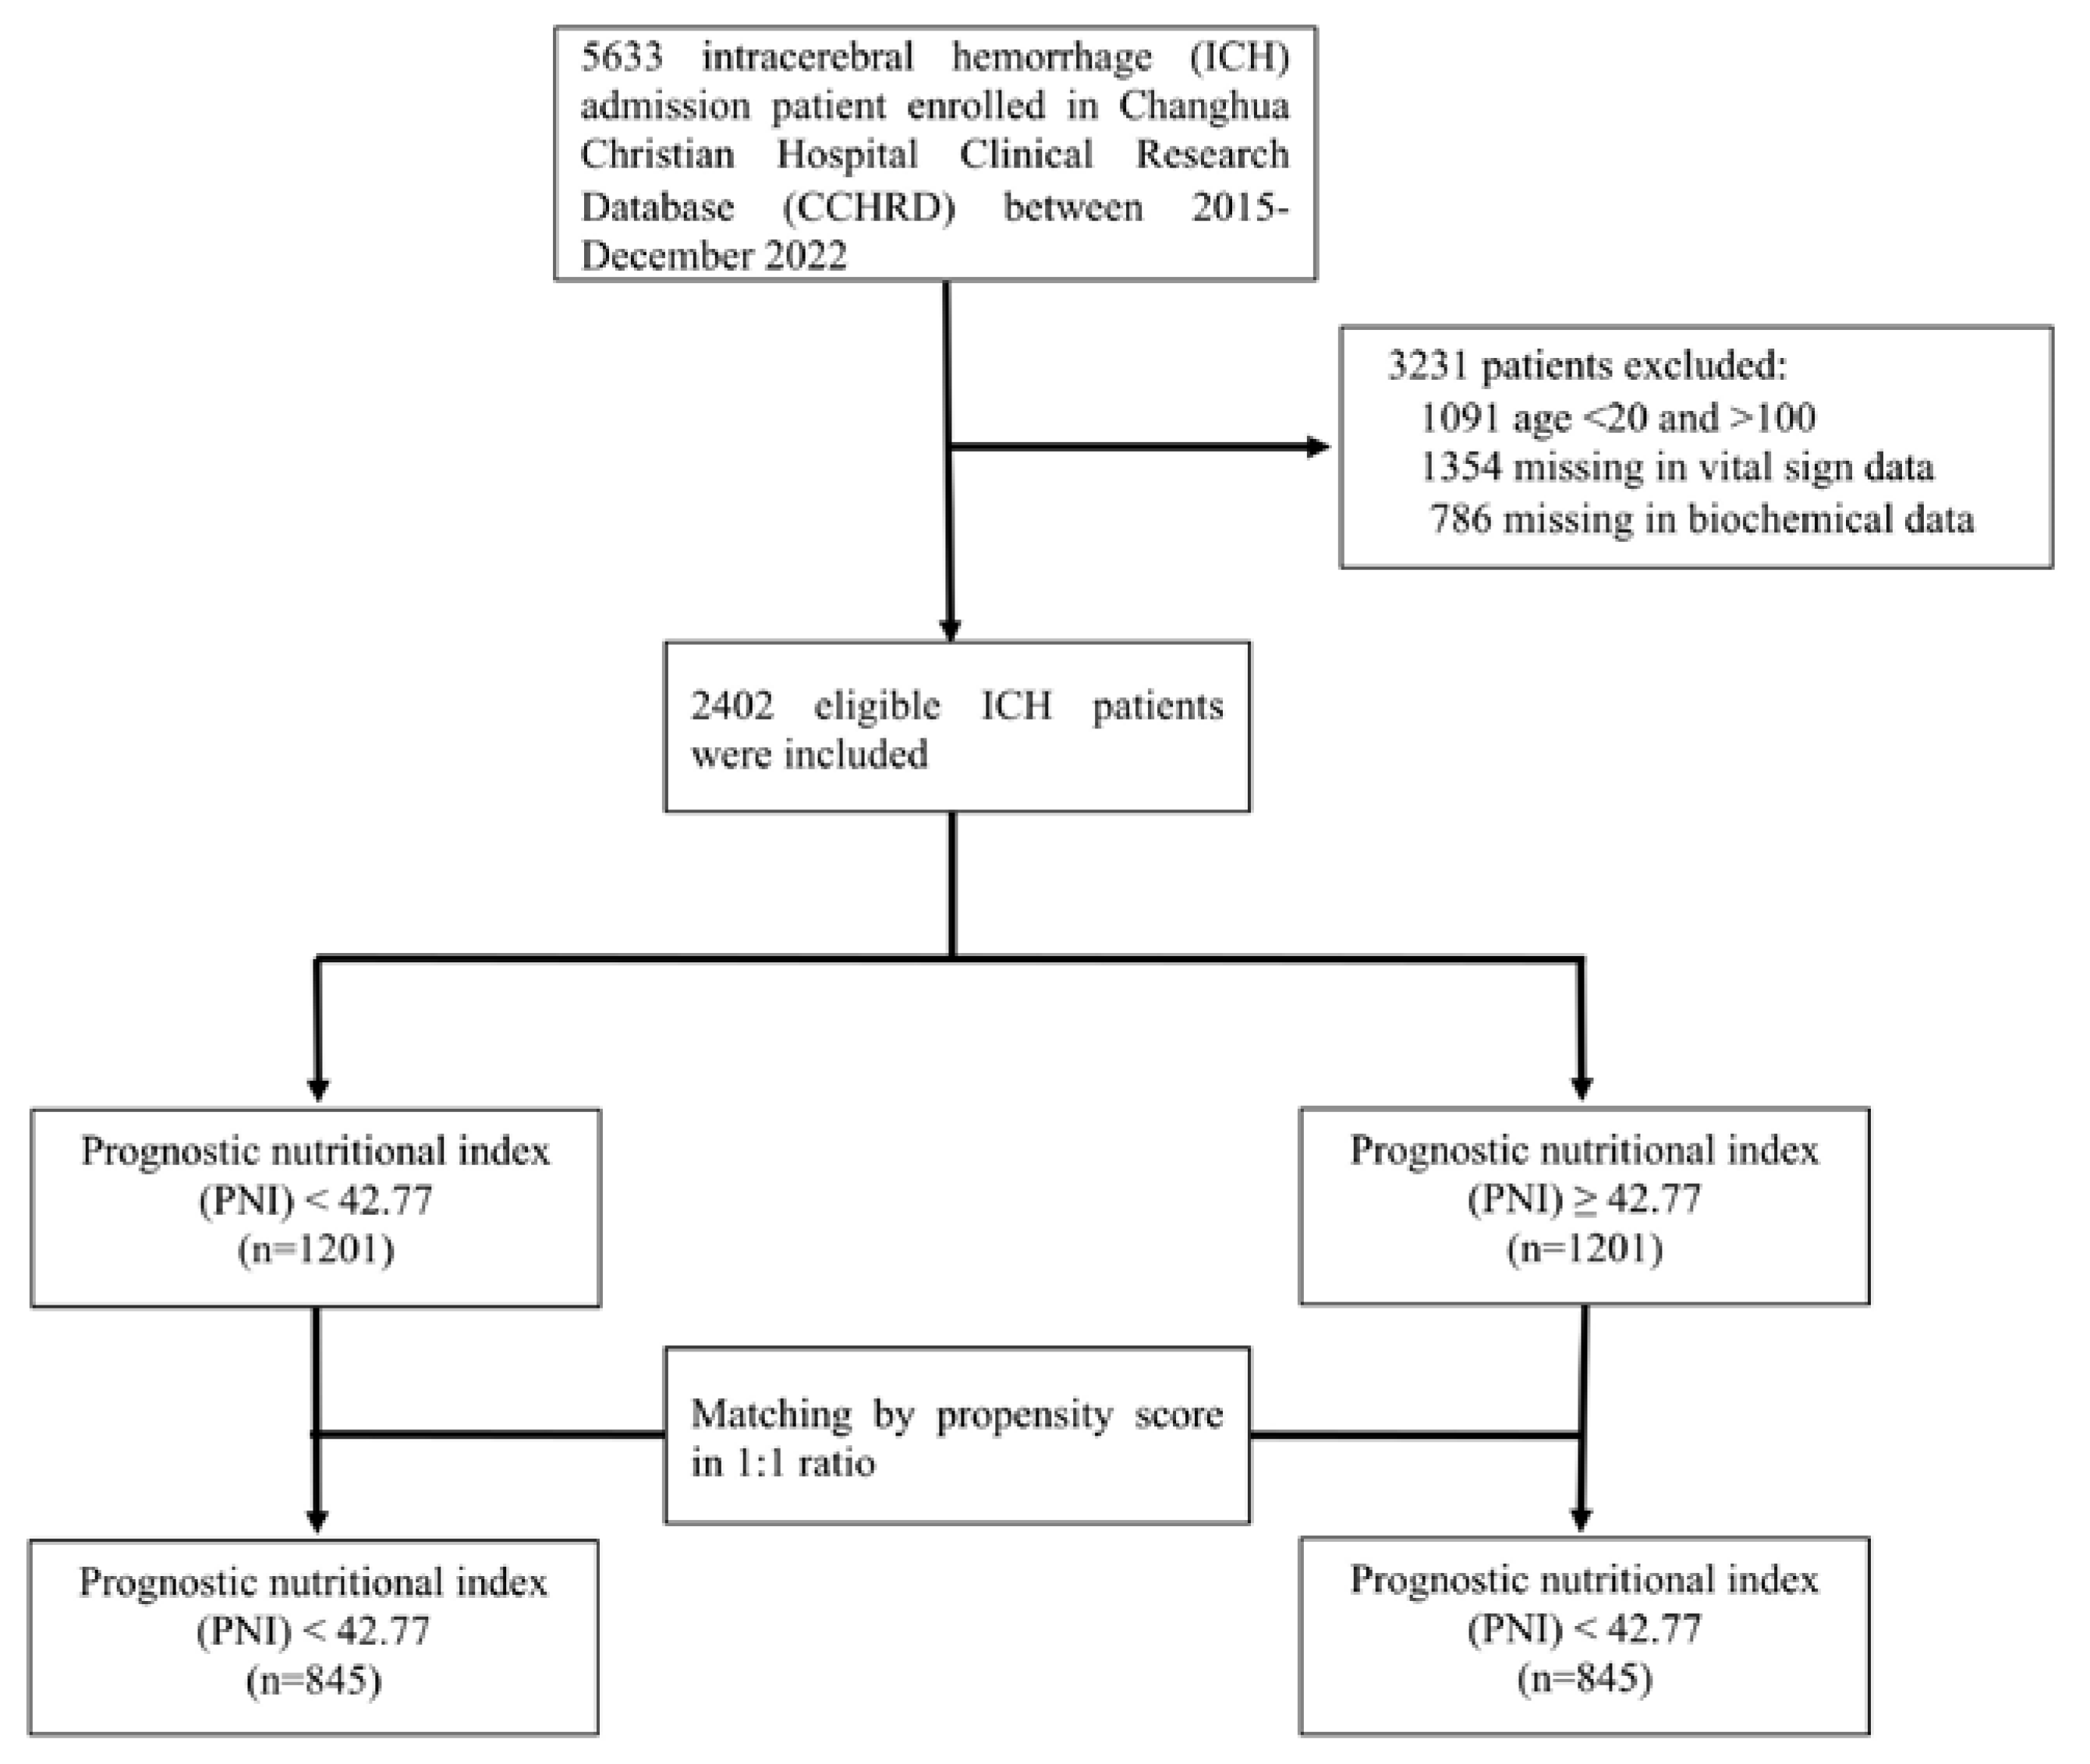
We included a total of five thousand six hundred thirty-three patients with spontaneous intracerebral hemorrhage at Changhua Christian Hospital between January 2015 and December 2022, and patient data were filtered in the Changhua Christian Hospital Clinical Research Database (CCHRD). We enrolled a total of two thousand four hundred and two cases of ICH in our study (
Figure 1). Our study was approved by the Institutional Review Board of CCH (IRB No: 230539).
The following data was collected: demographic variables, comorbidities, laboratory biochemical parameters, vital signs at admission, Charlson Comorbidity Index, and Glasgow Coma Scale from the medical records. Demographic characteristics included age, gender, and body mass index (BMI). The BMI was calculated as weight (kg)/height (m)². Comorbidities included hypertension, diabetes mellitus, and dyslipidemia. Vital signs included temperature, heart rate, respiratory rate, systolic blood pressure (SBP), diastolic blood pressure (DBP), and percutaneous oxygen saturation (SPO2) at the first admission. Laboratory parameters included red blood cells (RBC), white blood cells (WBC), lymphocytes, hemoglobin concentration, platelet count, red blood cell distribution width (RDW), serum creatinine, blood urea nitrogen (BUN), serum potassium, serum sodium, albumin, and HbA1c at first admission. The Charlson comorbidity index calculator estimates survival in patients with multiple comorbidities. It consists of 17 items related to various health conditions associated with mortality. Glasgow Coma Scale (GCS) is a neurological scale that is used to assess the level of consciousness and neurological functioning in patients. The GCS evaluates three components of neurological function: eye opening, verbal response, and motor response, with a lower score indicating a higher degree of coma. The PNI was calculated as follows: PNI = albumin (g/L) + 5 × lymphocyte (109/L). Patients were divided into low-value groups (PNI < 42.77) and high-value groups (PNI ≥ 42.77) according to the cut-off point.
2.4. Study Results and Definitions
The primary outcome was medical complications that developed during hospitalization, such as acute respiratory failure, stroke-associated pneumonia (SAP), urinary tract infection (UTI), seizures, cardiopulmonary resuscitation (CPR), sepsis, gastrointestinal bleeding, and acute venous thromboembolism, as recorded in the forms of the paper registry. Secondary outcomes were mortality at 28 days and 90 days after ICH. The start date was the date of admission of the patient.
2.5. Statistical Analysis
Categorical variables were presented as numerical proportions, and continuous variables were presented as mean ± standard deviation (SD) or median (interquartile range, IQR) according to the data distribution. Continuous variables were compared using Student's t test or Mann-Whitney U test and the chi-square test for categorical variables. Confounding factors always diminish the accuracy and objective of retrospective studies. Propensity score matching (PSM) analysis was performed to balance these clinical variables between groups, which could reduce potential bias to some extent. These patients were matched 1:1 using the nearest-neighbor algorithm with a caliper width of 0.017 and without replacement to identify the impact of PNI on ICH. Propensity score matching (PSM) was carried out to adjust for an imbalance of clinical parameters with a p-value of <0.05 in the multivariate analysis.
To investigate the associations between medical complications and PNI level in patients with spontaneous ICH, the logistic regression model was used. In order to investigate the correlation between 28- and 90- day mortality and the PNI level in patients with spontaneous ICH, we constructed the crude and multivariate Cox’s proportional hazard models. To improve the reliability of the results, two different adjustment models were applied before and after the propensity score matching.
Multivariate regression analyzes were performed and adjusted for potential covariates, including sex, age, GCS scores, history of diabetes mellitus, hypertension and hyperlipidemia, temperature, heart rate, respiratory rate, systolic blood pressure (SBP), diastolic blood pressure (DBP) and percutaneous oxygen saturation (SPO2), red blood cells (RBC), white blood cells (WBC), lymphocytes, hemoglobin concentration, platelet count, serum creatinine, blood urea nitrogen (BUN), serum potassium, serum sodium, HbA1c and Charlson comorbidity index. The relationship of PNI level with the 'Odds ratio' of inhospital complications and the 'Hazard ratio' of mortality at 28 and 30 days was evaluated using a restricted cubic spline with 4 knots. The Kaplan–Meier curves and log-rank test were used for survival analysis. Kaplan–Meier analysis was performed to evaluate time-to-event outcomes and the evaluation of discrepancies was assessed by log-rank tests. A significant log-rank test suggests that there are differences in survival experiences between the compared groups. The predictive value of RAR was evaluated using the receiver operating characteristic (ROC) curve. The results are shown as the area under the curve (AUC). A p-value < 0.05 was considered statistically significant in this study.
All statistical analyzes were performed with SAS and R software (version 4.1.0, accessed on May 18, 2021), and the R Archive Network (
http://cran.rproject.org). In this study, we define a p-value below 0.05 as statistically significant.
3. Results
3.1. Patient Characteristics before and after Propensity Score Matching
Among the 5633 patients with spontaneous ICH who were initially enrolled. We excluded 3231 people who (1) <20 years or >100 years (1091 patients), (2) missing vital sign data (1,354 patients) or (3) missing biochemical data (786 patients). Finally, in the present study, 2402 patients who met the screening criteria were included (
Figure 1). The comparison of demographic and clinical characteristics between the low PNI (< 42.77) and high PNI ( ≥ 42.77) groups before and after the propensity-score matching is presented in
Table 1.
Among the 2402 patients included in the present study. There were 1201 (50%) in the low PNI group and 1201(50%) in the high PNI group. The study population was 59.1 % male, and the mean age at diagnosis was 64 years.
Before propensity-score matching, spontaneous ICH patients with PNI < 42.77 had lower levels of BMI (P = 0.004), GCS scales (P < 0.001), diastolic blood pressure (P=0.039), body temperature P=0.023), Hb (P < 0.001), Na (P < 0.001), RBC (P < 0.001) , albumin (P < 0.001), platelet (P < 0.001), and lymphocyte counts (P < 0.001) ; higher levels of ages (P < 0.001), systolic blood pressure (P < 0.001), heart rate (P < 0.001), respiratory rate(P=0.006), creatine (P < 0.001),K (P =0.02), blood urea nitrogen (P < 0.001), red blood cell distribution width (P < 0.001), Charlson Comorbidity Index (P < 0.001), antihypertension treatment (P < 0.001), non-insulin antihyperglycemic treatment (P = 0.036), and insulin treatment (P =0.001). After that, we performed a propensity score matching analysis which divided into a low PNI group (n = 845) and a high PNI group (n = 845). All covariates were well balanced. BMI, GCS, Hb, RDW, albumin, WBC, and lymphocyte counts had statistically significant differences between the low PNI group and the high PNI group (
Table 1).
3.2. Association between PNI and in-Hospital Complication
In this study, the patients were subdivided into the following two groups according to the PNI value: < 42.77 (n=1201) and ≥42.77 (n=1201). The reference value for PNI was chosen as the median value, that is, 42.77 (OR=1).
Table 2 shows the association between PNI and in-hospital complication. A univariate logistic regression analysis demonstrated that patients in the high PNI group were significantly associated with a reduced risk of in-hospital complications (OR for the high group: 0.64; 95% CI 0.53-0.77; P < 0.001). In other words, the individuals in the high PNI group had a 0.64-fold lower risk of in-hospital complications in the crude logistic regression model. Similar results were also found in multivariate logistic regression and after analysis of propensity-score matching. When we included PNI as a categorical variable in the multivariate analysis, PNI levels were associated with in-hospital complication. (odds ratio, 0.69 ; 95% confidence interval, 0.55–0.87; P = 0.002).The odds ratio of in-hospital complications after propensity-score matching analysis was 0.74 (95% CI 0.58–0.94; p-value = 0.013) (
Table 2). We observed a significant association between PNI value and risk of in-hospital complications before and after propensity score-matched analysis.
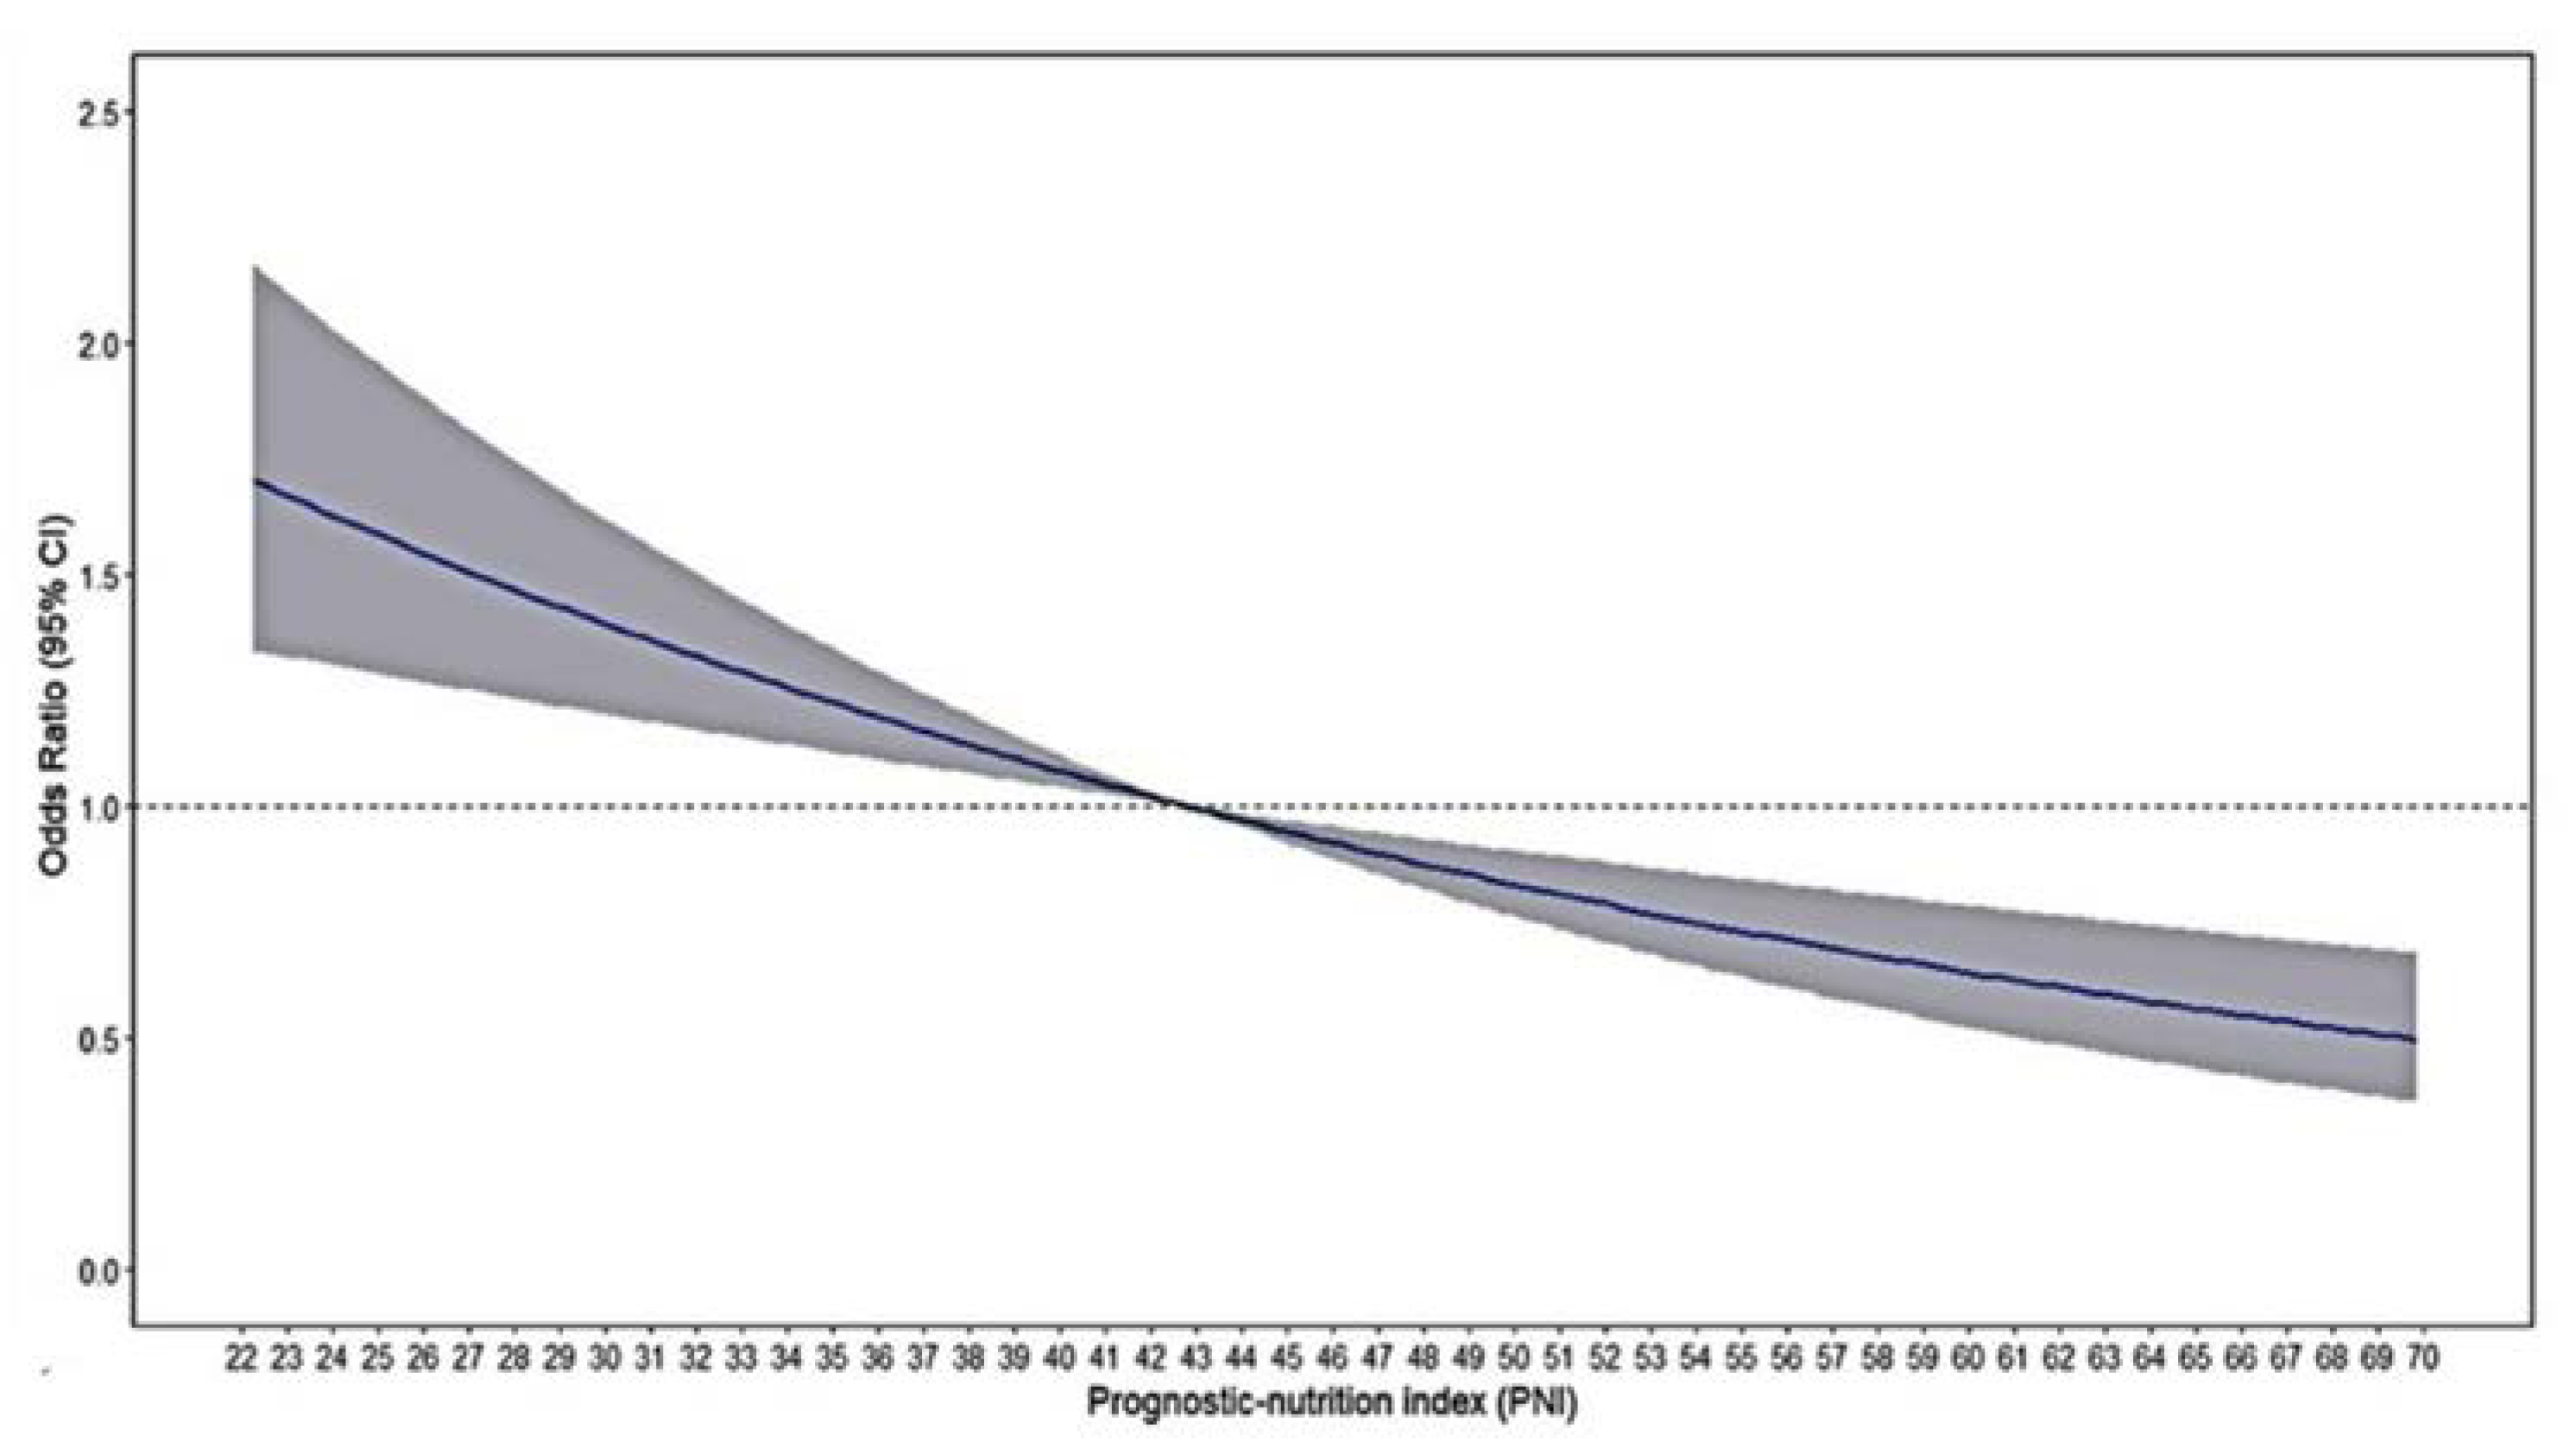
Restricted cubic spline analyses illustrate the shapes of the multivariate association between the PNI and in-hospital complications in the single-center study. An elevated risk of complications was observed with decreasing PNI levels (
Figure 2)
3.3. Association between PNI and 28- and 90-Day Mortality
We performed a Cox regression analysis to explore the association between PNI and mortality in patients with spontaneous ICH. The results, presented in
Table 3, revealed that the PNI serves as an independent predictor of 28- and 90-day mortality in spontaneous ICH patients. In the unadjusted model, the hazard ratio for the high group (PNI ≥ 42.77) was 0.46 (95% CI: 0.36-0.59) and 0.45 (95% CI: 0.35-0.57), respectively, that is, the decreased PNI (PNI < 42.77) was significantly associated with an increased incidence of 30-day and 90-day mortality. After adjustment was made, the hazard ratio (of 30-day and 90-day mortality for the high group) was 0.72 (95% CI: 0.55-0.94) and 0.72 (95% CI: 0.56-0.93), respectively, compared to the lower group. In the multivariate logistic regression analysis after PSM, the HR (of 30-day and 90-day mortality) of the PNI ≥ 42.77 group was 0.71 (95% CI: 0.52-0.98) and 0.69 (95% CI: 0.51-0.94), respectively. (
Table 3).
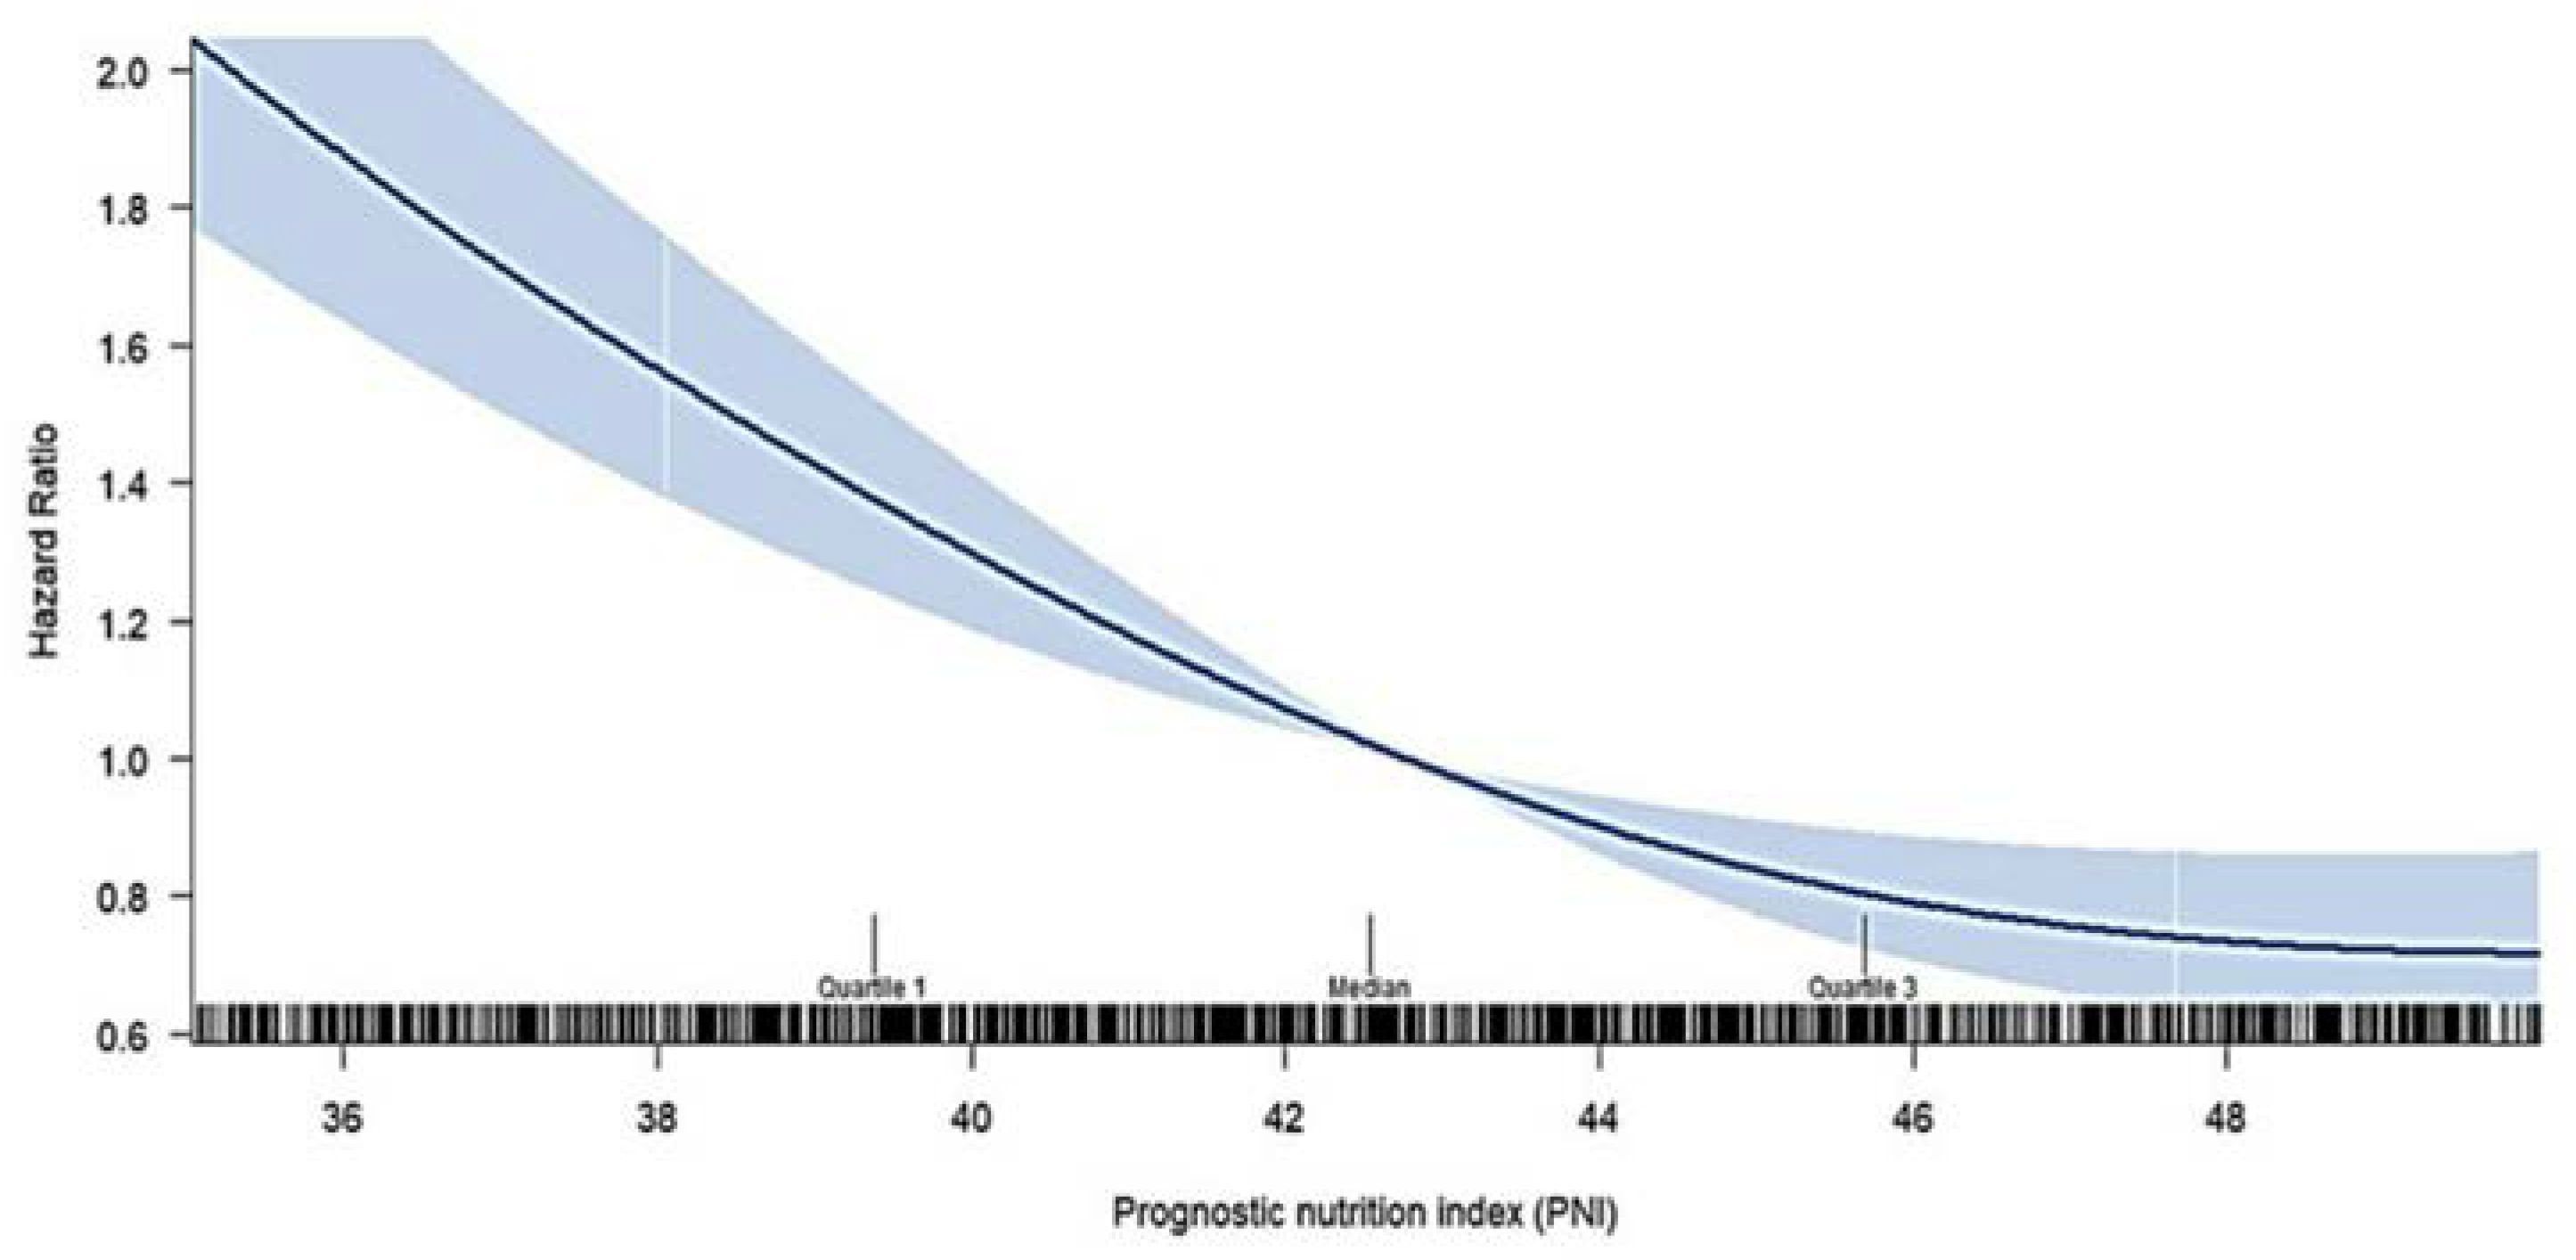
We further examined the crude hazard ratio (HR) for 90-day mortality by treating the PNI as a continuous variable, utilizing restricted cubic spline analysis in the Cox model, as shown in
Figure 3. The figure illustrates that the increased PNI level,the restricted cubic spline curve showed the trend of monotonic decrease in the risk of 90-days all-cause mortality.
3.4. Risk Factor for In-Hospital Complication and 28- and 90-Day Mortality
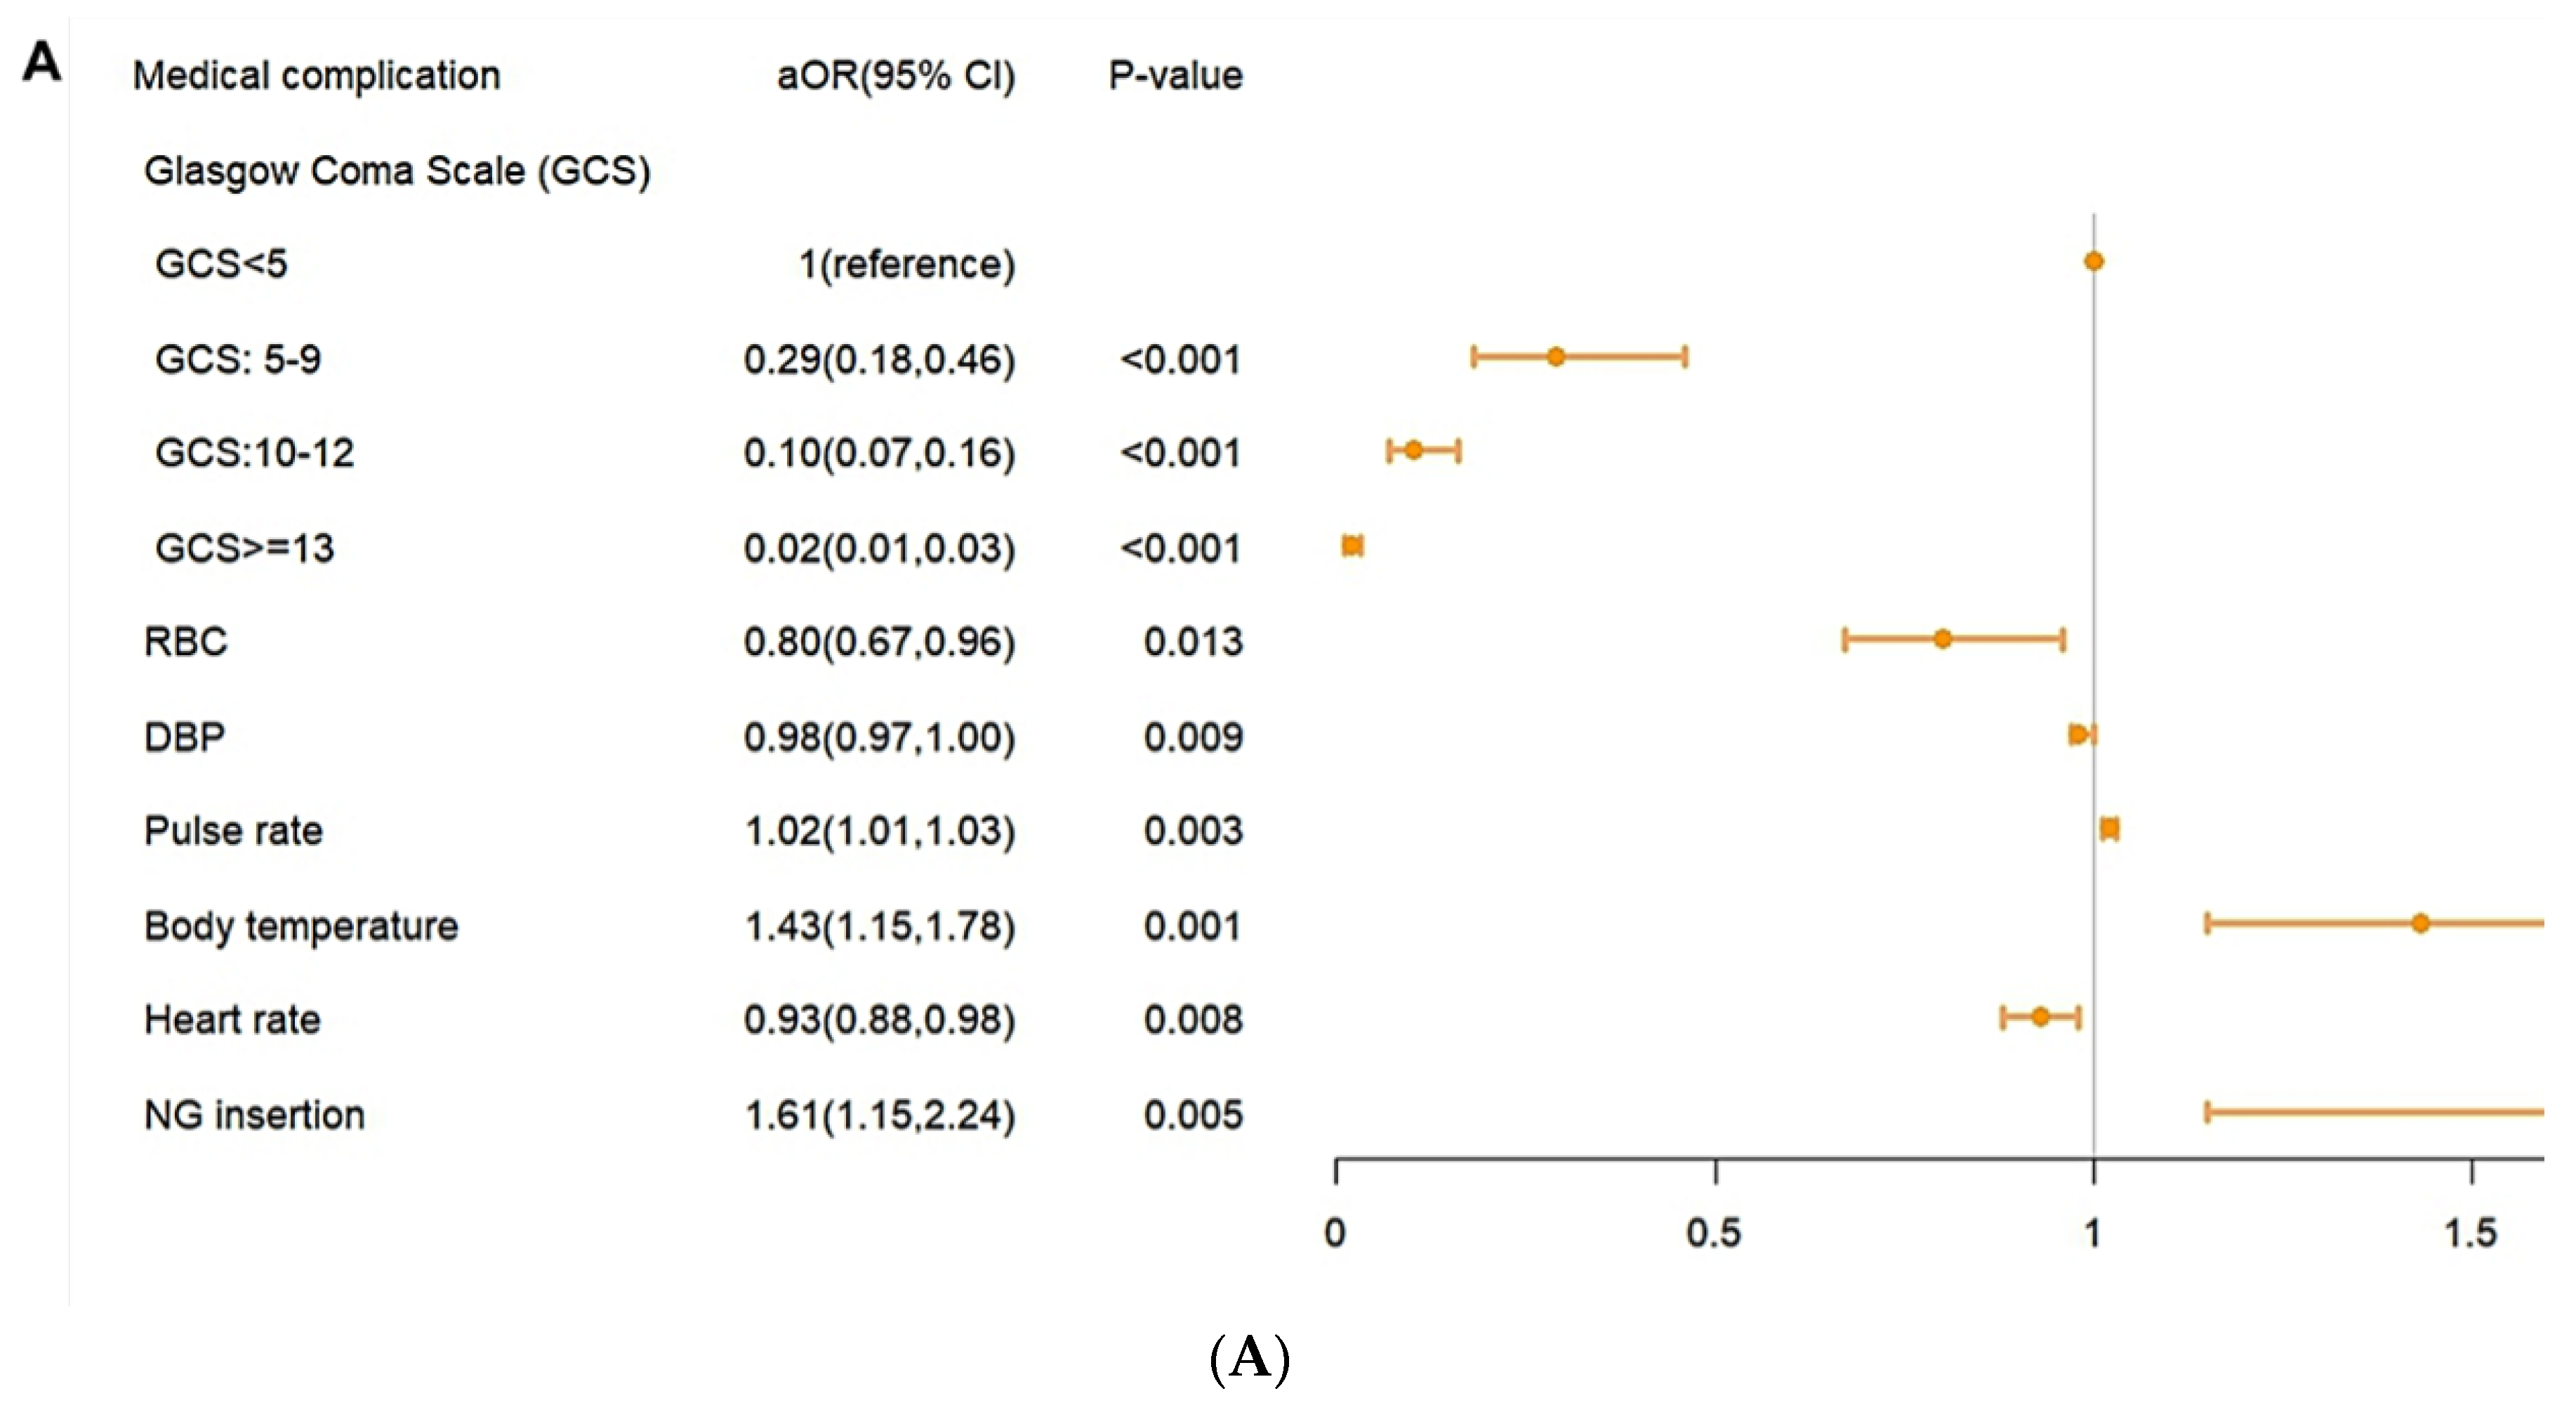
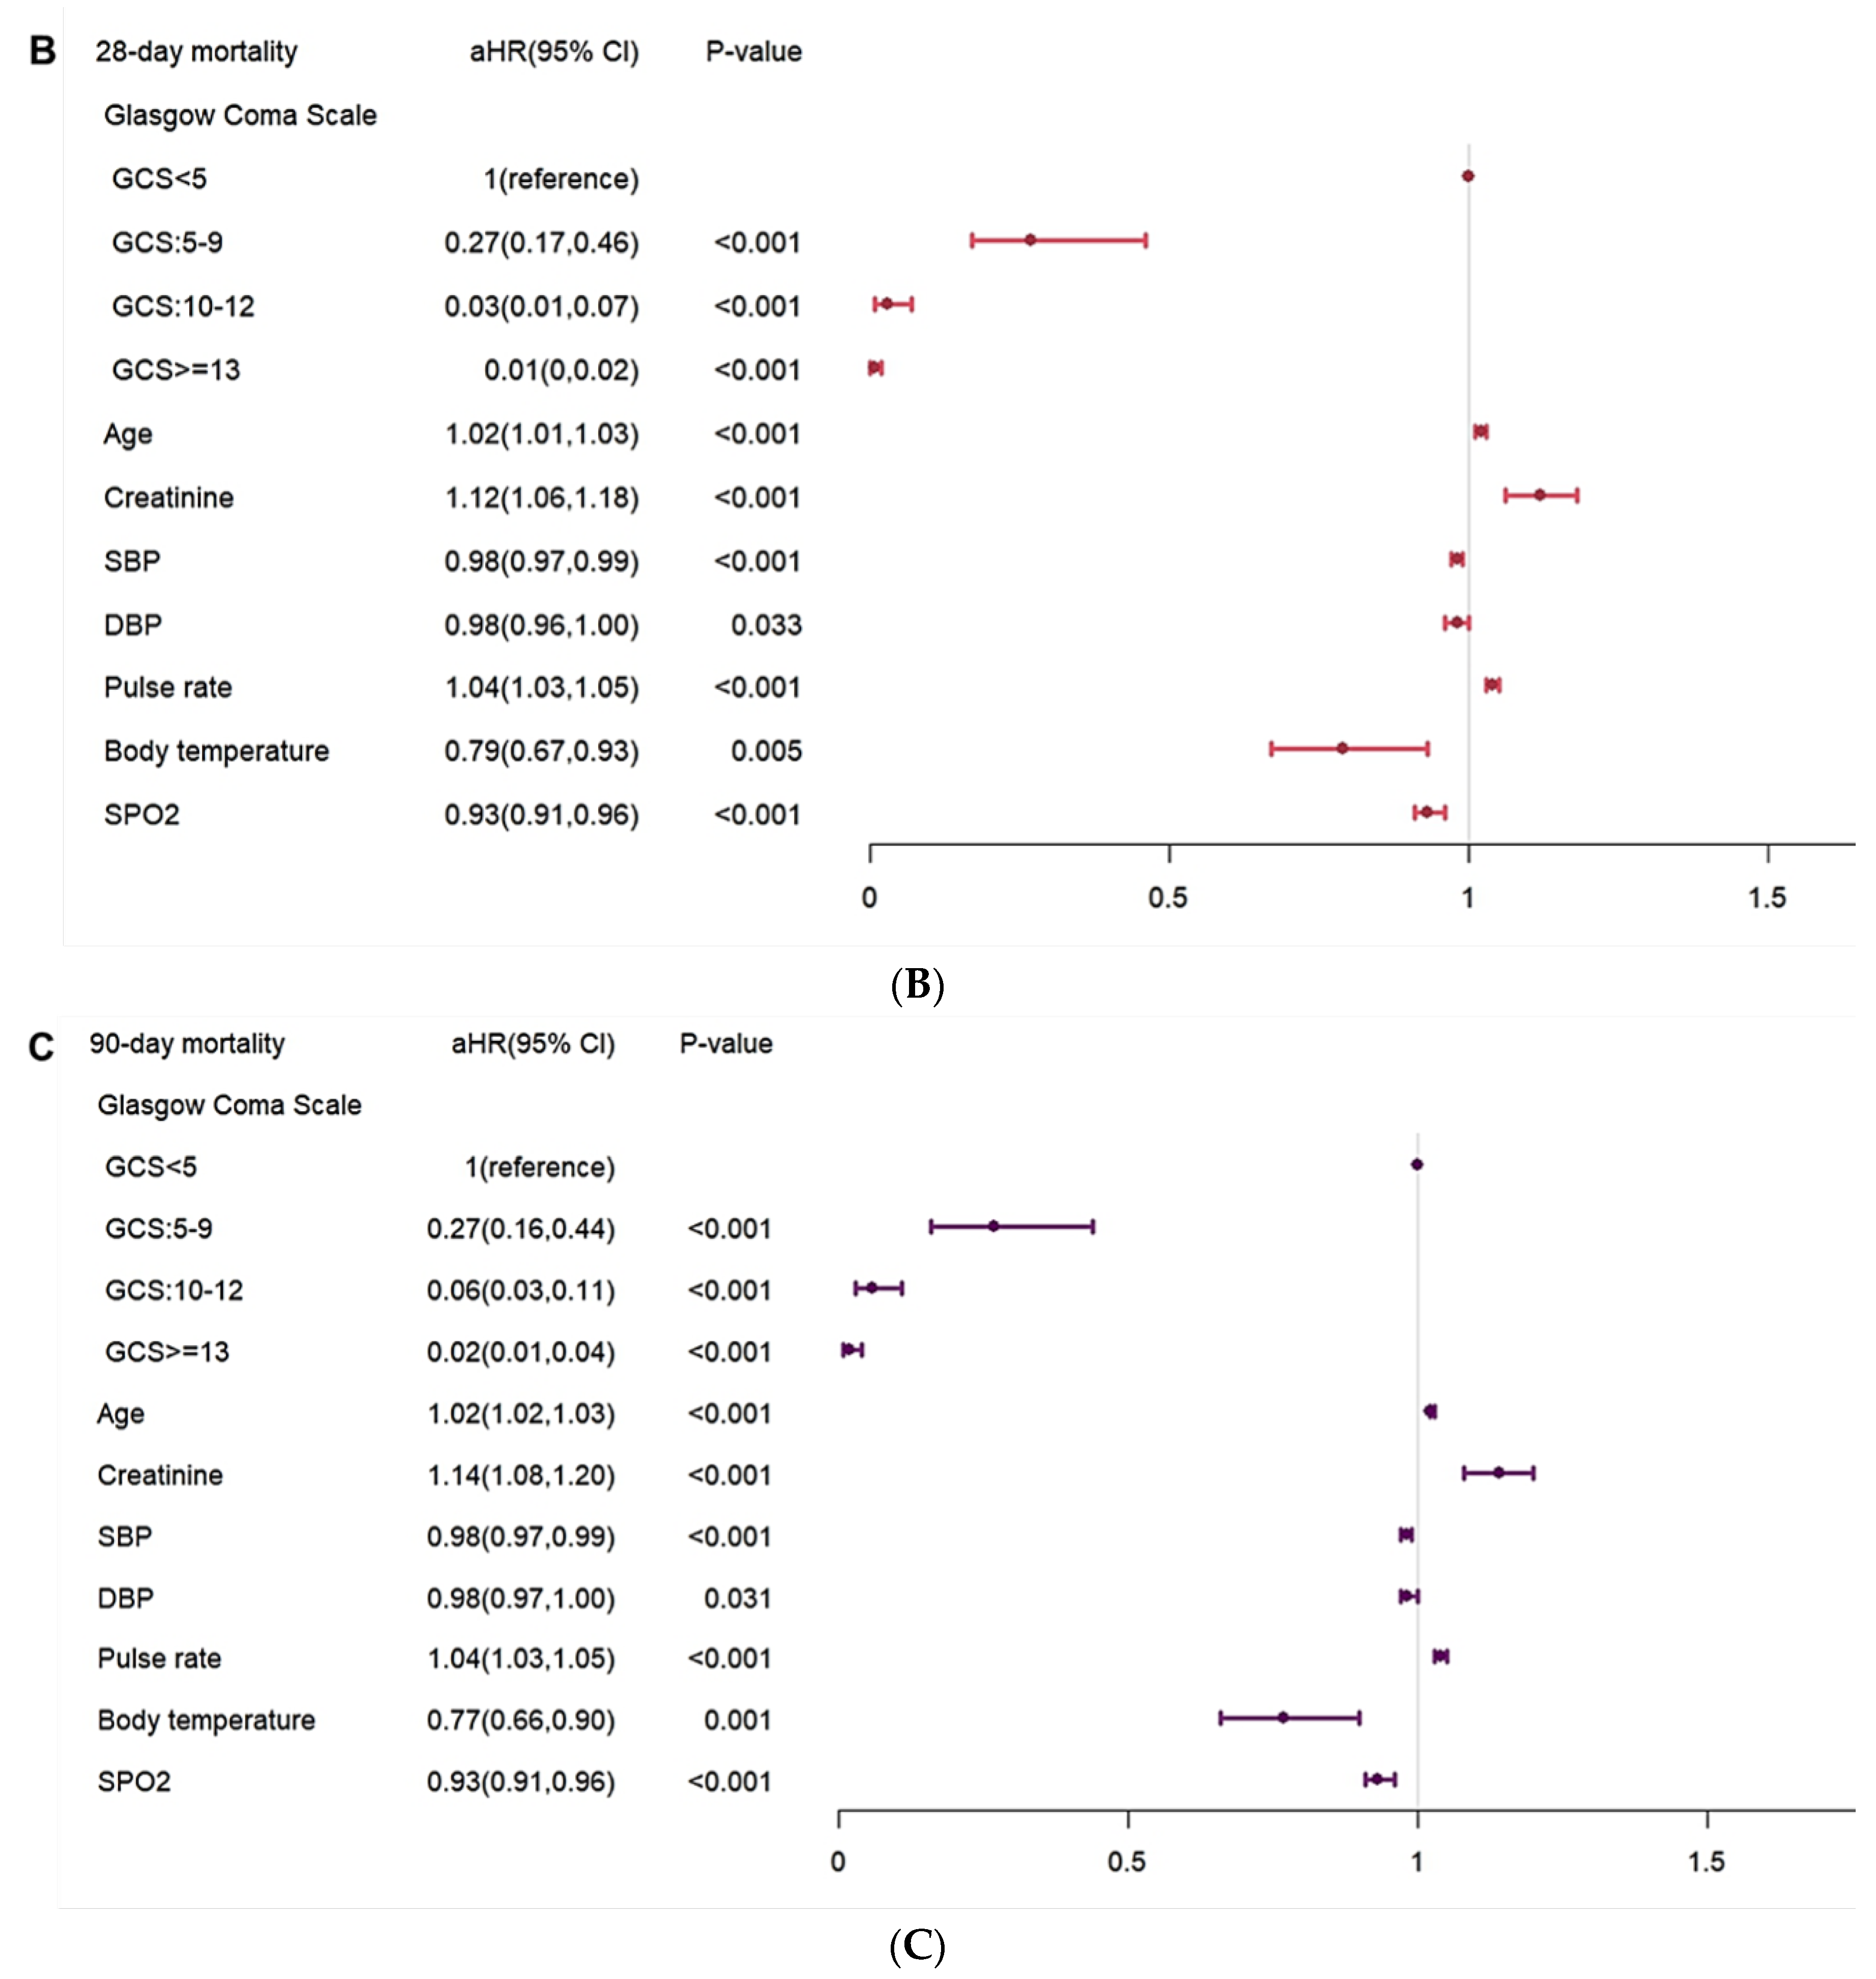
In the analysis of risk factors, a higher pulse rate, a higher body temperature, and NG insertion were shown to have a higher risk of in-hospital complications (
Figure 4A).Higher GCS level of GCS, RBC, DBP and heart rate were shown to have a lower risk of in-hospital complications. In the risk factor for mortality risk, old age, higher creatine level, and higher pulse rate were shown to have higher mortality risk. A higher level of GCS, SDP, DBP, SPO2 were shown to have a lower risk of mortality. (
Figure 4B,
Figure 4C).
3.5. Predictive Value of PNI for 90-Day Mortality in Patients with Spontaneous ICH
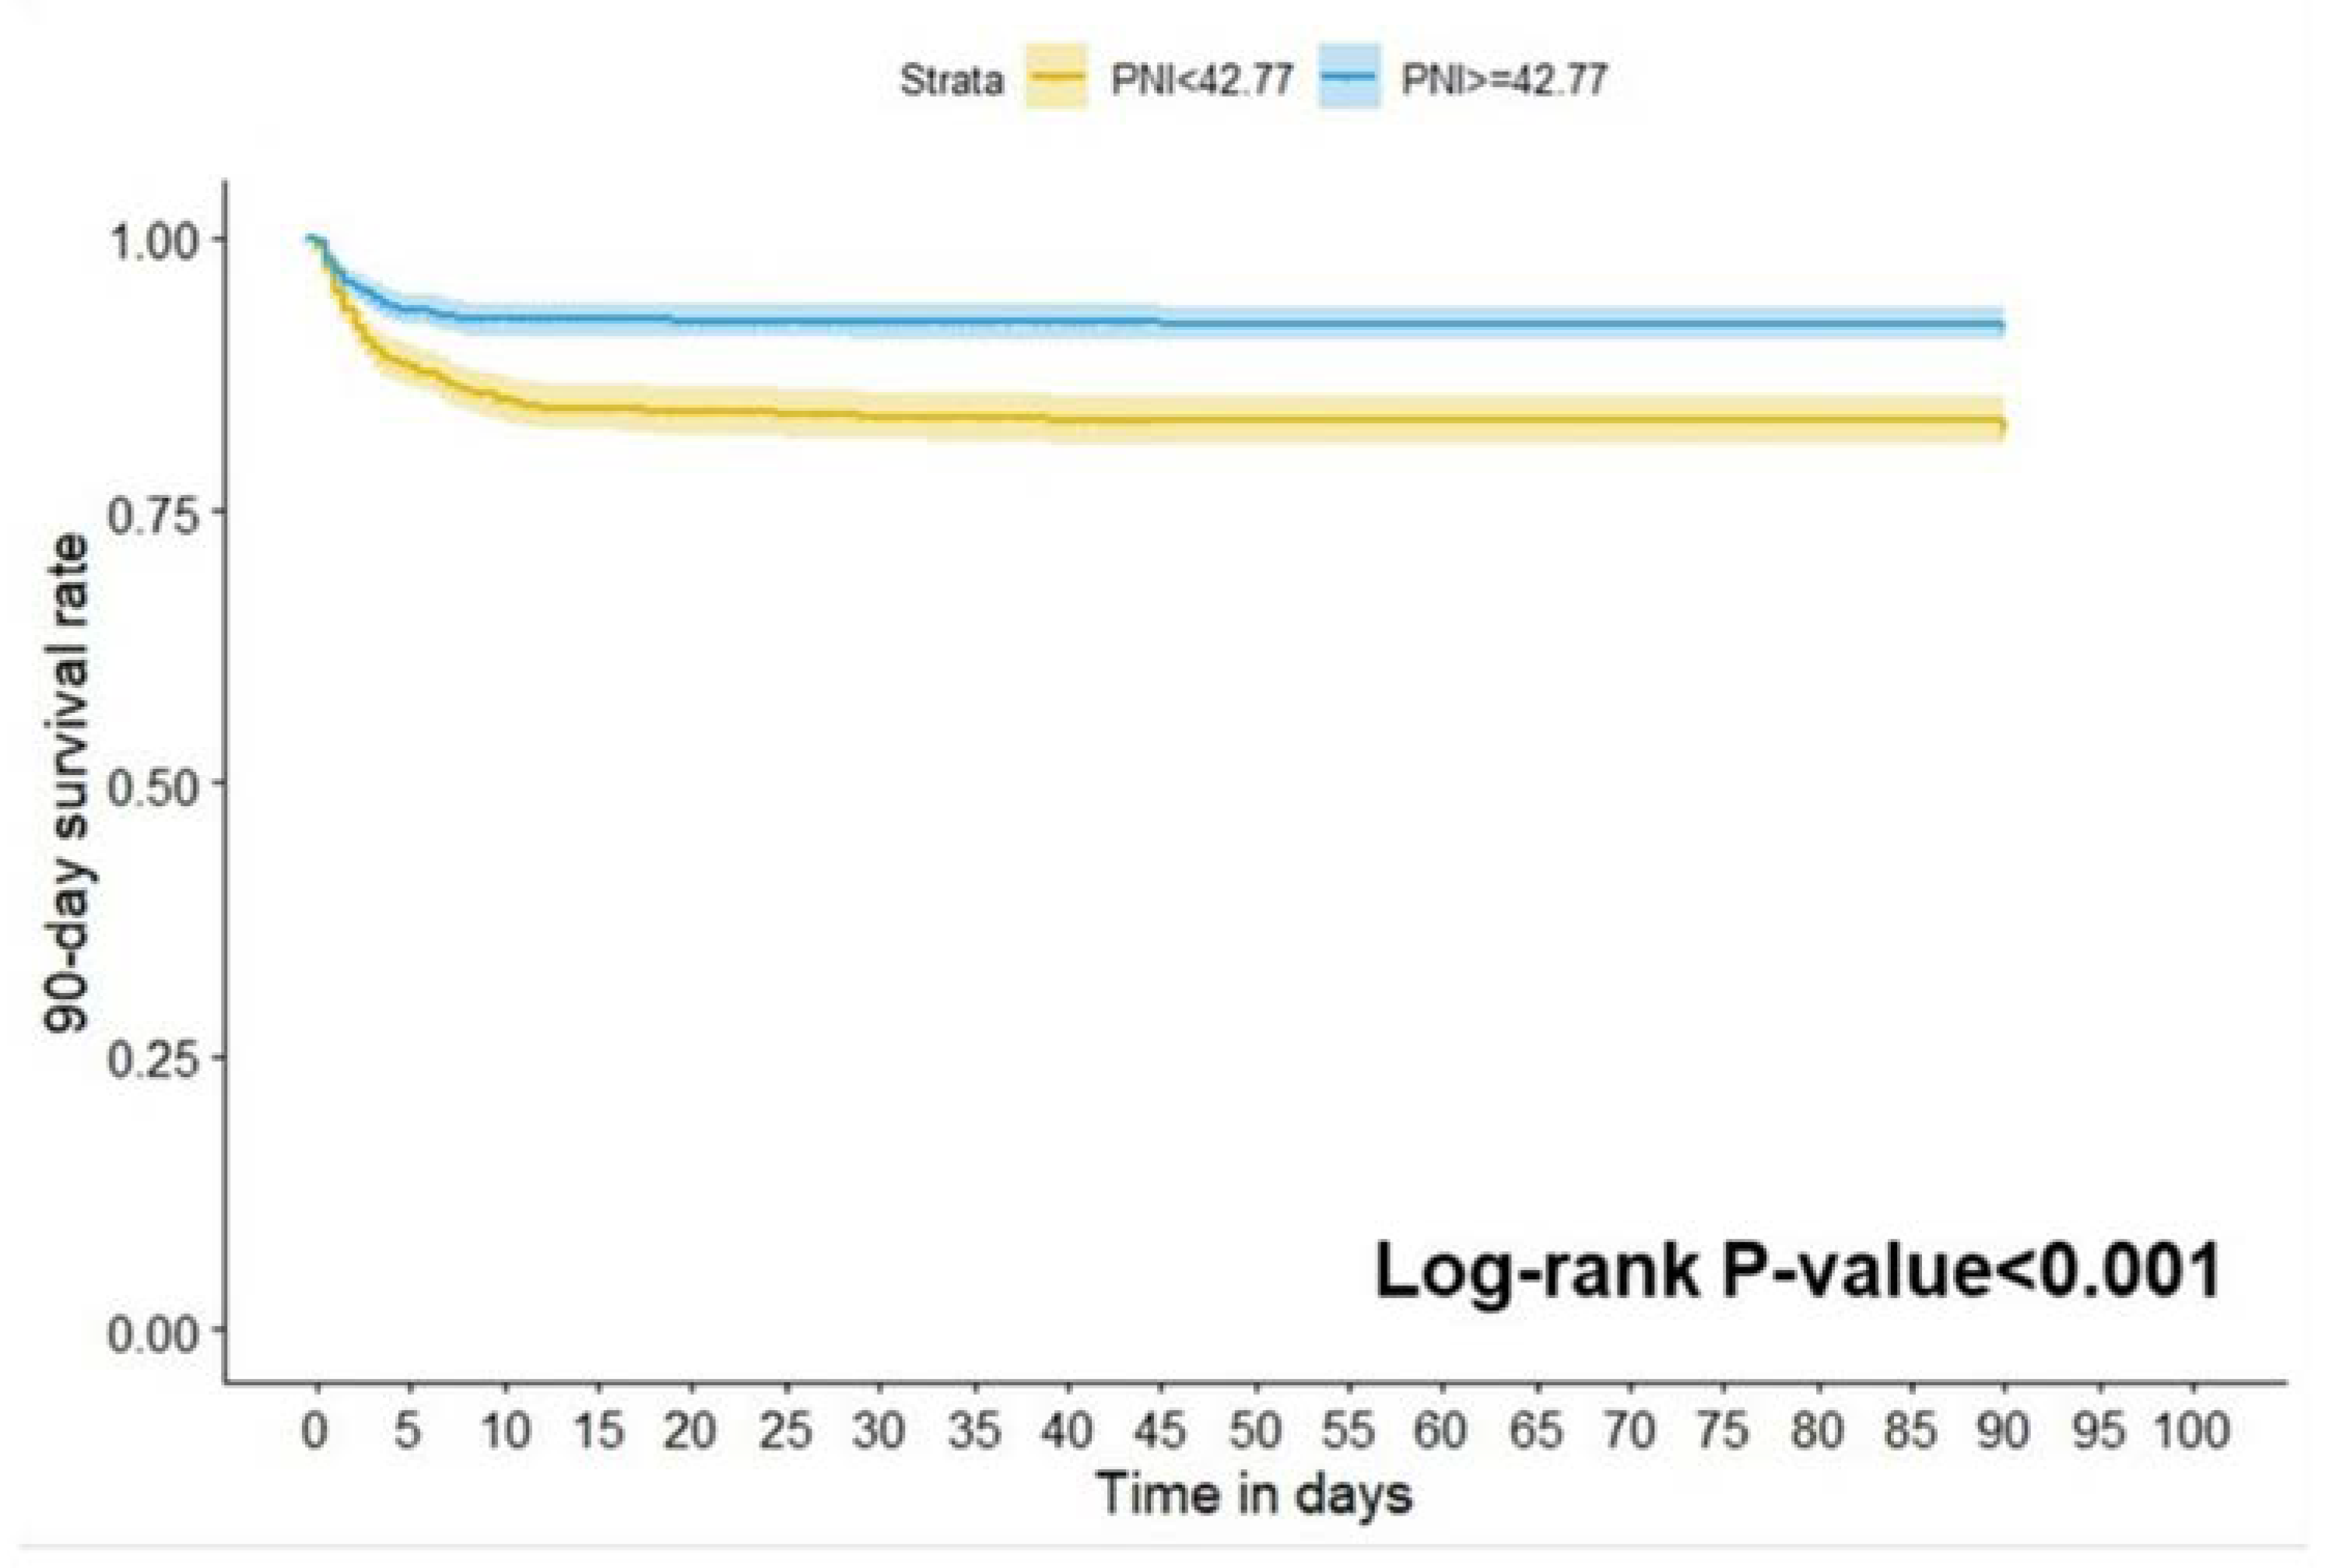
In the results of a Kaplan-Meier survival curve analysis, the study population was divided into a high PNI group (≥ 42.77) and a low PNI group (< 42.77) showing that the mortality at 90 days of all causes in the low PNI group was significantly higher than in the high group (log-rank P<0.001;
Figure 5).
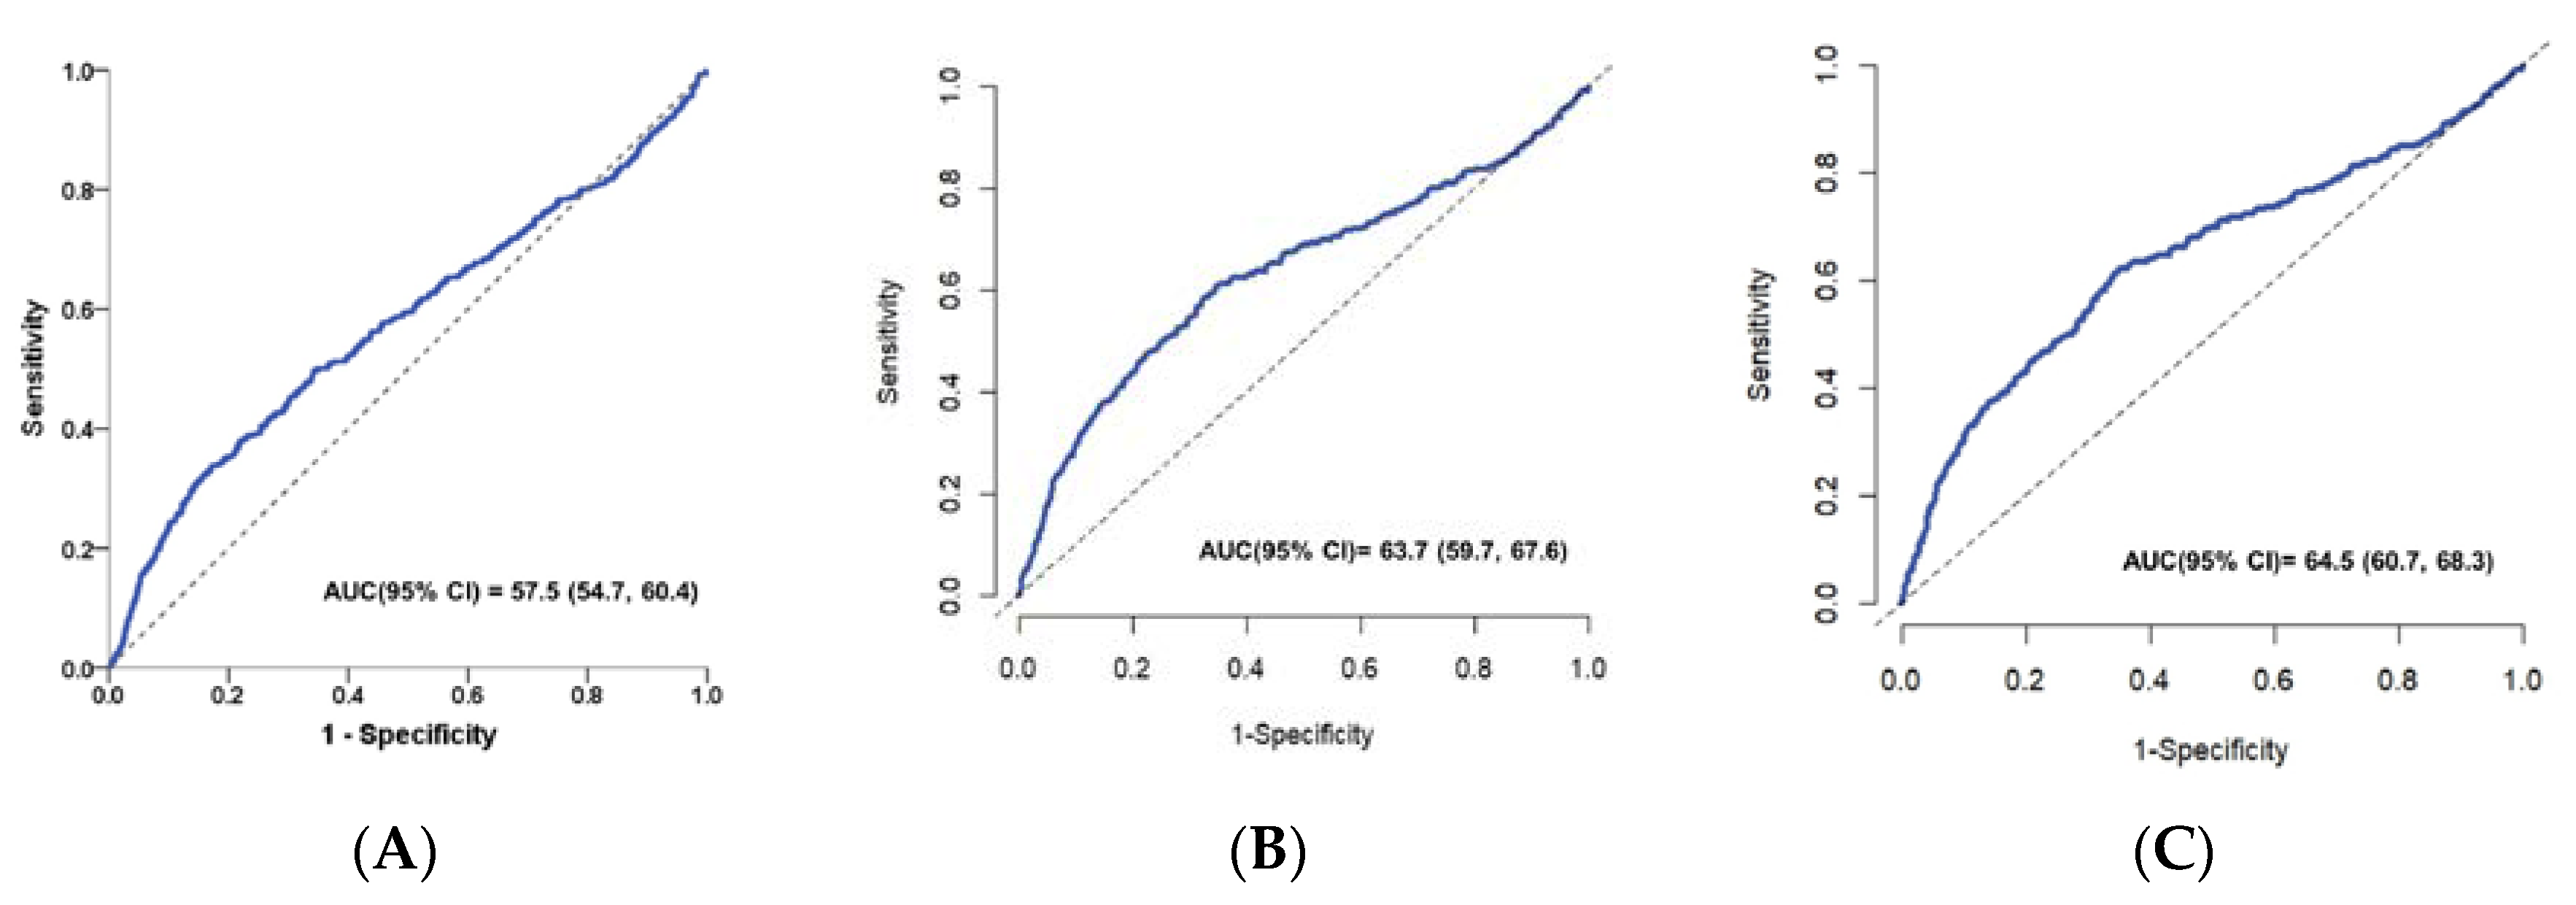
The value of PNI for predicting in-hospital complications, 28-day and 90-day mortality in patients with spontaneous ICH was analyzed using the ROC curve. As shown in the ROC curve, PNI had a good ability to predict in-hospital complications in patients with ICH with an AUC of 0.575 (95% CI: 0.547–0.604) (
Figure 6A).Furthermore, the time-dependent ROC curve for the prediction of mortality at 28- and 90-day mortality and the AUC value of PNI in all patients was 0.637(95% CI: 0.597-0.676) and 0.645 (95% CI: 0.607-0.683) respectively (
Figure 6B and
Figure 6C). The above results showed that PNI was a valuable predictive biomarker of the risk of in-hospital complication, 28-day and 90-day mortality in patients with spontaneous ICH.
As shown in the ROC curve, PNI had a good ability to predict in-hospital complications in patients with ICH with an AUC of 0.575 (95% CI: 0.547–0.604) (
Figure 5A). The AUC for the PNI to predict 28-day and 90-day mortality was 0.637 (95% CI: 0.597–0.676,
Figure 5B), 0.645 (95% CI: 0.607–0.683,
Figure 6C), respectively.
4. Discussion
To the best of our knowledge, this is the first study to compare all-cause in-hospital complications and 28- and 90-day mortality between high and low PNI groups with spontaneous ICH patients.
In our study, propensity score matching (PSM) was carried out to adjust for an imbalance of clinical parameters with a p-value of <0.05 in the multivariate analysis to reduce the interference of confounders with survival outcomes. The main finding of our study is that
a low PNI score at admission was independently associated with a poor ICH outcome. After intracerebral hemorrhage, neuroinflammation plays a significant role in causing damage to brain tissue[
14,
15,
16] and downregulates the immune system, which may result in immunodepression [
15,
16,
17,
18]. Recent evidence showed that post-ICH neuroinflammation is a major contributor to secondary-induced brain damage and is often associated with a poor clinical prognosis [
17,
18]. In recent decades, blood-based biomarkers upon admission have demonstrated substantial promise for the diagnosis and prognosis of ICH[
10,
14,
19,
20,
21]. Stroke-induced immunosuppression decreases immune capacity as lymphocyte numbers reduce, which increases the risk of infection and is strongly associated with an unfavorable functional outcome[
22,
23]. Another study reported that ICH patients with lower lymphocyte counts are associated with poor outcomes[
21].Furthermore, malnutrition is associated with impaired immunological function and can increase the risk of infections and mortality in critically ill patient[
24,
25]. Previous reports suggested a relationship between hypoalbuminemia and increased mortality in patients with ICH[
8,
9]. Rui et al. showed that a poor outcome ICH group had worse nutritional and inflammatory status[
21]. Thus, the prognosis of patients with ICH is related not only to inflammation levels, but also to nutritional status. Consequently, PNI combined with serum albumin and lymphocytes can well predict the efficacy of spontaneous ICH and it can be easily calculated from parameters that are routinely measured in blood parameters at admission.
In this study, we confirmed that the PNI score was an independent biomarker to predict complications and overall survival in spontaneous ICH patients. Our study showed that a low PNI score was associated with a higher risk of in-hospital complication, 28-day and 90-day mortality. We first used univariate logistic analysis to investigate the association between in-hospital complications and PNI as categorical variable with a median value of 42.77(OR=1) and PNI ≥ 42.77 was significantly associated with a reduced risk of in-hospital complications (OR = 0.64; 95% CI 0.53-0.77; P < 0.001). We then performed a multivariate logistic regression analysis to further explore the association between in-hospital complications and PNI. In a similar way, the results revealed PNI ≥ 42.77 to be an independent decrease risk for in-hospital complications (OR = 0.69, 95% CI: 0.55-0.87, P = 0.002). To eliminate potential residual confounding variables, we subsequently performed PSM analysis to further identify the relationship between in-hospital complication and PNI using multivariate logistic regression analyses. After matching, the results revealed that the low PNI group was significantly associated with in-hospital complications. Its significant finding was that PNI was an independent predictor of complications, 30- and 90-day mortality among patients with spontaneous ICH.
In the present study, a low GCS level, anemia, low blood pressure, high fever, and NG insertion have been shown to have a higher risk of in-hospital complications. Langmore et al. identified the need for tube feeding as a predictor of pneumonia, because patients who cannot tolerate oral feeding due to impaired consciousness or severe dysphagia.[
26,
27,
28].One meta-analysis showed that anemia at admission was associated with increased mortality and an increased risk of poor outcomes in patients with ICH[
29]. Schwarz S report that the incidence of fever in patients with hemorrhagic stroke is high and the duration of fever is associated with poor outcome[
30]. The findings of our study are consistent with the previous literature.
Based on the findings of the study, it is important to take action to minimize the nutritional and immune decline of ICH patients. Early identification of potentially modified risk factors can provide an alternative approach to reduce the risk of complications and improve the outcome. PNI scores can better reflect the balance between nutrition and inflammation than single markers.
We identified some limitations in our study: First, this is a retrospective cohort study conducted in a single center, which leads to inevitable selection bias. In this regard, we adjusted various variables to enhance the accuracy of the results. More validation through prospective multicenter studies is necessary to corroborate our findings. Second, the PNI was evaluated only at admission, neglecting the changes in the laboratory over time. The potential of dynamic PNI to predict the poor prognosis of spontaneous ICH patients requires further exploration. Third, since our study was confined to Taiwan, the generalizability of our results to other populations remains uncertain. Future research conducted in different countries is essential to validate our conclusions.
5. Conclusions
This retrospective study revealed that PNI may be valuable markers to predict the outcomes of patients with spontaneous ICH.
Author Contributions
SWJ : Writing – review & editing, Conceptualization, Methodology, Project administration; YTL: Writing – review & editing, Conceptualization, Methodology; CTK: Writing – review & editing ,Formal Analysis, Data Curation ; YPW: Writing – original draft, Formal Analysis; CHL: Writing – review & editing, Conceptualization, Methodology. All authors read and approved the final manuscript.
Institutional Review Board Statement
The study was conducted in accordance with the Declaration of Helsinki, and approved by the Institutional Review Board of Changhua Christian Hospital (protocol code No: 230539).
Informed Consent Statement
Not applicable.
Data Availability Statement
Not applicable.
Acknowledgments
The authors would like to thank all colleagues and students who contributed to this study. We thank the editor and series editor for constructive criticisms of an earlier version of this chapter. Thanks also to professor Lai of Veterinary Medicine at National Chung Hsing University, Taiwan, whose advice on experimental design and help with subsequent analysis was invaluable.
Conflicts of Interest
The authors declare that they have no conflict of interest.
References
- Greenberg, S.M.; Ziai, W.C.; Cordonnier, C.; Dowlatshahi, D.; Francis, B.; Goldstein, J.N.; Hemphill, J.C.; Johnson, R.; Keigher, K.M.; Mack, W.J.; et al. 2022 Guideline for the Management of Patients With Spontaneous Intracerebral Hemorrhage: A Guideline From the American Heart Association/American Stroke Association. Stroke 2022, 53, E282–E361. [Google Scholar] [CrossRef] [PubMed]
- Chan, C.L.; Ting, W.; Huang, H.T. The incidence, hospital expenditure, and, 30 day and 1 year mortality rates of spontaneous intracerebral hemorrhage in Taiwan. J Clin Neurosci 2014, 21, 91–94. [Google Scholar] [CrossRef] [PubMed]
- Liu, C.-T.; Wu, B.-Y.; Hu, W.-L.; Hung, Y.-C. Gender-based differences in mortality and complementary therapies for patients with stroke in Taiwan. Complement. Ther. Med. 2017, 30, 113–117. [Google Scholar] [CrossRef] [PubMed]
- Yoo, S.-H.; Kim, J.S.; Kwon, S.U.; Yun, S.-C.; Koh, J.-Y.; Kang, D.-W. Undernutrition as a Predictor of Poor Clinical Outcomes in Acute Ischemic Stroke Patients. Arch. Neurol. 2008, 65, 39–43. [Google Scholar] [CrossRef] [PubMed]
- Poor nutritional status on admission predicts poor outcomes after stroke: observational data from the FOOD trial. Stroke 2003, 34, 1450–1456. [CrossRef]
- Zhang, M.; Ye, S.; Huang, X.; Sun, L.; Liu, Z.; Liao, C.; Feng, R.; Chen, H.; Wu, Y.; Cai, Z.; et al. Comparing the prognostic significance of nutritional screening tools and ESPEN-DCM on 3-month and 12-month outcomes in stroke patients. Clin. Nutr. 2021, 40, 3346–3353. [Google Scholar] [CrossRef] [PubMed]
- Shiga, Y.; Nezu, T.; Shimomura, R.; Sato, K.; Himeno, T.; Terasawa, Y.; Aoki, S.; Hosomi, N.; Kohriyama, T.; Maruyama, H. Various effects of nutritional status on clinical outcomes after intracerebral hemorrhage. Intern. Emerg. Med. 2021, 17, 1043–1052. [Google Scholar] [CrossRef] [PubMed]
- Limaye, K.; Yang, J.D.; Hinduja, A. Role of admission serum albumin levels in patients with intracerebral hemorrhage. Acta Neurol. Belg. 2016, 116, 27–30. [Google Scholar] [CrossRef] [PubMed]
- Morotti, A.; Marini, S.; Lena, U.K.; Crawford, K.; Schwab, K.; Kourkoulis, C.; Ayres, A.M.; Gurol, M.E.; Viswanathan, A.; Greenberg, S.M.; et al. Significance of admission hypoalbuminemia in acute intracerebral hemorrhage. J. Neurol. 2017, 264, 905–911. [Google Scholar] [CrossRef]
- Morotti, A.; et al. Lymphopenia, Infectious Complications, and Outcome in Spontaneous Intracerebral Hemorrhage. Neurocrit Care 2017, 26, 160–166. [Google Scholar] [CrossRef]
- Ma, M.; Liu, Y.; Liu, F.; Li, Z.; Cheng, Q.; Liu, Z.; Yang, R.; Yu, C. Relationship Between Prognostic Nutrition Index and New York Heart Association Classification in Patients with Coronary Heart Disease: A RCSCD-TCM Study. J. Inflamm. Res. 2022, 15, 4303–4314. [Google Scholar] [CrossRef] [PubMed]
- Liu, Y.; Yang, X.; Kadasah, S.; Peng, C. Clinical Value of the Prognostic Nutrition Index in the Assessment of Prognosis in Critically Ill Patients with Stroke: A Retrospective Analysis. Comput. Math. Methods Med. 2022, 2022, 1–7. [Google Scholar] [CrossRef] [PubMed]
- Xu, M.; Zhang, L.; Wang, J.; Cheng, L.; Chen, C.; Li, S.; Dai, H.; Zhao, P.; Hang, C. Pre-operative prognostic nutrition index and post-operative pneumonia in aneurysmal subarachnoid hemorrhage patients. Front. Neurol. 2023, 14. [Google Scholar] [CrossRef] [PubMed]
- Lattanzi, S. , et al., Neutrophil-to-Lymphocyte Ratio Predicts the Outcome of Acute Intracerebral Hemorrhage. Stroke 2016, 47, 1654–1657. [Google Scholar] [CrossRef] [PubMed]
- Alsbrook, D.L.; Di Napoli, M.; Bhatia, K.; Biller, J.; Andalib, S.; Hinduja, A.; Rodrigues, R.; Rodriguez, M.; Sabbagh, S.Y.; Selim, M.; et al. Neuroinflammation in Acute Ischemic and Hemorrhagic Stroke. Curr. Neurol. Neurosci. Rep. 2023, 23, 407–431. [Google Scholar] [CrossRef] [PubMed]
- Mracsko, E.; Veltkamp, R. Neuroinflammation after intracerebral hemorrhage. Front. Cell. Neurosci. 2014, 8, 388–388. [Google Scholar] [CrossRef] [PubMed]
- Xia, S.; Zheng, Y.; Yan, F.; Chen, G. MicroRNAs modulate neuroinflammation after intracerebral hemorrhage: Prospects for new therapy. Front. Immunol. 2022, 13, 945860. [Google Scholar] [CrossRef] [PubMed]
- Meisel, C.; Schwab, J.M.; Prass, K.; Meisel, A.; Dirnagl, U. Central nervous system injury-induced immune deficiency syndrome. Nat. Rev. Neurosci. 2005, 6, 775–786. [Google Scholar] [CrossRef] [PubMed]
- Lv, X.-N.; Li, Z.-Q.; Li, Q. Blood-Based Biomarkers in Intracerebral Hemorrhage. J. Clin. Med. 2023, 12, 6562. [Google Scholar] [CrossRef] [PubMed]
- Anderson, T.N.; Hwang, J.; Munar, M.; Papa, L.; Hinson, H.E.M.; Vaughan, A.; Rowell, S.E. Blood-based biomarkers for prediction of intracranial hemorrhage and outcome in patients with moderate or severe traumatic brain injury. J. Trauma: Inj. Infect. Crit. Care 2020, 89, 80–86. [Google Scholar] [CrossRef]
- Liu, R.; Chen, C.; Zhao, Y.; Tang, Y.; Shen, W.; Xie, Z. The Osaka prognostic score and Naples prognostic score: novel biomarkers for predicting short-term outcomes after spontaneous intracerebral hemorrhage. BMC Neurol. 2023, 23, 1–11. [Google Scholar] [CrossRef]
- Hoffmann, S.; Harms, H.; Ulm, L.; Nabavi, D.G.; Mackert, B.-M.; Schmehl, I.; Jungehulsing, G.J.; Montaner, J.; Bustamante, A.; Hermans, M.; et al. Stroke-induced immunodepression and dysphagia independently predict stroke-associated pneumonia – The PREDICT study. J. Cereb. Blood Flow Metab. 2016, 37, 3671–3682. [Google Scholar] [CrossRef]
- Faura, J.; et al. , Stroke-induced immunosuppression: implications for the prevention and prediction of post-stroke infections. Journal of Neuroinflammation 2021, 18, 127. [Google Scholar] [CrossRef]
- Caironi, P.; Gattinoni, L. The clinical use of albumin: the point of view of a specialist in intensive care. 2009, 7, 259–67. [CrossRef]
- Nicholson, J.; Wolmarans, M.; Park, G. The role of albumin in critical illness. Br. J. Anaesth. 2000, 85, 599–610. [Google Scholar] [CrossRef]
- Takahata, H.; Tsutsumi, K.; Baba, H.; Nagata, I.; Yonekura, M. Early intervention to promote oral feeding in patients with intracerebral hemorrhage: a retrospective cohort study. BMC Neurol. 2011, 11, 6–6. [Google Scholar] [CrossRef]
- Togha, M.; Bakhtavar, K. Factors associated with in-hospital mortality following intracerebral hemorrhage: a three-year study in Tehran, Iran. BMC Neurol. 2004, 4, 9–9. [Google Scholar] [CrossRef]
- Langmore, S.E.; Skarupski, K.A.; Park, P.S.; Fries, B.E. Predictors of Aspiration Pneumonia in Nursing Home Residents. Dysphagia 2002, 17, 298–307. [Google Scholar] [CrossRef]
- Zhang, S.; Pan, X.; Wei, C.; Wang, L.; Cheng, Y.; Hu, Z.; Dong, W.; Liu, M.; Wu, B. Associations of Anemia With Outcomes in Patients With Spontaneous Intracerebral Hemorrhage: A Meta-Analysis. Front. Neurol. 2019, 10, 406. [Google Scholar] [CrossRef]
- Schwarz, S.; Häfner, K.; Aschoff, A.; Schwab, S. Incidence and prognostic significance of fever following intracerebral hemorrhage. Neurology 2000, 54, 354–354. [Google Scholar] [CrossRef]
|
Disclaimer/Publisher’s Note: The statements, opinions and data contained in all publications are solely those of the individual author(s) and contributor(s) and not of MDPI and/or the editor(s). MDPI and/or the editor(s) disclaim responsibility for any injury to people or property resulting from any ideas, methods, instructions or products referred to in the content. |
© 2024 by the authors. Licensee MDPI, Basel, Switzerland. This article is an open access article distributed under the terms and conditions of the Creative Commons Attribution (CC BY) license (http://creativecommons.org/licenses/by/4.0/).
