Preprint
Article

Alterations in Graph Network Connectivity Predict Neurocognitive Changes in Patients Undergoing Brain Tumor Surgery

Altmetrics

Downloads

189

Views

93

Comments

0

Submitted:

09 May 2024

Posted:

13 May 2024

Read the latest preprint version here

Alerts
Abstract
Background: Patients undergoing brain tumor resection experience changes to their neurocognitive abilities, many of which can be difficult to predict. We hypothesized that changes in brain connectivity could predict changes in neurocognitive functioning, demonstrating the potential for brain connectivity aware surgical planning to provide enhanced outcomes for patients. Methods: Patients underwent functional and diffusion MR scanning and neuropsychological testing before tumor resection and two weeks post-resection. Using this functional and diffusion imaging, we measured changes in the topology of the functional and structural graph networks, respectively. From the neuropsychological testing scores, we derived a composite score that describes a patient’s overall level of neurocognitive functioning. We then used a multiple linear regression model to test if structural and functional connectivity measures could predict changes in composite scores. Results: Twenty-one subjects completed imaging and neuropsychological evaluation both before and after surgery. The multiple linear regression model showed that changes in functional local efficiency were inversely correlated with changes in composite score (p
Keywords: 
Subject: Medicine and Pharmacology  -   Neuroscience and Neurology

Introduction:

For malignant brain tumors, surgical resection often provides patients with increased longevity and enhanced quality of life. Expert neurosurgeons are skilled at avoiding highly disruptive surgically induced neurocognitive deficits using tools such as preoperative functional imaging and intraoperative stimulation [1,2,3]. However, even with this technology and expertise, many patients can still experience unexpected changes in their neurocognitive functioning following surgery.
Alterations caused by tumor invasion on top of the already substantial complexity of the brain makes predicting changes in neurocognitive functioning in tumor resection patients highly difficult. However, not all neurocognitive changes caused by surgery are undesirable. In many cases tumor removal can relieve neurological deficits, but these positive outcomes are likewise difficult to predict. Effective prediction of neurocognitive outcomes could pave the way for neurosurgical planning that maximizes positive outcomes and produces better quality of life for patients.
Advanced neuroimaging analysis could prove useful in understanding how surgically induced brain changes relate to neurocognitive outcomes. Recent research has shown the utility of modeling the brain in both disease and health as a graph network [4,5,6,7,8,9]. In this network model of the brain, distinct cortical regions form the nodes of the network. The presence of functional or structural connections between nodes determines the topology of the network. This network topology can then be analyzed to better understand how information travels through the brain.
While graph network analysis of the brain has proven useful in many domains, it has not yet been shown whether changes in network connectivity can predict changes in neurocognitive outcomes. To this end, we monitored graph network connectivity and neuropsychological measures in patients before and after tumor resection surgery. We hypothesized that changes in brain connectivity could predict changes in neurocognitive functioning, demonstrating the potential for brain connectivity aware surgical planning to provide enhanced outcomes for patients.

Methods:

Subject Enrollment and Clinical Care

Adult patients (>/ 19 years old in Nebraska) were considered for enrollment if they had a supratentorial primary or metastatic tumor or cavernoma for which resective surgery was recommended. Subjects could not have had any prior brain treatments (surgery, radiation) or a history of a neurodegenerative disorder. After consent and enrollment, patients had preoperative clinical, neuropsychological, quality of life, and imaging (MRI) evaluations within one week prior to surgery. Tumor resection was performed via craniotomy for resection of their lesion and the patients received standard perioperative clinical care. Two weeks postoperatively, clinical, neuropsychological, quality of life, and imaging studies were repeated. For control subjects, no surgery was performed but the same neuropsychological, quality of life, and imaging assessments were performed two weeks apart.

Neuropsychological Testing and Clinical Assessment

Subjects and controls were administered neurocognitive tests and quality of life (QOL) inventories (Table 1). This test battery was designed to assess neurocognitive functions commonly noted in the literature to be compromised in patients with gliomas [10,11,12]. These tests included the verbal memory based on a list learning task (AVLT), visual memory for a complex geometric shape (RCFT), baseline neurocognitive ability (WRAT-IV), speeded processing/alternation (Trails A and B), verbal fluency (Controlled Oral Word Association Test), dexterity (Grooved Pegboard), general expressive and receptive language (Boston Naming Test, Sentence Repetition and NAB Auditory Comprehension Test), working memory (NAB Digits Forward and Backward; Wechsler Memory Scale, Third Edition Spatial Span Forward and Backward), and the ability to inhibit a pre-learned or automatic response (Stroop Color and Word Test). Additionally, this test battery includes measures of effort based on embedded MNB measures, including Forced Choice and patterns of recognition memory. Mood and quality of life were assessed via several questionnaires, including the MD Anderson Symptom Inventory – Brain Tumor (MDASI-BT) [13], Functional Assessment of Cancer Therapy – Brain (FACT-Br) [14], and Frontal Systems Behavior Scale (FrSBe)[15].
To assess neurocognitive abilities for a given domain, as listed in Table 1, the normalized scores of the tests within each domain were averaged, similar to previous studies [10,20,21]. We computed a single clinical trial battery composite (CTB Comp) per subject from the averaged domain scores. We used this score to assess the overall combined changes in neurocognitive functioning and impairment per subject.
Other objective clinical assessment was performed by the neurosurgery clinicians. Cognition, orientation, attention, fluency, and thought content were assessed. Further language functions were assessed by reading, writing, naming, repetition. Parietal function was assessed by testing or determining presence of: calculation, agraphesthesia, extinction, proprioception, neglect, apraxia. Motor function was assessed by strength testing and motor scale. Visual deficits were assessed by testing visual field quadrants to confrontation.

Image Acquisition

In addition to our standard clinical brain tumor MRI protocol at the timepoints mentioned above, we acquired research sequences consisting of high angular resolution diffusion MRI (dMRI) and 26 minutes of high-resolution resting-state functional MRI (rs-fMRI) according to the protocol from the Human Connectome Project on Development and Aging (HCP D/A) [22]. We used the Siemens Prisma 3T MR scanner at the University of Nebraska Medical Center Advanced Magnetic Resonance Imaging Core Facility (RRID:SCR_022468) for all scanning sessions. The HCP D/A designed the protocol for the Siemens Prisma scanner to acquire high-quality data in a reasonable amount of time for their developing and aging cohorts [22]. This protocol allows for high resolution, 1.5mm and 2mm isotropic for dMRI and rs-fMRI, respectively. We acquired the dMRI data with two shells, 1500 and 3000 s/mm2, with 92-93 directions per shell, each acquired twice in opposite phase encoding directions and 28 b0 volumes interspersed equally. In addition, we acquired a total of 1952 rs-fMRI volumes over four runs for a total of about 26 minutes of rs-fMRI data. Acquiring a large number of volumes over multiple runs has been shown to provide enhanced results for mapping functional connectivity in individual subjects [23,24].

Image Processing & Registration

We performed image processing using an in-house processing pipeline written utilizing NiPype [25] and incorporating processing workflows from fMRIPrep [26] and related projects [27]. We designed the in-house pipeline to allow for enhanced customizability of the image registrations and transformations not offered in fMRIPrep.
To minimize registration errors between the MNI template space and the patients’ T1w images, we performed the transformations between MNI and T1w space using the preoperative T1w image. In our experience, the registration between the MNI template and the preoperative T1w images has proven much more reliable than the registration between the MNI and the postoperative T1w images due to poor alignment of areas containing surgical defects. To work around registering between MNI and postoperative space, we computed the transforms between the postoperative T1w and the preoperative T1w images. We then concatenated these intra-subject transforms with the preoperative space to MNI transforms so that all transformations into and out of MNI space were performed through the preoperative space. In addition to minimizing registration errors, performing transformations through preoperative space ensured that the node definitions remained more consistent for an individual patient than if the registrations between MNI space were performed separately for each scanning session. The node definitions were defined by the Schaefer et al. 300 parcellation seven network atlas [28] in FSLs asymmetric MNI space [29] as acquired from TemplateFlow [30]. To account for any distortions caused by surgery or tumor growth, the registrations between the preoperative and postoperative T1w scans for an individual patient were computed using non-linear registrations. All non-linear registrations were performed using the Advanced Normalization Tools (ANTs) SyN registration algorithm [31].

Functional Image Processing

Head motion correction [32] and susceptibility distortion correction [33] were performed on the rs-fMRI using FSL [34] and fMRIPrep [26]. The alignment between each rs-fMRI scan, and the T1w image for that scanning visit was computed using a boundary-based rigid registration in FreeSurfer [35]. Transformation into MNI space through preoperative T1w space was performed in a single step that includes the head motion and susceptibility distortion correction transforms. Due to the TR being much shorter than standard fMRI sequences (TR=770ms for the rs-fMRI scans compared to a TR of about 2.5s for a standard fMRI scan), we did not perform slice timing correction, which is the same approach used by the HCP for their processing pipelines [36]. To correct for artifacts in the bold acquisition, we adopted the Power et al. approach to denoising by simultaneously applying high-pass and low-pass filters, regressing out of 24 motion regressors along with global signal, and censoring of high motion timepoints [37]. Any timepoints with fewer than 5 minutes of resting state data following denoising were excluded from the analysis.
Following preprocessing, the whole brain functional networks were constructed with Nilearn [38]. The regions of interest from the Schaefer et al. parcellation atlas [28] were used as the nodes of the network [9,39], with the connections between nodes being defined as the temporal correlation between the regions of interest. To allow consistent comparison between timepoints, the networks were normalized to only include the connections with correlations at or above the 80th percentile (i.e., the network density was set at 20%).

Diffusion Image Processing

The diffusion imaging data were processed in the native diffusion space to avoid unnecessary artifacts. The alignment between the diffusion imaging and the T1w image for that scanning visit was computed using a rigid registration. Head motion correction [32], susceptibility distortion correction [33], and eddy current correction [34,40]. Multi-shell multi-tissue constrained spherical deconvolution was used to estimate fiber orientation distributions [41]. Next, anatomically constrained tractography (ACT) was performed to generate white matter tracts for each subject and session [42]. This method of tractography limits the white matter tracts to terminate mainly at the boundary between the gray matter and the white matter or within deep gray. Constraining the tractography in this way makes the assignment of tracts to cortical regions straight forward. Finally, we applied spherical deconvolution-informed filtering of tractograms (SIFT) to the white matter tracts to filter out tracts less likely to be accurate [43]. We then constructed the structural connectome matrix by counting the number of estimated white matter tracts between any two brain regions as defined by the Harvard-Oxford atlas transformed through the preoperative T1w space into the native diffusion space [44]. Two nodes of the atlas were determined to be connected if five or more reconstructed tracts connect those regions. This overall method of reconstructing white matter tracts greatly increases the accuracy of the tractography results [45] and has been used previously to estimate the structural connectome in brain tumor patients [9].

Graph Network Measures

With both the functional and structural networks constructed, we computed graph network measures for all scanning visits. We focused on whole-brain network measures rather than individual nodes or connections due to the variability in location of the tumors, tumor induced brain disruptions, and surgical treatment. We focused on the following network measures that have shown promise in previous brain imaging studies: modularity, clustering coefficient, and global/local efficiency.
Modularity measures how well networks can be divided into modules. A module is a subset of nodes that are more densely connected to each other than to the rest of the network. A network with higher modularity will have modules containing nodes that are more closely connected to each other and more loosely connected to the nodes of other modules [46,47]. Similarly, the clustering coefficient is a measure of the degree to which brain regions in the network tend to form tightly interconnected clusters or communities. Modularity of the functional brain network has been shown to be increased in early-onset multiple sclerosis (MS) patients and correlated negatively with task performance in those patients [48]. The modularity of the functional network has also been shown to change in the brains of subjects undergoing sleep deprivation [49]. To compute the modularity of the brain networks, we assigned each node to a module based on the network assigned by Yeo et al. 7-network atlas (visual, somatomotor, dorsal attention, ventral attention, limbic, frontoparietal, and default mode) [28,50].
In addition to modularity and clustering coefficient, we also measured the global efficiency (i.e., the efficiency of the parallel information transfer in the network) as well as the mean local efficiency across all nodes (i.e., the fault tolerance of the network) [51]. All graph network connectivity measures were computed using the Brain Connectivity Toolbox for Python (https://pypi.org/project/bctpy/) [52].
In Figure 1, we show some examples of simple graph networks and how connections between and within modules change the network measures. Figure 1B, shows that adding intra-module connections to the simple network shown in Figure 1A, increases the clustering coefficient, by making module form tighter network clusters, and local efficiency, by making the neighbors of many of the nodes more fault tolerant to loss of any given node. Figure 1C shows that adding inter-module connections decreases the modularity of the network by making each of the modules less segregated. Figure 1D, shows that adding both inter- and intra-module connections produces a combination of decreased modularity with increased efficiency and clustering coefficient.

Statistical Analysis

To investigate the effect of surgery on neurocognitive performance, we computed the change for each neurocognitive domain and composite score. We then performed a one-sample t-test to determine if the changes were significantly different from zero. We also performed a two-sample t-test to determine if the changes in the neurocognitive scores of the patients were significantly different from those of the control group.
To evaluate the relationship between brain connectivity measures and changes in neurocognitive functioning, we constructed a linear model. We used both the structural and functional connectivity changes as the independent variables in the model and the composite score changes as the dependent variable. We removed independent variables in the model that had a Pearson correlation of absolute value greater than 0.8 to other variables in the model, as these variables are redundant and could reduce the stability of the model. We also included age and sex as independent variables in the model. We used the R programming language to construct the linear model and perform the statistical inference [53].

Results

Enrollment

We enrolled a total of 38 patients, 37 of whom completed at least one MRI session. As shown in Table 2, the average age at the time of surgery was 50.8 years (standard deviation=11.8), 89% of patients were right-handed, the average years of education were 13.8 (standard deviation=2.3), and there were 24 males and 13 females. Table 3 shows the distribution of tumor diagnosis and tumor location: 51% of the cases were either high- or low-grade gliomas, and the cases were almost evenly split between the right (51%) and left (49%) hemispheres. Thirty-one patients completed at least portions of the neuropsychological evaluations, as shown in Table 4. A total of 24 patients completed each of the domain tests in the evaluation for both visits, and only 17 patients completed each of the domain tests and the quality-of-life tests for both visits. Seven healthy control subjects were also enrolled, with 6 completing all evaluations. After censoring timepoints affected by motion, each scanning session contained 12-26 minutes of resting state fMRI data (mean=23.7 minutes, standard deviation=4.2 minutes). The average number of days between scanning sessions was 18.2 days for patients and 18.7 for controls.

Clinical Assessment

At the time of surgery, 17 patients (46%) had pre-existing deficits (Table 5). At the 2-week postoperative appointment, 4 of the patients with pre-existing deficits saw all their deficits resolve, 3 saw improvement to at least one of their deficits, 7 saw no change to their deficits, and 4 either saw their deficits worsen or developed new deficits. In addition, 4 of the patients with no pre-existing deficits had developed deficits by the 2-week postoperative appointment. However, 3 out of 4 of these patients with new deficits would see their deficits resolve at a later follow-up date.
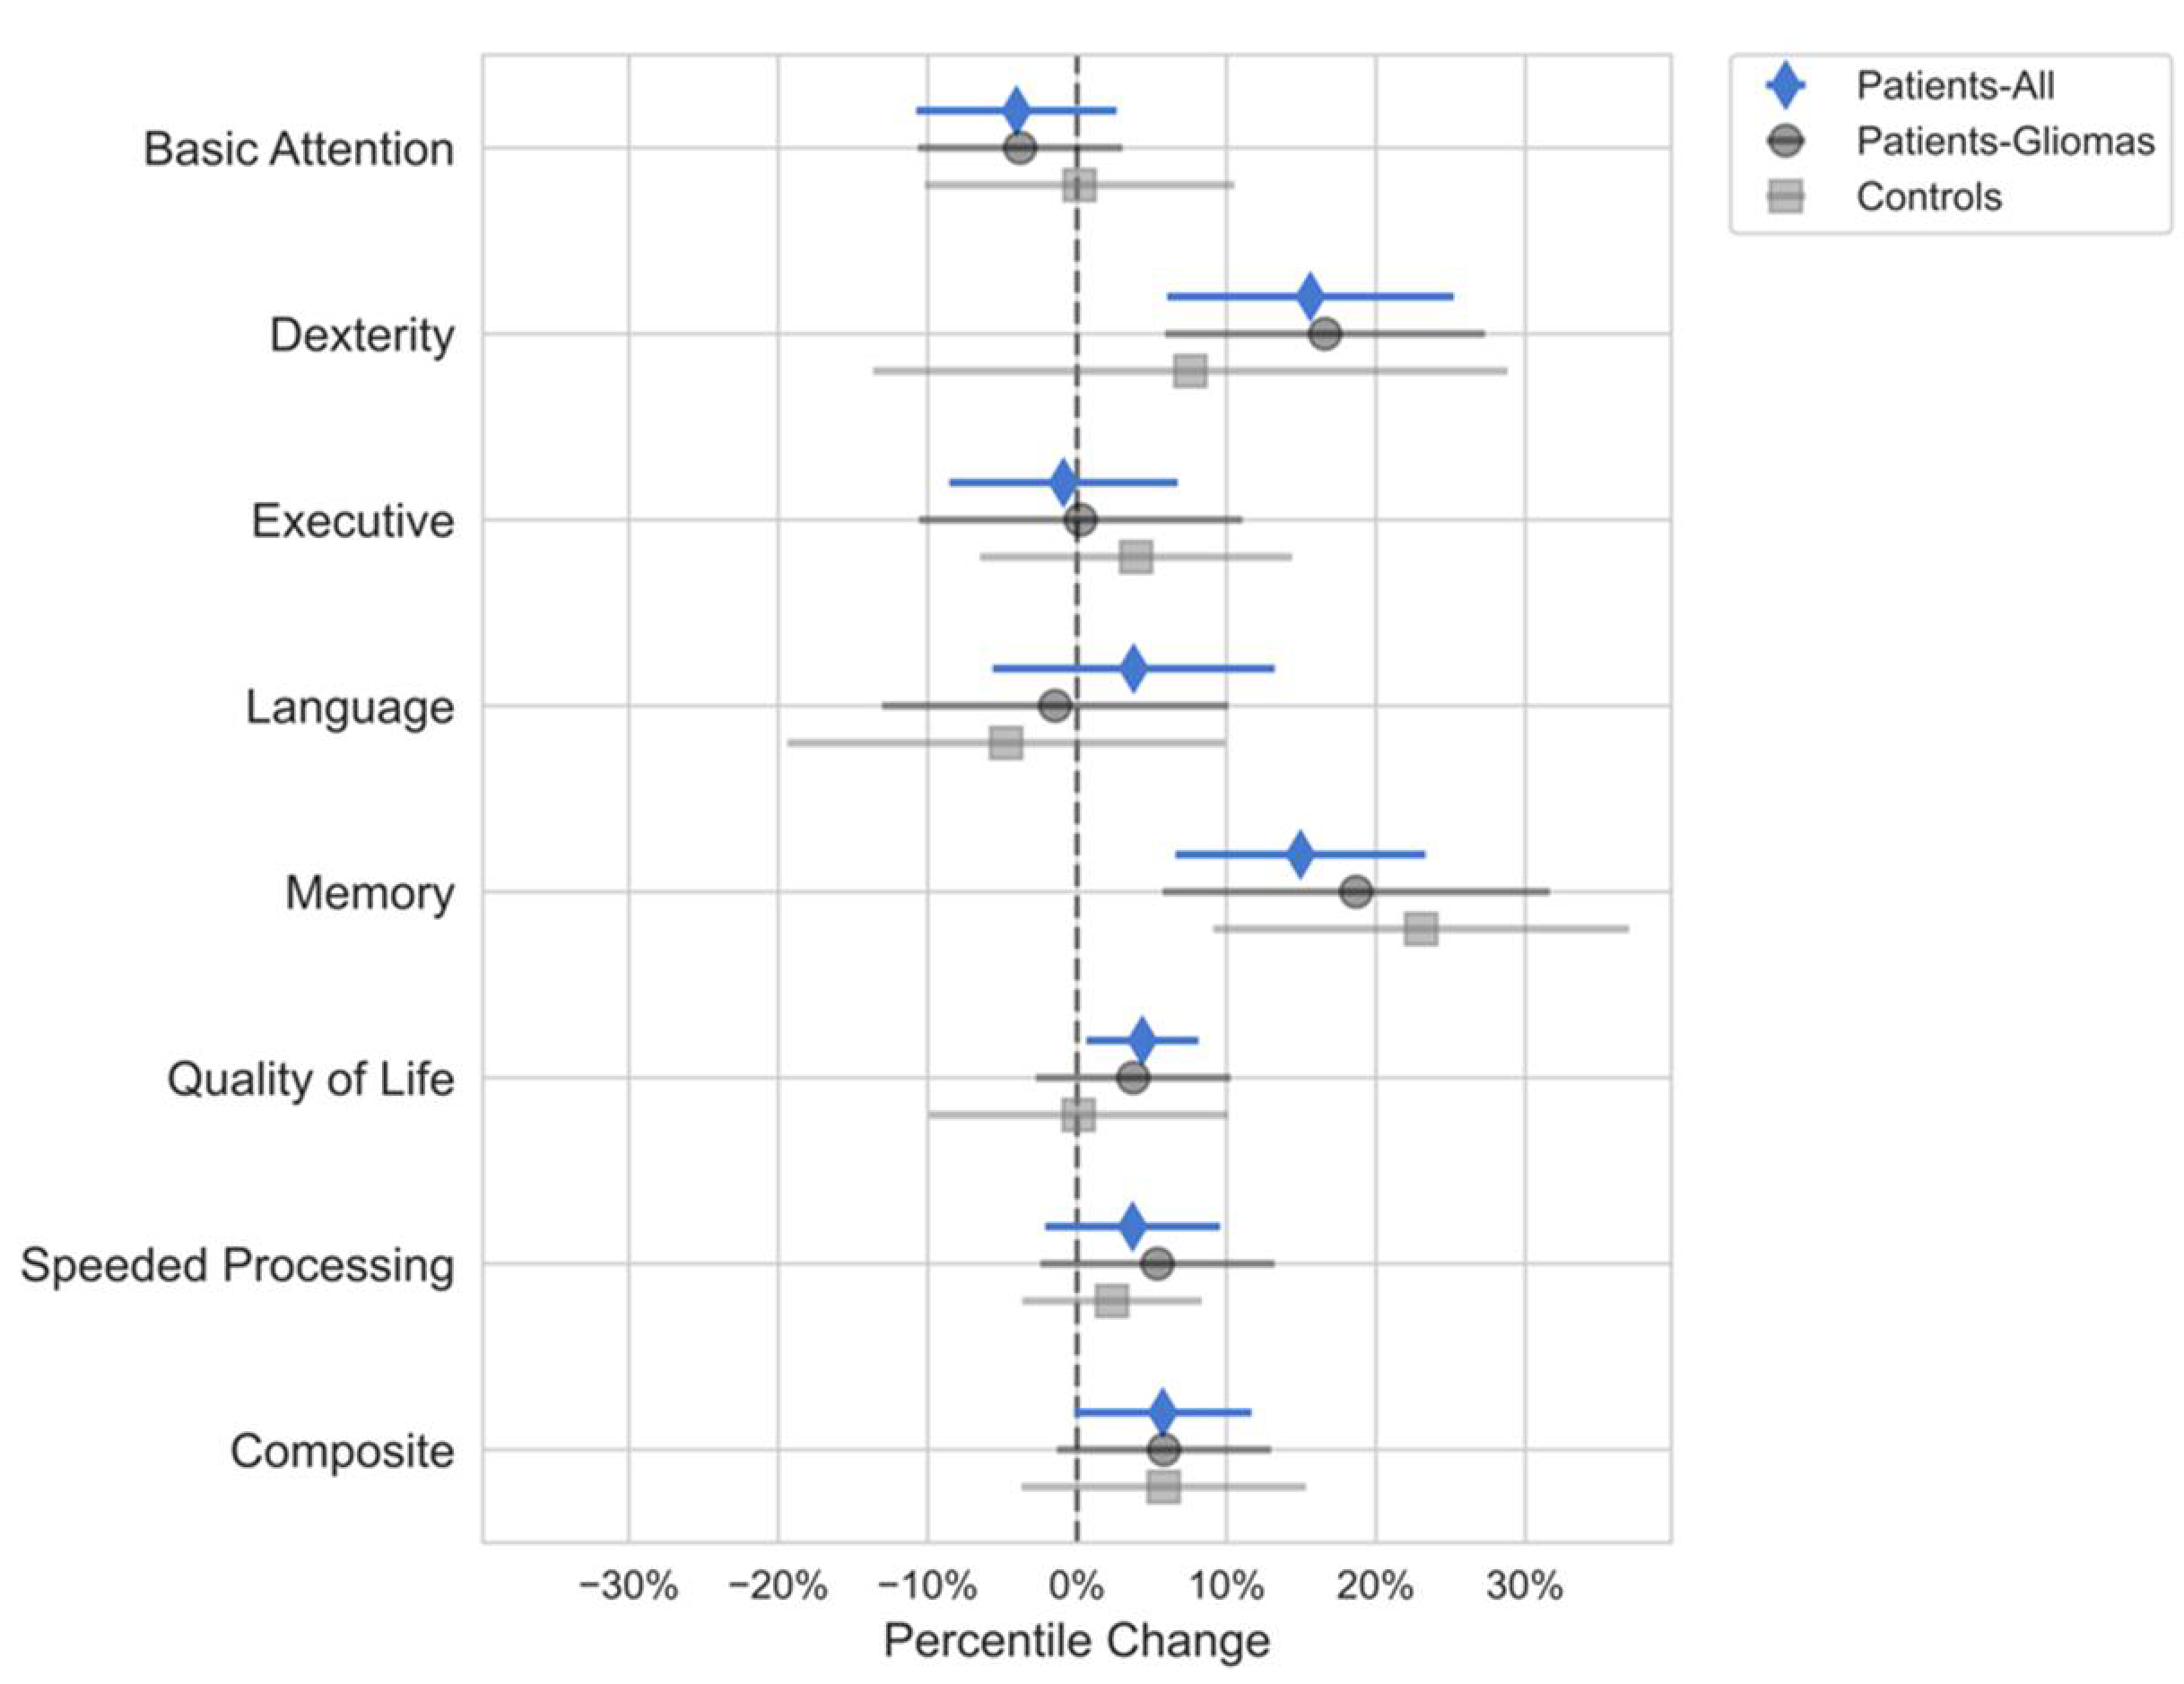
Changes in Neurocognitive Function Following Surgery We investigated whether neurocognitive domain scores would change after surgery. We took the difference between the postoperative and preoperative neurocognitive scores. The domain scores for Quality of Life, Dexterity, and Memory improved in patients postoperatively (p < 0.05), but these changes were not significantly different from the controls (Figure 2). The control group had a significant increase in the Memory domain scores (p < 0.05) but not for any of the other domains. Because none of the neurocognitive domain score changes for the patient group were different from the controls, we could not conclude that the neurocognitive domain scores changed as a result of surgery.

Variable Selection

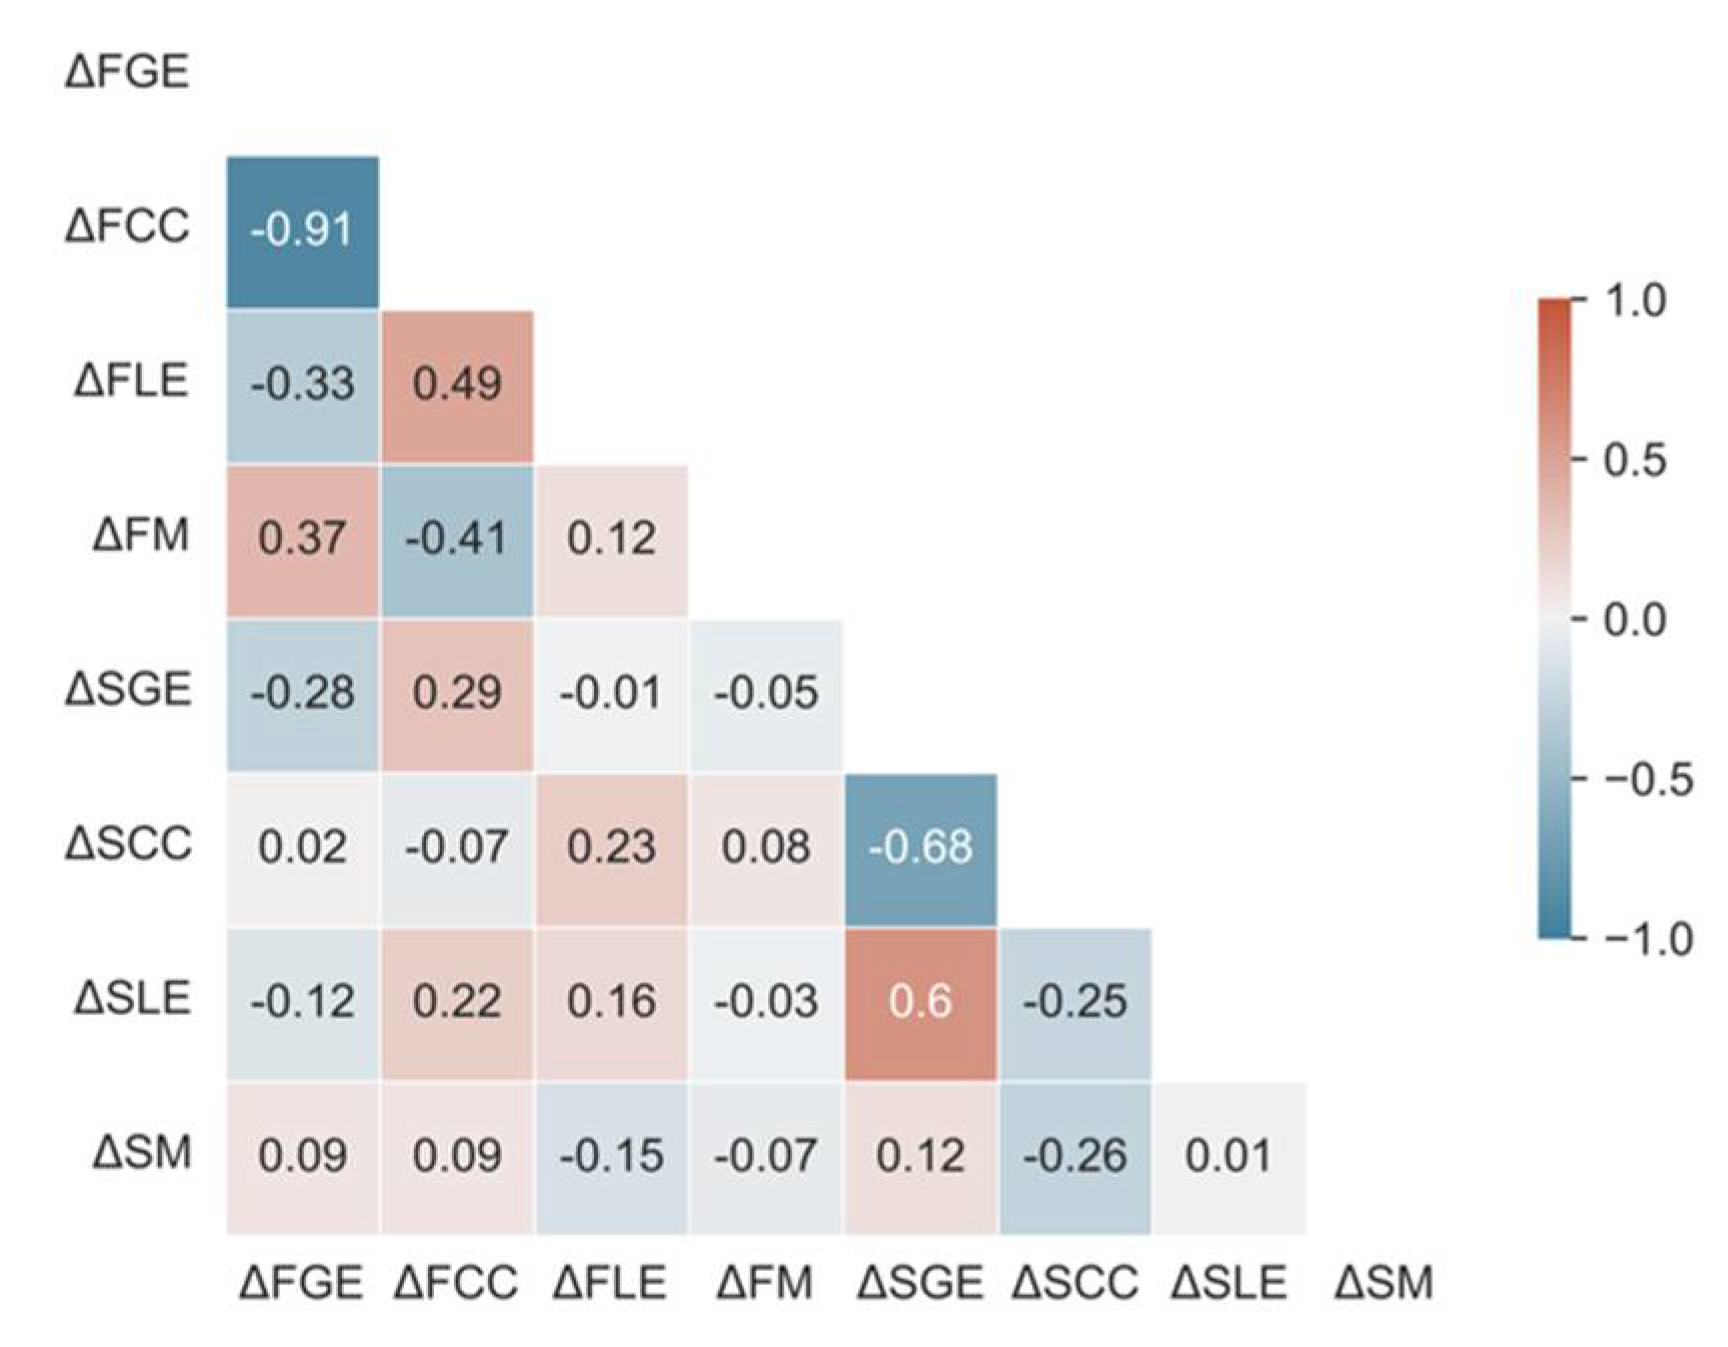
We removed the changes in mean functional clustering coefficient from the analysis because it strongly correlated with changes in functional global efficiency, with Pearson r = -0.91 (Figure 3). All other variables had an absolute Pearson coefficient less than 0.8 and were kept in the model. Additionally, we added age and sex as variables to the model to investigate their relationship to changes in neurocognitive scores. In total, nine features were used to train the model on the 21 patients with complete neuropsychological testing and MRI. Each feature was z-score normalized to allow for comparison of fitted values.

Multiple Linear Regression Analysis

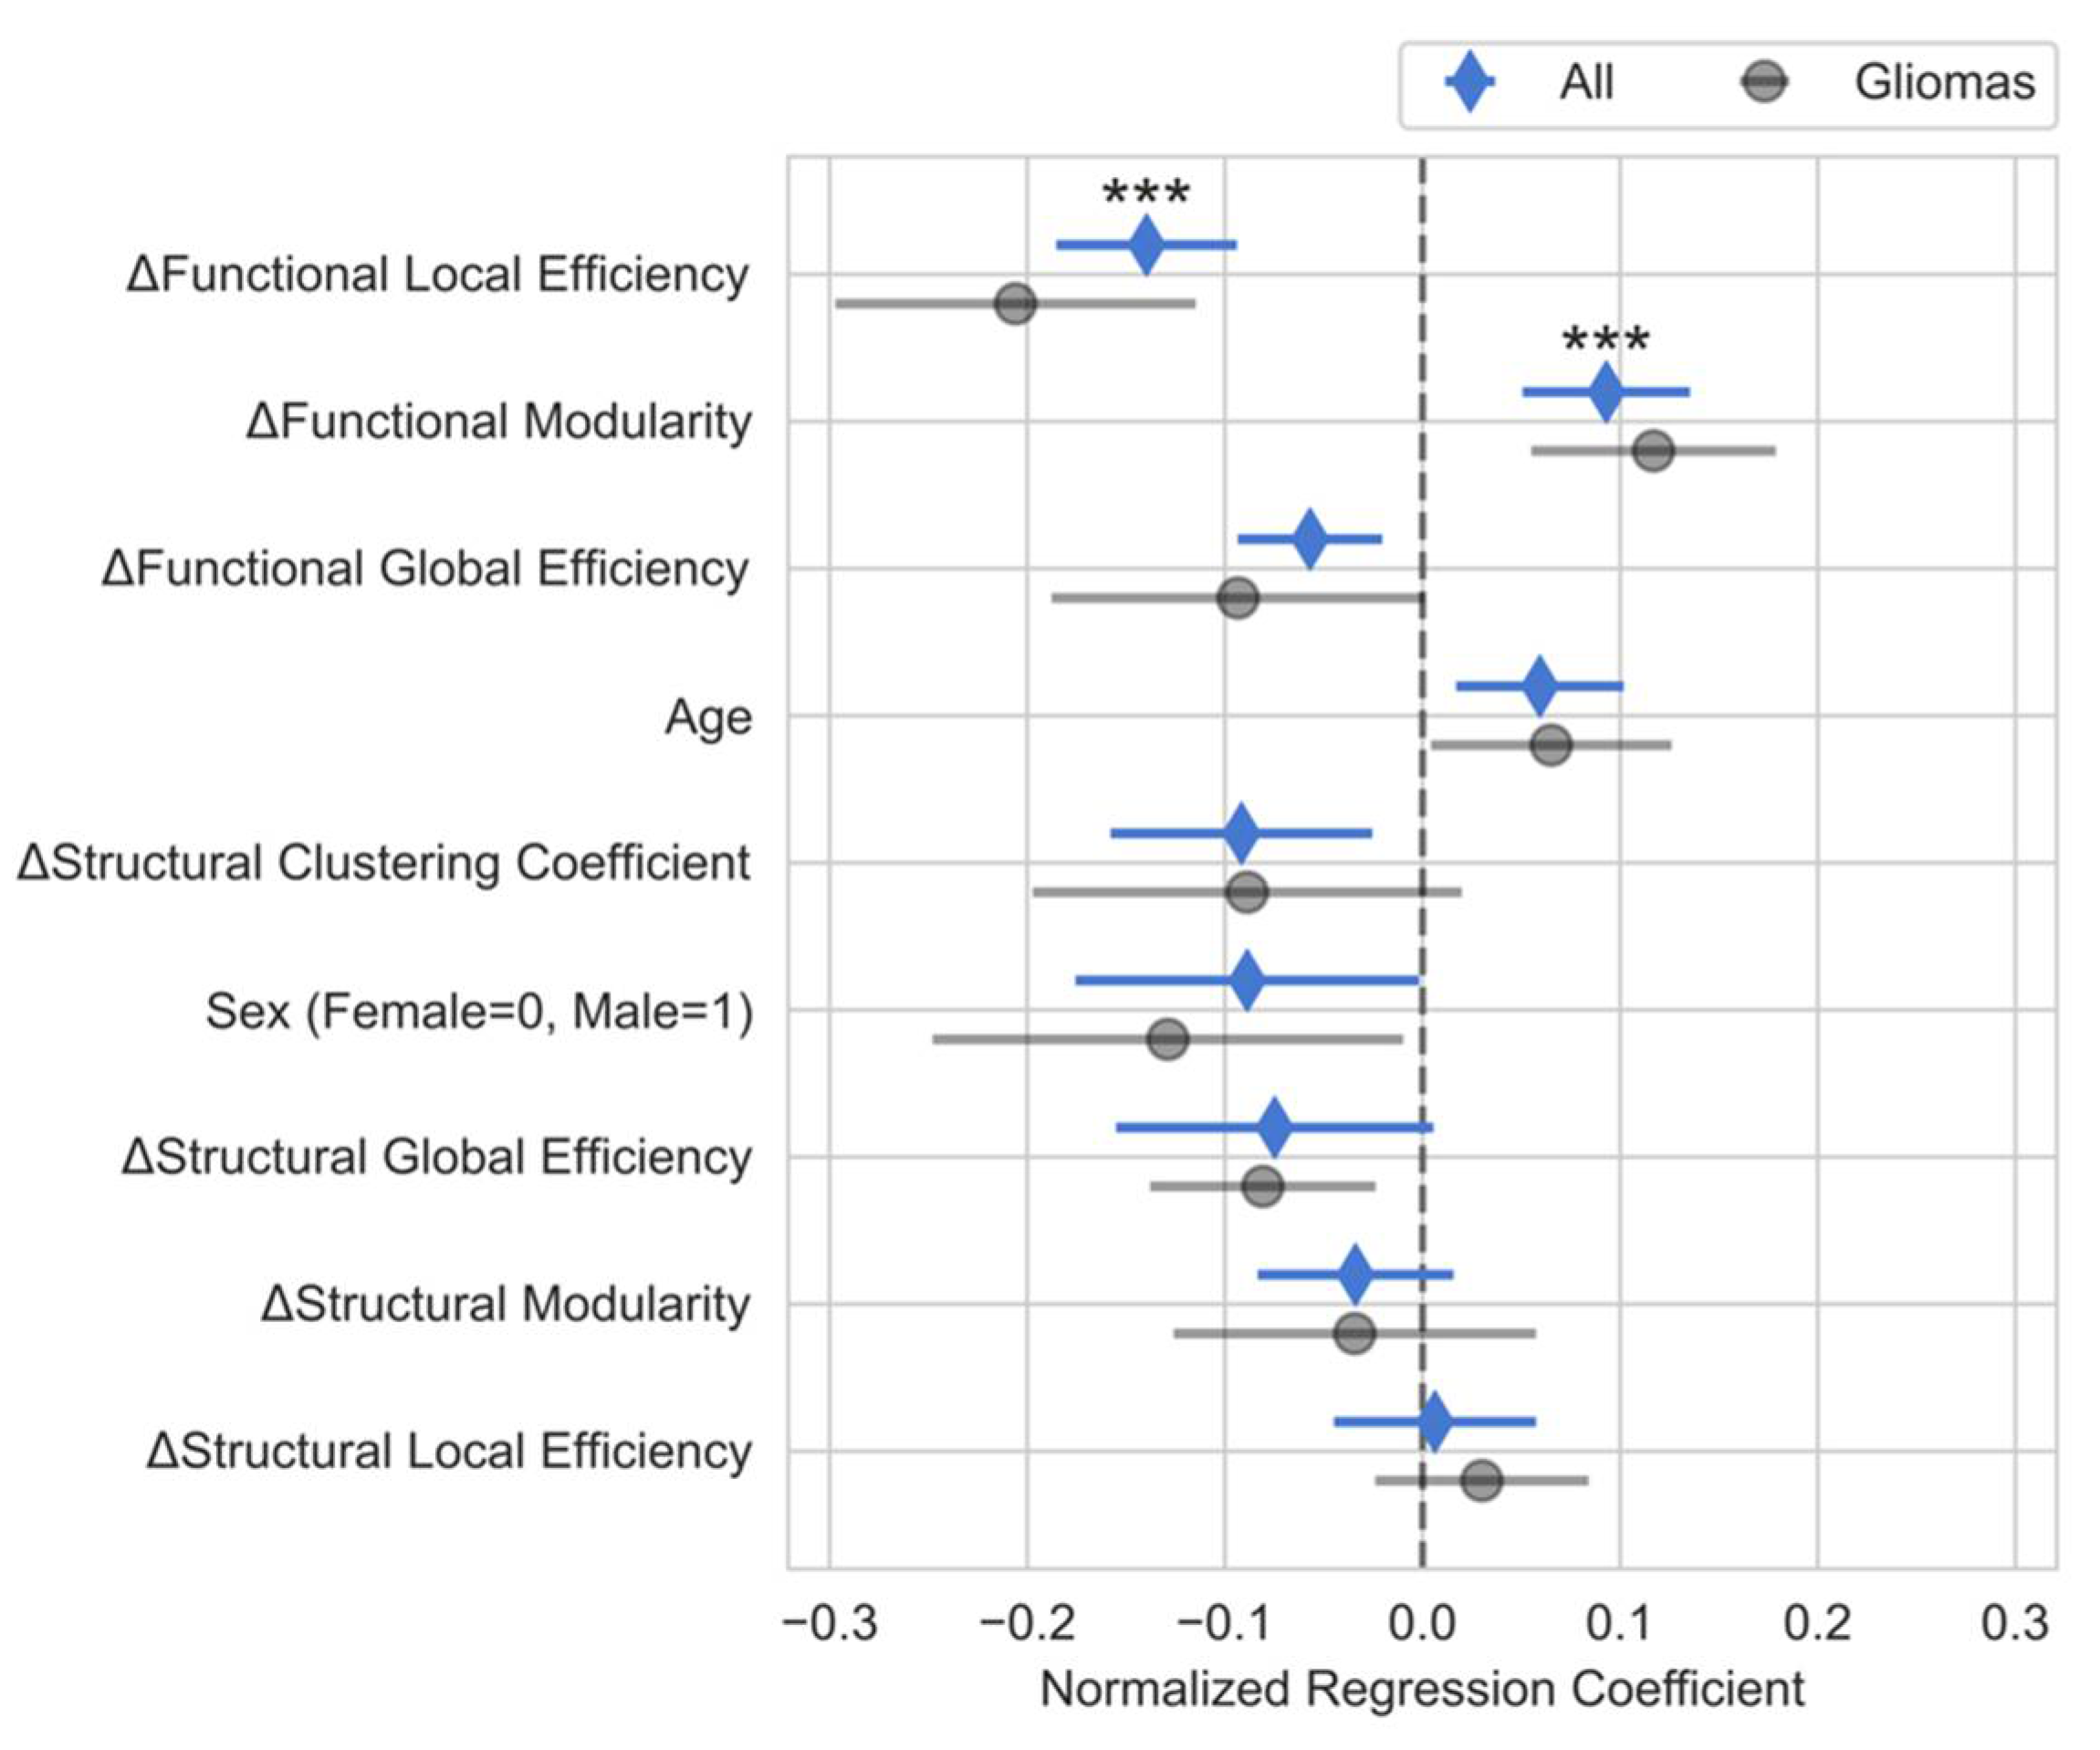
We investigated the correlation between the brain connectivity measures, age, and sex to changes in the Composite domain percentiles by using a multiple linear regression model. After fitting the multiple linear regression model and correcting for multiple comparisons, changes in functional local efficiency and functional modularity were significantly correlated with changes in composite neurocognitive score (p < 0.001), while changes in functional global efficiency trended toward significance (p = 0.0058), as shown in Figure 4. Decreases in functional local efficiency were correlated to decreases in neurocognitive scores, while increases in functional modularity were correlated with increases in composite score. Overall, the functional connectivity measures were much more sensitive to changes in neurocognitive functioning than the structural connectivity measures. For the model, the R2 was 0.908, adjusted R2 was 0.832, F-statistic = 12.0 with p value < 0.001.

Domain-specific Multiple Linear Regression Analysis

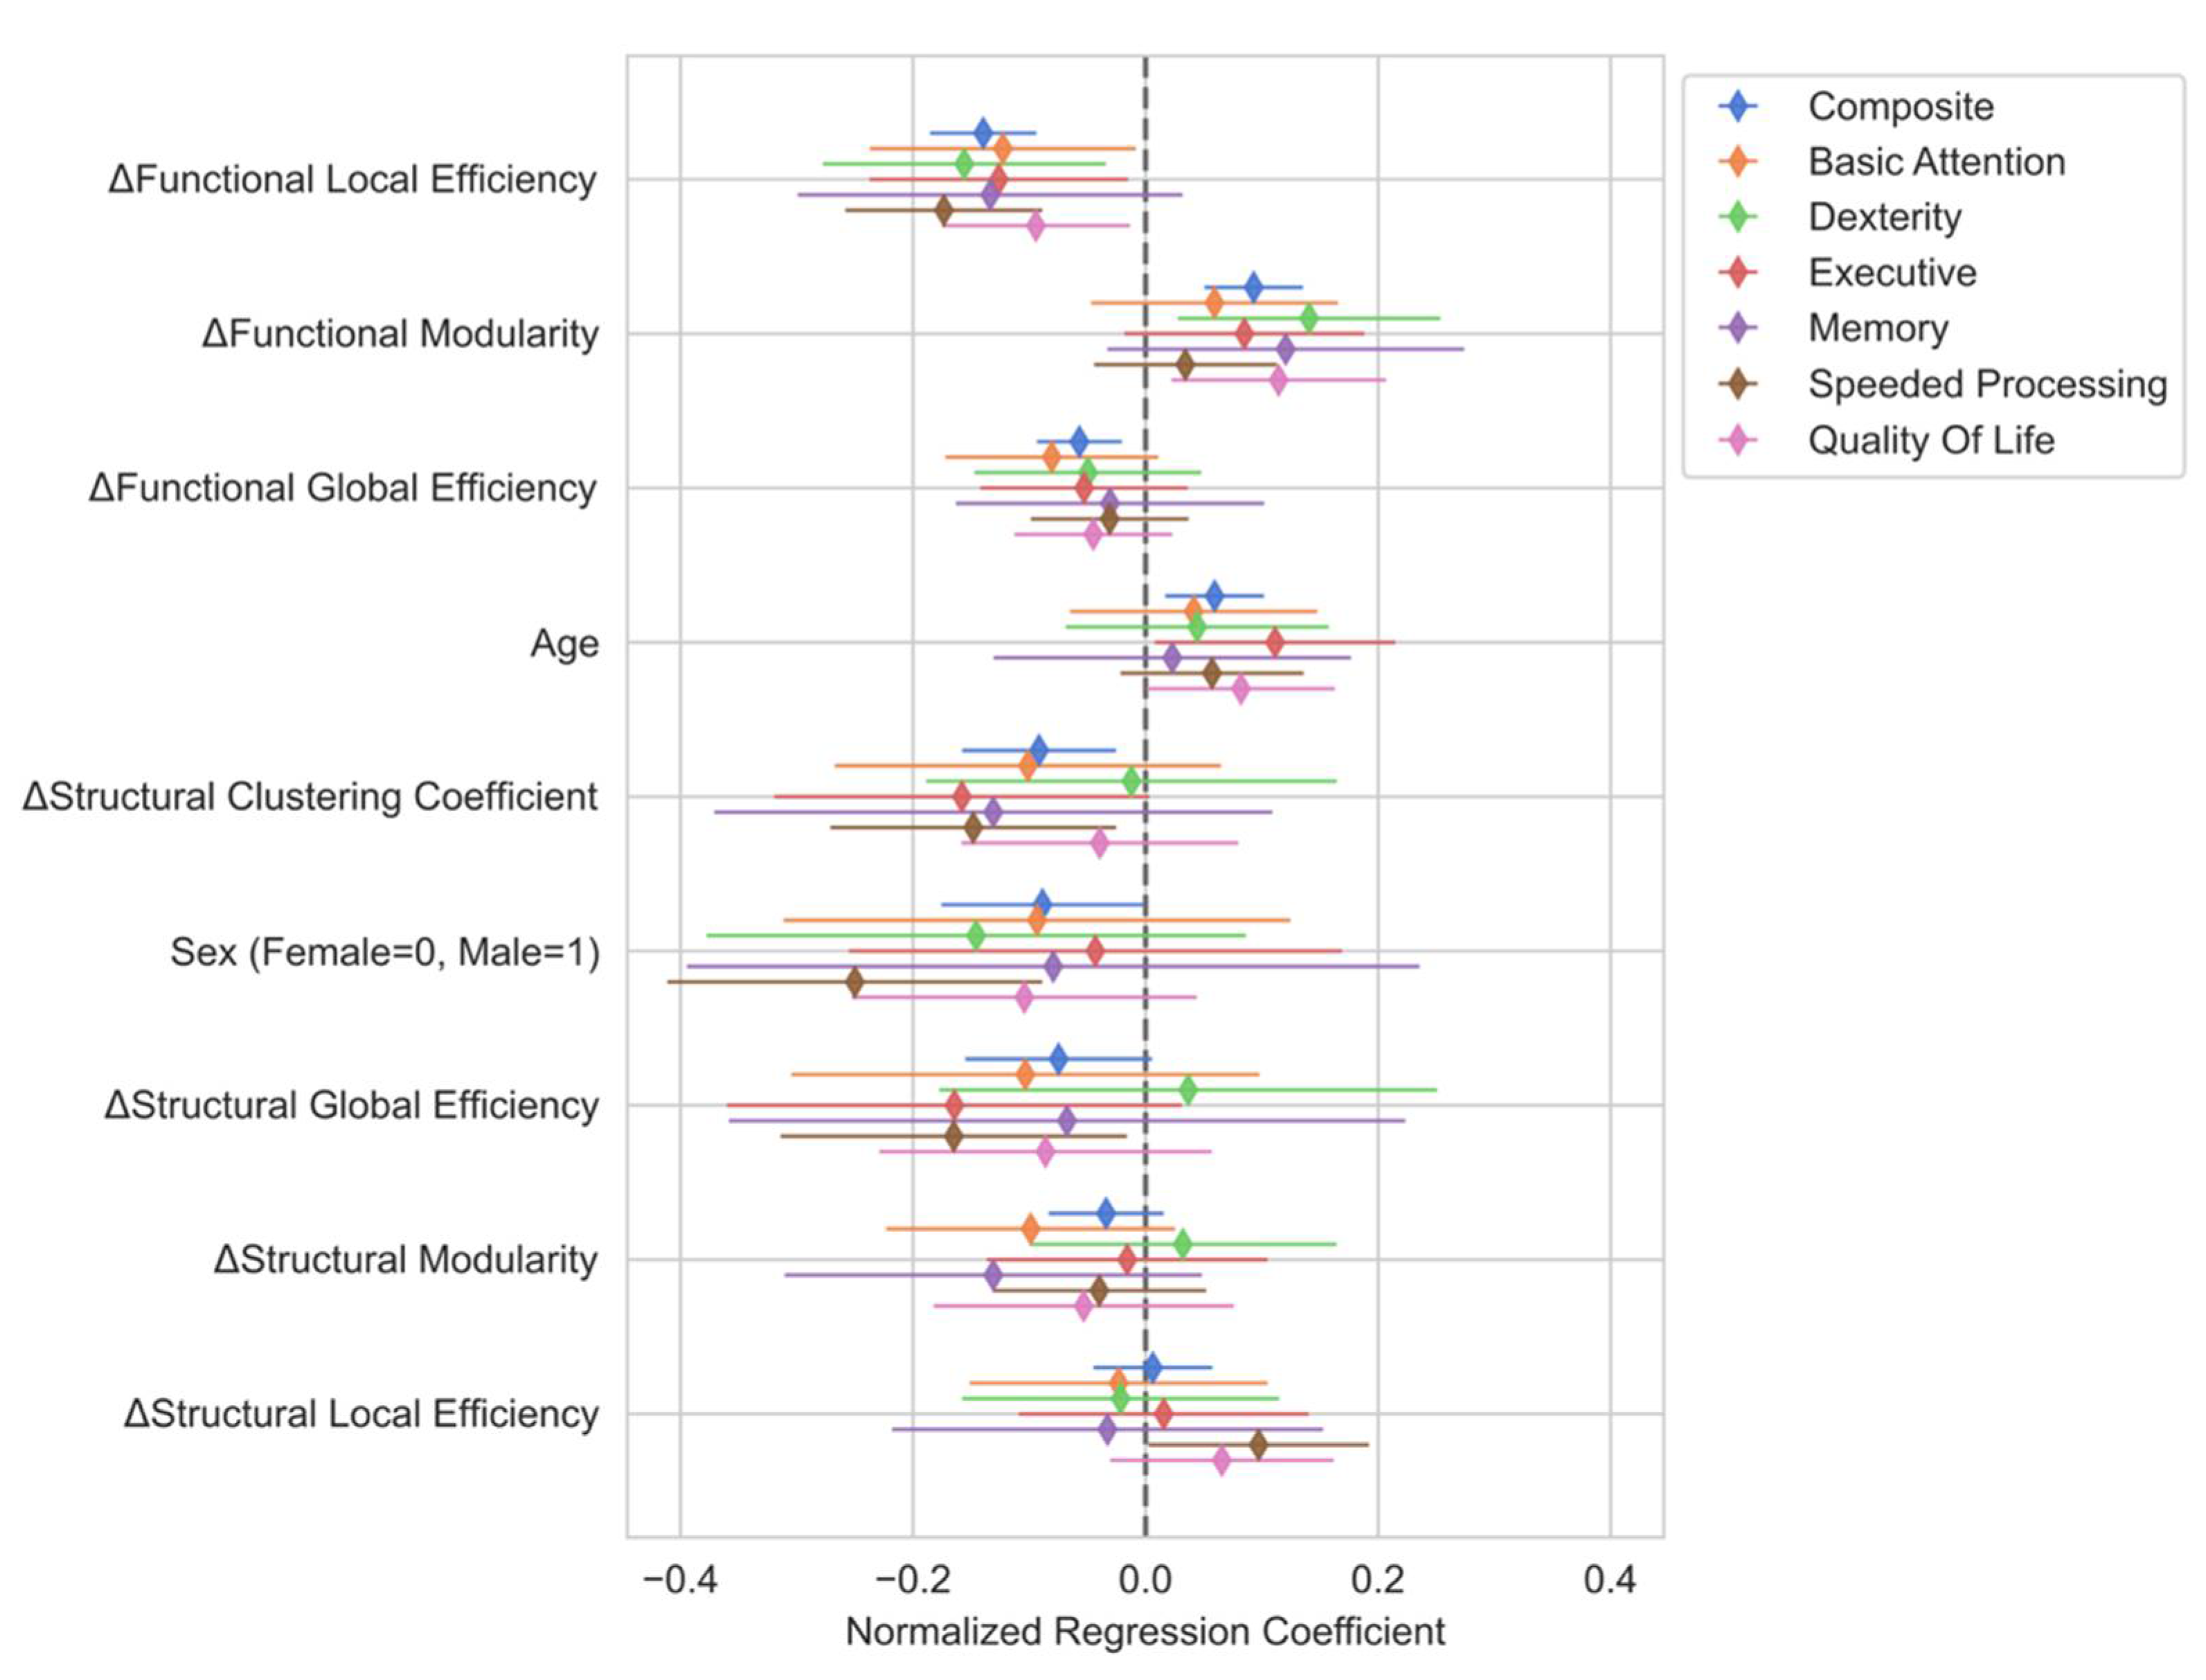
To investigate whether different neurocognitive domains correlate independently to the brain connectivity predictions, we performed additional multiple linear analyses, as shown in Figure 5. The relationships between the predictor variables and the domain scores were similar to the relationships between predictors and composite score. Quality of life scores were not included in the composite score, but Figure 5 shows that the relationship between quality of life and the predictor variables was similar to that of the composite score as well. The most significant predictor from the main model, functional local efficiency, had inverse relationships to all testing domains.

Simple Linear Regression Analysis

We also analyzed the predictive ability of changes in mean functional local efficiency and Functional Modularity to changes in composite using separate simple linear regression models, as shown in Figure 6. Even in the absence of a multiple linear regression model, changes in mean functional local efficiency (left) demonstrate a strong inverse correlation, Pearson r = -0.77, p < 0.001, to changes in composite scores (Figure 6A). Changes in functional modularity did not show a significant correlation to changes in composite score, Pearson r = 0.10, p = 0.656 (Figure 6B). even though the relationship between these two variables was highly significant in the multiple regression model. However, changes in modularity did show a slightly positive correlation with the residuals from the mean functional local efficiency model, though this relationship did not reach statistical significance, Pearson r = 0.38, p = 0.086, (Figure 6C). Therefore, changes in modularity trend towards being predictive after accounting for changes in functional local efficiency and are only highly predictive after accounting for the other predictor variables in the main model.
Discussion: Our study tested whether brain connectivity measures could predict changes in neurocognitive functioning in patients undergoing brain tumor resection surgery. Our results showed that changes in functional graph network connectivity were highly predictive of changes in the neurocognitive abilities of brain tumor resection patients. Specifically, our model reported a strong relationship between functional local efficiency and functional modularity to neurocognitive changes, while changes in functional global efficiency trended toward significance.
Changes in mean functional local efficiency were strongly inversely correlated with changes in overall neurocognitive functioning suggesting that increases in local efficiency may have negative effects on neurocognitive functioning in brain tumor patients. Local efficiency represents the level of integration of a local network averaged across the whole network [54] and can be thought of as the level of fault tolerance of the network [51]. Therefore, brains with increased local efficiency have higher fault tolerance and decreased local segregation [55]. In a study of 29 healthy adults, Stanley et al. also found that functional local efficiency during working memory tasks was inversely correlated to the working memory performance [55]. This finding supports the role of decreased local efficiency correlating to better neurocognitive performance. Interestingly, Stanley et al. only found the local efficiency to be predictive of working memory performance during task performance and not while the subject was at rest, while our results show that the changes to the local efficiency at rest are highly predictive of overall changes to neurocognitive functioning. Also supporting the inverse role of functional local efficiency in neurocognitive performance, Kawagoe et al. performed a cross-sectional study in elderly individuals and found that higher functional local efficiency at rest correlated to lower executive function performance and worse physical fitness [56].
One possible explanation for the inverse relationship between functional local efficiency and neurocognitive outcomes could be that functional local efficiency increases due to the level of neurocognitive demand even during mind wandering at rest. Brains of patients who sustained more neurocognitive setbacks due to surgery may be compensating by recruiting multiple functionally related regions to compensate for lost neurocognitive ability. Conversely, the brains of patients who saw decreased local efficiency may have had high recruitment of functionally local cortical areas before surgery due to mass effect. After surgery, the alleviation of mass effect may decrease the amount of local compensation necessary to ensure adequate neurocognitive functioning.
Functional modularity was also correlated with changes in neurocognitive scores. Increases in functional modularity were positively correlated with increases in neurocognitive functioning. This correlation corroborates previous studies showing functional modularity to be a biomarker positively associated with improved neurocognitive functioning [57,58,59,60]. For example, Siegel et al. found significantly increased functional modularity at three months post-stroke in patients with good recovery from language, spatial memory, and attention deficits [60].
Our results serve as a preliminary analysis to identify the key measures that are most predictive of neurocognitive outcomes in brain tumor resection patients. A crucial next step is to validate the predictive ability of functional brain connectivity measures on an independent cohort of patients.
We modeled the brain connectivity measures together in a single multiple linear regression model rather than in separate models. Combining the connectivity measures into a single model is intuitive as brain connectivity is complex and unlikely to be convincingly captured by a single metric. This approach, however, requires that the interpretation of the effects of a single brain connectivity metric be made with caution. The coefficients associated with each connectivity measure in the model represent the relationship between that specific measure and the changes in neurocognitive functioning while holding all other variables constant. In situ, however, brain connectivity measures do not change in isolation, and inferences about changes in neurocognitive score can only be made when accounting for the changes in all the variables.
While functional connectivity measures predicted changes in composite score, we did not see an overall improvement in neurocognitive functioning following surgery relative to the controls. Dexterity and memory functioning scores did improve; however, these improvements were not significantly different from the control group. Because both controls and patients improved in their performance on these assessments, it is likely that the improvement in these domains represents the improvement due to practice effects rather than surgical treatment. Quality of life metrics also improved postoperatively, supporting the use of tumor removal as a means to improve patients’ well-being.
We observed low compliance from our patients for the neuropsychological testing, likely due to the mental demands of the neuropsychological evaluations under already stressful circumstances for the patients. In a 2018 study, Burke et al. investigated dropout rates for patients Alzheimer Disease studies and found that worsening neurocognitive impairment along with difficulty in performing tasks predicted which patients would dropout [61]. Therefore, we believe that the high mental strains of testing in combination with the already present difficulties from neurological impairment led to poor patient compliance with the neuropsychological testing. Future studies should investigate how to reduce the burden of neurocognitive testing which should, in turn, increase patient compliance. Interestingly, compliance with MR scanning was much higher, indicating that brain connectivity markers could be a less burdensome means of tracking neurocognitive functioning.
Even when patients with significant impairments complied with testing, many of the tests were not sensitive enough to measure changes in states of impairment. For example, an elderly patient in our study presented with language deficits and poor overall neurocognitive functioning. This patient was unable to complete most of the assessments both preoperatively and postoperatively. Therefore, we could not track the change from baseline for this patient. However, upon clinical assessment, the physician noted an improvement in their neurocognitive functioning. For such patients with neurocognitive deficits, the neuropsychological measurement tools proved to be insufficiently sensitive for monitoring their capabilities. This patient group may be better monitored with neuropsychological measurement tools that can detect changes in the levels of impairment without being overly burdensome.
Another factor may be timing. These assessments were conducted only two weeks apart, and it may be that reorganization changes take more time to become apparent. In the postoperative period, patients experience the effects of medications, brain shift, physical fatigue, sleep deprivation, and other factors that may affect brain function. The amount of time necessary for the resolution of these changes and their effects is unknown. We selected our time interval for testing to isolate surgical effects as well as minimize peri-operative medication effects.

Conclusion:

Functional connectivity measures of local efficiency and modularity were highly predictive of neurocognitive changes in brain tumor resection patients. Therefore, surgical planning that accounts for changes in graph network functional connectivity shows promise for predicting neurocognitive outcomes in patients.

Disclosures

The project described is supported by the National Institute of General Medical Sciences, U54 GM115458, which funds the Great Plains IDeA-CTR Network. It was awarded to author MA. The content is solely the responsibility of the authors and does not necessarily represent the official views of the NIH.

Describe any perceived Conflict(s) of Interest

All authors declare no conflicts of interest.

Acknowledgments

Thank you to Jill Skorupa, RN, BSN, Katie Burcal, MS, Dulce Maroni, PhD, and James Brown for data collection and coordinating enrollment. Visual abstract was created with BioRender.com.

References

  1. Luna, L.P.; Sherbaf, F.G.; Sair, H.I.; Mukherjee, D.; Oliveira, I.B.; Köhler, C.A. Can Preoperative Mapping with Functional MRI Reduce Morbidity in Brain Tumor Resection? A Systematic Review and Meta-Analysis of 68 Observational Studies. Radiology 2021, 300, 338–349. [Google Scholar] [CrossRef]
  2. Hamer, P.D.W.; Robles, S.G.; Zwinderman, A.H.; Duffau, H.; Berger, M.S. Impact of intraoperative stimulation brain mapping on glioma surgery outcome: a meta-analysis. J. Clin. Oncol. 2012, 30, 2559–2565. [Google Scholar] [CrossRef]
  3. Ellis, D.G.; White, M.L.; Hayasaka, S.; Warren, D.E.; Wilson, T.W.; Aizenberg, M.R. Accuracy analysis of fMRI and MEG activations determined by intraoperative mapping. Neurosurg. Focus 2020, 48, E13. [Google Scholar] [CrossRef] [PubMed]
  4. Sinha, N.; Wang, Y.; da Silva, N.M.; Miserocchi, A.; McEvoy, A.W.; de Tisi, J.; Vos, S.B.; Winston, G.P.; Duncan, J.S.; Taylor, P.N. Structural brain network abnormalities and the probability of seizure recurrence after epilepsy surgery. Neurology 2021, 96, e758–e771. [Google Scholar] [CrossRef] [PubMed]
  5. Wei, Y.; Li, C.; Cui, Z.; Mayrand, R.C.; Zou, J.; Wong, A.L.K.C.; Sinha, R.; Matys, T.; Schönlieb, C.-B.; Price, S.J. Structural connectome quantifies tumour invasion and predicts survival in glioblastoma patients. Brain 2023, 146, 1714–1727. [Google Scholar] [CrossRef] [PubMed]
  6. Pievani, M.; Filippini, N.; van den Heuvel, M.P.; Cappa, S.F.; Frisoni, G.B. Brain connectivity in neurodegenerative diseases—from phenotype to proteinopathy. Nature Reviews Neurology 2014, 10, 620. [Google Scholar] [CrossRef]
  7. https://www.nature.com/articles/nrneurol.2014.178#supplementary-information.
  8. Rogers, B.P.; Morgan, V.L.; Newton, A.T.; Gore, J.C. Assessing functional connectivity in the human brain by fMRI. Magn. Reson. Imaging 2007, 25, 1347–1357. [Google Scholar] [CrossRef]
  9. Albert, K.M.; Potter, G.G.; Boyd, B.D.; Kang, H.; Taylor, W.D. Brain network functional connectivity and cognitive performance in major depressive disorder. J. Psychiatr. Res. 2019, 110, 51–56. [Google Scholar] [CrossRef]
  10. Aerts, H.; Schirner, M.; Jeurissen, B.; Van Roost, D.; Achten, E.; Ritter, P.; Marinazzo, D. Modeling Brain Dynamics in Brain Tumor Patients Using the Virtual Brain. eNeuro 2018, 5, ENEURO.0083-0018.2018. [Google Scholar] [CrossRef]
  11. Johnson, D.R.; Sawyer, A.M.; Meyers, C.A.; O’Neill, B.P.; Wefel, J.S. Early measures of cognitive function predict survival in patients with newly diagnosed glioblastoma. Neuro Oncol. 2012, 14, 808–816. [Google Scholar] [CrossRef]
  12. Noll, K.R.; Sullaway, C.; Ziu, M.; Weinberg, J.S.; Wefel, J.S. Relationships between tumor grade and neurocognitive functioning in patients with glioma of the left temporal lobe prior to surgical resection. Neuro Oncol. 2015, 17, 580–587. [Google Scholar] [CrossRef] [PubMed]
  13. Wefel, J.S.; Noll, K.R.; Rao, G.; Cahill, D.P. Neurocognitive function varies by IDH1 genetic mutation status in patients with malignant glioma prior to surgical resection. Neuro Oncol. 2016, 18, 1656–1663. [Google Scholar] [CrossRef] [PubMed]
  14. Armstrong, T.; Mendoza, T.; Gring, I.; Coco, C.; Cohen, M.; Eriksen, L.; Hsu, M.-A.; Gilbert, M.R.; Cleeland, C. Validation of the MD Anderson symptom inventory brain tumor module (MDASI-BT). J. Neurooncol. 2006, 80, 27–35. [Google Scholar] [CrossRef] [PubMed]
  15. Weitzner, M.A.; Meyers, C.A.; Gelke, C.K.; Byrne, K.S.; Levin, V.A.; Cella, D.F. The Functional Assessment of Cancer Therapy (FACT) scale. Development of a brain subscale and revalidation of the general version (FACT-G) in patients with primary brain tumors. Cancer 1995, 75, 1151–1161. [Google Scholar] [CrossRef] [PubMed]
  16. Grace, J.; Malloy, P.H. Frontal systems behavior scale (FrSBe): Professional manual; Psychological Assessment Resources (PAR): 2001.
  17. Iverson, G.L.; Brooks, B.L.; White, T.; Stern, R.A. Neuropsychological Assessment Battery: Introduction and advanced interpretation. 2008.
  18. Scale, W.D.W.M. WMS-III. San Antonio: The Psychological Corporation 1997.
  19. Meyers, J.E.; Volbrecht, M.; Axelrod, B.N.; Reinsch-Boothby, L. Embedded symptom validity tests and overall neuropsychological test performance. Arch. Clin. Neuropsychol. 2011, 26, 8–15. [Google Scholar] [CrossRef] [PubMed]
  20. Golden, C.; Freshwater, S. Stroop Color and Word Test Adult Version. A manual for clinical and experimental uses.(2a ed.). Wood Dale, Illinois: Stoelting 2002.
  21. Armstrong, T.; Wefel, J.; Wang, M.; Won, M.; Bottomley, A.; Mendoza, T.; Coens, C.; Werner-Wasik, M.; Brachman, D.; Choucair, A. Clinical utility of neurocognitive function (NCF), quality of life (QOL), and symptom assessment as prognostic factors for survival and measures of treatment effects on RTOG 0525. J. Clin. Oncol. 2011, 29, 2016–2016. [Google Scholar] [CrossRef]
  22. Wefel, J.S.; Cloughesy, T.; Zazzali, J.L.; Zheng, M.; Prados, M.; Wen, P.Y.; Mikkelsen, T.; Schiff, D.; Abrey, L.E.; Yung, W.A. Neurocognitive function in patients with recurrent glioblastoma treated with bevacizumab. Neuro Oncol. 2011, 13, 660–668. [Google Scholar] [CrossRef]
  23. Harms, M.P.; Somerville, L.H.; Ances, B.M.; Andersson, J.; Barch, D.M.; Bastiani, M.; Bookheimer, S.Y.; Brown, T.B.; Buckner, R.L.; Burgess, G.C.; et al. Extending the Human Connectome Project across ages: Imaging protocols for the Lifespan Development and Aging projects. Neuroimage 2018, 183, 972–984. [Google Scholar] [CrossRef] [PubMed]
  24. Finn, E.S.; Shen, X.; Scheinost, D.; Rosenberg, M.D.; Huang, J.; Chun, M.M.; Papademetris, X.; Constable, R.T. Functional connectome fingerprinting: identifying individuals using patterns of brain connectivity. Nat. Neurosci. 2015, 18, 1664. [Google Scholar] [CrossRef]
  25. https://www.nature.com/articles/nn.4135#supplementary-information.
  26. Pannunzi, M.; Hindriks, R.; Bettinardi, R.G.; Wenger, E.; Lisofsky, N.; Martensson, J.; Butler, O.; Filevich, E.; Becker, M.; Lochstet, M.; et al. Resting-state fMRI correlations: From link-wise unreliability to whole brain stability. Neuroimage 2017, 157, 250–262. [Google Scholar] [CrossRef]
  27. Esteban, O.; Markiewicz, C.; Burns, C.; Johnson, H.; Ziegler, E.; Manhães-Savio, A.; Jarecka, D.; Ellis, D.; Yvernault, B.; Hamalainen, C. nipy/nipype: 1.5. 0. Zenodo https://doi. org/10.5281/zenodo 2020, 596855. [Google Scholar]
  28. Esteban, O.; Markiewicz, C.J.; Blair, R.W.; Moodie, C.A.; Isik, A.I.; Erramuzpe, A.; Kent, J.D.; Goncalves, M.; DuPre, E.; Snyder, M. fMRIPrep: a robust preprocessing pipeline for functional MRI. Nature methods 2019, 16, 111–116. [Google Scholar] [CrossRef] [PubMed]
  29. Esteban, O.; Wright, J.; Markiewicz, C.J.; Thompson, W.H.; Goncalves, M.; Ciric, R.; Blair, R.W.; Feingold, F.; Rokem, A.; Ghosh, S. NiPreps: enabling the division of labor in neuroimaging beyond fMRIPrep. 2019.
  30. Schaefer, A.; Kong, R.; Gordon, E.M.; Laumann, T.O.; Zuo, X.-N.; Holmes, A.J.; Eickhoff, S.B.; Yeo, B.T. Local-global parcellation of the human cerebral cortex from intrinsic functional connectivity MRI. Cereb. Cortex 2018, 28, 3095–3114. [Google Scholar] [CrossRef] [PubMed]
  31. Evans, A.C.; Janke, A.L.; Collins, D.L.; Baillet, S. Brain templates and atlases. Neuroimage 2012, 62, 911–922. [Google Scholar] [CrossRef] [PubMed]
  32. Ciric, R.; Thompson, W.H.; Lorenz, R.; Goncalves, M.; MacNicol, E.; Markiewicz, C.J.; Halchenko, Y.O.; Ghosh, S.S.; Gorgolewski, K.J.; Poldrack, R.A.; et al. TemplateFlow: FAIR-sharing of multi-scale, multi-species brain models. bioRxiv 2022, 2021.2002.2010.430678. [CrossRef]
  33. Avants, B.B.; Tustison, N.; Song, G. Advanced normalization tools (ANTS). Insight j 2009, 2, 1–35. [Google Scholar]
  34. Jenkinson, M.; Bannister, P.; Brady, M.; Smith, S. Improved Optimization for the Robust and Accurate Linear Registration and Motion Correction of Brain Images. Neuroimage 2002, 17, 825–841. [Google Scholar] [CrossRef] [PubMed]
  35. Andersson, J.L.R.; Skare, S.; Ashburner, J. How to correct susceptibility distortions in spin-echo echo-planar images: application to diffusion tensor imaging. Neuroimage 2003, 20, 870–888. [Google Scholar] [CrossRef] [PubMed]
  36. Woolrich, M.W.; Jbabdi, S.; Patenaude, B.; Chappell, M.; Makni, S.; Behrens, T.; Beckmann, C.; Jenkinson, M.; Smith, S.M. Bayesian analysis of neuroimaging data in FSL. Neuroimage 2009, 45, S173–186. [Google Scholar]
  37. 10.1016/j.neuroimage.2008.10.055.
  38. Greve, D.N.; Fischl, B. Accurate and robust brain image alignment using boundary-based registration. Neuroimage 2009, 48, 63–72. [Google Scholar] [CrossRef]
  39. Glasser, M.F.; Sotiropoulos, S.N.; Wilson, J.A.; Coalson, T.S.; Fischl, B.; Andersson, J.L.; Xu, J.; Jbabdi, S.; Webster, M.; Polimeni, J.R.; et al. The minimal preprocessing pipelines for the Human Connectome Project. Neuroimage 2013, 80, 105–124. [Google Scholar] [CrossRef]
  40. Power, J.D.; Mitra, A.; Laumann, T.O.; Snyder, A.Z.; Schlaggar, B.L.; Petersen, S.E. Methods to detect, characterize, and remove motion artifact in resting state fMRI. Neuroimage 2014, 84, 320–341. [Google Scholar] [CrossRef]
  41. Abraham, A.; Pedregosa, F.; Eickenberg, M.; Gervais, P.; Mueller, A.; Kossaifi, J.; Gramfort, A.; Thirion, B.; Varoquaux, G. Machine learning for neuroimaging with scikit-learn. Front. Neuroinform. 2014, 8. [Google Scholar] [CrossRef] [PubMed]
  42. Cheng, W.; Palaniyappan, L.; Li, M.; Kendrick, K.M.; Zhang, J.; Luo, Q.; Liu, Z.; Yu, R.; Deng, W.; Wang, Q.; et al. Voxel-based, brain-wide association study of aberrant functional connectivity in schizophrenia implicates thalamocortical circuitry. Npj Schizophrenia 2015, 1, 15016. [Google Scholar] [CrossRef] [PubMed]
  43. https://www.nature.com/articles/npjschz201516#supplementary-information.
  44. Andersson, J.L.R.; Sotiropoulos, S.N. An integrated approach to correction for off-resonance effects and subject movement in diffusion MR imaging. Neuroimage 2016, 125, 1063–1078. [Google Scholar] [CrossRef] [PubMed]
  45. Jeurissen, B.; Tournier, J.-D.; Dhollander, T.; Connelly, A.; Sijbers, J. Multi-tissue constrained spherical deconvolution for improved analysis of multi-shell diffusion MRI data. Neuroimage 2014, 103, 411–426. [Google Scholar] [CrossRef] [PubMed]
  46. Smith, R.E.; Tournier, J.-D.; Calamante, F.; Connelly, A. Anatomically-constrained tractography: Improved diffusion MRI streamlines tractography through effective use of anatomical information. Neuroimage 2012, 62, 1924–1938. [Google Scholar] [CrossRef] [PubMed]
  47. Smith, R.E.; Tournier, J.-D.; Calamante, F.; Connelly, A. SIFT: Spherical-deconvolution informed filtering of tractograms. Neuroimage 2013, 67, 298–312. [Google Scholar] [CrossRef] [PubMed]
  48. Rolls, E.T.; Joliot, M.; Tzourio-Mazoyer, N. Implementation of a new parcellation of the orbitofrontal cortex in the automated anatomical labeling atlas. Neuroimage 2015, 122, 1–5. [Google Scholar] [CrossRef]
  49. Jeurissen, B.; Descoteaux, M.; Mori, S.; Leemans, A. Diffusion MRI fiber tractography of the brain. NMR Biomed. 2019, 32, e3785. [Google Scholar] [CrossRef]
  50. Newman, M.E.J. Modularity and community structure in networks. Proceedings of the National Academy of Sciences 2006, 103, 8577–8582. [Google Scholar] [CrossRef]
  51. Sun, Y.; Yin, Q.; Fang, R.; Yan, X.; Wang, Y.; Bezerianos, A.; Tang, H.; Miao, F.; Sun, J. Disrupted Functional Brain Connectivity and Its Association to Structural Connectivity in Amnestic Mild Cognitive Impairment and Alzheimer’s Disease. PLoS One 2014, 9, e96505. [Google Scholar] [CrossRef] [PubMed]
  52. Gamboa, O.L.; Tagliazucchi, E.; von Wegner, F.; Jurcoane, A.; Wahl, M.; Laufs, H.; Ziemann, U. Working memory performance of early MS patients correlates inversely with modularity increases in resting state functional connectivity networks. Neuroimage 2014, 94, 385–395. [Google Scholar] [CrossRef] [PubMed]
  53. Ben Simon, E.; Maron-Katz, A.; Lahav, N.; Shamir, R.; Hendler, T. Tired and misconnected: A breakdown of brain modularity following sleep deprivation. Hum. Brain Mapp. 2017, 38, 3300–3314. [Google Scholar] [CrossRef] [PubMed]
  54. Yeo, B.T.T.; Krienen, F.M.; Sepulcre, J.; Sabuncu, M.R.; Lashkari, D.; Hollinshead, M.; Roffman, J.L.; Smoller, J.W.; Zöllei, L.; Polimeni, J.R.; et al. The organization of the human cerebral cortex estimated by intrinsic functional connectivity. J. Neurophysiol. 2011, 106, 1125–1165. [Google Scholar] [CrossRef] [PubMed]
  55. Latora, V.; Marchiori, M. Efficient behavior of small-world networks. Phys. Rev. Lett. 2001, 87, 198701. [Google Scholar] [CrossRef] [PubMed]
  56. Rubinov, M.; Sporns, O. Complex network measures of brain connectivity: Uses and interpretations. Neuroimage 2010, 52, 1059–1069. [Google Scholar] [CrossRef]
  57. Team, R.C. R: A language and environment for statistical computing, R Foundation for Statistical Computing: Vienna, Austria, 2022.
  58. Nieto-Castanon, A. Handbook of functional connectivity magnetic resonance imaging methods in CONN; Hilbert Press: 2020.
  59. Stanley, M.L.; Simpson, S.L.; Dagenbach, D.; Lyday, R.G.; Burdette, J.H.; Laurienti, P.J. Changes in brain network efficiency and working memory performance in aging. PLoS One 2015, 10, e0123950. [Google Scholar] [CrossRef] [PubMed]
  60. Kawagoe, T.; Onoda, K.; Yamaguchi, S. Associations among executive function, cardiorespiratory fitness, and brain network properties in older adults. Sci. Rep. 2017, 7, 40107. [Google Scholar] [CrossRef]
  61. Alexander-Bloch, A.; Gogtay, N.; Meunier, D.; Birn, R.; Clasen, L.; Lalonde, F.; Lenroot, R.; Giedd, J.; Bullmore, E. Disrupted Modularity and Local Connectivity of Brain Functional Networks in Childhood-Onset Schizophrenia. Front. Syst. Neurosci. 2010, 4. [Google Scholar] [CrossRef]
  62. Gallen, C.L.; D’Esposito, M. Brain Modularity: A Biomarker of Intervention-related Plasticity. Trends Cogn. Sci. 2019, 23, 293–304. [Google Scholar] [CrossRef]
  63. Jalili, M. Graph theoretical analysis of Alzheimer’s disease: Discrimination of AD patients from healthy subjects. Information Sciences 2017, 384, 145–156. [Google Scholar] [CrossRef]
  64. Siegel, J.S.; Seitzman, B.A.; Ramsey, L.E.; Ortega, M.; Gordon, E.M.; Dosenbach, N.U.F.; Petersen, S.E.; Shulman, G.L.; Corbetta, M. Re-emergence of modular brain networks in stroke recovery. Cortex 2018, 101, 44–59. [Google Scholar] [CrossRef] [PubMed]
  65. Burke, S.L.; Hu, T.; Naseh, M.; Fava, N.M.; O’Driscoll, J.; Alvarez, D.; Cottler, L.B.; Duara, R. Factors influencing attrition in 35 Alzheimer’s Disease Centers across the USA: a longitudinal examination of the National Alzheimer’s Coordinating Center’s Uniform Data Set. Aging Clin. Exp. Res. 2019, 31, 1283–1297. [Google Scholar] [CrossRef] [PubMed]
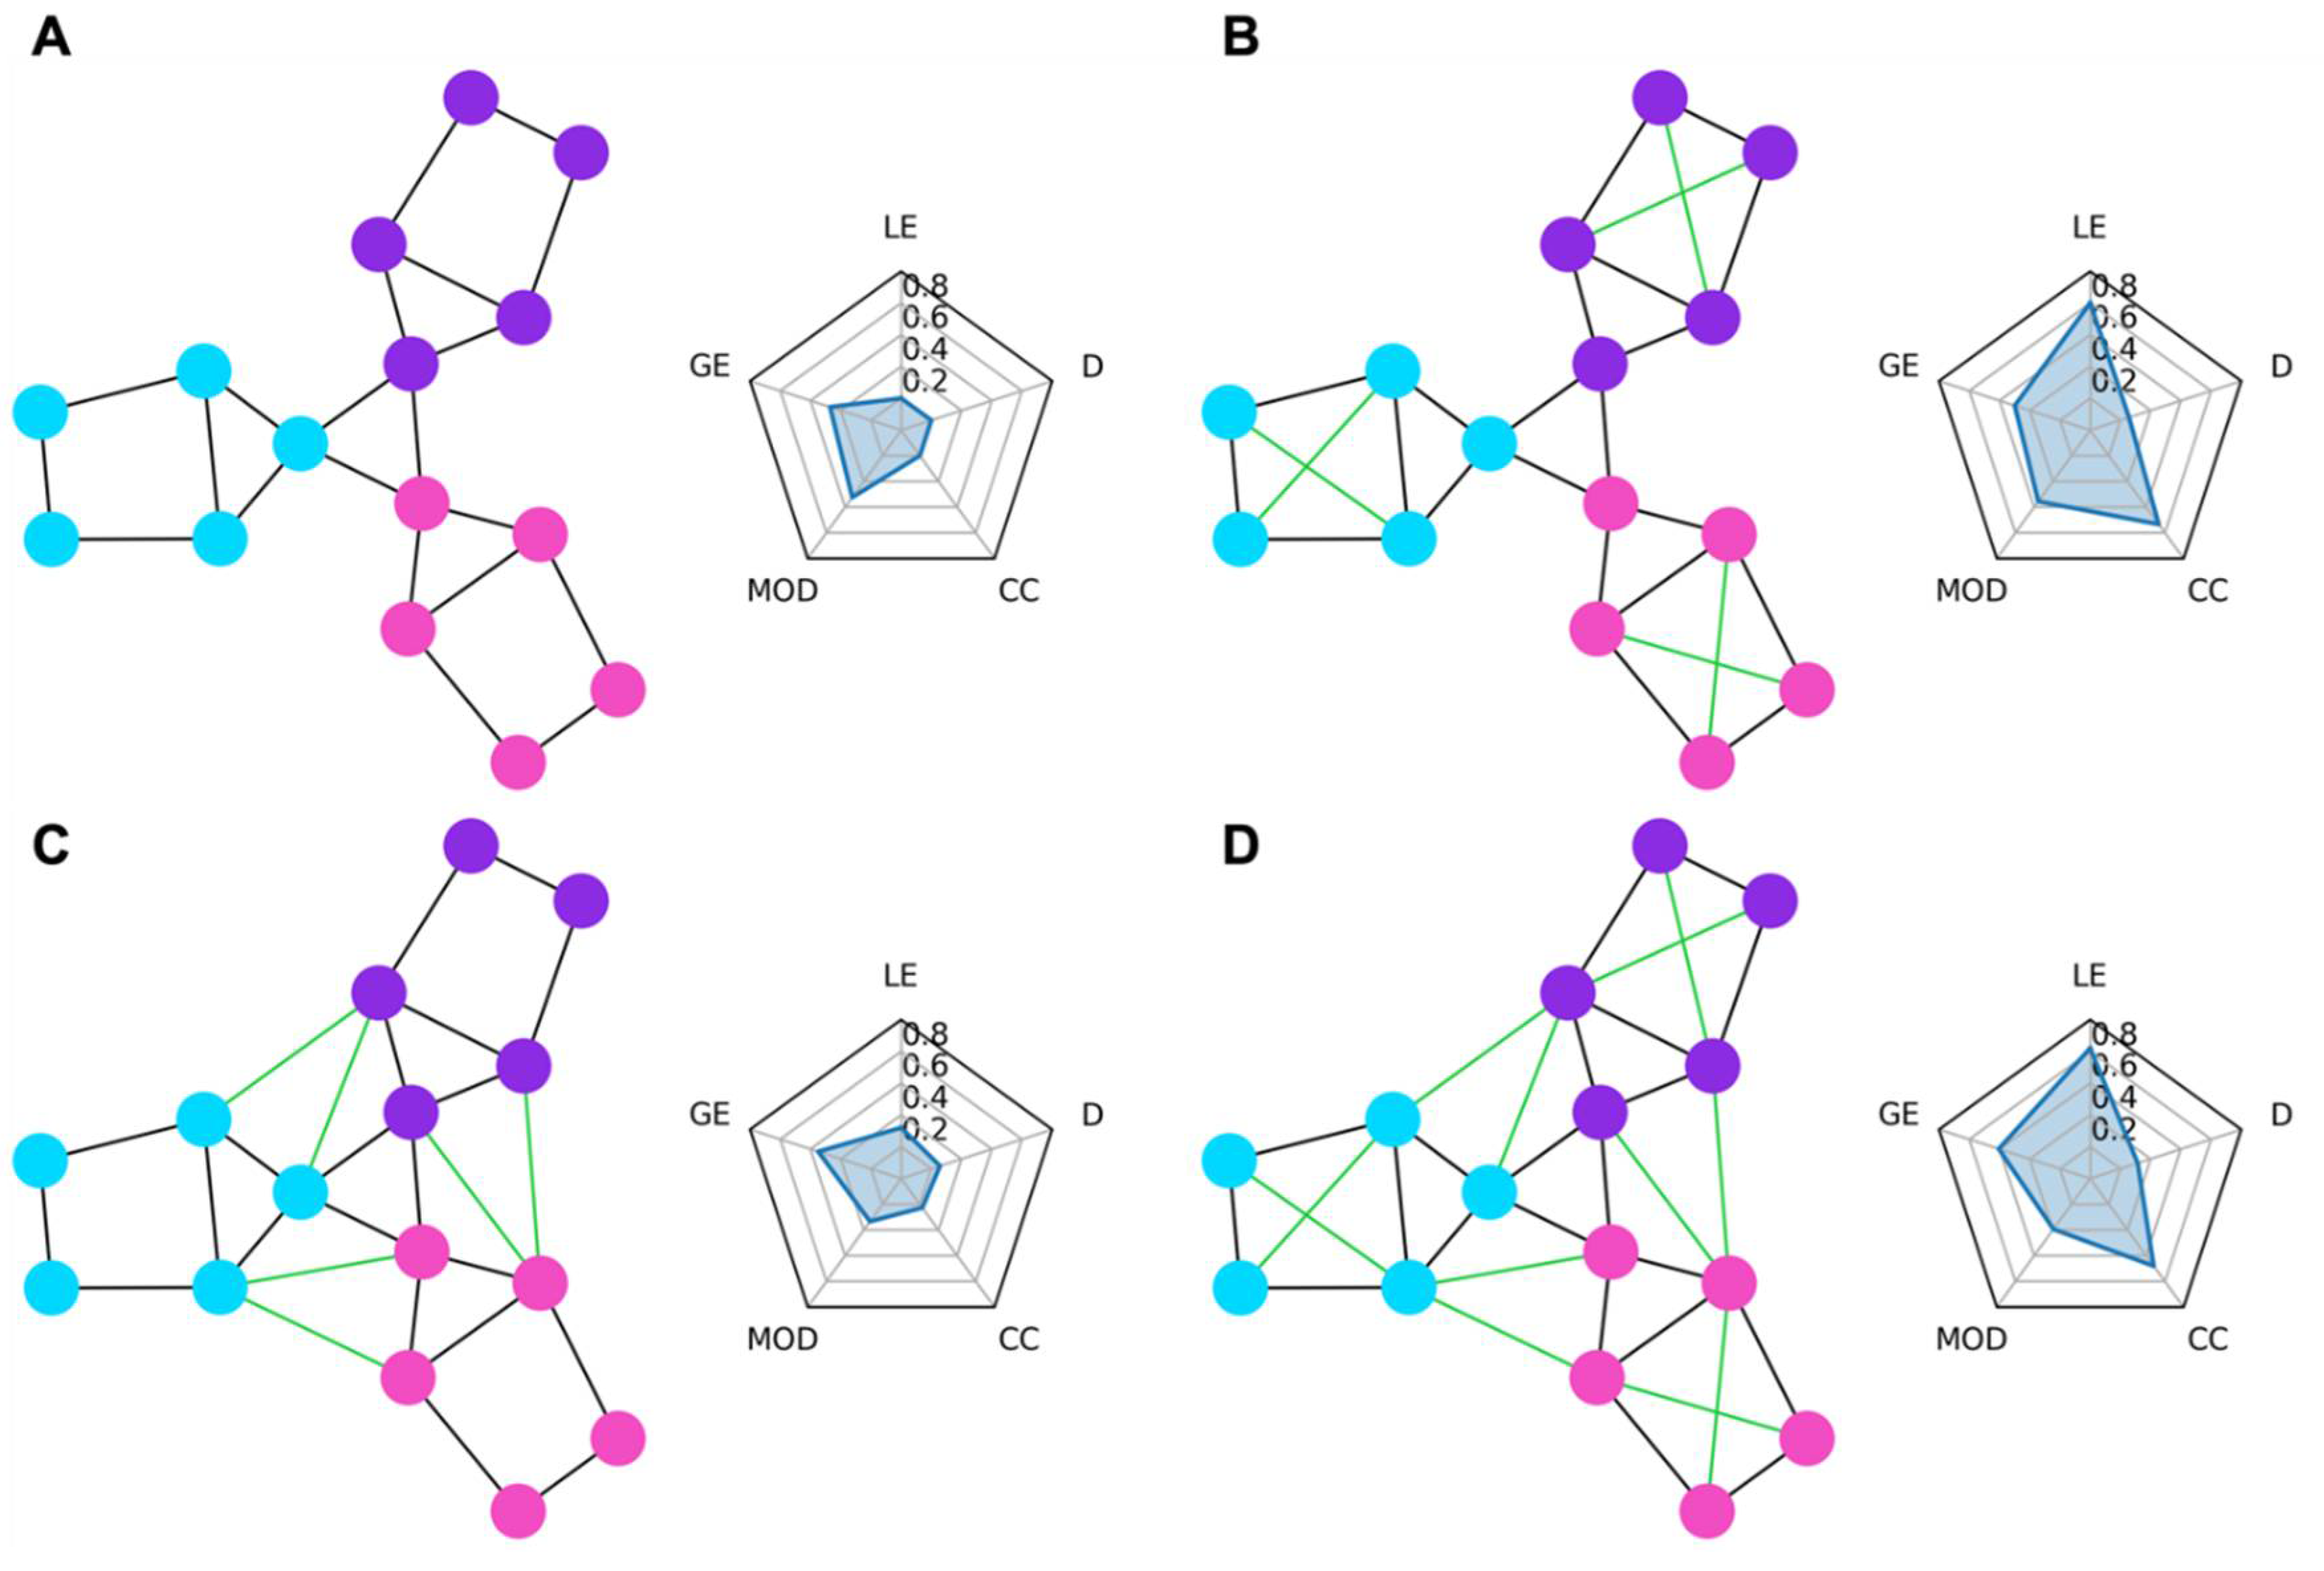
Figure 1. Example graph networks and corresponding graph theory measures shown in radar charts. The circles represent the nodes of the network while the lines represent the edges. Each node belongs to either the purple, blue, or pink module. The radar chart to the right of each network shows the graph theory measures of local efficiency (LE), global efficiency (GE), modularity (MOD), clustering coefficient (CC), and density (D) for that network. (A) shows a simple network with three distinct modules. (B) shows the network from A but with added connections (green edges) within each module. These within-module connections greatly increase the local efficiency (local fault tolerance) and clustering coefficient and slightly increase the modularity and global efficiency. (C) shows the network from A but with added connections between modules which decrease modularity but provide a small increase to local efficiency. (D) shows the network from A but with both the within module connections from B and between module connections from B added. Compared to B the modularity is decreased due to the between module connections, while compared to C the local efficiency, global efficiency, and clustering coefficient are all increased due to the added within module connections.
Preprints 106127 g001
Figure 2. Changes in cognitive functioning in brain tumor patients after surgical tumor resection (blue). Quality of Life improved post-surgery (p<0.05), as did Dexterity, and Memory scores (p<0.005). However, these changes were not significantly different than those in the control group of healthy patients that did not have surgery (light gray square). Therefore, the improvements in Dexterity and Memory are potentially the result of practice increasing both the control and patient scores rather than surgery which would only increase the patient scores. All other cognitive domain scores did not statistically change from baseline in either the tumor or control cohort. We also looked at the changes in cognitive scores for the glioma patients (dark gray circle) and found that infiltrative tumor patients follow a pattern similar to those of the whole patient cohort.
Preprints 106127 g002
Figure 3. Correlation between changes in connectivity measures. Increases in functional clustering coefficient (FCC) were highly correlated with decreases in functional global efficiency (FGE). Due to the high correlation (pearson r > 0.8) between changes in FCC and changes in FGE, we excluded changes in FCC from the multiple linear regression model predicting changes in cognitive scores. All other variables had low enough correlation between themselves to be included in the regression model and analysis. (FGE=Functional Global Efficiency; FCC=Functional Clustering Coefficient; FLE=Functional Local Efficiency; FM=Functional Modularity; SGE=Structural Global Efficiency; SCC=Structural Clustering Coefficient; SLE=Structural Local Efficiency; SM=Structural Modularity).
Preprints 106127 g003
Figure 4. Relationship between changes in neurocognitive functioning and changes in brain connectivity. This figure shows the normalized regression estimates and 95% confidence intervals of the multiple linear regression model predicting changes in the composite cognitive score (which is the average of all the tested cognitive domains). Coefficient estimates greater than zero are associated with increases in the composite neurocognitive scores. Likewise, coefficients less than zero are associated with decreases in composite neurocognitive scores. Changes in functional local efficiency and functional modularity demonstrated greater correlation to changes in neurocognitive measures than all other variables. Changes in structural connectivity were less correlated to the neurocognitive scores than the functional connectivity metrics. Age and sex were included as potential variables of interest but did not pass the test for multiple comparisons. Coefficient estimates are sorted by p value, with the diamond reflecting the estimated coefficient and the lines describing the 95% confidence interval. The markers with the dark gray circles show the estimated regression coefficients for an identical model fitted to only the subset of patients with gliomas. The estimated coefficients for the gliomas are similar to those of the full model, demonstrating the applicability of these results to glioma patients. Asterisks are only displayed for coefficients that passed the corrected p-value for multiple comparisons (*** p < 0.001).
Preprints 106127 g004
Figure 5. Normalized regression coefficients for multiple linear regression models describing the relationship between changes in connectivity and changes in cognitive scores for each domain including quality of life (QOL). The regression coefficients for each of the neuropsychological domains roughly follows the coefficients for the composite score model. The similarity between the coefficients for the individual domains and the composite model could indicate that the connectivity measures are detecting large scale brain changes that affect all of a patient’s cognitive abilities similarly. Of note, QOL was not included in the composite model, but the relationship between QOL and connectivity variables mirrors that of the composite model.
Preprints 106127 g005
Figure 6. Simple linear regression results between composite score and top predictor variables. Even in the absence of a multiple linear regression model, changes in mean functional local efficiency (A) demonstrate a strong inverse correlation (Pearson r = -0.77, p < 0.001) to changes in composite scores. Changes in functional modularity (B) do not show a significant correlation to changes in composite score even though the relationship between these two variables was highly significant in the multiple regression model. Changes in modularity do show a slightly positive correlation with the residuals from the mean functional local efficiency model (C), though this relationship did not reach statistical significance (Pearson r = 0.38, p = 0.086). This indicates that the changes in modularity trend towards being predictive after accounting for changes in functional local efficiency and are only highly predictive after accounting for the other predictor variables in the main model.
Preprints 106127 g006
Table 1. List of neuropsychological and QOL assessments for clinical evaluation. The composite score is calculated from the average of the normalized composite scores for each domain.
Domain Neuropsychological Assessment
Basic Attention NAB Digits Forward [16]
NAB Orientation [16]
WMS-III Spatial Span Forward [17]
Dexterity Grooved Pegboard [18]
Executive HRB Trails B [18]
Stroop Inference [19]
NAB Digits Backward [16]
WMS-III Spatial Span Backward [17]
Language Controlled Oral Word Association [18]
Boston Naming Test [18]
Memory Auditory Verbal Learning Test [18]
Rey Complex Figure Test [18]
Speeded processing HRB Trails A [18]
Stroop Color and Word [19]
Quality of life (QOL) MDASI-BT [13]
FACT-Br [14]
FrSBe [15]
Table 2. Subject Demographics.
Patients
(n=37)
Controls
(n=7)
Age (years)
Mean (±SD) 50.1 (±11.8) 32.8 (±3.8)
Range 26 – 71 27 – 37
Handedness
R (%) 33 (89%) 6 (100%)
L (%) 4 (11%) 0 (0%)
Education (years)
Mean (±SD) 13.8 (±2.3) 19.2 (±1.8)
Range 11 – 18 16 – 21
Sex
M (%) 24 (65%) 3 (50%)
F (%) 13 (35%) 3 (50%)
Table 3. Patients’ tumor characteristics.
Count (%)
Classification
  LGG 5 (14%)
  HGG 14 (38%)
  Met 11 (30%)
  Meningioma 4 (11%)
  Cavernoma 3 (8%)
Hemisphere
  R 18 (49%)
  L 19 (51%)
Location
  Frontal 10 (27%)
  Frontoparietal 1 (3%)
  Occipital 4 (11%)
  Parietal 9 (24%)
  Temporal 11 (30%)
Frontal/Cingulate 1 (3%)
  Insula 1 (3%)
Table 4. - Number of patients that completed MRI scanning and neuropsychological evaluation. While nearly all the 38 enrolled patients completed MRI scanning both preoperatively and postoperatively, many patients did not complete the neuropsychological and quality of life (QOL) exams.
Preop Postop Both
MRI 37 34 34
Neuropsych 31 30 30
Complete Neuropsych 24 24 22
Complete Neuropsych + QOL 20 19 17
Complete MRI + Neuropsych 22 23 21
Complete MRI + Neuropsych + QOL 19 18 16
Table 5. Clinical deficits. Pre-existing deficits were noted at the preoperative visit and the effect of surgery on those deficits at the 2-week postoperative visit are noted as well as new deficits.
Pre-existing
(% of all patients)
Resolved Improved No change Worsened Unknown New Deficits
Motor 4 (11%) 2 0 1 1 0 2
Language 5 (14%) 2 0 3 0 0 3
Sensory 3 (8%) 0 0 3 0 0 2
Cognitive 5 (14%) 0 2 3 0 0 1
Visual 5 (14%) 1 1 1 2 0 2
Disclaimer/Publisher’s Note: The statements, opinions and data contained in all publications are solely those of the individual author(s) and contributor(s) and not of MDPI and/or the editor(s). MDPI and/or the editor(s) disclaim responsibility for any injury to people or property resulting from any ideas, methods, instructions or products referred to in the content.
Copyright: This open access article is published under a Creative Commons CC BY 4.0 license, which permit the free download, distribution, and reuse, provided that the author and preprint are cited in any reuse.
Prerpints.org logo

Preprints.org is a free preprint server supported by MDPI in Basel, Switzerland.

Subscribe

© 2024 MDPI (Basel, Switzerland) unless otherwise stated