Preprint
Article

Feasibility Assessment of Wind Energy Study in Selected Districts of North Shewa Zone, Amhara, Ethiopia

Altmetrics

Downloads

77

Views

35

Comments

0

Submitted:

11 May 2024

Posted:

13 May 2024

You are already at the latest version

Alerts
Abstract
In this paper, the feasibility and potential assessment (PA) of wind power in six different areas MehalMeda, Eneware, DebreBerhan, AlemKetema, GundoMekel, and Majet are investigated. The data is collected from the National Metrological Agency (NMA) in Addis Ababa and from the districts of the case study areas and analyzed using MATLAB and HOMER software. Using the data collected at 10 meter height, wind direction using a wind rose, the wind frequency distribution, and wind turbine characteristics have been analyzed. Moreover, to obtain a more realistic wind potential study, the wind speed at a 10 meter height is extrapolated to a height of 50 meter in order to determine wind speed, wind power density, and wind energy density. The average wind speed of the zone at 10m and 50m heights are 1.58 m/s and 1.99 m/s, 3.06 m/s and 3.85 m/s, 4.75 m/s and 5.98 m/s, 2.29 m/s and 2.88 m/s, 1.01 m/s and 1.27 m/s and 4.07 and 5.12m/s at Alemketema, Debreberhan, Eneware, Gundemeskel, Majete and Mehalmeda respectively. The extrapolated result shows that the maximum wind speed and power densities at a height of 50 meter for Eneware, MehalMeda and Debre Berhan are 10.4 m/s, 689 W/m2, 8.9m/s, 429 W/m2 and 6.3m/s, 152.2 W/m2 respectively. The energy densities at a height of 50 meter for AlemKetema, DebreBerhan, Eneware, GundoMekel, Majete, and MehalMeda are 181.06 kWh/m2*yr , 1332.83 kWh/ m2*yr, 6078.91 kWh/ m2*yr, 857.76 kWh/ m2*yr, 58.78 kWh/ m2*yr, and 3939.42 kWh/ m2*yr respectively. As per the international standard for wind power and wind speed classification, considering the extrapolated height, Eneware, MehalMeda, and DebreBerhan have feasible wind potential for both small-scale and large-scale wind farm implementation, whereas Majete, AlemKetema, and GundoMeskel of the North Shewa Zone in the Amhara region have poor wind potential.
Keywords: 
Subject: Engineering  -   Electrical and Electronic Engineering

1. Introduction

With a population of over 100 million, Ethiopia is the second-most populous country in sub-Saharan Africa. More than 80% of the population of Ethiopia lives in rural areas with low electrification rate, and a study shows that traditionally more than 90% of the households of the country use biomass as their primary fuel [1,2]. The problem is even worse in the North Shewa Zone of Amhara, Ethiopia. The country has an estimated exploitable wind potential of 10 GW [3]. Although there is exploitable wind potential that is expected to be found in some of the case study areas, there has been no proper wind feasibility and potential assessment (PA). To address this, a proper feasibility and PA study is necessary for the Zone, which is helpful to attract the interested stakeholders and investors to involve themselves in implementing an off-grid or on-grid system in the area to solve the problem of lack of access to electricity. The main goal of this study is to assess wind energy potential of the North Shewa Zone.

1.1. Motivation

Ethiopia has an enormous amount of renewable energy potential, such as wind energy. However, these ample energy sources are largely unexploited and not properly assessed. On the other hand, the settlement of the population on hilly sites in the case study areas is a good opportunity for wind energy supply. These few problems and opportunities mentioned above motivated the researchers to conduct this study. If the PA feasibility is undergone for implementation, the study is useful to enhance the future power enhancement of the country and reduce the carbonization or greenhouse gas (GHG) effect of future electricity.

1.2. Literature Review

Wind energy is emerging as one of the most viable alternatives to meet the challenge of increasing energy demand, particularly for electrical energy generation. It is clean, fuel free, and available almost in every country in the world and in abundance in off-shore. Wind energy is applicable for both power generation & water pumping applications for rural societies and to model the wind data researchers used different statistical methods and software for selecting wind turbine class, for forecasting site wind energy & power density, for developing site wind resource map, for preliminary wind turbine micro siting and for estimating farm annual energy production (AEP) [4].
Currently Ethiopian Electric Power (EEP) is authorized for power generation in the country, and from the preliminary survey assessment, the country has a 45000 MW exploitable potential from hydropower, which is currently the country's primary source of electricity, while wind and geothermal energy have exploitable potentials of 10000 MW and 5000 MW, respectively. Besides this, the country has an estimated 5.26 kWh/m2 solar potential [5].The country currently has total generation capacity of 4250 MW. From this, the share of wind power generation is 8%, and the remaining 2% is shared by geothermal and diesel power plants.
If ongoing projects such as the renaissance dam which is the country's largest hydropower plant, geothermal and wind projects are completed within the next two to three years, the country's total capacity will reach 10,000 MW [6]. As the country’s main energy generation source is hydropower and the amount of rainfall decreases from November to May each year, the generation will be reduced step by step. A good complementary alternate solution for this is wind power. Based on the previous completed wind power project experiences such as 51 MW of Adama I, 120 MW of Ashegoda, and 153 MW of Adama II wind farms, EEP has currently completed the feasibility study of the Ayisha I and Ayisha II wind projects in the Somali region, with each having a potential capacity of 120 MW. Currently, construction is under way [3].
Wind energy potential assessment had been investigated in four Ethiopian areas, such as Addis Ababa, Nazret, Mekele, and Debrezeit, by compiling data from different sources and analysing it using a software tool. The results relating to wind energy potential are given in terms of the monthly average wind speed, wind speed probability density function (PDF), wind speed cumulative density function (CDF), and wind speed duration curve (DC). According to the results, for three of the four locations, the wind energy potential is reasonable [7].
Though non-government organizations (NGO) installed micro-wind turbines in some selected districts of North Shewa for a few farmers for lighting purposes, there is no published paper on the potential assessment of wind in this area. One of the previous studies in the Amhara region is presented in [6]. Although the installed capacity of wind has recently increased and it is now second in rank to hydroelectric power, there are a few factors such as icing, extreme wind speed, permafrost, sea ice, and others that are affecting globally the coverage of wind generation. However, the authors of [8] concluded that these factors do not jeopardize the exploitation of wind resources in northern Europe. Wind power installation capacity for selected countries was studied in [9], and Germany, Spain, the United States, India, Denmark, and China were the highest the world's leading wind energy producers from 1997 to 2006. Chinese has been the leading market with installed capacity of 21.2 GW since 2008 and according to the 2018 global wind report world wind total installation capacity both onshore and offshore reaches 591 GW [10]. Recently, there have been various methods for determining the potential of wind resources, such as wind resource mapping, trees and vegetation as biological indicators of wind potential, advanced numerical weather prediction models, techno-environmental and economic feasibility analysis, the weibull function to model the wind behaviour using actual meteorological data using these methods different countries can easily identify the wind resource potential in a particular area and moreover uses these methods to study the effect of different weather data on the generated annual electricity production (AEP) and helps in wind forecasting which used to reduce the problems in the grid were discussed in [11,12,13,14,15,16,17,18]. Moreover, according to the special report of the Inter-governmental Panel on Climate Change (IPCC), studying on renewable energy such as wind has a great role for climate change mitigation to reduce the amount of greenhouse gases due to the release of carbon, as was discussed in [19,20].
As solar energy is one of the creators of wind resources, the authors of [21] previously studied potential assessment of solar resources in the case study areas. In wind potential assessment, studying the mathematical expression for the Weibull probability density function, wind power density in W/m2 by extrapolating from different heights such as 10 m to 50 m etc. and studying wind speed frequency distribution analysis will make the assessment more reliable and discussed in [22,23,24,25,26,27,28]. One of the international laws forced to mitigate global warming, this will also be achieved by studying and implementing renewable energy resources such as wind according to the Paris Agreement to make carbon emissions zero by 2050. This will support achieving climate stabilization goals by 2050, which will support reducing GHG emissions and in reducing global temperature for sustainable development goals (SDG) and clean economic development and to mitigate approximately million tons of carbon dioxide and some countries, such as Nepal plans and motivates a 15% increase in national energy use from renewables with a reduction of 23% of CO2 emissions by 2030, were discussed in [29,30,31,32,33,34]. To achieve this goal, everybody across the globe should keep its footprint. The study here also on potential assessment in the case study area will aid in mitigating the carbon emissions as more than 80% of the population have no access to electricity and still rely on traditional biomass to cook food, which is another environmental pollution crisis against the carbon reduction policy of the world agreement.
Recently, wind power turbine technology is growing day by day, as some literature shows, it will be possible to generate wind power from low-rated wind speed regions by enhancing wind turbine technology. In [35], low-wind-speed regions are taken into account as a feasible option to generate electricity. In the study, the feasibility of a wind power plant in a low-rated wind speed region is investigated, and it is found out that it can also be feasible to install wind power plants in low-rated wind speed regions as the wind turbine technology enhances. In [36] using the statistical two-parameter weibull probability density function method, wind speed data retrieved from an indigenous oceanography company and the global information system (GIS) were analysed for wind energy harvest, and the coastal and offshore sites of wind power potential were compared. The findings from the study showed that the offshore sites have four times greater wind power potential than the coastal sites. Assessing and knowing wind potential has not only have the advantage of application in generation electric energy, in [37] the application of wind in appropriate type of double fed induction generator (DFIG) type wind turbine is investigated to control frequency and power system oscillation of a system in the grid.
As per studying in the literature review, studying and implementing wind potential assessments has great contribution for both reducing carbon emission and economic development. In this regard, the authors of this article are motivated to contribute to the world's zero carbon emission by 2050 by some amount and considered one of the study areas, which is the North Shewa Zone in the Amhara region of Ethiopia, as the best and most convenient site in such a way that 100-150 households settle in the same place in the rural area, and the other settlements are indigenous family groups with 10-15 households in the case study area, mostly living in hilly sites. This will make easier the installation if potential investors need to install wind turbines after a successful feasibility and potential assessment.
The remaining sections of the paper are arranged as, the materials and methodology including study area descriptions is discussed in Section 2. The results of the test studies and discussions are presented in Section 3. The concluding highlights of the paper are described in Section 4 and finally the scope of the research and future directions are described in Section 5.

1.3. Contributions

The following are the contribution of this work,
  • As there is no wind PA study in the zone has been addressed so far in the literature, this study aims to bridge this gap by assessing the wind resource potential of each district in the zone, thus increasing the scientific knowledge across the globe.
  • The resource assessment and analysis will be used for predicting and planning the future power alternative for the zone.

2. Materials and Methodology

The major tasks associated with the wind potential assessment of the North Shewa Zone are data collection, field visits, oral communication with local communities, and administrative tasks. The methodology data was collected from NMA and NASA at different locations of wind speed, wind direction, latitude, longitude, and the topography of the zone. As North Shewa Zone covers a wide area, only six districts, such as DebreBerhan, MehalMeda, Eneware, GundeMeskel, Majete, AlemKetema have metrology stations, and the study covered those areas only. MATLAB, hybrid optimization of multiple energy resources (HOMER), Wind Rose, and others are the most common software used for this study. The data used for this study was from 2000 G.C o 2019 G.C, which is more than ten years from NMA. In data analysis and interpretation, the tasks done are wind energy evaluation, finding of the wind speed using the extrapolation method, determination of wind power density, and energy density at two heights (10 m and 50 m) have been analysed. In Ethiopia, data were available in all metrology centers only at heights of 2m and 10m, but for practical purposes, these heights are not enough for sufficient real wind power generation. In this regard, the extrapolation method has been considered for this study.

2.1. Data Collection

Data collected for the six districts selected for this article was mainly from the NMA Center and NASA. The six locations investigated in this study are DebreBerhan (9.633333, 39.5, 2750m), AlemKetema (10.033333, and 39.033333, 2280m), MehalMeda (10.3146, 39.66025, 3084 m), Eneware (9.83, 39.15, 2561 m), GundeMeskel (10.1833, 38.71667, 2480 m), and Majete (10.5, 39.85, 2000 m) with respect to latitude, longitude, and altitude. The daily and monthly data for the study has been collected from each metrological station from the years 2000 to 2019 at the height of 2m and 10m, at the time intervals of 6:00, 9:00, 12:00, 15:00, and 18:00 for the consecutive years. The missing data has been replaced by taking the average of the previous and preceding values.

2.2. Frequency Distribution of Wind Speed

f v = k c k c k 1 e x p v c k ( k > 0 , v > 0 , c > 0 )
The corresponding cumulative probability function of the Weibull distribution is given in [38].
    F   ( v ) = 1 e x p v c k
where F (v) is the probability of observing wind speed; v and k are the dimensionless Weibull shape parameter, c is the Weibull scale parameter with a unit equal to the wind speed unit and F (v) is the cumulative probability function.
k = σ v 1.086
c =   v m 1.253
where vm is the mean value and σ is the standard deviation
v m = 1 n i = 1 n v i 3 1 3  
σ = i = 1 n ( v i v m ) 2 n

2.3. Wind Speed Variation with Height

Wind speed varies with height as a function of different factors such as topographic features, surface roughness, atmospheric stability, etc,. The extrapolation calculation method has been used for this study to extrapolate the data collected from the NMA at 10 m to 50m and to determine the wind speed and power density of different locations in the North Shewa Zone, which is shown in Figure 1.
v 2 = v 1 h 2 h 1 α
where, at h1 meter, the actual wind speed recorded is v1 m/s. And at height h2 meter, the wind speed required is v2 m/s. The ‘α’ depends on the surface roughness and atmospheric stability and its value lies in the range from 0.05–0.5. In this paper, 0.14 as the value of α is considered.

2.4. Wind Power and Energy Density Function

The power of wind depending on the speed of wind and the sweep area of the blade (A m2).
P w = ρ A V 3 2
P A = P ( w ) A = ρ V 3 2
where ρ kg/ m 3 is the mean air density and it value depending on different factors such as altitude [39], it’s the value varies depending on the site altitude. In general, the zone altitude varies from 900m to 4000 m, as shown in Figure 1. The estimated air densities of the locations are: Alemketema, Gundemeskel, and Majete have 1.007 kg/m3, and Debre Berhan, Eneware, and Mehalmeda have 0.9093 kg/m3.

Wind Energy Density Function Can be Calculated

E = P w T = ρ A V 3 2 T
E A = P A T
where T is the time of the year, E energy Wh and E A is energy per area.

2.5. Study Area Description

Figure 1 shows the map of the North Shewa Zone and meteorology station locations. Out of 23 districts in the North Shewa Zone the data is collected from the six meteorology centers, and online data is collected from NASA. This paper addresses a total of six districts in the city administrations in the North Shewa, such as DebreBerhan, MehalMeda, Eneware, GundeMeskel, Majete and AlemKetema. The total households counted in this zone are 429,423, it results an average of 4.28 people per household and 413,235 housing units [21].

3. Results and Discussions

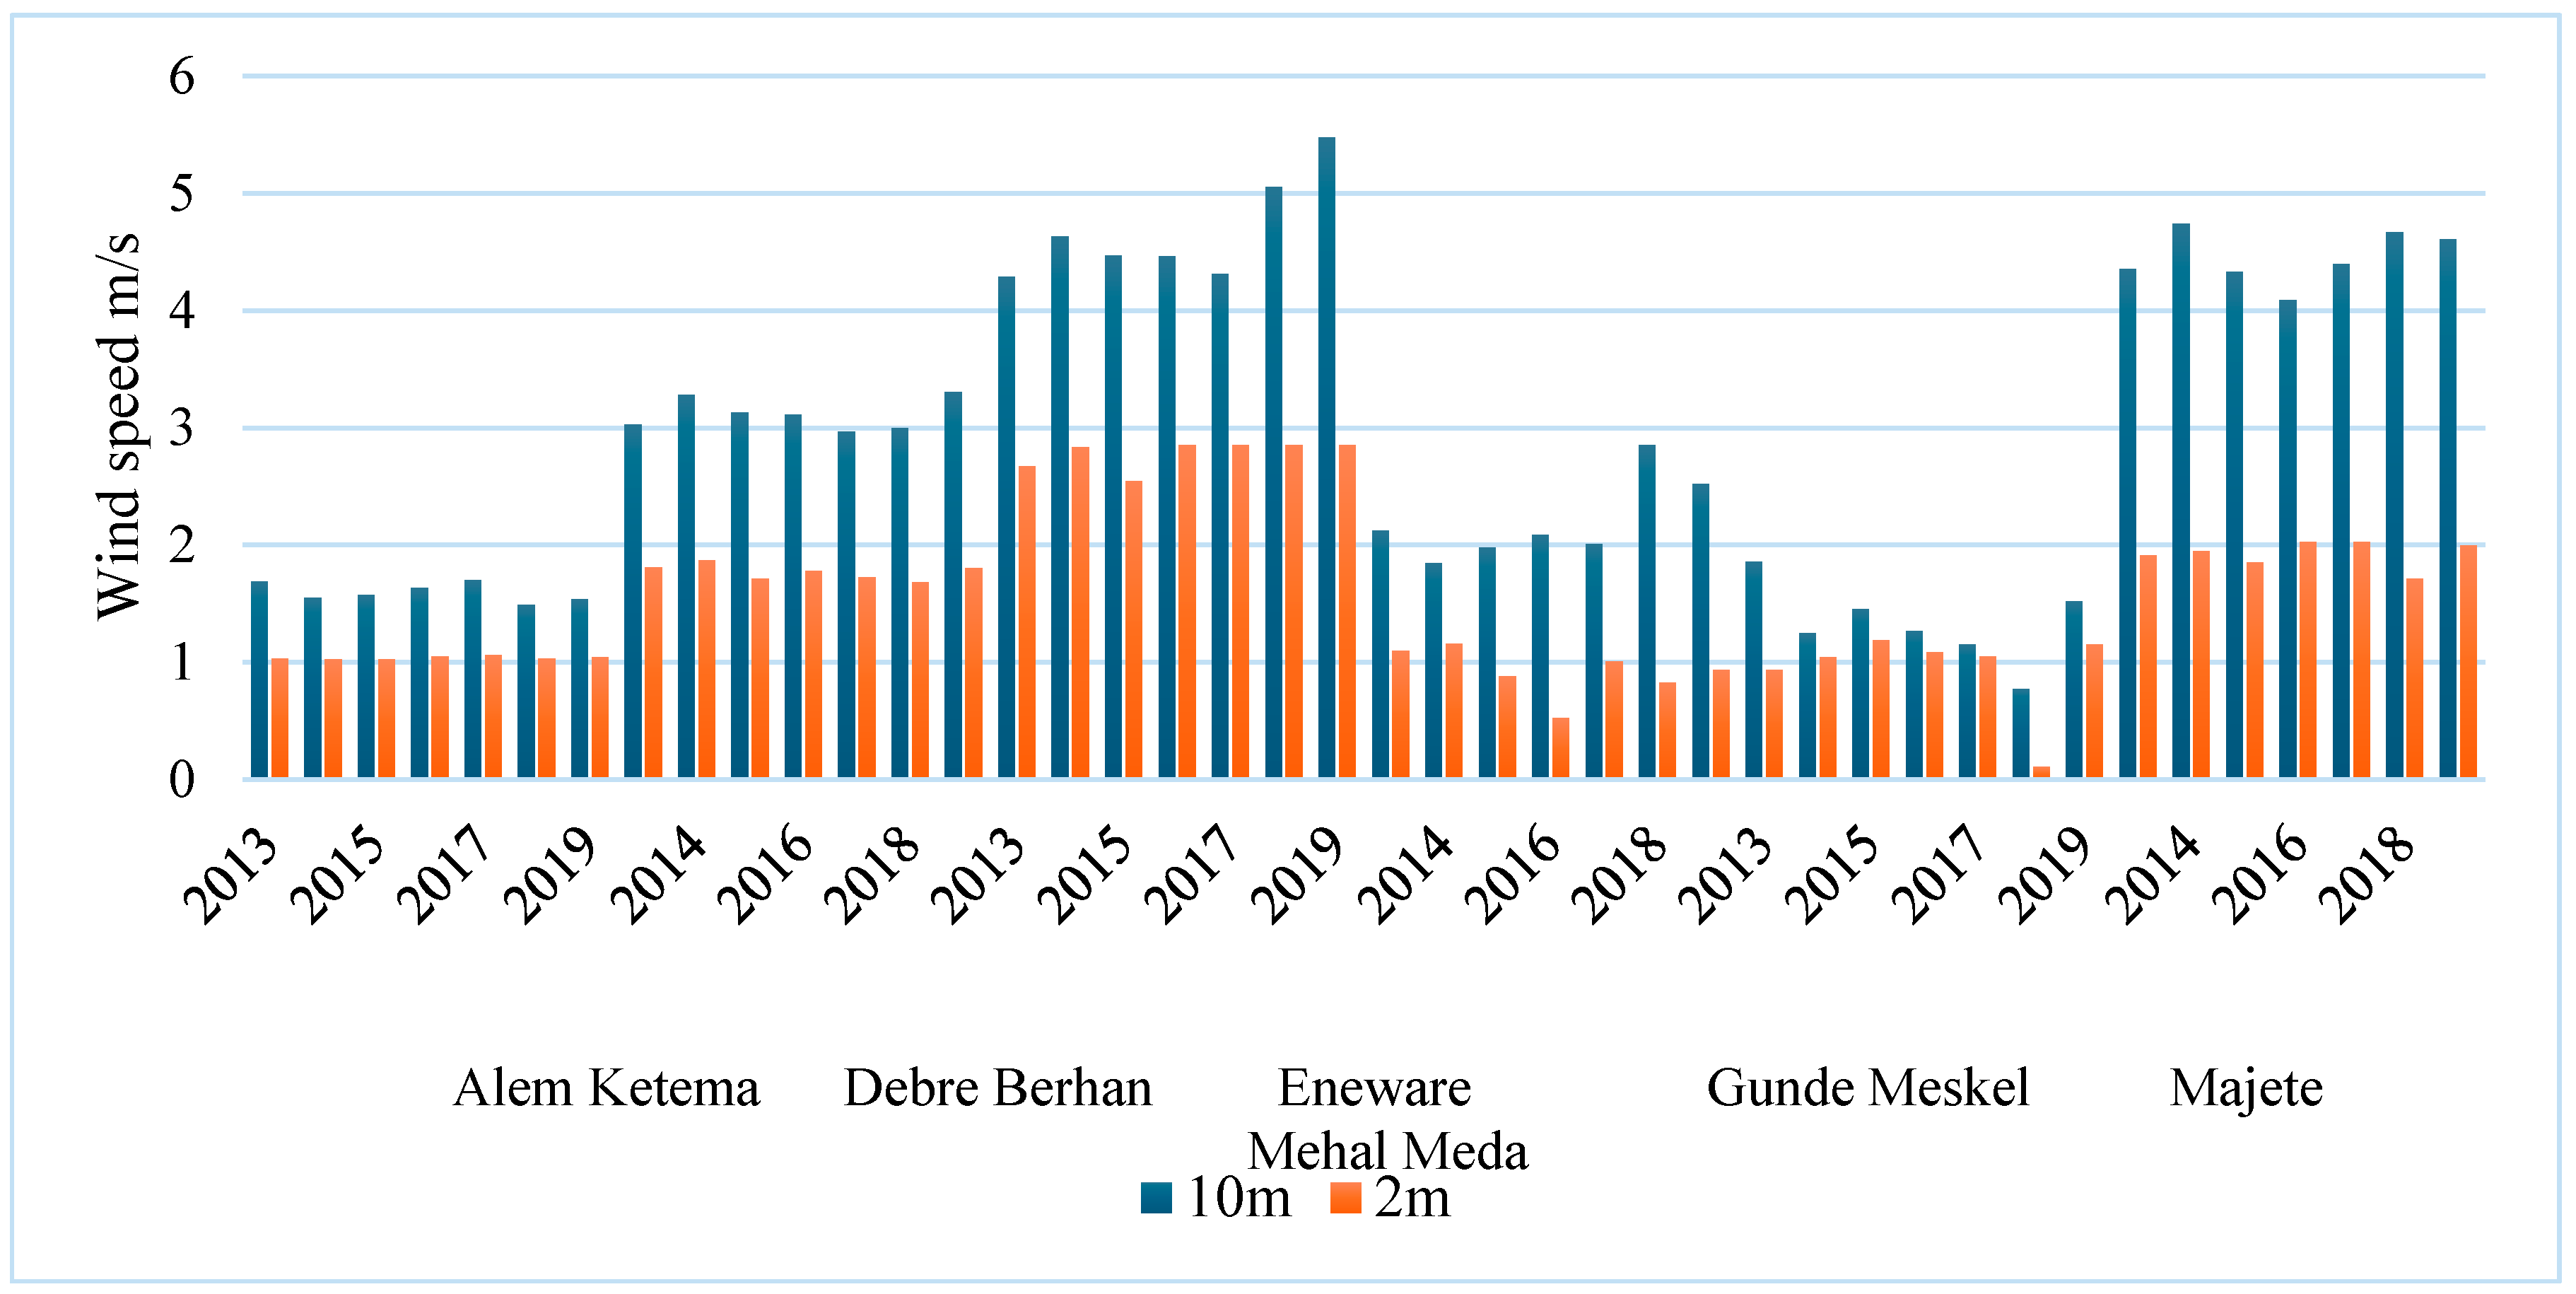
Figure 2 shows the mean wind speed of the North Shewa Zone from 2013–2019 for all the months at 2 meter and 10 meter heights. From the graph, it could be observed that the mean wind speed is maximum at Eneware, Mehal Meda, and Debre Berhan and the minimum mean wind speed in Majete, Gunde Meskel, and Alem Ketema at both 2 meter and 10 meter heights.
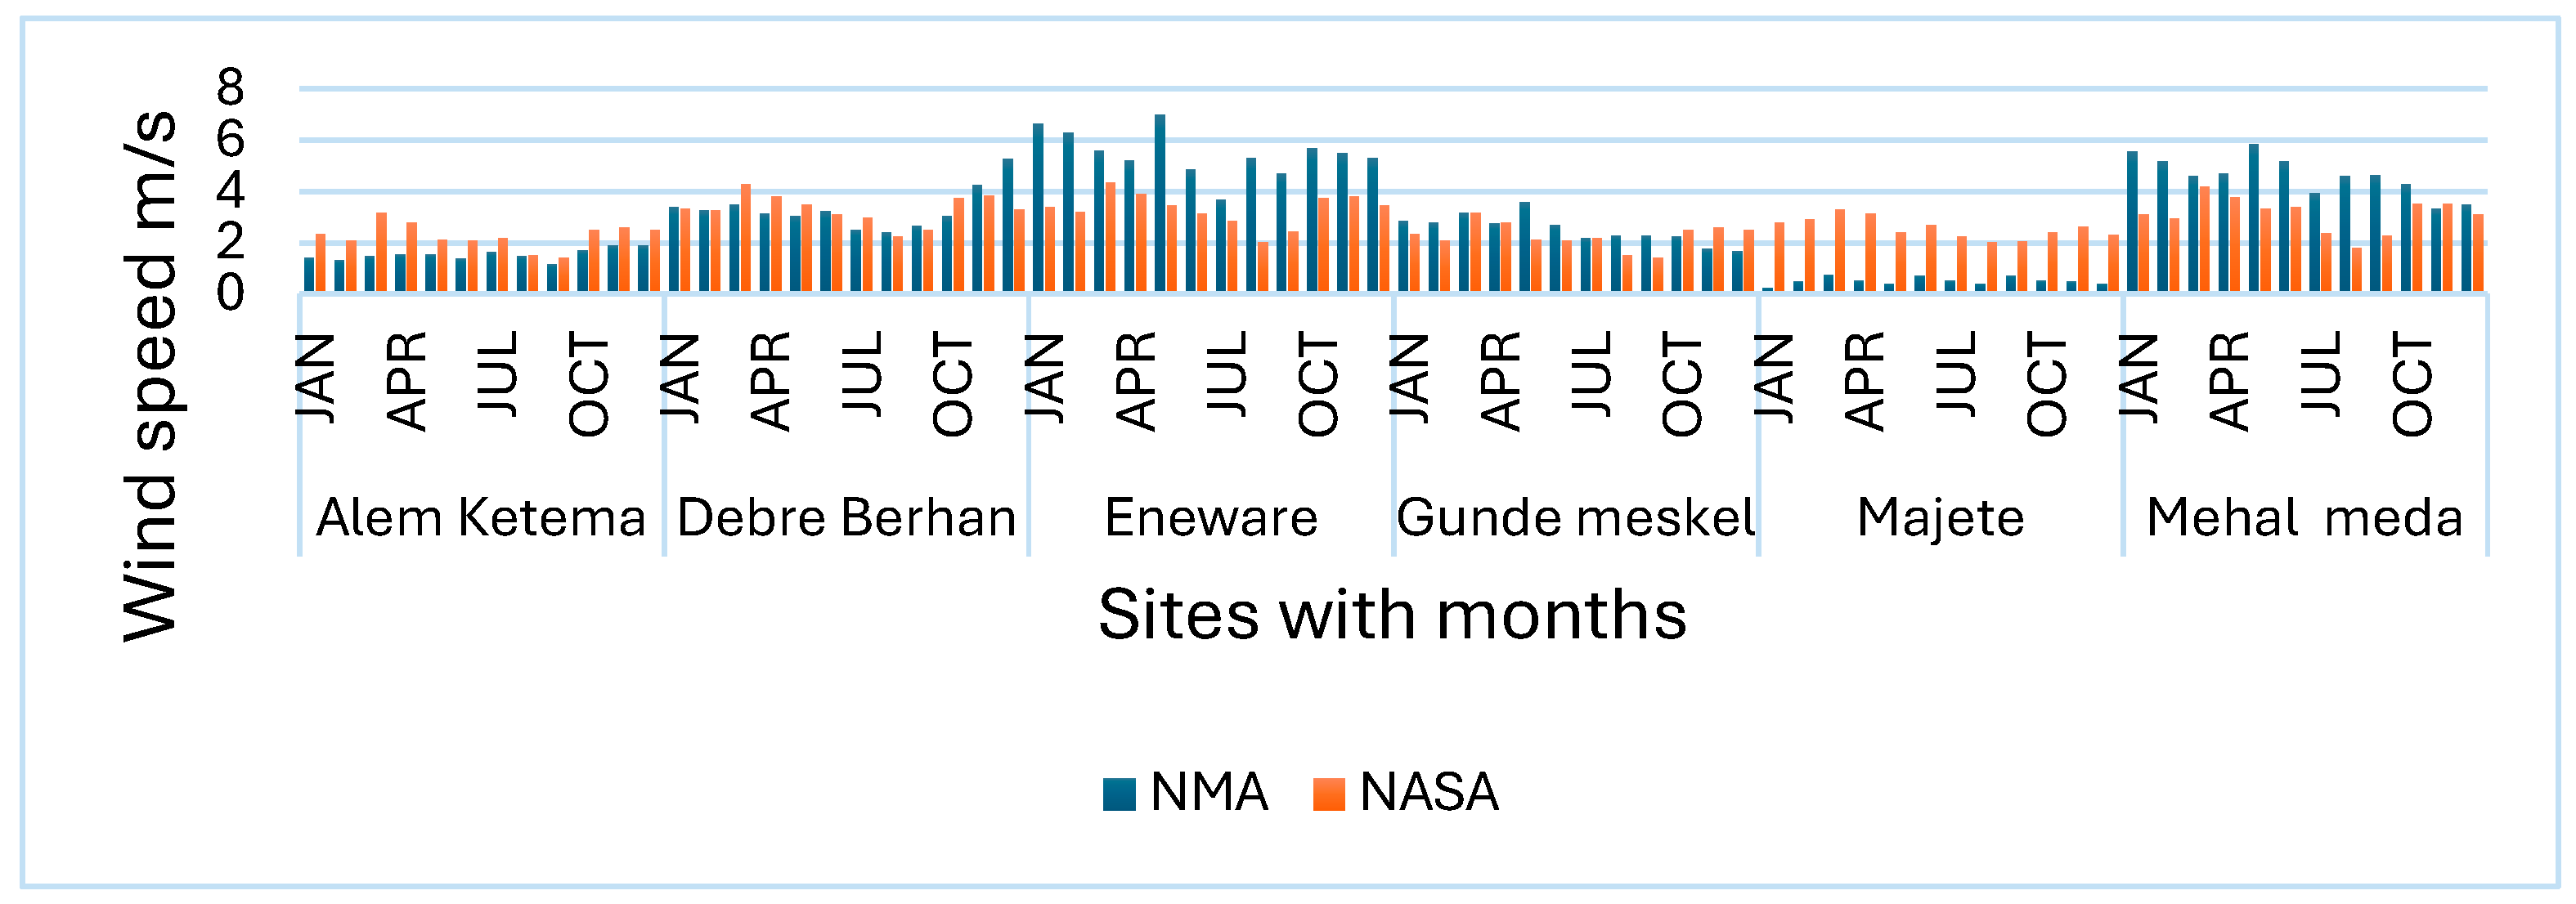
Figure 3 depicts the wind speed data assessment analysis comparison for the ob-tained data from NMA and NASA at a height of 10 meters. As shown in the figure, both NMA and NASA have the same results on which sites have the best wind speed at 10 m. Therefore, Debre Berhan, Eneware, and Mehal Meda have the best wind speeds, while others like Gunde Meskel, Majete, and Alem Ketema have low wind speeds at the same height. However, the two measured data have different results, which shows that this is due to different factors and that they have their own limitations. For the next phase, the paper recommended installing wind masts at selected sites.
Therefore, Figure 3 tells that the minimum mean wind speed was present in GundeMeskel with 0.75 m/s, and the maximum was present in Eneware with 6.98 m/s from NAM data. Similarly, the minimum mean wind speeds were 1.05 m/s at Majete and the maximum was present at 4.35 m/s in Eneware from NASA data.
Table 1 shows the NMA data assessment for five years, and from the monthly average wind speed result analysis, most sites in the zone have high wind speeds in the months of October, November, and December, and low wind speeds in the months of July, August, and September. In the zone Eneware, Mehal meda and Debreberhan have best wind speed as shown the table; and the remaining sites have moderate wind speed available at 10 m height.

3.1. Wind Rose Analysis of Selected Sites

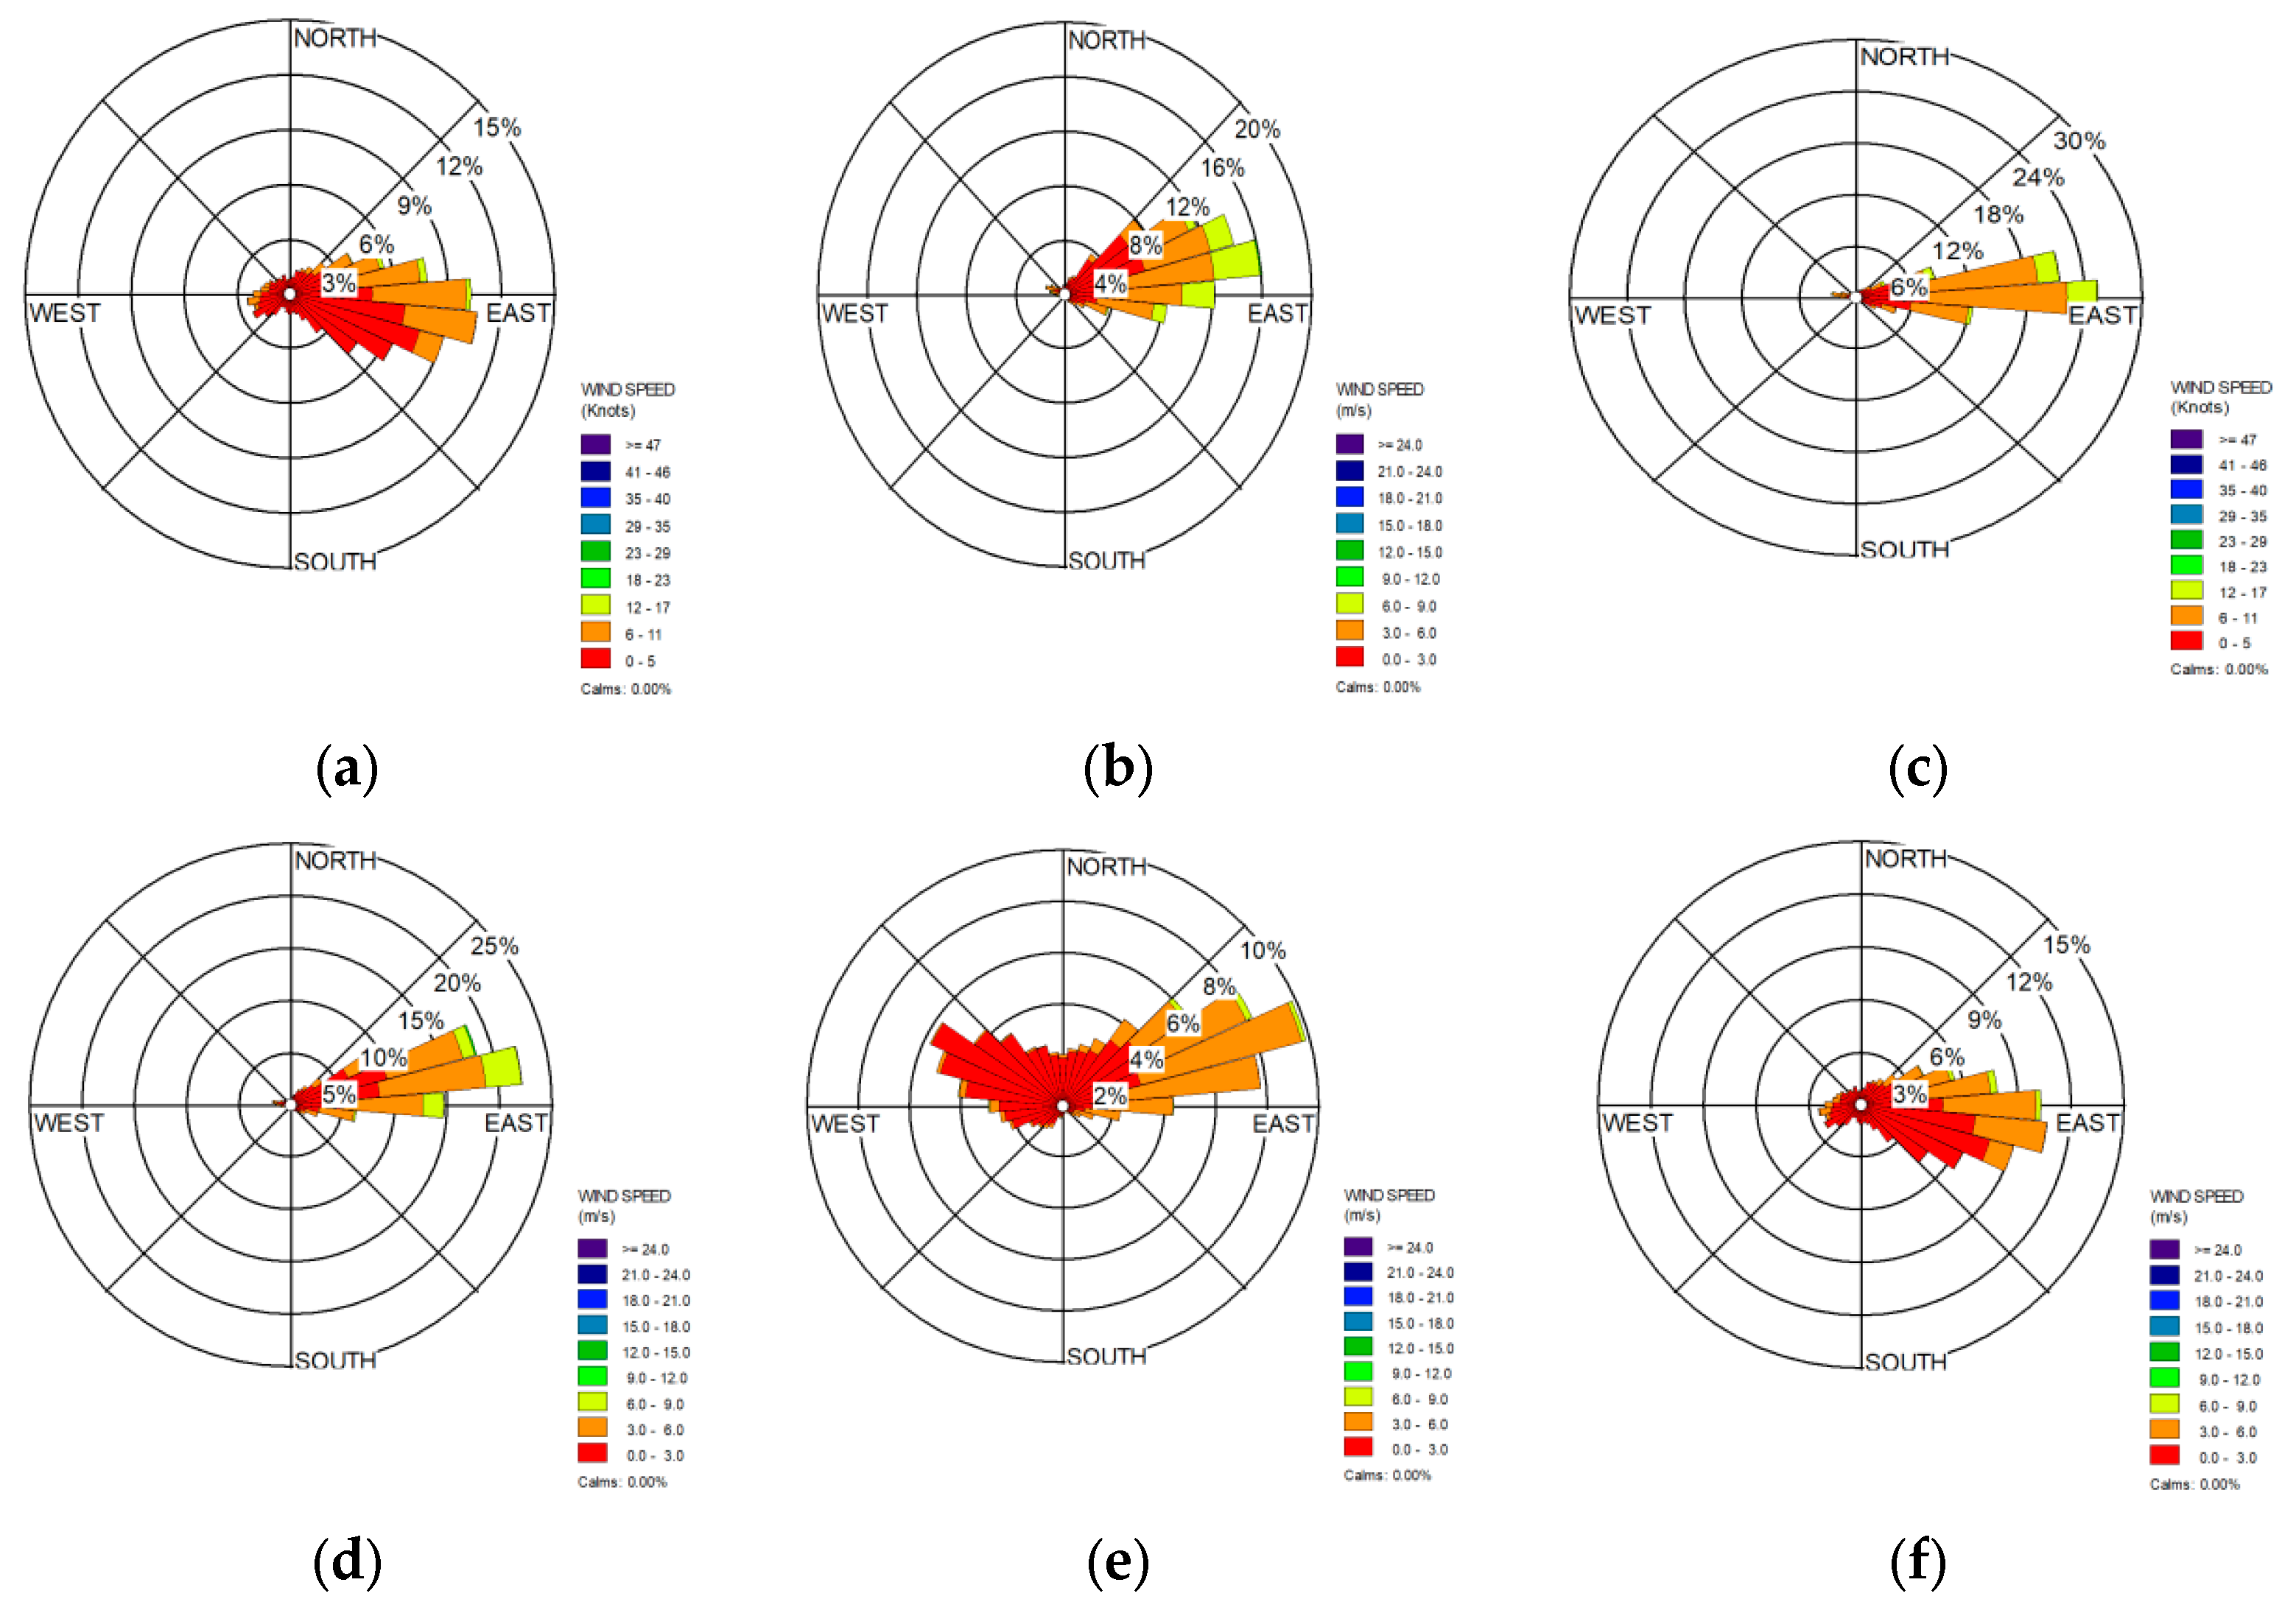
In determining the maximum output of wind power, analysing wind direction using a wind rose plays an integral role. Figure 4 depicts the average annual wind rose diagrams of AlemKetema, DebreBerhan, Eneware, GundeMeskel, Majete and MehalMeda respectively.
The overall wind speed and wind directions are presented in Figure 4 in the form of a bin-sector and its distributions. After analysing Figure 4, it is clear that the wind direction was most dominant in the sector 95-105 degrees, with a frequency of 10.650% in AlemKetema, 75-85 degrees with a frequency of 15.9589% in DebreBerhan, 85-95 degrees with a frequency of 25.3196% in Eneware, and 75-85 degrees with a frequency of 22.1804% in MehalMeda.
Where low wind speeds flowed in the sectors of 295–305 degrees at Majete and 105–115 degrees at GundeMeskel at 10 m height. A study of wind direction showed that the majority of the wind was flowing from east to west in most sites.
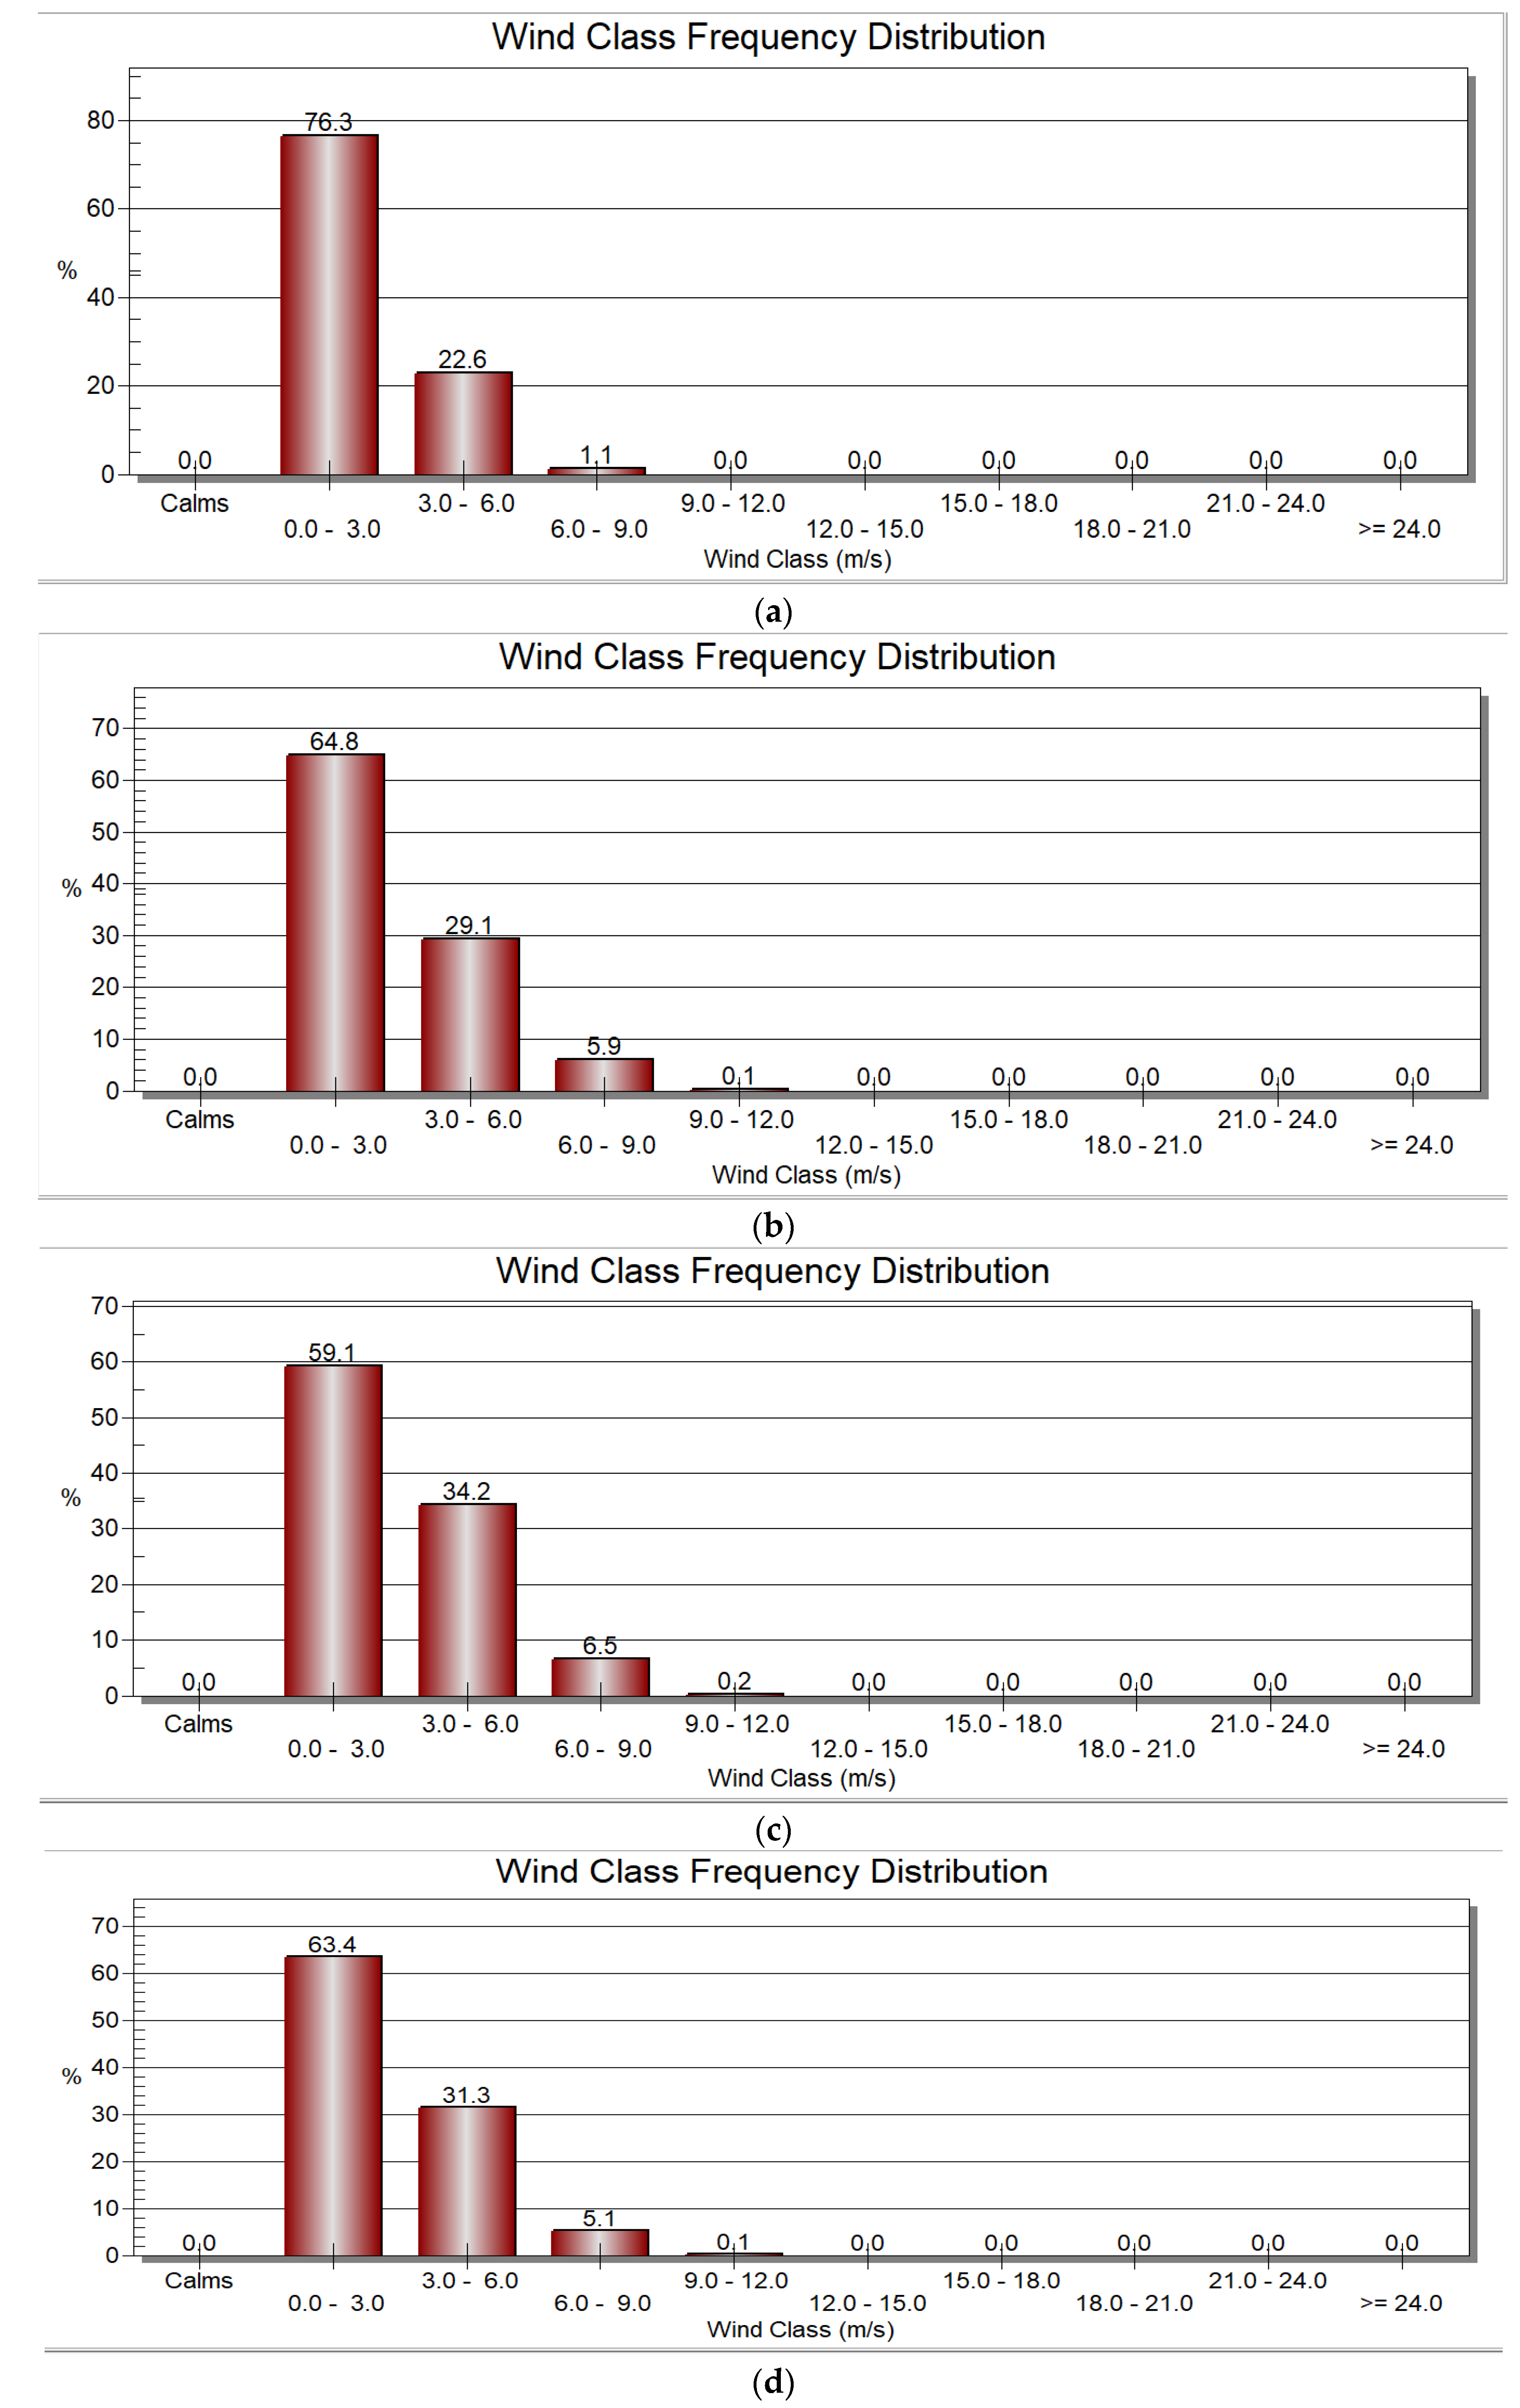
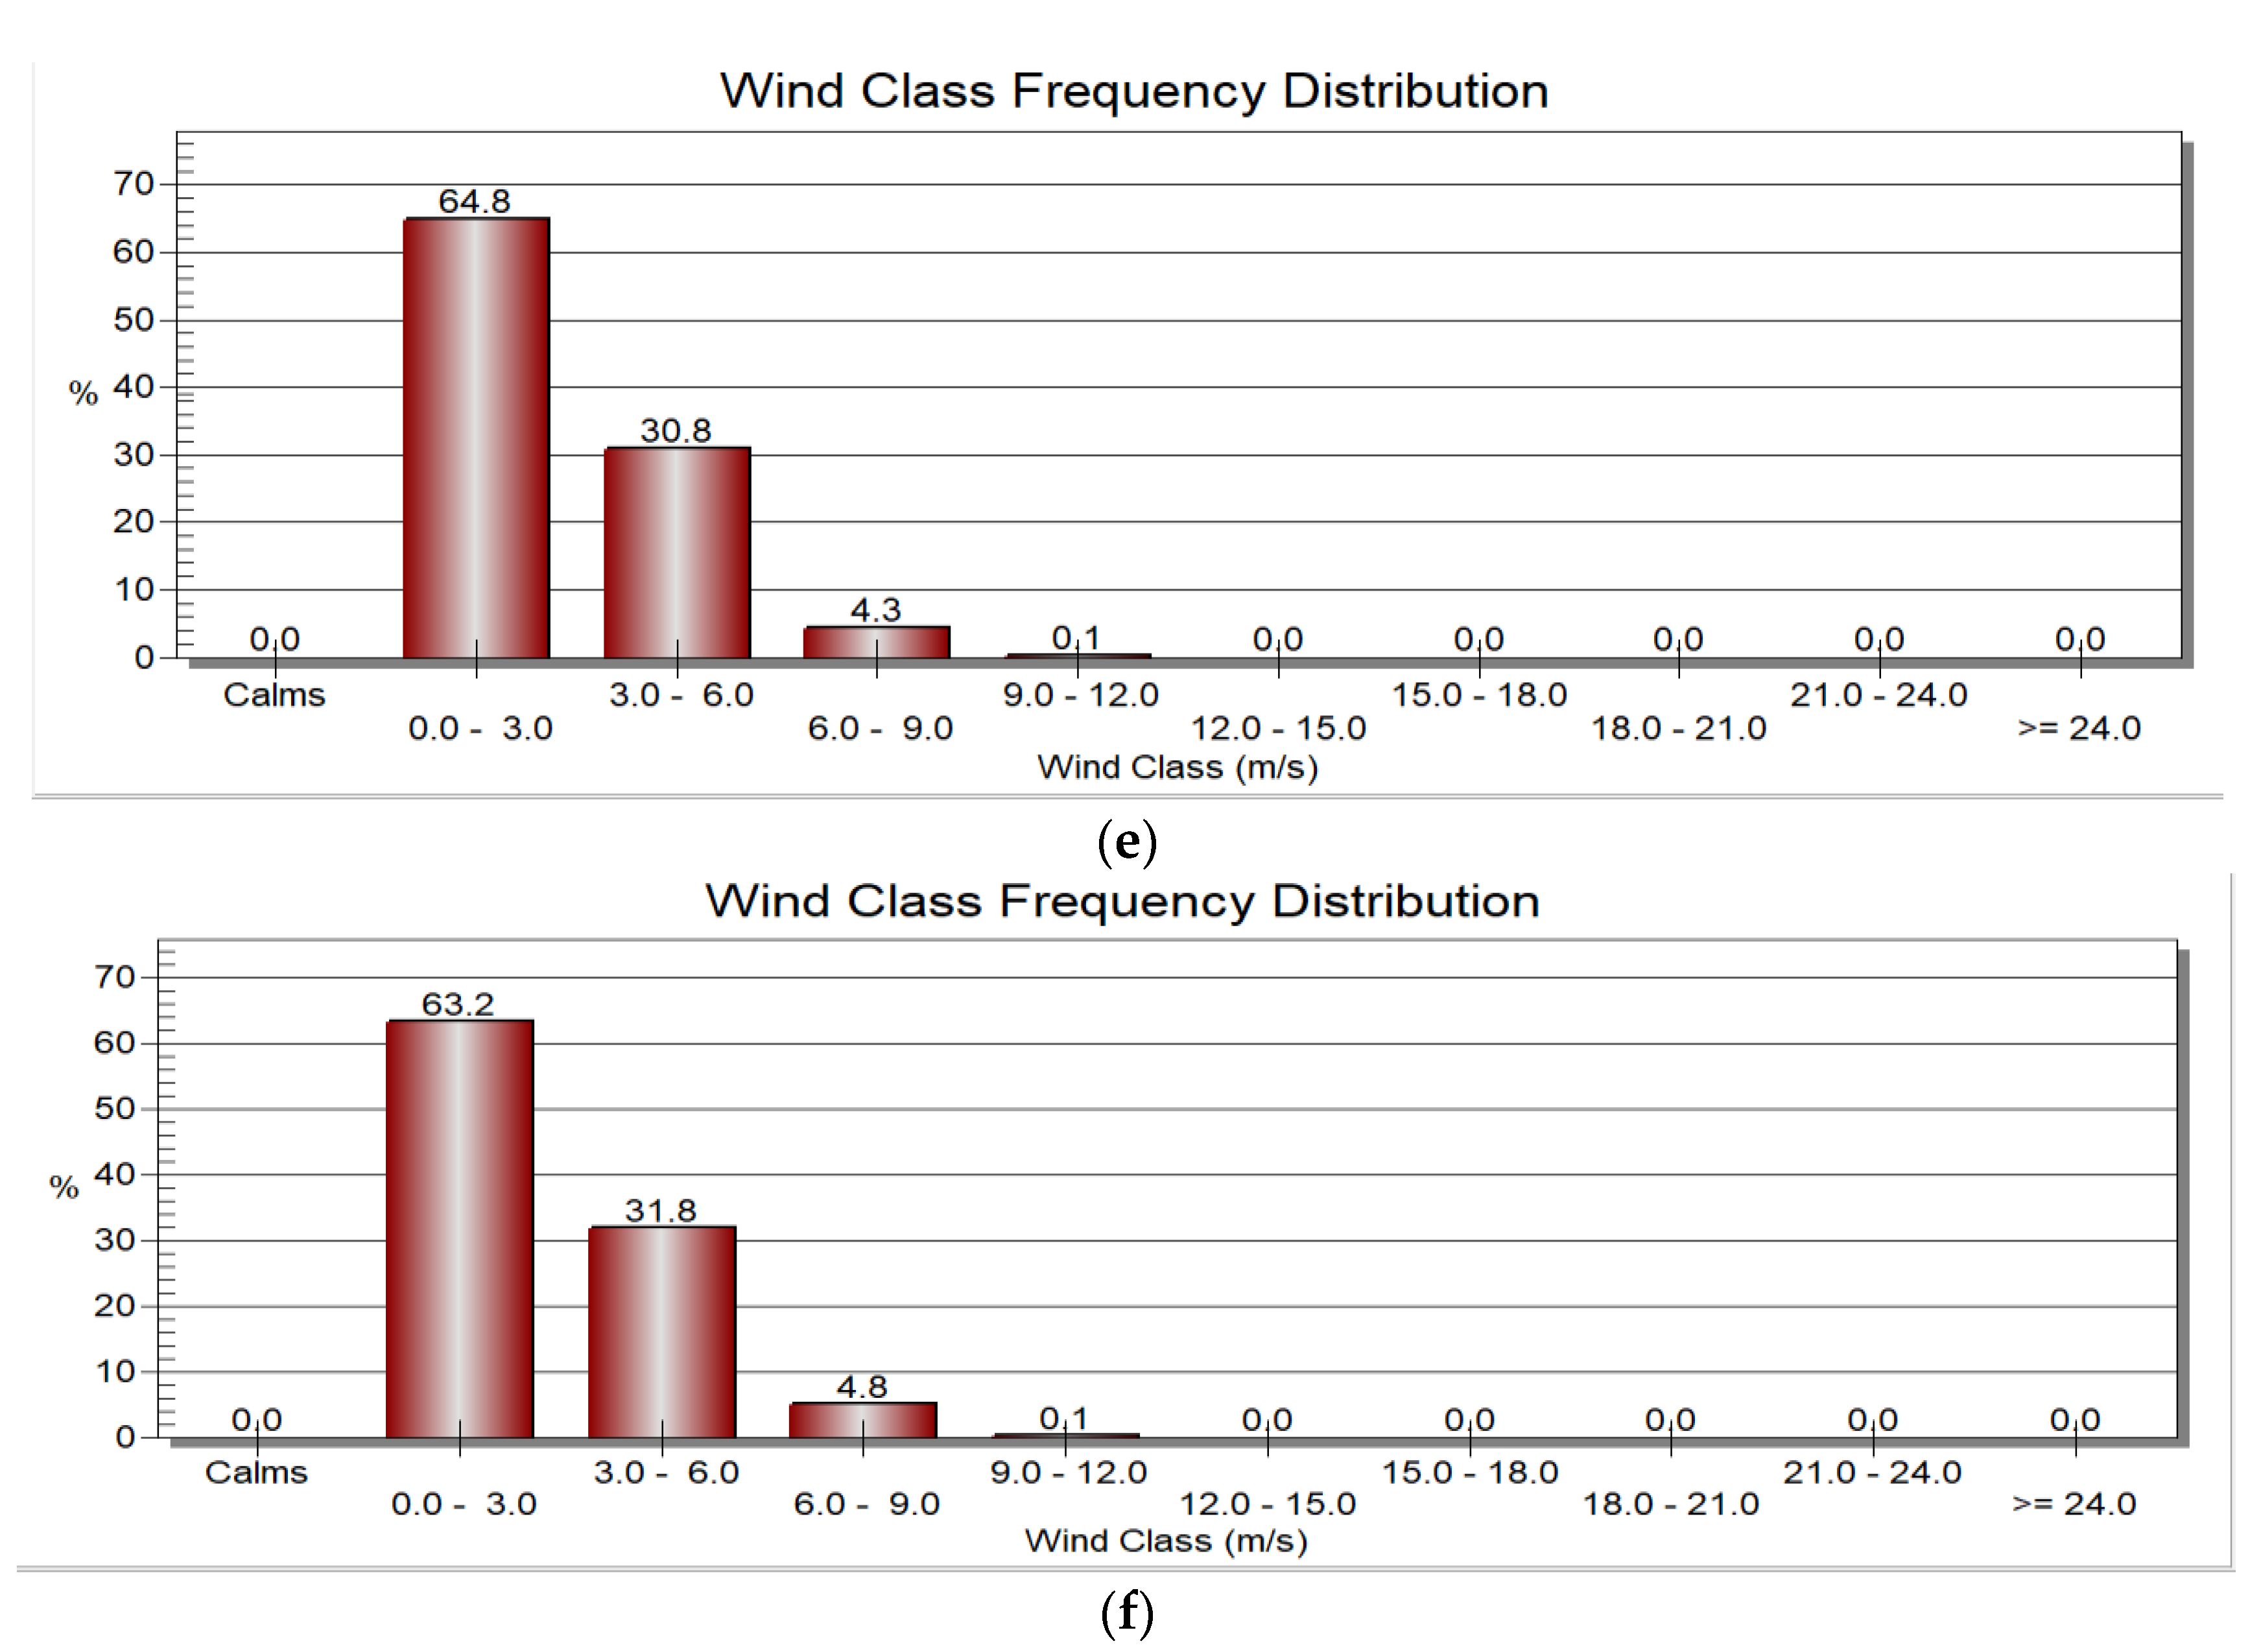
Figure 5 depicts the frequency distribution for the six sites considered at 10-metre heights, with more than 60% of the sites having wind speeds of 1-3 m/s. From 10–50%, the available wind speed was 3 m/s to 4 m/s, and some of the sites, such as MehalMeda, Eneware and DebreBerhan, have a frequency distribution at greater than 4 m/s of wind speed, which is less than 10% of the total.
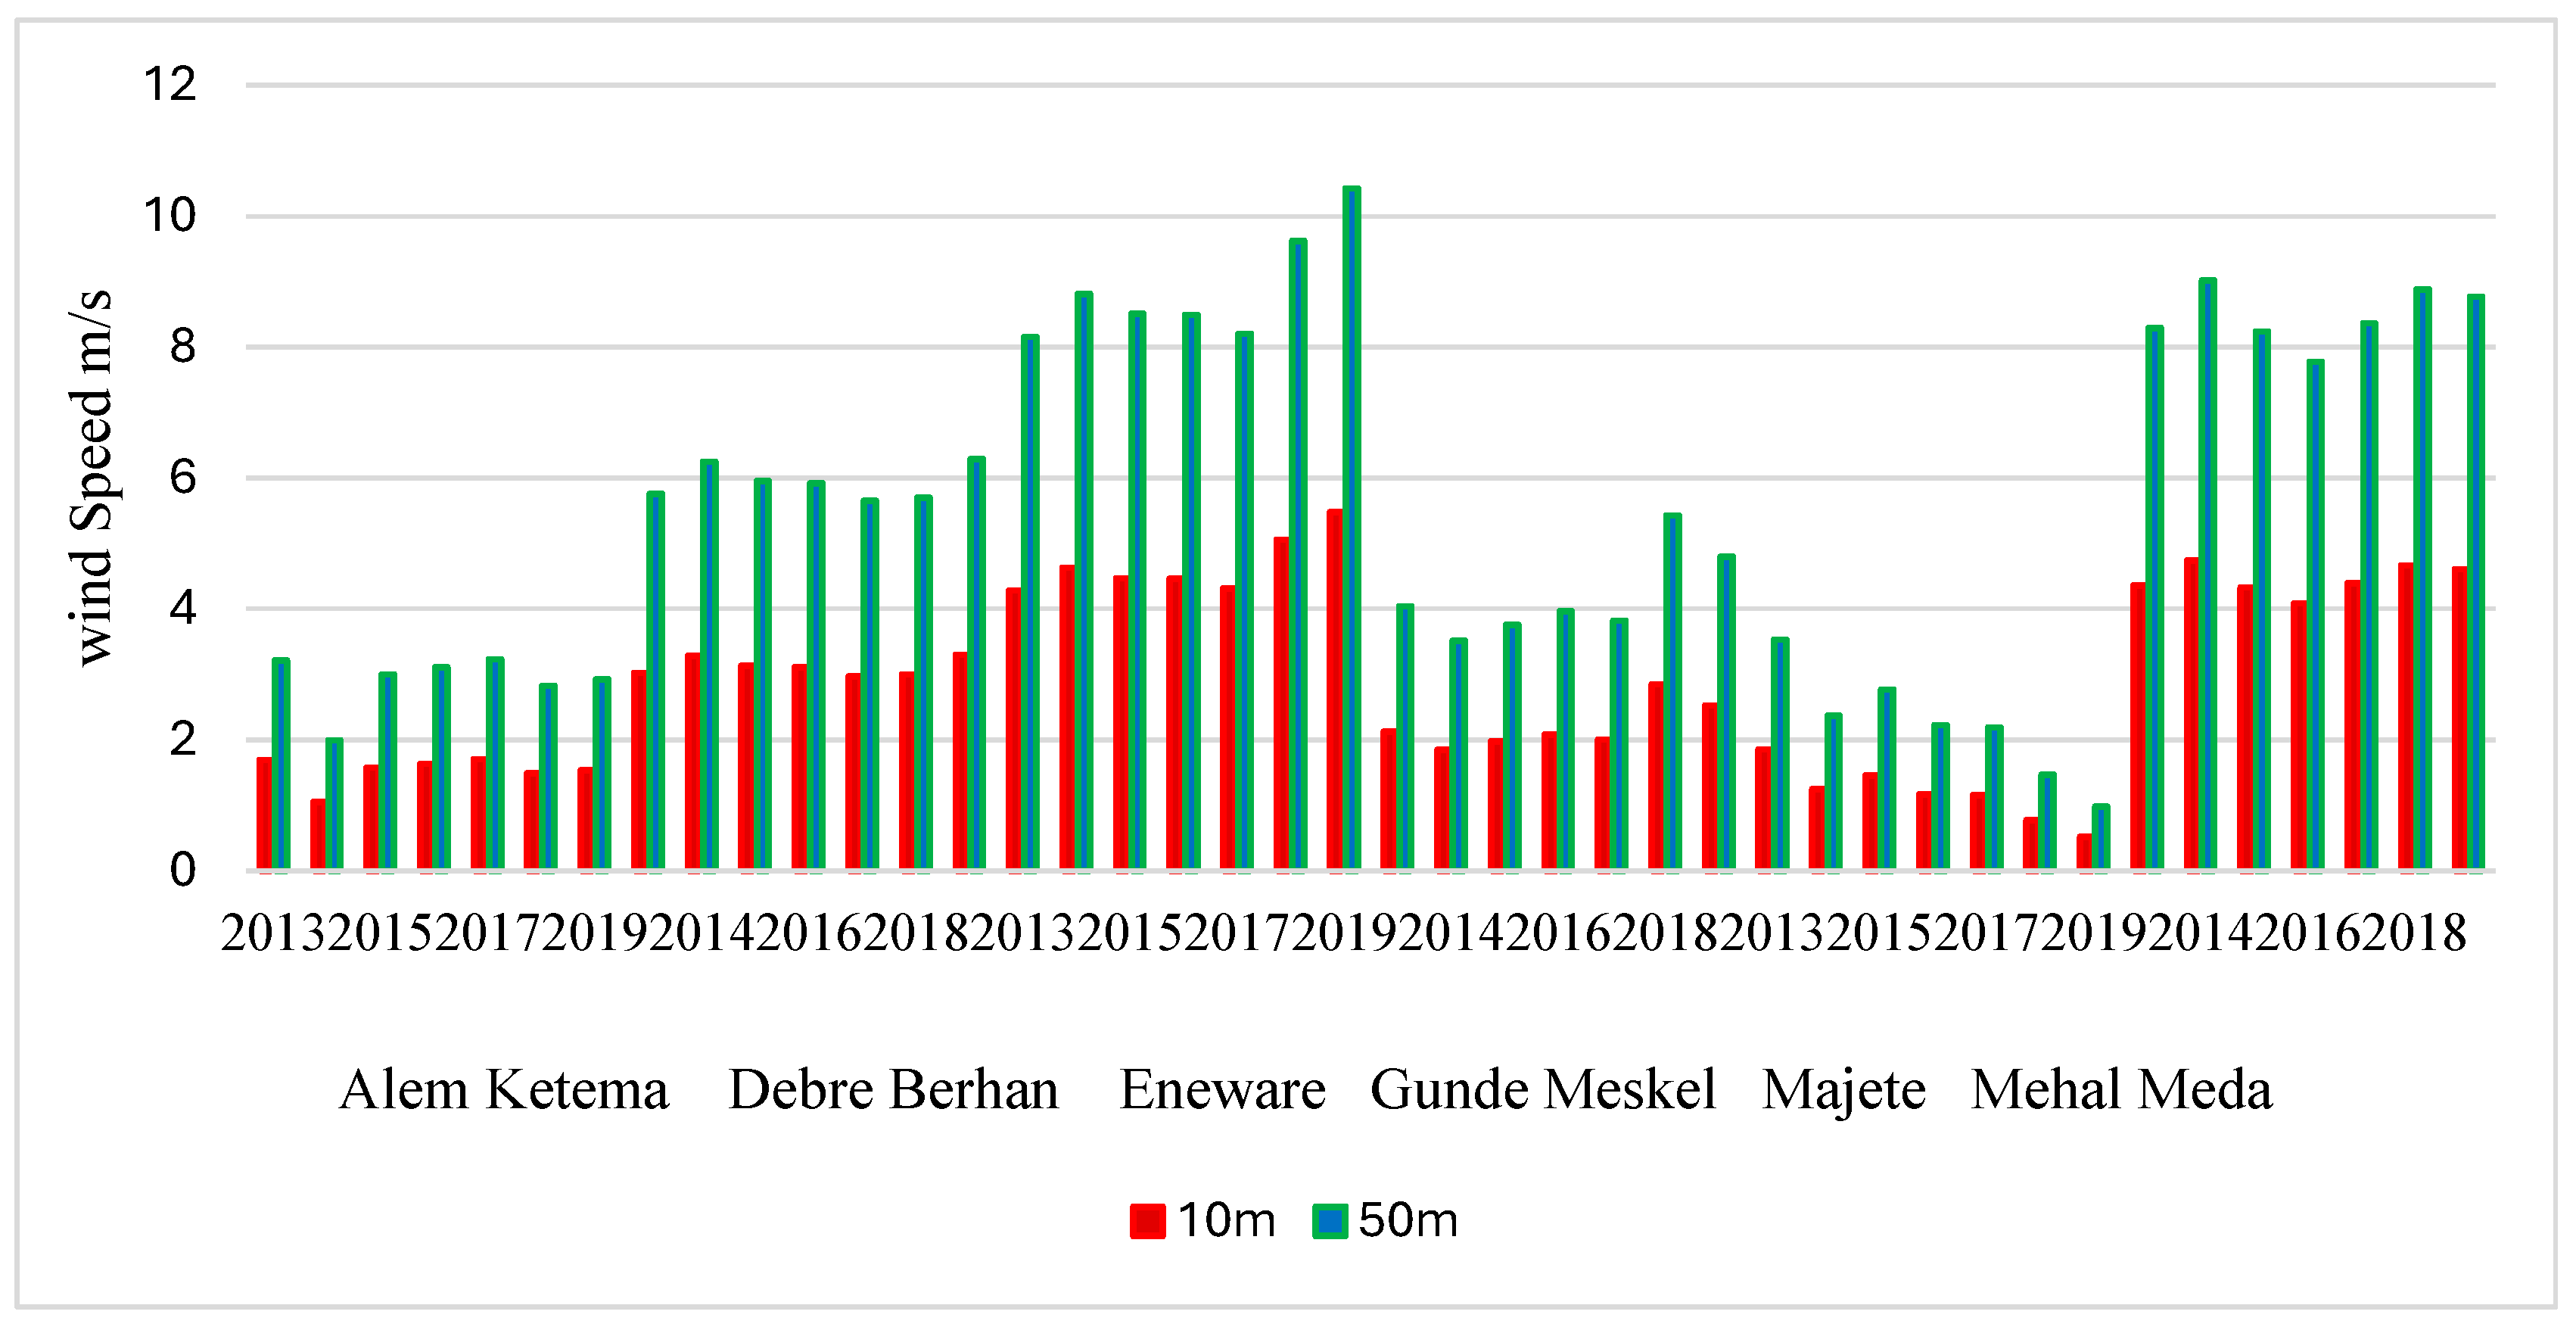
The wind speed changes with altitude and the actual wind turbines are placed at different heights. To choose the appropriate height for the wind turbines, the average monthly and annual wind speeds have been extrapolated at different heights. Figure 6 depicts the comparison of wind speed at 10m and 50 m. In which the determined extrapolated wind speed values obtained are 2.5 m/s and 8.5 m/s at the heights of 10m and 50 m, respectively.
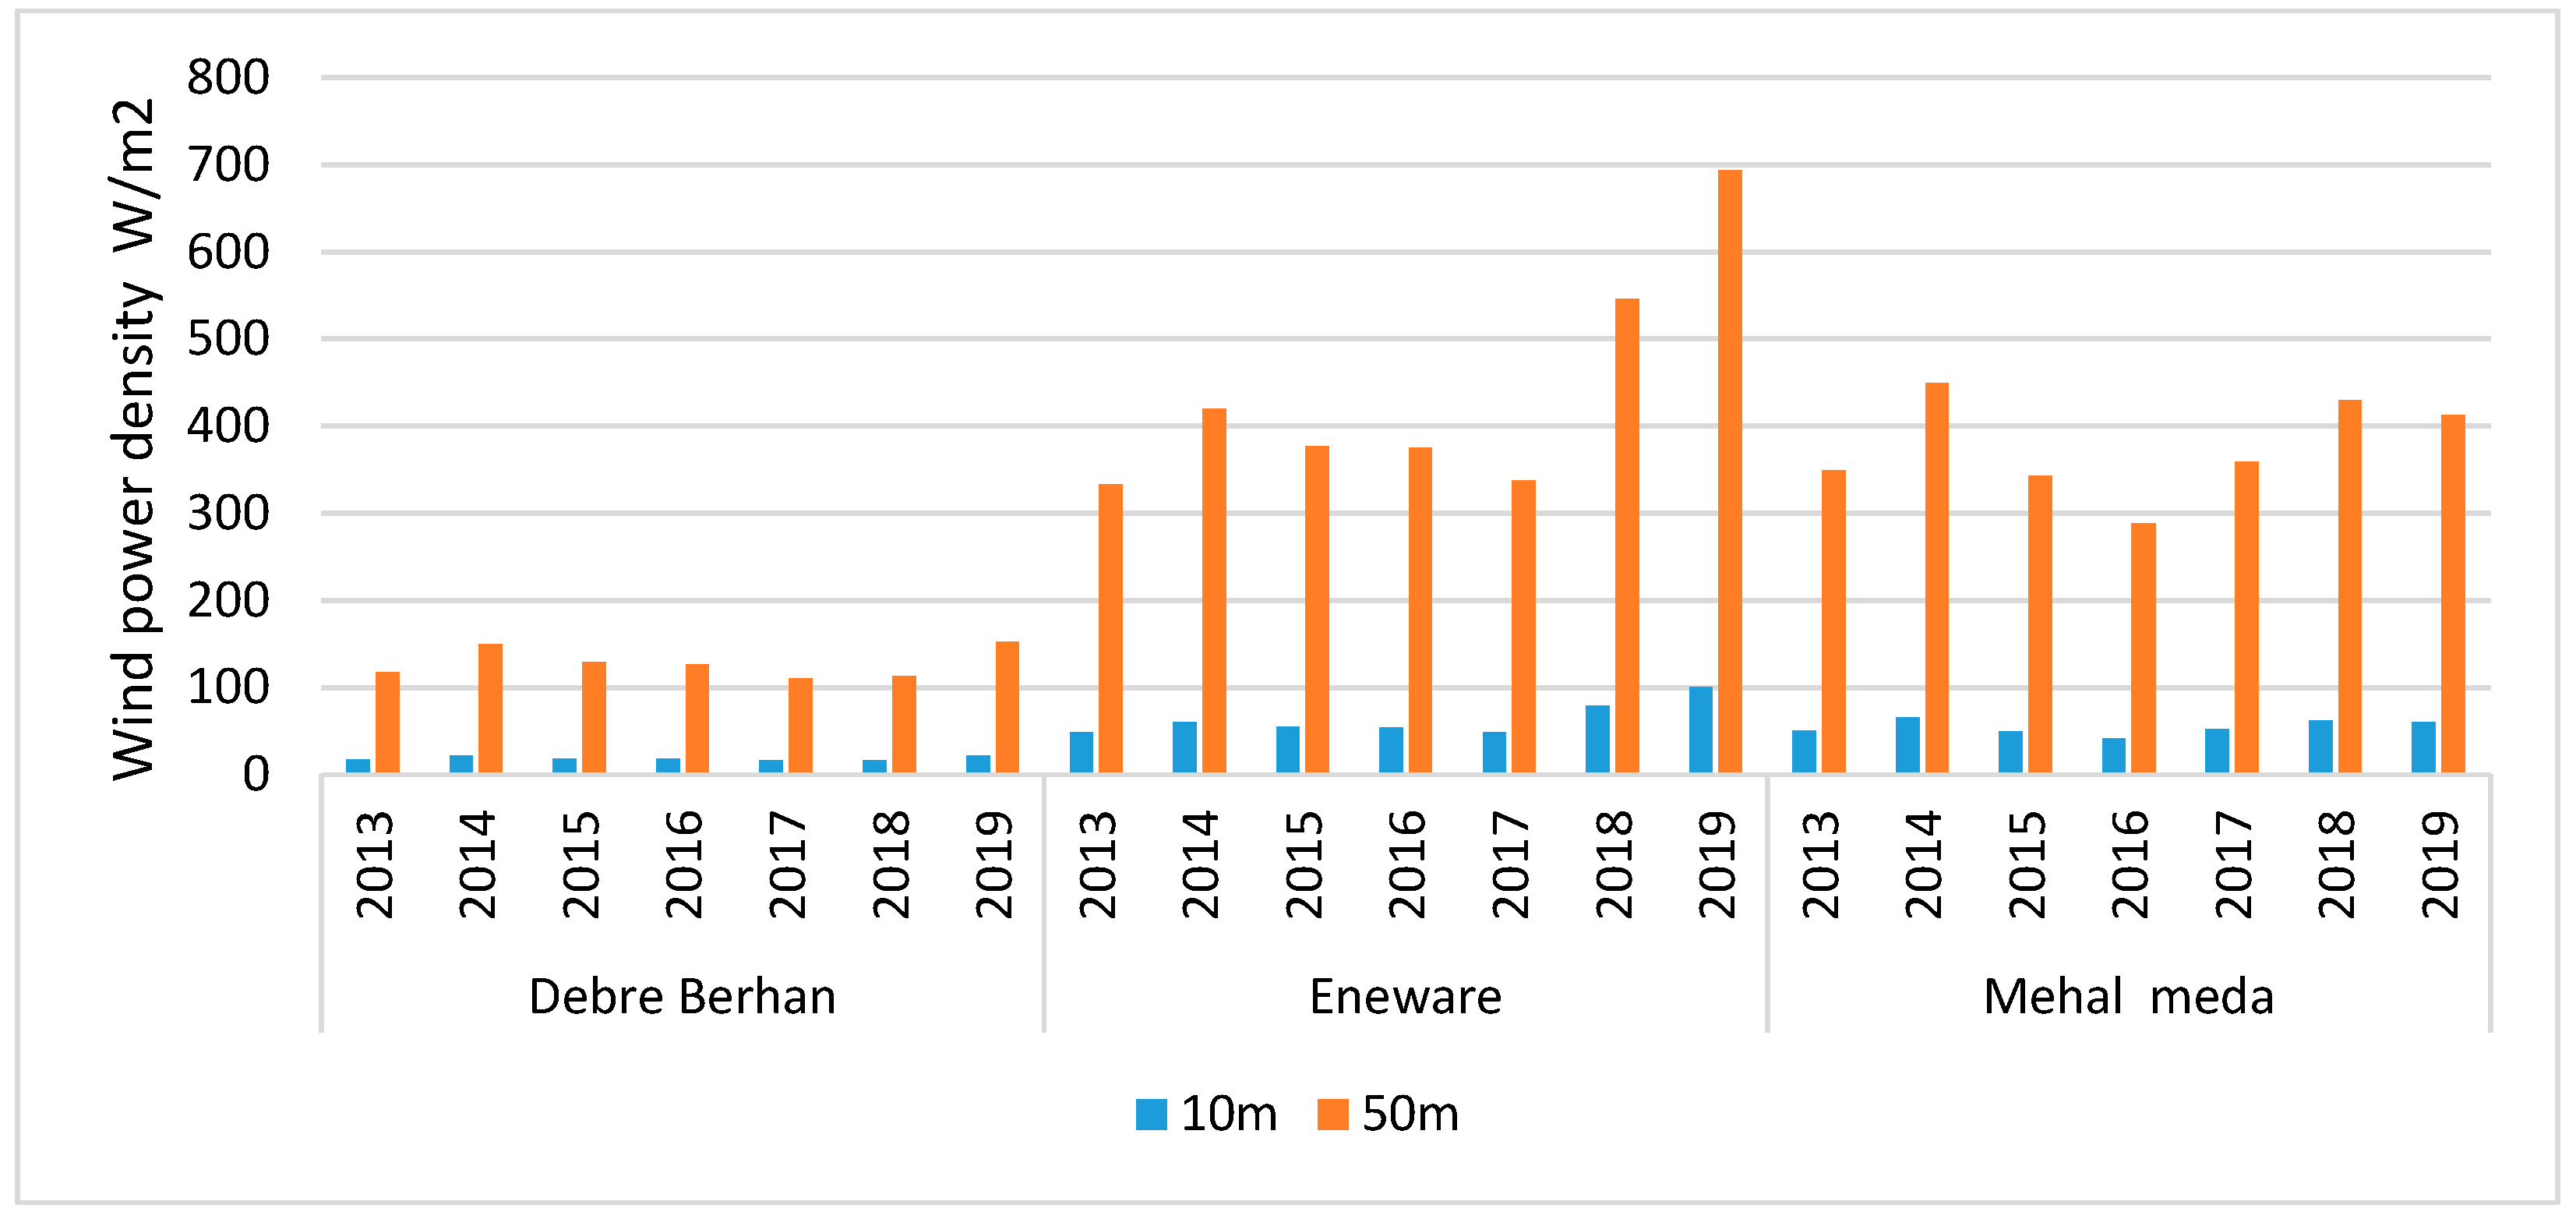
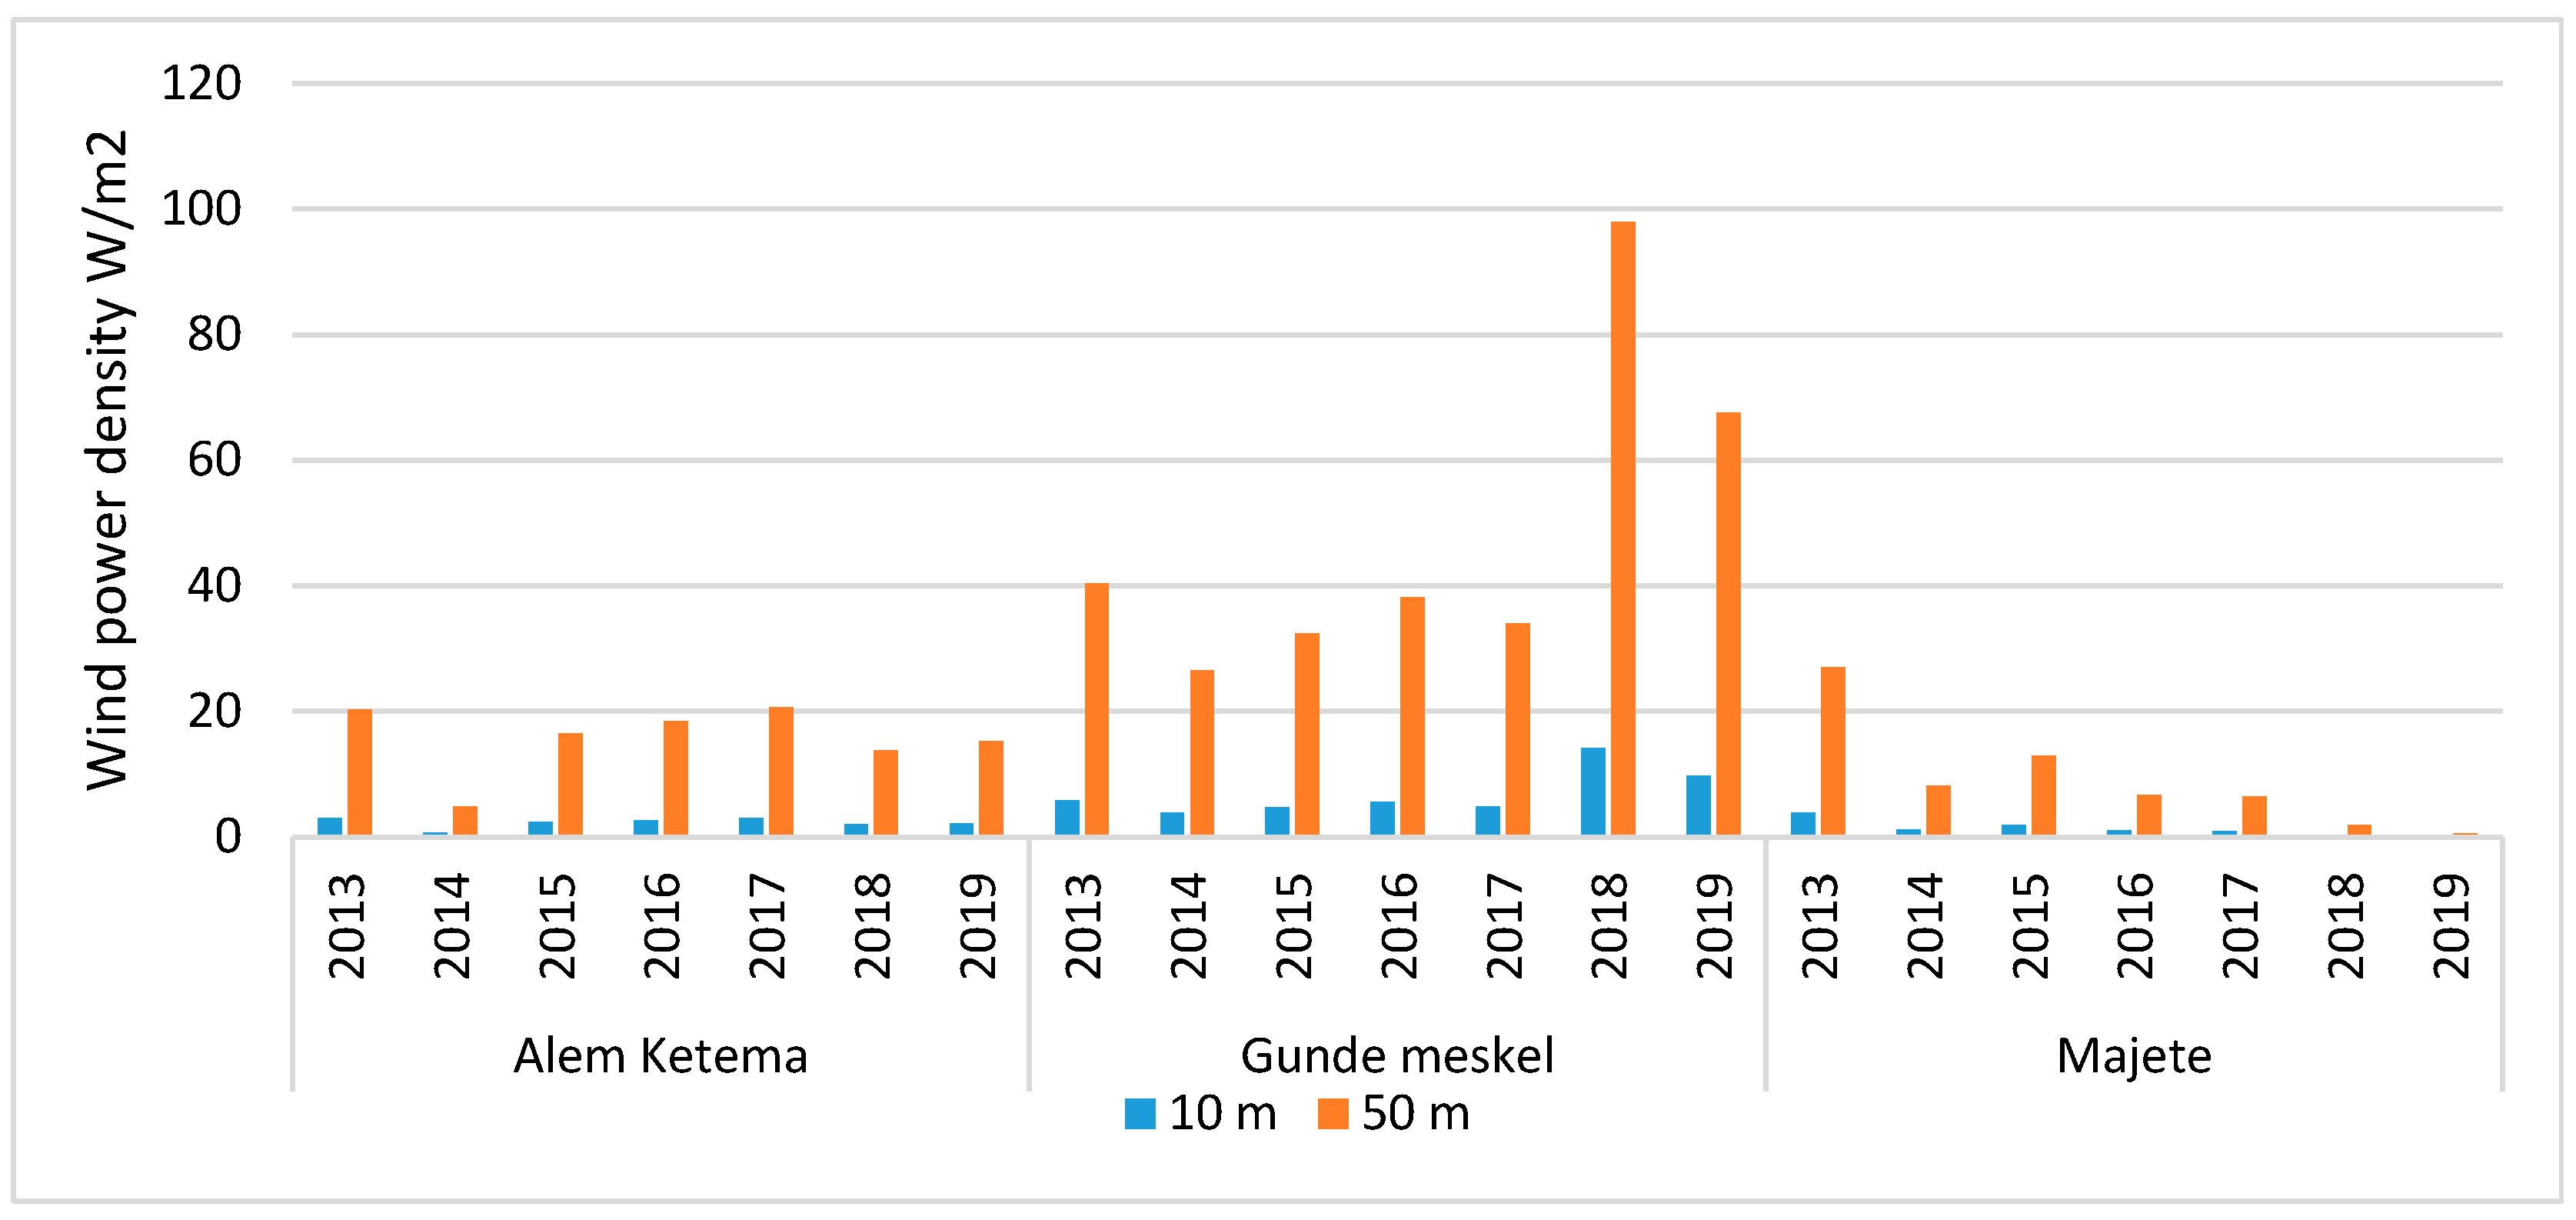
The wind power density for the North Shewa Zone over the given seven-years period is presented in Figure 7 and Figure 8. Based on the figures, it is shown that compared the sites of the case study area, from six sites three of them (Debreberhan, Eneware and Mehalmeda) have good wind speed both heights and the remaining site have low wind density as shown figure bellows. From good wind density sites, Eneware has the highest wind power density and Majete has the lowest wind power density. The maximum power density analysed at a height of 50m for Eneware is 689 W/m2., whereas the minimum power density with respective height for Eneware is 333.1 W/m2. Similarly, Majete, which is one of the district in the case study area, has a minimum wind power density at a height of 50 m, which is 6.7 W/m2 and having a maximum wind speed 26.96W/m2 at the same height.
The annual energy density of the case study area has been calculated using equation 9. From the result analysis, the maximum wind energy values were determined at Eneware, and the minimum wind energy density was found to be in Majete, with the energy ranging from 113.7315 to 6078.914 kWh/m2/year. Based on the international standards of wind power classification [4], the minimum average wind speed at 50m height for MehalMeda and Eneware is 8 m/s, which is under class 6 ‘Excellent. DebreBerhan lies in Class 2 and is classified as ‘Marginal’ with a minimum average wind speed of 5.6 m/s. As per the international standard for wind speed and wind power density, Eneware, MehalMeda, and DebreBerhan are suitable for electric wind power generation for large-scale applications. The remaining districts in the case study area, including Majete, GundeMeskel, and AlemKetema, are categorized under Class 1, which is ‘poor, with a minimum average wind speed of 3.5 m/s at 50m height.

3.2. Wind Turbine Power Characteristics

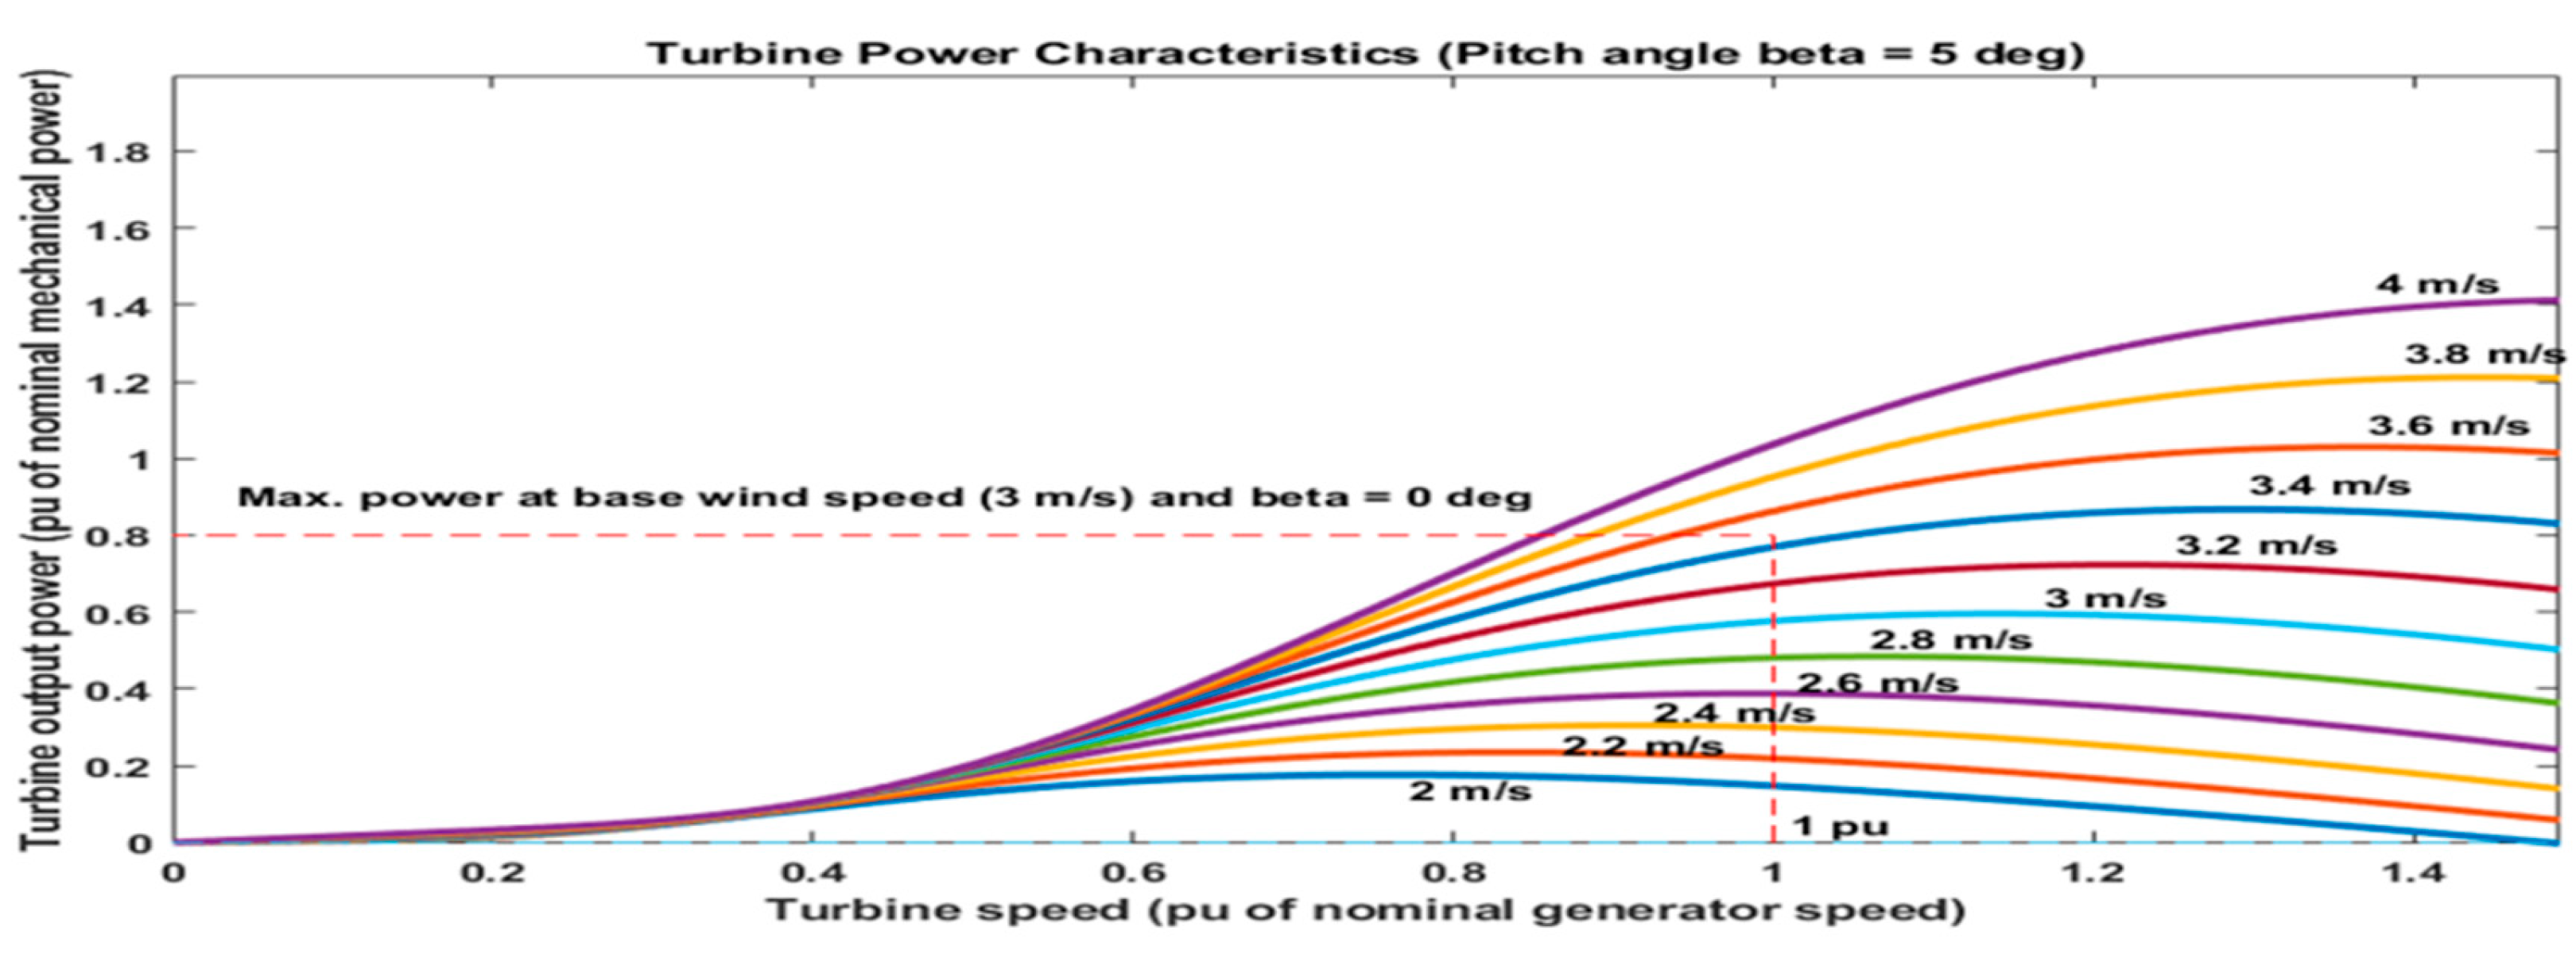
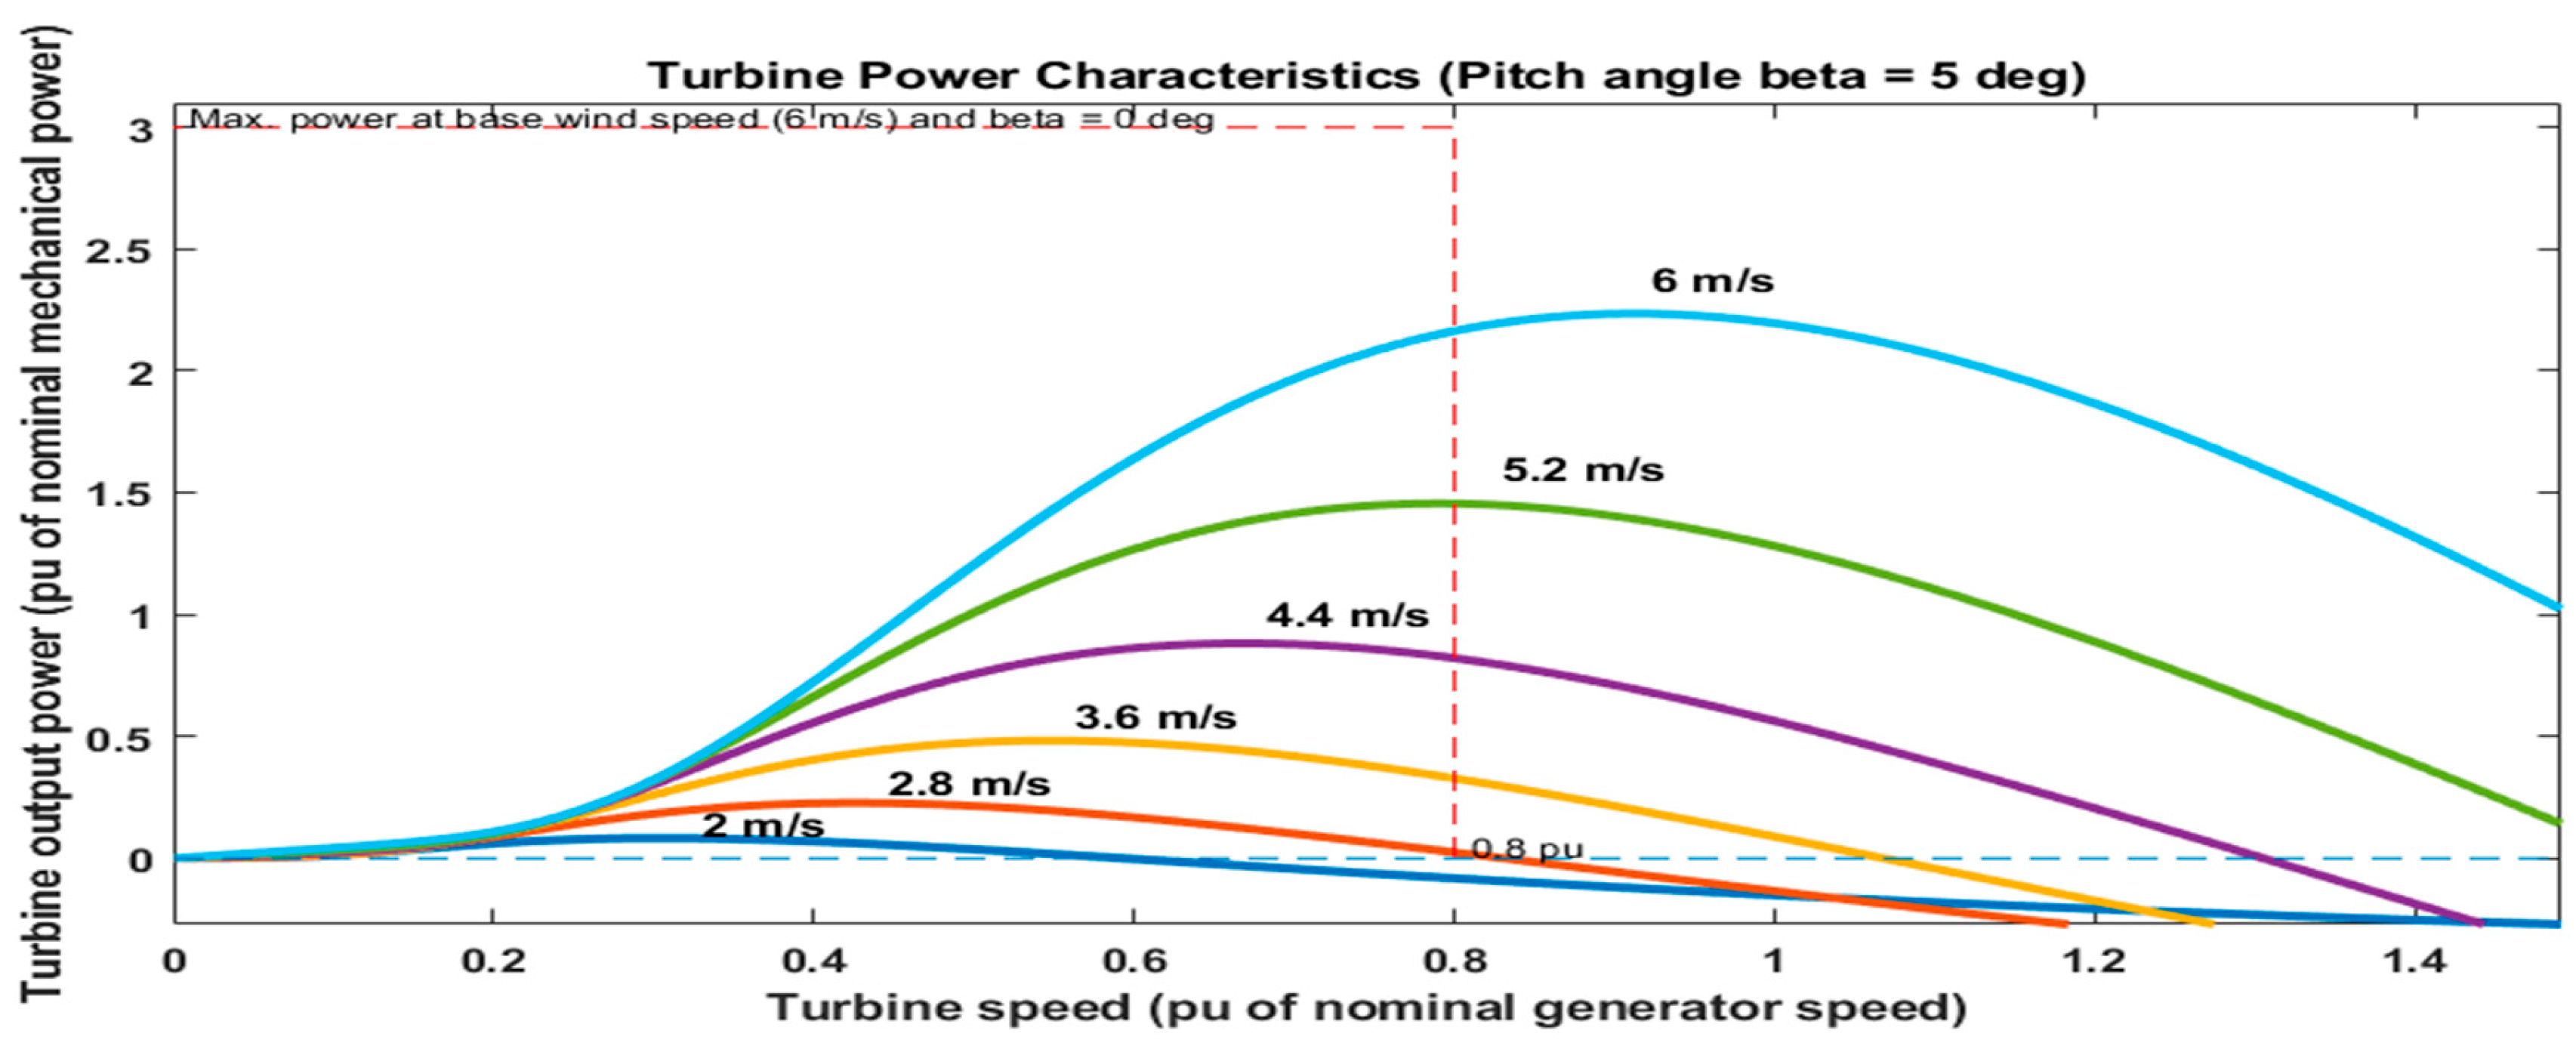
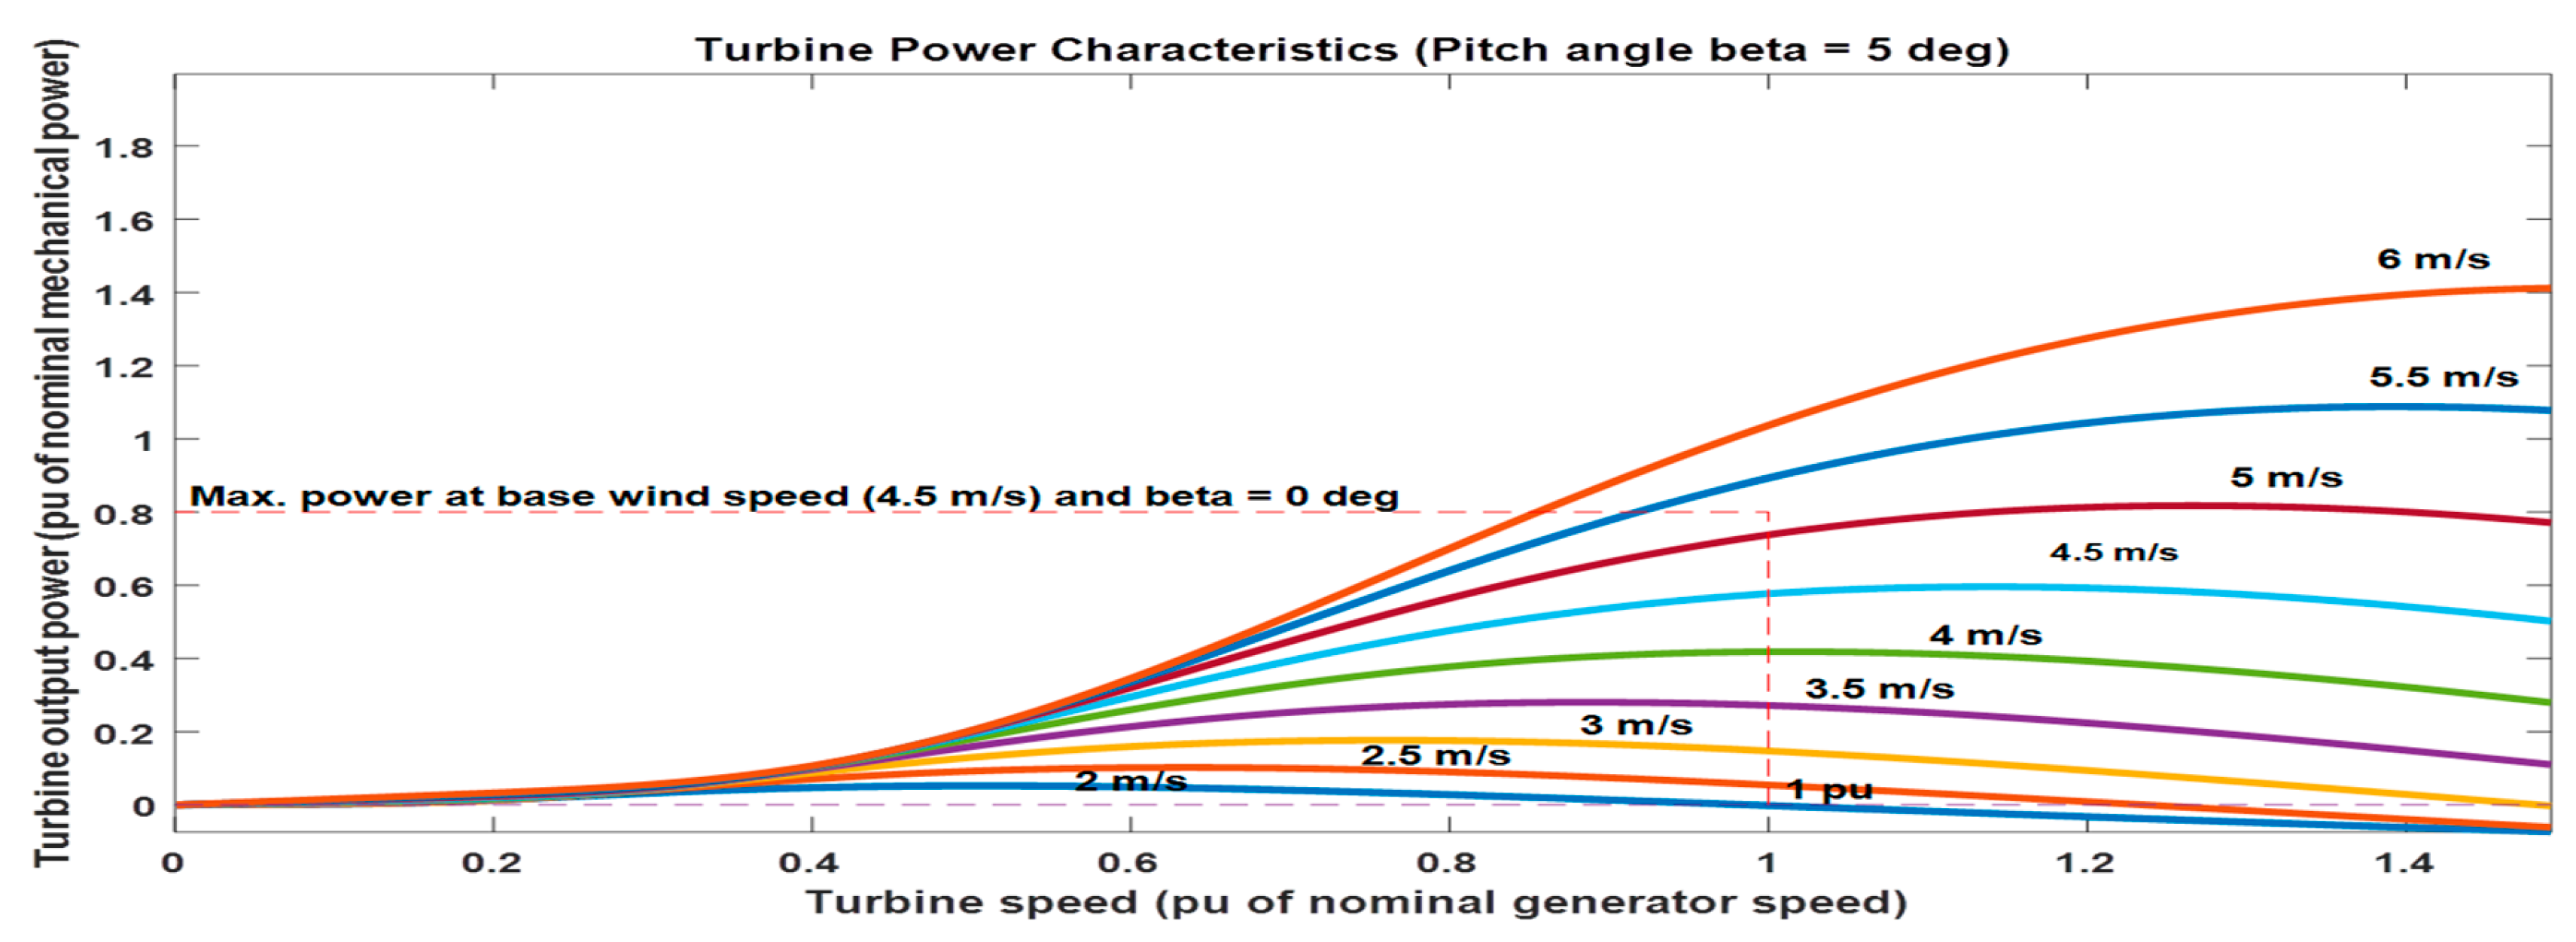
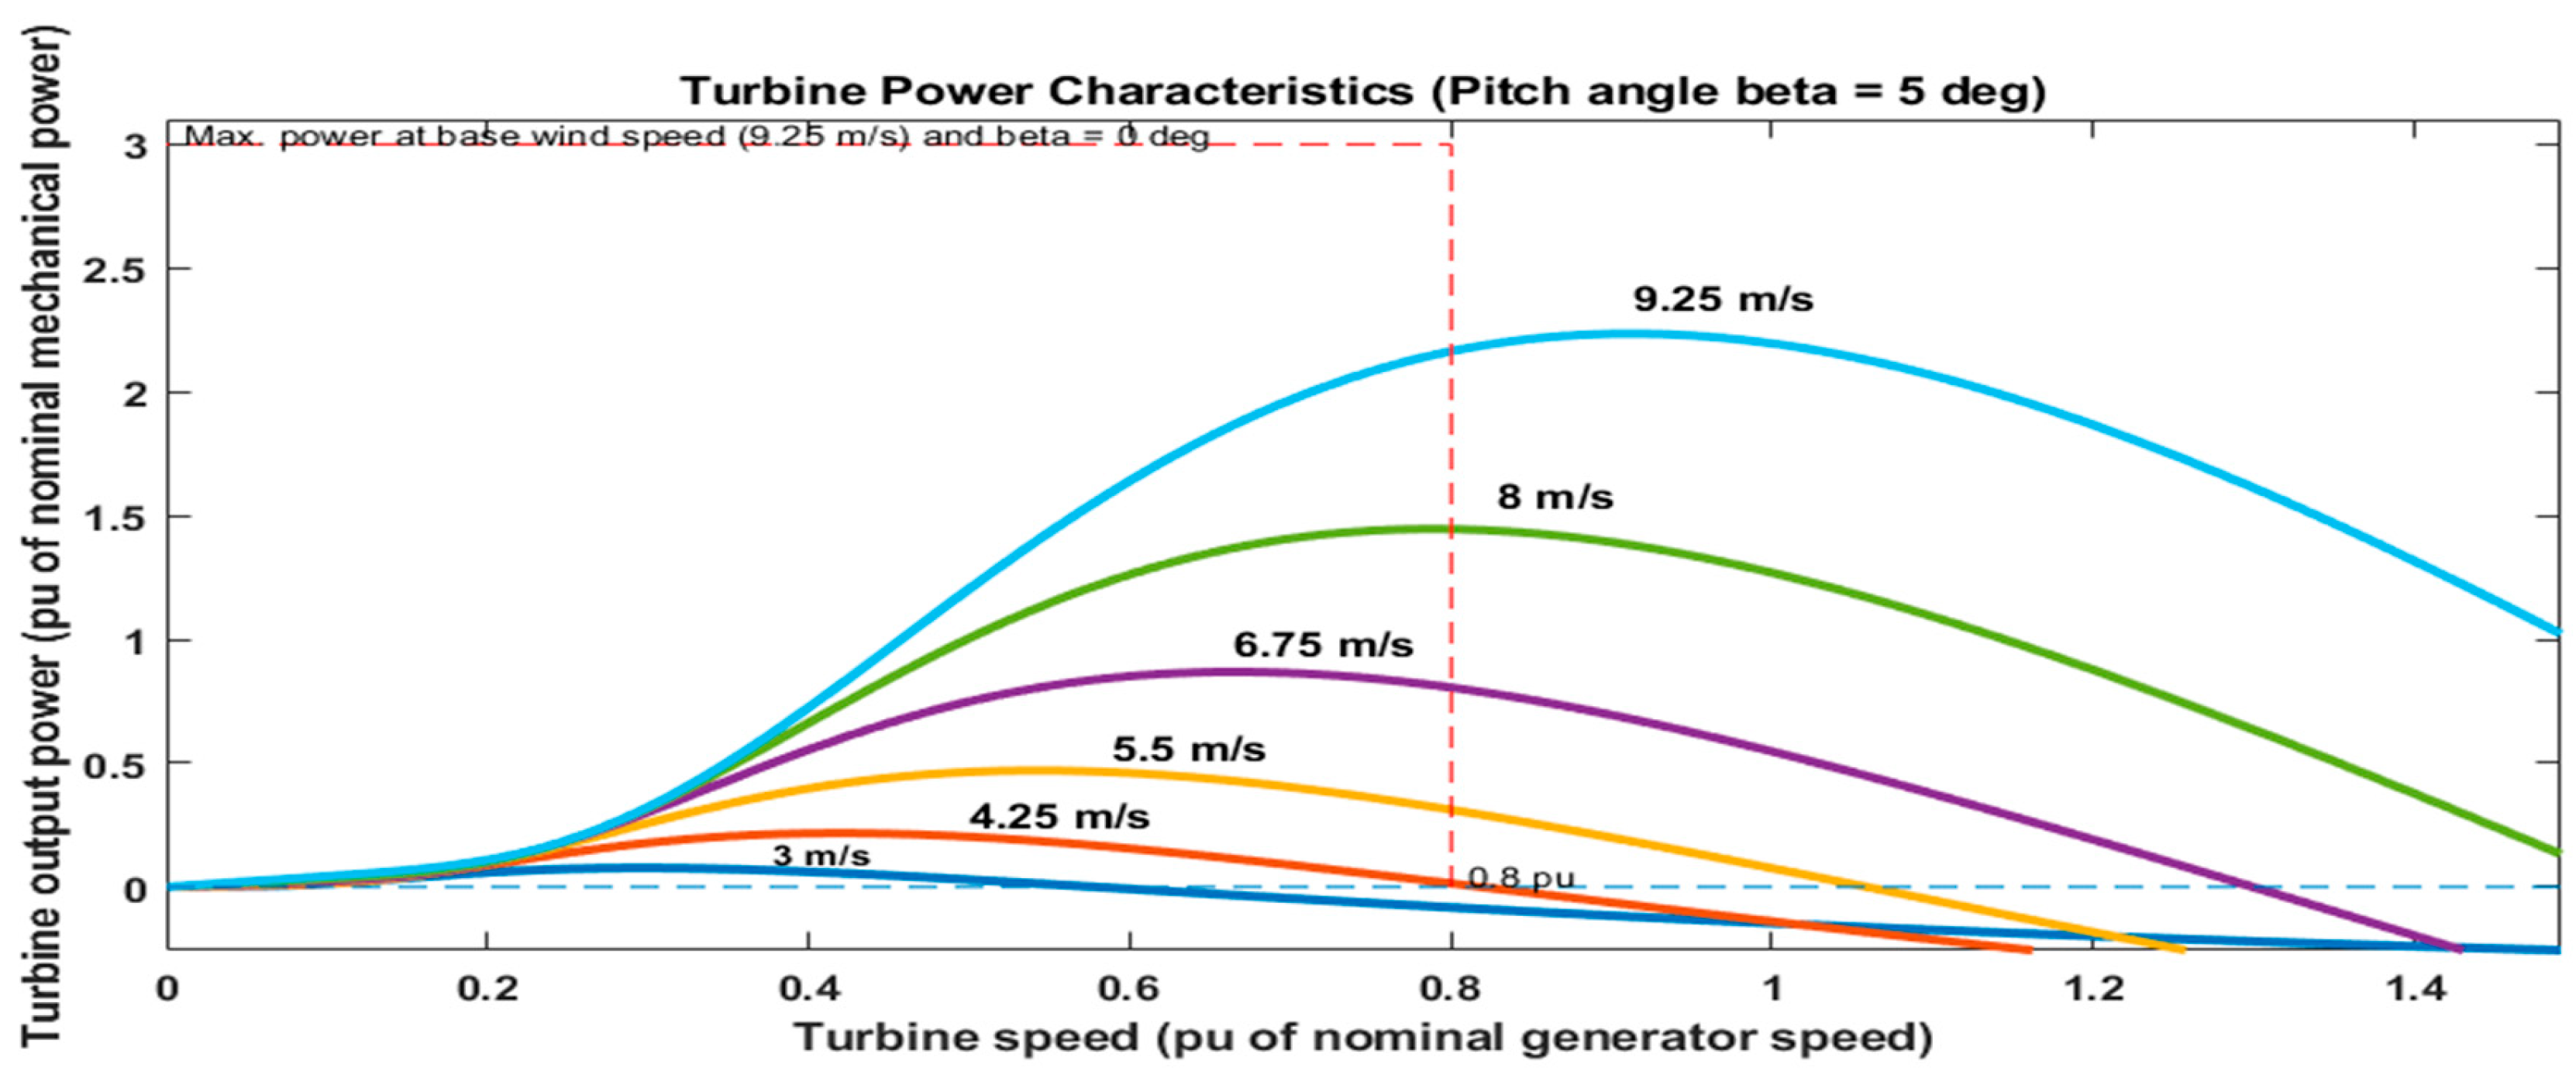
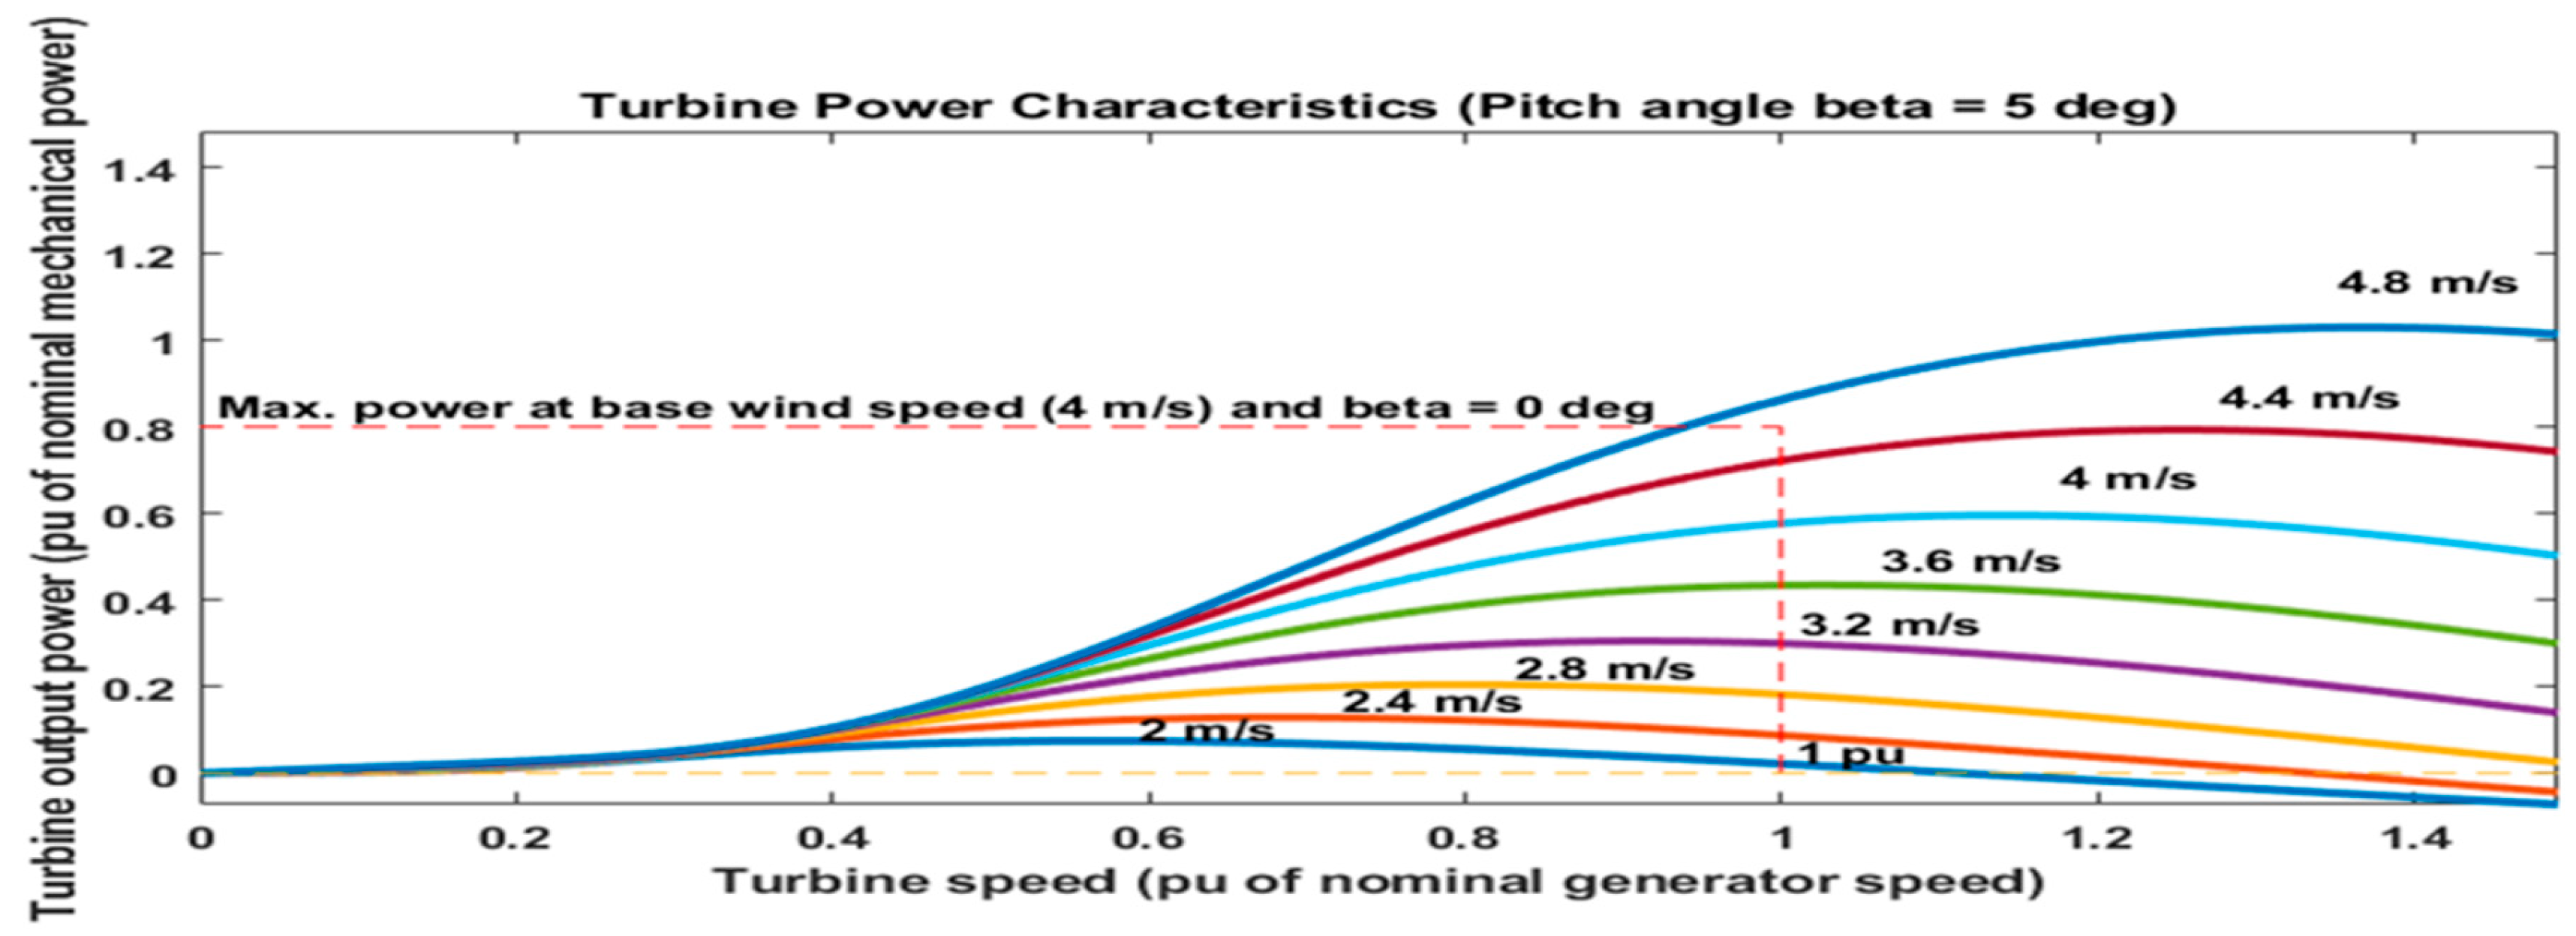
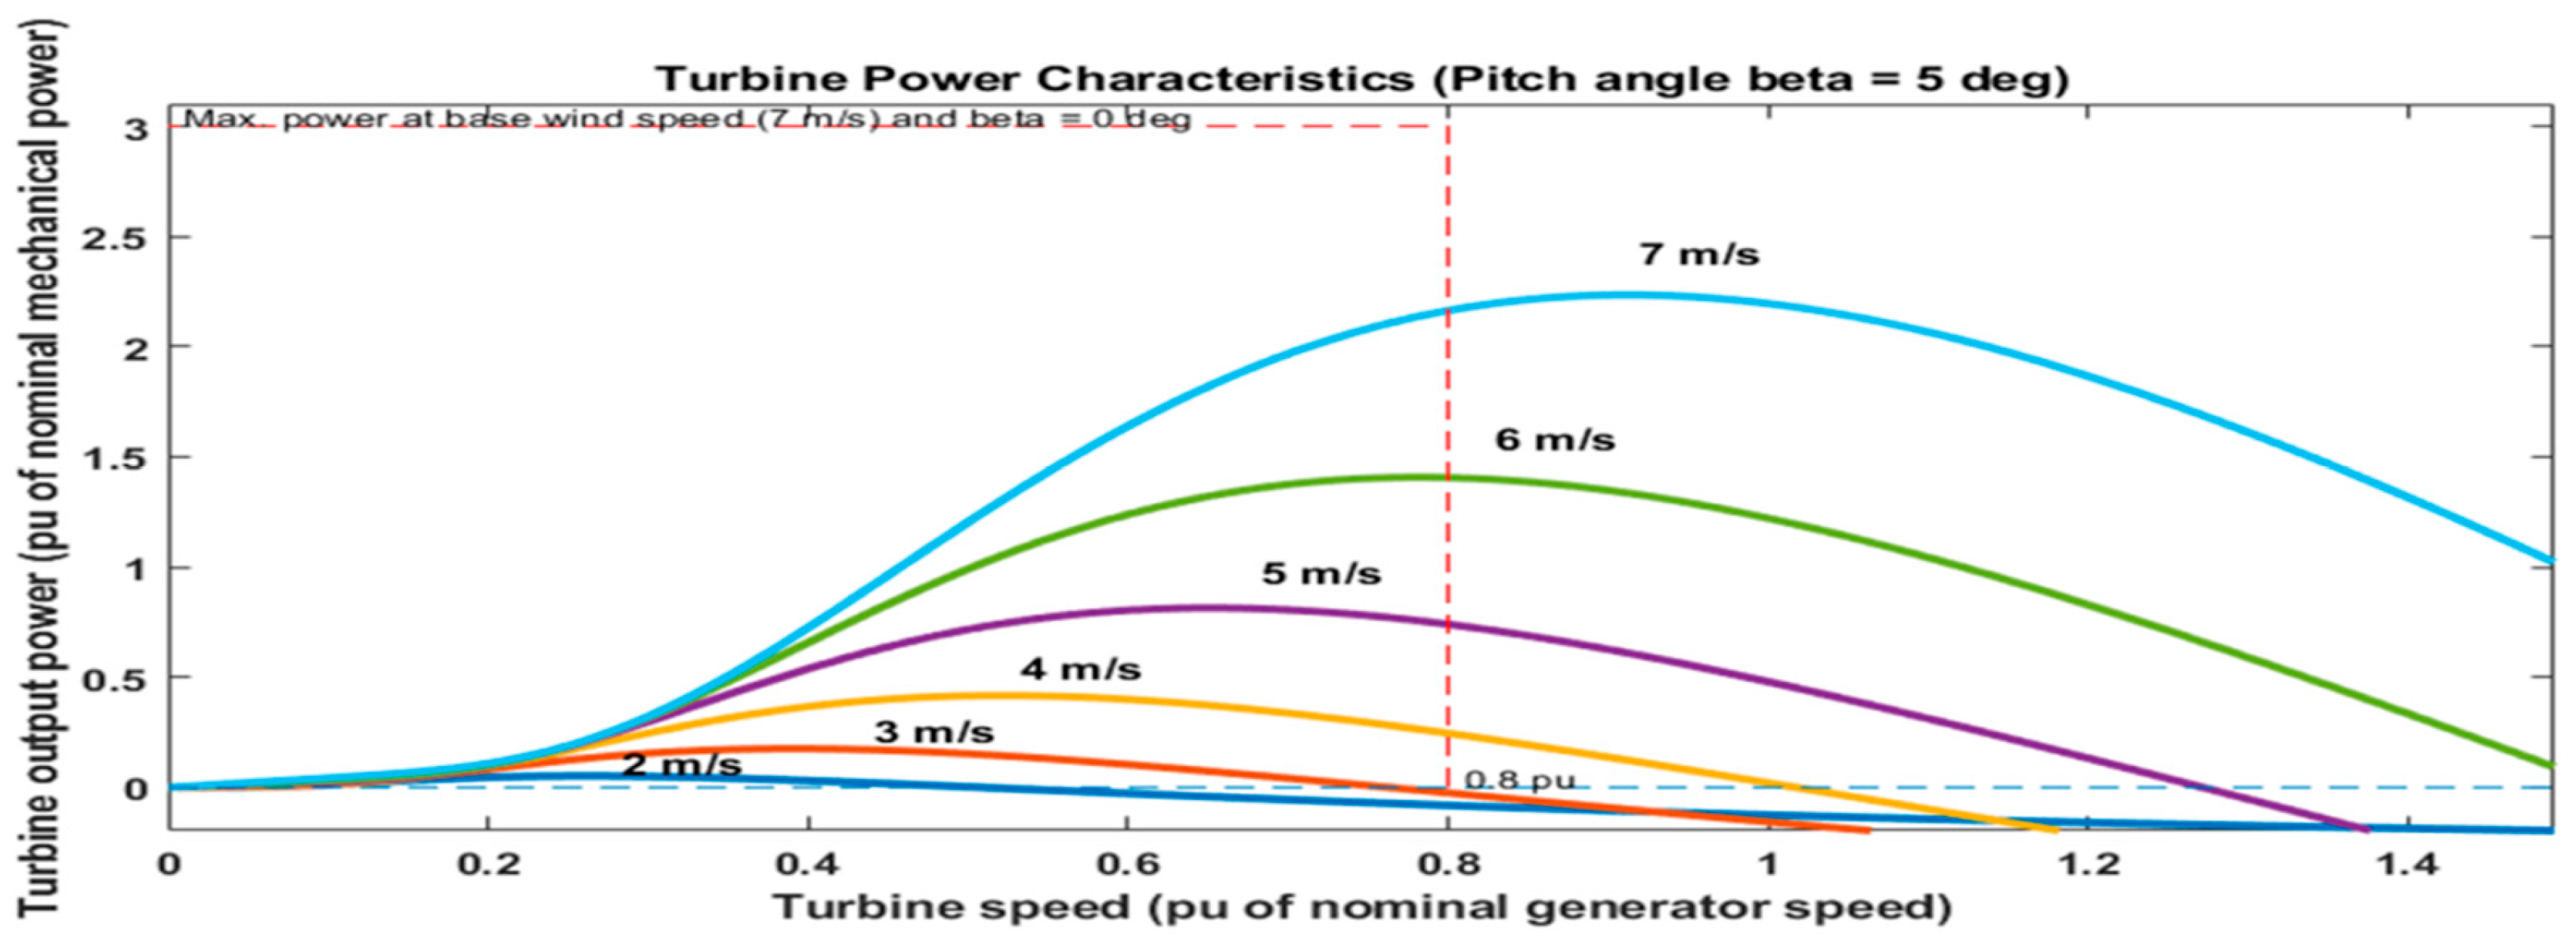
The wind speed is crucial for a wind turbine. Using the data from power curve and relevant frequencies of the wind speed, the electricity produced by the wind turbine is obtained on a monthly basis. A permanent magnet synchronous generator type wind turbine with a manufacturer model of FD2.7-1000 and rated power of 1000 w at 10 m and 50 m hub height and 2.7 m rotor diameter is considered to study wind turbine power characteristics at a base wind speed of 3 m/s and 6m/s for DebreBerhan, 4.5 m/s and 9.25m/s for Eneware, and 4 m/s and 7m/s for MehalMeda respectively. Its wind turbine power characteristics graph pitch angle beta of 0 degree for different wind speed ranges are given in Figure 9, Figure 10, Figure 11, Figure 12, Figure 13 and Figure 14 respectively. It is observed that, the maximum active power is achieved through the optimal wind speeds and not at high wind velocity. The wind turbine does not operate below the minimum wind speed, because the captured wind energy is not enough to compensate the losses and operation cost.
The wind speed and direction assessment and forecast wind speed potential are key points for wind energy industry.

4. Conclusions

This study identifies wind potential for the North Shewa Zone of the Amhara Region, Ethiopia. Using NMA and NASA data, six different districts (MehalMeda, Eneware, DebreBerhan, AlemKetema, GundoMekel, and Majete) with metrological center wind speed data at 2 m and 10 m heights are selected for analysis. In this work, 20 years of data are considered for analysis. However, in Table 1, it is difficult to employ 20 years of data as per space and quality; the paper used 5 years of data. The data obtained from different districts of the zone were the daily records from the national meteorological agency (NMA) at 3-hour intervals. Using the wind speed data obtained at 10m height from the wind direction measured with a wind rose, the wind weibull frequency distribution and wind turbine characteristics have been analyzed.
From the study, the most dominant wind direction is 95–105 degrees with a frequency distribution of 10.6% for AlemKetema, 75–85 degrees with a frequency distribution of 15.9589% for DebreBerhan, 85–95 degrees with a frequency distribution of 25.3196% for Eneware, and 75–85 degrees with a frequency distribution of 22.1804% for MehalMeda.
Where low wind speeds flowed in the sectors of 295–305 degrees at Majete and 105–115 degrees at GundeMeskel, at 10 m height. A study of wind direction showed that the majority of the wind was flowing from east to west in most sites. Extrapolating the 10 meter wind speed data to 50 meters, the annual energy capacity in kWh/yr is determined for AlemKetema, DebreBerhan, Eneware, GundoMekel, Majete, and MehalMeda are 181.06 kWh/yr, 1332.83 kWh/yr, 6078.914 kWh/yr, 857.775 kWh/yr, 58.783 kWh/yr, and 3939.418 kWh/yr respectively. After determining and analysing the extrapolated wind speed, wind power density, and wind energy density, it is concluded that Eneware, MehalMeda, and DebreBerhan have feasible wind potential for both small-scale and large-scale wind farm implementation, whereas Majete, AlemKetema, and GundoMeskel of the North Shewa Zone in the Amhara region have poor wind potential.

5. Scope of the Research and Future Directions

The work presented in this paper is limited to verifying the feasibility and PA of wind power in selected meteorological districts in the North Shewa zone of the Amhara region, Ethiopia. The future scope of this work is to validate the wind potential experimentally at small and medium scales and study its grid stability impact using artificial-intelligence-based optimization approaches.

Funding

This research received no external funding

Conflicts of Interest

The authors declare no conflict of interest.

References

  1. Padam G, Rysankova D, Portale E, Koo BB, Keller S, Fleurantin G. Ethiopia–Beyond connections: energy access diagnostic report based on the multi-tier framework. World Bank; 2018 Jul 1.
  2. Tucho, G.T.; Weesie, P.D.; Nonhebel, S. Assessment of renewable energy resources potential for large scale and standalone applications in Ethiopia. Renew. Sustain. Energy Rev. 2014, 40, 422–431. [CrossRef]
  3. Hailu AD, Kumsa DK. Ethiopia renewable energy potentials and current state. Aims Energy. 2021 Jan 1;9(1):1-4. [CrossRef]
  4. Yissa Dawde, O.(2013). Wind Resource Data Analysis: The case of MYDERHU project site, Tigray regional state, Ethiopia.
  5. Yalew, AW. The Ethiopian energy sector and its implications for the SDGs and modeling. Renewable and Sustainable Energy Transition. 2022 Aug 1;2:100018. [CrossRef]
  6. Sitotaw, Eshete.;Tadesse, Abate. Wind energy potential assessment in NifasMewucha, Amhara Province Ethiopia, 2021 doi.org/10.1177/0309524X211000713. [CrossRef]
  7. Bekele, G., & Palm, B. (2009). Wind energy potential assessment at four typical locations in Ethiopia. Applied Energy, 86(3), 388-396. [CrossRef]
  8. Pryor, S. C., and R. J. Barthelmie, 2010: Climate change impacts on wind energy: A review. Renewable Sustainable Energy Rev., 14, 430–437. [CrossRef]
  9. Lewis, JI. Technology acquisition and innovation in the developing world: Wind turbine development in China and India. Studies in comparative international development. 2007 Dec;42(3-4):208-32. [CrossRef]
  10. Council, GW. GWEC Global Wind Report 2019. Global Wind Energy Council: Bonn, Germany. 2017.
  11. Elliott, D. Assessing the world's wind resources. In2002 IEEE Power Engineering Society Winter Meeting. Conference Proceedings (Cat. No. 02CH37309) 2002 Jan 27 (Vol. 1, pp. 346-347). IEEE.
  12. Solyali D, Altunç M, Tolun S, Aslan Z. Wind resource assessment of Northern Cyprus. Renewable and Sustainable Energy Reviews. 2016 Mar 1;55:180-7. [CrossRef]
  13. Anjum, L. Wind resource estimation techniques-an overview. Int. J. Wind Renew. Energy. 2014 Jan;3(2):26-38.
  14. Ren G, Wan J, Liu J, Yu D. Characterization of wind resource in China from a new perspective. Energy. 2019 Jan 15;167:994-1010. [CrossRef]
  15. Tizpar A, Satkin M, Roshan MB, Armoudli Y. Wind resource assessment and wind power potential of Mil-E Nader region in Sistan and Baluchestan Province, Iran–Part 1: Annual energy estimation. Energy conversion and management. 2014 Mar 1;79:273-80. [CrossRef]
  16. Bina SM, Jalilinasrabady S, Fujii H, Farabi-Asl H. A comprehensive approach for wind power plant potential assessment, application to northwestern Iran. Energy. 2018 Dec 1;164:344-58. [CrossRef]
  17. Alessandrini S, Sperati S, Pinson P. A comparison between the ECMWF and COSMO Ensemble Prediction Systems applied to short-term wind power forecasting on real data. Applied energy. 2013 Jul 1;107:271-80. [CrossRef]
  18. Chen MH, Lin YT, Chiu PH, Cho CC, Weng HC. Wind Resources Assessment and Development of Grid Connected Wind Farm—A Case Study. Sustainability. 2020 Oct 27;12(21):8903. [CrossRef]
  19. Mitigation, CC. IPCC special report on renewable energy sources and climate change mitigation. Renewable Energy. 2011;20(11).
  20. Clark, K. The Paris agreement: its role in international law and American jurisprudence. Notre Dame J. Int'l Comp. L.. 2018;8:107.
  21. Feleke S, Anteneh D, Pydi B, Satish R, El-Shahat A, Abdelaziz AY. Feasibility and Potential Assessment of Solar Resources: A Case Study in North Shewa Zone, Amhara, Ethiopia. Energies. 2023 Mar 13;16(6):2681. [CrossRef]
  22. Al-Wesabi FN, Almekhlafi MA, Al-Hagery MA, Alamgeer M, Mahmood K, Eltahir MM, Al-Sharafi AM, Amin M. Analysis and assessment of wind energy potential of Al-Hodeidah in Yemen. CMC-Comput Mater Continua. 2021 Jan 1;69(2):1995-2011. [CrossRef]
  23. Yingni J, Xiuling Y, Xiaojun C, Xiaoyun P. Wind potential assessment using the Weibull model at the Inner Mongolia of China. Energy exploration & exploitation. 2006 Jun;24(3):211-21. [CrossRef]
  24. Dayal KK, Cater JE, Kingan MJ, Bellon GD, Sharma RN. Wind resource assessment and energy potential of selected locations in Fiji. Renewable Energy. 2021 Jul 1;172:219-37. [CrossRef]
  25. Hwai LJ, Zambak MF, Nisja I. Assessment of Wind Energy Potential using Weibull Distribution Function as Wind Power Plant in Medan, North Sumatra. International Journal of Simulation--Systems, Science & Technology. 2016 Dec 1;17(41).
  26. Negash T, Möllerström E, Ottermo F. An assessment of wind energy potential for the three topographic regions of eritrea. Energies. 2020 Apr 10;13(7):1846. [CrossRef]
  27. Al-Wesabi, F.N., Almekhlafi, M.A., Al-Hagery, M.A., Alamgeer, M., Mahmood, K., Eltahir, M.M., Al-Sharafi, A.M. and Amin, M., 2021. Analysis and assessment of wind energy potential of Al-Hodeidah in Yemen. CMC-Comput Mater Continua, 69(2), pp.1995-2011. [CrossRef]
  28. Gul M, Tai N, Huang W, Nadeem MH, Yu M. Assessment of wind power potential and economic analysis at Hyderabad in Pakistan: Powering to local communities using wind power. Sustainability. 2019 Mar 6;11(5):1391. [CrossRef]
  29. Moghaddasi H, Culp C, Vanegas J, Ehsani M. Net zero energy buildings: variations, clarifications, and requirements in response to the Paris Agreement. Energies. 2021 Jun 23;14(13):3760. [CrossRef]
  30. Wu J, Xiao J, Hou J, Sun W, Li P, Lyu X. A multi-criteria methodology for wind energy resource assessment and development at an intercontinental level: Facing low-carbon energy transition. IET Renewable Power Generation. 2023 Feb;17(2):480-94. [CrossRef]
  31. Holechek JL, Geli HM, Sawalhah MN, Valdez R. A global assessment: can renewable energy replace fossil fuels by 2050?. Sustainability. 2022 Apr 16;14(8):4792. [CrossRef]
  32. Barthelmie RJ, Pryor SC. Climate change mitigation potential of wind energy. Climate. 2021 Aug 28;9(9):136. [CrossRef]
  33. Olabi AG, Obaideen K, Abdelkareem MA, AlMallahi MN, Shehata N, Alami AH, Mdallal A, Hassan AA, Sayed ET. Wind Energy Contribution to the Sustainable Development Goals: Case Study on London Array. Sustainability. 2023 Mar 6;15(5):4641. [CrossRef]
  34. Suman, A. Role of renewable energy technologies in climate change adaptation and mitigation: A brief review from Nepal. Renewable and Sustainable Energy Reviews. 2021 Nov 1;151:111524. [CrossRef]
  35. Kaya, M. N., & Köse, F. (2016). Wind power plants for low rated wind speed regions: feasibility analysis and simulation of a system. [CrossRef]
  36. Attabo, A. A., Ajayi, O. O., Oyedepo, S. O., & Afolalu, S. A. (2023). Assessment of the wind energy potential and economic viability of selected sites along Nigeria's coastal and offshore locations. Frontiers in Energy Research, 11, 1186095. [CrossRef]
  37. Feleke, S., Satish, R., Pydi, B., Anteneh, D., Abdelaziz, A. Y., & El-Shahat, A. (2023). Damping of Frequency and Power System Oscillations with DFIG Wind Turbine and DE Optimization. Sustainability, 15(6), 4751. [CrossRef]
  38. Şen, Z., Altunkaynak, A. and Erdik, T., 2012. Wind velocity vertical extrapolation by extended power law. Advances in meteorology, 2012. [CrossRef]
  39. https://www.engineeringtoolbox.com/standard-atmosphere-d_604.html.
  40. https://power.larc.nasa.gov/data-access-viewer.
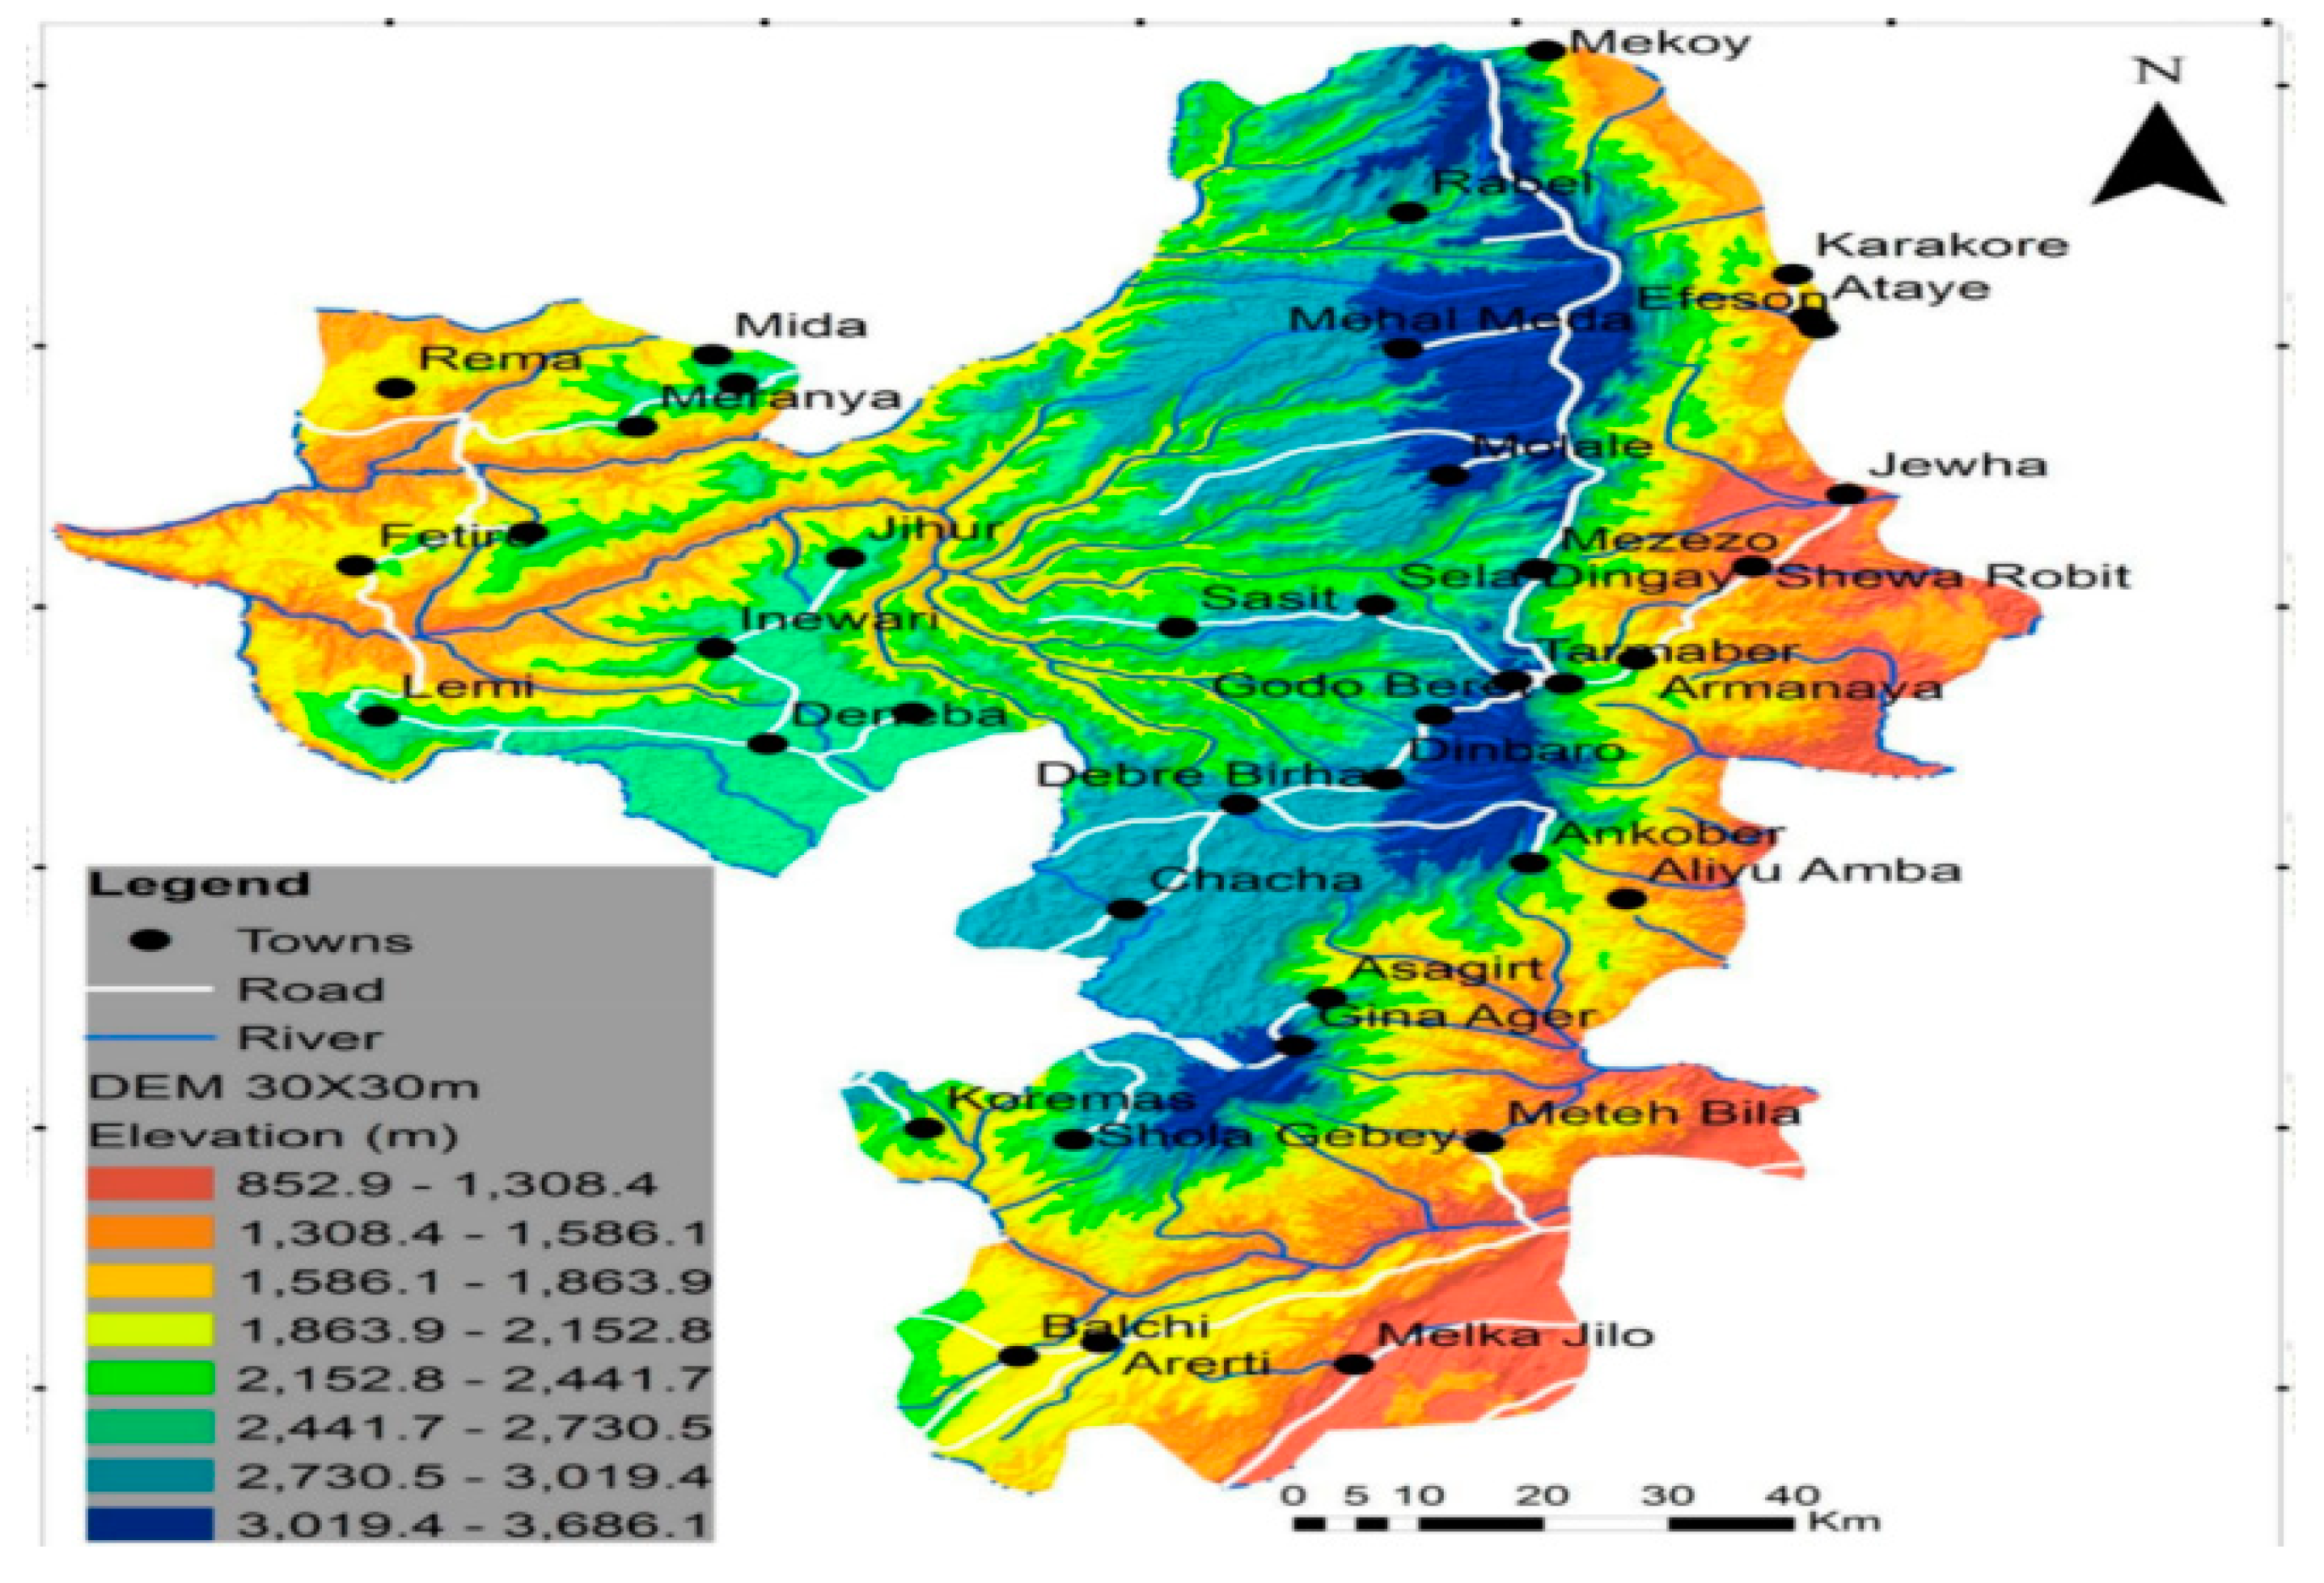
Figure 1. Geographical map of North Shewa Zone.
Preprints 106279 g001
Figure 2. Wind speed assessment using NMA data at different heights.
Preprints 106279 g002
Figure 3. Wind speed assessment of the zone using NMA and NASA data at 10 meter [40].
Preprints 106279 g003
Figure 4. Wind direction of different sites in North ShewaZone at 10 meter height (a) AlemKetema (b) DebreBerhan (c) Eneware (d) GundeMeskel (e) Majete and (f) MehalMeda,.
Preprints 106279 g004
Figure 5. The annual wind class frequency distribution in North Shewa Zone at 10 meter height (a) AlemKetema (b) DebreBerhan (c) Eneware (d) GundeMeskel (e) Majete and (f) MehalMeda.
Preprints 106279 g005aPreprints 106279 g005b
Figure 6. Wind speed extrapolation at different height.
Preprints 106279 g006
Figure 7. Best Wind Power density assessment and comparison.
Preprints 106279 g007
Figure 8. Low Wind Power density assessment and comparison.
Preprints 106279 g008
Figure 9. Wind turbine power characteristics of DebreBerhan at 10 meter height.
Preprints 106279 g009
Figure 10. Wind turbine power characteristics of DebreBerhan at 50 meter height.
Preprints 106279 g010
Figure 11. Wind turbine power characteristics of Eneware at 10 meter height.
Preprints 106279 g011
Figure 12. Wind turbine power characteristics of Eneware at 50 meter height.
Preprints 106279 g012
Figure 13. Wind turbine power characteristics of MehalMeda at 10 meter height.
Preprints 106279 g013
Figure 14. Wind turbine power characteristics of MehalMeda at 50 meter height.
Preprints 106279 g014
Table 1. Wind speed m/s assessment of North Shewa at 10 meter height.
Name year Jan Feb Mar Apr May Jun Jul Aug Sep Oct Nov Dec
AlemKetema 2015 1.9448 1.4875 1.9241 1.6125 1.3290 1.3250 1.4188 1.3871 1.9907 1.5935 1.4313 1.4313
2016 1.3600 1.5933 1.6256 1.4516 1.9313 2.3742 1.4000 1.4250 1.4645 1.7313 1.7355 1.5000
2017 1.9448 1.4875 1.9241 1.6125 1.6968 1.9063 1.8839 1.5750 1.6750 1.6581 1.4938 1.5125
2018 1.3250 1.3484 1.6250 1.4774 1.1500 1.2317 1.6367 1.8278 1.6141 1.1875 1.4875 1.9241
2019 1.4108 1.3239 1.4772 1.5478 1.5444 1.3804 1.6250 1.4774 1.1500 1.6968 1.9063 1.8839
DebreBerhan 2015 2.9063 3.2261 3.9194 3.0581 3.5329 3.2120 2.5813 2.3313 2.7806 3.3125 3.2258 3.4688
2016 3.2073 3.2067 3.0375 2.4000 3.0125 3.1226 2.1000 2.1750 2.5897 2.7938 3.6129 3.6149
2017 3.1201 3.2101 2.8750 3.0014 2.0500 3.0146 2.7541 2.0160 3.1040 3.2140 3.5850 3.5230
2018 3.6452 3.2250 3.3310 3.4375 2.2968 3.2438 2.6387 2.4125 2.2563 3.1290 2.9313 3.3871
2019 3.3787 3.2662 3.4798 3.1432 3.0433 3.2236 2.5066 2.3891 2.6631 3.0250 4.2387 5.2688
Eneware 2015 4.2563 4.6276 4.7313 4.9677 4.5688 4.0581 3.7313 3.0250 4.2387 5.2688 5.0645 5.0909
2016 4.3438 4.9333 4.5563 4.1355 4.2188 4.9806 3.1938 3.2625 4.0129 5.6125 5.4839 4.8000
2017 6.5097 5.0645 5.0909 4.7313 4.9677 4.5688 4.0581 3.7313 3.0250 4.2387 3.4375 2.2968
2018 5.3063 4.7063 5.6828 5.4938 5.3097 6.7688 3.5355 3.5750 3.0875 5.2387 6.3871 5.5806
2019 6.6250 6.2759 5.5813 5.2194 6.9813 4.8645 3.6688 5.3063 4.7063 5.6828 5.4938 5.3097
Gundemeskel 2015 1.2625 1.6414 1.8438 2.0839 2.1313 1.9161 1.6813 1.7875 1.9806 3.1688 2.1097 2.0750
2016 1.7375 2.2733 2.6375 2.2903 2.2625 2.2516 1.7563 1.6625 2.0258 2.3313 1.7875 1.9806
2017 1.6000 2.1000 2.1200 2.4000 2.2000 2.0000 1.2000 1.7000 2.6000 1.8000 2.3000 2.0258
2018 3.4813 3.1548 4.0442 2.6387 2.2750 2.1938 3.0581 3.9313 2.9419 2.7250 1.7875 1.9806
2019 2.8375 2.7793 3.1625 2.7613 3.5714 2.7032 2.1938 2.2903 2.2625 2.2516 1.7563 1.6625
Majete 2015 1.0000 1.6483 1.1750 1.6000 1.2125 1.4194 1.7125 1.4500 1.3097 1.1500 1.7875 1.9806
2016 0.7750 1.2467 1.7750 1.2774 0.8688 1.1613 0.7438 1.1313 0.9517 1.2500 1.3742 1.4452
2017 1.1000 0.9000 1.1000 1.1000 1.2000 1.1000 1.6000 0.7000 1.3000 0.7000 1.3000 1.7000
2018 0.4063 0.7172 0.5125 0.4774 0.6563 0.5935 0.4438 0.4813 0.5750 0.6194 1.7875 1.9806
2019 0.2500 0.5034 0.7625 0.5161 0.4063 0.7172 0.5125 0.4063 0.7172 0.5125 0.4774 0.4063
Mehalmeda 2015 3.7938 4.7448 5.0688 5.6516 4.9250 4.2258 4.1688 3.7250 6.4000 5.4645 1.7875 1.9806
2016 3.7313 4.7200 4.4688 3.3806 4.6375 4.5742 3.3063 3.7938 4.7448 4.1938 3.9931 3.4938
2017 2.4000 1.8000 2.2000 2.9000 2.3000 2.1000 1.4000 1.7000 1.6000 2.1000 5.5290 5.6750
2018 4.3688 4.8966 5.2938 4.5935 4.6313 4.2710 3.3313 3.4750 5.5290 5.6750 5.1161 4.8125
2019 5.5563 5.1862 4.6063 4.6839 5.8563 5.1742 3.9188 4.5935 4.6313 4.2710 3.3313 3.4750
Disclaimer/Publisher’s Note: The statements, opinions and data contained in all publications are solely those of the individual author(s) and contributor(s) and not of MDPI and/or the editor(s). MDPI and/or the editor(s) disclaim responsibility for any injury to people or property resulting from any ideas, methods, instructions or products referred to in the content.
Copyright: This open access article is published under a Creative Commons CC BY 4.0 license, which permit the free download, distribution, and reuse, provided that the author and preprint are cited in any reuse.
Prerpints.org logo

Preprints.org is a free preprint server supported by MDPI in Basel, Switzerland.

Subscribe

© 2024 MDPI (Basel, Switzerland) unless otherwise stated