1. Introduction
The problem of studying the adaptation mechanism and strategies for preserving plants in conditions unsuitable for life is relevant during the rapid negative climate change of our planet. The increase in desert zones, soil degradation and rising global temperatures expose most species of higher vascular plants to inhibition of growth and development. Despite this, most woody plants have a complex system of adaptations to unfavourable environmental factors [
1,
2].
One of these arid territories of our planet is the little-studied Mangistau desert zone of Kazakhstan, an area with virtually no sources of fresh water, which is located in one named administrative region near the Caspian Sea with brackish water up to 12.6-13.2 ppm [
3]. This area has an experimental site called the Mangyshlak Experimental Botanical Garden (MEBG) in Aktau on rocky (gypsum) desert soil. The primary scientific mission is to study the processes of adaptation, acclimatisation, and introduction of local and foreign cultural and natural plant species to conditions unsuitable for everyday life [
4].
The harsh conditions of this area lead to a reduction in the biological diversity of woody plants, which negatively affects the state of the ecosystem as a whole. One of the main reasons for this phenomenon is the insufficient justification for the species diversity and range of tree species. However, this theory of plant introduction is carried out by generally accepted methodological approaches to selecting promising plant samples. These approaches include climatic analogues [
5], generic complexes [
6], ecological-historical [
7], fluorogenic relatedness [
8], botanical-geographical [
9], ecological-physiological [
10], and recommended practices implementation of long-term forecasting [
11,
12].
We also considered drought resistance to be the leading environmental indicator of tree plantations in the Mangistau desert despite the intensity of transpiration. The issue of physiological restoration of water is very relevant. Under limited soil moisture conditions, maximising plant productivity comes down to the simultaneous optimisation of solar radiation absorption and water consumption through transpiration. The amount of water a plant evaporates is often more significant than the amount of water it contains. At the same time, economical water consumption is one of the most acute problems of phytointroduction in arid regions. Indeed, at normal levels, transpiration is not necessary. So, if plants grow in low and high soil moisture conditions, then transpiration occurs with much less intensity in the first case. However, plant growth in a specific humidity range should be approximately the same (within the limits of statistical error). Thus, it is necessary to find the best option by selecting a specific assortment and adjusting the watering regime. Moreover, transpiration is an essential physiological process for plant organisms. This is vital as a defence mechanism to keep the leaves from overheating in direct sunlight. It is also the creator of a continuous flow of water and minerals from the root system to other anatomical organs [
13,
14,
15].
Most botanical gardens in the CIS apply those mentioned classical visual methods and approaches to selecting resistant forms adapted to the local conditions of their environment, and classical methods are also aimed at identifying the optimal tool for selecting promising samples. Currently, many scales for determining plant forms are promising for introduction. Most are based on ecological and biological indicators, determined primarily by visual observation and assessed in points. Analysis of the methods available in explantation allows us to judge that a universal scientifically based method of plant introduction, taking into account the integral assessment of taxa and reliable selection for the Mangistau ecological zone, is currently missing [
16].
One of the optimal models for diagnosing and selecting promising plant species and woody forms is to measure the intensity of transpiration, leaf hydration, and the content of chlorophyll A, B and carotenoids in plant parts. The results should be based on fundamental methods for analysing the signs of innovativeness of specific indicators. The analysis requires the creation of local databases using computer analysis and comparisons using traditional rating scales for drought resistance, phytophagy, gas tolerance, salt tolerance, winter hardiness and soil fertility. Various restoration methods give a general picture of plant resistance to different conditions [
17].
The most important types of sustainability can be classified as reflected by the influence of factors from inside and outside. Drought resistance is one of the principal abiotic stresses that causes a decrease in plant health. Increasing drought tolerance under drought stress is a significant goal of activity introductions as it is critical for environmental safety [
18]. Also, plants exposed to salt stress change their environment. The ability of plants to detoxify radicals under salt stress is probably the most essential requirement for adaptation to unfavourable conditions [
19]. Conditions of drought and salt in combination create oppression of plants and, in turn, the plant’s resistance to insect attacks and gas resistance decreases. The territory of Mangistau is distinguished not only by hot and dry summer seasons but also by prolonged and severe winters, which require plants to be winter-hardy. Harsh climate factors lead to soil degradation and require plants to resist low soil fertility. External environmental factors activate physiological parameters of variability, which make it possible to obtain an informative response to specific external catalysts [
20,
21].
The leading informative physiological indicators of plant state are the indicators of vegetative green leaves. The main transpiring organ in plants is the leaf. One can judge plants ‘ adaptation to environmental conditions based on the leaf moisture content and the percentage of its loss during transpiration. Detecting the intensity of transpiration in higher vascular plants has positive results. Transpiration highly depends on soil moisture and leaves’ closely related water content. Several authors have experimentally confirmed this. As soil moisture decreases, the level of transpiration decreases. The less water in the soil, the weaker the watering of plants. Reducing water content in the plant regime automatically reduces transpiration due to stomatal and extrastriatal regulation. We are interested in their ability to adapt to climate change [
22].
Another primary physiological indicator of plants is the amount of water retained in various parts of the plant. The amount of water balance is not uniform and depends on multiple factors. As is already known, some plant species do not respond to increased salinity with changes in tissue water content, at least at moderate salinity, and only mild effects on plant growth are observed. Still, organ specificity must be taken into account. On the other hand, if water content changes under the influence of salinity, then it can be either increased or decreased. These variable indicators can be considered to assess plants’ condition and adaptability to environmental conditions [
23].
A pronounced ultra-arid climate, waterlessness, poverty of local flora, increased soil salinity, low fertility, and a thin profile of zonal brown soils characterise the Mangistau desert. Thus, for the Mangystau region, the introduction of diagnostics mainly considers plant drought resistance, heat resistance, salt tolerance, and requirements for soil fertility. On the contrary, in Eastern Kazakhstan, the main limiting factors are a short frost-free period, recurrent spring frosts and low winter temperatures. Therefore, winter hardiness and frost resistance are the dominant indicators of the prospects for introduction [
24,
25,
26].
It should also be noted that when diagnosing adaptability, biophysical and other physiological properties occurring in plants—for example, the content of chlorophyll of groups A and B, as well as various carotenoids—are necessary. There is a proven connection with plant health, such as chlorophyll fluorescence, chlorophyll content, calcium, and nitrogen. One frequently used variable that gives satisfactory results is the chlorophyll content of the leaves. This is due to the high correlation between chlorophyll content and plant condition [
27,
28].
Plant leaves also contain a particularly informative group of objects, such as carotenoids. Carotenoids are natural organic pigments synthesised by higher plants that produce yellow, orange or red colours. They play an essential role in the light-harvesting complex and photoprotection of photosystems. Several studies have shown that these compounds protect the photosynthetic apparatus from photodamage by interconverting xanthophyll molecules. Therefore, indirect, non-destructive quantitative determination of the total amount of carotenoids is of great importance for relevant studies on the state of plants under various conditions [
29].
The obtained diverse data in aggregate can be analysed as comprehensive. Creating local databases plays an essential role in this process, accumulating data and forming forecasts for the near future [
30]. The main goal of this study is to develop and test a universal scale for assessing potentially suitable plant species and forms for arid conditions using physiological, visual and computer analysis methods. The results of this study will help to identify the possibilities of using physiological indicators of the growth and development of woody plants as markers of their tolerance to the arid conditions of the Mangistau desert.
2. Study Area
The research area is located on the eastern coast of the Caspian Sea, at the junction of the northern and southern desert subzones within 42-46 degrees north latitude and 50-54 degrees east longitude. It is administratively part of the Mangist-u region. The study area is a desert vegetation zone with a sharply continental climate, little snowy winters, and long, hot summers. The climate is sharply continental and extremely dry. Summer temperatures can reach + 43-45 °C; in winter, the average temperature in January, the coldest month, is -5, -8 °C in the north and -1, -4 °C in the south of the territory. In some of the coldest winters, frosts reach -38 °C. Frequent strong winds lead to the spread of hot winds, dust storms, and the removal (pulverisation) of salts from the Caspian Sea. The zonal brown and grey-brown soils of Mangistau are universally saline, often solonetzic, poorly saturated with organic matter and moisture, and closely underlain by dense limestone. Intrazonal soils include takyrs, solonchaks, solonetzes, sands, meadow-brown soils and mountain outcrops. Due to unfavourable natural and climatic conditions, there are no natural tree and shrub plantations in the region that are classified as forests in several structural and genetic characteristics [
31]. The area also experiences an acute deficit of atmospheric moisture (107-180 mm of precipitation per year), poor soil quality (poverty, low profile, increased salinity), strong winds and dust storms. These harsh conditions create significant difficulties in introducing plants, gardening, and phytomelioration [
32]. The natural flora is dominated by annual (268 species or 43.1%) and perennial (247 species or 40%) species. Tree forms are represented by only 100 taxa or 16.2% [
33]. The species diversity of higher vascular plants is relatively sparse.
3. Materials and Methods
3.1. Model of Research Process Organizations
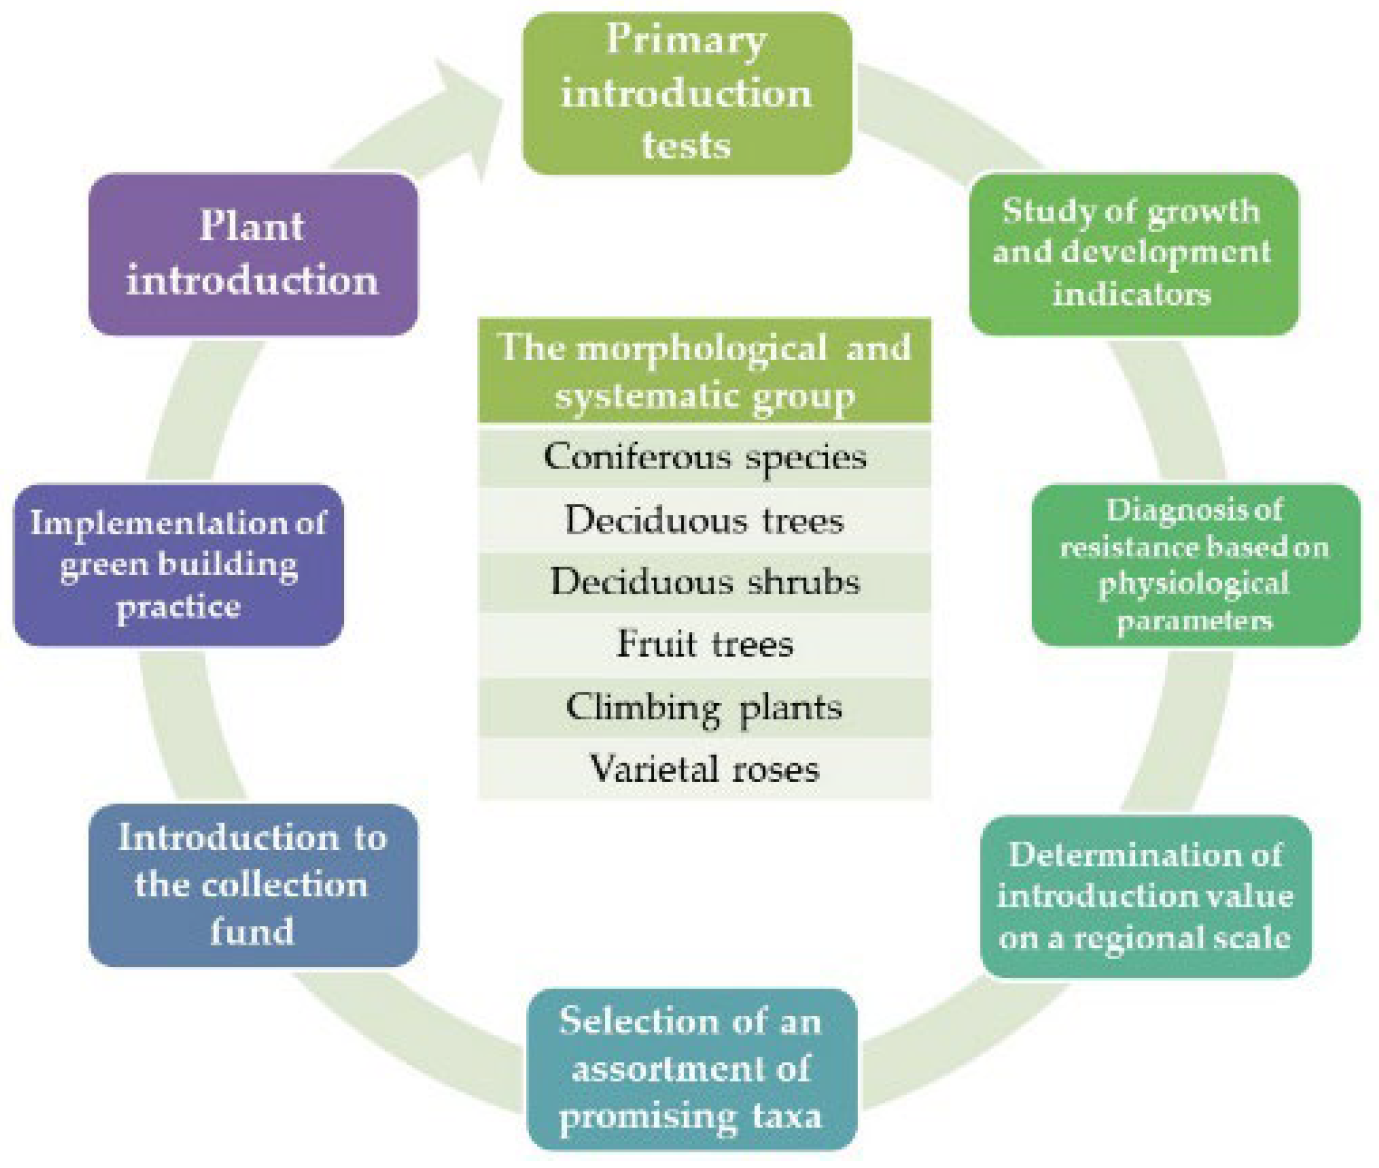
The primary role in the Mangistau desert’s botanical development is the mobilisation of woody plants. The general concept of the study is to use a multi-stage selection of the most optimal samples of woody plants that are more resistant to the environmental conditions of the Mangistau region using physiological parameters and a score assessment of resistance.
Figure 1.
The cycle of conducting research and obtaining optimal introduction samples of woody plants.
Figure 1.
The cycle of conducting research and obtaining optimal introduction samples of woody plants.
The identification of physiological markers of biological resistance of woody plants was carried out in 4 stages: 1) selection of plant resistance indicators from the “DinTseR” program; 2) Compilation of summary matrices of data indicators and physiological isomers of growth and development; 3) correlation analysis and identification of reliable relationships between selected variables; 4) regression analysis of research materials. The research results will contribute to the improvement and implementation of the ecological method of phytointroduction.
3.2. Plant Material
The MEBG collection of woody plant forms was used as plant material. The study involved 128 specimens from various taxonomic groups: 128 species of higher vascular plants from different geographical places of origin. These samples represent 34 families and five subdivisions of taxa. They also represent various specialised morphological groups: 7 - coniferous, 58 - deciduous trees, 49 - deciduous shrubs, 4 - fruit trees, 5 - climbing plants (woody vines) and 5 - varietal roses. A more detailed list of species is presented in
Table 1.
This selection of samples allows testing on a large variable group, which provides for a wide range of predictions. Both natural plant species and cultivated varieties participated in the research, which will help clarify the research as a unique experimental external group.
3.3. Physiological Study of Parameters
Based on literature data and previous studies, the following fundamental methodological and valid physiological indicators of plants were selected: the content of primary pigments in the leaves (chlorophylls A and B, carotenoids), the total water content in the leaves and the intensity of transpiration [
34].
Determination of Water Content in Leaves
The gravimetric diagnostic method was used to determine the total water content in leaves. Reference developed green leaves, without apparent signs of damage and drying, were selected from the upper and lower tiers of the tree crown. Each determination is carried out in 3 repetitions with a mass of raw leaves of at least 5 g. The bottle with plant material is weighed on an analytical balance, placed in a cabinet heated to 105 °C for 4–5 hours, cooled in a desiccator and weighed again. However, 4–5 hours is not enough to remove all the moisture from the plant, so after weighing the bottles, they are opened and placed in a drying cabinet at the same temperature. Then, the bottles cooled in the desiccator are weighed again, which is repeated until the mass of the bottle with the material is constant. The amount of water in the sample is obtained by subtracting the mass of the dried material from the original plant material. The water content is calculated as a percentage of the dry and wet weight of the material, and a conclusion is drawn about the dependence of the water content in the leaves on their location on the plant [
35].
Determination of Transpiration Rate
The rapid weighing method determined the transpiration rate (according to L.A. Ivanov). A simple and relatively accurate method of quick weighing lets you choose the transpiration rate. This method is based on taking into account changes in the mass of the transpiring organ over short periods (up to 5 minutes). This makes it possible to observe transpiration at the state of saturation of the organ with water in which it was on the plant. The interval between weighings should not exceed 5 minutes since, with more prolonged exposure, the water content in the leaf decreases, and the intensity of transpiration decreases.
Reference leaves were used, which were immediately cut off and quickly weighed. After 5 minutes, reweigh the sheet. Experiment with three repetitions. The leaf mass loss between the first and second weighing shows how much water evaporated during this period. Calculate the amount of water evaporated from 1 g of raw leaves in 1 hour [
36].
Contents of Main Pigments
The content of the photosynthetic apparatus’s primary pigments in higher plants’ leaves was determined. Extract pigments and determine their concentration on a spectrophotometer. A sample of plant material (100-200 mg) is crushed with scissors and placed in a small mortar. A little MgCO3 is added to the tip of a scalpel, and 4-5 ml of acetone is added and thoroughly ground. The resulting extract is poured onto a stick in a glass filter inserted into a Bunsen flask. The liquid is sucked out using a pump. After this, add a little more acetone to the mortar, grind it, pour it back onto the filter and suck it off. This operation is repeated several times until the solution from the filter is entirely colourless.
The extract is poured into a volumetric flask, and the Bunsen flask is rinsed several times with small portions of acetone. The extract volume in the volumetric flask is adjusted to the mark with pure acetone. The resulting acetone extract contains a sum of green and yellow pigments.
The concentration of chlorophylls a and b is determined using a spectrophotometer. Part of the resulting extract is poured into a spectrophotometer cuvette to do this. A second cuvette filled with pure solvent is used as a control. The cuvettes are placed in the cuvette chamber of a spectrophotometer, and the optical density D of the extract is determined at wavelengths corresponding to the absorption maxima of chlorophylls a and b in an 80% acetone solution, 663 and 646 nm. To determine the content of carotenoids, the optical density D of the extract is determined at λ = 470 nm [
37].
3.4. Software and Statistical Analysis
Download the leading software for analysing the data obtained; a computer algorithmic software, “DinCeR”, was developed. The main principle is the formation of a database of the studied plants. In addition to diagnosing the introduction value, this database contains the entry and storage of various registration information on taxonomy, location in the collection, distribution areas, morphology, ecology, and herbarium specimens, illustrated with photographs of taxa [
38].
“DInCeR” is a computer program that registers and determines the introduction value of plants in arid regions of Kazakhstan. Scope of application: input and storage in computer memory of various accounting and ecological-biological information about collection species of plants; forecasting their introduction value; compilation of family lists, genera, seed selects, herbarium fund, placement in the Garden, photoprotection status; according to the degree of sustainability, productivity, reproductive capacity, for economic, biological and scientific reasons, etc.; Selection of plants according to given taxonomic, bioecological, decorative and landscaping conditions, printing information and exporting it to different formats for use in external graphic and text editors. Programming languages: Microsoft Visual FoxPro 9 SP2, Visual Basic For Applications 7.0, HTML 4.0 and JavaScript API 2.1. Version: 3.00. The volume of information for each record and database (DB) is 25 - 30 (with pictures and map - up to 150-200) KB. State registration: DInCeR is registered with the Ministry of Justice of the Republic of Kazakhstan. A state certificate of registration of rights to a copyright object No. 2339 dated December 14, 2015 (IS 003261).
Statistical processing of the results was carried out using the Statistics 10 program (StatSoft STATISTICA 10.2011) and the capabilities of the Microsoft Excel 10.1 program. Statistical analysis varies depending on the limits, which vary according to the standard deviation of the coefficient of variation, the mean error, the degree of confidence and the degree of precision. One-way analysis of variance was used to compare the results with significant correlations found between soil type and key plant parameters in the population. When analysing primary data, correlation coefficients were calculated using the R Studio (IDE) statistics program for Windows (R version 3.6.0, 2019). Principal Coordinate Analysis (PCoA) was performed using the Numerical Taxonomy and Multivariate Analysis System version 2.1. (NTSYS-pc) [
39].
3.5. Comprehensive Rating Scale
The studies used a developed scale to assess the complex diagnostics of the introduction value of plants in the arid conditions of Mangistau. Research has covered many plants for resistance to desert habitats and external influences. Drought resistance is awarded from 0 (min) to 15 (max) points; for salt resistance 0 - 10; for winter hardiness 1 - 8; according to soil fertility requirements 0 - 6; for resistance to phytophages 0 - 6; for gas tolerance 1 - 5. A description of the diagnostic scale (stability conditions and assessment points) is given in
Table 2
Regression analysis assessed the validity of this scoring scale for assessing indicators of biological stability, growth, and development. Based on the study, significant indicators were selected (r f> r>cr05 at a significance level of 5%).
4. Results
The main results are presented in the form of tables. The results obtained on physiological parameters were described according to the primary statistical parameters. Basic statistics of physiological parameters are given in
Table 3.
An evaluation was also carried out using the introduction-diagnostic scale. The results are summarised in
Table 4.
The materials for the correlation analysis of the calculated indicators of drought resistance, phytophage and gas resistance, salt resistance, soil fertility, winter hardiness, plant requirements, and their dependent indicators are analysed. The statistical analysis results of physiological indicators of growth and development were correlated with the calculated scores of biological resistance. The obtained correlation results are presented in
Table 5.
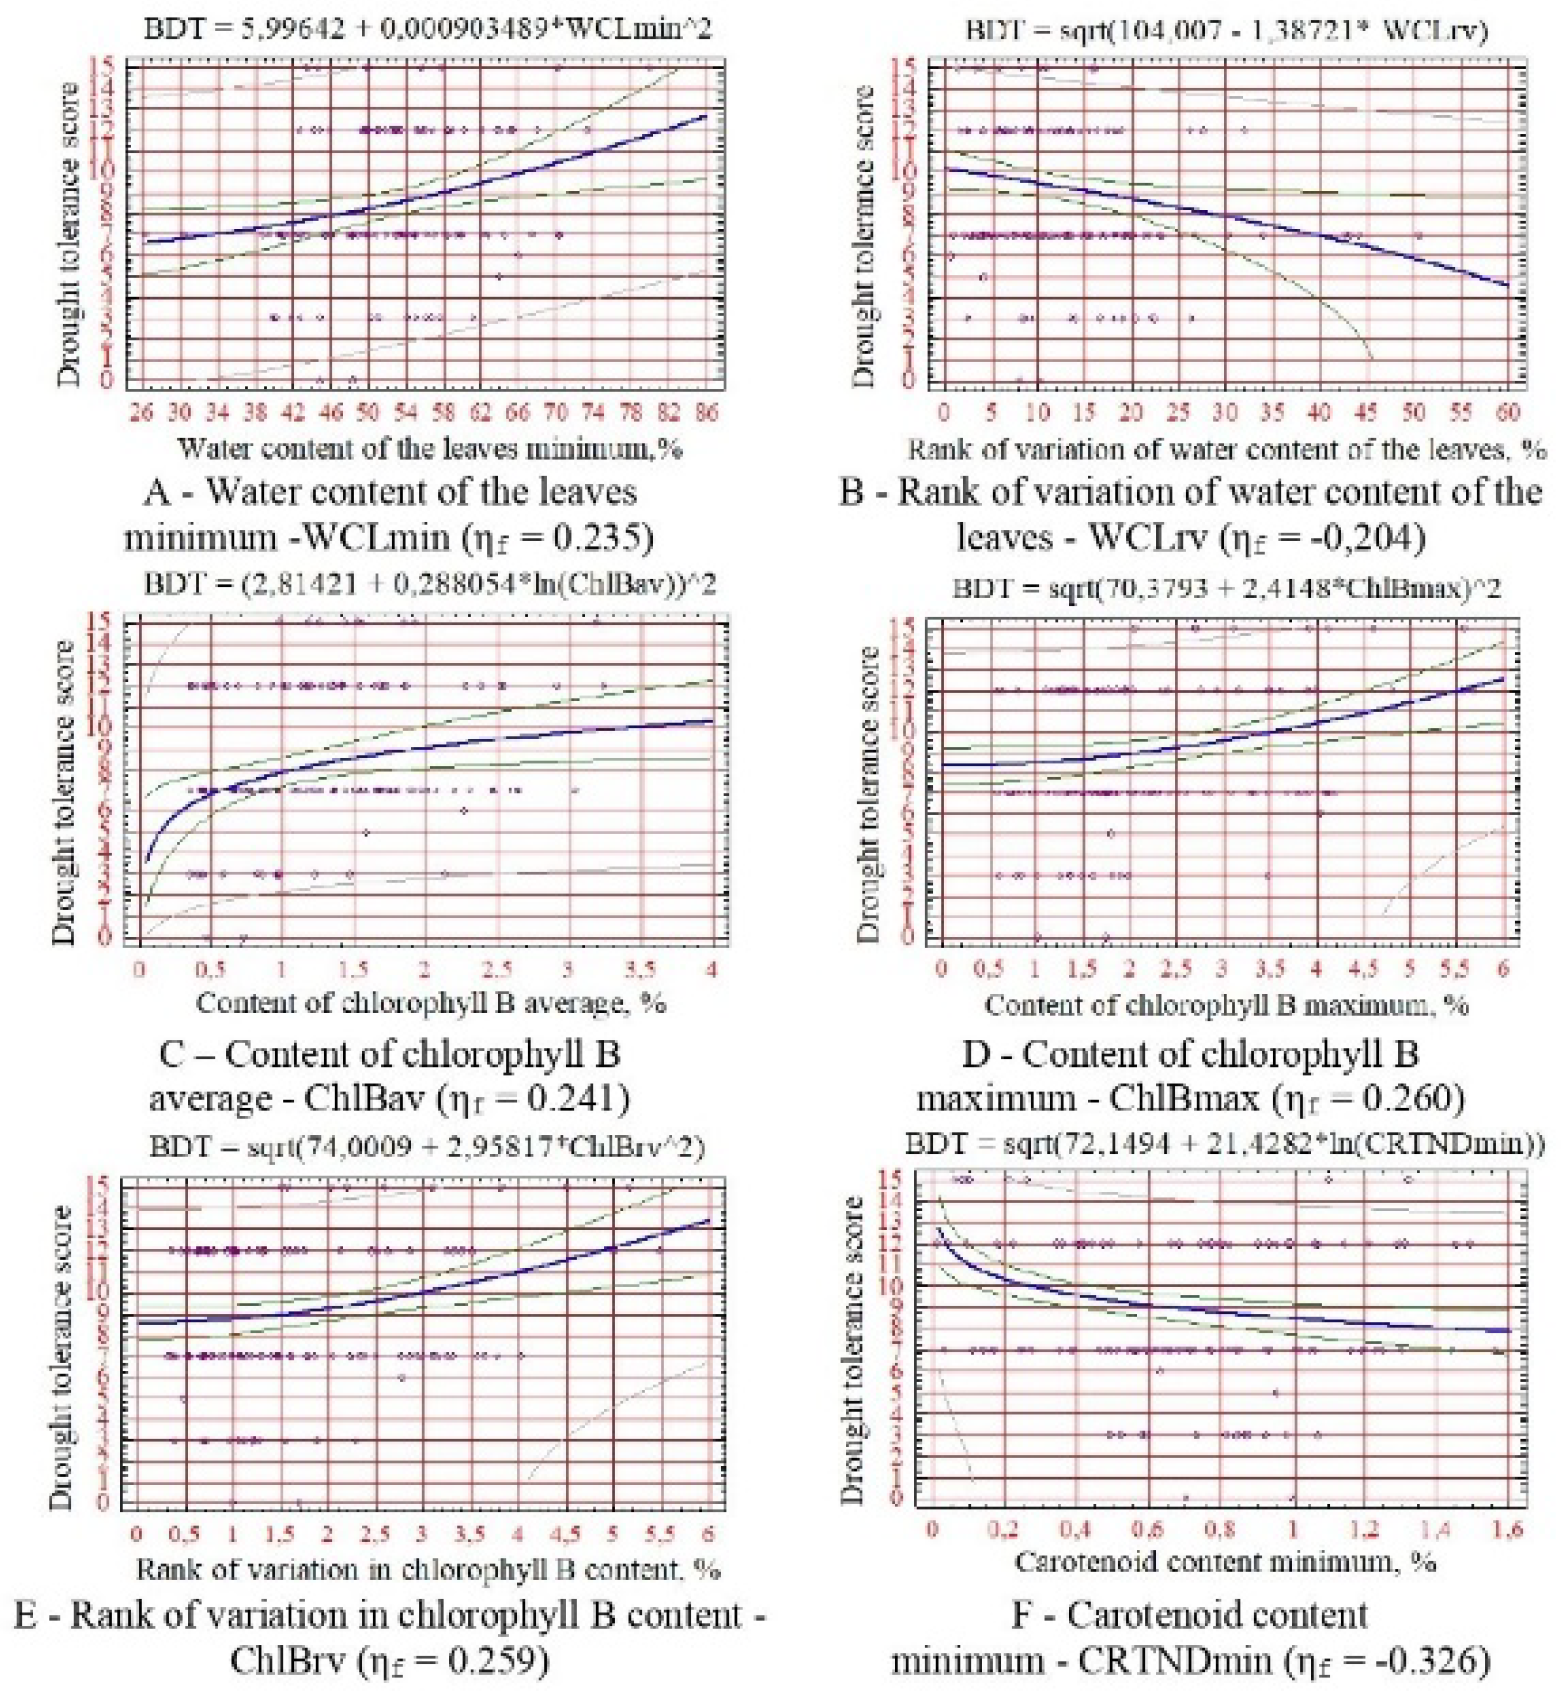
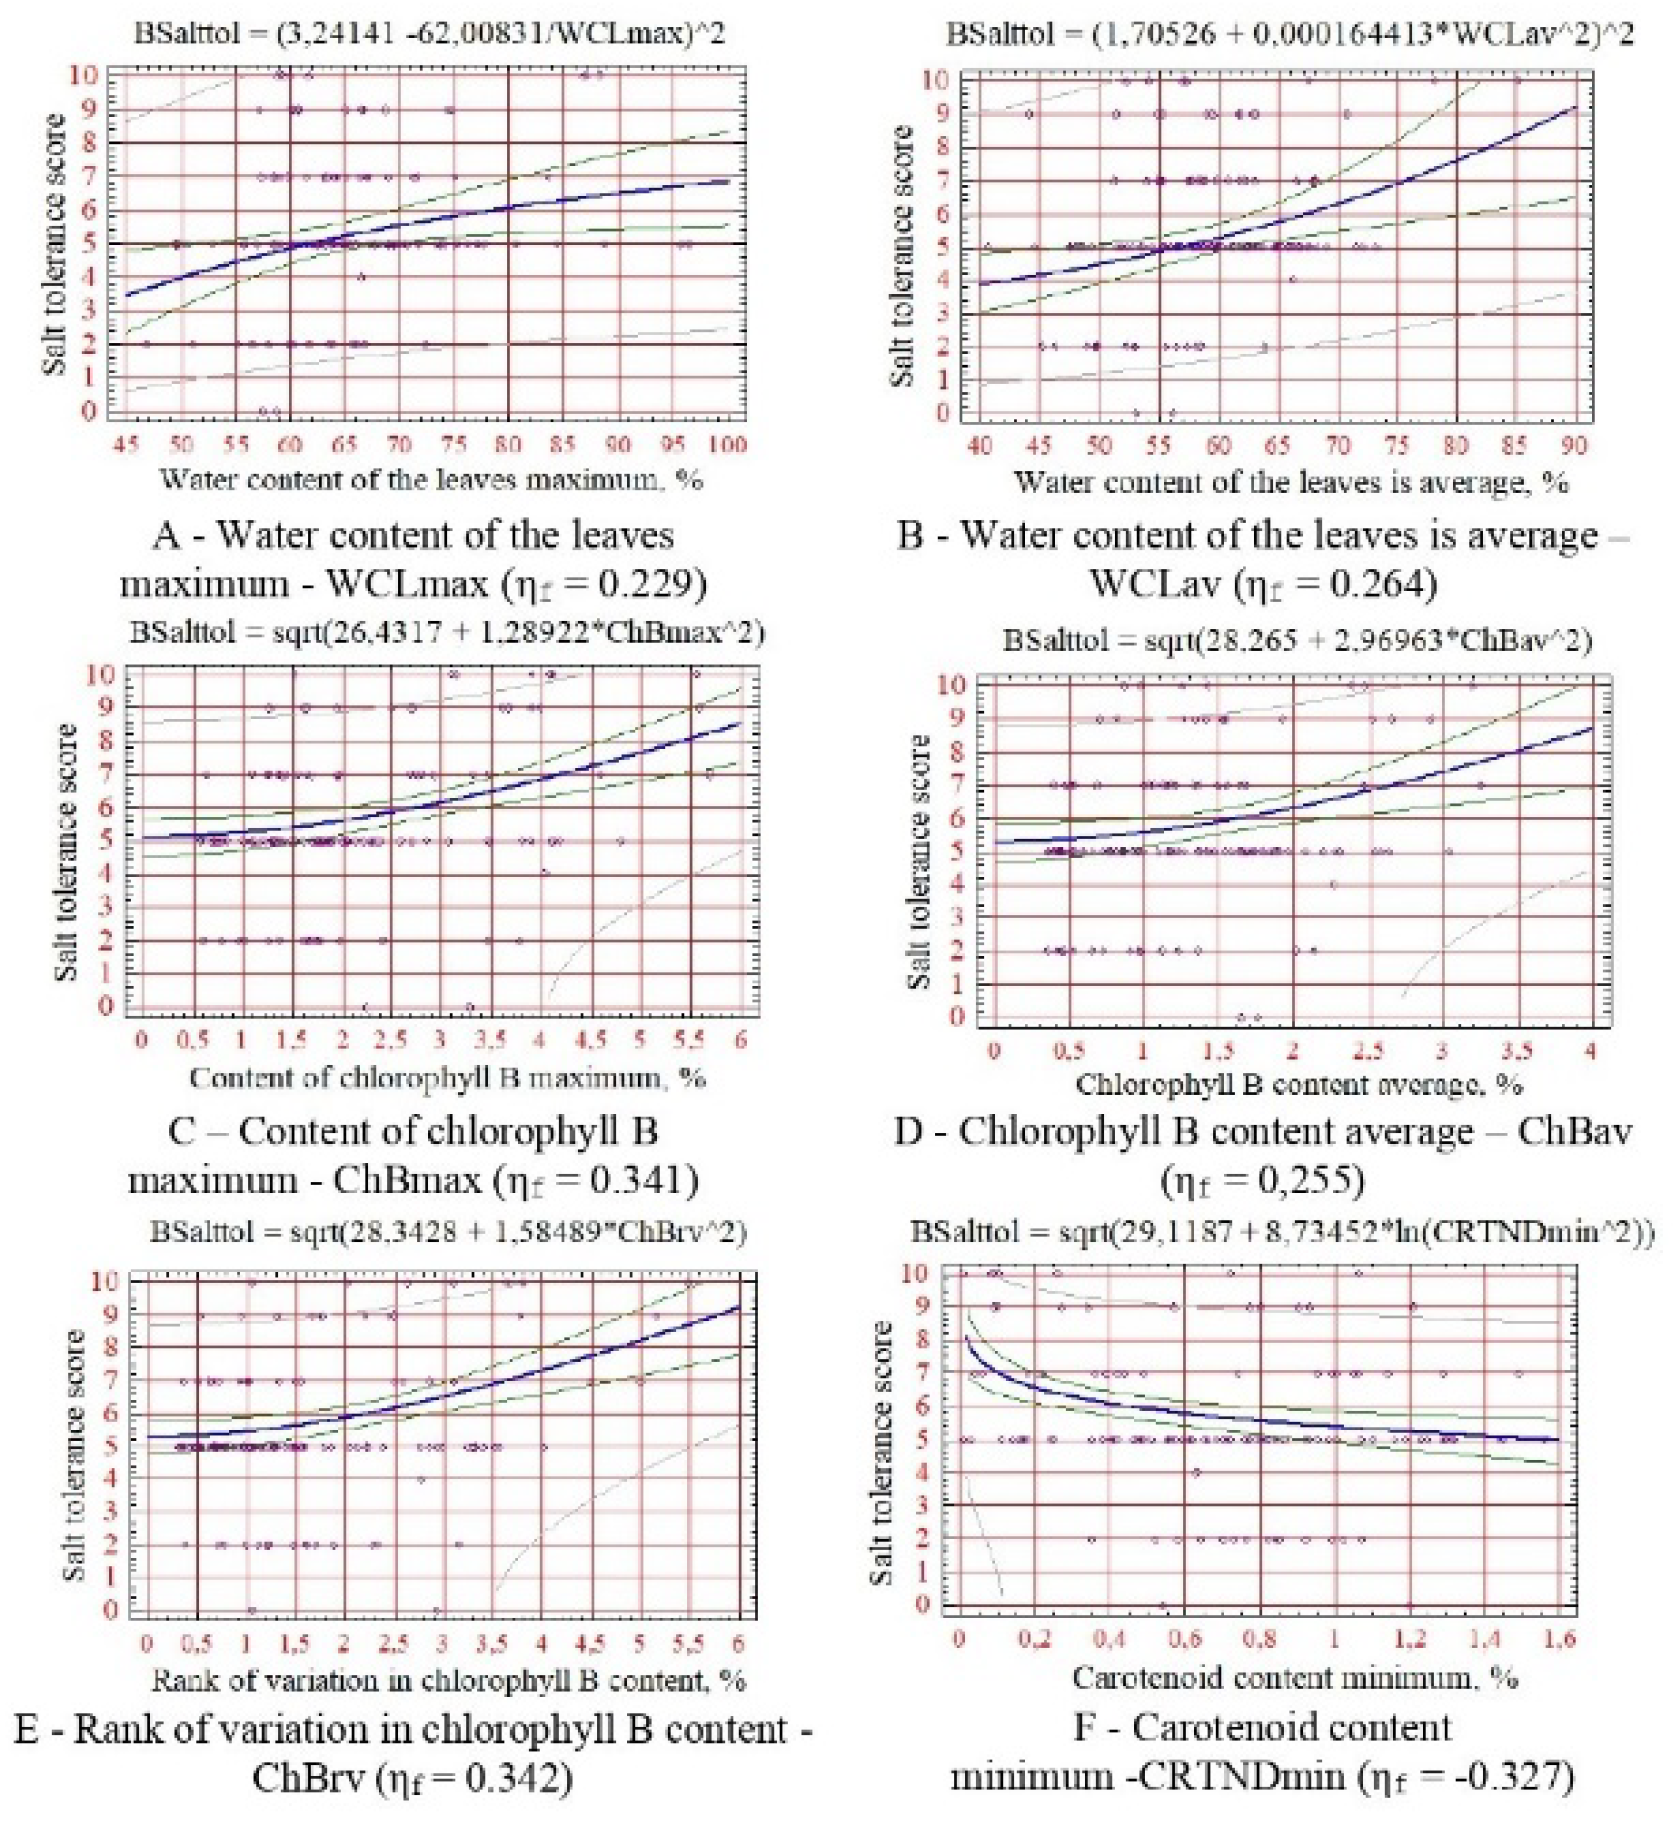
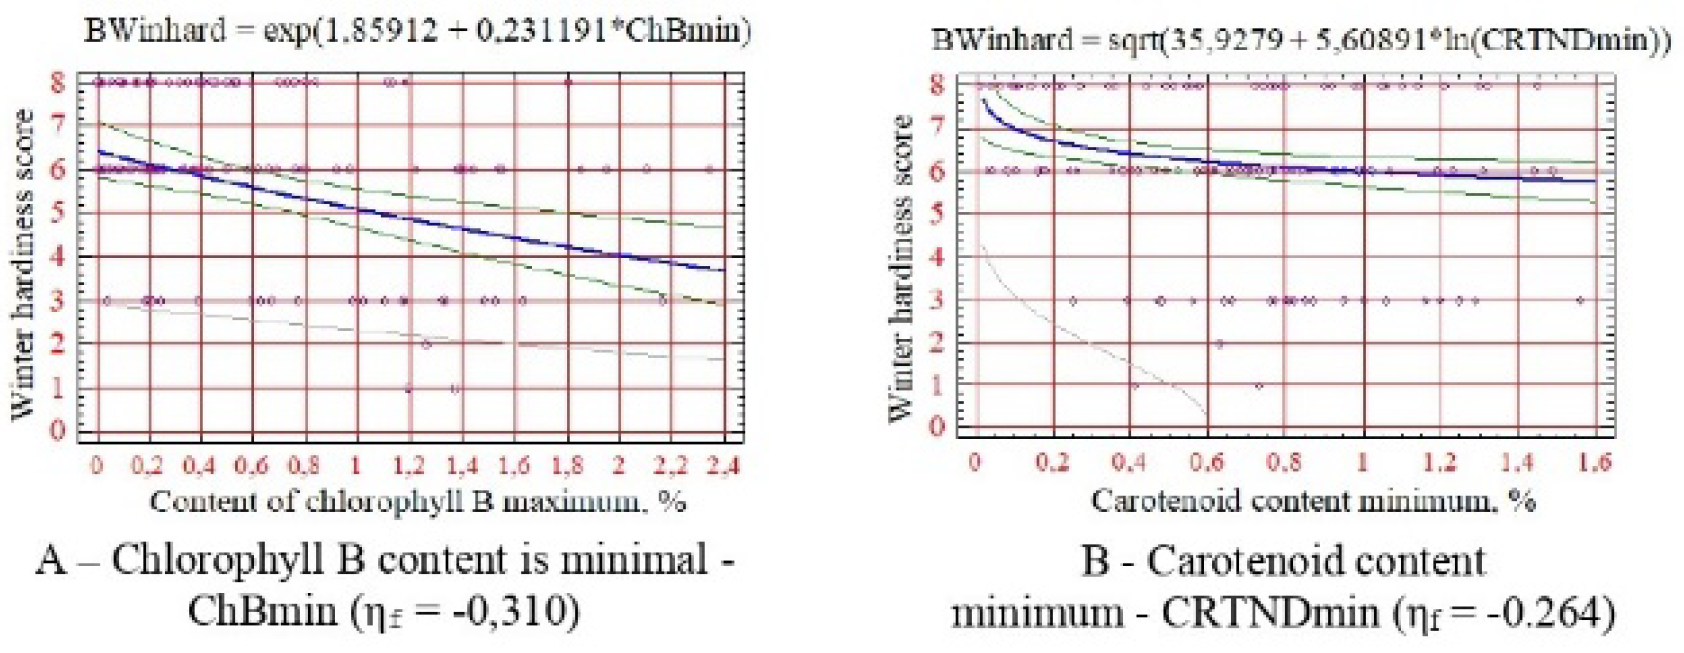
Regression equations are constructed for all significant relationships between the measured indicators of stability and diagnostic indicators of growth and development, and graphs for their prediction are constructed in logarithmic, power, multiplicative, and exponential forms. In the presence of curvilinear formulas, the charts show the values of correlations (ηф), which, in this case, reflect the rigidity of the function’s dependence.
Also, the levelling results were interpreted as a graph predicting the degree of the studied physiological stability. Indicators of drought resistance according to physiological indicators of growth and development of woody plants (ηcr05 = 0.176).
For drought resistance, the minimum and degree of change in leaf hydration, the average, maximum, and degree of change in chlorophyll B content, and the minimum content of carotenoids (
Figure 2).
For salt tolerance - maximum and average leaf hydration, maximum, average and rank variations in the content of chlorophyll B, minimum content of carotenoids (
Figure 3).
For winter hardiness, the minimum content of chlorophyll B and carotenoids is shown (
Figure 4).
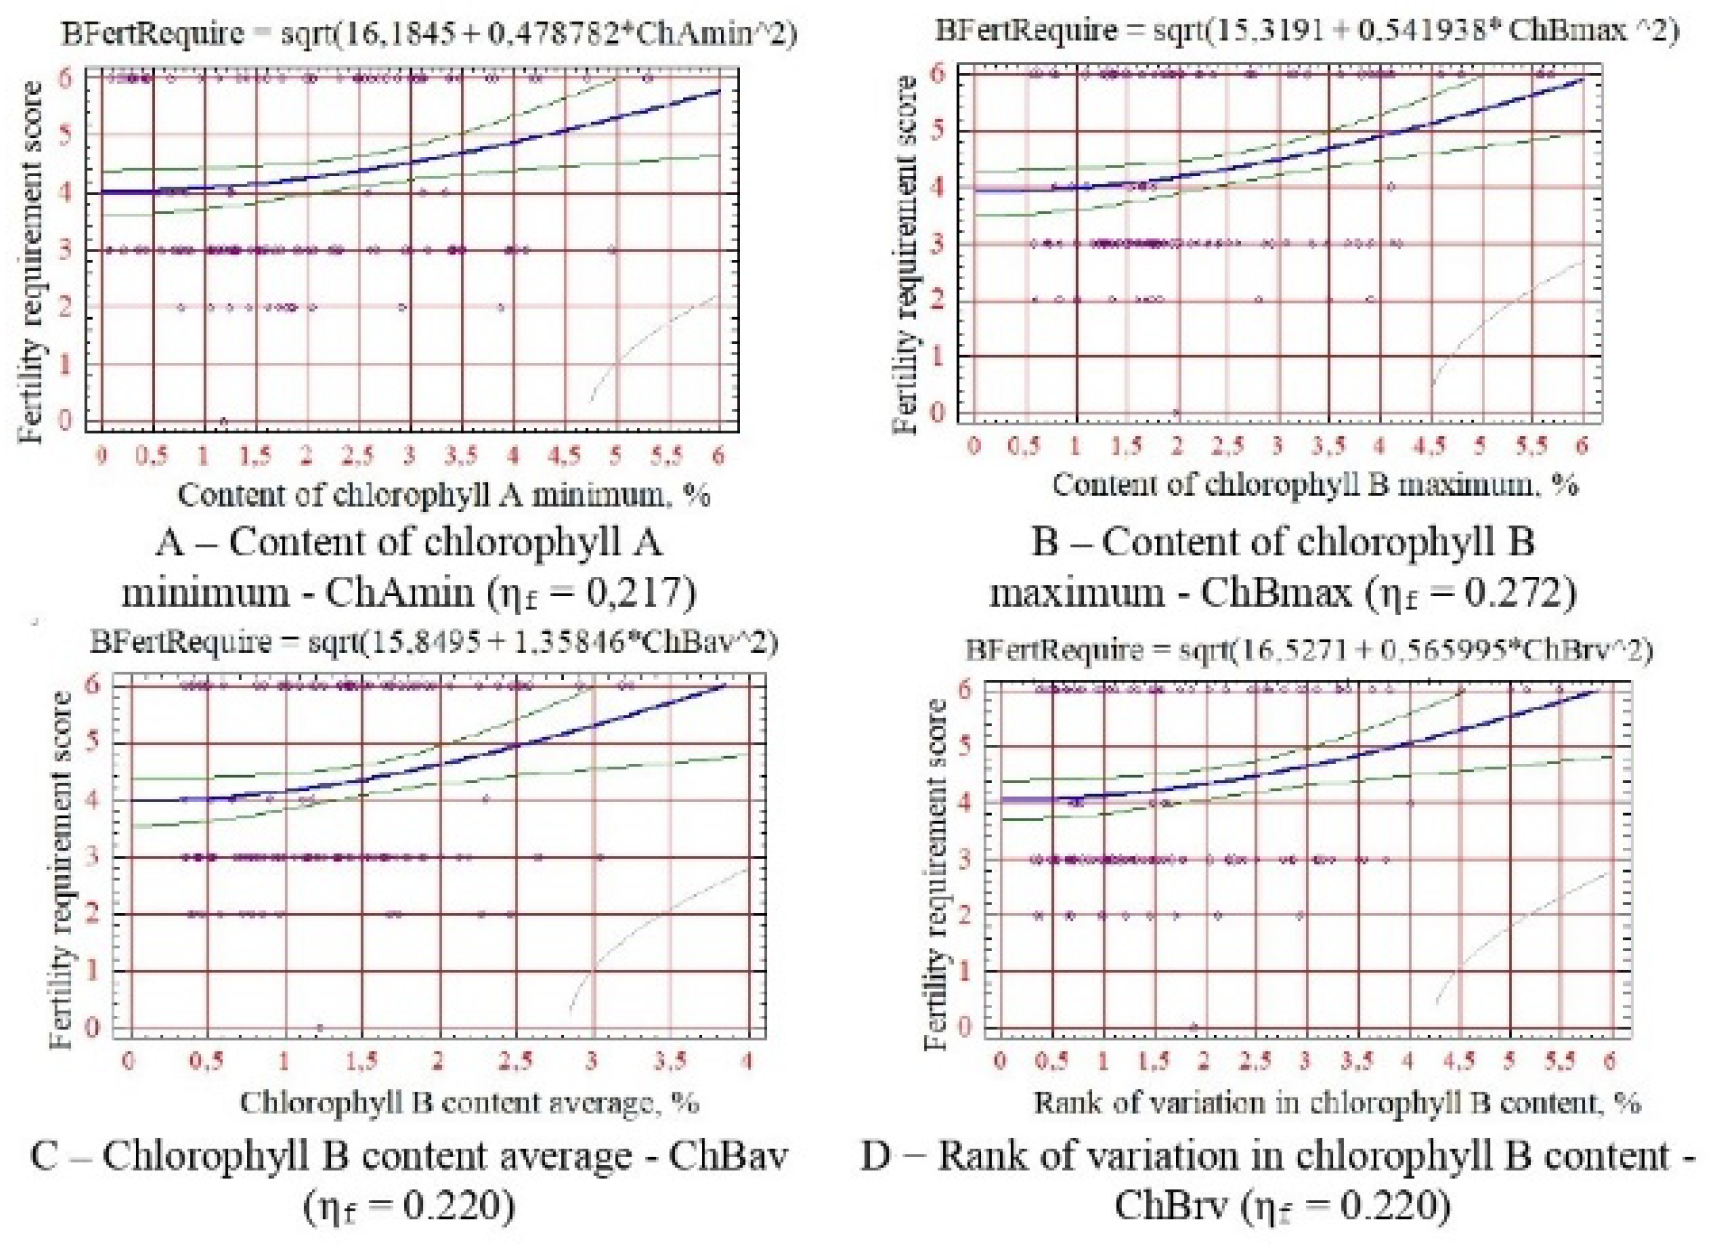
For soil fertility requirements - the minimum content of chlorophyll A, maximum, average and rank of change in chlorophyll B (
Figure 5).
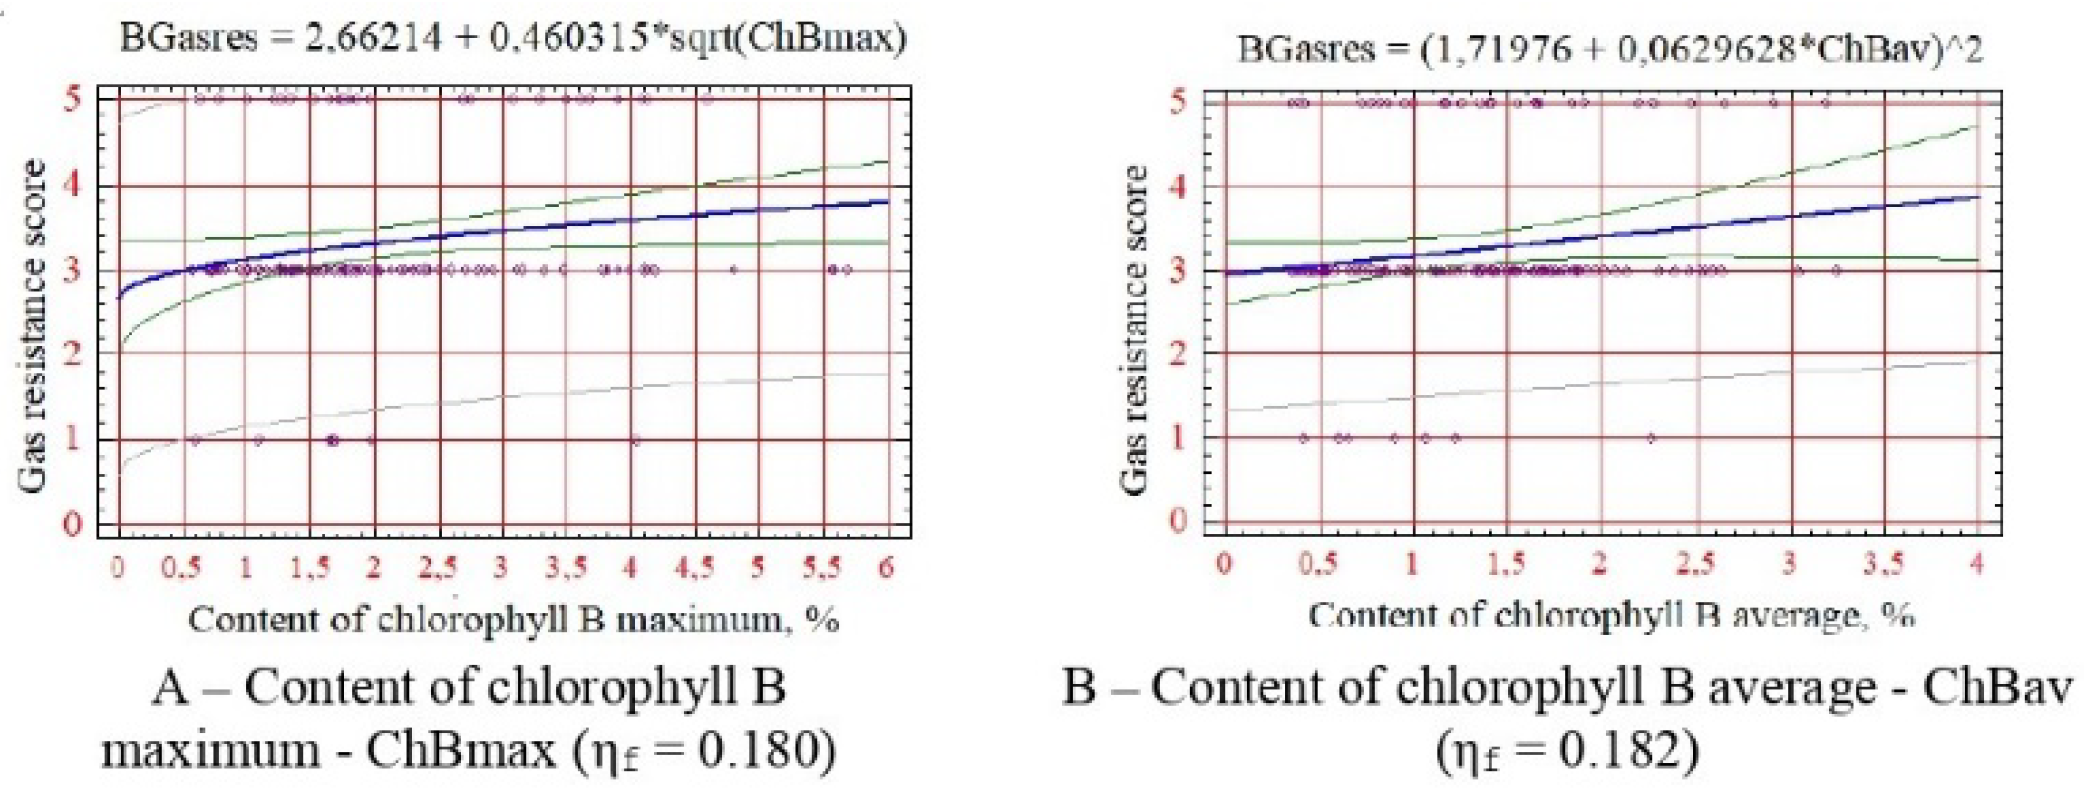
For gas resistance - maximum and average chlorophyll content (
Figure 6).
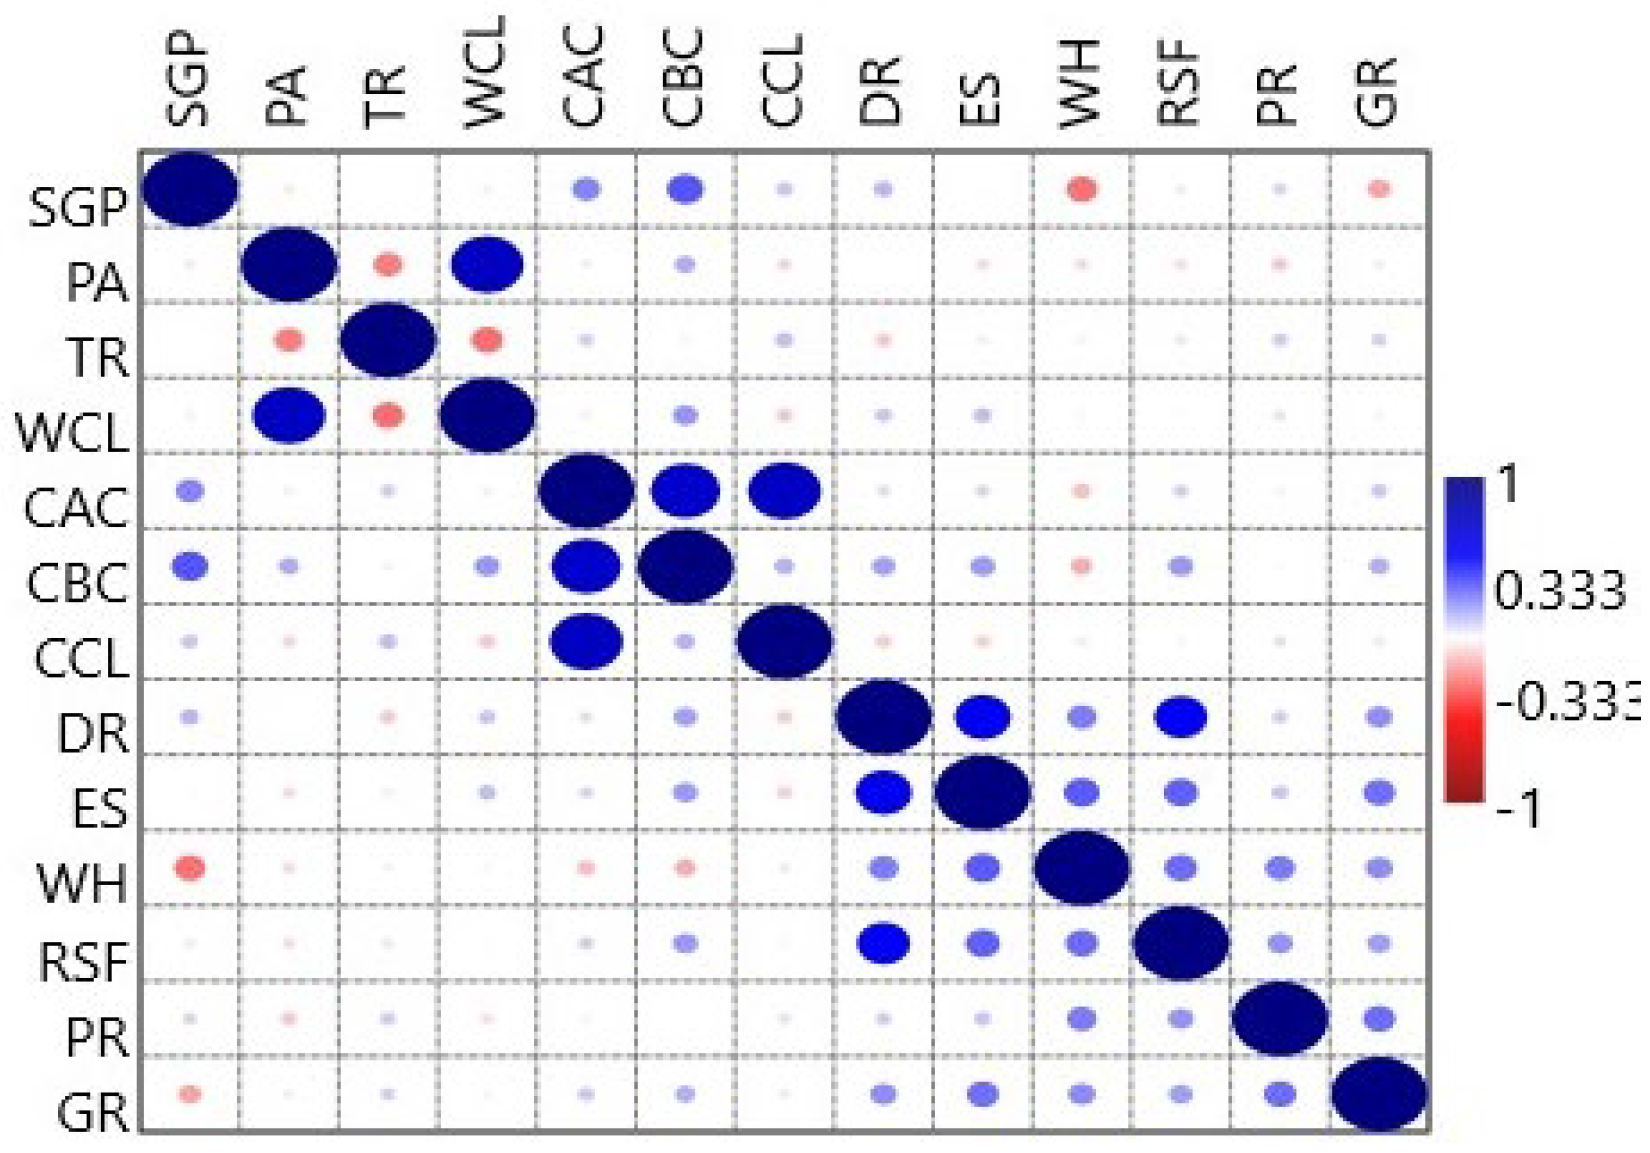
Also, the results obtained on the physiological state of the samples’ woody plants studied, and the scale’s results for assessing physiological resistance were correlated. The results are presented as a correlation matrix in
Figure 7.
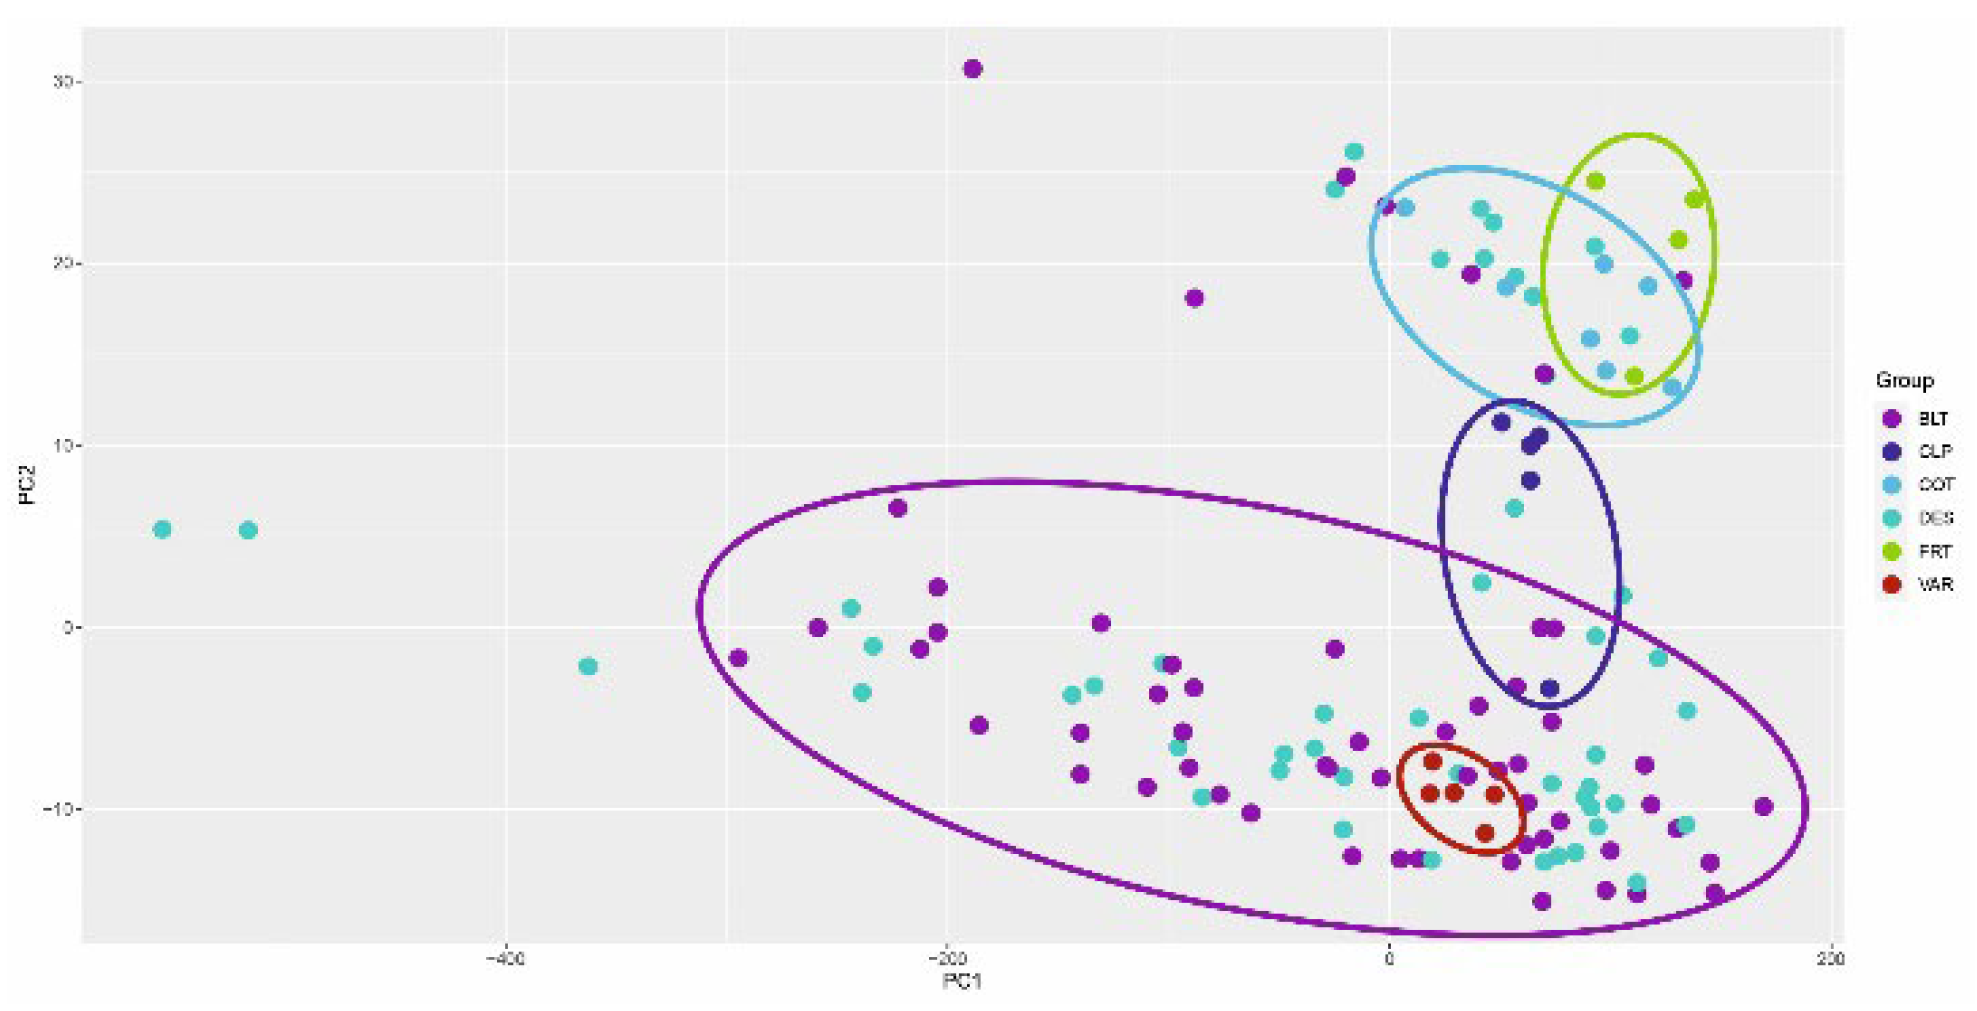
As a result, principal coordinate analysis (PCoA) analysis was applied, revealing sample groups according to morphological and systematic groups in the studied parameters of statistical coordinates. The results are presented in
Figure 8.
The formed groups correspond to the morphological and systematic groups of plants. The diverse results can be interpreted to identify and predict resistant forms of woody plants that are optimal for the region under study. All initial static analysis data are presented in
Appendix A and
Appendix B.
3. Discussion
Decades of experience show that creating collectable green spaces in the desert is complex and time-consuming. Damage and plant death were often observed in the hottest and driest years [
40,
41].
In this case, one cannot mention the author’s words on the trinitarian (material-energy-informational) concept of Bulakh PE [
42]. He argues that when analysing the features of the formation and development of plant introductions in the system of biological sciences, attention is drawn to the lack of a general theory of introduction that establishes logical connections between individual generalisations, hypotheses and laws. The author emphasises the need for a unified conceptual framework for studying the complex self-organising “organism-environment” system.
In many botanical centres in Kazakhstan, plant prospects are forecast based on visual (mainly phenological) observations. This approach gives good results but does not reveal the mechanisms of plant adaptation to unfavourable environmental conditions [
43,
44,
45,
46,
47,
48]. Previous studies of introduced plants’ winter hardiness, water regime, and heat resistance have revealed some features of their adaptive response. Based on the literature, conclusions about plant resistance to abiotic factors were made.
A large group of plant pigments - carotenoids - gives different colours to plants’ vegetative and generative organs. This predetermines their seasonal variability, and at the same time, they are necessary for the plant organism to absorb solar energy [
49]. A phenological feature of the seasonal rhythms of development of introduced plants in the Mangystau region is very late colouring and leaf fall, which is a peculiar reaction to the nature of the weather conditions of the desert zone. Therefore, the concentration of carotenoids in leaves, especially xanthophylls, can be a reliable marker of some diagnostic traits of plant biological resistance.
The diverse results are confirmed by generally accepted concepts published in various scientific works. The calculated correlation coefficients have a very low value for all diagnostic signs of stability (0.009-0.299) in absolute numerical terms. Therefore, the significant proximity of the relationship was identified by comparing the actual (r f) and critical (r cr05) values of the correlation coefficients; r f should be greater than r cr05 [
50,
51].
No reliable regression equations with physiological indicators have been found for calculated indicators of phytophage resistance associated with the presence or absence of introduced pathogenic fauna and microflora in the introduction zone or genetically determined plant resistance to them [
52].
As can be seen from the obtained dependencies (
Figure 2,
Figure 3,
Figure 4,
Figure 5 and
Figure 6), no diagnostic sign of biological resistance can be attributed to the criterion of resistance of woody plants. This is due to the transpiration process’s significant variability and multifactorial intensity. At the same time, a reasonably close dependence on the water content in the leaves was observed (
Figure 2A,B and
Figure 3A,B). With an increase in the variability of its values, the tolerance of plants to arid habitat conditions usually increases due to an increase in their ability to self-regulate water metabolism and, as a consequence, the salt regime of the leaf apparatus [
53].
An interesting pattern has been revealed: a decrease in the indicators of drought resistance, salt resistance, and winter hardiness of introduced species with an increase in the minimum threshold of carotenoid content (
Figure 2E,
Figure 3E and
Figure 4B). This still confirms their significant adaptive role for plants in the arid conditions of the research region [
54,
55].
Score values of all resistance indicators increase with increasing chlorophyll content in leaves, especially species B (
Figure 2B–D,
Figure 3B–D,
Figure 4A,
Figure 5A–D and
Figure 6A,B), which is due to stimulation of photosynthetic activity and increase in the water-holding capacity of leaf tissues.
The introduction value of the experimental plants varied in the range of 33-86, and the value class from 4 (“low”) to 9 (“very high”). A significant role in introducing plants is given to studying the adaptive abilities of introduced species in the introduction zone. Important indicators of adaptive response in the Mangistau desert are the intensity of transpiration, leaf hydration, and the concentration of chlorophyll and carotenoids. Therefore, in our studies, these physiological indicators were the main ones in determining the biological stability of woody and ornamental introduced plants. Moreover, these physiological indicators were determined in the driest and hottest months of the growing season - from June to September.
The values of the studied physiological indicators differ significantly in a seasonal aspect and within the sample for all experimental plants (
Table 4). Thus, the transpiration rate varies from 14 to 1519 mg/g fresh weight of leaves per hour, the water content in the leaves from 26.3 to 96.4%, the content of chlorophylls A and B, carotenoids from 0.06 to 5.76; from 0.00 to 5.68 and from 0.01 to 2.44% on fresh leaf weight, respectively. The coefficient of variation of some physiological parameters reaches very high values - 51.7-52.2%. This is due to the inclusion of taxa in the sample of various growth forms, geographic origin, and ecological and biological properties. At the same time, this fact already indirectly confirms a close connection between the selected isomers and the indicators of plant resistance and their adaptive capabilities in the arid conditions of Mangistau. It should also be noted that significant variability did not hurt the accuracy of determining the average values of physiological isomers. In most cases, its value did not exceed the permissible value of 5%.
Similarly, the chlorophyll content in leaves was studied as a physiological indicator. It not only characterises the ontogenetic, age and genetic characteristics of plants but also reflects the reaction of plant organisms to growing conditions. Also, funds are formed about a specific natural and climatic zone in the collecting conditions by observing optimal technologies for growing plants [
56].
The connection between photosynthesis and the water regime is mainly due to the influence of water on the entire complex of plant life processes. Suppression or enhancement of the synthesis of green pigments is noted. The preservation of plant life in the absence of water is closely related to the functioning of pigment systems. Moisture availability is a determining factor affecting the leaf pigment complex. Plants with high drought tolerance lose less water and have more stable chlorophyll. Proteins play a significant role in developing water-retaining forces of tissues; a substantial part of them (especially soluble ones) is concentrated in chloroplasts. Therefore, it can be assumed that chlorophyll strongly affects water retention and its connection with the lipoprotein complex [
57,
58].
Judging by the extensive research materials on the experience of introducing plants in the botanical gardens of Kazakhstan, it is advisable to improve the ecological method. This method should be based on the rules for adaptation of taxa according to biometric, physiological and biochemical indicators of growth and development. It is also essential to correlate meteorological and edaphic factors of new habitats.
The above features served as the basis for the MEBG development in 2013-2015 of a regional comprehensive diagnostic scale of introduction significance. This scale includes 24 diagnostic signs, which are divided into four sections (groups): 1) biological stability (6); 2) decorative and household properties (8); 3) reproductive capacity (3); and 4) economic, biological and scientific significance (7). At the same time, the tolerance of introduced species to living conditions consists of their drought resistance, phytophagy, gas resistance, salt tolerance, winter hardiness and demands on soil fertility. Therefore, the estimated parameters are scaled to reduce their significance in forming overall stability [
59].
Our complex regional scale shows a significant spread of assessment scores even for domestic and foreign plants with high biological resistance. This critical conclusion proves its high reliability and compliance with the preliminary opinion of introducers about the value of specific taxa. The distribution of taxa across classes appears nearly symmetrical compared to previously tested scales, relative to the “average” that accounts for 23.9% of plants tested. In summary, the MEBG bioecological approach used for plant introduction assessment at a comprehensive regional scale has shown positive results. The next stage of its improvement was the 2015 translation of a unique software called “DinTseR” into an electronic language. At the same time, during the tests, the problem of ranking the resistance indicators of exotic species into groups and classes was revealed due to the lack of literature data and the extreme complexity of comparative experimental determination for many taxa of the collection gene pool. Therefore, one of the objectives of this study was to identify the most easily diagnosed and reliable physiological indicators of winter hardiness, drought resistance, heat resistance, salt tolerance, and the demands of introducers on soil fertility.
5. Conclusions
Thus, as a result of the study, indicators of the physiological resistance of woody plants to the arid conditions of the Mangistau region were established. The study was carried out in four stages: 1) Development of a computer program DInCeR, including scoring diagnostic signs of biological resistance; 2) Creation of data matrices for data processing; 3) Correlation analysis of the research material; 4) Regression analysis.
The research involved 128 forms of growth and resistance to desert habitats of coniferous, deciduous fruit and creeping woody plants from 34 botanical families. The introduction value of the experimental taxa ranged from 33 to 86 points, and the value class ranged from 4 (low) to 9 (very high).
A significant variation (up to 51.7-52.2%) of all studied physiological parameters was found due to taxa of different geographical origins in a sample with other ecological and biological properties. Although the accuracy of their determination practically was within the permissible value - 5%.
Deciduous trees, shrubs and rose varieties have the highest transpiration rates (205-243 mg/g fresh leaf mass per hour). Climbing plants have the highest leaf water content (68.9%). The highest content of chlorophylls A and B (3.46-3.93 and 1.34-1.84%) is found in deciduous trees, fruit trees and varietal roses. There is practically no difference between groups of deciduous plants in the saturation of leaves with carotenoids (1.12-1.17%). In coniferous species, the content of carotenoids is almost two times less (0.63%).
Correlation analysis of physiological indicators and calculated indicators of woody plant resistance revealed shallow correlation coefficient values (0.009-0.299). In this case, statistically reliable relationships were established by comparing the correlation coefficients’ actual and critical values. As a result, the following statistically reliable physiological indicators were identified: 1) for drought resistance - minimum and rank of variation in water content in the leaf, average, maximum and rank of variation in chlorophyll B content, minimum of carotenoid content; 2) according to salt tolerance - maximum and average water content in the leaf, maximum, average and rank of variation in the content of chlorophyll B, minimum content of carotenoids; 3) for winter hardiness - minimum content of chlorophyll B and carotenoids; 4) for soil fertility - the minimum content of chlorophyll A, the maximum, average and rank of variation in the content of chlorophyll B and 5) for gas resistance - the maximum and average content of chlorophyll B. No reliable correlations were found for indicators of resistance to phytophages.
As a result of regression analysis, 20 forecast graphs of stability indicators and the derived dependence formula have a logarithmic, power, multiplicative and exponential form.
The research results will contribute to improving and implementing the ecological method of phytointroduction. This will significantly reduce the time and financial resources required to conduct introduction research and quickly select appropriate plants. As a result, in the extremely harsh climatic conditions of the Mangystau region, the quality of green construction will significantly improve.
6. Patents
Copyright certificate of state registration of rights to an object of copyright No. 2339 dated December 14, 2015, issued by the Minister of Justice of the Republic of Kazakhstan, registered exclusive property rights to an object of copyright under the name “DInCeR (computer program). Authors: Imanbayeva Akzhunis, Belozerov Ivan. Patent holder: Mangyshlak Experimental Botanical Garden.”
Author Contributions
Conceptualization, I.A. and B.I.; methodology, Z.D.; software, B.I.; validation, B.I., O.A. and T.N.; formal analysis, B.I.; investigation, B.I.; resources, O.A.; data curation, O.A.; writing—original draft preparation, O.A.; writing—review and editing, O.A.; visualization, O.A.; supervision, I.A.; project administration, I.A.; funding acquisition, I.A. All authors have read and agreed to the published version of the manuscript.
Funding
The research was carried out with program-targeted funding “ Scientific and practical basis of reproduction, conservation, use of fruit-berry plants of the natural flora of Western, Eastern, Central and Northern Kazakhstan to ensure food security BR21882166”. Science Committee of the Ministry of Science and Higher Education of the Republic of Kazakhstan.
Data Availability Statement
The data presented in this study are available upon request from the corresponding author.
Acknowledgements
The authors express gratitude to the entire team of the Mangistau Experimental Garden for actively contributing to maintaining the collections of the studied plants.
Conflicts of Interest
The authors declare no conflict of interest.
Appendix A
Physiological indicators of growth and development of trees and shrubs of the MEBG collection gene pool.
Appendix B
Sums of assessment points of biological stability for trees and shrubs of the MEBG collection gene pools.
References
- Christmas, M. J., Breed, M. F., & Lowe, A. J. (2016). Constraints to and conservation implications for climate change adaptation in plants. Conservation Genetics, 17, 305-320. [CrossRef]
- Timofeeva, O.A.; Dubrovnaya, S.A.; Khusnetdinova, L.Z. Morphophysiological characterisation of Bupleurum aureum in natural populations of the Republic of Tatarstan. Acta Biologica Sibirica 2022, 8, 843-855. [CrossRef]
- Zhang, Y., Tariq, A., Hughes, A. C., Hong, D., Wei, F., Sun, H., ... & Ma, K. (2023). Challenges and solutions to biodiversity conservation in arid lands. Science of the Total Environment, 857, 159695. [CrossRef]
- Imanbayeva, A., Belozerov, I., Musaeva, Z., & Hasanova, G. (2024). Development of interactive maps of geolocations of native plants of Kazakhstan and the living collections of the Mangyshlak experimental botanical garden. In BIO Web of Conferences (Vol. 100, p. 04047). EDP Sciences. [CrossRef]
- Mayr, H. (1909). Waldbau auf naturgeschichtlicher Grundlage. Berlin: Verlagsbuchhandlung Paul Parey.
- Rusanov, F. N. (1971). Method of generic complexes in plant introduction and its further development. Moscow Gl Bot Sad Byul, 1971.
- Kultiasov MV (1953) Ecological-historical method in plant introduction. Bulletin of the Main Botanical Garden of the Academy of Sciences of the USSR 53:24-39 (in Russian).
- Kormilitsyn AM (1977) Methodological recommendations for the selection of trees and shrubs for introduction in the south of the USSR. Yalta, Nikitinsky State Botanical Garden:29 (in Russian).
- Vavilov, N. I. (1935). Botanical and geographical bases of breeding. Theoretical foundations of plant breeding, 1, 17-75.
- Petukhova, I. P. (1981). Ekologo-fiziologicheskie osnovy introduktsii drevesnykh rasteniy [Ecological and physiological basis for the introduction of woody plants].
- Lapin, P. I., & Sidneva, S. V. (1973). Evaluation of the prospects of introduction of woody plants according to visual observations. Experience in the introduction of woody plants. M, 3-67.
- Lapin PI (1974) Introduction of woody plants in the middle zone of the European part of the USSR (scientific foundations, methods and results):137 (in Russian).
- Proskuryakov MA, Rubanik VG (1986) Experience and prospects of forecasting the results of the introduction of woody plants in Kazakhstan. Bulletin of the Main Botanical Garden of the Academy of Sciences of the KazSSR 139:55-58 (in Russian).
- Golovkin, B. N. (1986). The problem of climatic zoning of introduced plants.
- Baitulin IO, Proskuryakov MA, Chekalin SV (1992) System-ecological approach to plant introduction in Kazakhstan. Part 2 1:98 (in Russian).
- Myers, J. H., & Bazely, D. (2003). Ecology and control of introduced plants. Cambridge University Press. [CrossRef]
- Baccari, S., Elloumi, O., Chaari-Rkhis, A., Fenollosa, E., Morales, M., Drira, N., ... & Munné-Bosch, S. (2020). Linking leaf water potential, photosynthesis and chlorophyll loss with mechanisms of photo-and antioxidant protection in juvenile olive trees subjected to severe drought. Frontiers in Plant Science, 11, 614144. [CrossRef]
- Zhang, H., Sun, X., & Dai, M. (2022). Improving crop drought resistance with plant growth regulators and rhizobacteria: Mechanisms, applications, and perspectives. Plant Communications, 3(1). [CrossRef]
- Parida, A. K., & Das, A. B. (2005). Salt tolerance and salinity effects on plants: a review. Ecotoxicology and environmental safety, 60(3), 324-349. [CrossRef]
- Orazov, A., Myrzagaliyeva, A., Mukhitdinov, N., & Tustubayeva, S. (2022). Callus induction with 6-BAP and IBA as a way to preserve Prunus ledebouriana (Rosaceae), and endemic plant of Altai and Tarbagatai, East Kazakhstan. Biodiversitas Journal of Biological Diversity, 23(6). [CrossRef]
- Orazov, A., Yermagambetova, M., Myrzagaliyeva, A., Mukhitdinov, N., Tustubayeva, S., Turuspekov, Y., & Almerekova, S. (2024). Plant height variation and genetic diversity between Prunus ledebouriana (Schlecht.) YY Yao and Prunus tenella Batsch based on using SSR markers in East Kazakhstan. PeerJ, 12, e16735. [CrossRef]
- Inoue, Y., Kimball, B. A., Jackson, R. D., Pinter Jr, P. J., & Reginato, R. J. (1990). Remote estimation of leaf transpiration rate and stomatal resistance based on infrared thermometry. Agricultural and Forest Meteorology, 51(1), 21-33. [CrossRef]
- Ievinsh, G. (2023). Water Content of Plant Tissues: So Simple That Almost Forgotten? Plants 2023, 12, 1238. [CrossRef]
- Kubentayev, S. A., Alibekov, D. T., Perezhogin, Y. V., Lazkov, G. A., Kupriyanov, A. N., Ebel, A. L., ... & Kubentayeva, B. B. (2024). Revised checklist of endemic vascular plants of Kazakhstan. PhytoKeys, 238, 241-279. [CrossRef]
- Sumbembayev, A. A., Tergenbaeva, Z. H. T., Kudabayeva, G. M., Tashmetova, R. S., Genievskaya, Y. A., & Szlachetko, D. L. (2022). Assessment of state of Dactylorhiza fuchsii (Orchidaceae) populations from the Altai mountains of Kazakhstan. Biodiversitas, 23(9). [CrossRef]
- Kusmangazinov, A., Kurmanbayeva, M. S., Zharkova, I., Karabalayeva, D., Kaparbay, R., & Kaiyrbekov, T. (2023). Comparison of anatomical characteristics and phytochemical components between two species of hedysarum (Fabaceae). OnLine Journal of Biological Sciences, 23(3), 323-335. [CrossRef]
- Pérez-Patricio, M., Camas-Anzueto, J. L., Sanchez-Alegría, A., Aguilar-González, A., Gutiérrez-Miceli, F., Escobar-Gómez, E., ... & Grajales-Coutiño, R. (2018). Optical method for estimating the chlorophyll contents in plant leaves. Sensors, 18(2), 650. [CrossRef]
- Honda, I., Turuspekov, Y., Komatsuda, T., & Watanabe, Y. (2005). Morphological and physiological analysis of cleistogamy in barley (Hordeum vulgare). Physiologia Plantarum, 124(4), 524-531. [CrossRef]
- Maoka, T. (2020). Carotenoids as natural functional pigments. Journal of natural medicines, 74(1), 1-16. [CrossRef]
- Perez, T. M., Valverde-Barrantes, O., Bravo, C., Taylor, T. C., Fadrique, B., Hogan, J. A., ... & Feeley, K. J. (2019). Botanic gardens are an untapped resource for studying the functional ecology of tropical plants. Philosophical Transactions of the Royal Society B, 374(1763), 20170390. [CrossRef]
- Imanbayeva, A. A., Ishmuratova, M. Y., & Gassanova, G. G. (2020). Geographical innovations in the flora of the Mangystau region. In BIO Web of Conferences (Vol. 24, p. 00028). EDP Sciences. [CrossRef]
- Koshim, A. G., Sergeyeva, A. M., Bexeitova, R. T., & Aktymbayeva, A. S. (2020). Landscape of the Mangystau region in Kazakhstan as a geomorphotourism destination: a geographical review. Geo Journal of Tourism and Geosites, 29(2), 385-397. [CrossRef]
- Imanbayeva, A. A., Ishmuratova, M. Y., & Gassanova, G. G. (2020). Geographical innovations in the flora of the Mangystau region. In BIO Web of Conferences (Vol. 24, p. 00028). EDP Sciences. [CrossRef]
- Viktorov D.P. Small workshop on plant physiology. Textbook manual for biology. specialities of university and pedagogy. Inst. - 2nd ed., add. - Moscow: Higher. School, 1969. - 120 p.
- Guzhvin S. A., Kumacheva V. D., Kamenev R. A. Physiology and biochemistry of plants, Textbook, Persianovsky 2019.
- Workshop on plant physiology: textbook. village for higher education agricultural textbook institutions / ed. N. N. Tretyakova. – M.: Kolos, 1982. – P. 41–43.
- Lichtenthaler, H. K. and Wellburn, A. R. (1983). Determinations of total carotenoids and chlorophylls a and b of leaf extracts in different solvents. Biochemical Society Transactions, 11(5), 591-592. [CrossRef]
- Belozerov IF, Imanbayeva AA (2015) Certificate of state registration of rights to the object of copyright program “DInCeR” (computer software) No. 2339 (IS 003261) (in Russian).
- Rohlf, F. NTSYSpc: Numerical Taxonomy and Multivariate Analysis System, Version 2.02; Exeter Software: Setauket, NY, USA, 1998.
- Imanbayeva, A. A., Ishmuratova, M. Y., & Gassanova, G. G. (2020). Geographical innovations in the flora of the Mangystau region. In BIO Web of Conferences (Vol. 24, p. 00028). EDP Sciences. [CrossRef]
- Akzhunis, I., Nurzhaugan, D., Aidyn, O., Meruert, S., Ivan, B., & Ainur, T. (2024). Study of Floristic, Morphological, and Genetic (atpF-atpH, ITS, matK, psbK-psbI, rbcL, and trnH-psbA) Differences in Crataegus ambigua Populations in Mangistau (Kazakhstan). [CrossRef]
- Bulakh PE (2010) Theory and methods of forecasting in plant introduction. Kiev Nauk dumka 1:110.
- Orazov, A., Tustubayeva, S., Alemseytova, J., Mukhitdinov, N., Myrzagaliyeva, A., Turuspekov, Y., & Sramko, G. (2021). Flora is accompanying Prunus ledebouriana (Schltdl.) YY Yao in the Tarbagatai State National Park in Kazakhstan. International Journal of Biology and Chemistry, 14(1), 21-34. [CrossRef]
- Anar, M., Ainur, S., Manar, T., Saule, M., Zhumagul, M. Z., Zheksenbaevna, N. A., ... & Zharakovich, M. M. (2023). Morphological variability of the rare species Linaria cretacea in the conditions of the chalk hills in North-Western Kazakhstan. Caspian Journal of Environmental Sciences, 21(5), 1273-1278. [CrossRef]
- Sumbembayev, A. A., Abugalieva, S. I., Danilova, A. N., Matveyeva, E. V., & Szlachetko, D. L. (2021). A flower morphometry of members of the genus Dactylorhiza Necker ex Nevski (Orchidaceae) from the Altai Mountains of Kazakhstan. Biodiversitas, 22(8). [CrossRef]
- Kubentayev, S. A., Alibekov, D. T., Perezhogin, Y. V., Lazkov, G. A., Kupriyanov, A. N., Ebel, A. L., ... & Kubentayeva, B. B. (2024). Revised checklist of endemic vascular plants of Kazakhstan. PhytoKeys, 238, 241-279. [CrossRef]
- Kusmangazinov, A., Kurmanbayeva, M. S., Zharkova, I., Karabalayeva, D., Kaparbay, R., & Kaiyrbekov, T. (2023). Comparison of anatomical characteristics and phytochemical components between two species of hedysarum (Fabaceae). OnLine Journal of Biological Sciences, 23(3), 323-335. [CrossRef]
- Almerekova, S.; Yermagambetova, M.; Osmonali, B.; Vesselova, P.; Abugalieva, S.; Turuspekov, Y. Characterization of the Plastid Genomes of Four Caroxylon Thunb. Species from Kazakhstan. Plants 2024, 13, 1332. [CrossRef]
- Kramer PD, Kozlovsky TT (1983) Physiology of woody plants. Forest industry:464 (in Russian).
- Lakin GF (1990) Biometrics. Higher School:352 (in Russian).
- Zeinullina, A., Zargar, M., Dyussibayeva, E., Orazov, A., Zhirnova, I., Yessenbekova, G., ... & Hu, Y. G. (2023). Agro-Morphological Traits and Molecular Diversity of Proso Millet (Panicum miliaceum L.) Affected by Various Colchicine Treatments. Agronomy, 13(12), 2973. [CrossRef]
- Viktorov, A. G. (2015). Can efficient insecticidal plants be created, or the evolution of phytophage resistance to commercial transgenic Bt-Plants? Russian journal of plant physiology, 62, 14-22. [CrossRef]
- Zargar, M., Dyussibayeva, E., Orazov, A., Zeinullina, A., Zhirnova, I., Yessenbekova, G., & Rysbekova, A. (2023). Microsatellite-based genetic diversity analysis and population structure of Proso Millet (Panicum miliaceum L.) in Kazakhstan. Agronomy, 13(10), 2514. [CrossRef]
- Akzhunis, I., Nurzhaugan, D., Aidyn, O., Meruert, S., Ivan, B., & Ainur, T. (2024). Study of Floristic, Morphological, and Genetic (atpF-atpH, ITS, matK, psbK-psbI, rbcL, and trnH-psbA) Differences in Crataegus ambigua Populations in Mangistau (Kazakhstan). [CrossRef]
- Zhang, Y., Tariq, A., Hughes, A. C., Hong, D., Wei, F., Sun, H., ... & Ma, K. (2023). Challenges and solutions to biodiversity conservation in arid lands. Science of the Total Environment, 857, 159695. [CrossRef]
- Arestova SV, Arestova EA (2017) Assessment of adaptation of introduced woody and shrubby plants in the conditions of the Saratov Volga region (methodological recommendations). Saratov Federal State Budgetary Scientific Institution “Federal Agrarian Scientific Center Southeast” 1:28. (in Russian).
- Ramezan, D., Zargar, M., Nakhaev, M. R., Said-Akhmadovich, K. A., Bayat, M., & Ghaderi, A. (2024). Selenium alleviates growth characteristics, plant pigments, photosynthetic and antioxidant capacity of basil (Ocimum basilicum L.) under low temperature. Biocatalysis and Agricultural Biotechnology, 103198. [CrossRef]
- Honda, I., Turuspekov, Y., Komatsuda, T., & Watanabe, Y. (2005). Morphological and physiological analysis of cleistogamy in barley (Hordeum vulgare). Physiologia Plantarum, 124(4), 524-531. [CrossRef]
- Belozerov IF, Imanbayeva AA (2020) Phenological and electronic information aspects of introduction research in the Mangyshlak experimental botanical garden. Journal of Advanced Research in Dynamical and Control Systems 12(6):432–443. [CrossRef]
|
Disclaimer/Publisher’s Note: The statements, opinions and data contained in all publications are solely those of the individual author(s) and contributor(s) and not of MDPI and/or the editor(s). MDPI and/or the editor(s) disclaim responsibility for any injury to people or property resulting from any ideas, methods, instructions or products referred to in the content. |
© 2024 by the authors. Licensee MDPI, Basel, Switzerland. This article is an open access article distributed under the terms and conditions of the Creative Commons Attribution (CC BY) license (http://creativecommons.org/licenses/by/4.0/).
