1. Introduction
In the dynamic field of construction engineering and management, the quest for optimal resource utilization is a driving force for innovation. This study investigates a novel amalgamation of cutting-edge technologies—Agent-Based Modeling (ABM), Building Information Modeling (BIM), and Bluetooth Low Energy (BLE)—to cast new light on resource allocation and project monitoring within construction endeavors.
The research endeavors to bridge the existing gap in real-time resource optimization, with the explicit goal of constructing a validated, technologically synergistic methodology that propels construction project management into a new era of efficiency and decisional acuity.
This research is propelled by the imperative to transcend traditional management practices by leveraging a cohesive, technology-enhanced strategy. We are building upon the foundation laid by previous research, with an ambition to advance the praxis of construction management through the introduction of an integrative approach that harnesses real-time data and digital twin technology.
The methodology is underpinned by a case study at Helwan University's College of Engineering, buttressed by extensive expert evaluations to ensure the approach is empirically grounded and industry-appropriate. Our structured manuscript navigates through the research phases, from a comprehensive literature review to the methodological framework, data exposition, and analytic discussion, culminating in a forward-looking reflection on the implications for construction management and future research avenues.
In delineating our study's trajectory, we seek to crystallize our contribution to the construction engineering and management community, presenting a robust solution for enhanced resource allocation and project oversight, with the ultimate objective of amplifying both the efficacy and productivity of construction projects.
2. Research Problem
Despite progress in digital twin technology, a gap persists in fully exploiting its integration with Agent-Based Modeling (ABM) for resource positioning. The present study addresses this lacuna by developing an agent-level digital twin to refine simulation accuracy and realism in complex systems. This integration seeks to elucidate system dynamics, optimize resource allocation in construction projects, and facilitate data-driven decision-making on productivity rates.
3. Literature Review
The interdisciplinary integration of Agent-Based Modeling (ABM) with resource positioning technologies has garnered substantial scholarly attention, it was established as an instrumental methodology for optimizing labor productivity tracking and extending the functionalities of Building Information Modeling (BIM) within the construction industry. This literature review aims to provide a comprehensive exploration of the synergistic applications of ABM, resource positioning technologies, and advanced BIM functionalities, particularly focusing on their implications for labor productivity tracking and overall project management in construction.
3.1. Tracking of Labor Productivity
Labor productivity tracking is crucial for construction projects to identify inefficiencies and make informed decisions for improved project performance. Conventional manual tracking methodologies are time-consuming, subjective, and susceptible to inaccuracies[
1,
2,
3]. Integrating resource positioning technologies with ABM offers real-time and objective labor tracking capabilities.
GPS has been extensively utilized for tracking workers' locations, movements and activities. Studies have utilized GPS data to evaluate labor productivity in various construction activities, such as earthwork operations, concrete placement, and steel erection. RFID systems have also been applied to track worker attendance, monitor progress, and identify bottlenecks [
4]. Additionally, BLE technology enables indoor positioning, providing real-time visibility of workers within construction sites and facilitating immediate awareness and corrective actions [
5].
3.2. Building Information Modeling (BIM) and Labor Productivity
The integration of labor productivity data into BIM models enhances project visualization, analysis and decision-making processes. By incorporating labor productivity data within BIM, project stakeholders can gain insights into the current progress and identify potential issues affecting productivity. Abdelalim and Omar, 2021 [
2,
6] proposed a framework that integrates resource tracking data with BIM to visualize workers' activities and productivity; it enabled real-time monitoring and proactive decision-making. This integration provides a holistic view of the project status and facilitates optimizing labor productivity.
3.3. Agent-Based Modeling (ABM) and Labor Productivity
ABM simulates complex systems by representing individual agents and their interactions. Combining ABM with labor productivity tracking facilitates proactive management and optimization of construction projects. Abdelalim, A.M., et.al proposed an ABM technique that integrates resource positioning data and BIM to develop an early warning system (EWS) for labor productivity, [
6]. The ABM-based digital twin on the agent level enables simulation and prediction of productivity dynamics and intervention strategies. This proactive approach facilitates the identification of potential delays or inefficiencies, allowing stakeholders to take corrective actions promptly.
3.4. Augmented BIM for Labor Productivity Analysis
Augmented BIM incorporates additional dimensions, such as labor productivity data, into the BIM environment, which enables advanced analysis and visualization. Lee and Kim (2020) [
11], developed an augmented BIM framework that integrates labor productivity data with 4D BIM for construction progress visualization and analysis. This approach enhances the understanding of labor productivity variations and enables stakeholders to identify factors impacting project performance.
3.5. Multi-Dimensional Analysis for Labor Productivity
To improve labor productivity analysis, studies have explored multi-dimensional frameworks, considering various factors influencing productivity [
2,
6]. Si et al. (2019) [
7] proposed a multi-dimensional analysis framework that integrates resource positioning, BIM and environmental factors to evaluate labor productivity. This method considered spatial and temporal aspects, worker interactions and environmental conditions, and provided a comprehensive understanding of productivity dynamics.
Thus, the integration of ABM, resource positioning technologies and augmented BIM offers a powerful method for labor productivity tracking in construction projects. The combination of real-time labor tracking, multi-dimensional analysis and proactive decision-making facilitates improved project performance and enables stakeholders to optimize resource allocation.
4. Scientometric Analysis of Indoor Positioning Research
The list of publications was extracted from the Web of Science Database (WoS). WoS was chosen as the primary data source for the current study due to its widespread availability and endorsement in extant literature [
5,
7,
8]. The search strategy focused on "indoor position," examining titles, abstracts, and author-generated keywords. Data collection concluded in 2023, covering the period from 2000 to mid-2023. After filtering non-English and irrelevant publications, the authors retrieved 353 documents.
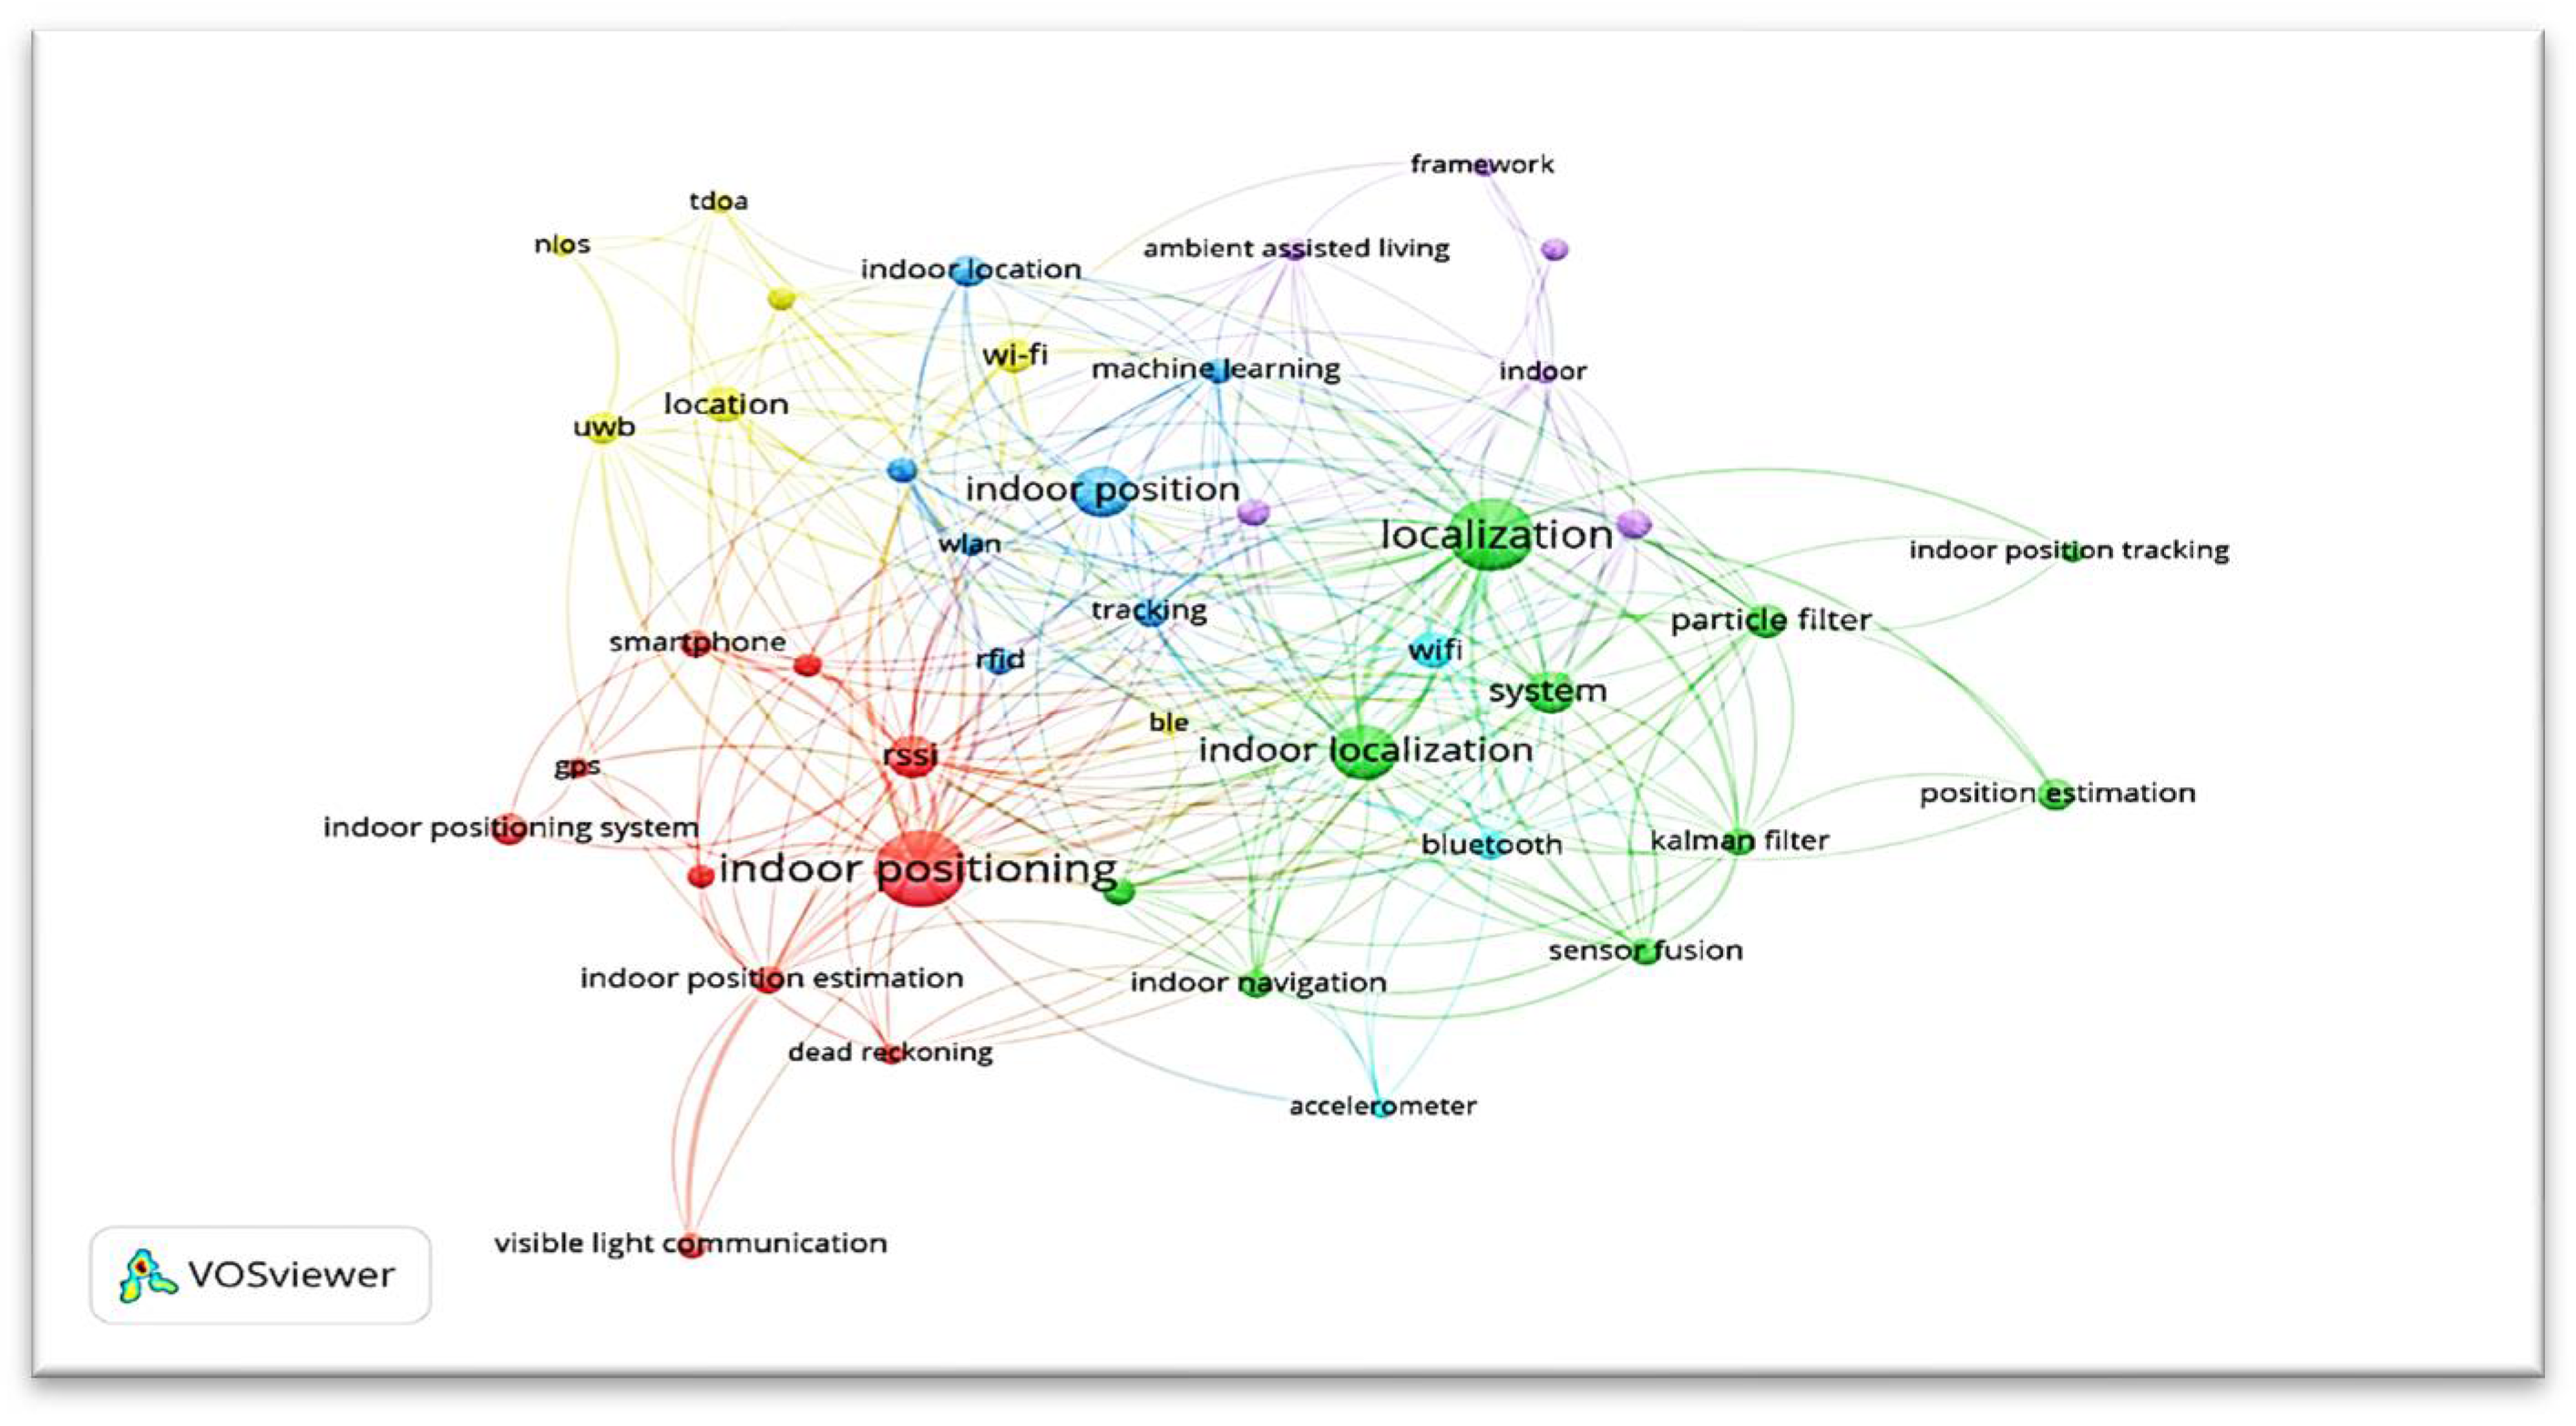
The authors utilized keyword co-occurrence analysis to track the development of "indoor positioning" studies. This method effectively visualizes evolving scientific trends and subjects through graphical maps. From the 1,026 keywords analyzed, 43 surpassed our threshold of at least five occurrences.
Figure 1 visually represents these keywords, categorized into six clusters. These clusters are color-coded as follows: red represents “indoor positioning”, green corresponds to “localization”, blue signifies “indoor localization with tracking”, purple indicates “framework”, yellow denotes “location” and sky blue stands for “WIFI”.
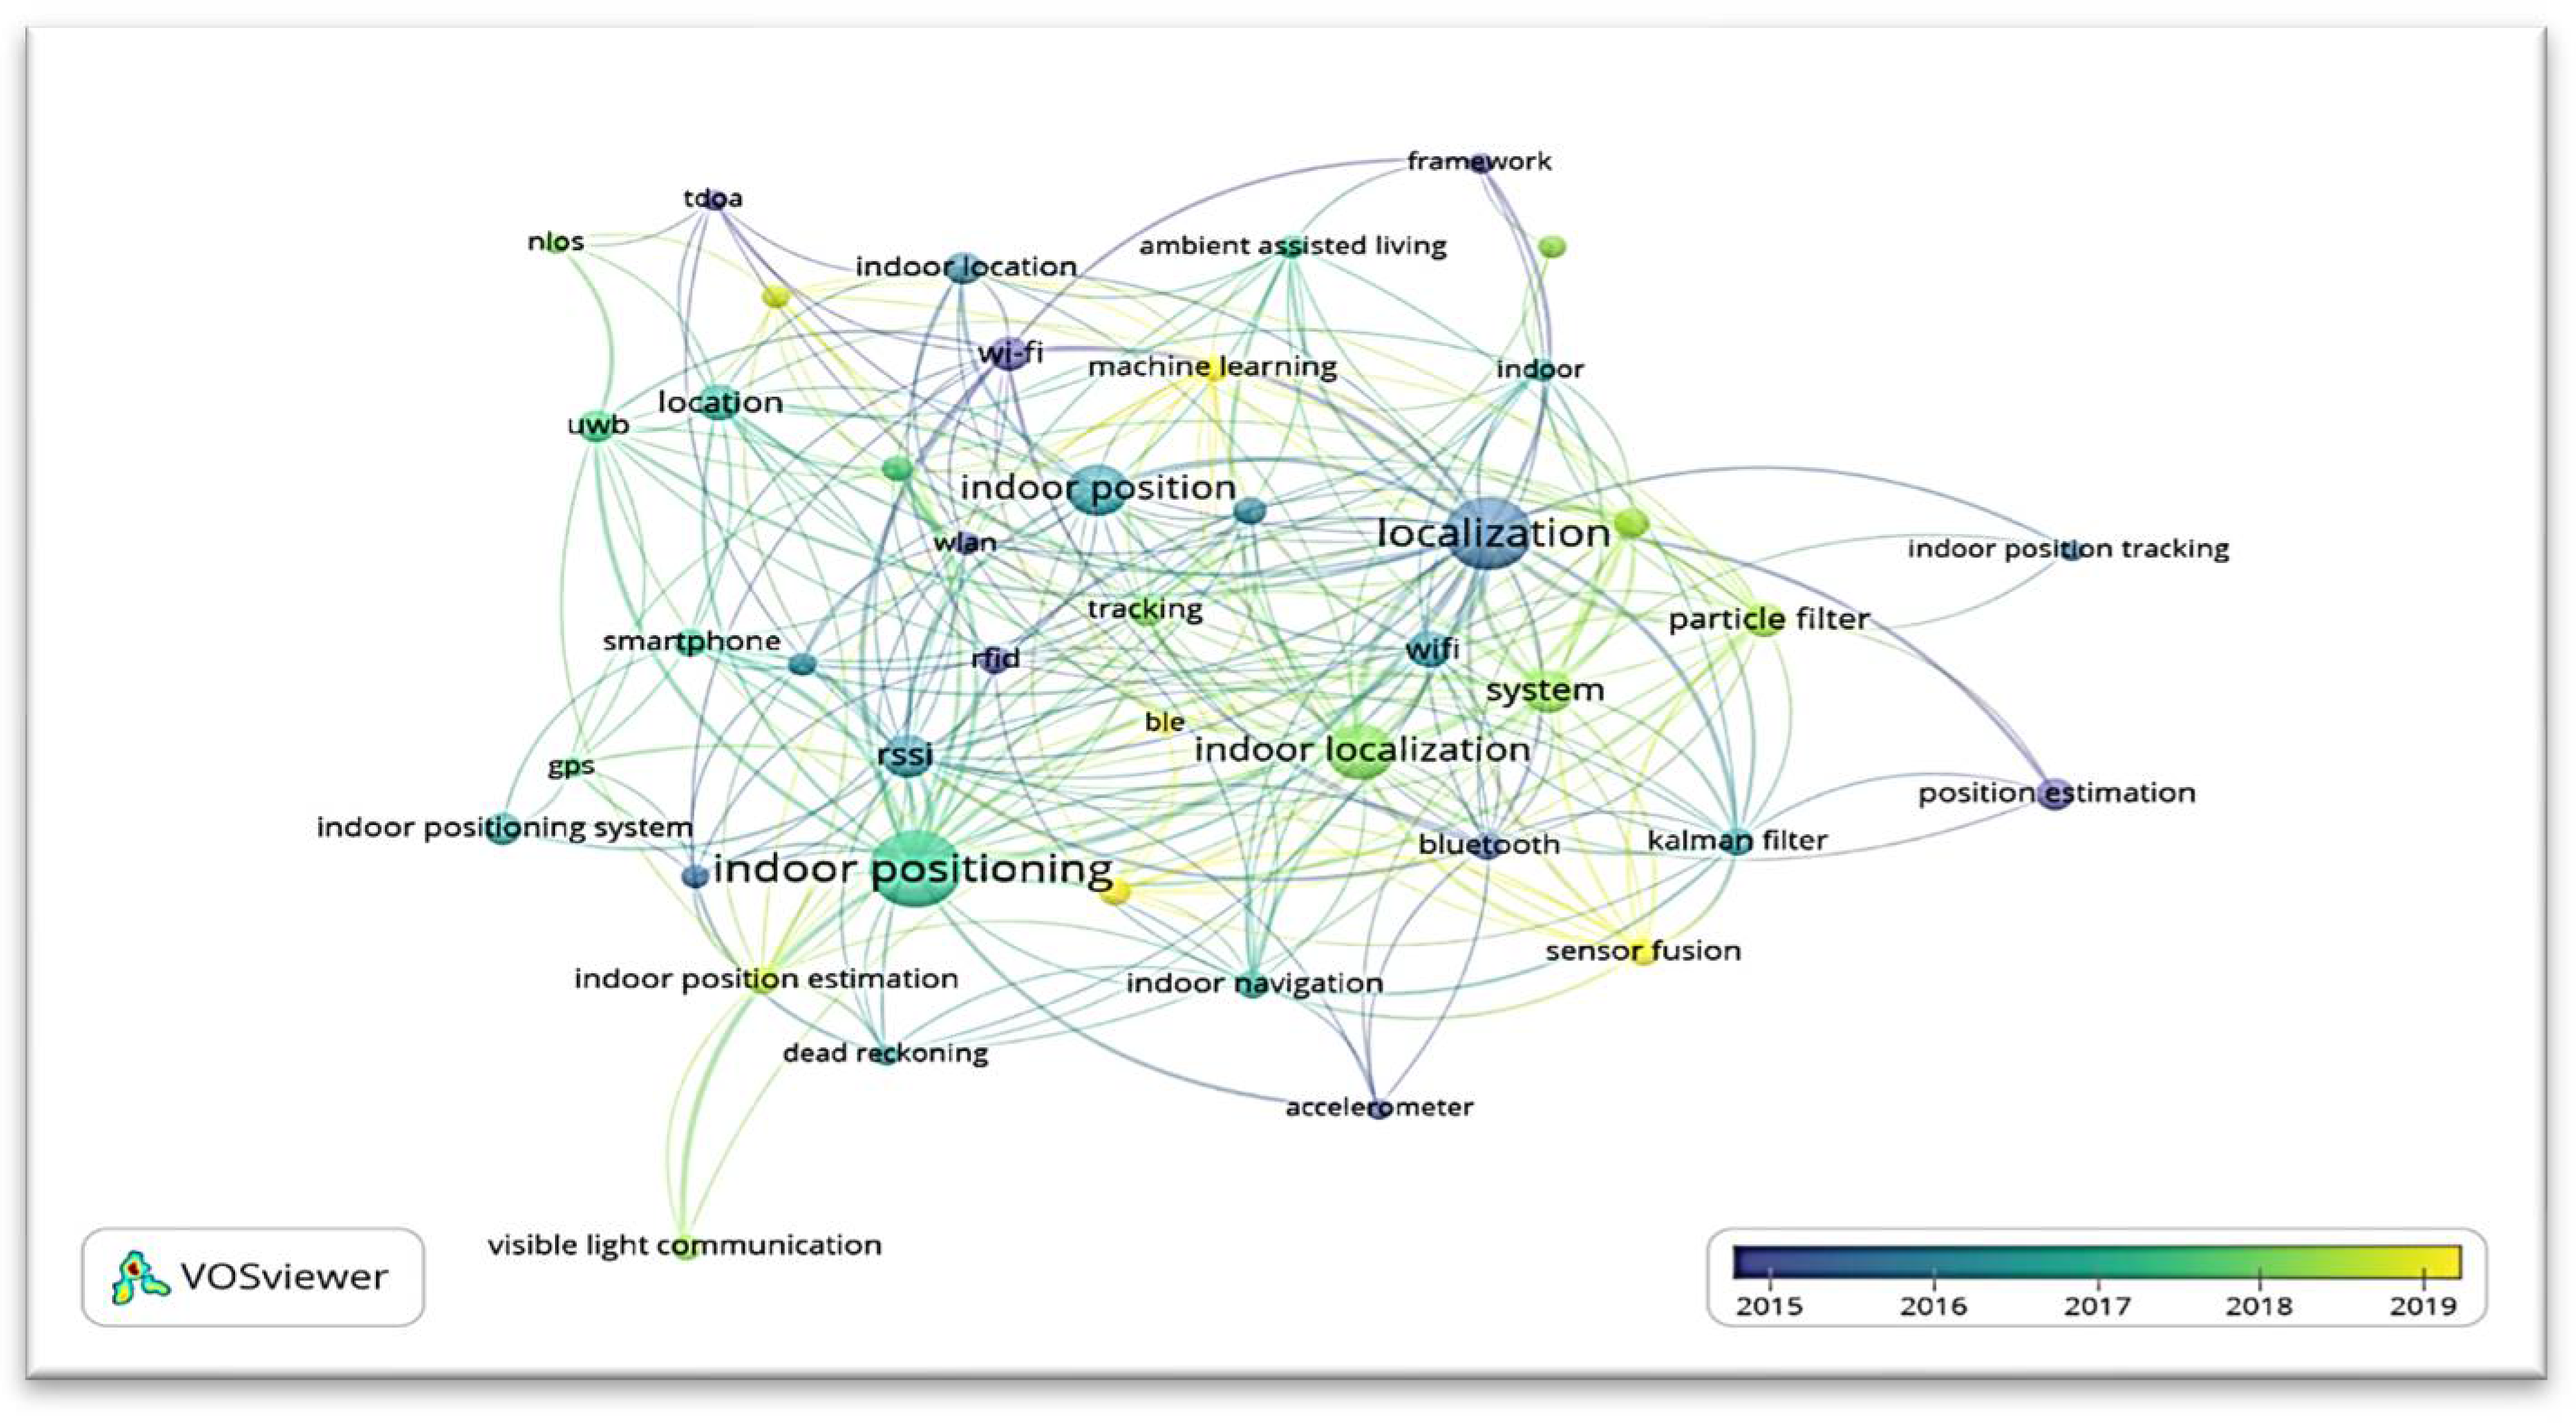
Figure 1 and
Figure 2 include 43 items, six clusters, 277 links, and a total link strength of 460. "Indoor positioning" serves as the central node.
Agent-Based Modeling (ABM) is a well-established computational modeling technique that has been widely used in various domains, including construction resource positioning. ABM focuses on simulating the behavior and interactions of autonomous agents within a system, representing entities such as construction workers, equipment, materials, and tasks [
10]. ABM enables the modeling of complex, dynamic systems by defining agents with specific characteristics, decision-making rules and interaction protocols. Through iterative simulations, ABM allows for the analysis of resource allocation strategies, identification of bottlenecks, and optimization of construction processes, Lee and Kim (2020) [
11].
Digital Twin technology has gained significant attention in the construction industry as a powerful tool for resource positioning, Zhou et al., 2018, [
12]. A Digital Twin refers to a virtual representation of a physical asset, system, or process that integrates real-time data, simulations, and analytics, Abdelalim et al., 2019, [
13]. By creating a digital replica that mirrors the physical construction project, Digital Twin technology enables real-time monitoring, predictive analytics, and decision support, Zhang et al., 2017, [
14]. It provides a platform for capturing, visualizing, and analyzing data related to construction resources, such as equipment utilization, material flow and task scheduling. This technology allows project stakeholders to assess the impact of resource positioning decisions, optimize resource utilization and identify potential issues or risks, Abdelalim, A.M, et.al., [
15,
16,
17,
18,
19,
20,
21]. The integration of ABM and Digital Twin technology offers a synergistic framework for construction resource positioning, [
22]. ABM simulates the behavior and decision-making of individual agents, while Digital Twin provides the virtual environment and data integration capabilities, [
22,
23,
24,
25,
26]. This combination allows for a comprehensive understanding of construction resource positioning by capturing both micro-level insights into agent behavior and macro-level system dynamics, Liao et al., 2021 [
27]. It facilitates informed decision-making and optimization of resource utilization by leveraging the strengths of both approaches.
The theoretical foundation of construction resource positioning with ABM and Digital Twin development involves decision-making and optimization principles. Decision-making techniques, such as multi-criteria decision analysis, can be integrated into the ABM framework to support resource allocation decisions [
4]. Optimization algorithms, such as genetic algorithms or particle swarm optimization, can be employed to search for the best resource positioning strategies [
8]. These approaches ensure that the ABM and Digital Twin-based resource positioning models are not only based on simulation and data analysis but also incorporate intelligent decision-making and optimization techniques, Yin et al., 2019, [
28].
By leveraging the theoretical foundations of ABM, Digital Twin technology, and decision-making and optimization principles, the proposed approach provides a robust framework for modeling, simulating, and optimizing construction resource positioning. This integration enables project stakeholders to gain insights into resource utilization, identify potential issues or bottlenecks, and make informed decisions to enhance project efficiency and cost-effectiveness, [
28,
29,
30,
31].
Research manuscripts reporting large datasets that are deposited in a publicly available database should specify where the data have been deposited and provide the relevant accession numbers. If the accession numbers have not yet been obtained at the time of submission, please state that they will be provided during review. They must be provided prior to publication.
5. Research Methodology
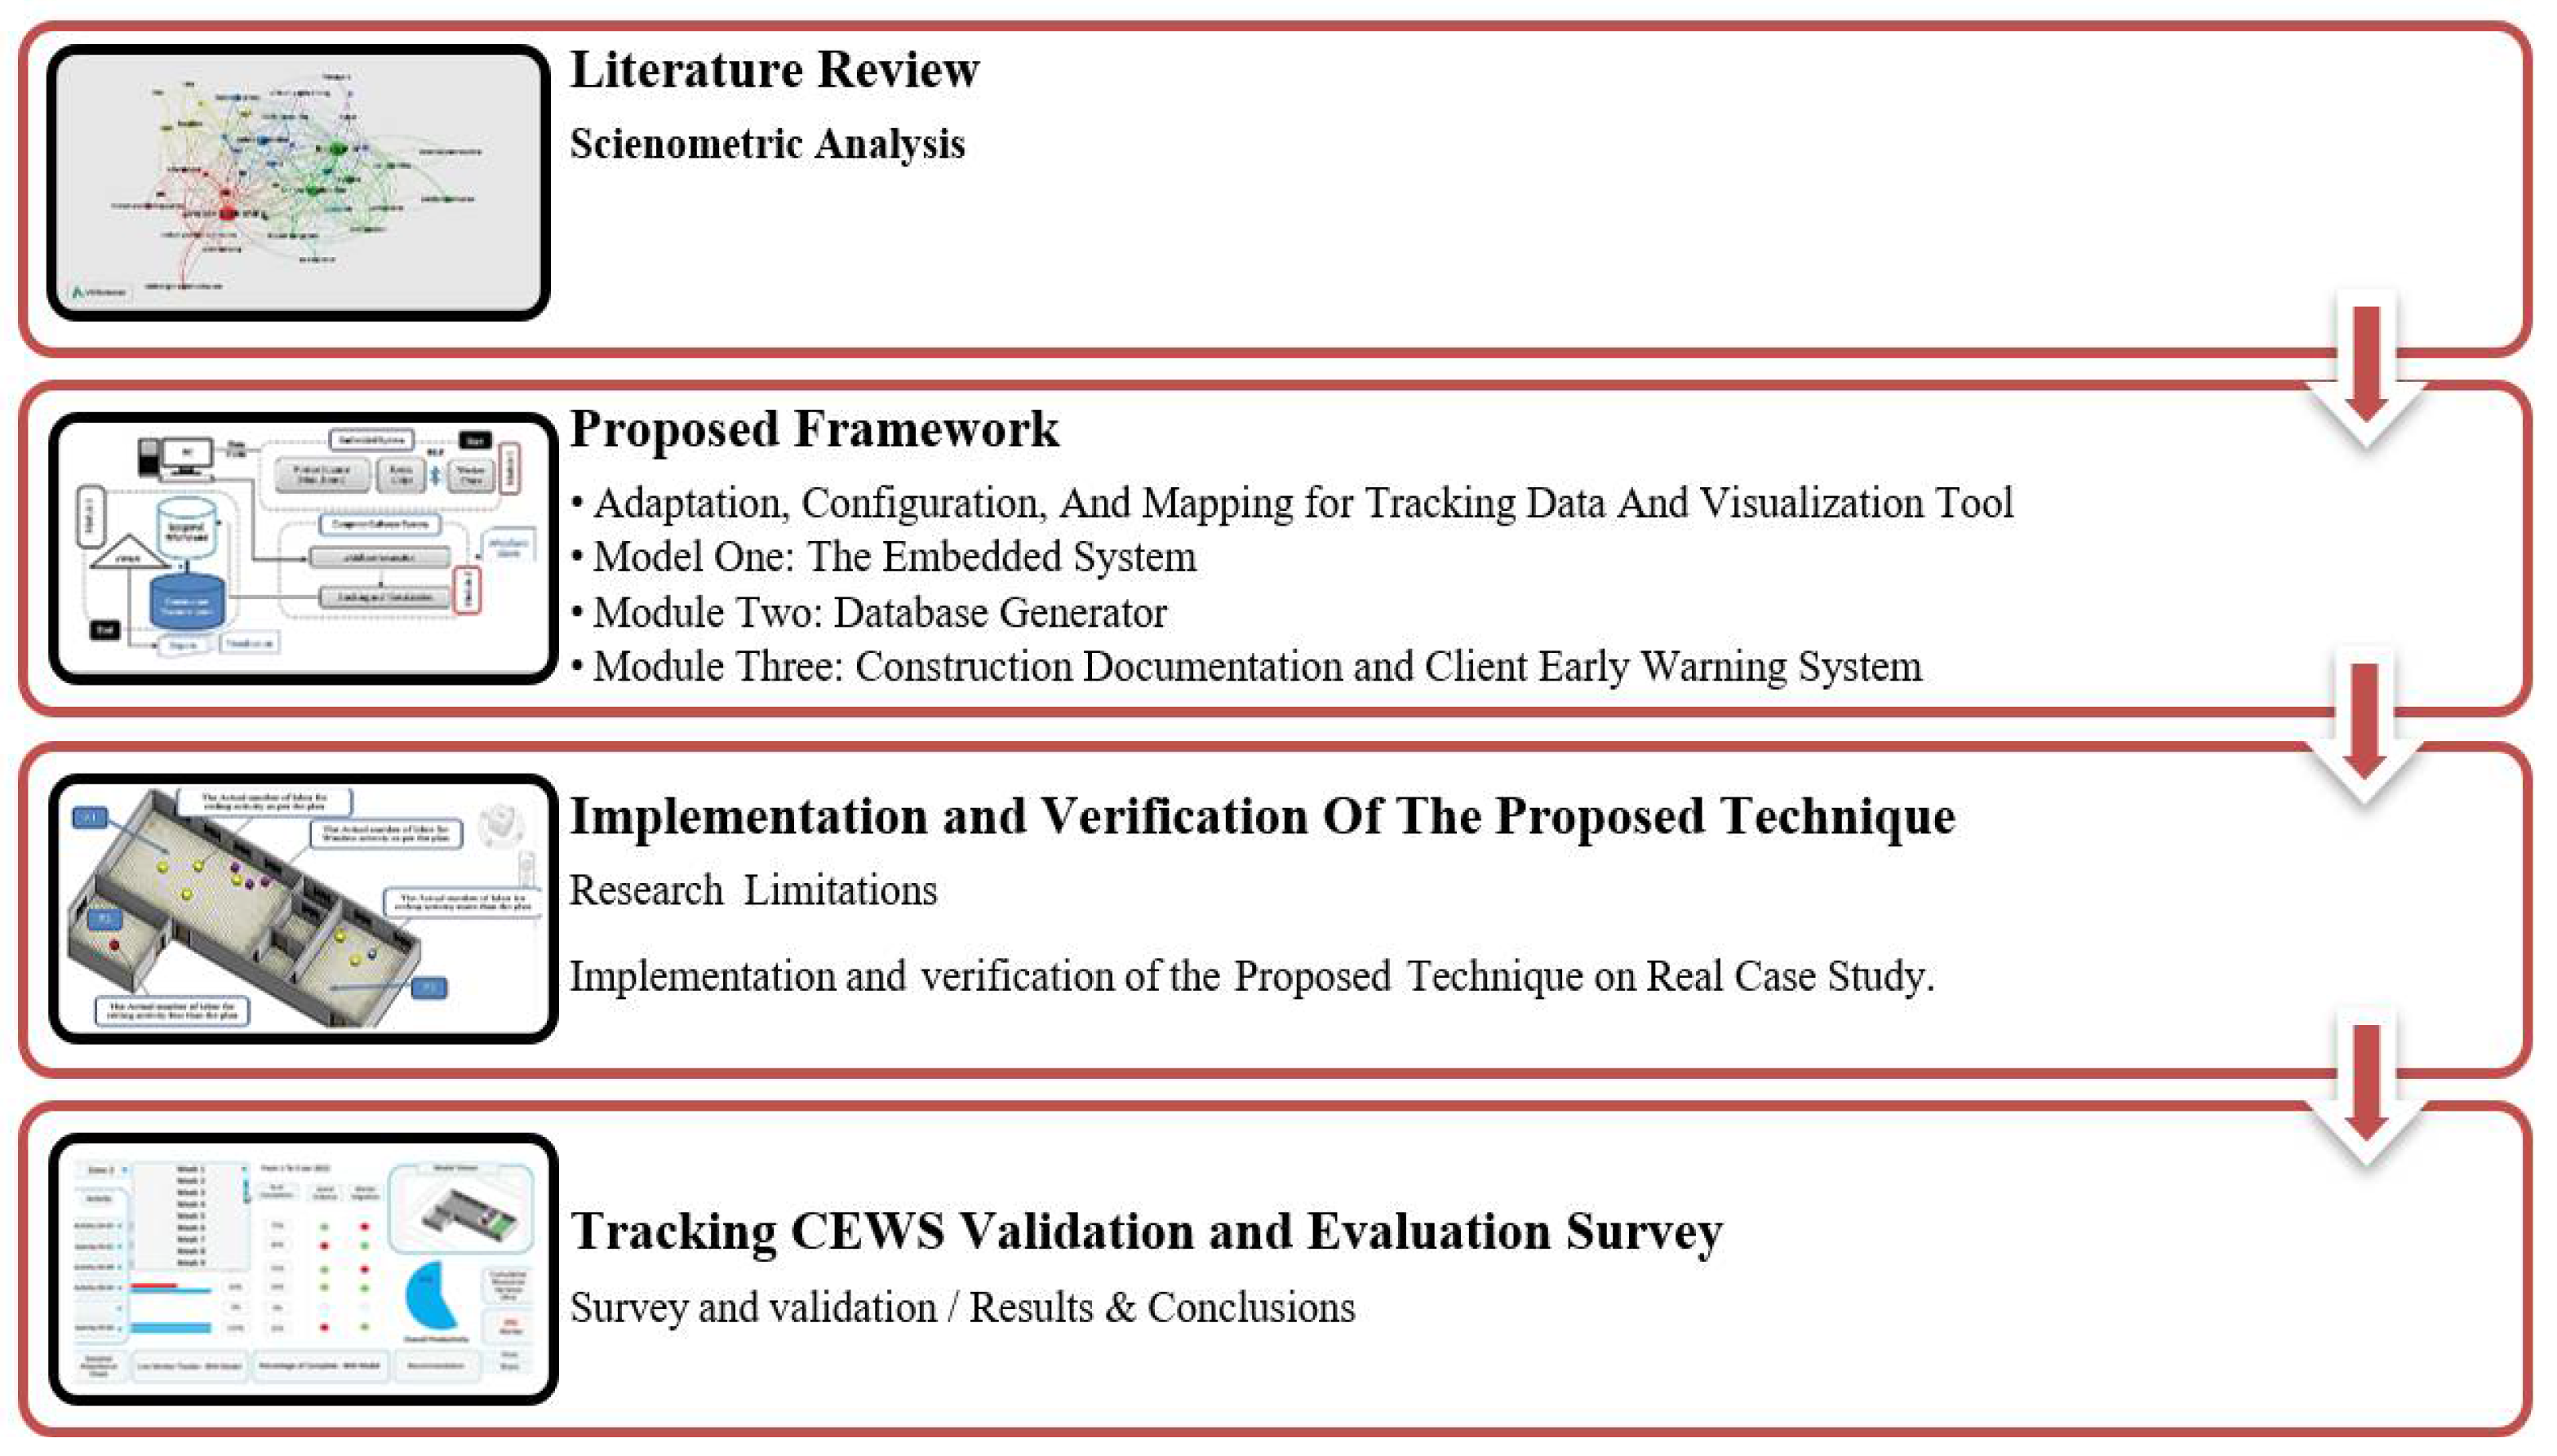
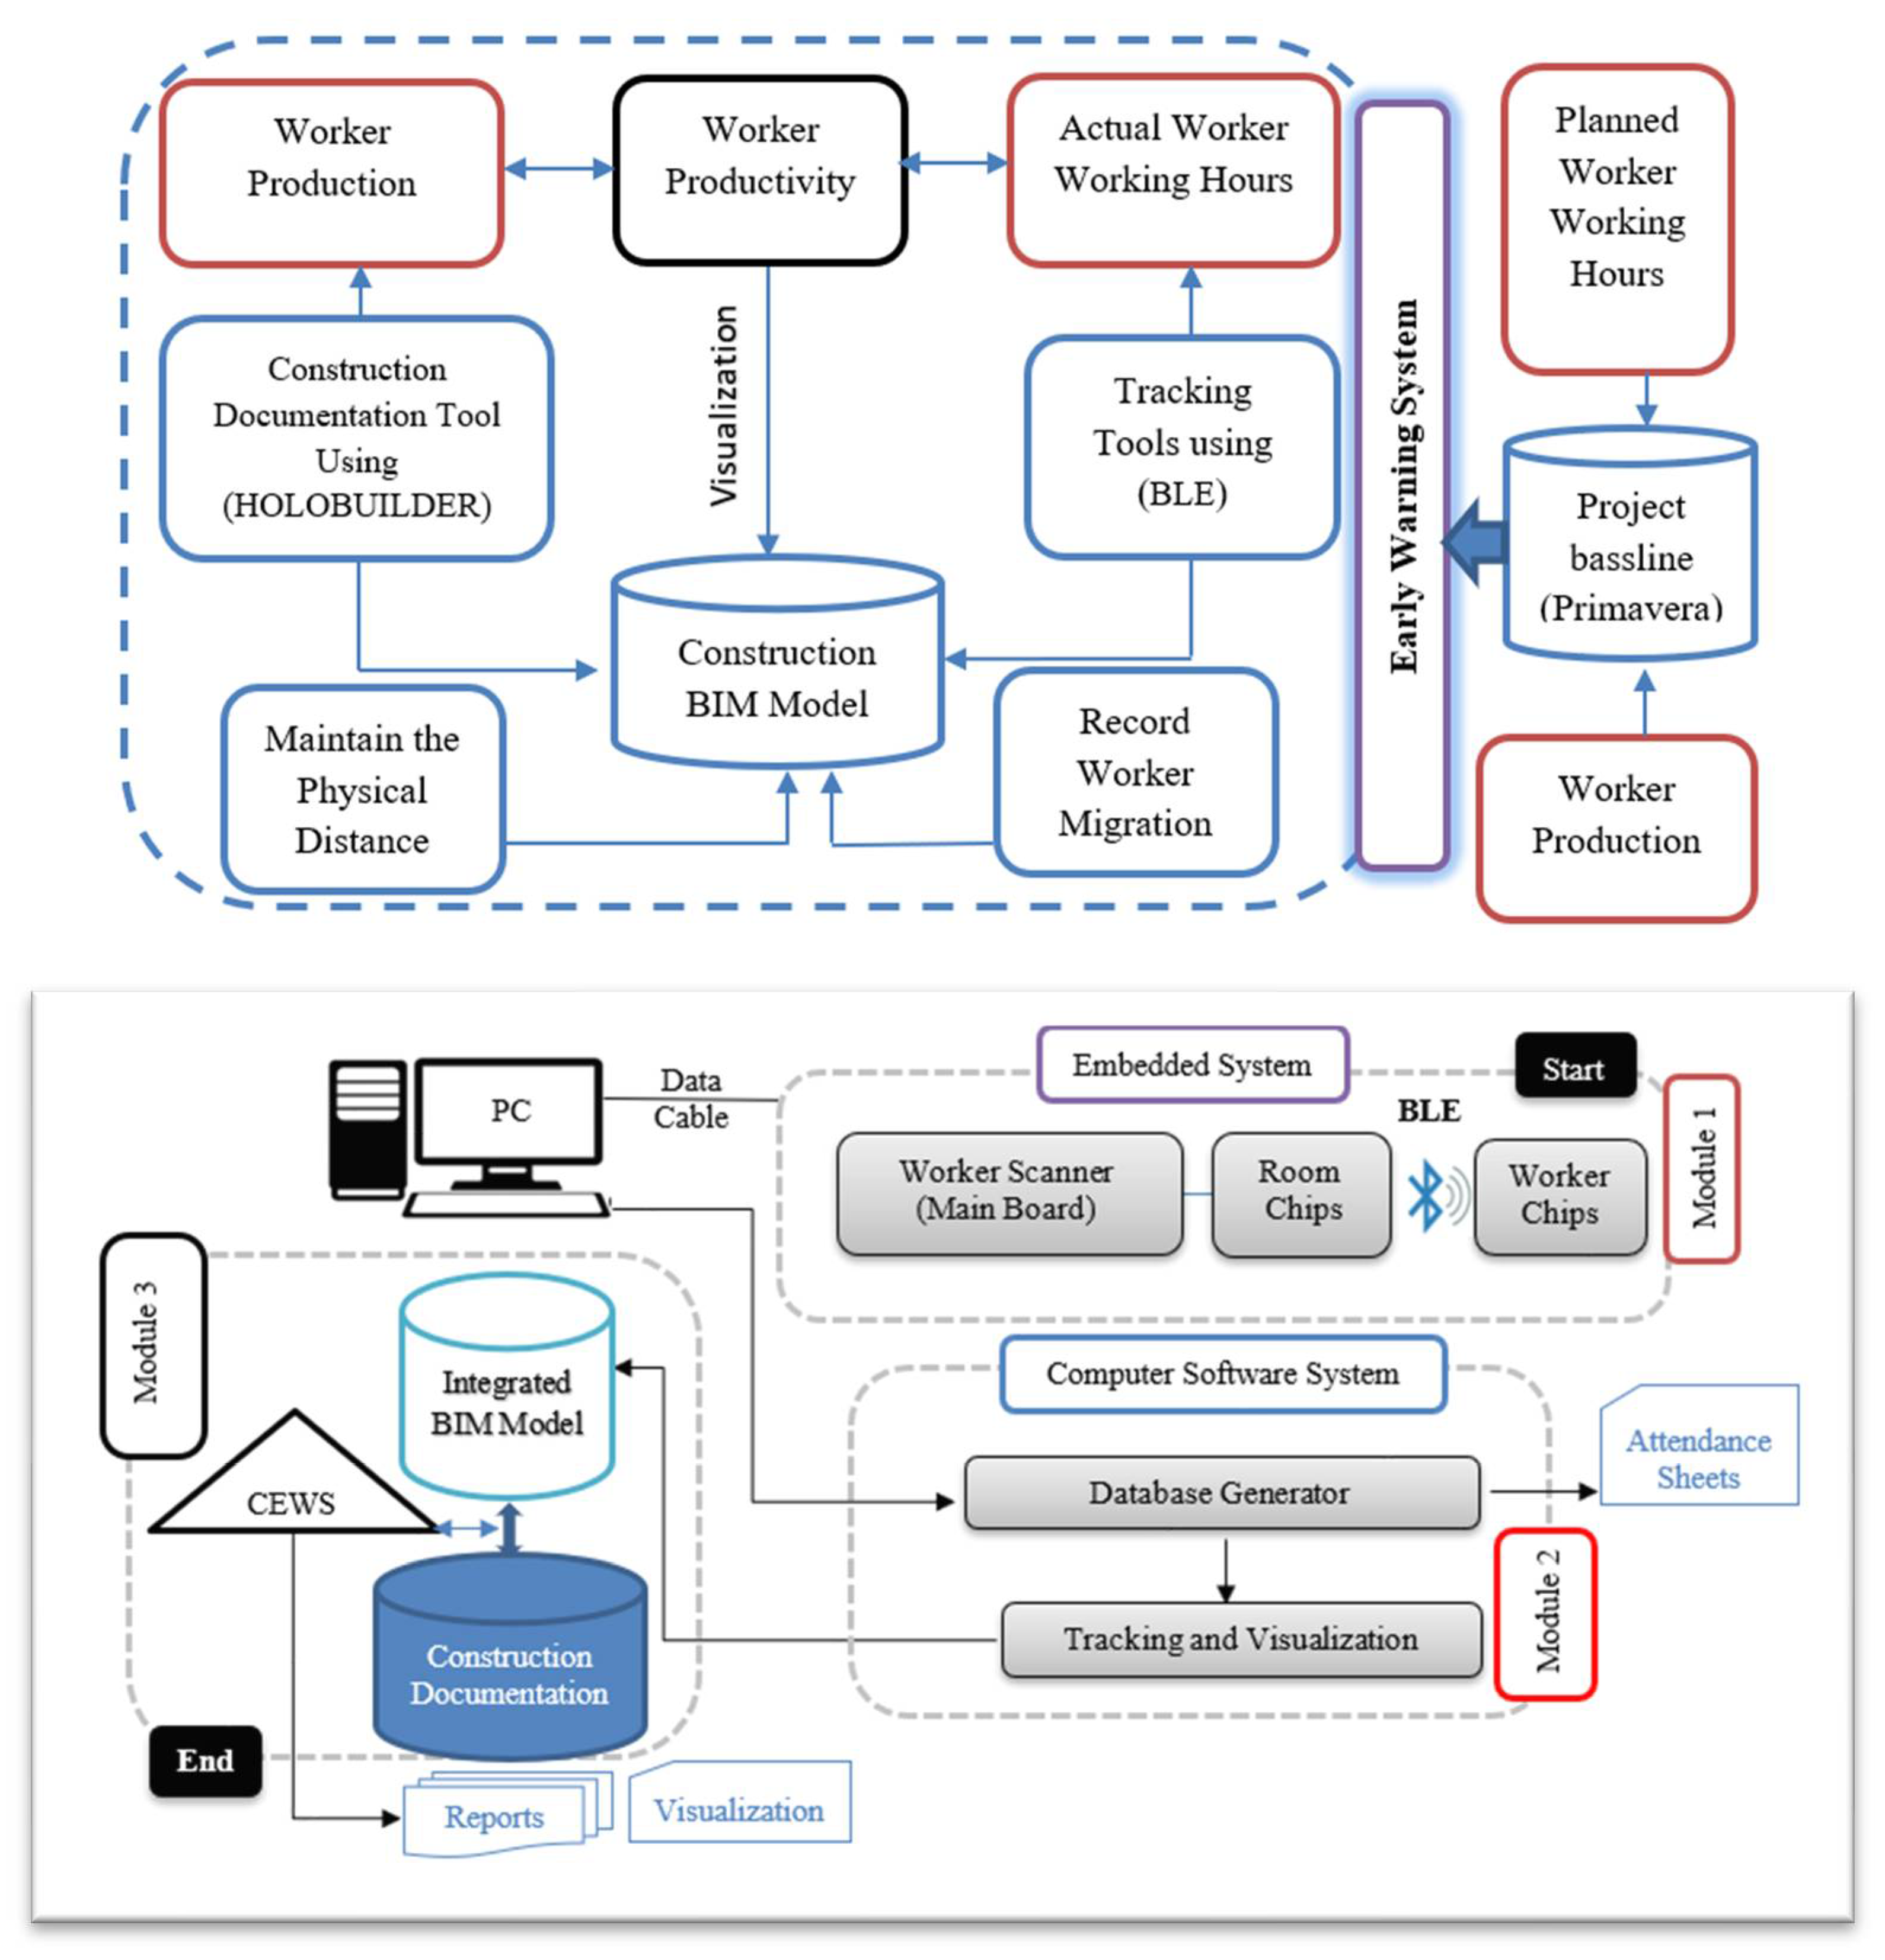
The methodology of this research was meticulously developed to ensure a robust and repeatable study, focusing on optimizing construction resource management through the innovative use of integrated digital technologies. At the core of our approach lies the seamless integration of Agent-Based Modeling (ABM), Building Information Modeling (BIM), and Bluetooth Low Energy (BLE) technologies, each selected for its ability to contribute to a holistic view of project management and execution; as shown in
Figure 3(A), and
Figure 3(B).
The ABM was operationalized using a state-of-the-art software suite that allowed for the detailed simulation of autonomous agents, reflecting the actions and interactions of workers and resources within the construction environment. BIM was implemented via a leading industry-standard platform, providing a rich, three-dimensional representation of the construction project, which was continuously updated in real-time to reflect on-site conditions. BLE technologies were integrated to facilitate precise and energy-efficient tracking of construction resources, leveraging advanced sensors known for their reliability and accuracy.
For system configuration, a Client Early Warning System (CEWS) was established, utilizing sophisticated algorithms to process data and trigger early alerts for potential project deviations. This was complemented by a Decision Support System (DSS), which employed a real-time analytics engine to synthesize the data into actionable insights, allowing project managers to make informed decisions swiftly. The DSS was intricately woven into the BIM framework, ensuring that all decision-making was grounded in the most current project data.
The data collection process was rigorous and methodical, with BLE sensors placed strategically across the construction site to capture a wide array of operational data. The frequency and parameters of data collection were set to capture a comprehensive dataset, while calibration and preprocessing protocols were established to ensure the integrity and reliability of the data collected.
A detailed case study at Helwan University's College of Engineering served as the empirical ground for testing our integrated methodology. The implementation steps were carefully documented, from the initial setup of the technological systems to the continuous monitoring and troubleshooting throughout the project duration. Ethical considerations, especially concerning participant privacy and data security, were paramount throughout the study. All data collection methods were approved by an institutional review board, with clear protocols for anonymization and consent in place.
Despite the successful application of our methodology in the case study, we have identified limitations that provide fruitful directions for future research. The scalability of BLE technology in larger or more complex construction environments presents a challenge that future studies might address. Furthermore, the integration of additional data sources and the potential for machine learning to enhance predictive analytics in construction management are areas we recommend for exploration.
5.1. Database Mapping
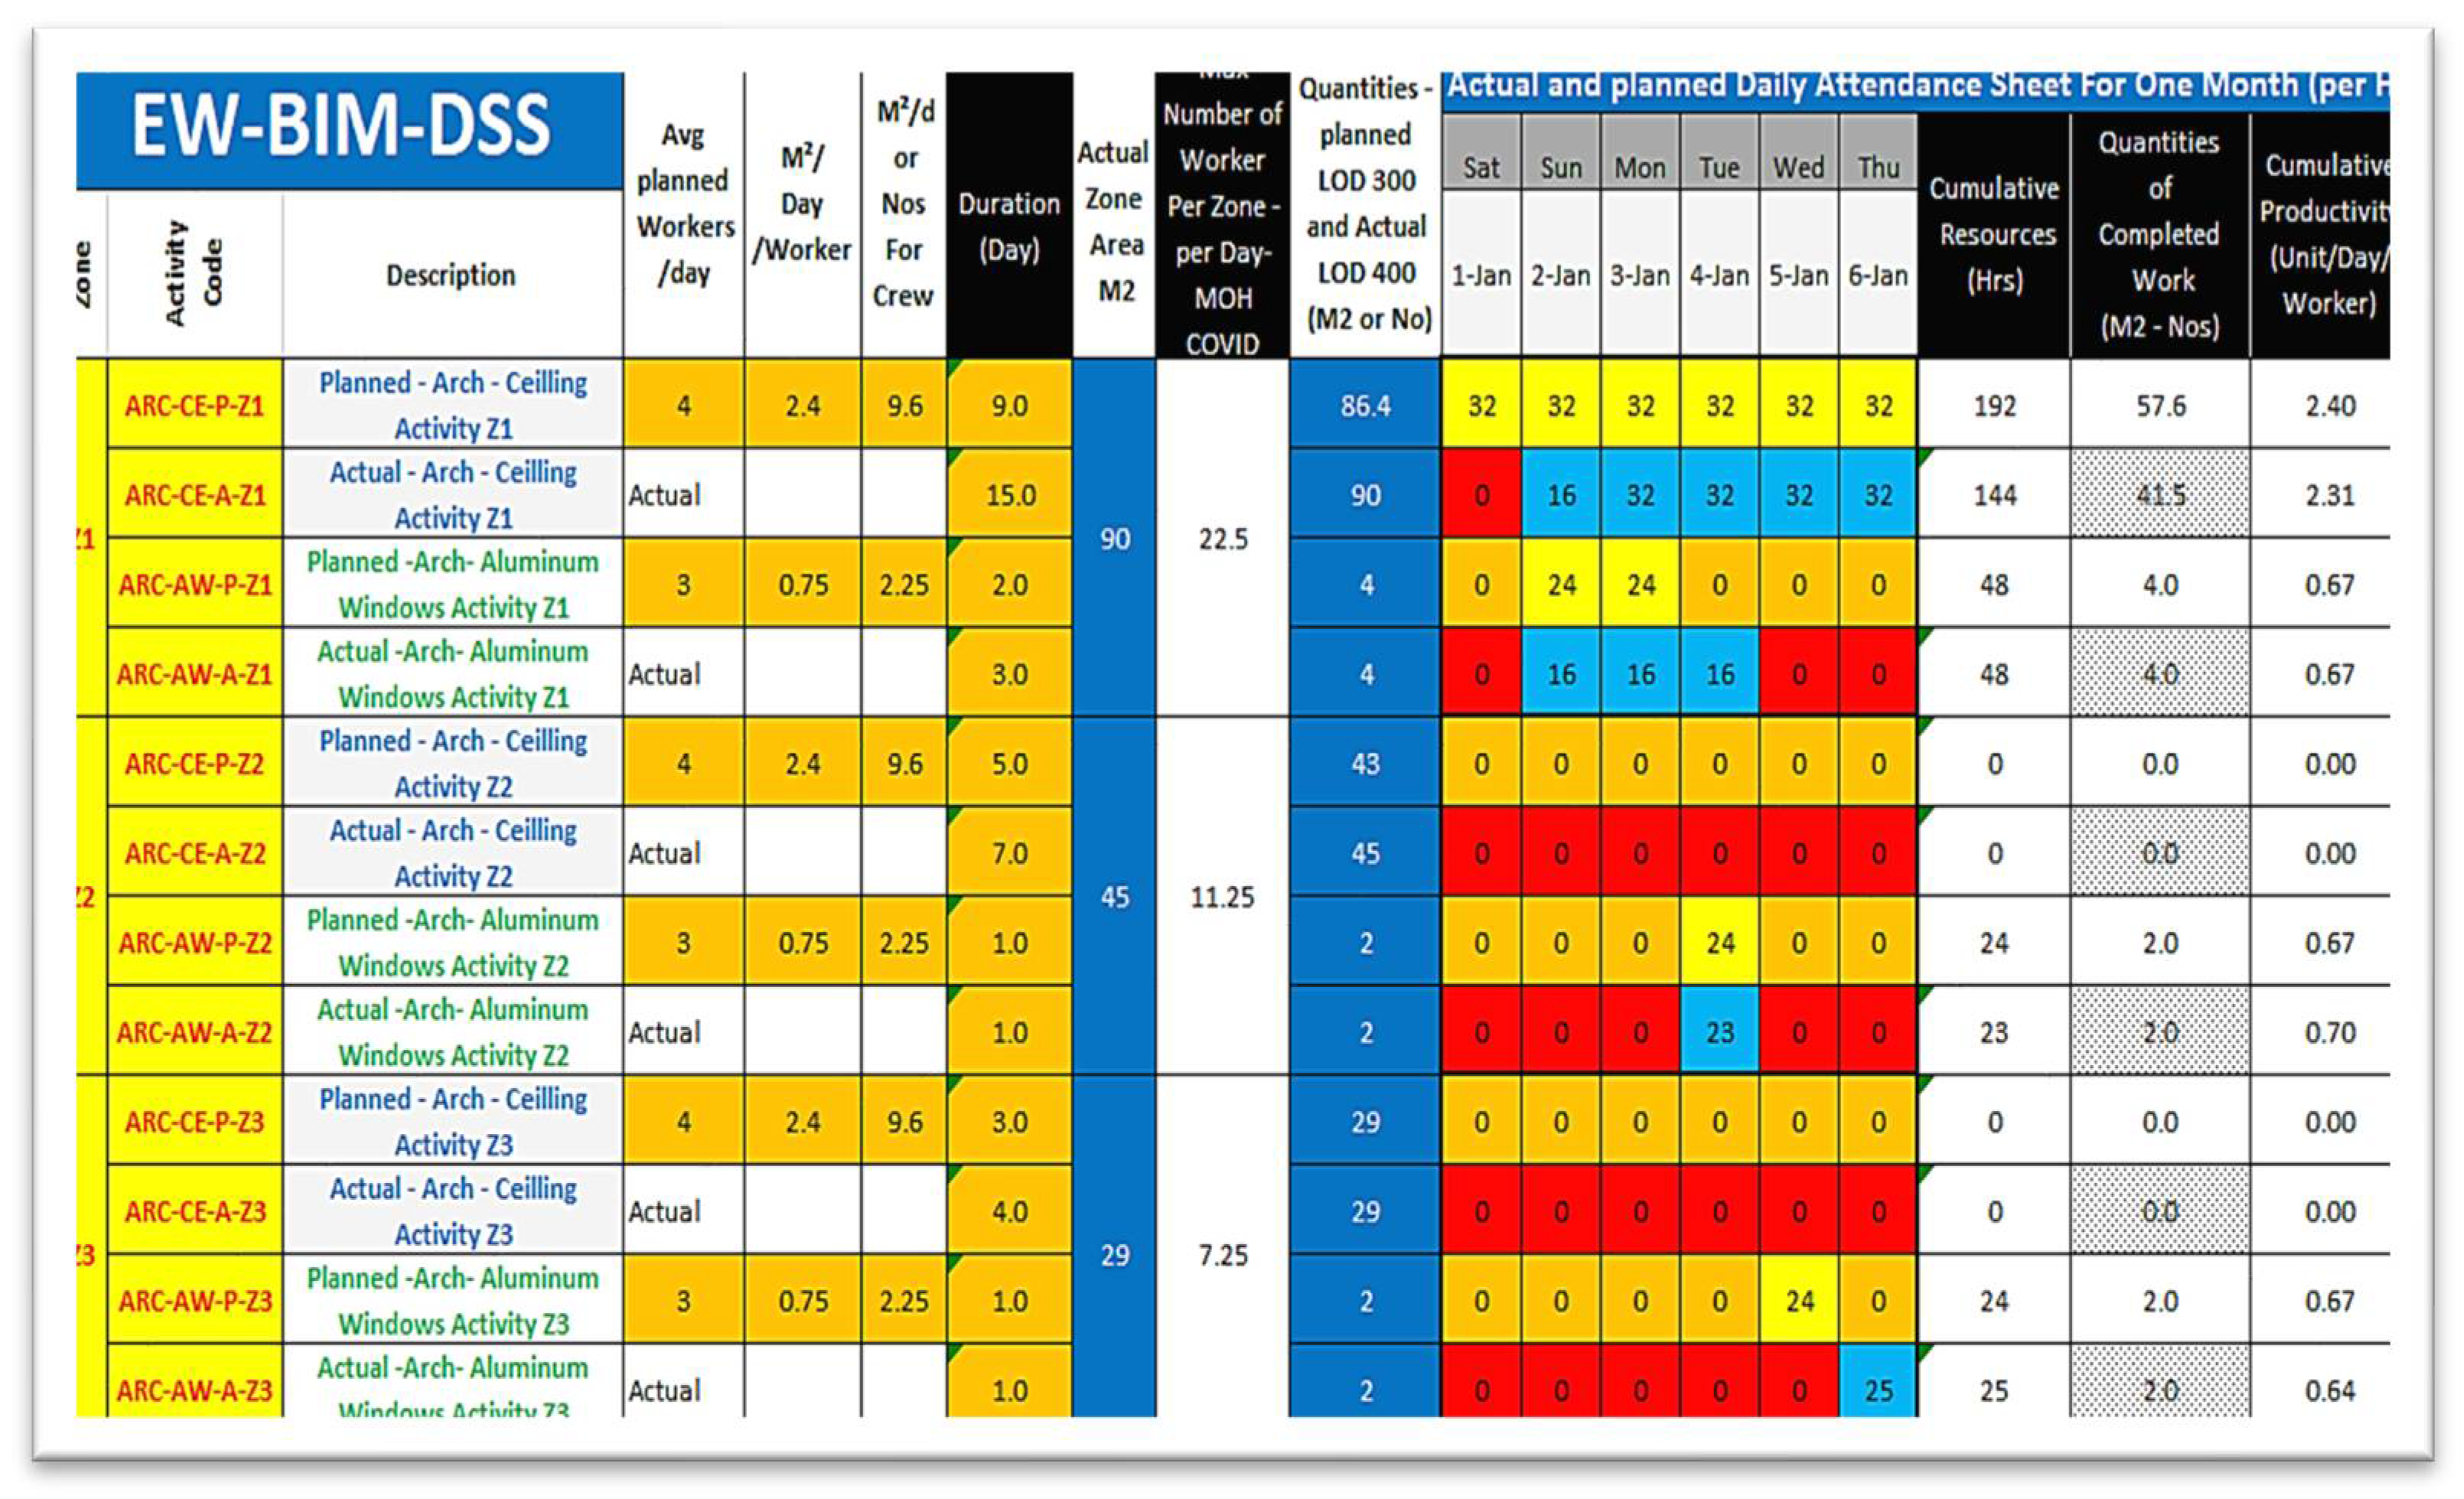
The CEWS deals with a variety of different types of forms that support different perspectives. According to the study, the Decision Support System (DSS) Excel sheet was proposed to support the main dashboard. The DSS will serve as an inventory for the project as well as a tracking system for data. For each parameter in the DSS sheet, its units, data source, and a method for creating integration link.
Table 1 provides a mapping of the data model and interoperability between different software, where Primavera and BLE devices serve as the primary source of information. This data will be integrated with the DSS through an Application Programming Interface (API), an Excel equation, or filling in blanks in the DSS as needed.
Table 2 compares different tracking technologies; Procedures, Faults, and Solutions [
6].
5.2. Tools and Technologies
To implement the proposed technique, BLE devices were adapted and configured to enable accurate indoor tracking, taking into account the specific availability and market considerations as shown in (
Figure 4).
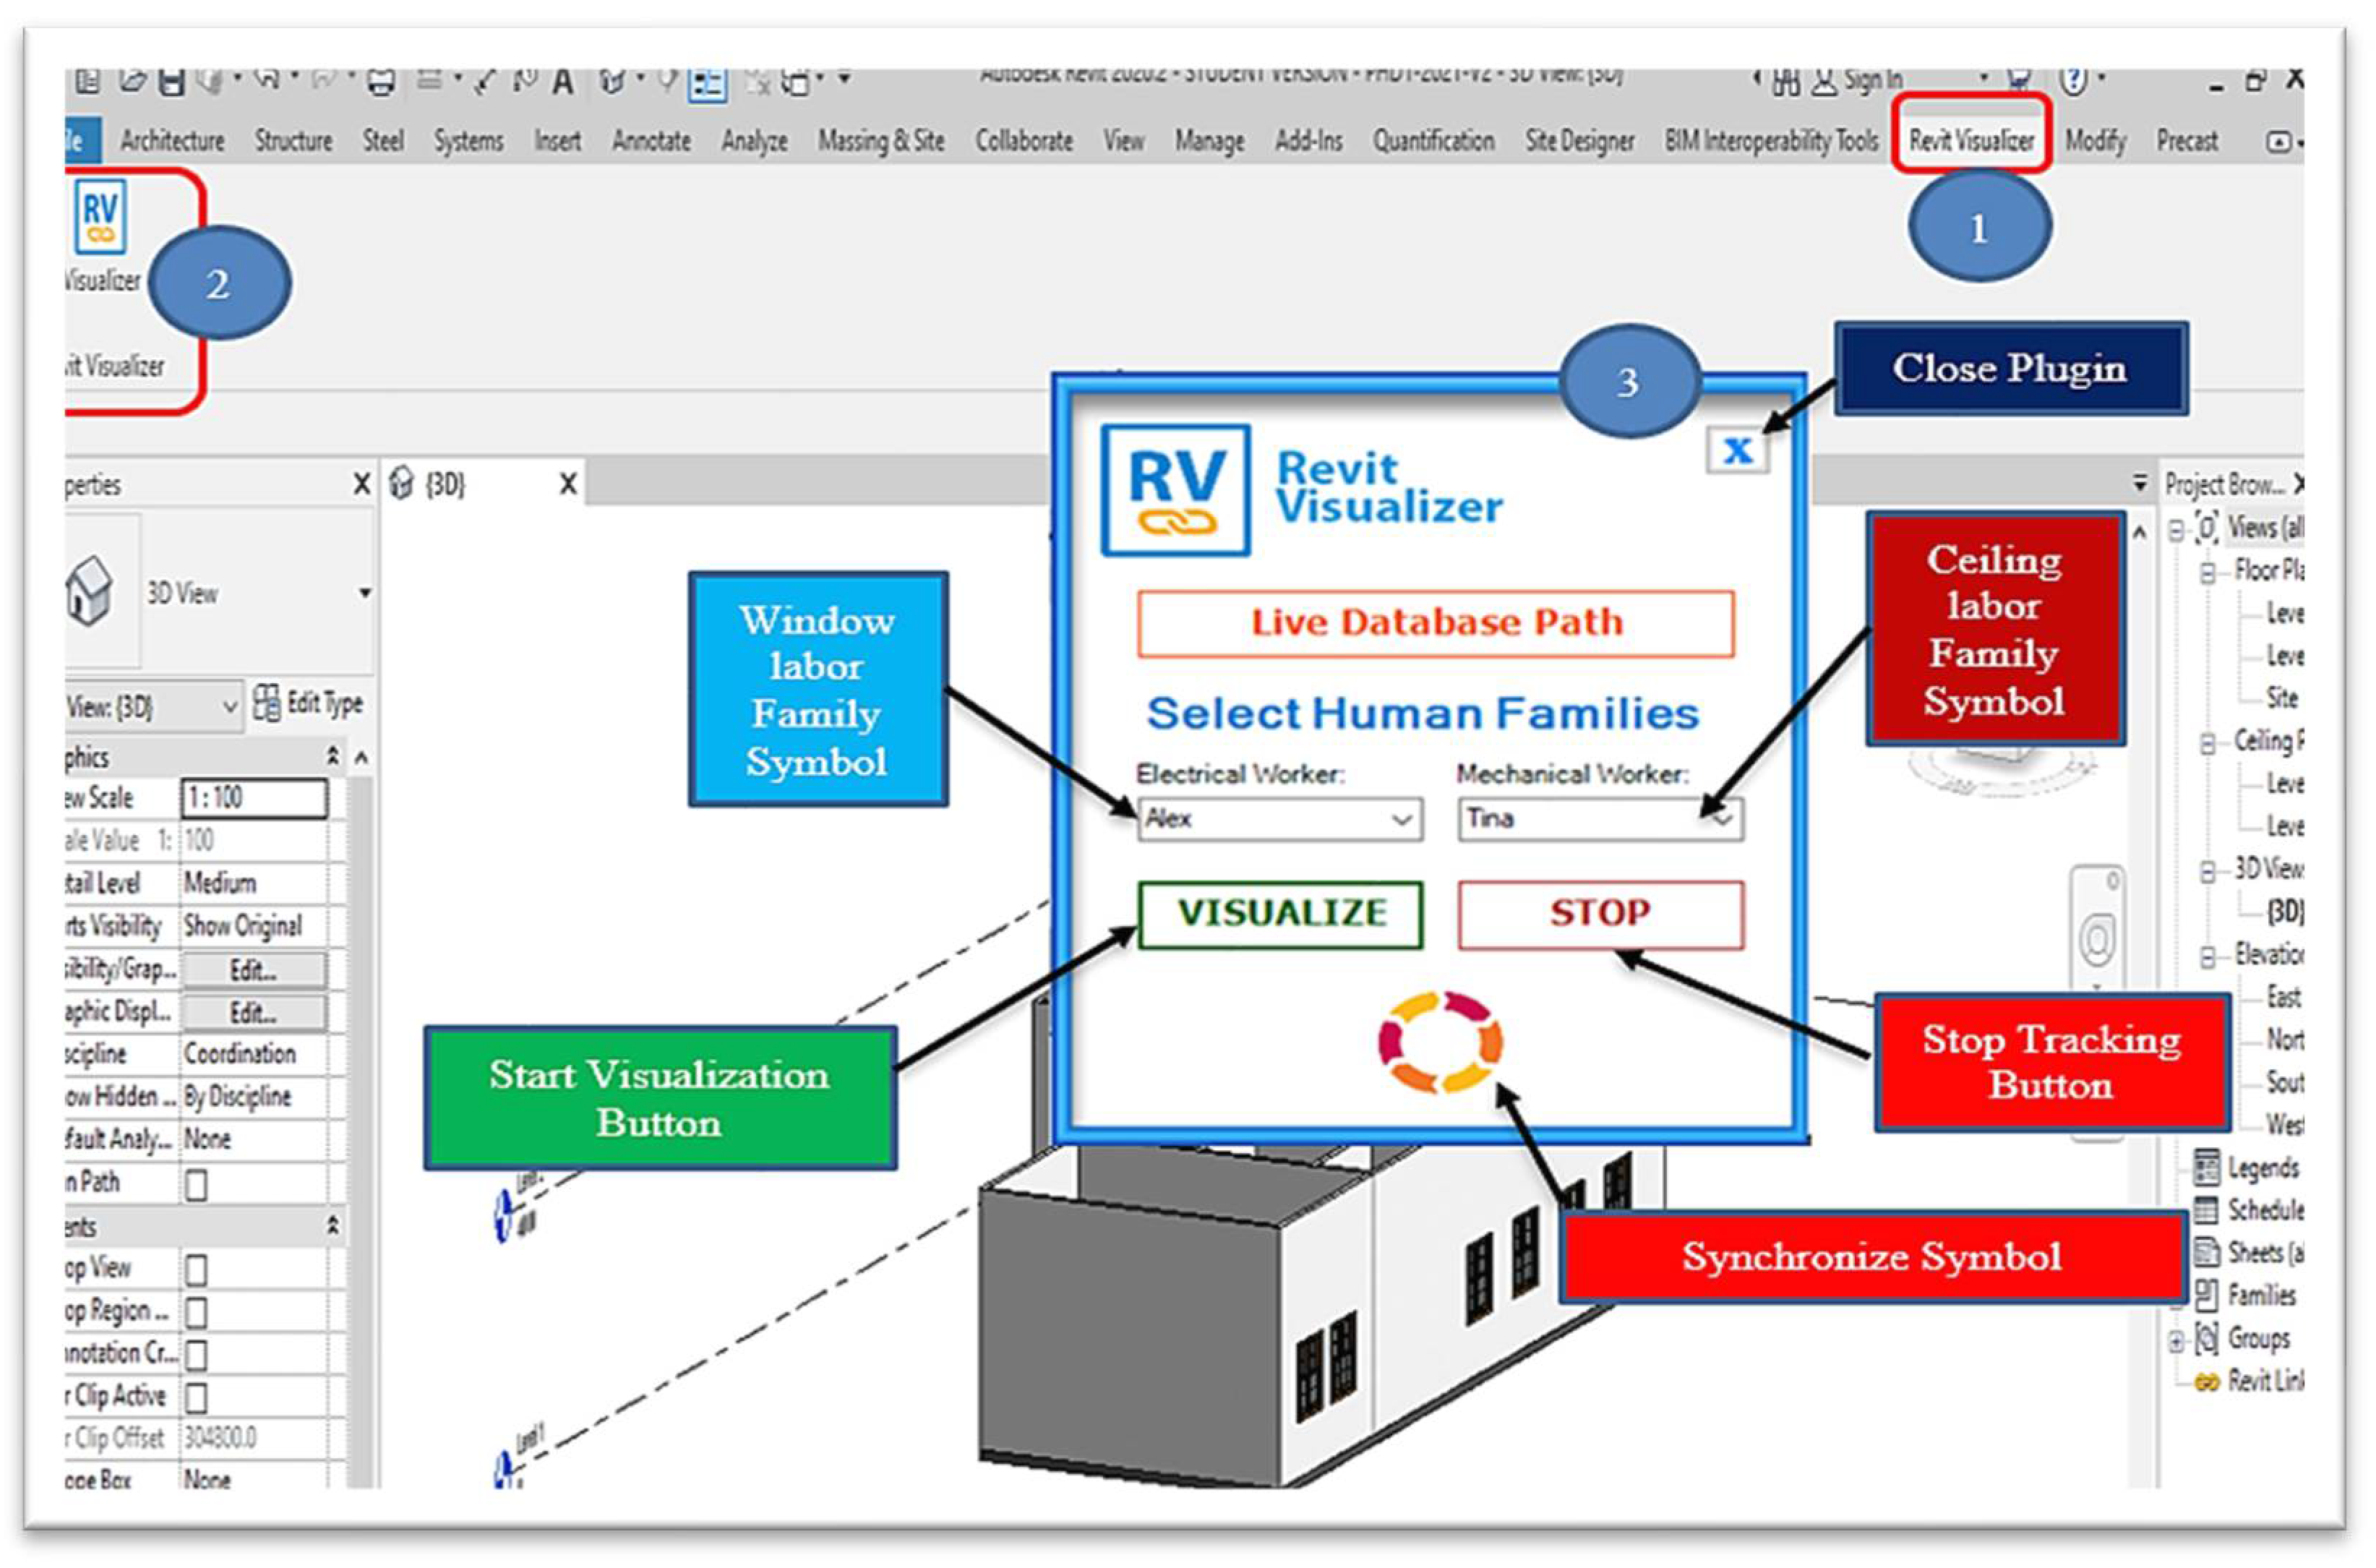
Additionally, a Revit Visualizer plugin was developed using C-Sharp (a programming language developed by Microsoft) and the Dot-Net Framework to integrate real-time worker status in the BIM model as shown in (
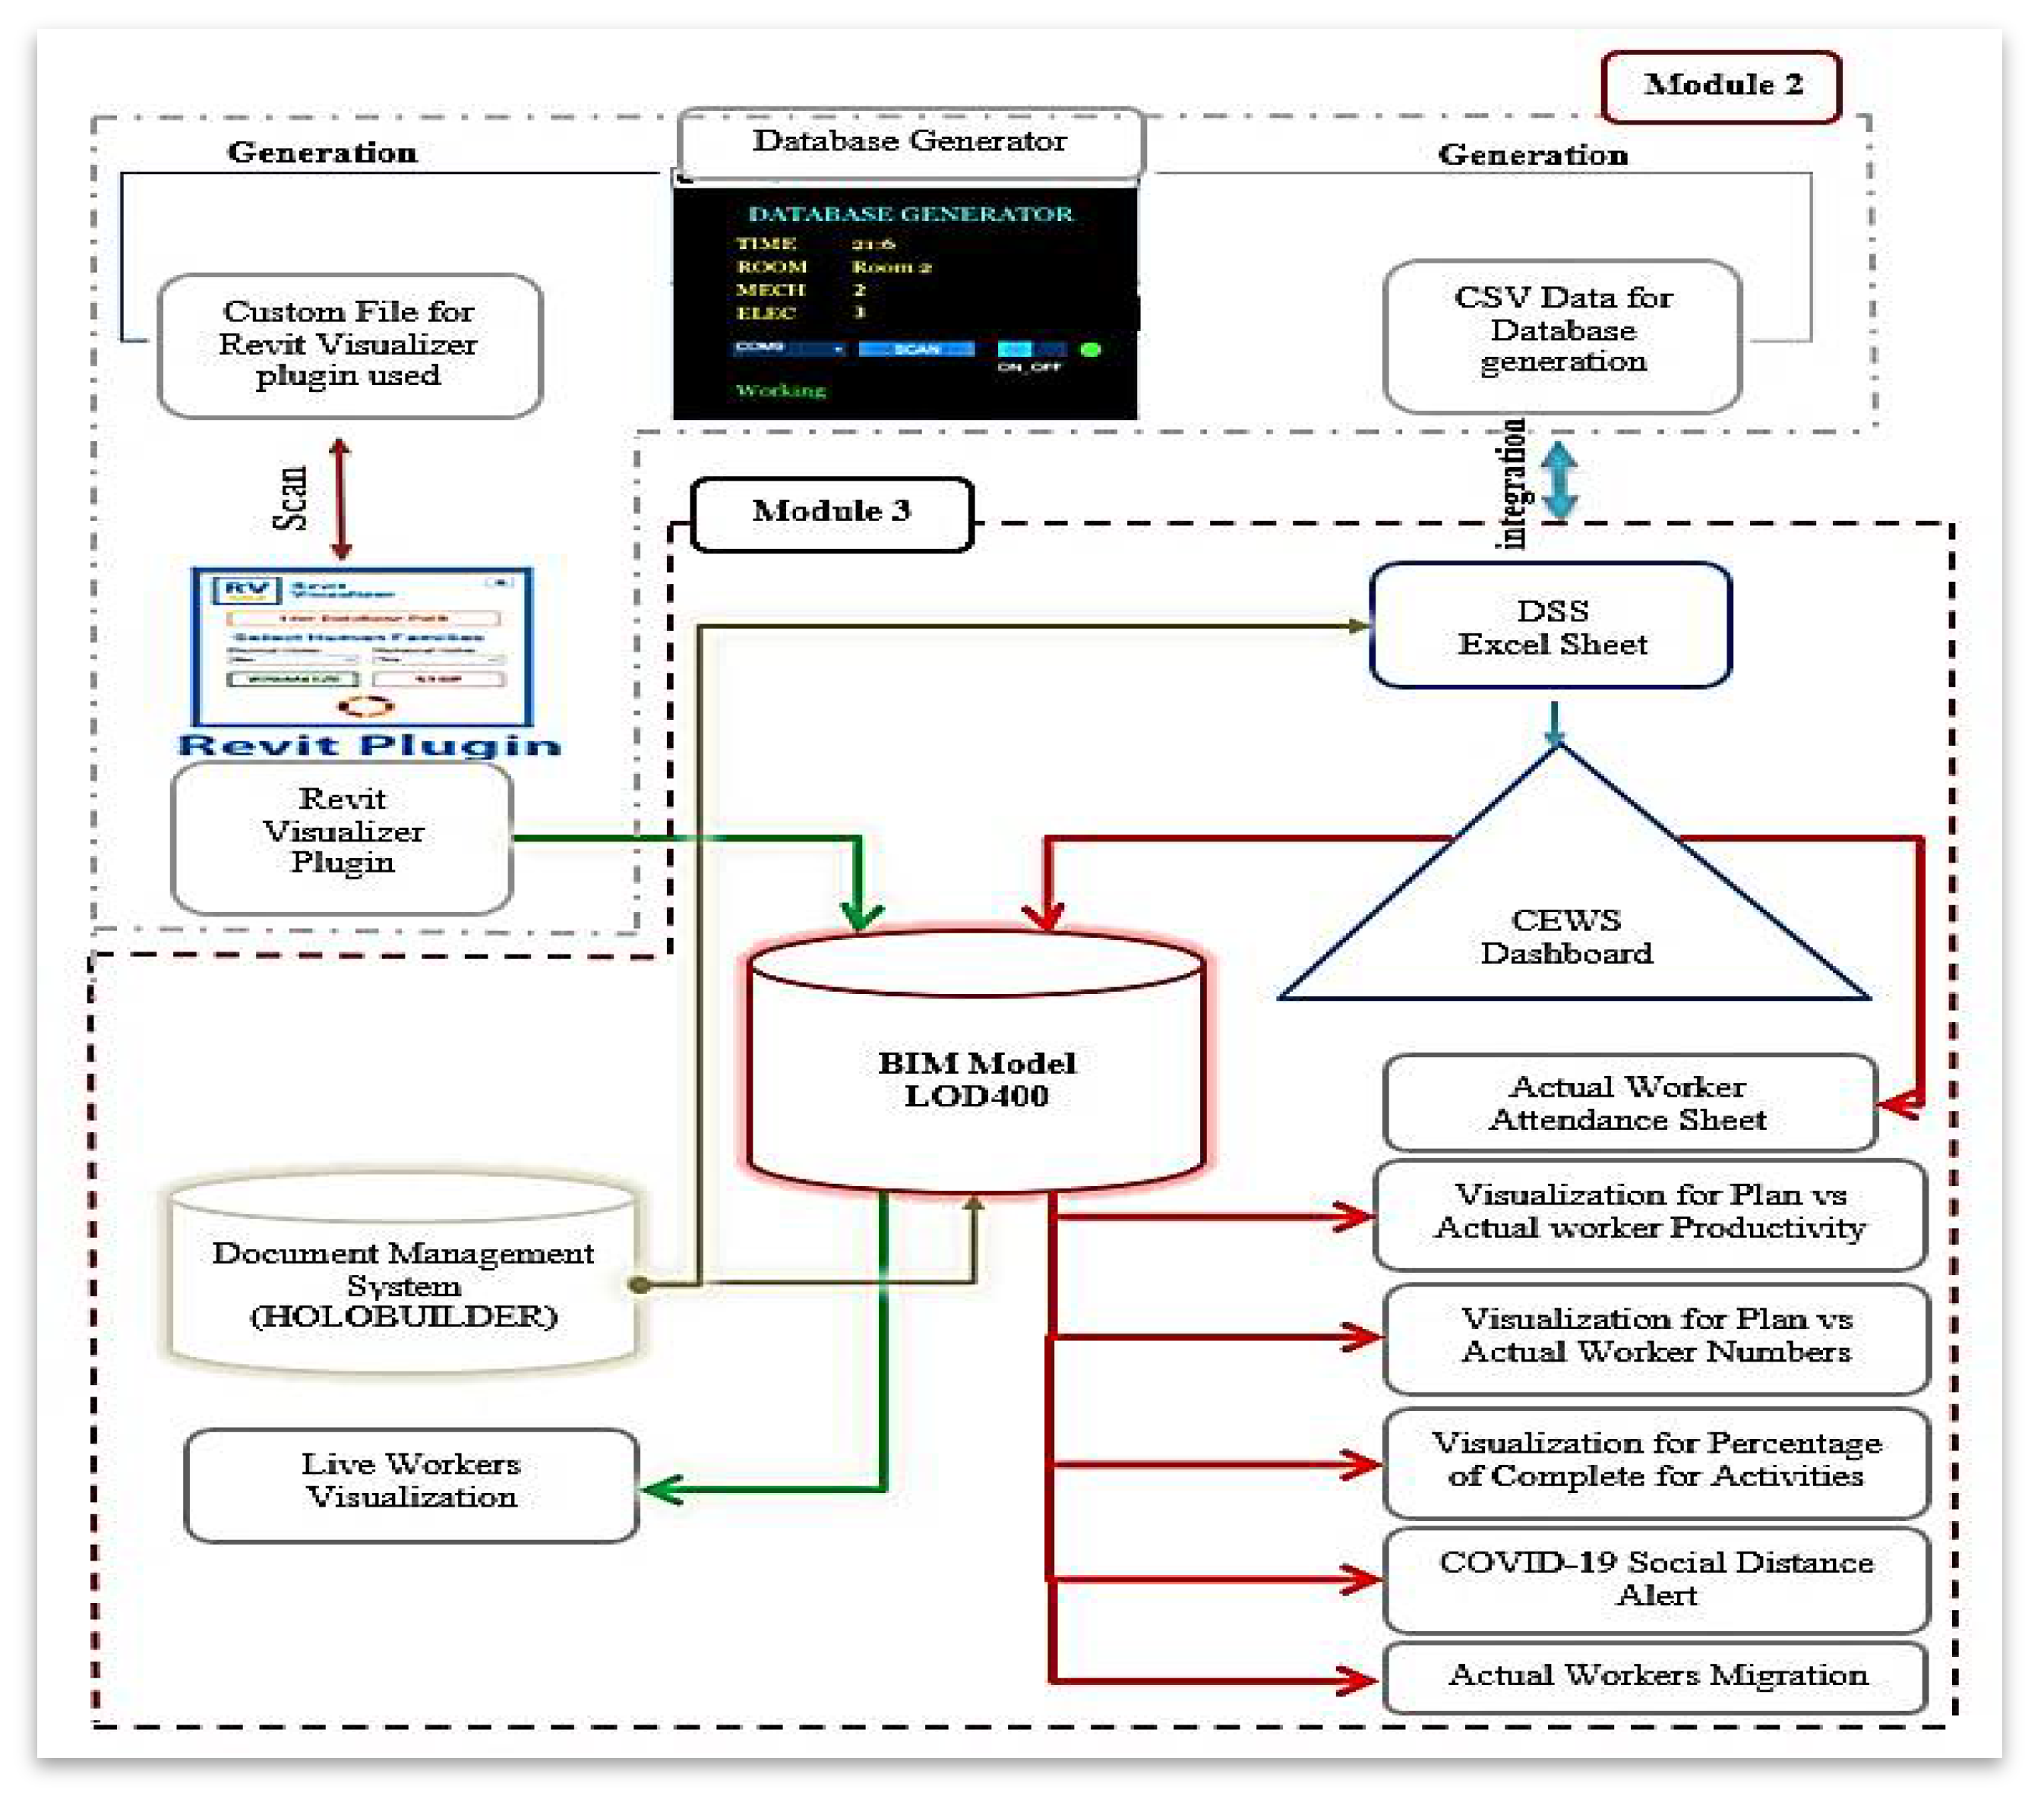
Figure 5). The database generator and visualization tool were developed to manage and visualize tracking data. There are three modules were integrated together.
5.2.1. Module One: Embedded System Development:
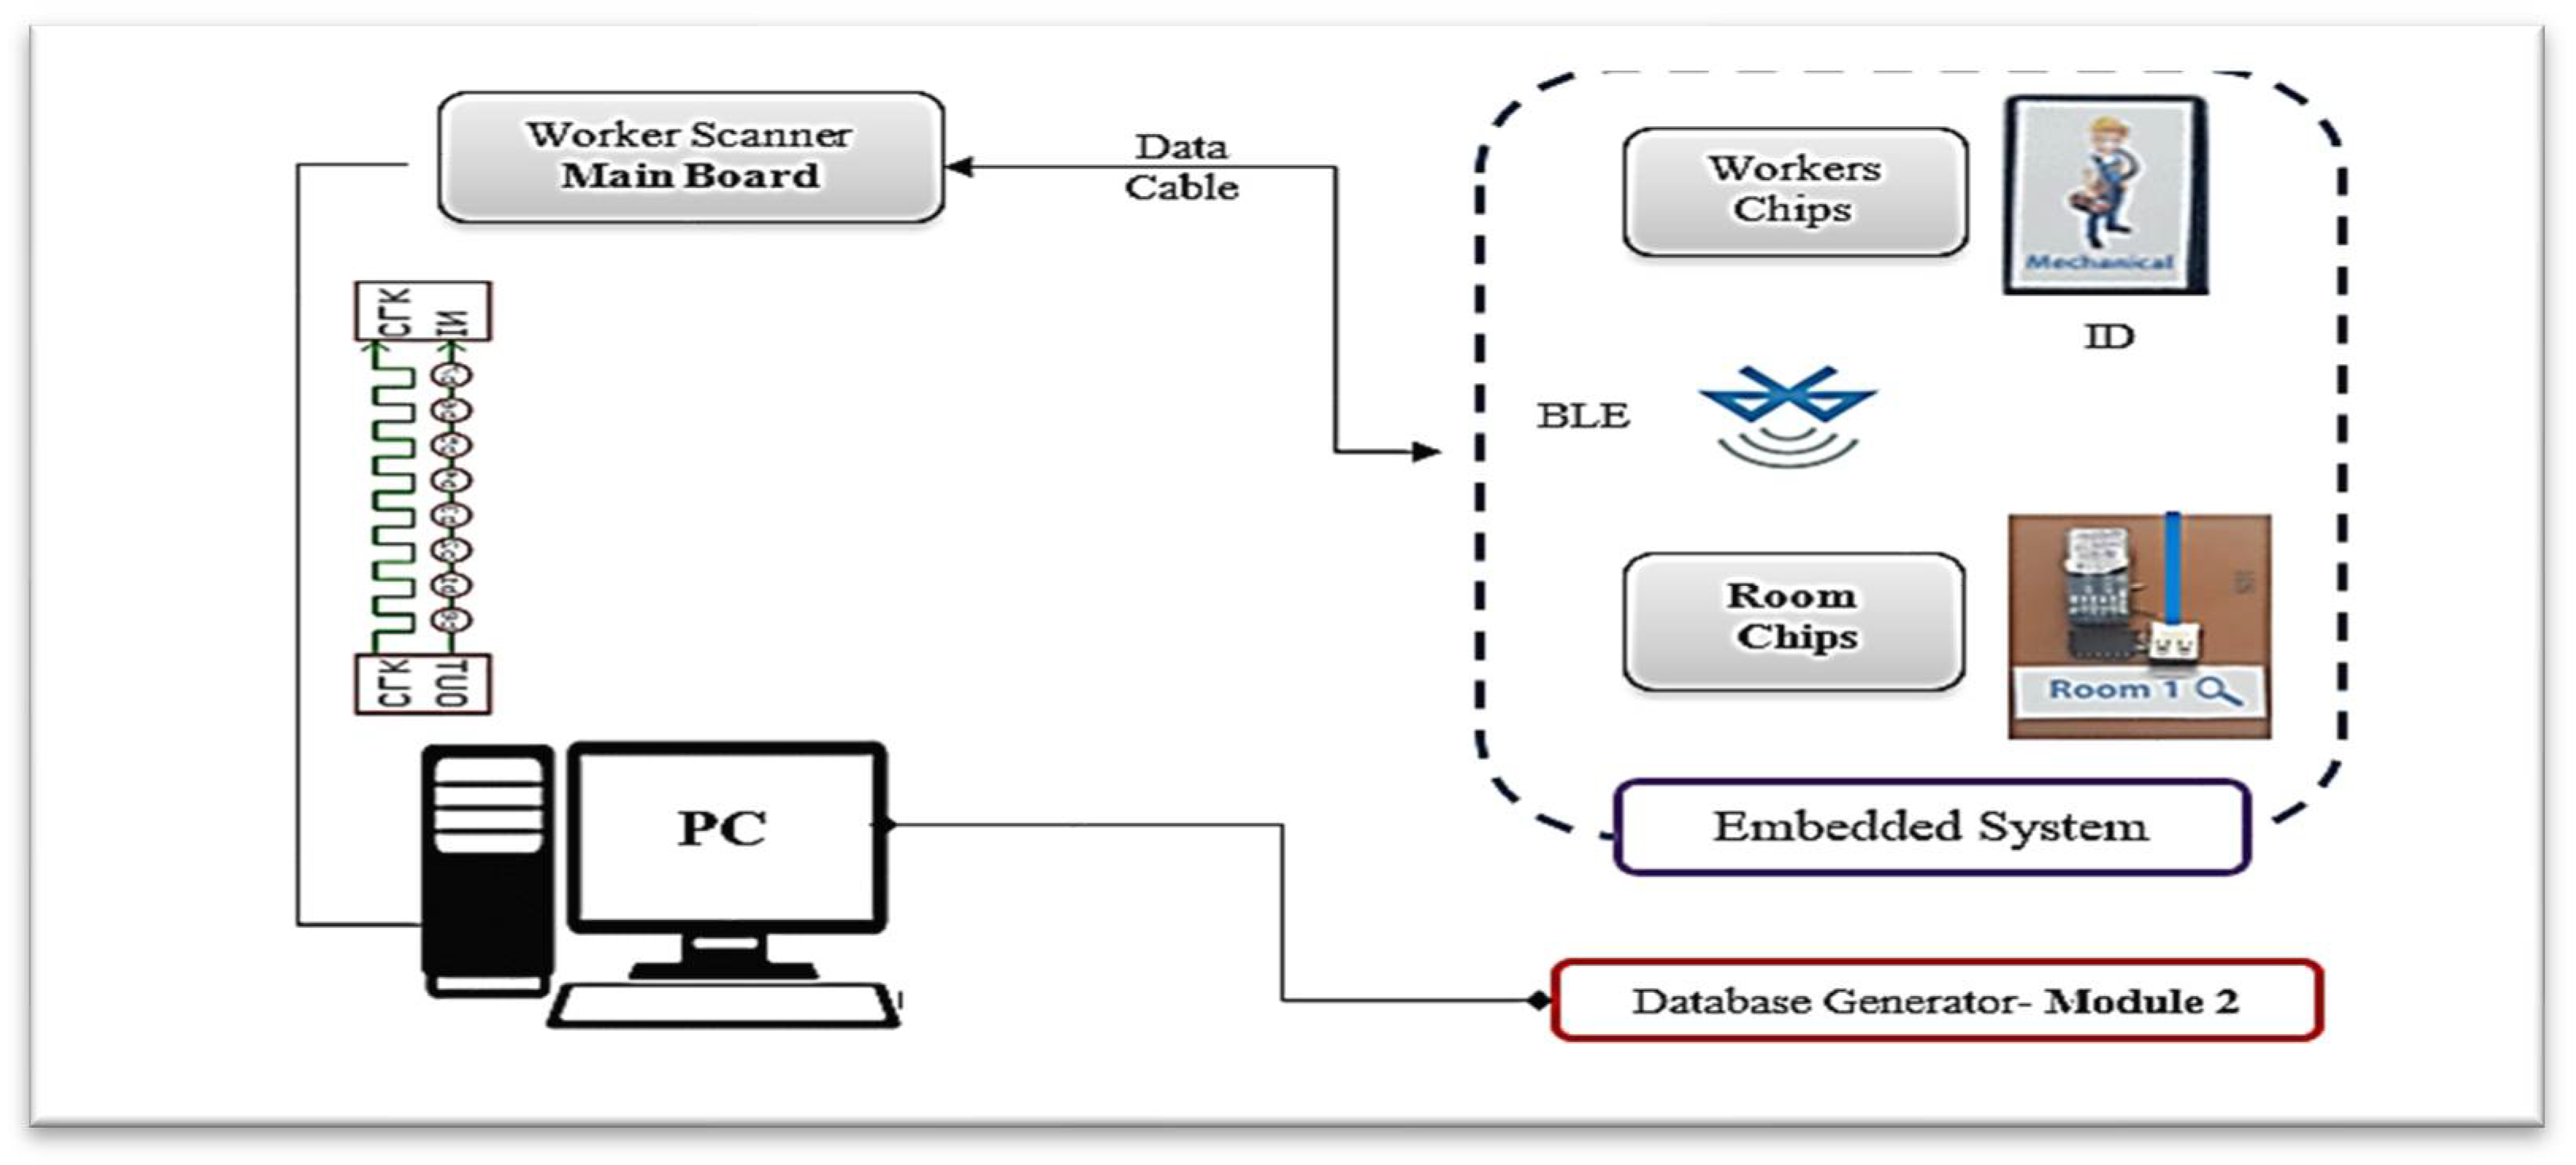
Module one focused on the development of an embedded system for indoor tracking. The Arduino software, an open-source Integrated Development Environment (IDE), was utilized for code development and uploading to the worker scanner Mainboard. The embedded system is configured to assign a worker's name and enable continuous broadcasting of worker tags with identification and location information. The main board facilitates communication with zone ship readers and collects the data for further processing, see (
Figure 6).
5.2.2. Module Two: Database Generation and Visualization
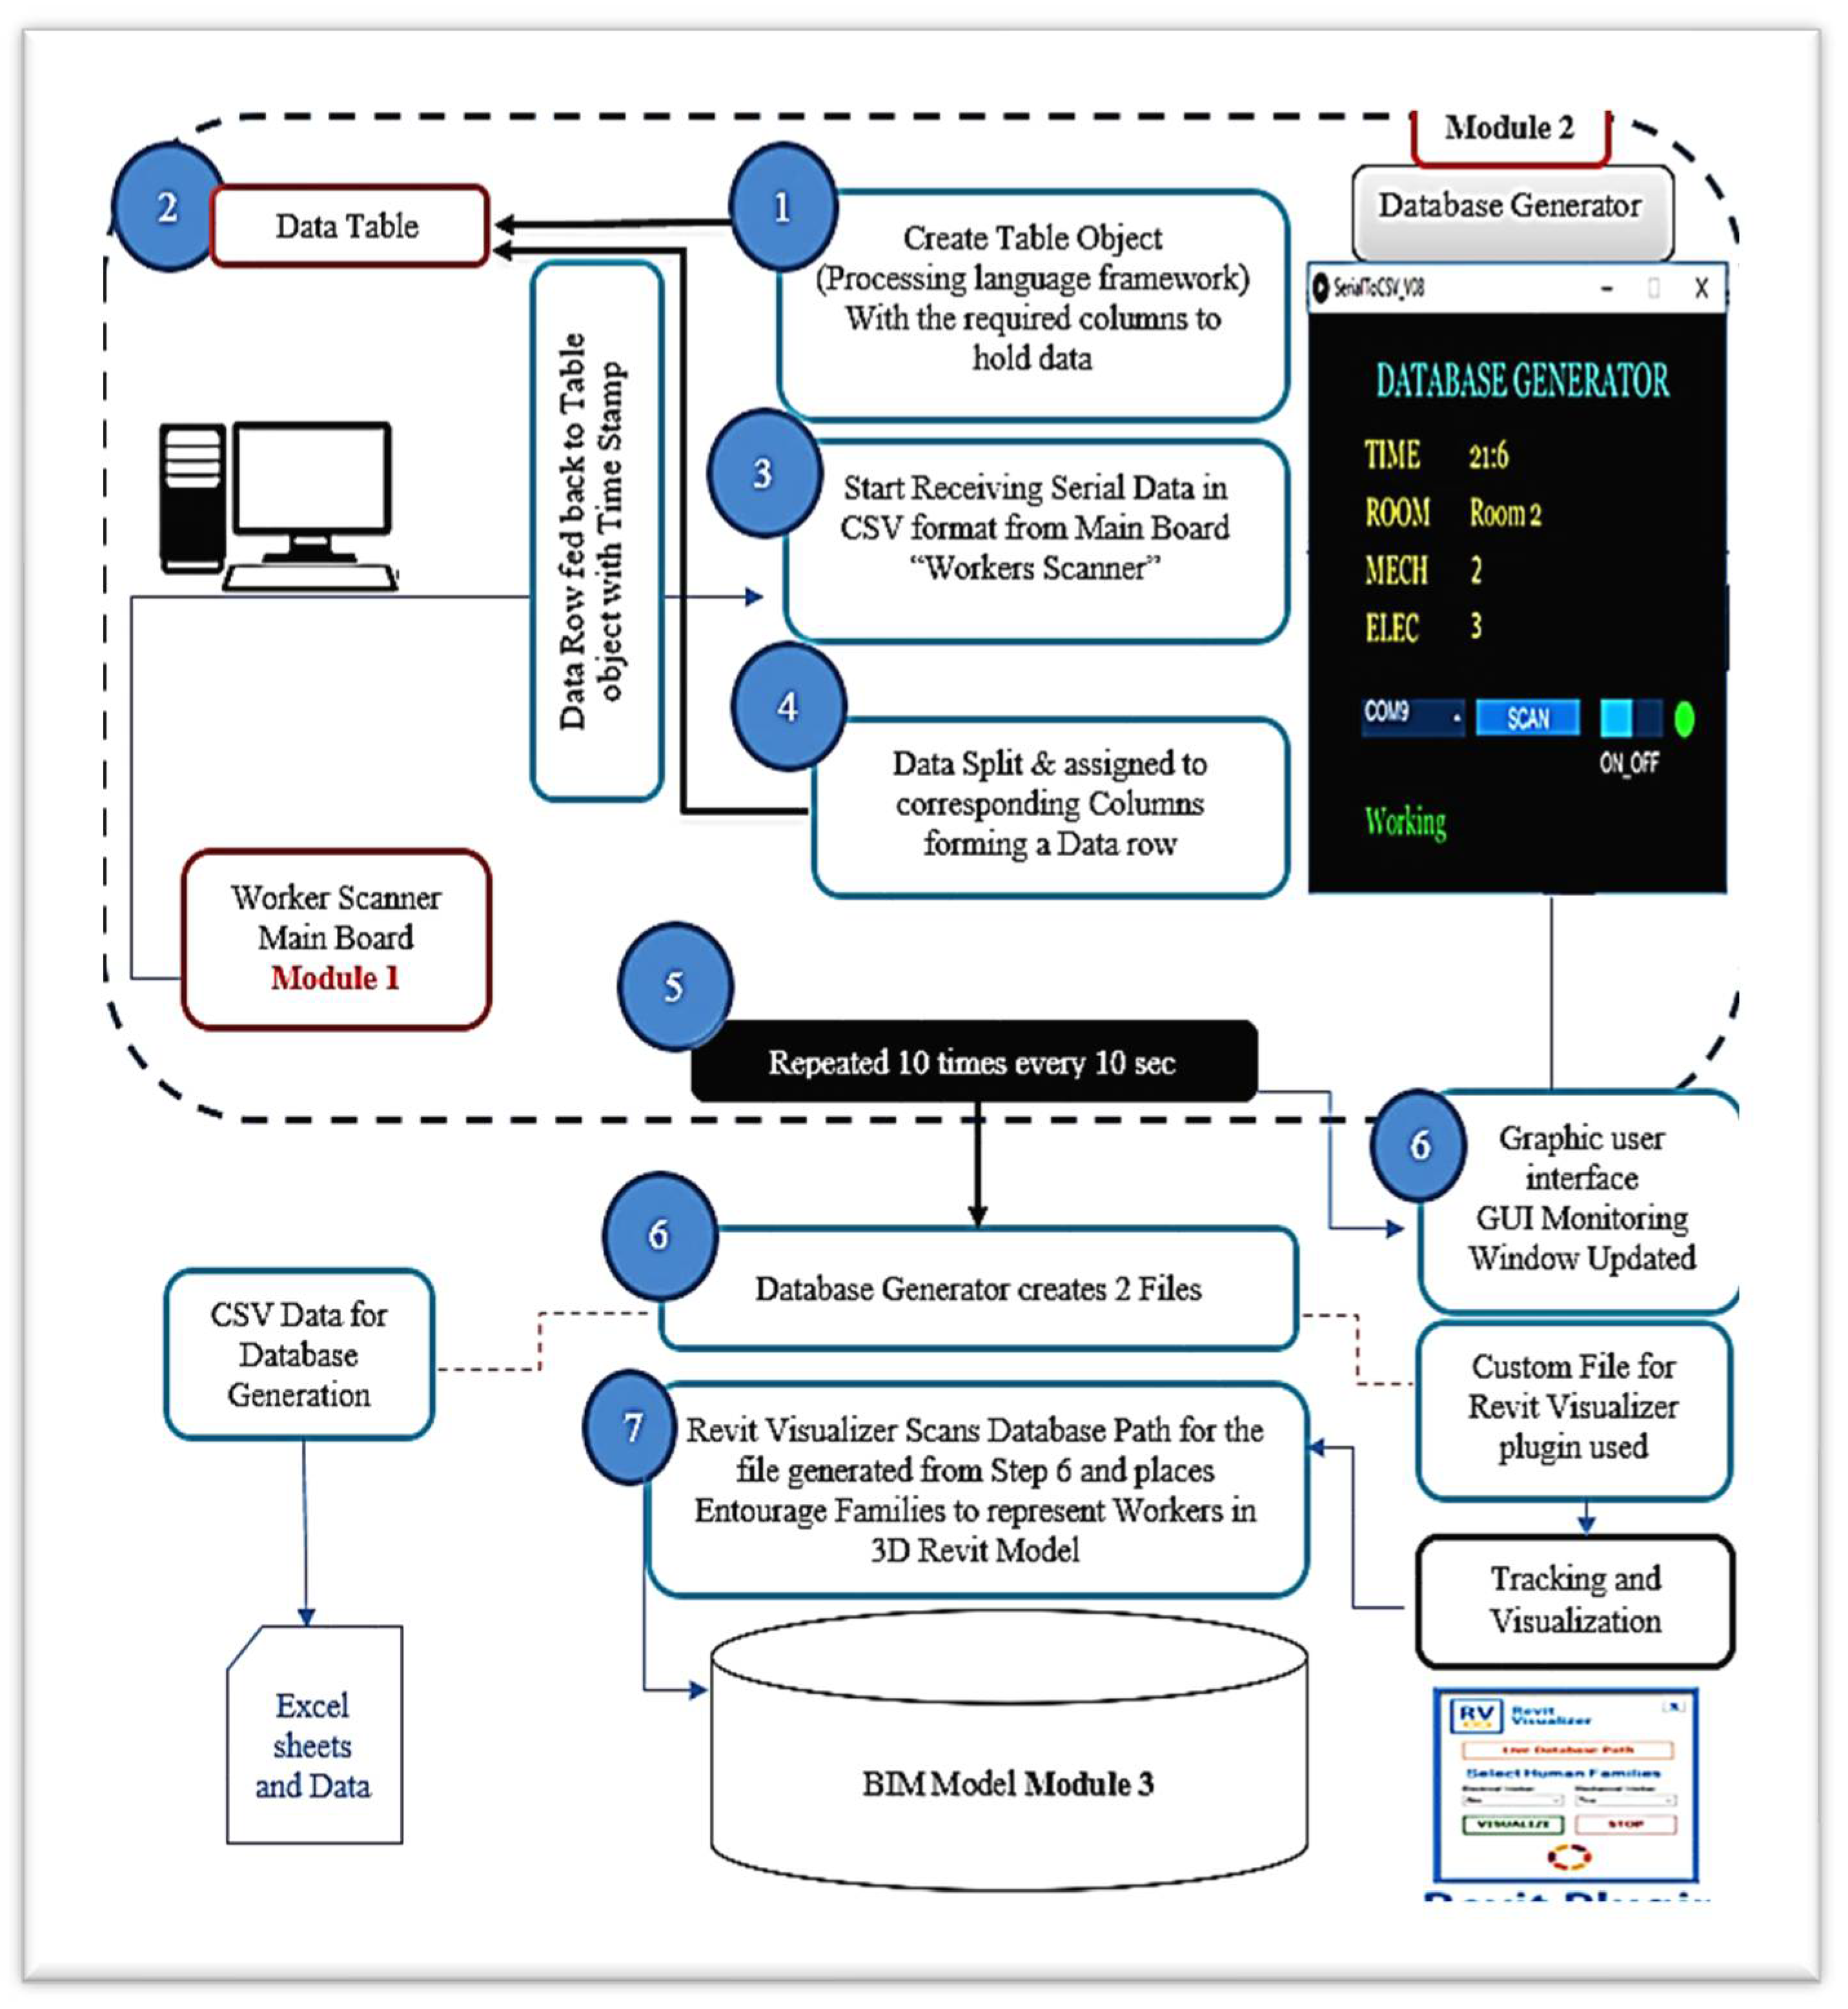
Module two involved the development of a database generator and visualization tool. The database generator serves as the middleware of the tracking system, receiving data from the worker scanner in comma-separated values (CSV) format. The data was processed, assigned to corresponding columns in a structured database, and enriched with timestamps for accurate worker attendance tracking. The visualization tool integrates with the BIM model to provide real-time visualization of worker positions and status as shown in (
Figure 7).
5.2.3. Module Three: Construction Documentation and Client Early Warning System (CEWS)
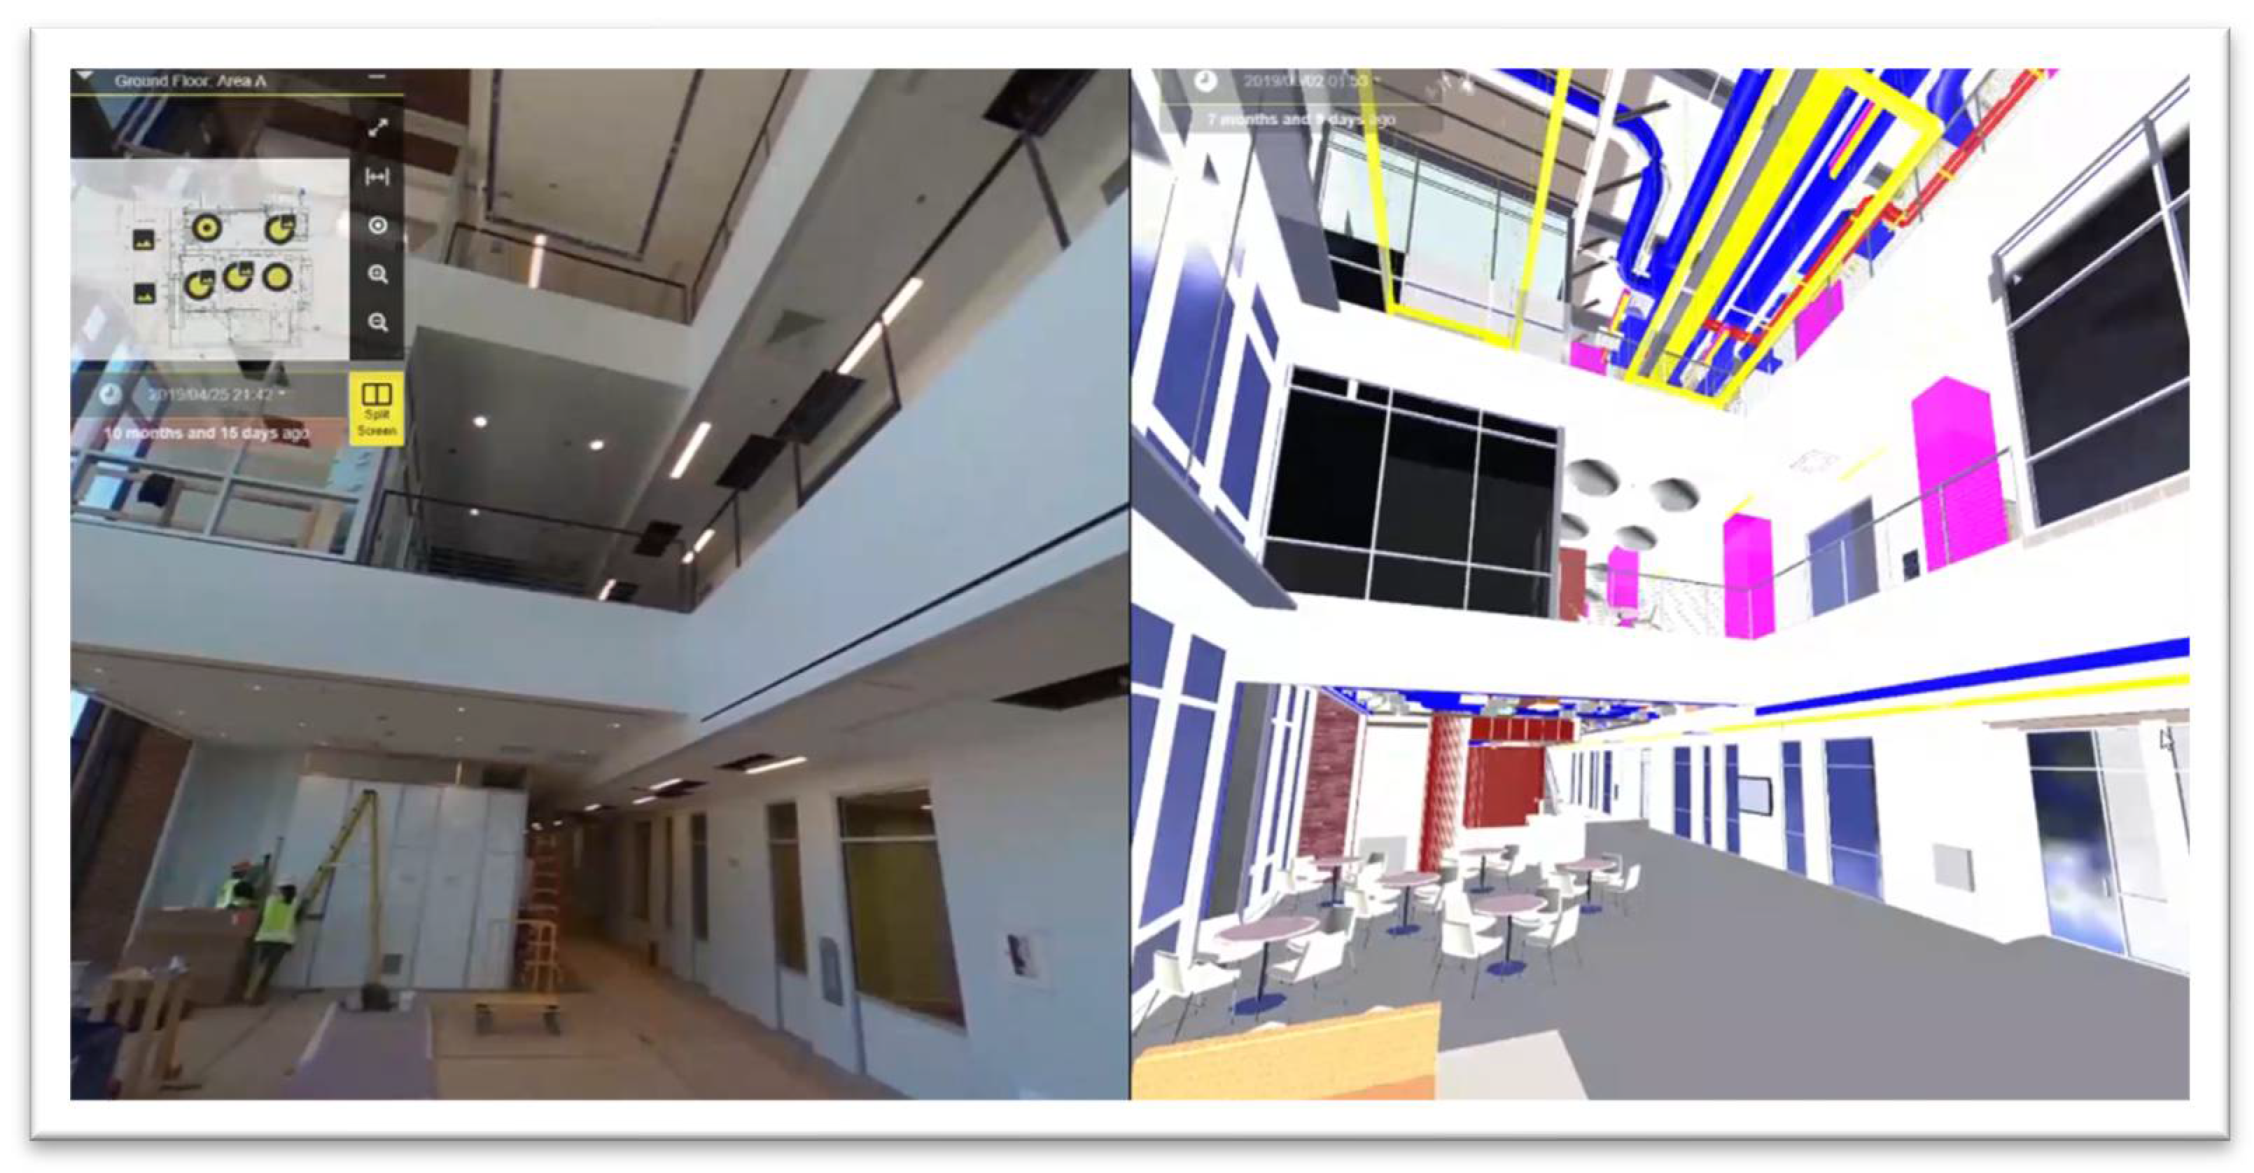
Module three focused on construction documentation and the implementation of the Client Early Warning System (CEWS). A 360-degree camera was employed to capture construction progress, and a suitable platform such as HOLOBUILDER was utilized for efficient construction progress management and documentation as shown in (
Figure 8). The 360° photos captured by the camera were integrated with the BIM environment, enabling a comprehensive visualization of the construction site (
Figure 9). The CEWS was integrated with project planning software (e.g., Primavera), that collects planning dates and calculates productivity based on an activity-oriented model. Worker productivity visualization was an additional challenge that can also be displayed using various shapes based on their relationship to the planned data. The planning for the worker’s scenarios is shown in
Figure 9. Each case was represented by a symbol in the BIM model, allowing the client to instantly identify the status and take corrective action with the project management. The integration with the CEWS Excel sheet gives the CEWS mainboard the ability to present the worker according to the case and related Symbol.
6. Verification of the Proposed Technique
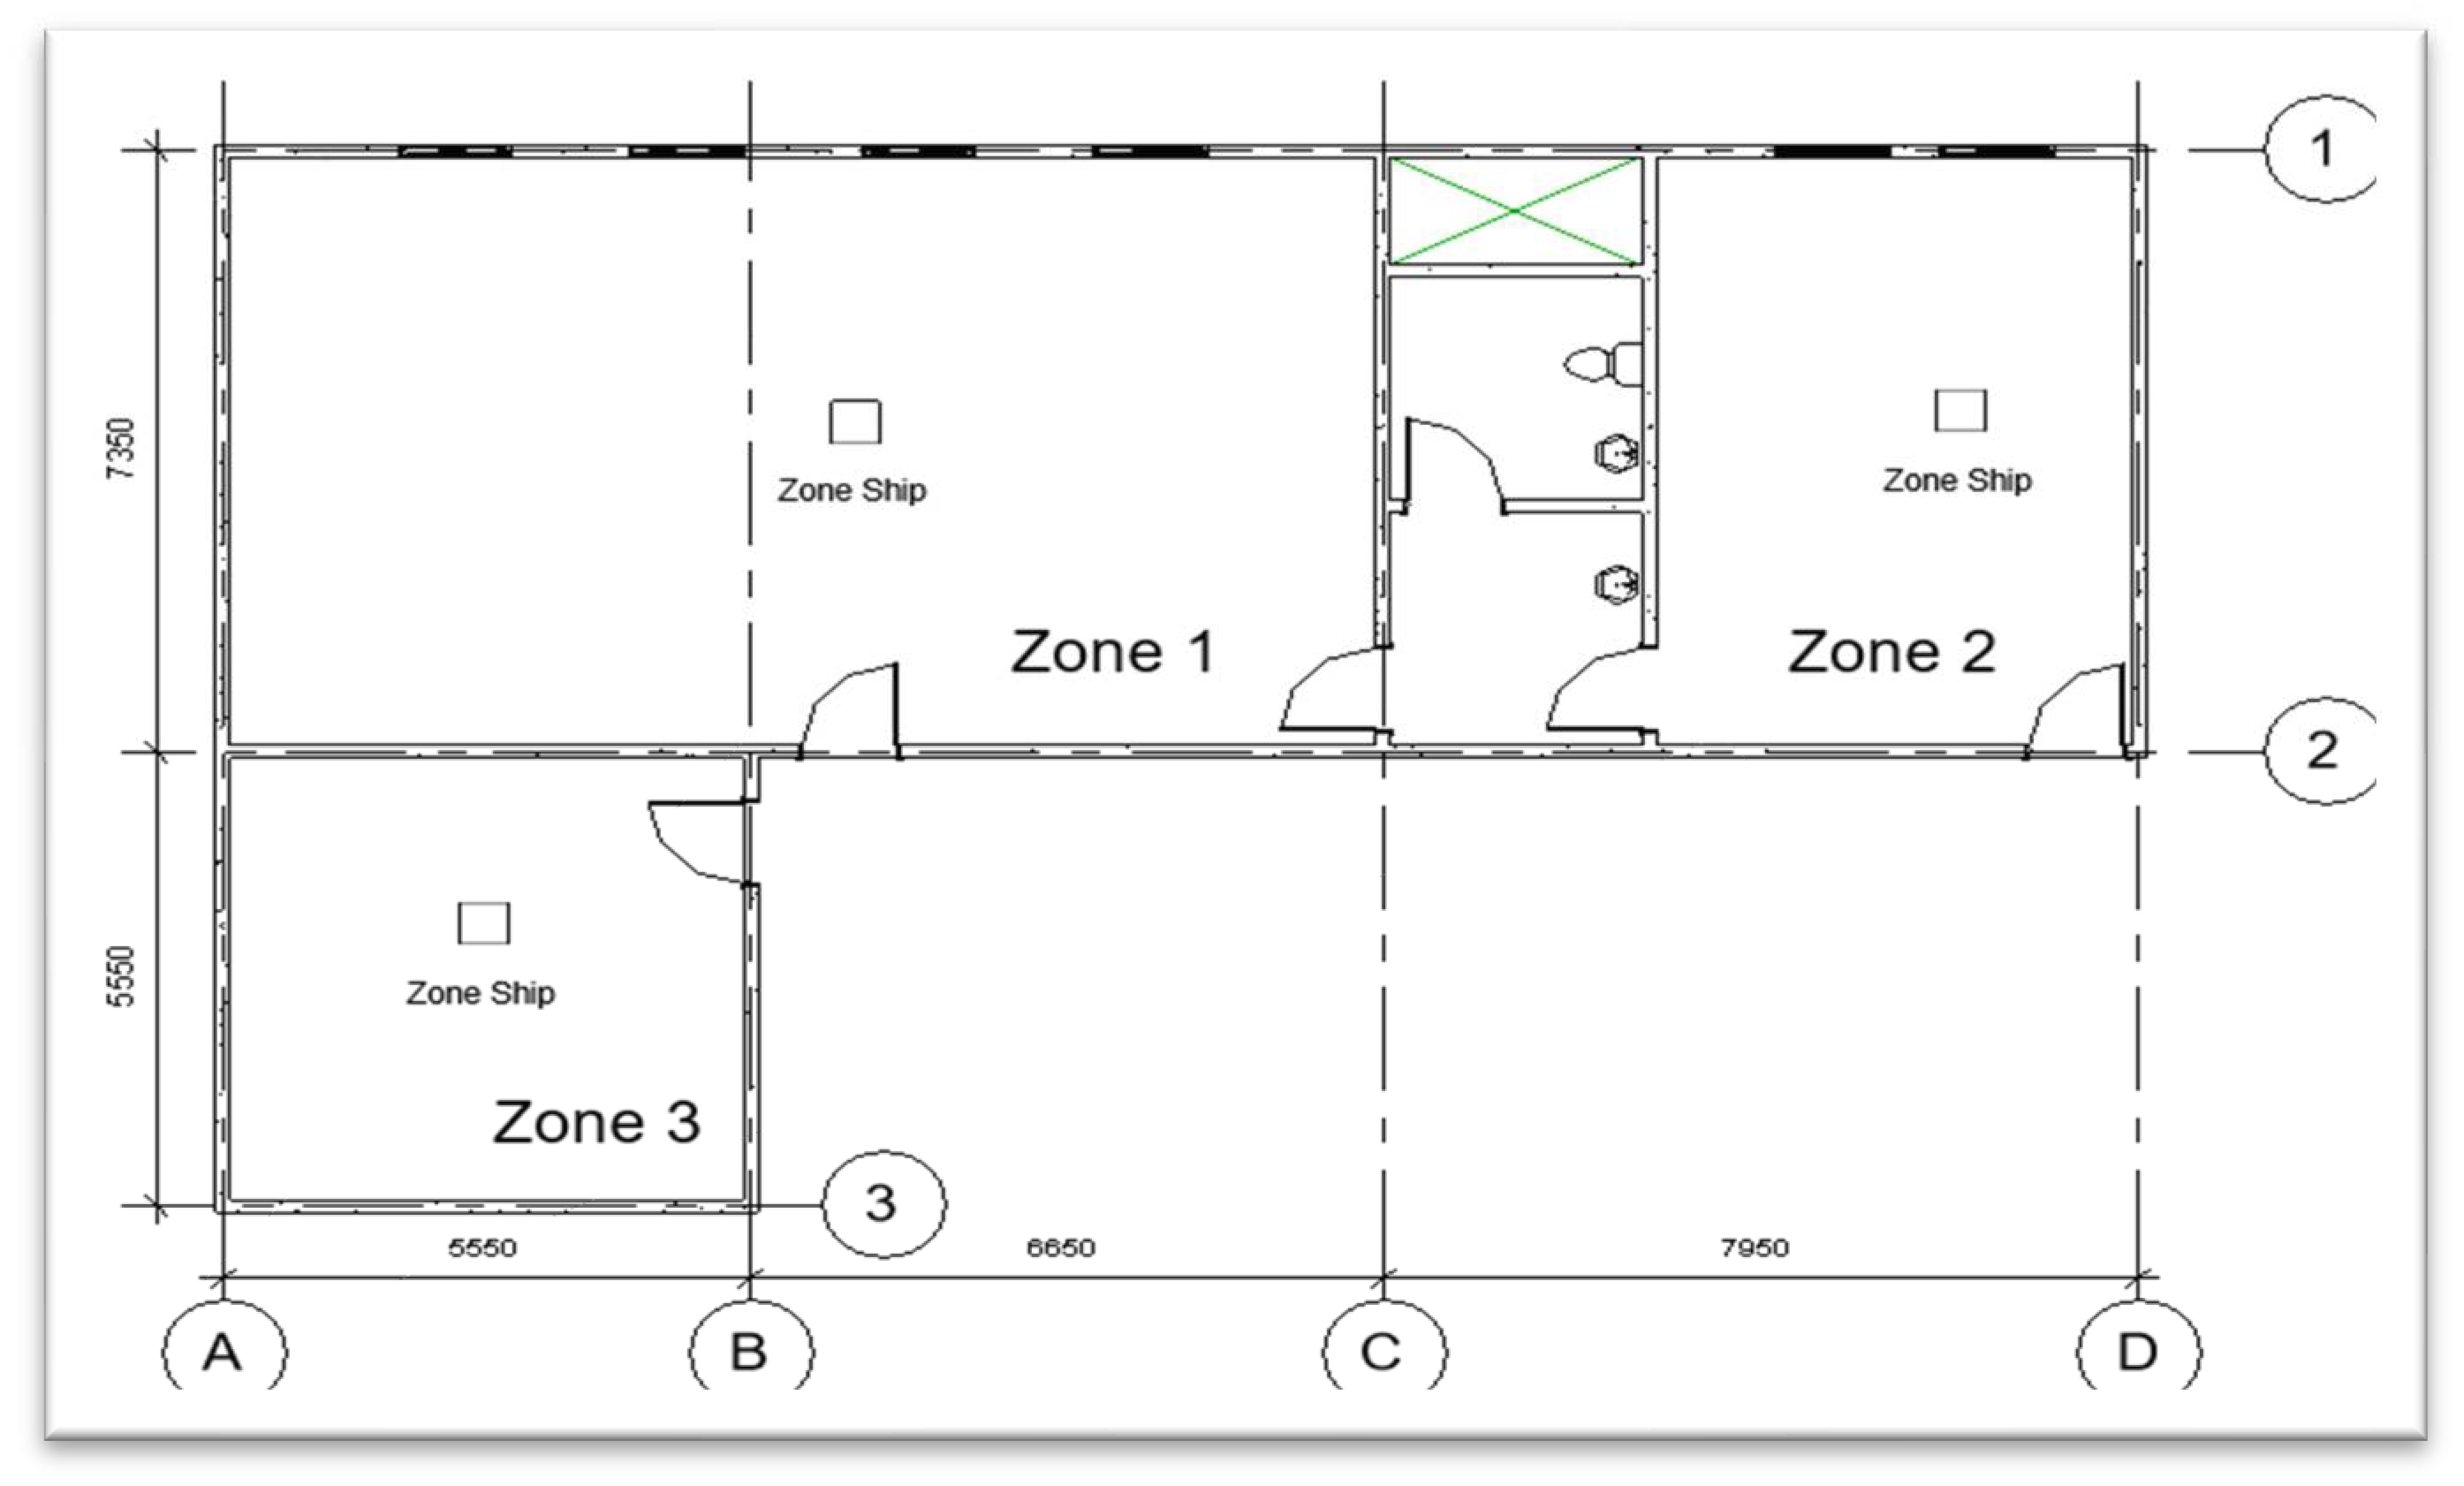
It is essential to address the limitations of the study to provide a comprehensive understanding of the potential constraints and implications of the research findings. The field test for the proposed methodology was conducted at one of the sections of the College of Engineering at Mataria, Helwan University, as indicated in (
Figure 10). The results may be influenced by the unique characteristics of that construction site. Further studies in diverse construction sites were partially conducted to validate the effectiveness and applicability of the methodology, but due to the high cost of setting up a huge number of laborers with different tasks and activities, the case study was better controlled and monitored as described below.
6.1. Applying the Proposed Technique on A Case Study
To demonstrate the applicability of the proposed technique, a case study was conducted at Helwan University, College of Engineering, Mataria, Cairo, Egypt (HU-CED) as indicated in (
Figure 8). The aim was to verify and assess the benefits of using agent-based modeling for construction resource positioning with digital twin development. The model project involved the construction of a commercial building with one floor, located in a complex area. The project had strict timelines and required efficient resource management to ensure timely completion. Only two activities were selected for the study (Aluminum windows fixation and ceiling)
6.2. Implementation of the Proposed Methodology
The proposed methodology was implemented in Project HU-CED to optimize resource positioning and enhance construction management. The following steps were undertaken:
6.2.1. Model Development
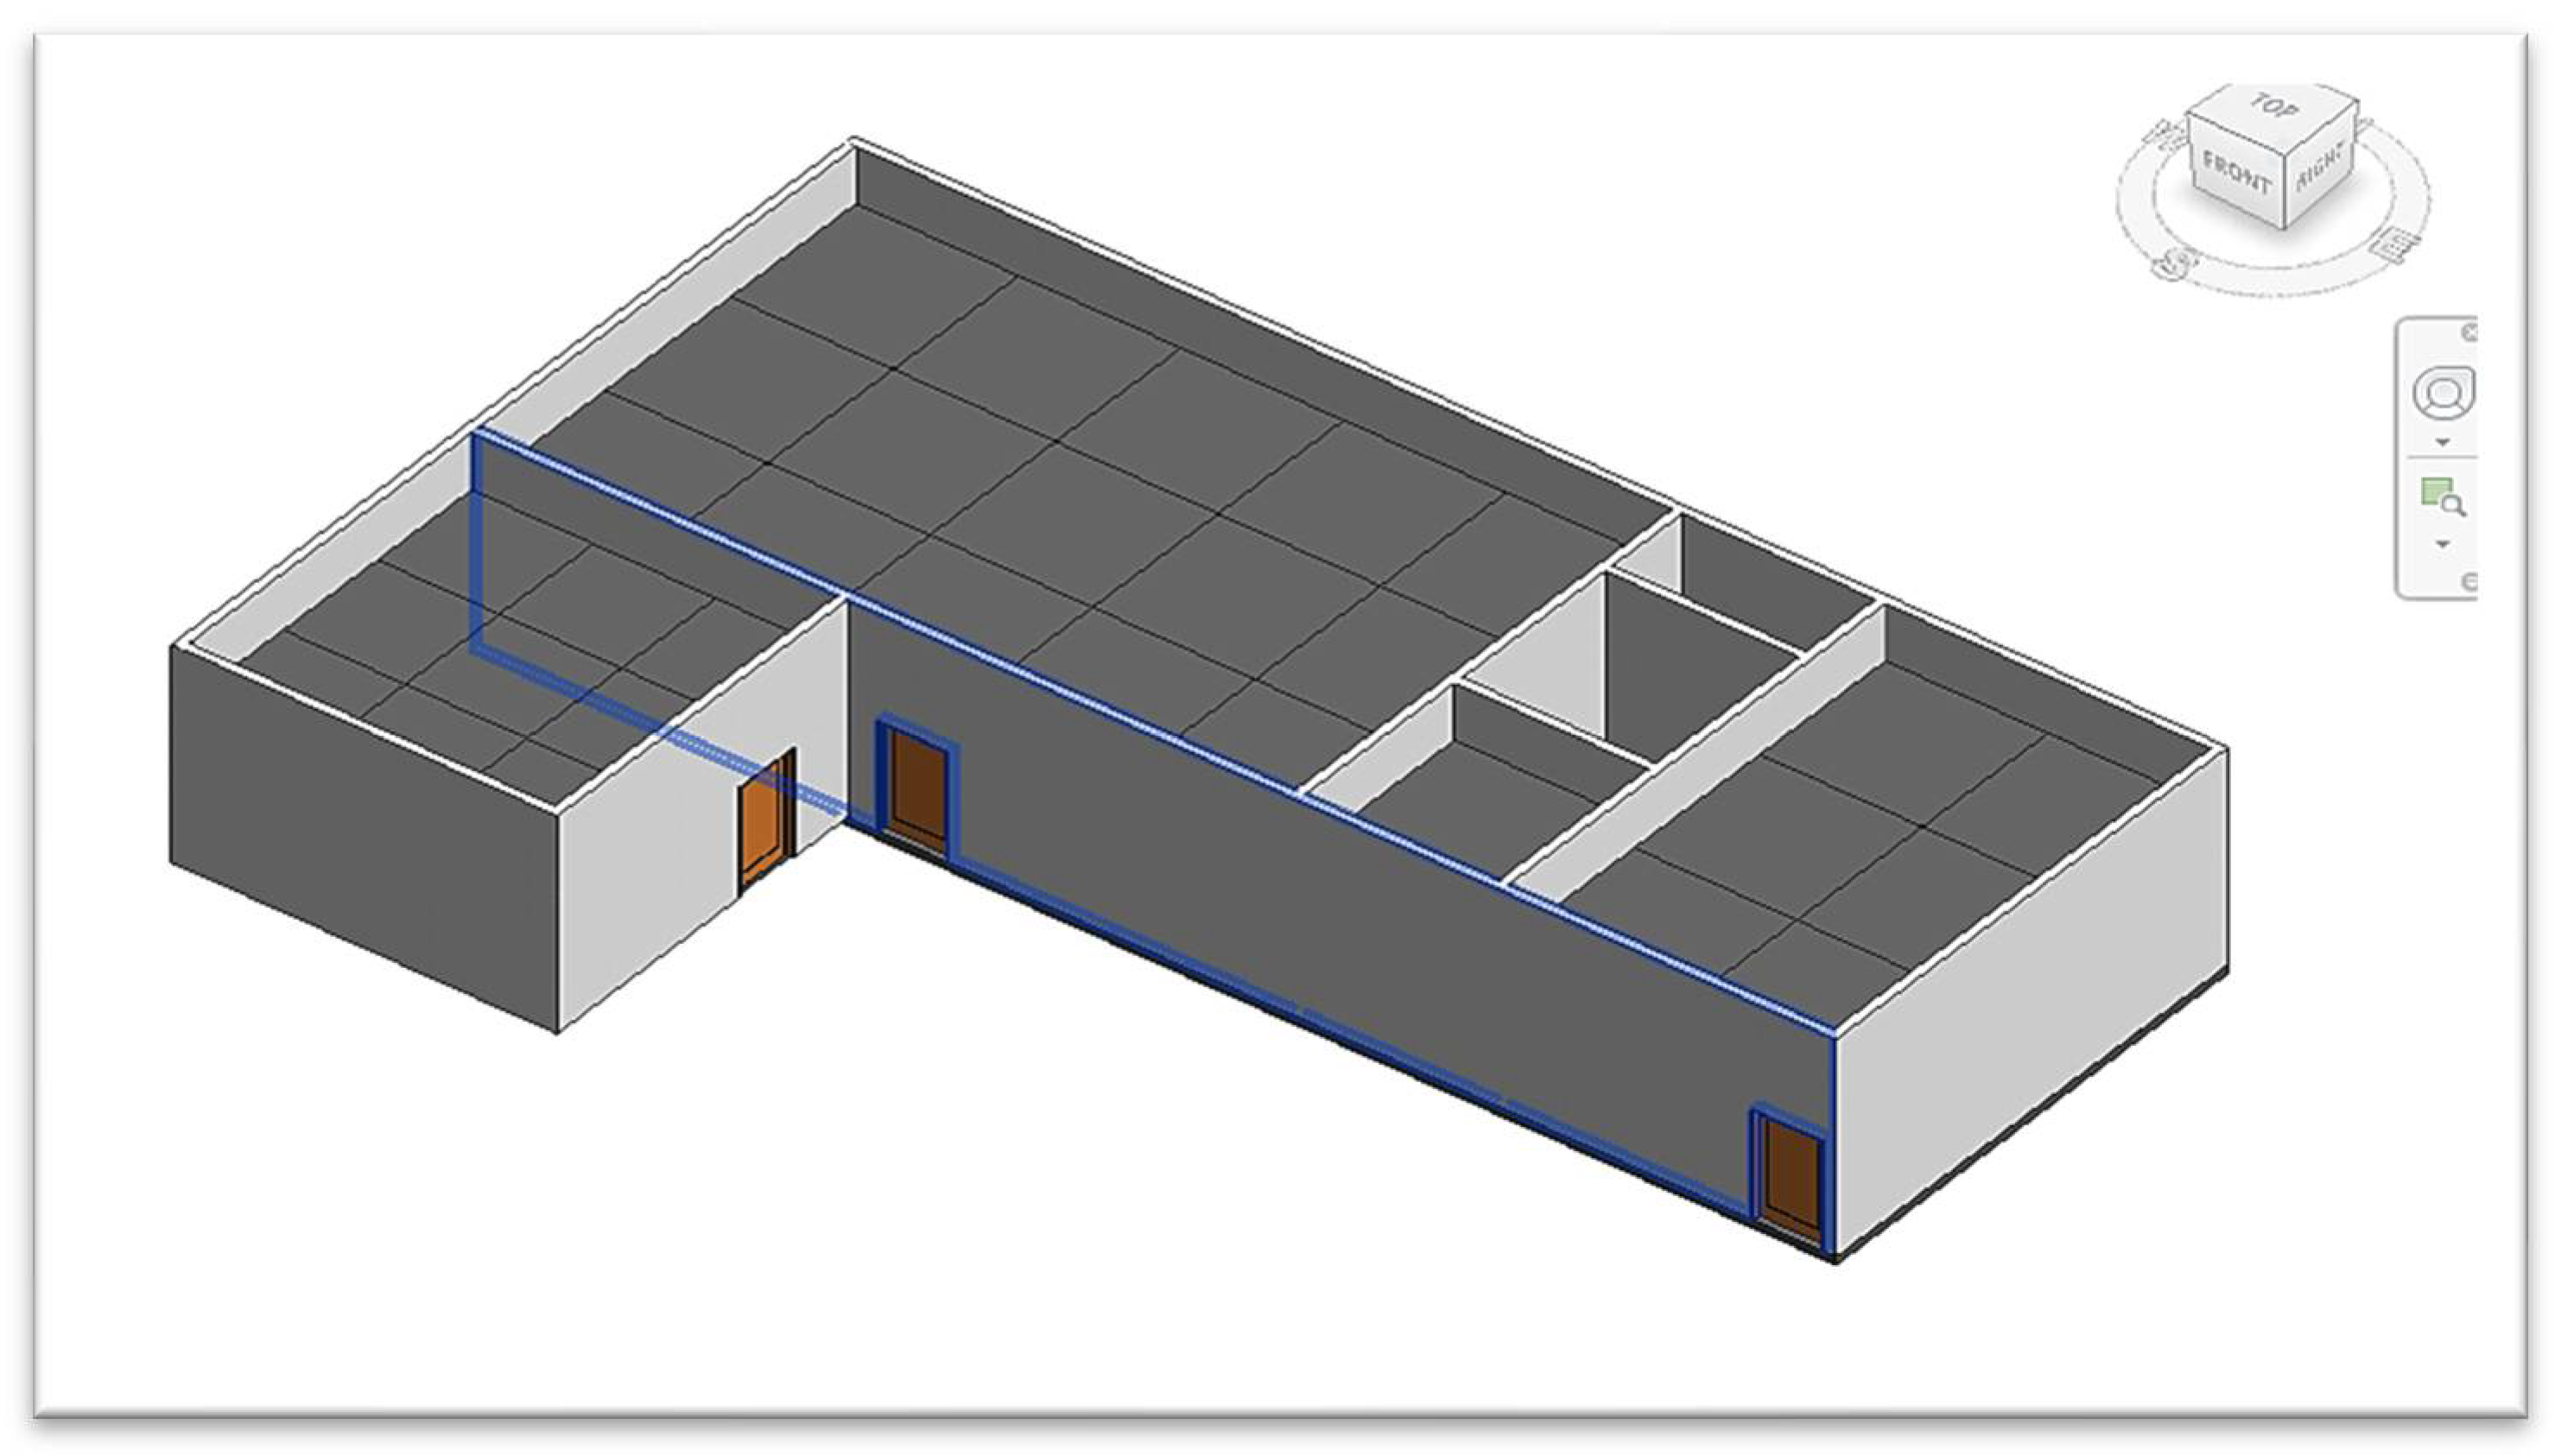
The BIM models were developed as indicated in
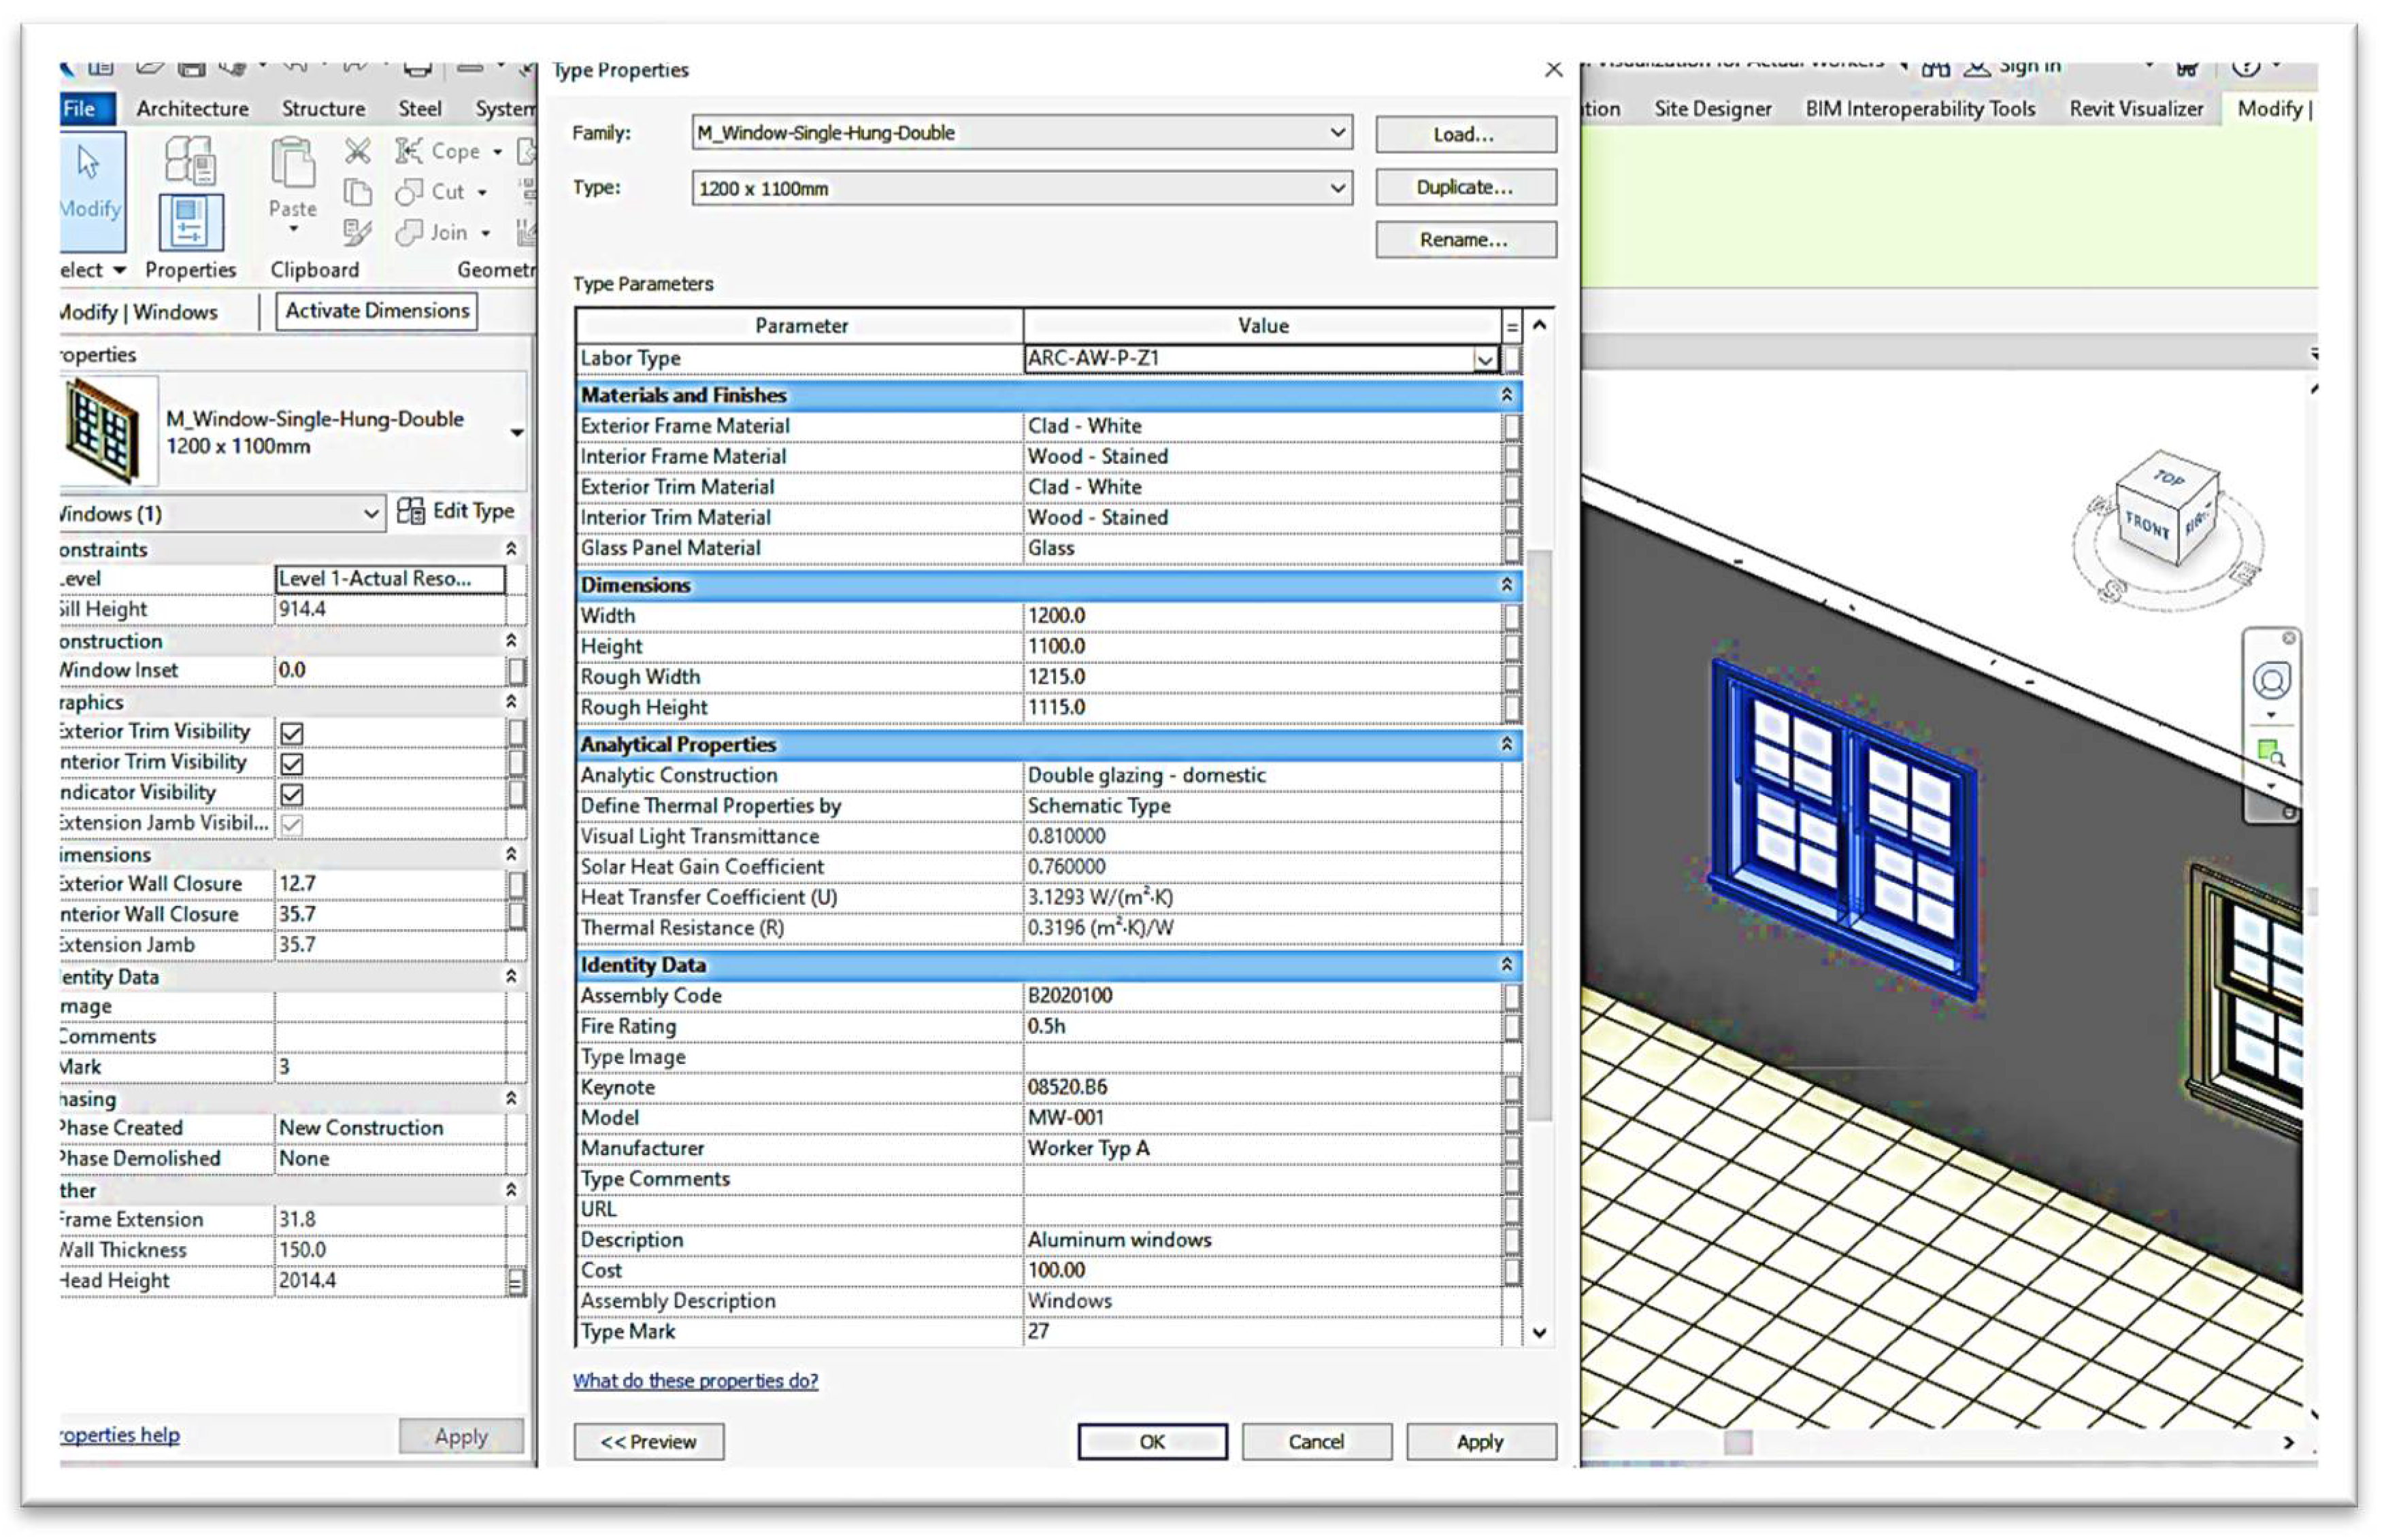
Figure 11 with the level of development LOD400 according to BIMFORUM 2022. The Omni Class, Keynotes, Dimensions, Physical Information, Type Mark, and Worker type have all been added to the BIM model to make it more comprehensive. Furthermore, the Revit families were customized to meet the specific needs of the study project. The type of parameters for Windows and Ceiling actions is shown in
Figure 12.
6.2.2. Framework Development and Tool Selection
A framework for indoor tracking using Bluetooth Low Energy (BLE) technology within the BIM environment was developed. Suitable tools, including BLE devices, the Revit Visualizer plugin, and the HOLOBUILDER platform, were selected based on their compatibility with the project requirements.
6.2.3. Implementing Module One: Embedded System Development
An embedded system was developed and deployed on the project. BLE tags were assigned to each worker and integrated into their safety jackets. The Revit software and IDE were utilized to configure the worker scanner mainboard, enabling continuous broadcasting of worker tags and collecting their identification and location information.
6.2.4. Implementing Module Two: Database Generation and Visualization
The database generator and visualization tool were implemented to manage the tracking data and integrate it with the BIM model. The database generator received data from the worker scanner in CSV format as indicated in
Figure 13, processed it, and created a structured database as per
Figure 14. The visualization tool provided real-time integration of worker positions and status within the BIM model.
6.2.5. Implementing Module Three: Construction Documentation and (CEWS)
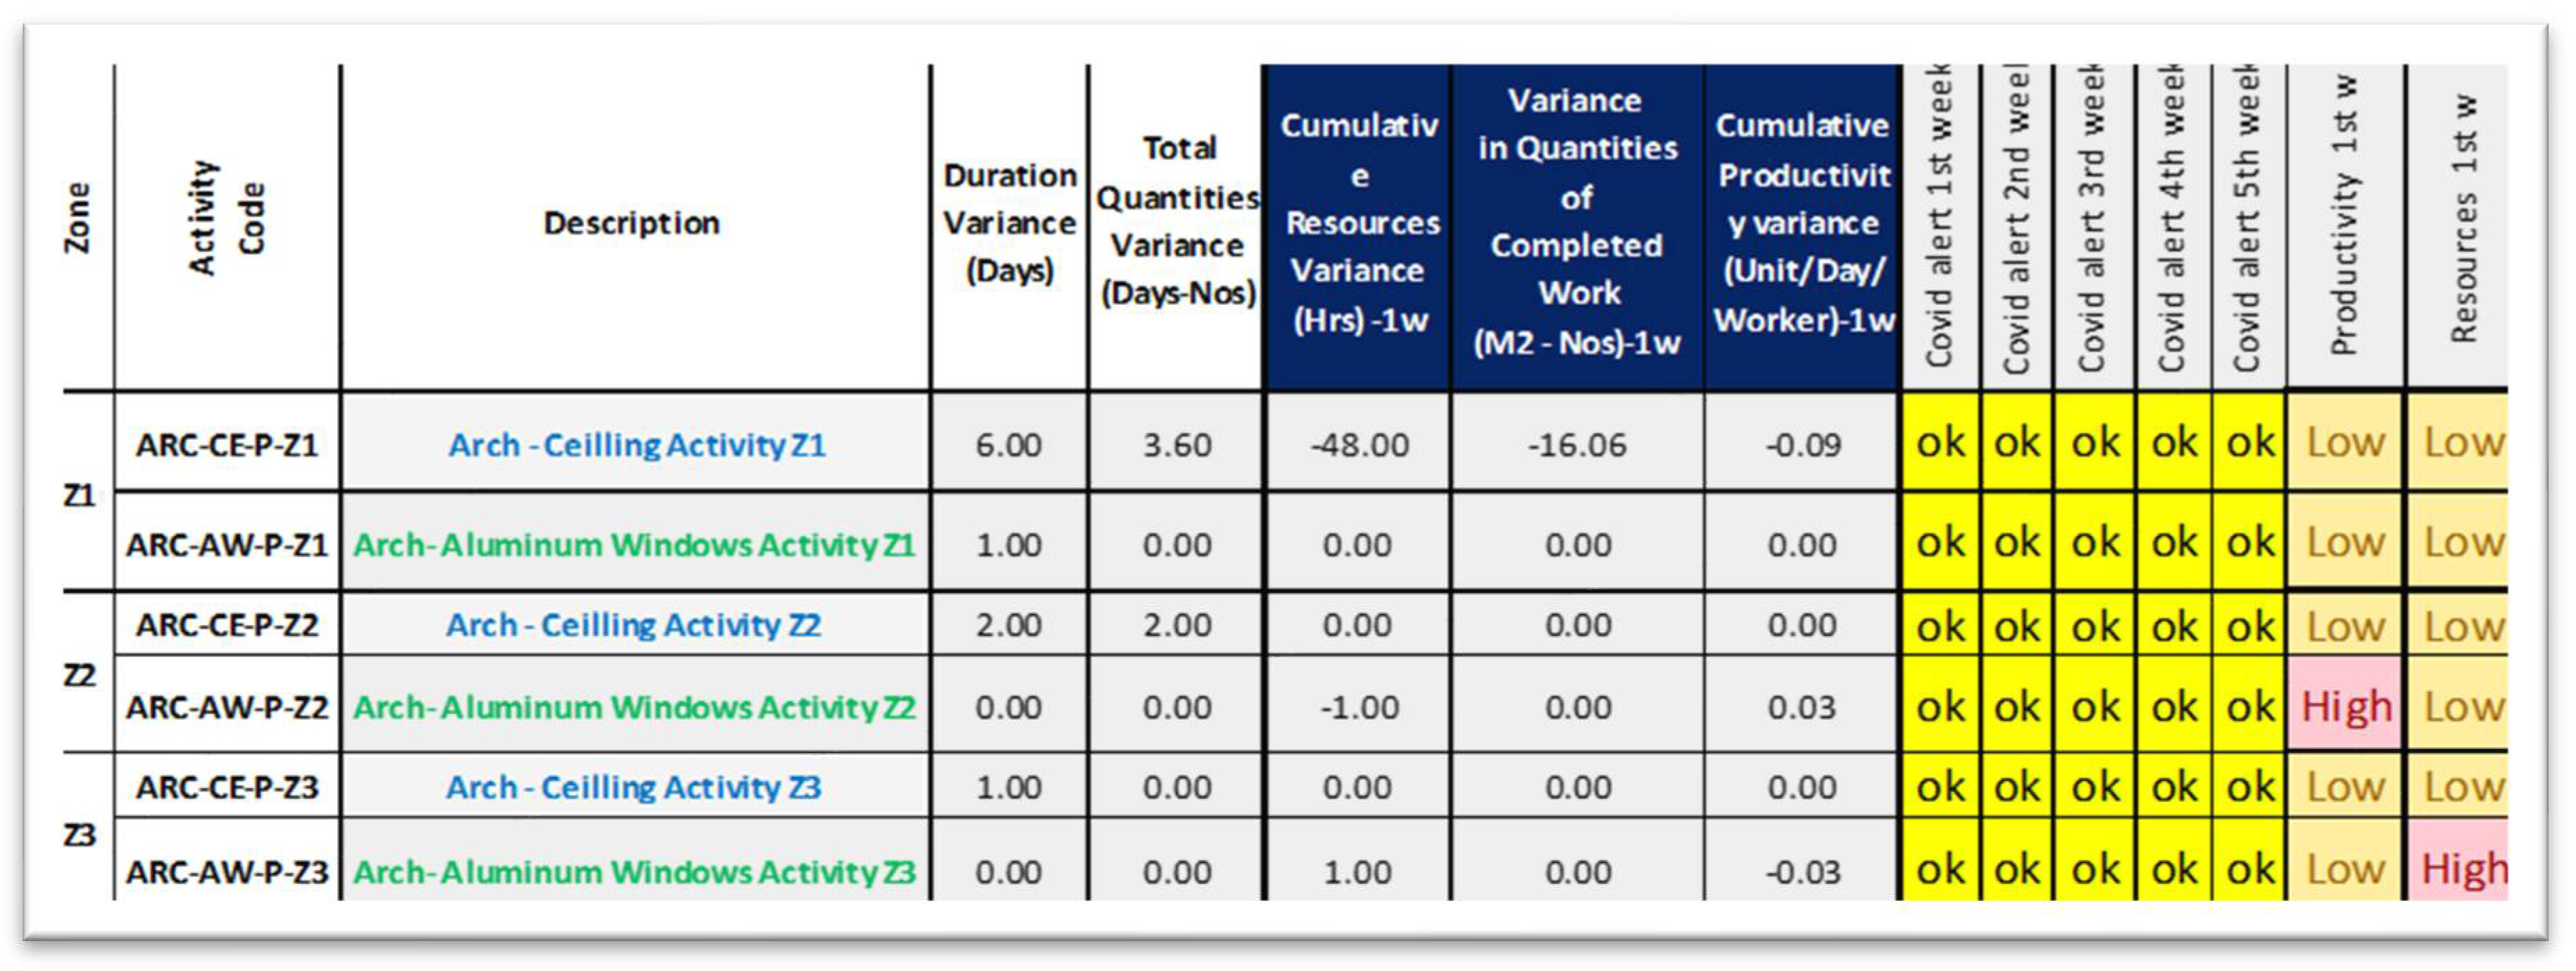
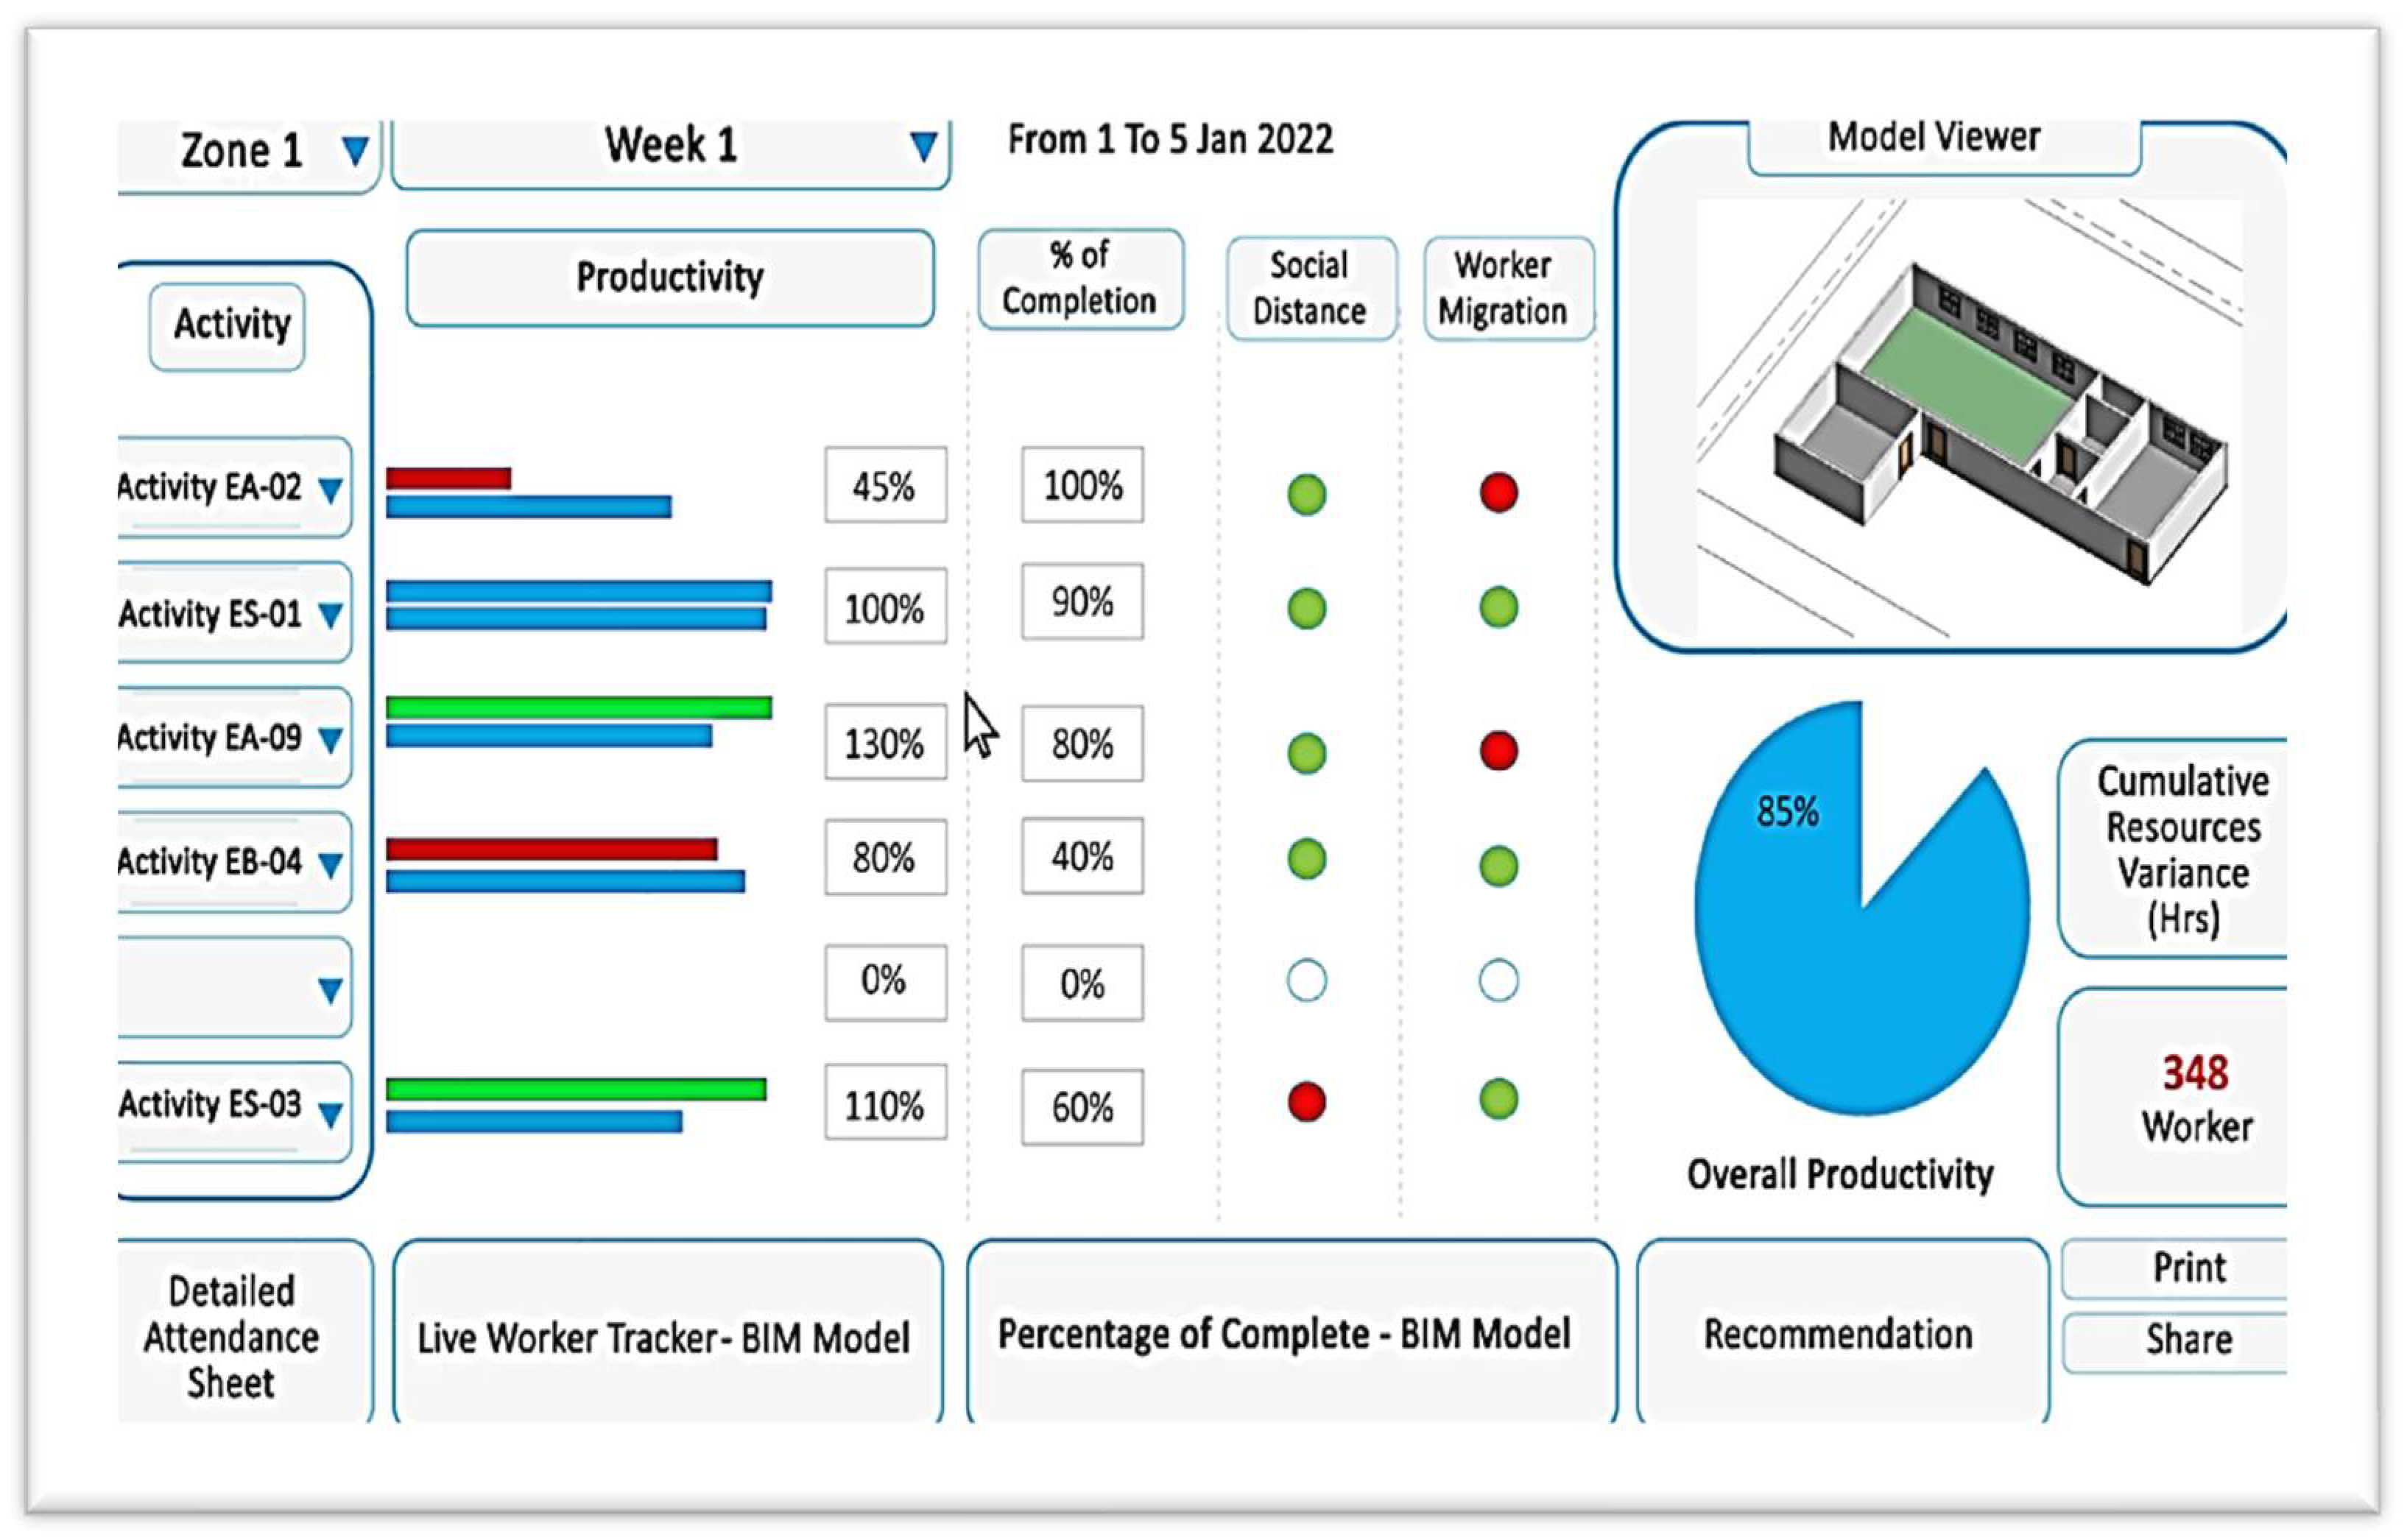
Construction documentation and the Client Early Warning System (CEWS) were implemented to enhance project monitoring and decision-making. A 360-degree camera was employed to capture construction progress and document activities at different stages of the project. The HOLOBUILDER platform facilitated efficient management and integration of the 360° photos with the BIM environment. The CEWS, integrated with Primavera, collected planning dates and calculated productivity based on an activity-oriented model.
Figure 15 illustrates the CEWS dashboard for client use which is live integrated with the BIM model viewer as indicated.
7. Results of Application and Benefits
The implementation of the proposed technique in the Project resulted in significant benefits. The Decision Support System (DSS) and CEWS provided valuable insights and facilitated data-driven decision-making.
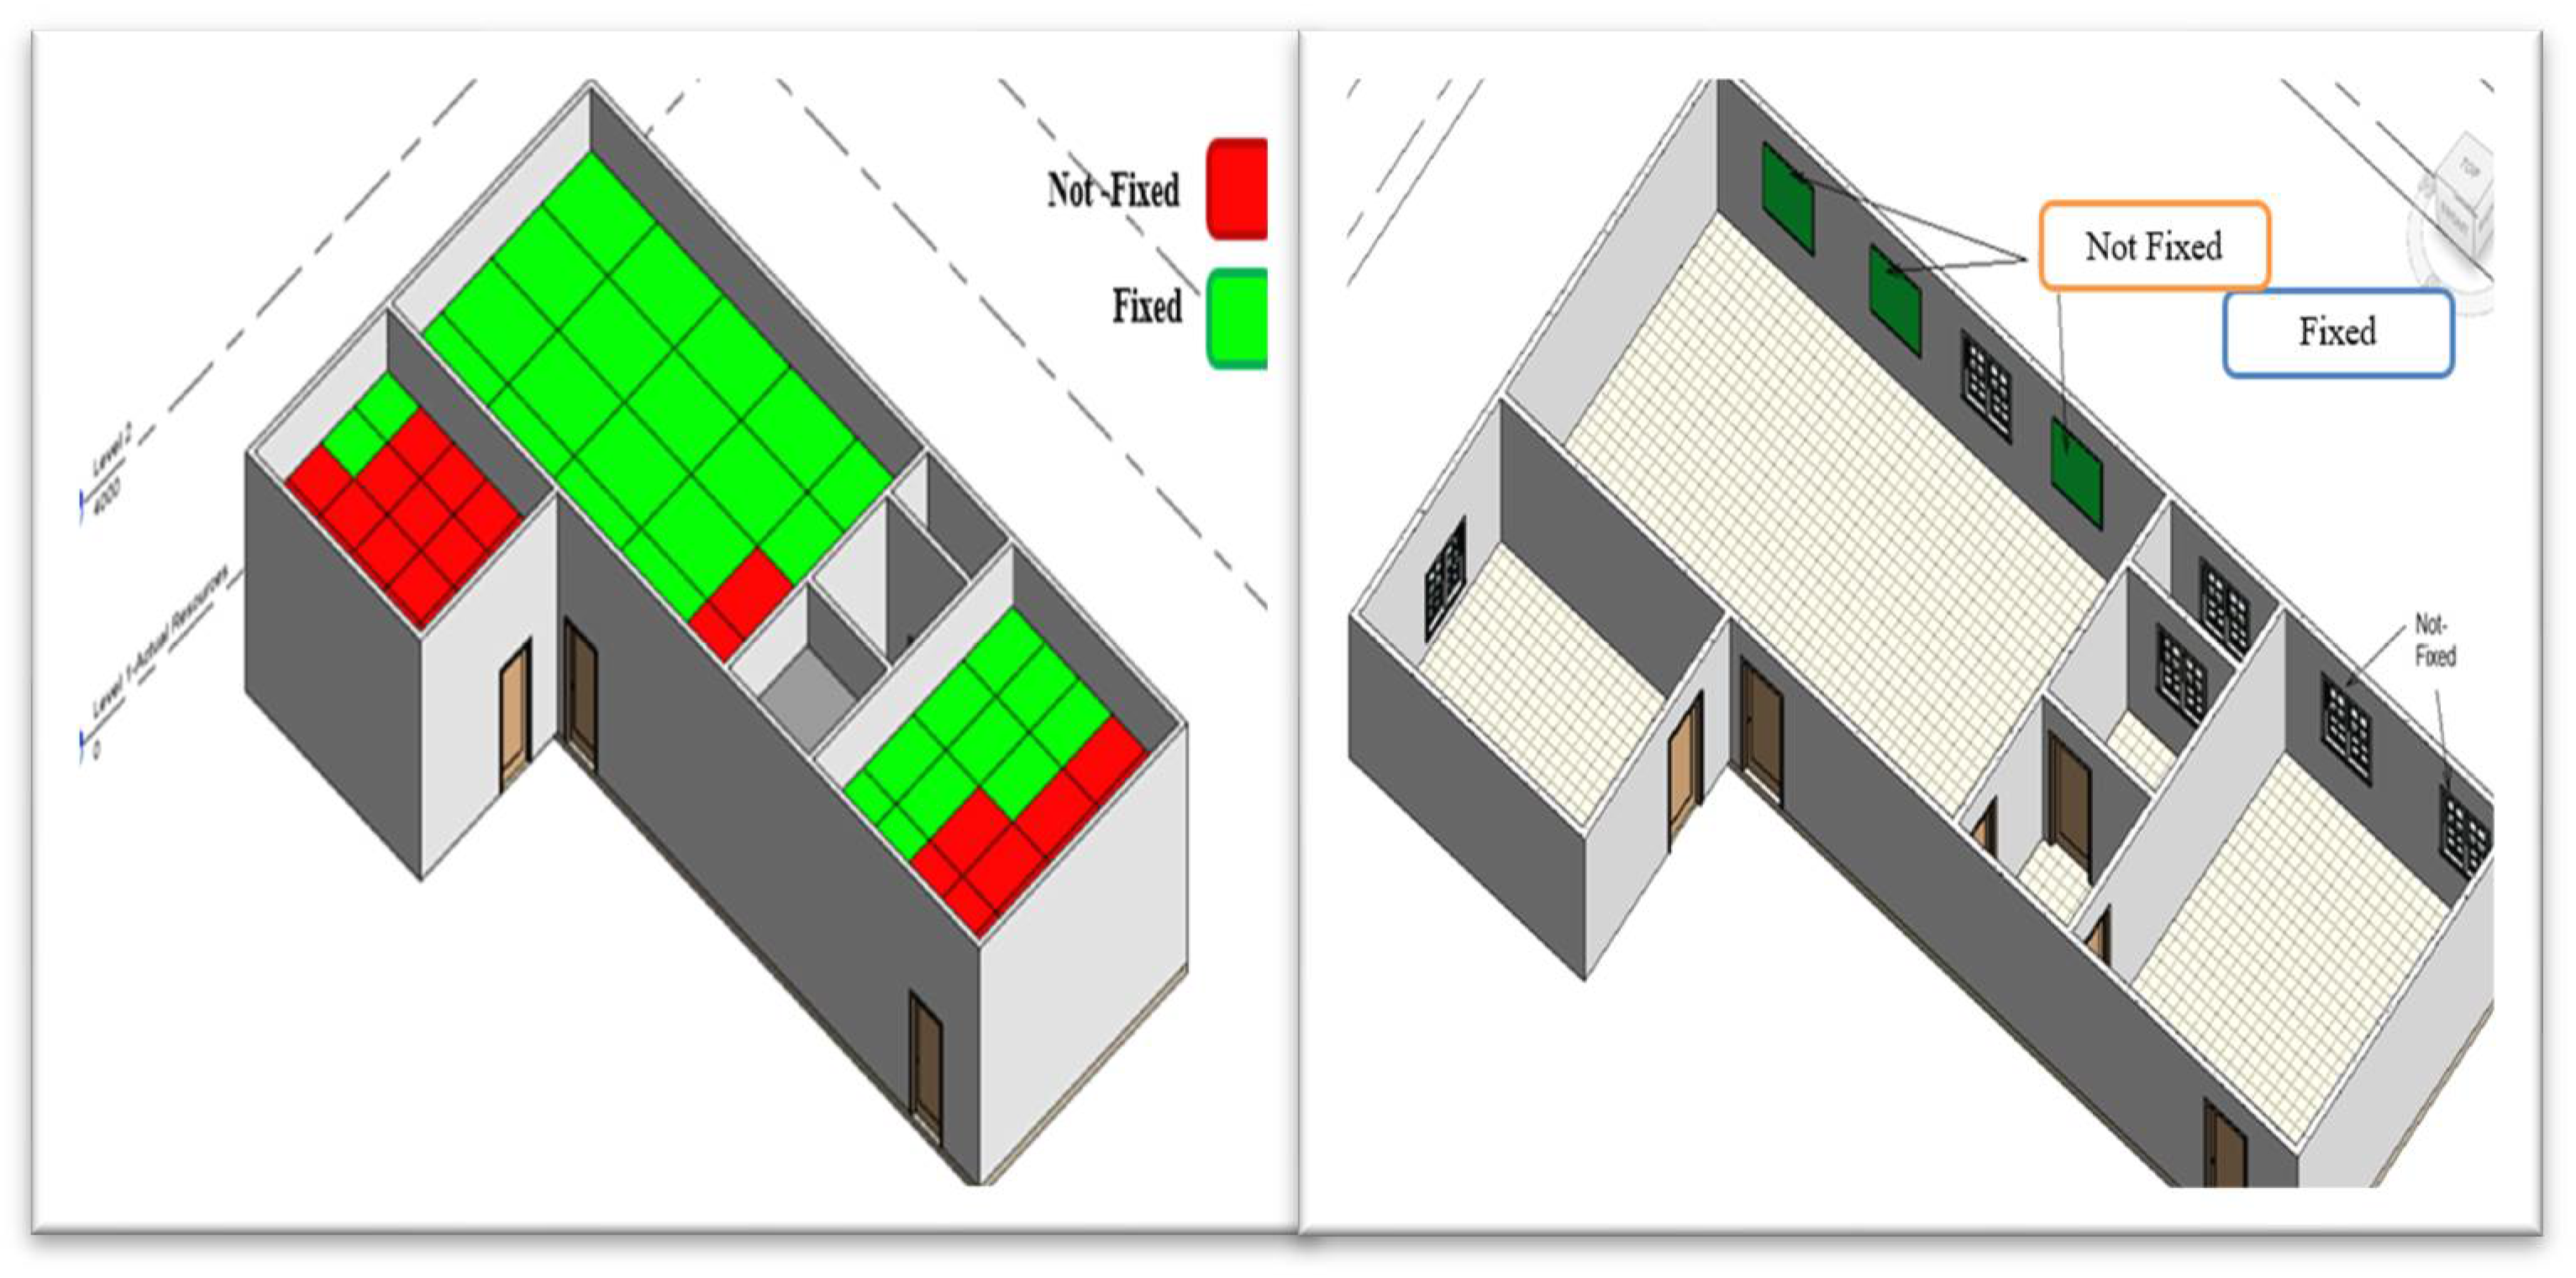
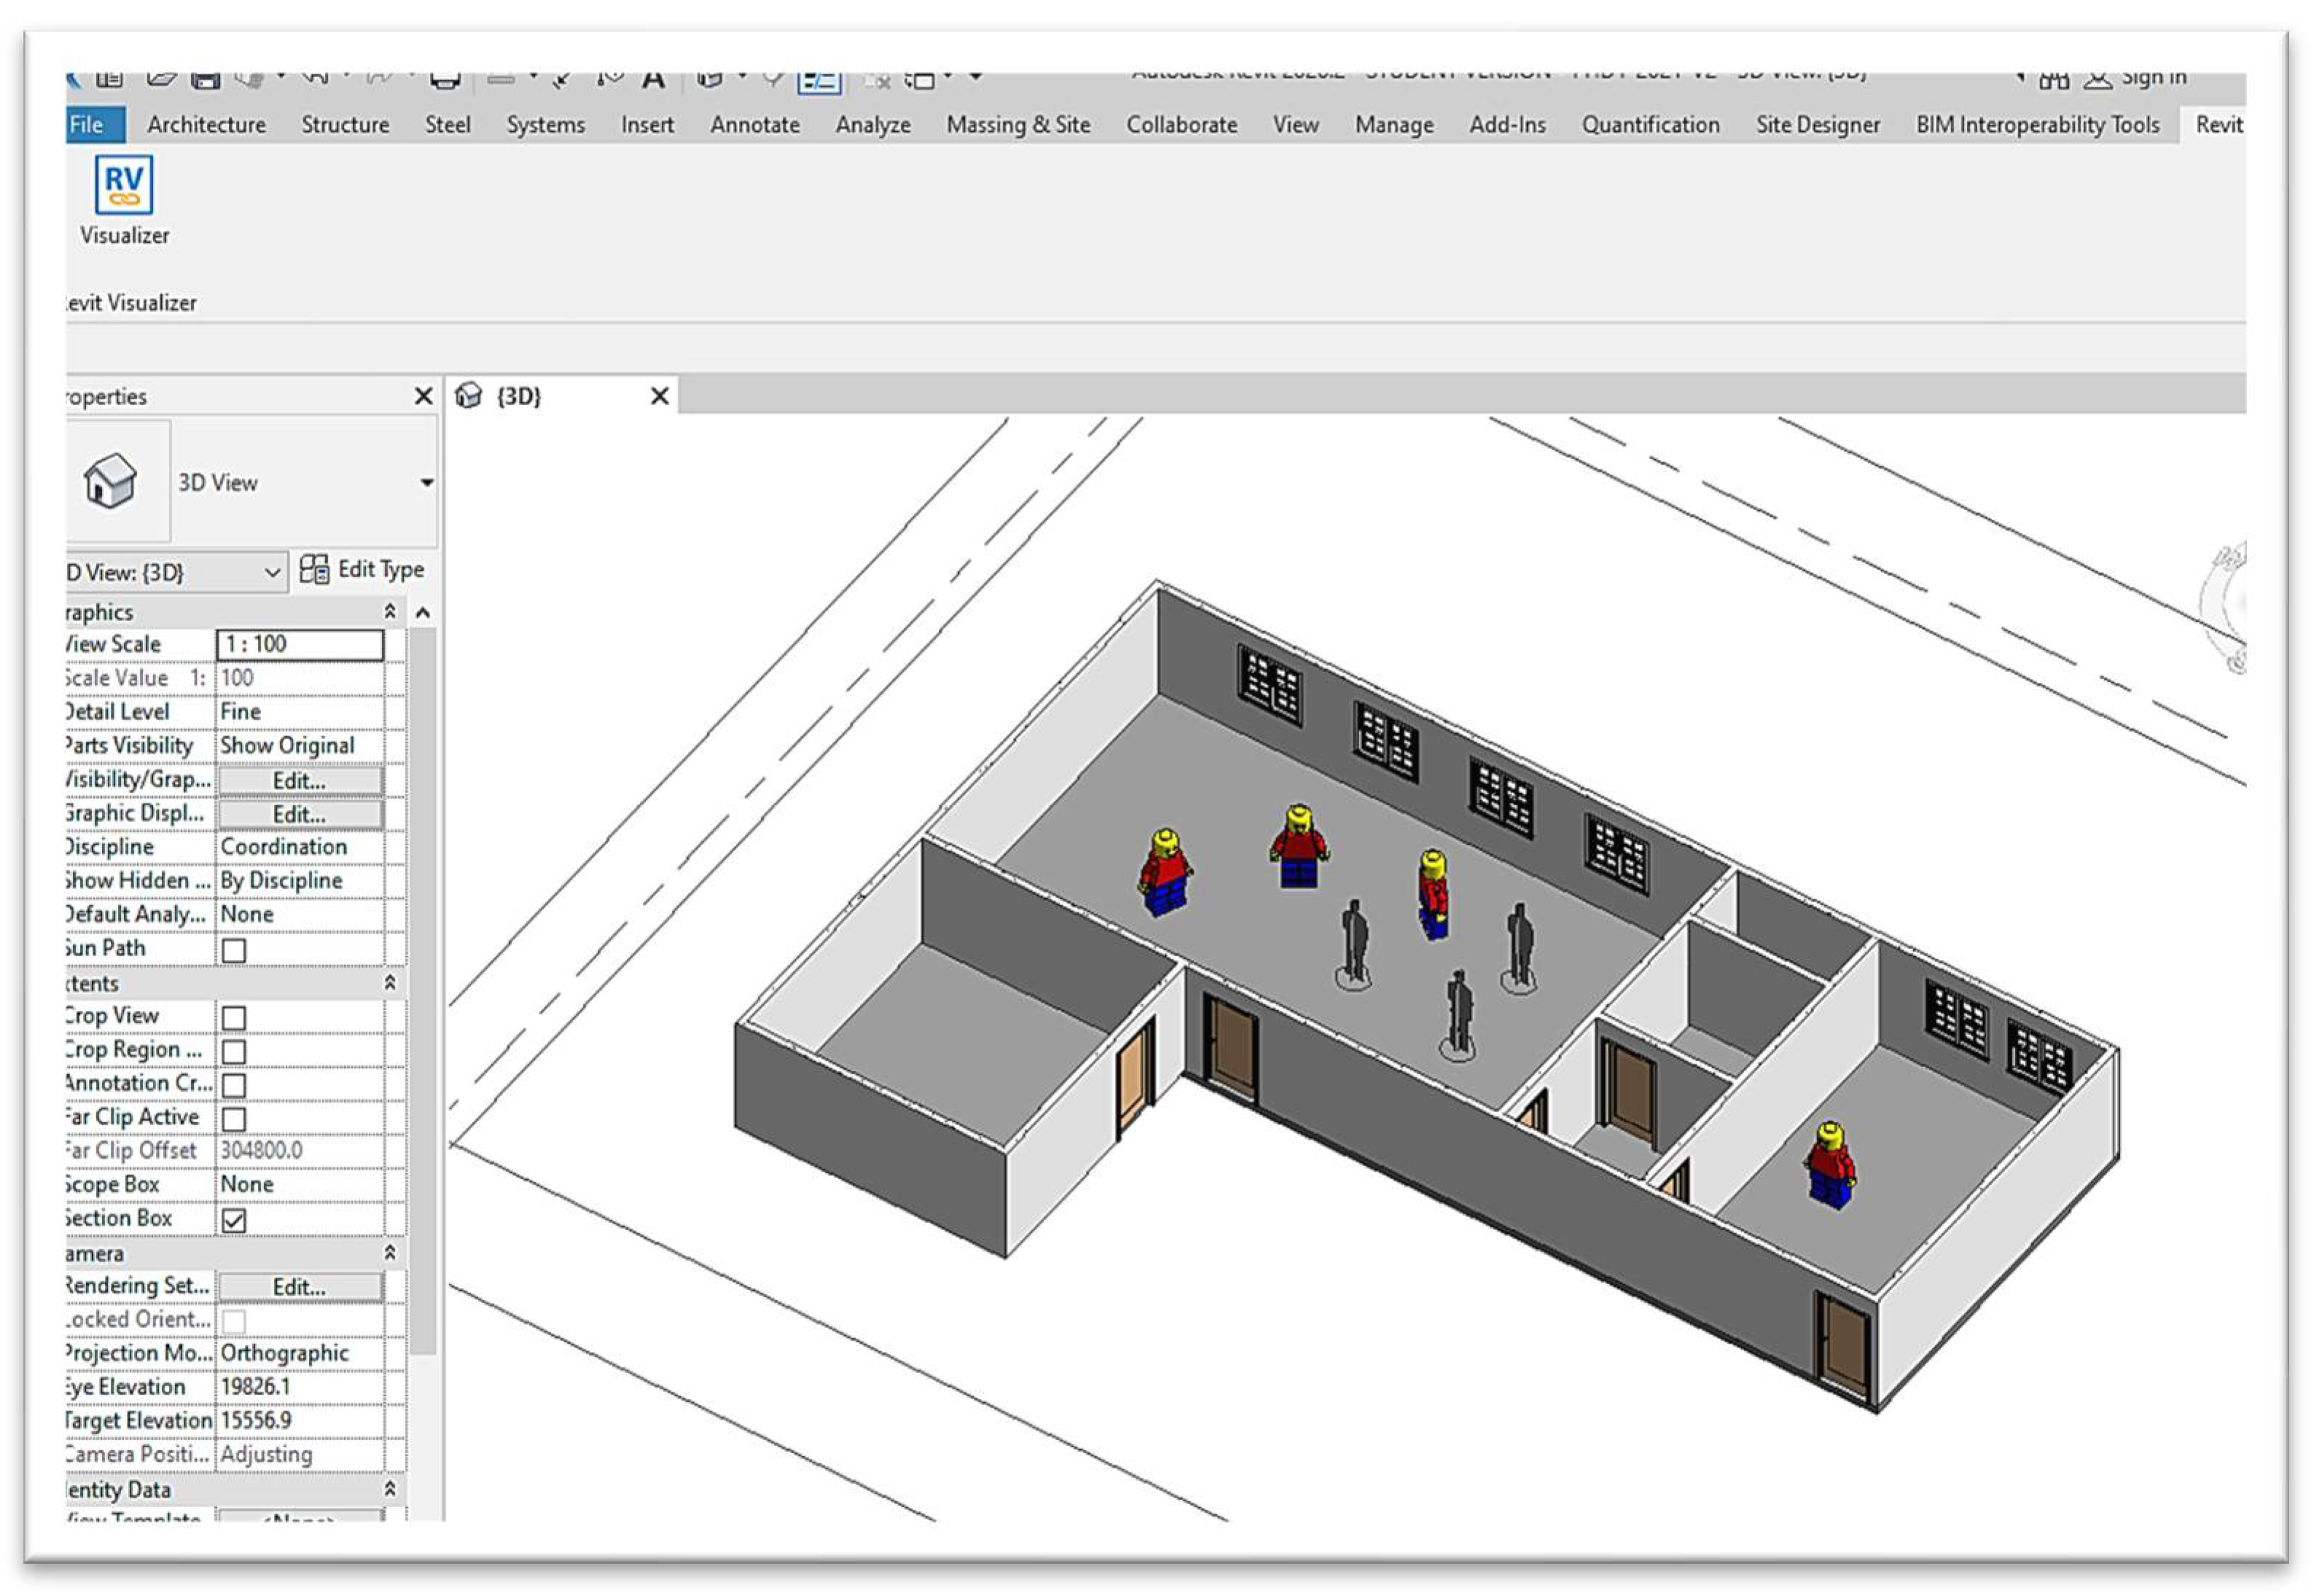
Figure 16 shows a live tracking feature for all activities of workers in the BIM model with friendly visualization symbols (as shown in
Figure 9). The user can easily know once he/she opens the models what happens in the site through the visualization tool.
Figure 17 demonstrates the helpful output of the CEWS, including visualization for the progress of work.
The user can also have access to the model to get any information about the resources based on customized time frequent updates as indicated in
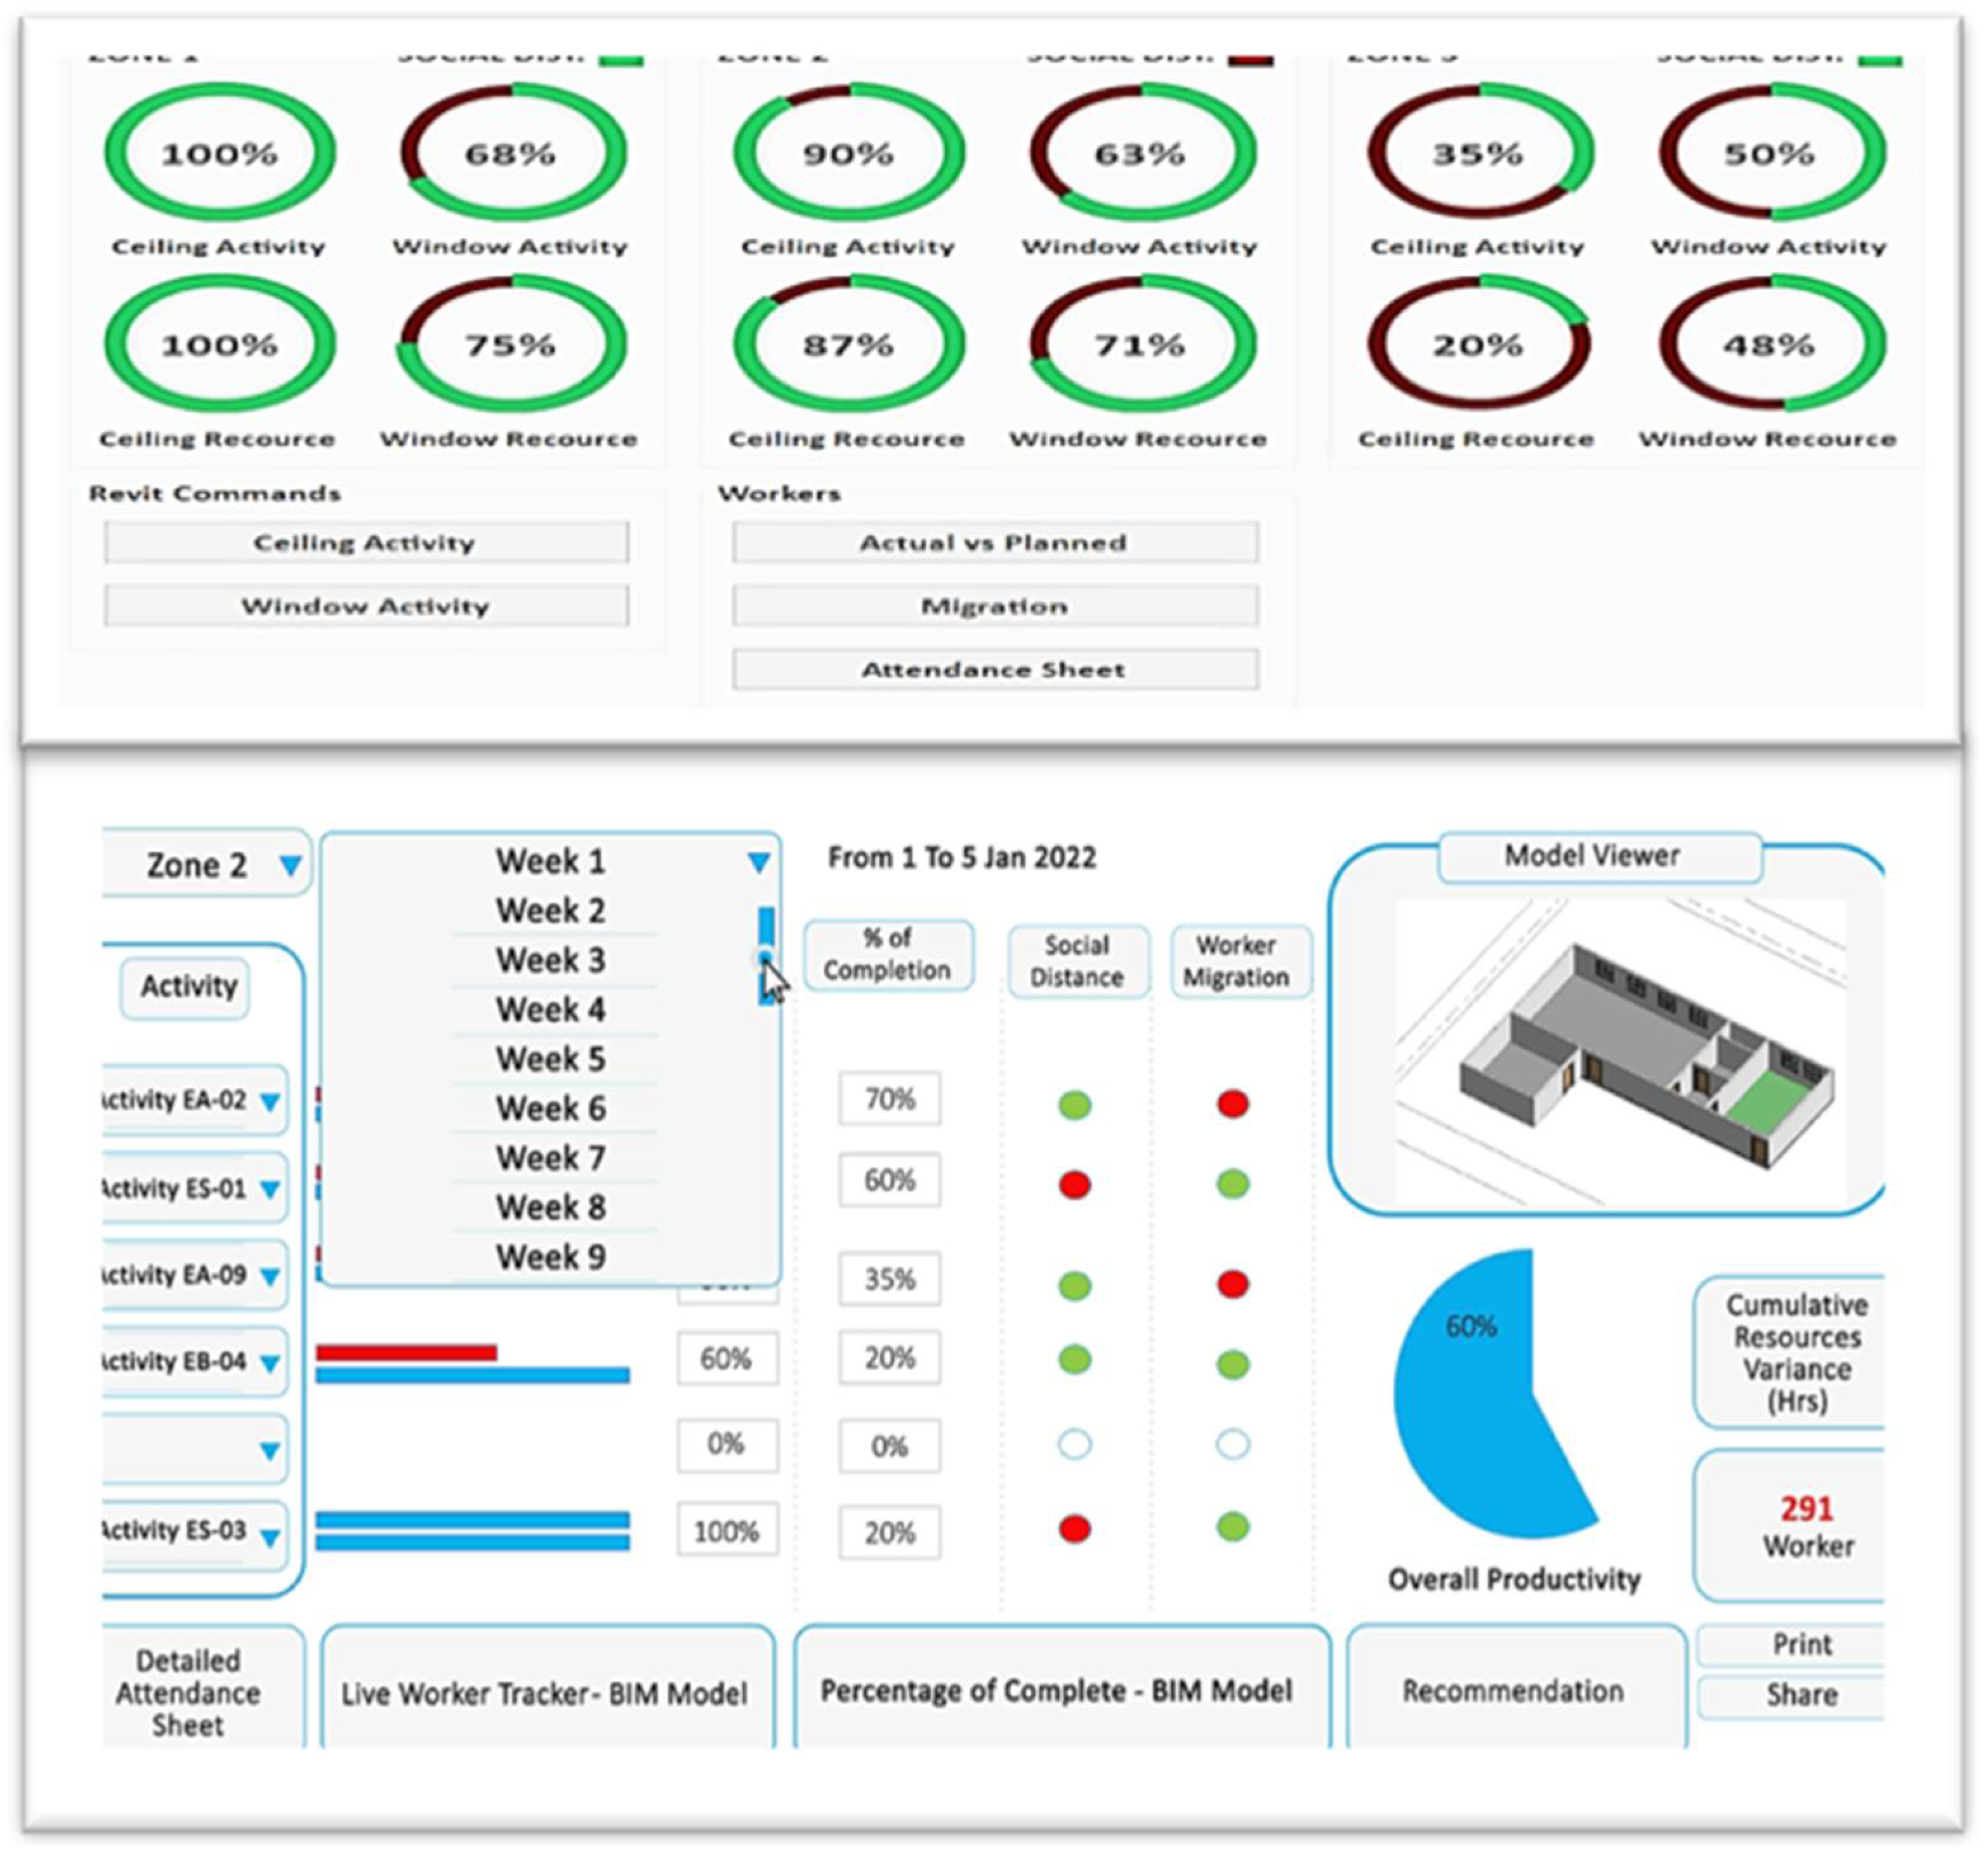
Figure 18. The CEWS master dashboard, shown in
Figure 19, provided a comprehensive view of the project's status. The dashboard was divided into many zones, each zone highlights different options to indicate activity completion percentages, actual resources, and adherence to social distancing regulations which become an essential part of exceptional events like what happened during COVID-19. Hyperlinks within the CEWS dashboard facilitated visualization of specific activities, World Health Organization guidelines, recommendations, live number of workers, and worker migration across zones (
Figure 19).
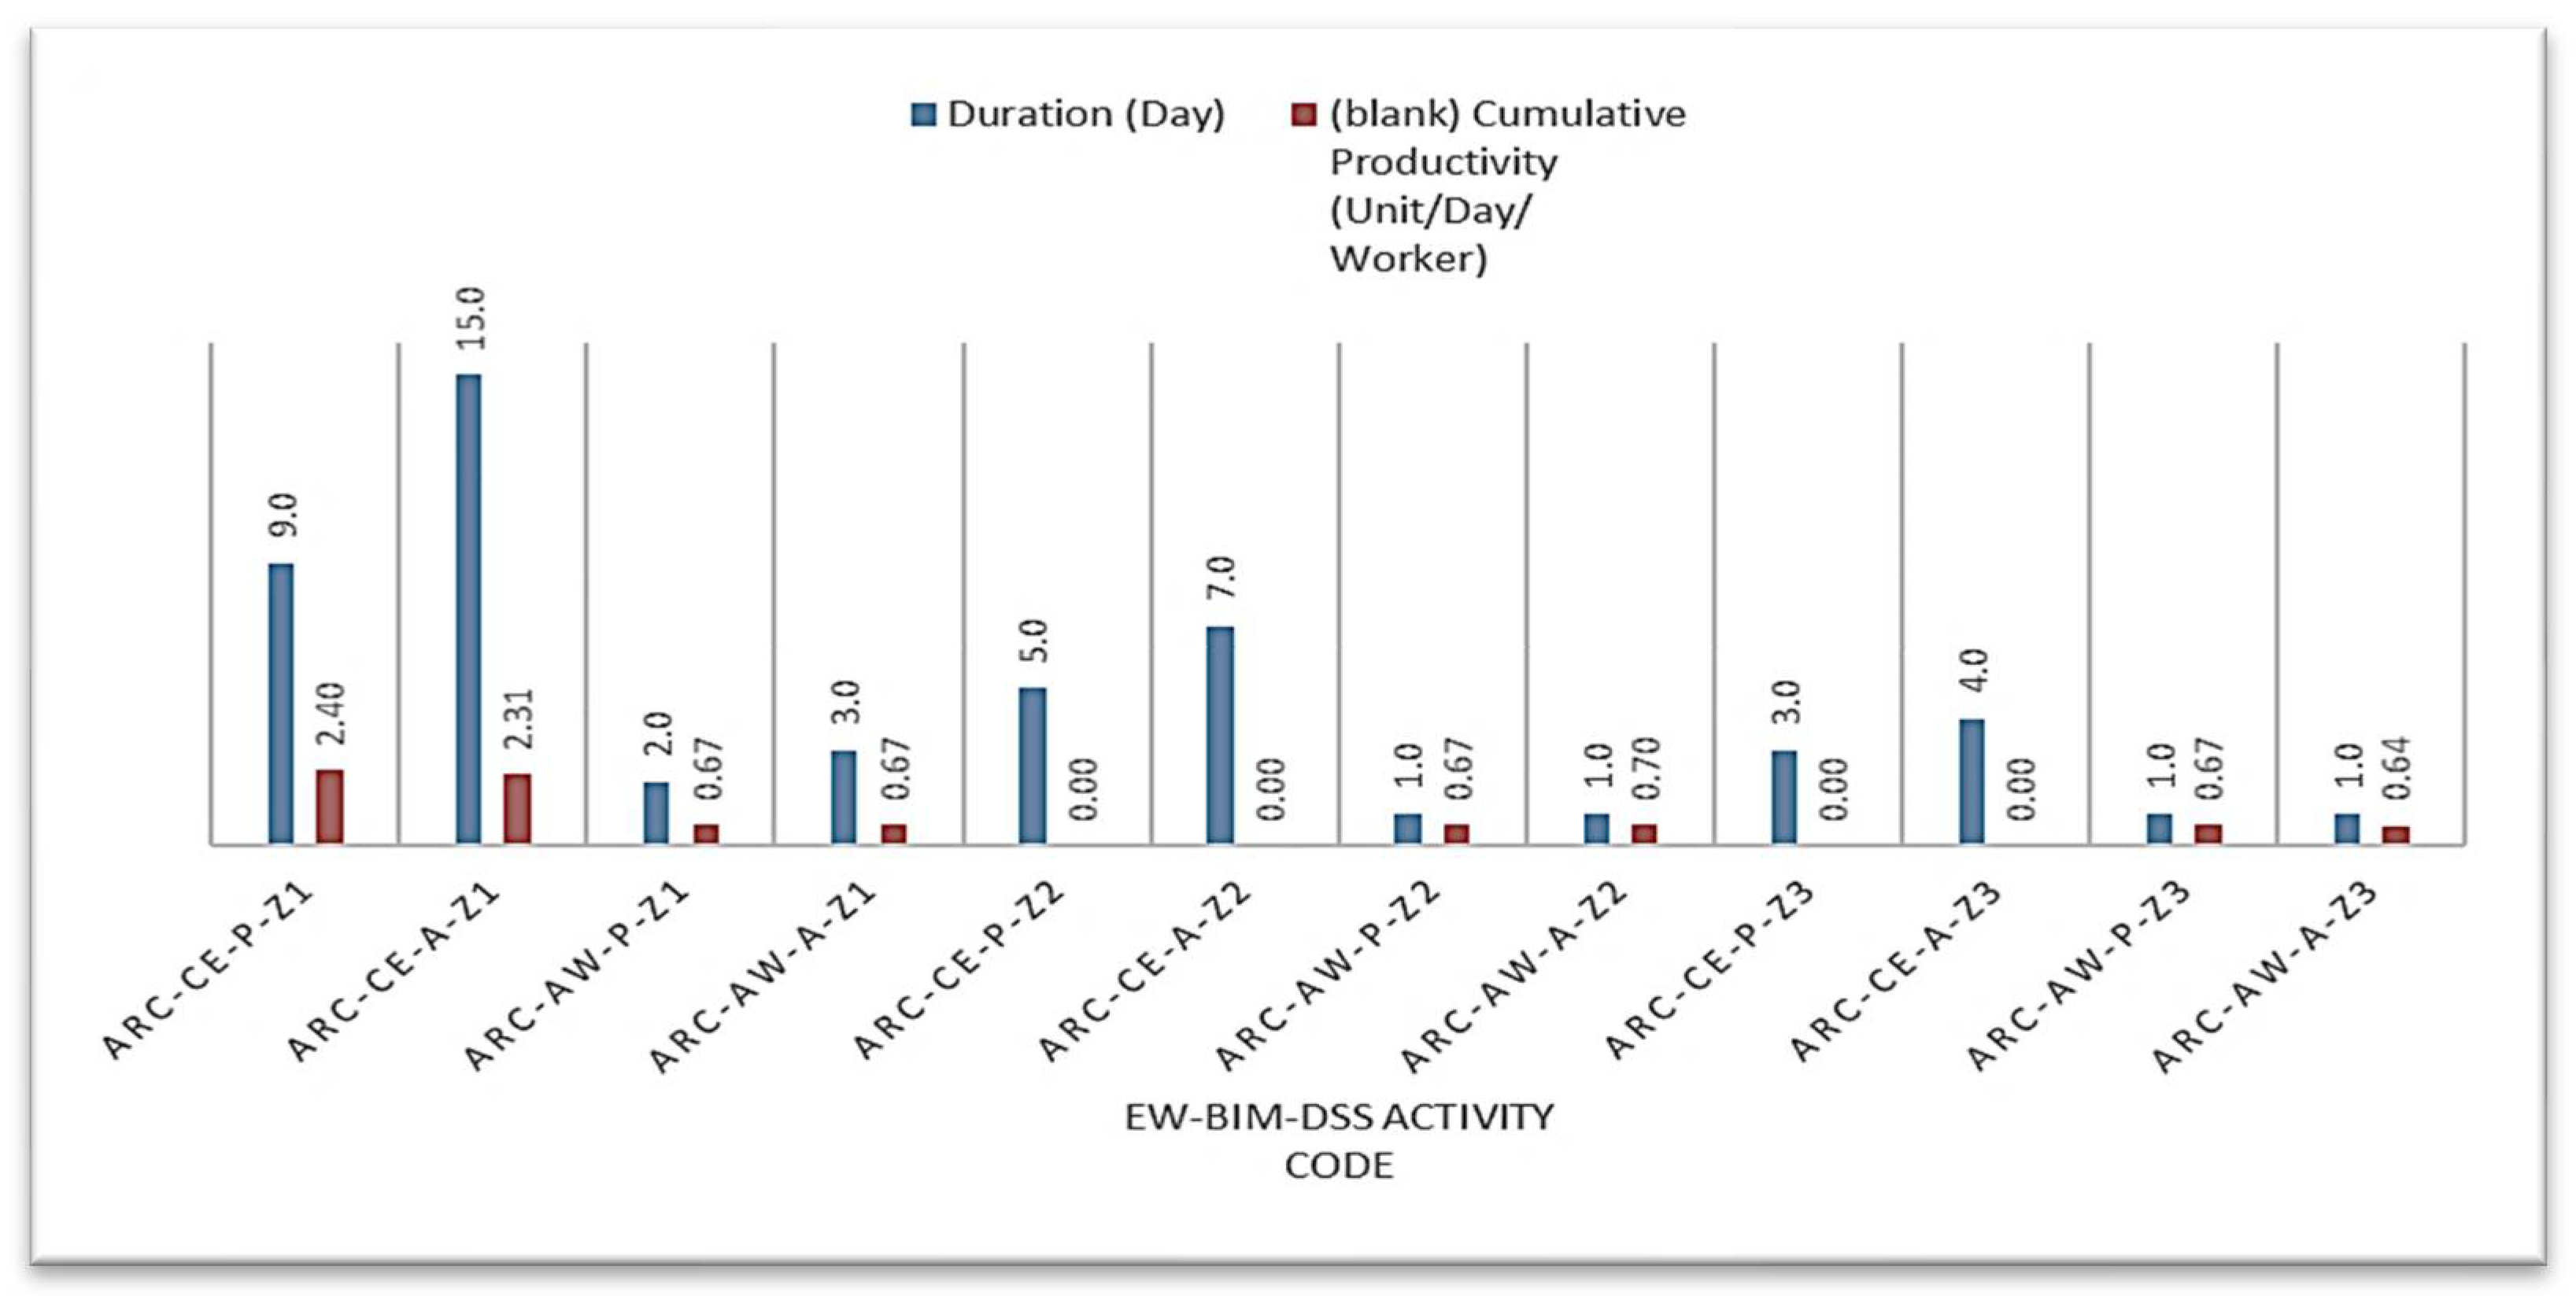
Figure 20, indicates the activity duration in days and its related cumulative Productivity (Unit/Day/ Worker) in the first week which is extracted from the recommendation report.
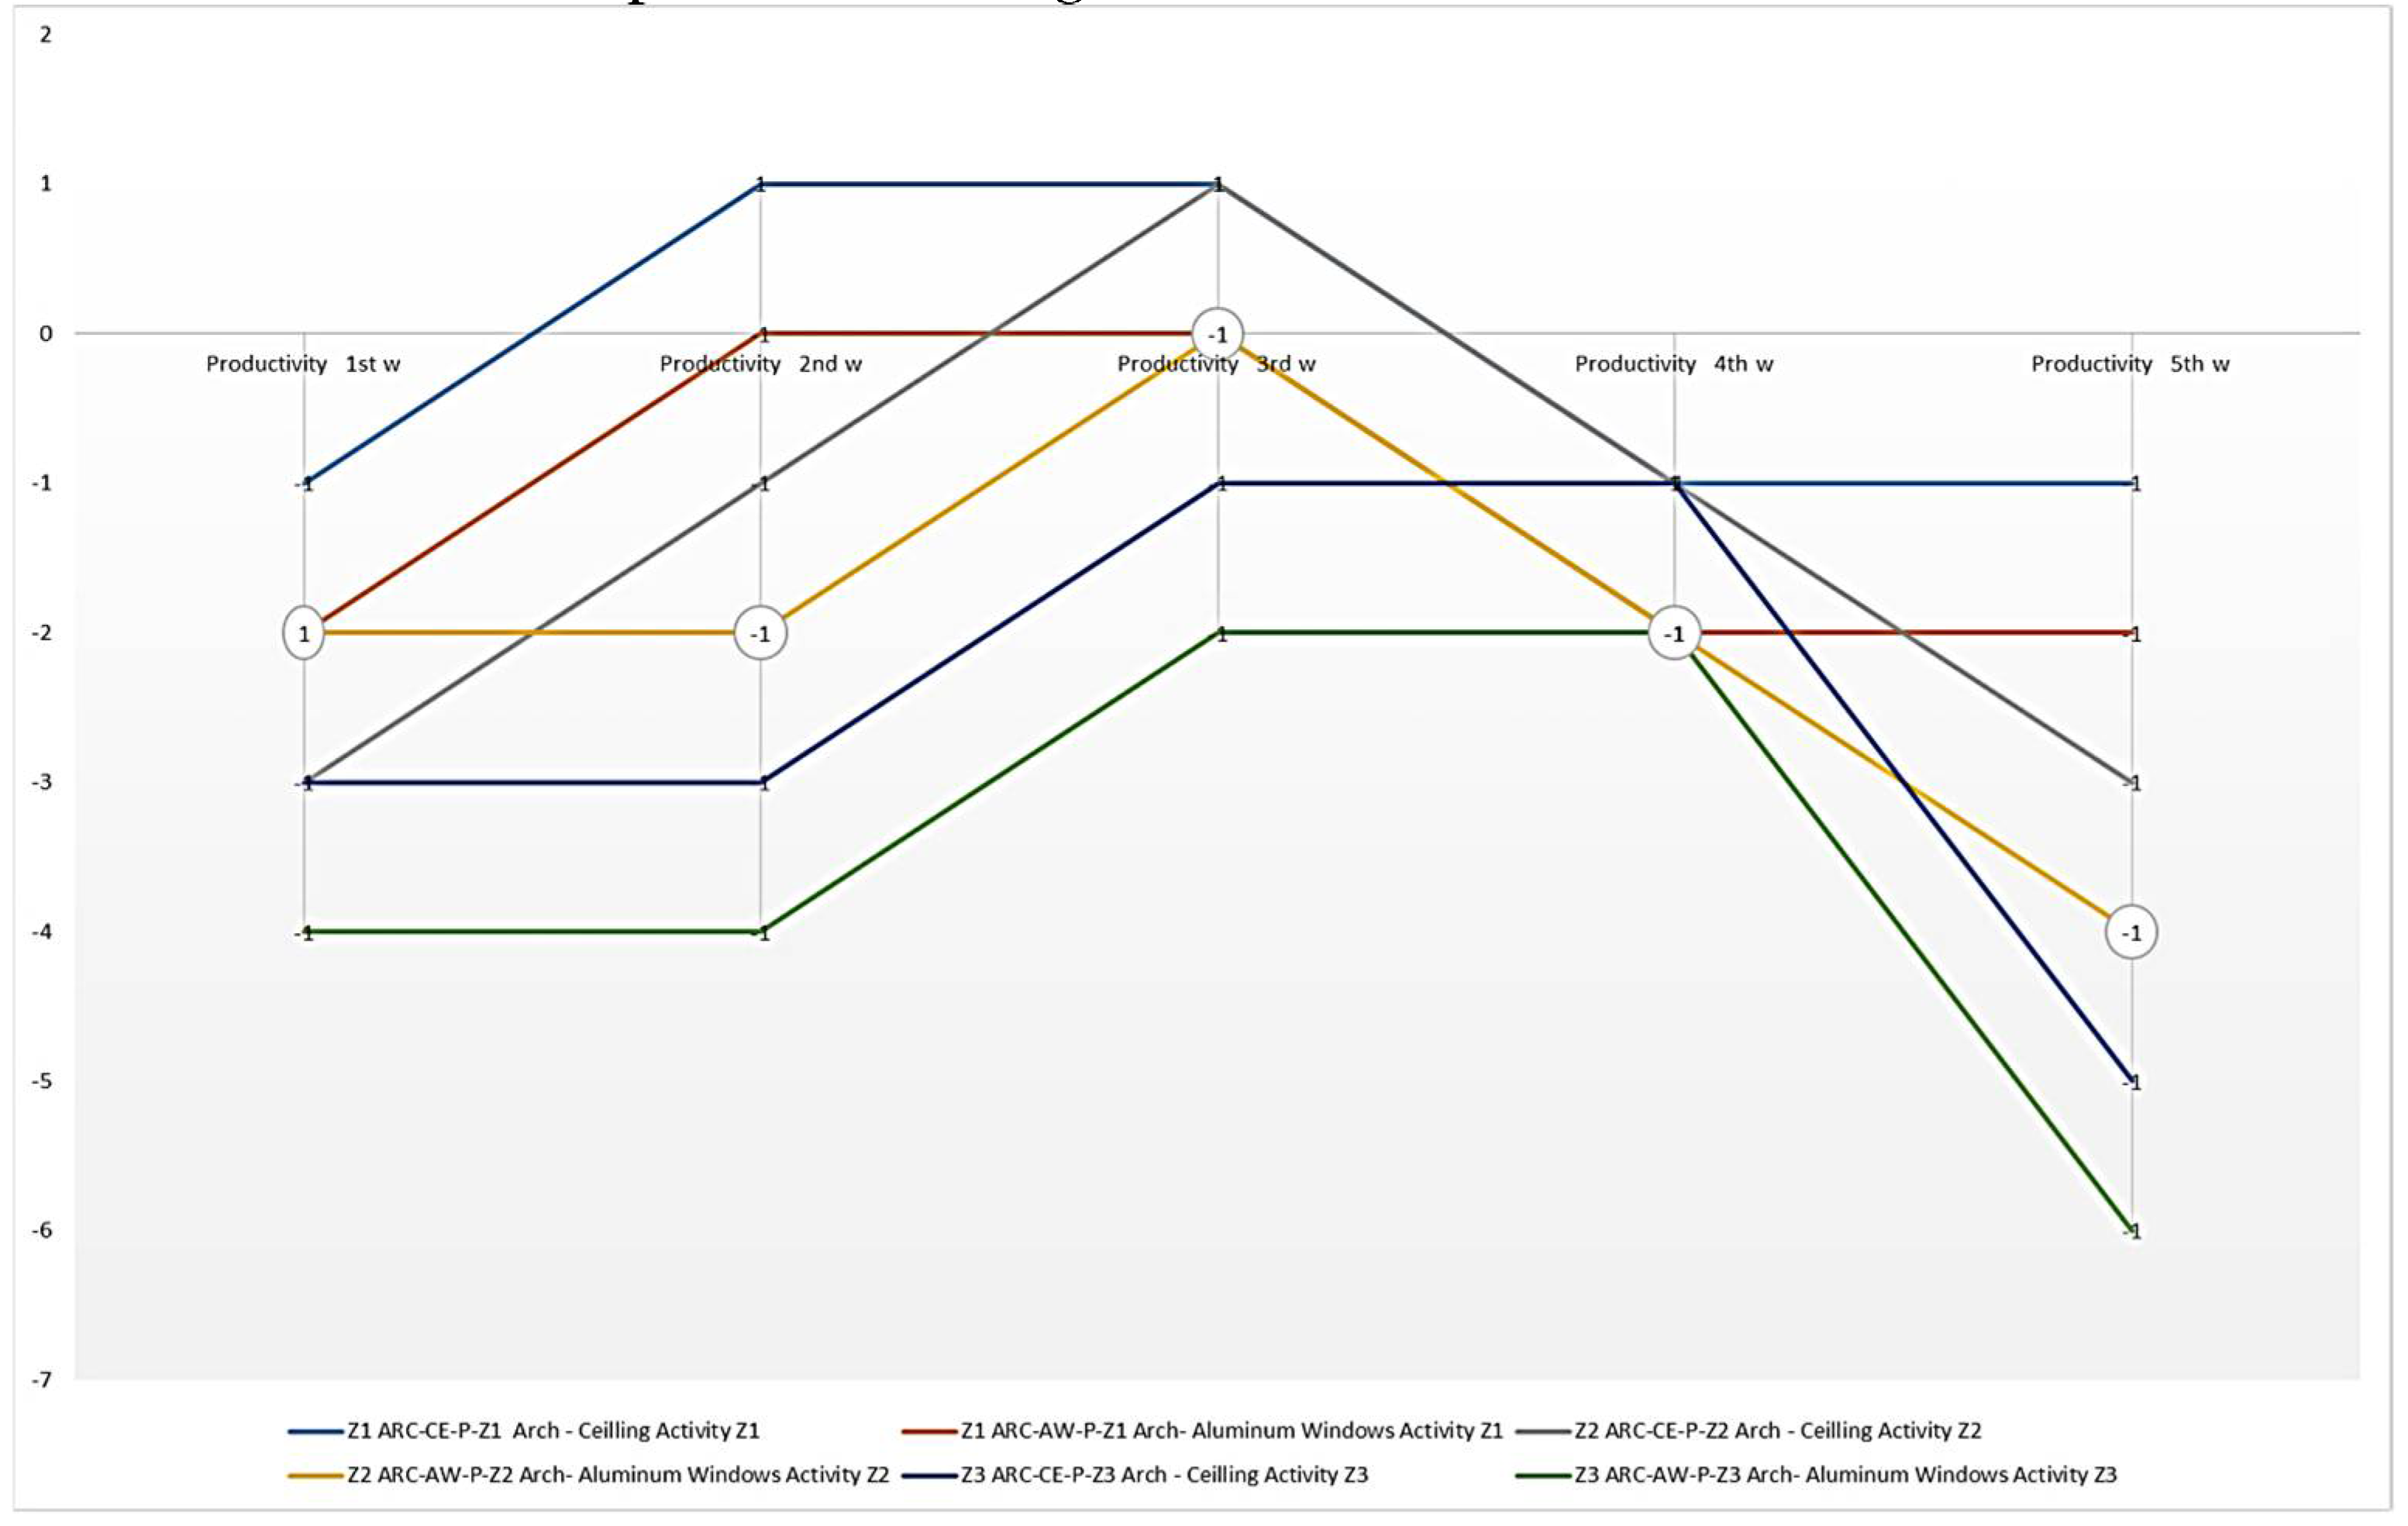
The study did not focus on productivity only, due to the complexity of this matter and to give the project manager the ability to analyze the issue. A positive or negative productivity variance is shown in
Figure 21 over the project's lifecycle. The presence of a positive figure indicates that the contractor has increased the production rate and vice versa. The figure implies that the ceiling and window contractor has underperformed assigned duties.
Additionally, the embedded system facilitated the extraction of a detailed daily attendance sheet, eliminating the need for traditional manual attendance records (
Table 3).
8. Case-Study Limitations of Research
The case study revealed key constraints, notably signal interference that compromised the Bluetooth Low Energy (BLE) tracking system in specific construction zones. Rigorous signal analysis and system calibration were essential for optimal performance. The initialization of BLE tags necessitated specialized training to ensure data integrity. Privacy and data security measures were implemented to safeguard worker confidentiality.
The study validates the proposed methodology for optimizing construction resource positioning via digital twin technology. It integrates Agent-Based Modeling (ABM), BLE tracking, Building Information Modeling (BIM) visualization, and the Construction Early Warning System (CEWS) to enhance real-time monitoring and project management. These findings augment existing literature on construction resource optimization and offer guidance for future methodological applications.
The research also notes the variable availability and suitability of BLE devices across different markets. Therefore, customization based on regional tools, technologies, and market conditions is advised for practitioners and researchers.
9. Discussion of Results
The case study at Project HU-CED has provided invaluable insights into the optimization of construction resource allocation via digital twin technology. The incorporation of Agent-Based Modeling (ABM), Bluetooth Low Energy (BLE) tracking, Building Information Modeling (BIM) visualization, and the Construction Early Warning System (CEWS) has facilitated real-time resource allocation intelligence. Stakeholders have derived considerable advantages from the CEWS dashboard and BIM model, which have enabled the real-time monitoring of activities, resource allocation, and labor productivity. Moreover, the BLE system has automated the attendance recording process, thereby obviating the need for manual data collection.
The Decision Support System (DSS) and CEWS have been pivotal in facilitating data-driven decision-making. The DSS has accurately managed project data, while the CEWS has supplied indispensable data concerning variances in resources, quantities, and productivity.
In comparison to conventional resource allocation methodologies, the proposed framework exhibits marked benefits. The real-time visibility, afforded by BLE tracking and BIM visualization, enables the expeditious identification of issues. Conventional methods, which are dependent on manual data collection, are often subject to delays. Additionally, the application of agent-based modeling has optimized resource allocation by considering variables such as workers' location and task prerequisites, thereby enhancing resource utilization and minimizing idle time. The CEWS has further augmented data-driven decision-making, contributing to superior resource allocation efficacy.
The deployment of the proposed framework has multiple far-reaching implications. Primarily, it elevates resource management by offering enhanced visibility and governance over resource allocation. Secondly, it augments decision-making through the real-time availability of data via the CEWS and DSS, thereby enabling anticipatory adjustments and resource allocation optimization. Lastly, it boosts efficiency by curtailing idle time, thereby enhancing the overall efficacy of the project.
Nevertheless, certain limitations warrant consideration. The scope and intricacy of the case study are relatively confined, necessitating additional research to assess the framework's scalability for more expansive and complex projects. The framework's effectiveness is contingent upon technological compatibility and the availability of BLE devices, BIM software, and the HOLOBUILDER platform. Moreover, the success of the framework is influenced by project-specific variables such as site layout, worker collaboration, and the proficiency of the project team, which must be customized to each project's unique circumstances. The incorporation of ABM and digital twin technology in construction projects offers manifold benefits for project managers and stakeholders. These benefits encompass enhanced decision-making facilitated by real-time data and visualization capabilities, improved resource utilization, proactive issue detection, and augmented collaboration among project stakeholders, thereby fostering transparency and efficacious communication. While the merits of ABM and digital twin technology are considerable, certain challenges are likely to be encountered. These challenges encompass technological integration, data veracity, change management, cost considerations, and privacy and security concerns. Effectively addressing these challenges necessitates the engagement of seasoned technology providers for seamless integration, the implementation of data validation protocols, the articulation of the advantages of technology adoption to project teams, the execution of cost-benefit analyses, and adherence to data privacy regulations while implementing security protocols to safeguard sensitive project data.
10. Tracking Client Early Warning System Evaluation Survey
A survey was carried out to examine, test, and validate the construction project's tracking method. For this survey, the factors contributing to the success of the proposed method and procedures for tracking workers’ productivity using a hybrid system consisting of Bluetooth Low Energy (BLE) and Building Information Modelling (BIM) technology through the user-friendly CEWS dashboard were evaluated and reported. (40) experts representing a diverse range of contemporary business disciplines participated in the survey (Client, PMCM, Consultant, and Contractor). Most surveys were conducted using a self-administered interview, emphasizing the weightings and rankings of project management processes in the construction industry from the perspectives of the various stakeholders. Four parts were included in the questionnaire as follows:
Part I: The background of the participant, and preliminary descriptive analysis of respondents’ profile.
Part II: BIM Adoption in the Project.
Part III: Current Project Information.
Part IV: Autodesk Visualizer Plugin & CEWS tool primary Evaluation.
10.1. Part I: The Background of the Participants, and Descriptive Analysis of Respondents’ Profile
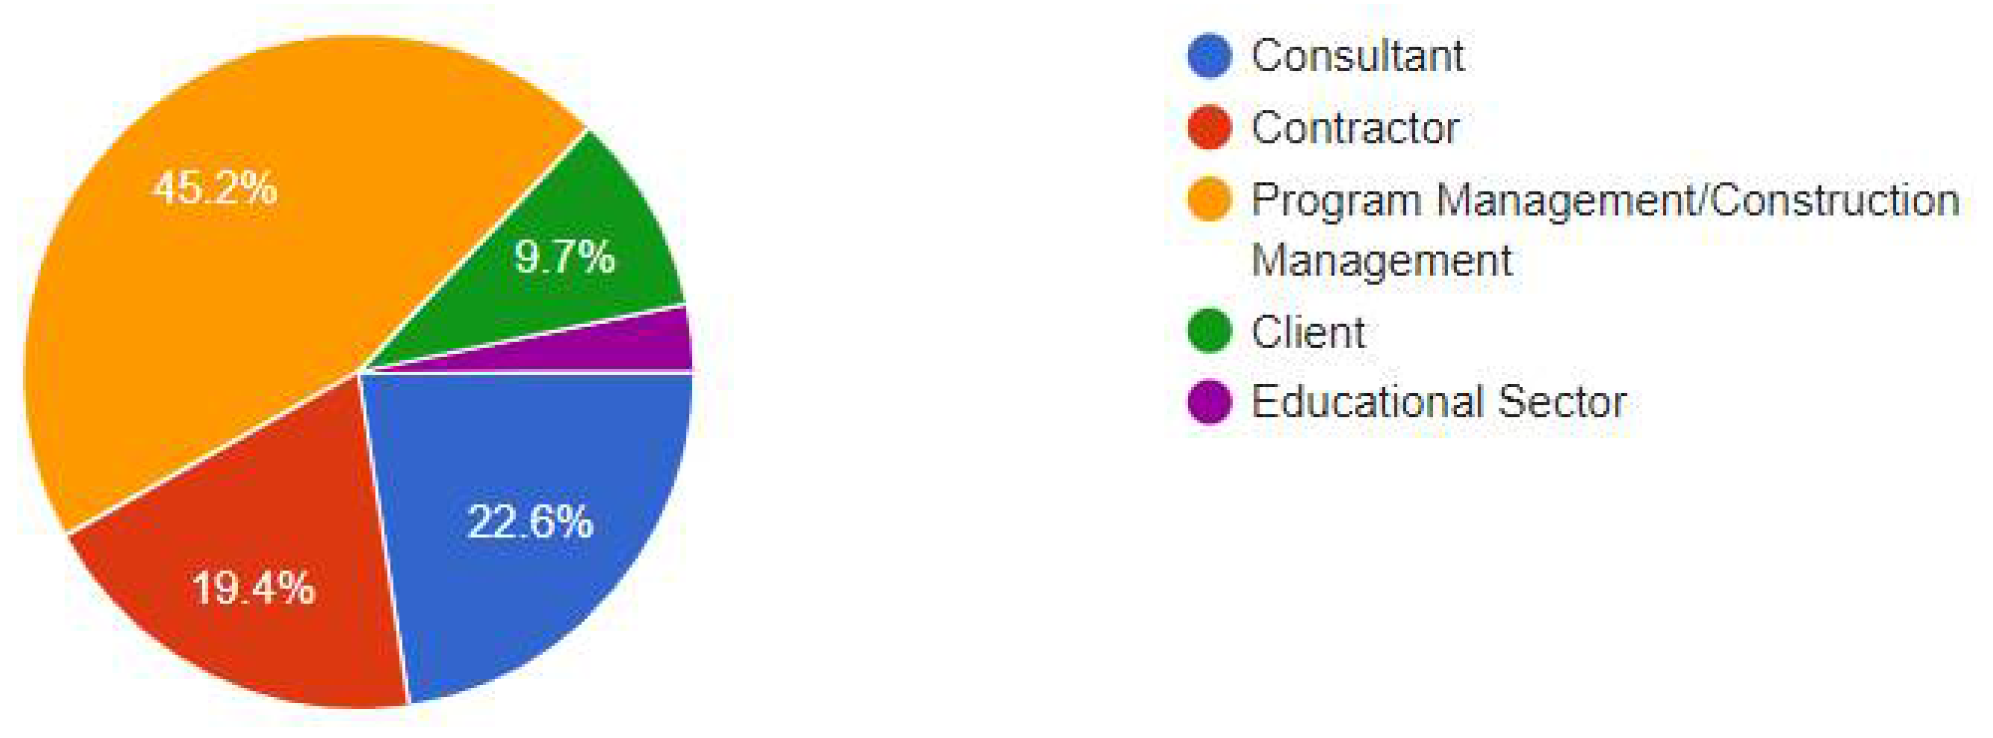
The survey encompassed a broad range of engineering roles with diverse backgrounds. Based on the data that was collected via the questionnaire forms, a diverse type of organizations was evidenced where the majority of the participants were coming from the Management Consultant, Contractor, and Consultant, see
Figure 22.
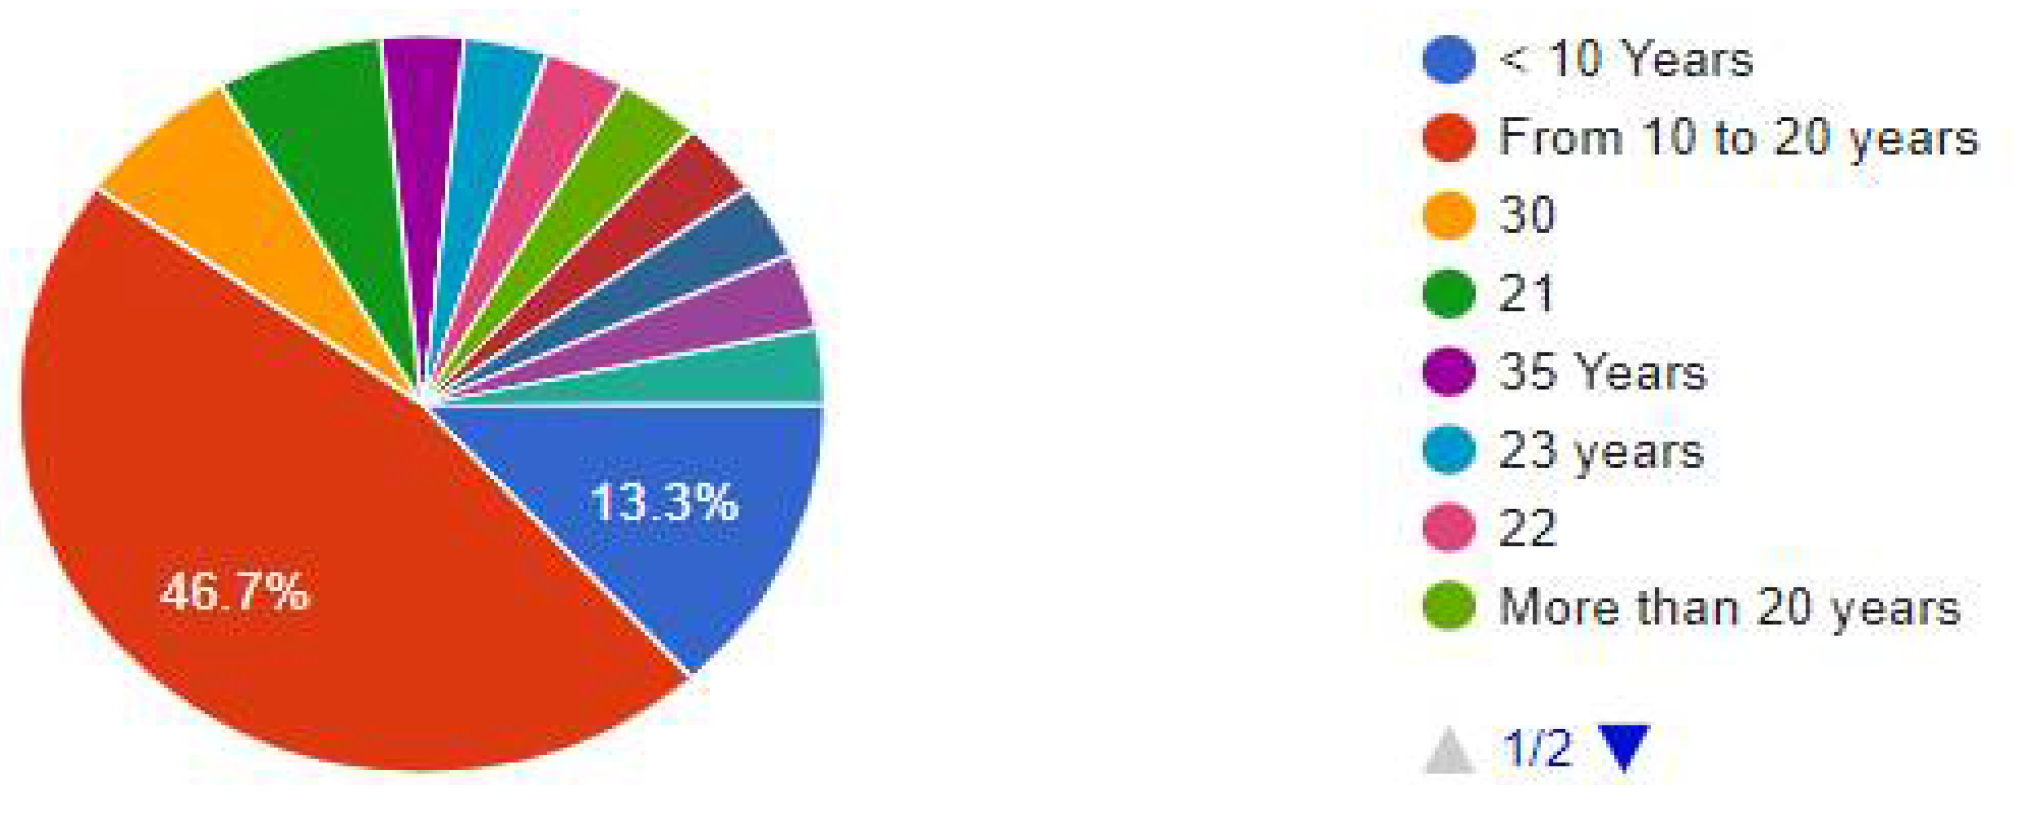
As previously stated, the majority of the participants held positions such as Senior/Project Managers, Planning Managers, Design Managers, and BIM/GIS Managers, among others. As shown in
Figure 23, most participants had a combined experience of approximately 20 years.
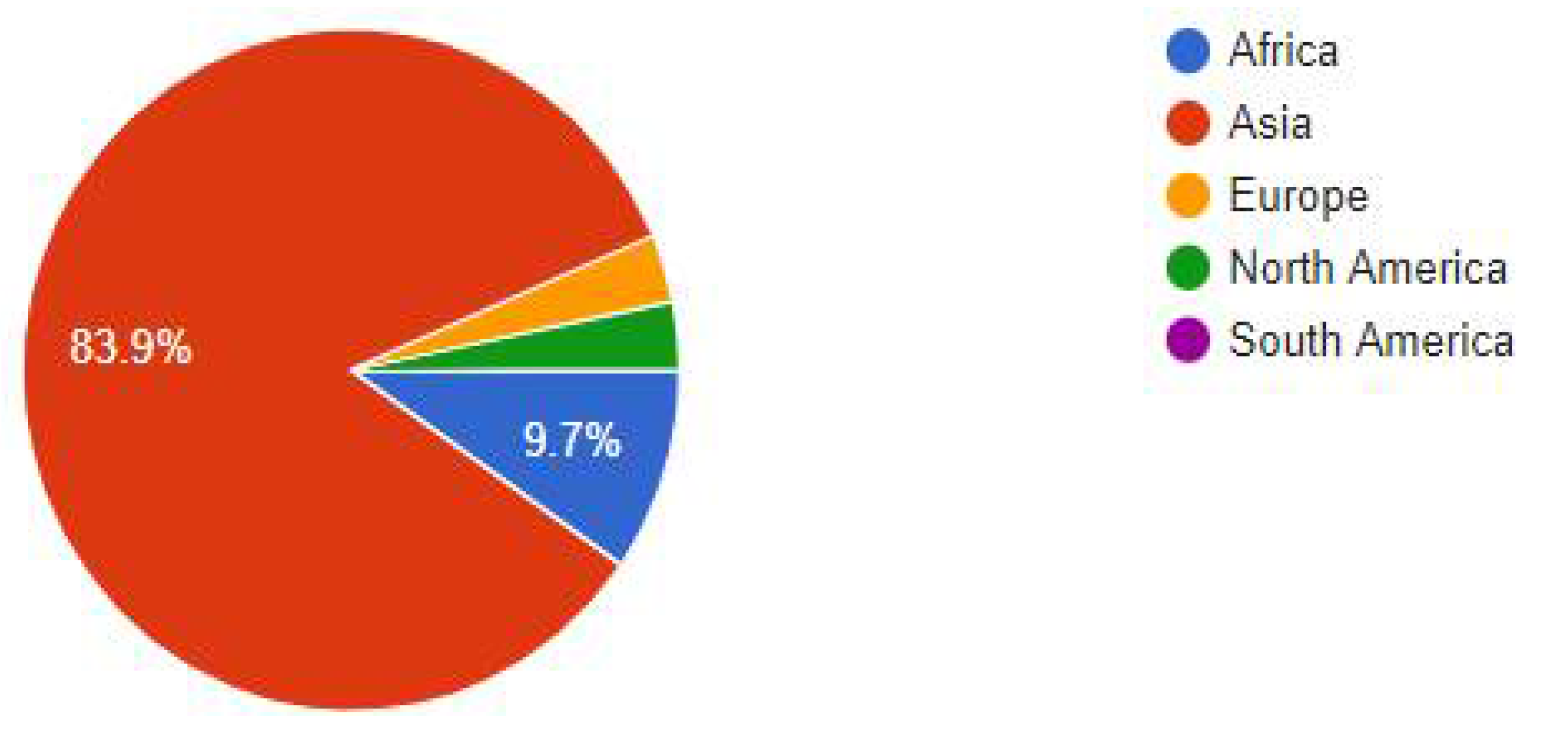
As seen in
Figure 24, most participants came from Asia and Africa, with only a handful coming from North America and Europe. However, more than 80% of those who took part were from Africa and Asia.
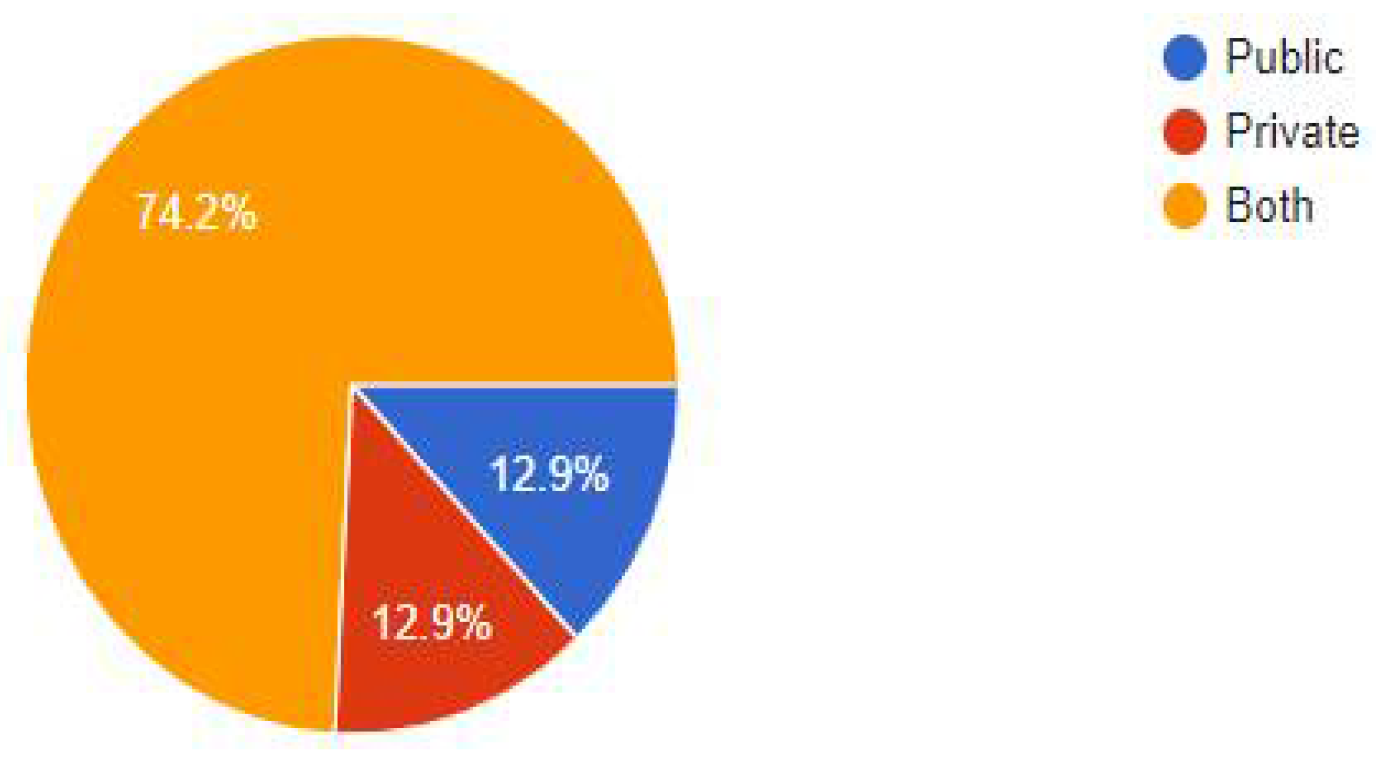
It was a diverse group of project types, with some private and others public in the project's character. However, as illustrated in
Figure 25, most of the completed projects were hybrid private-public initiatives.
In addition, as illustrated in
Figure 26, the majority of the participants are from the project management industry; however, the evaluation also includes participants from other industries, such as contractors and consultants, among others.
10.2. Part II: BIM Adoption in the Project.
This part of the survey collected additional information regarding the BIM adoption in the current projects of the participants. The following items can be derived;
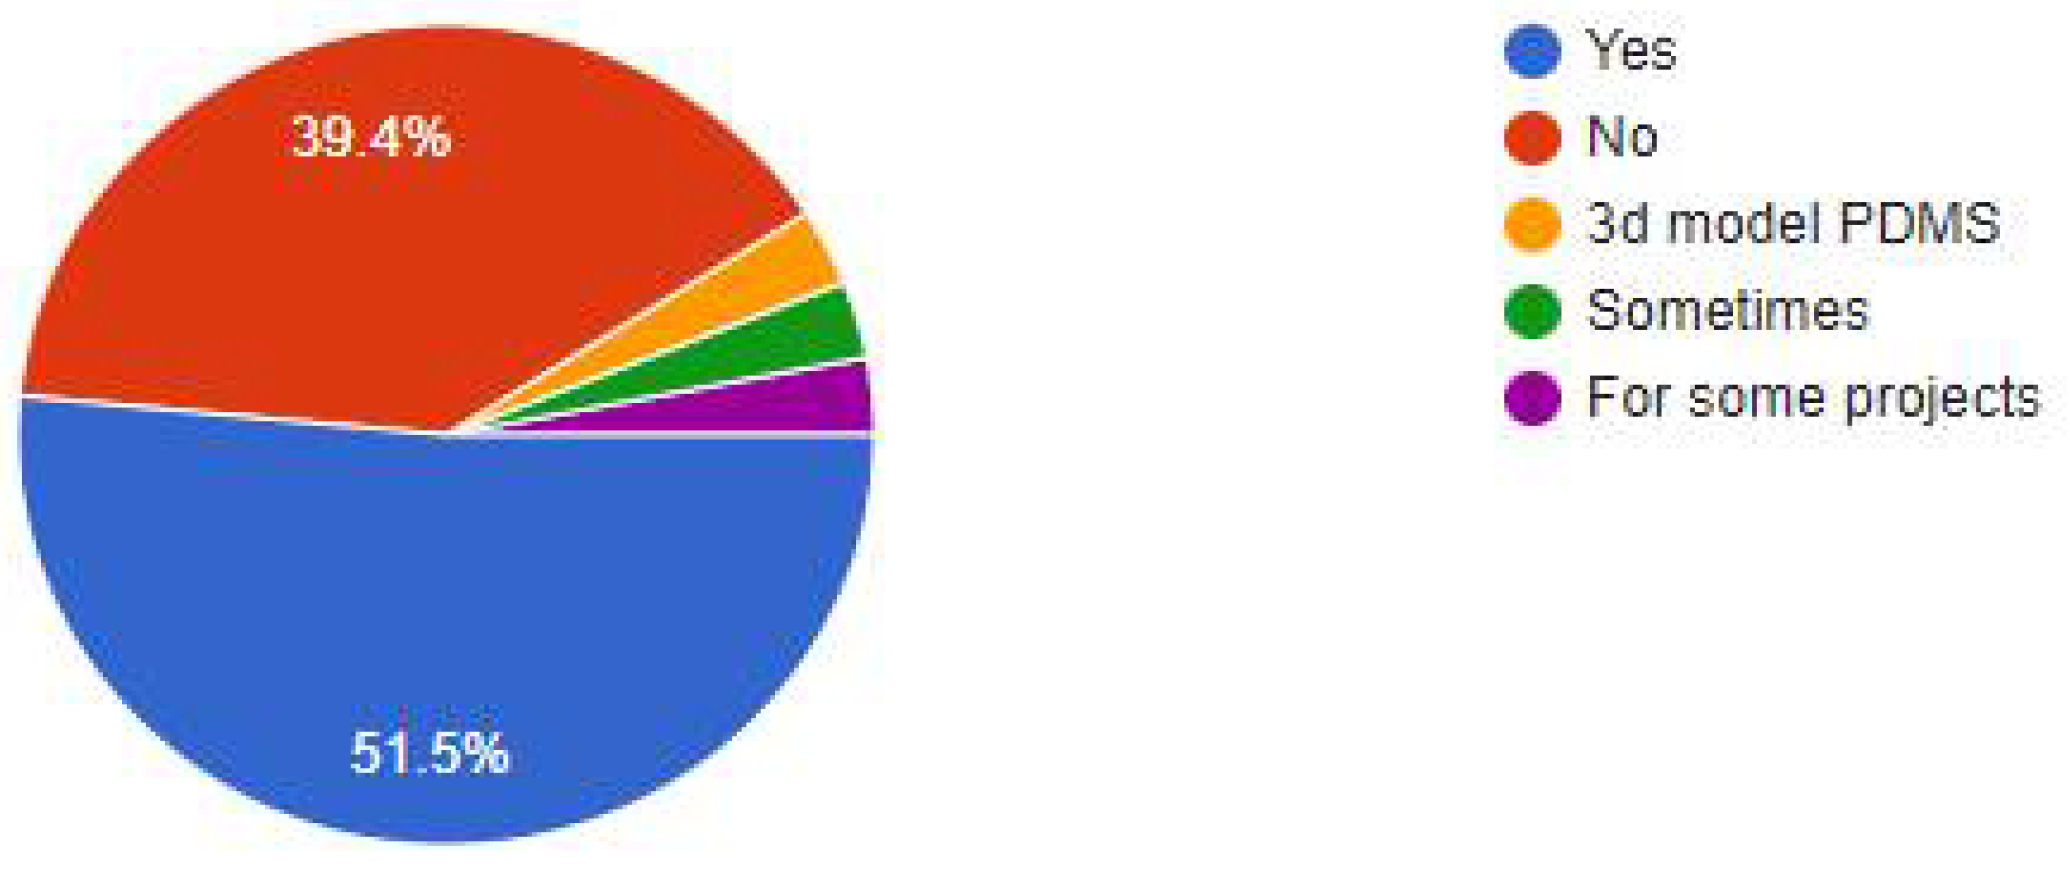
As indicated in
Figure 27, most of the participants used BIM or similar software in their projects.
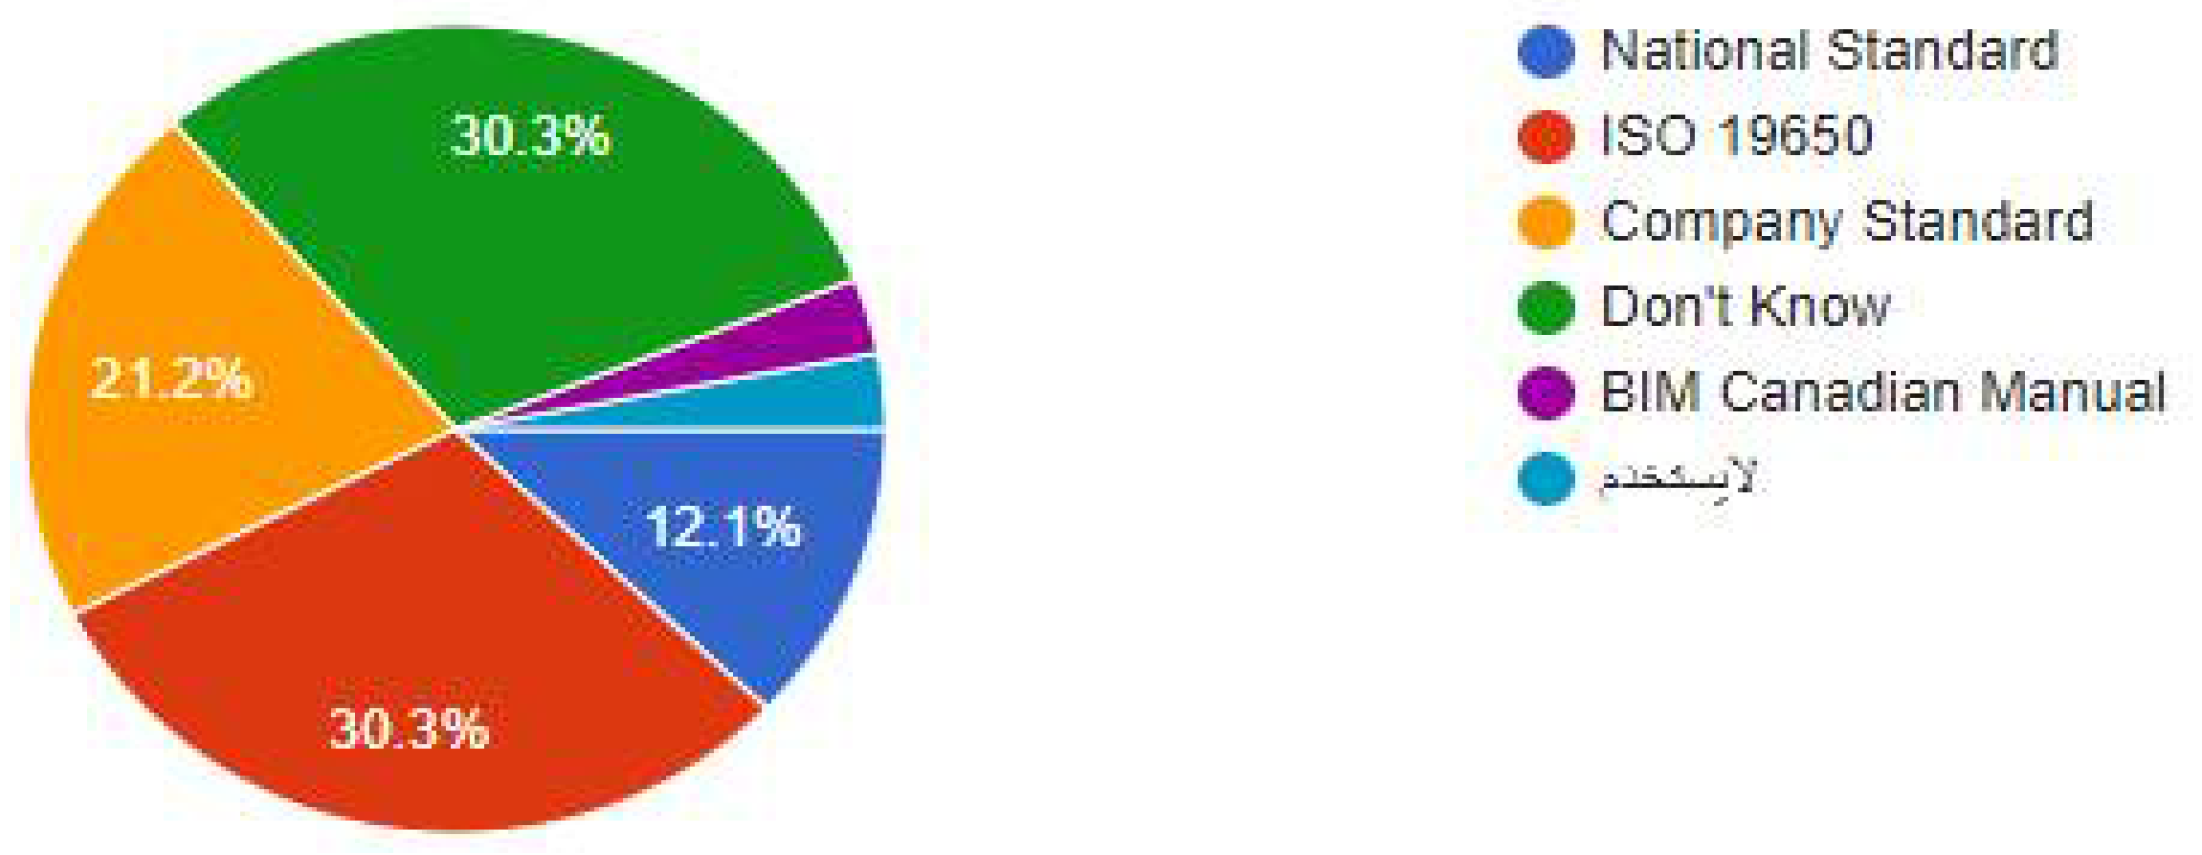
Figure 28 illustrates a clear distinction in the types of BIM standards used to manage the BIM process in construction projects. Some participants in the survey utilize the ISO19650-1&2 BIM standard, while others still use the national BIM standard or do not use it.
As shown in
Figure 29, most participants agree that using BIM as a platform for gathering and displaying worker behavior and completion percentage will add value to the tracking approach described in the previous section.
10.3. Part III: Current Project Information
This section is designed to gather feedback on the current project of the participants.
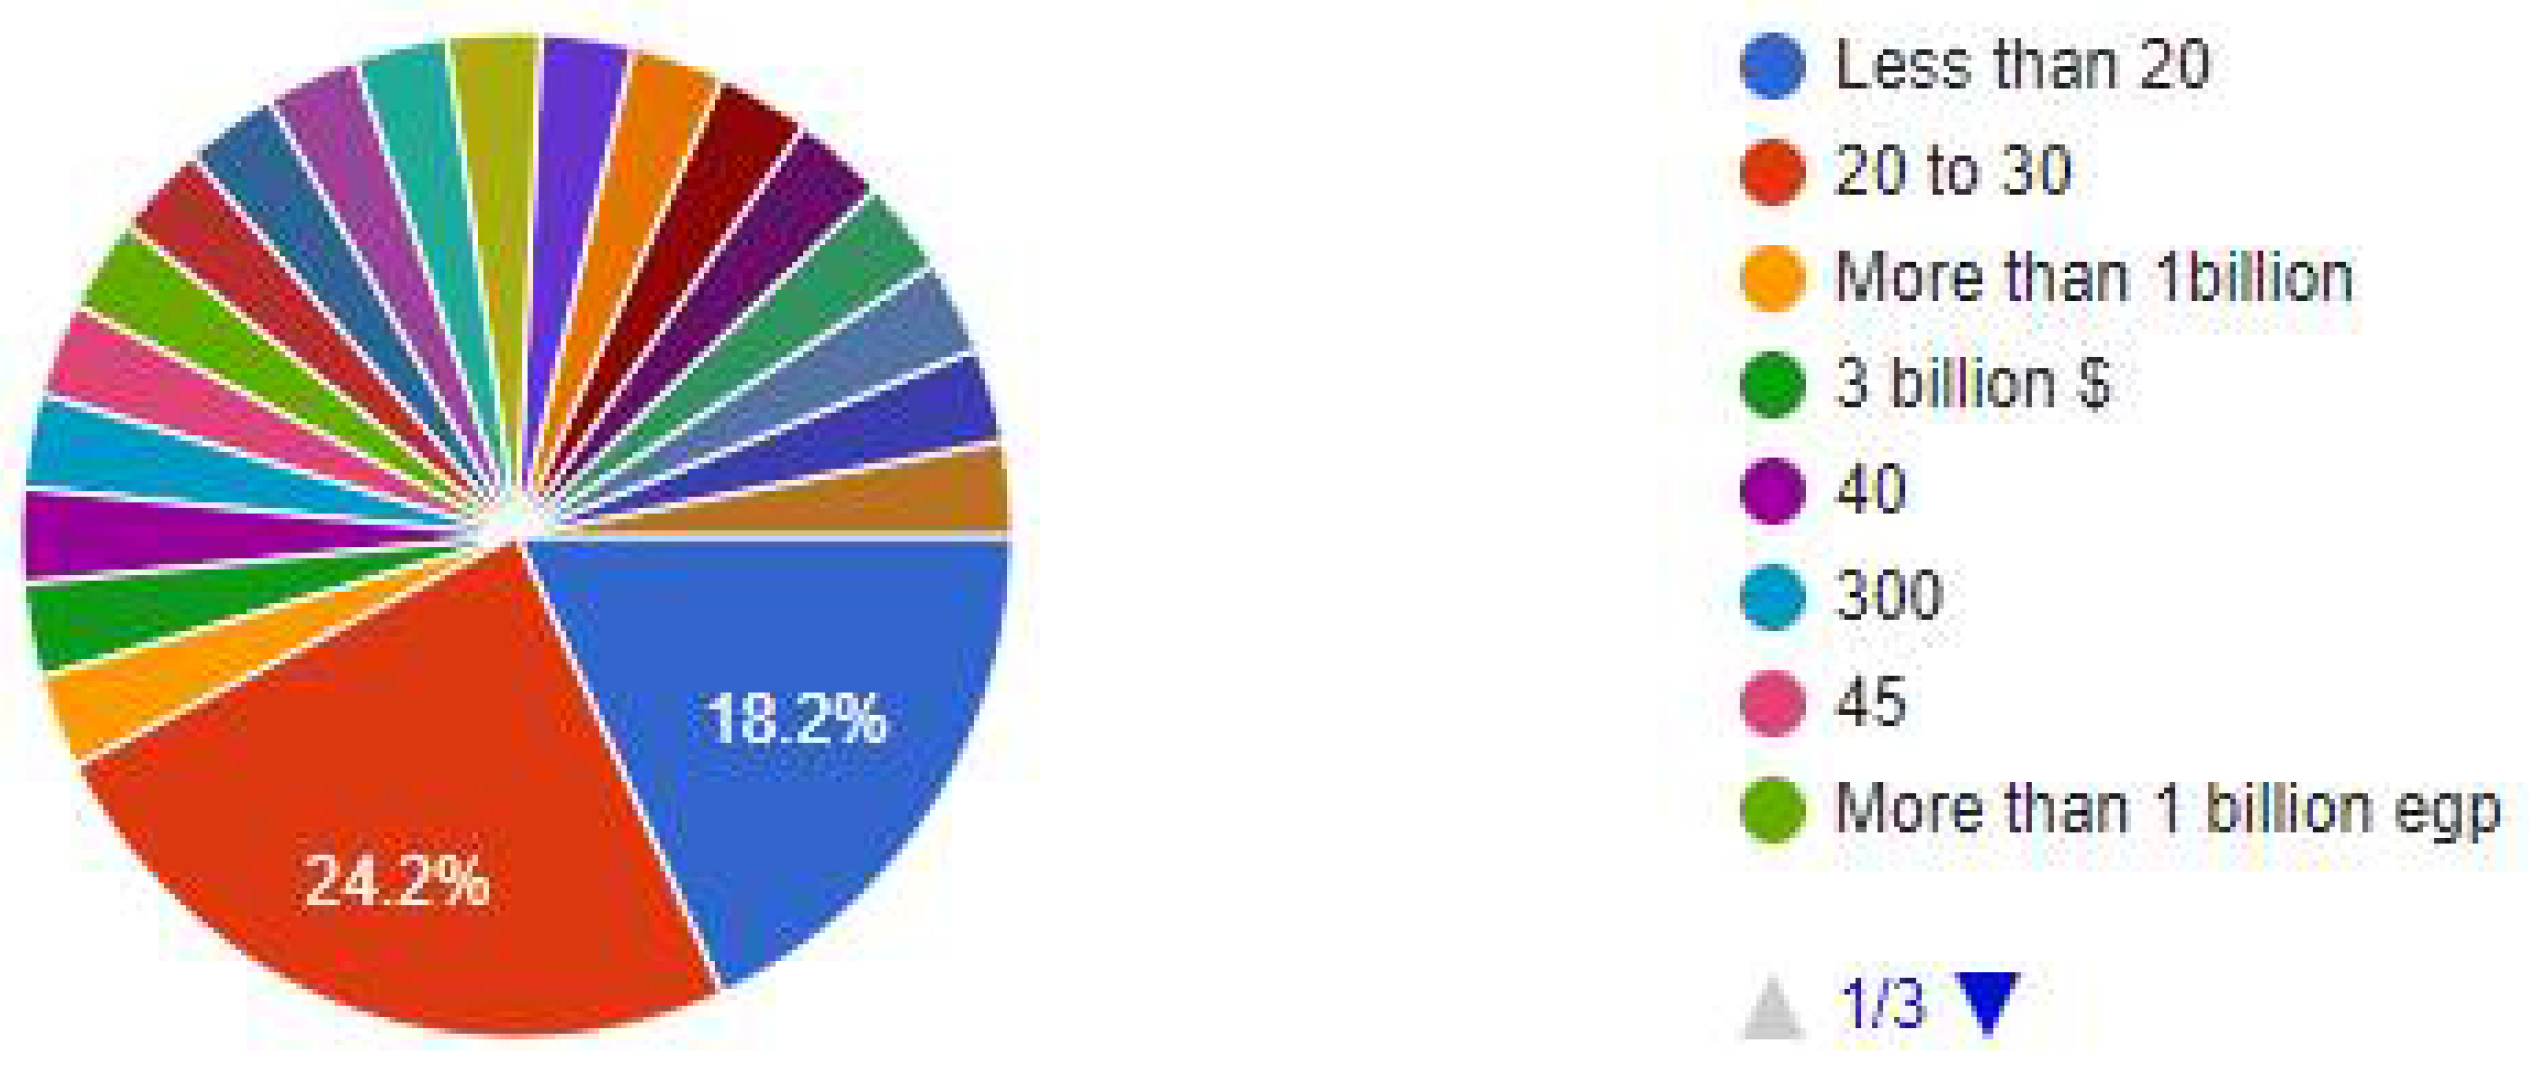
As shown in
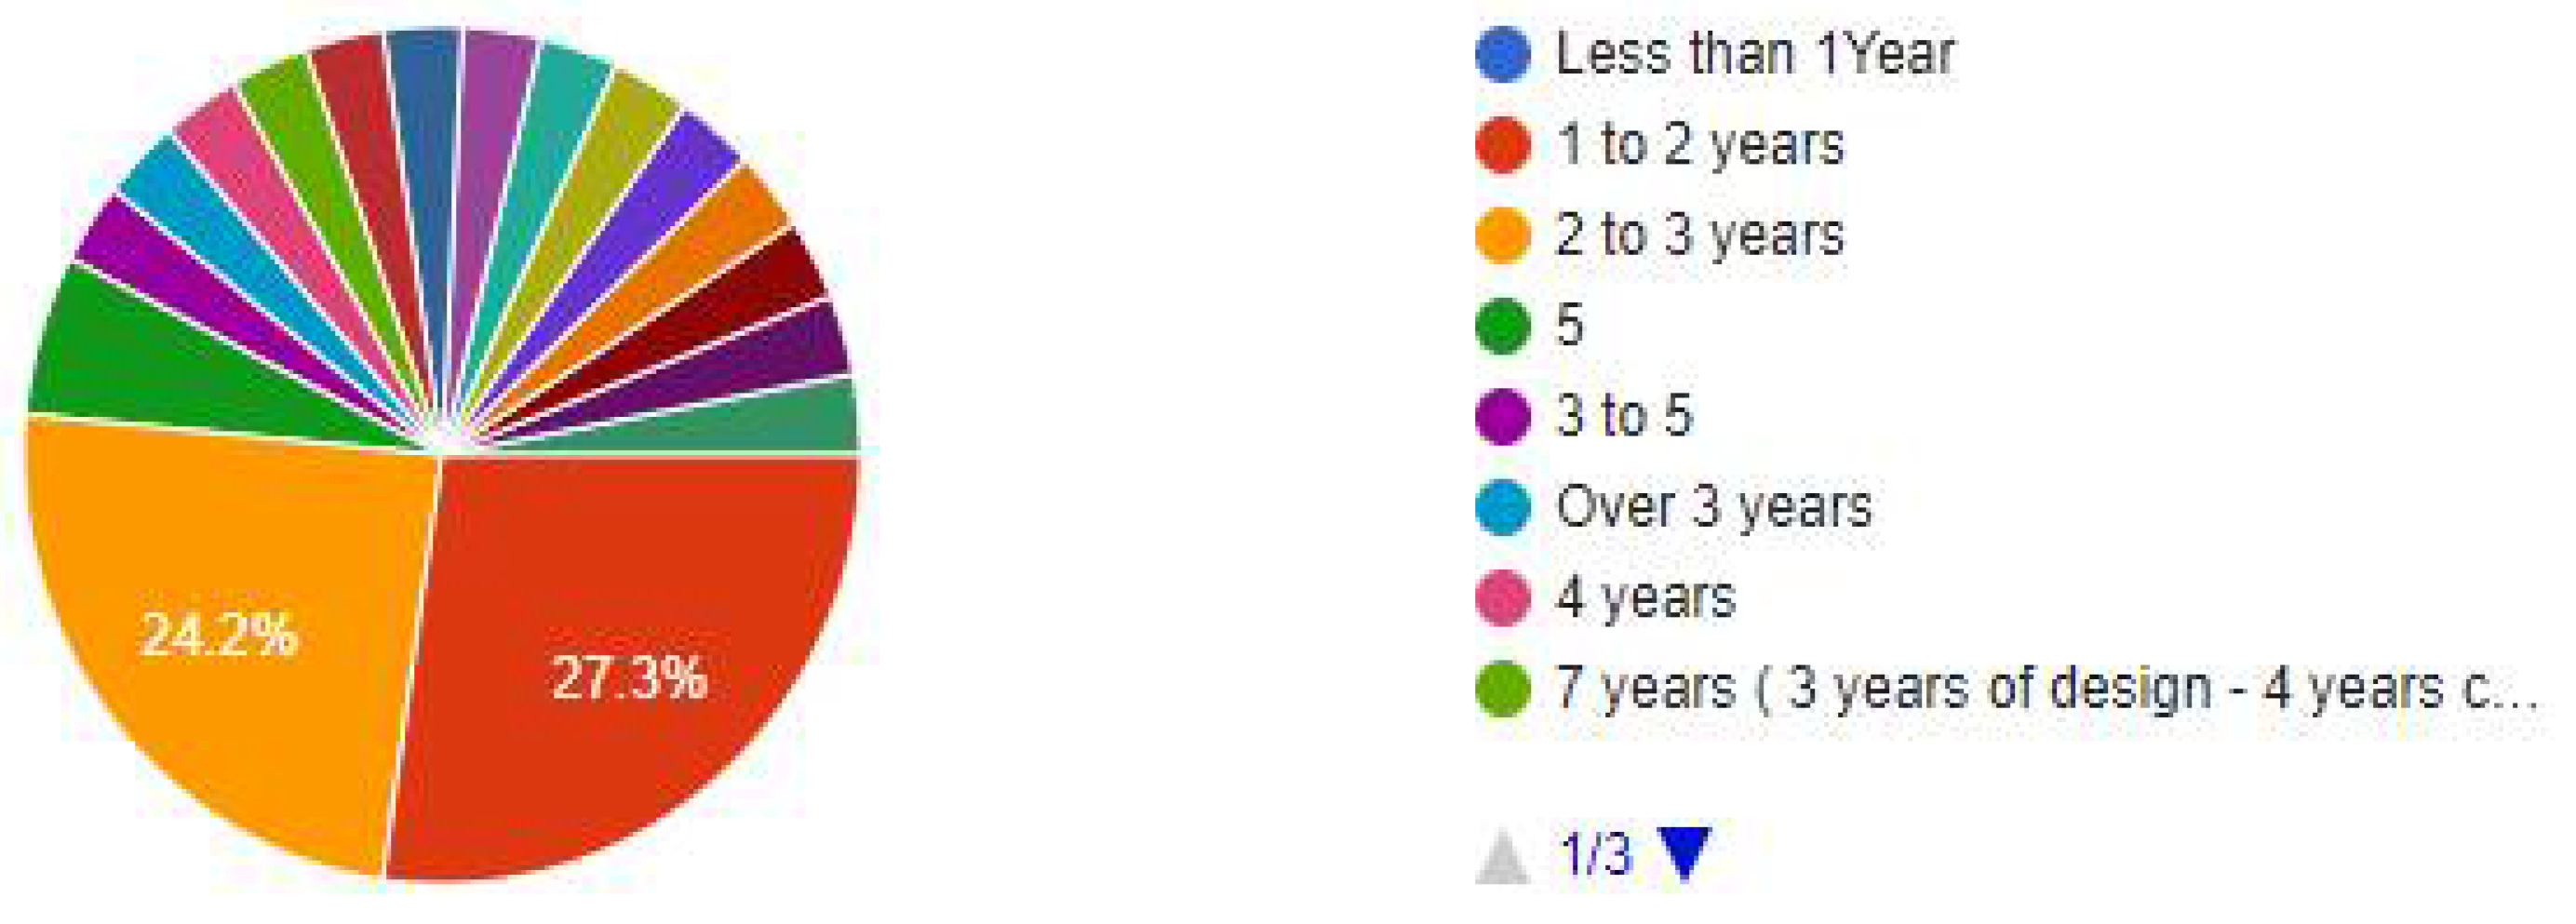
Figure 30 (in million US dollars), a typical project with typical values has been managed or worked on by the participant. The majority of them were in charge of projects with a value of 20 to 30 million US dollars. Furthermore, most of the data was gathered throughout the project which lasted between one and three years, as indicated in
Figure 31.
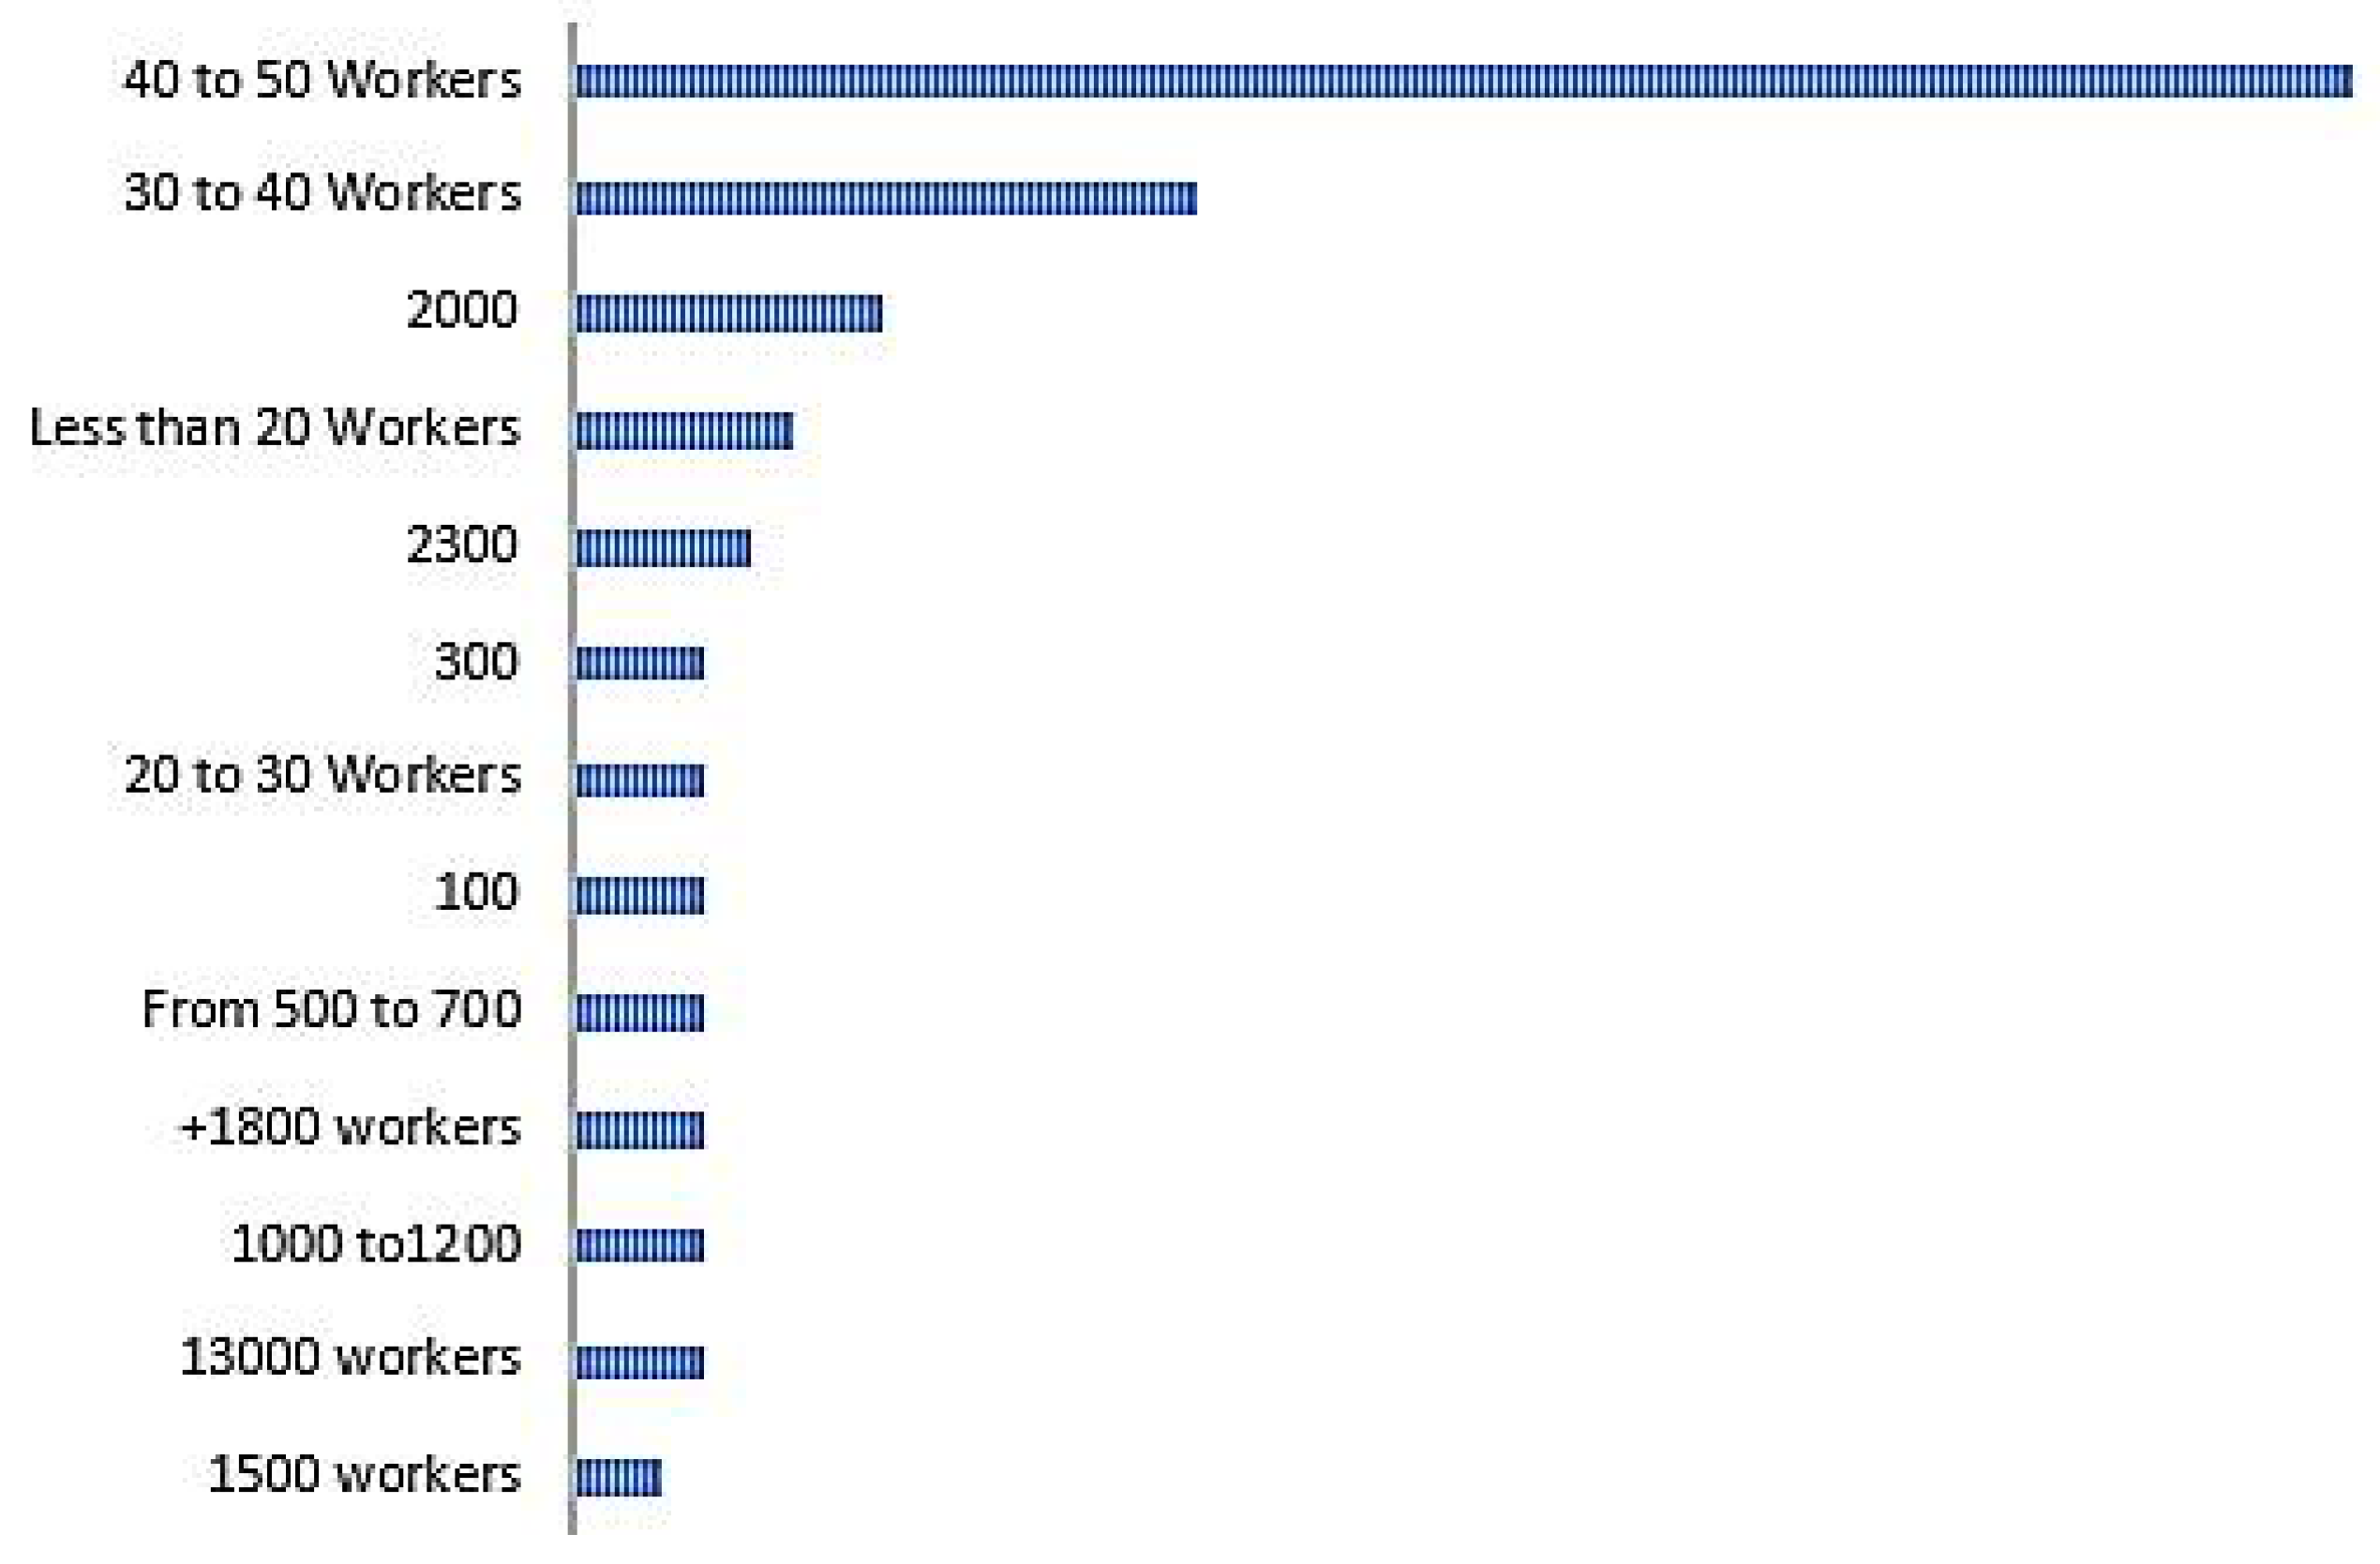
The maximum daily number of workers required to complete the work for the majority of participants was between 30 and 50 workers per hour during rush hour, as indicated in
Figure 32. Each participant stated the magnitude of the problem before providing solutions for managing and monitoring those particular numbers of workers.
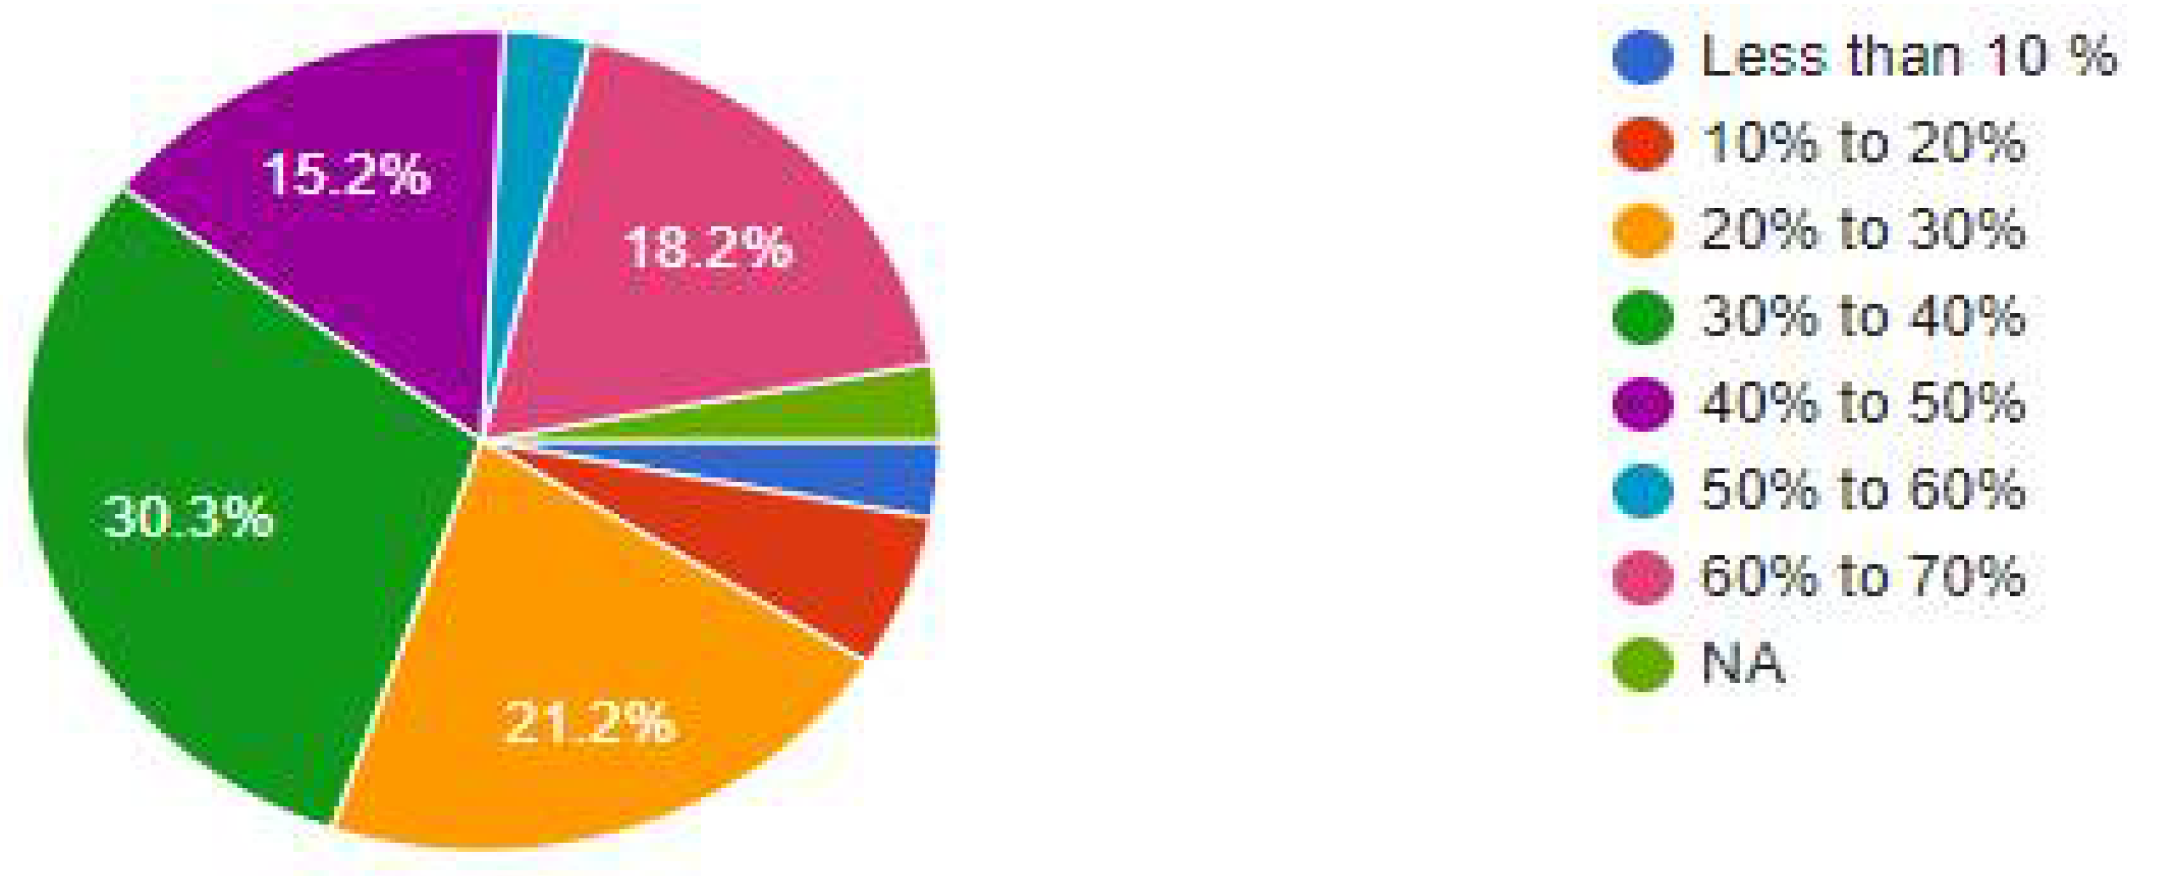
At the same time, the participants believe that worker productivity can contribute to project delays by 10 to 30%, as depicted in
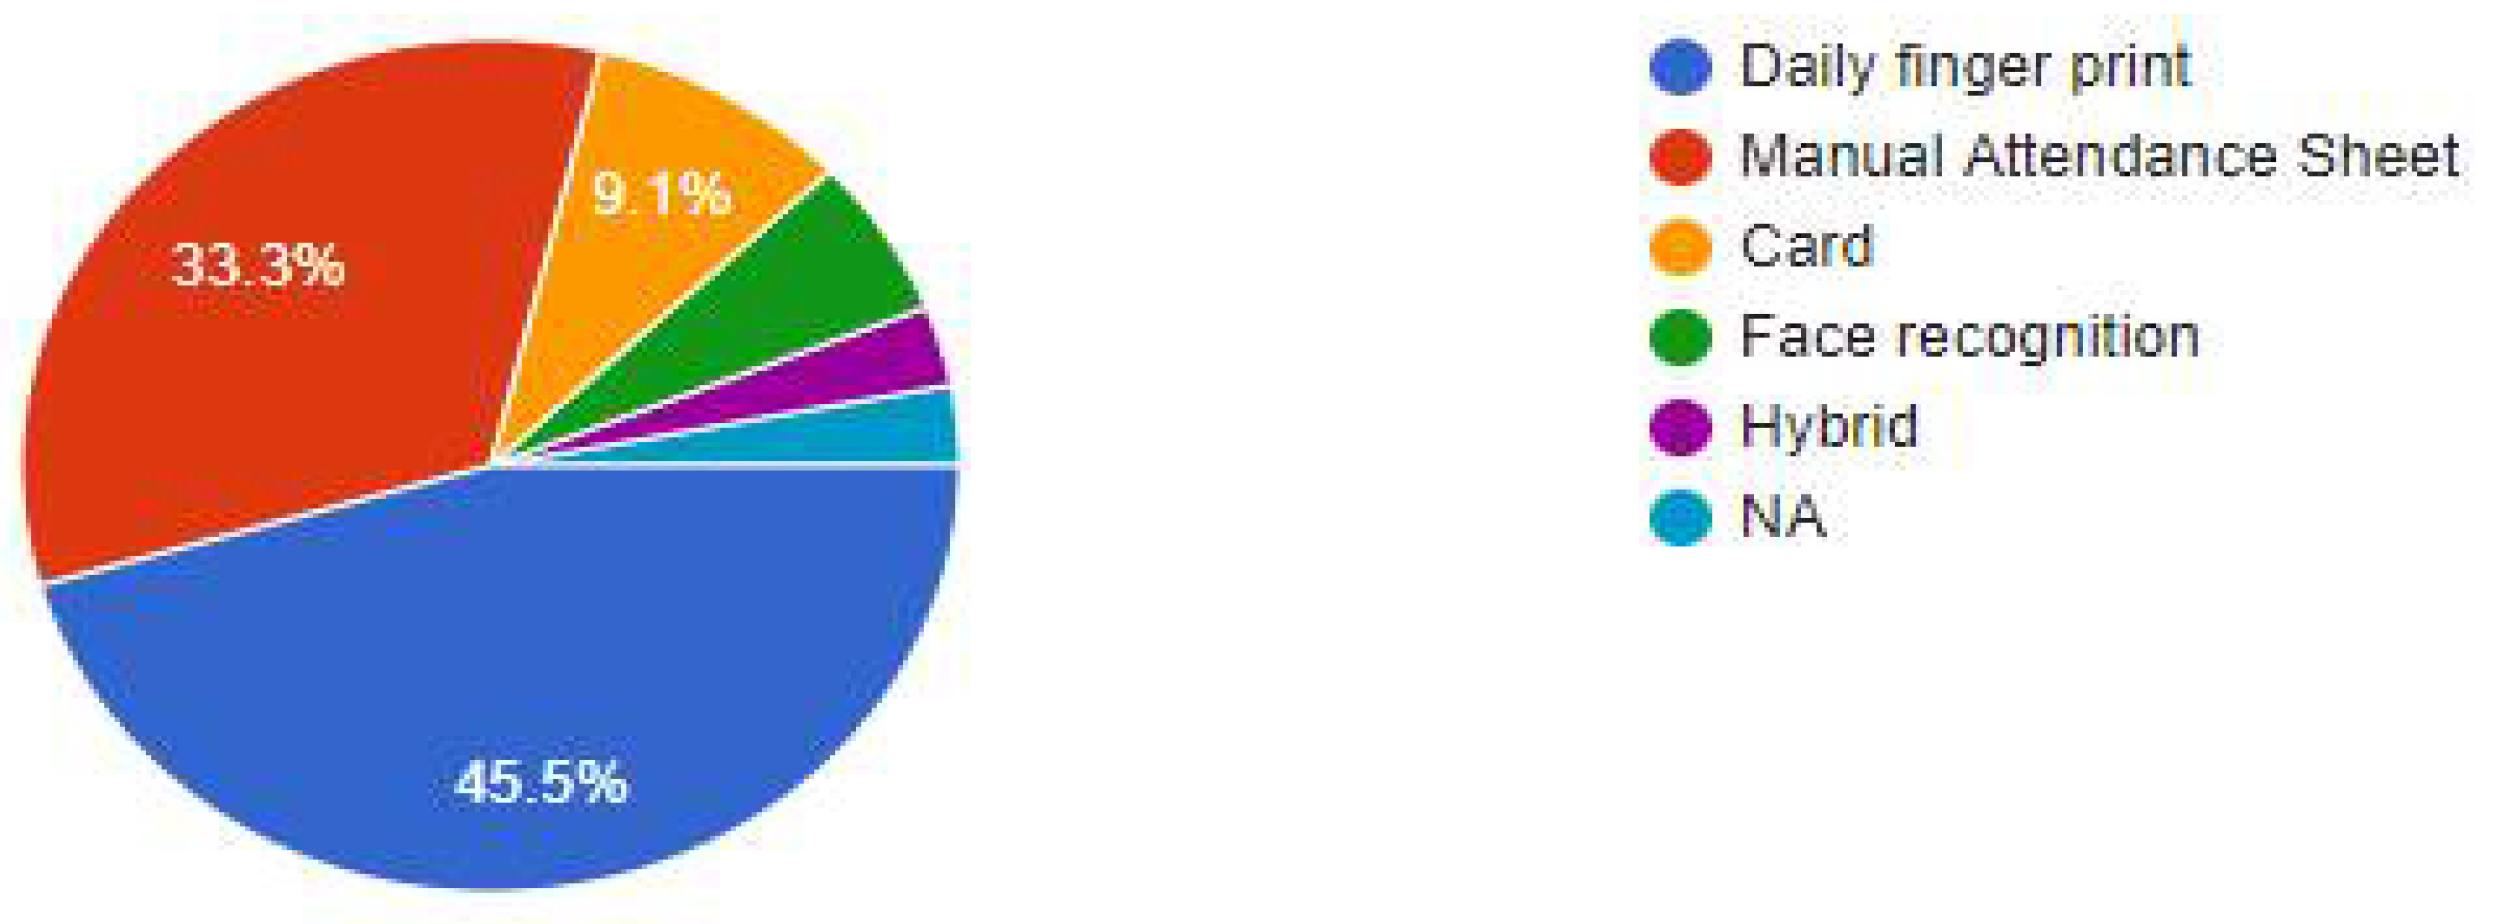
Figure 33. The methods used for tracking workers were Fingerprints or an RFID card. Face recognition was employed by only a small number of participants, as indicated in
Figure 34.
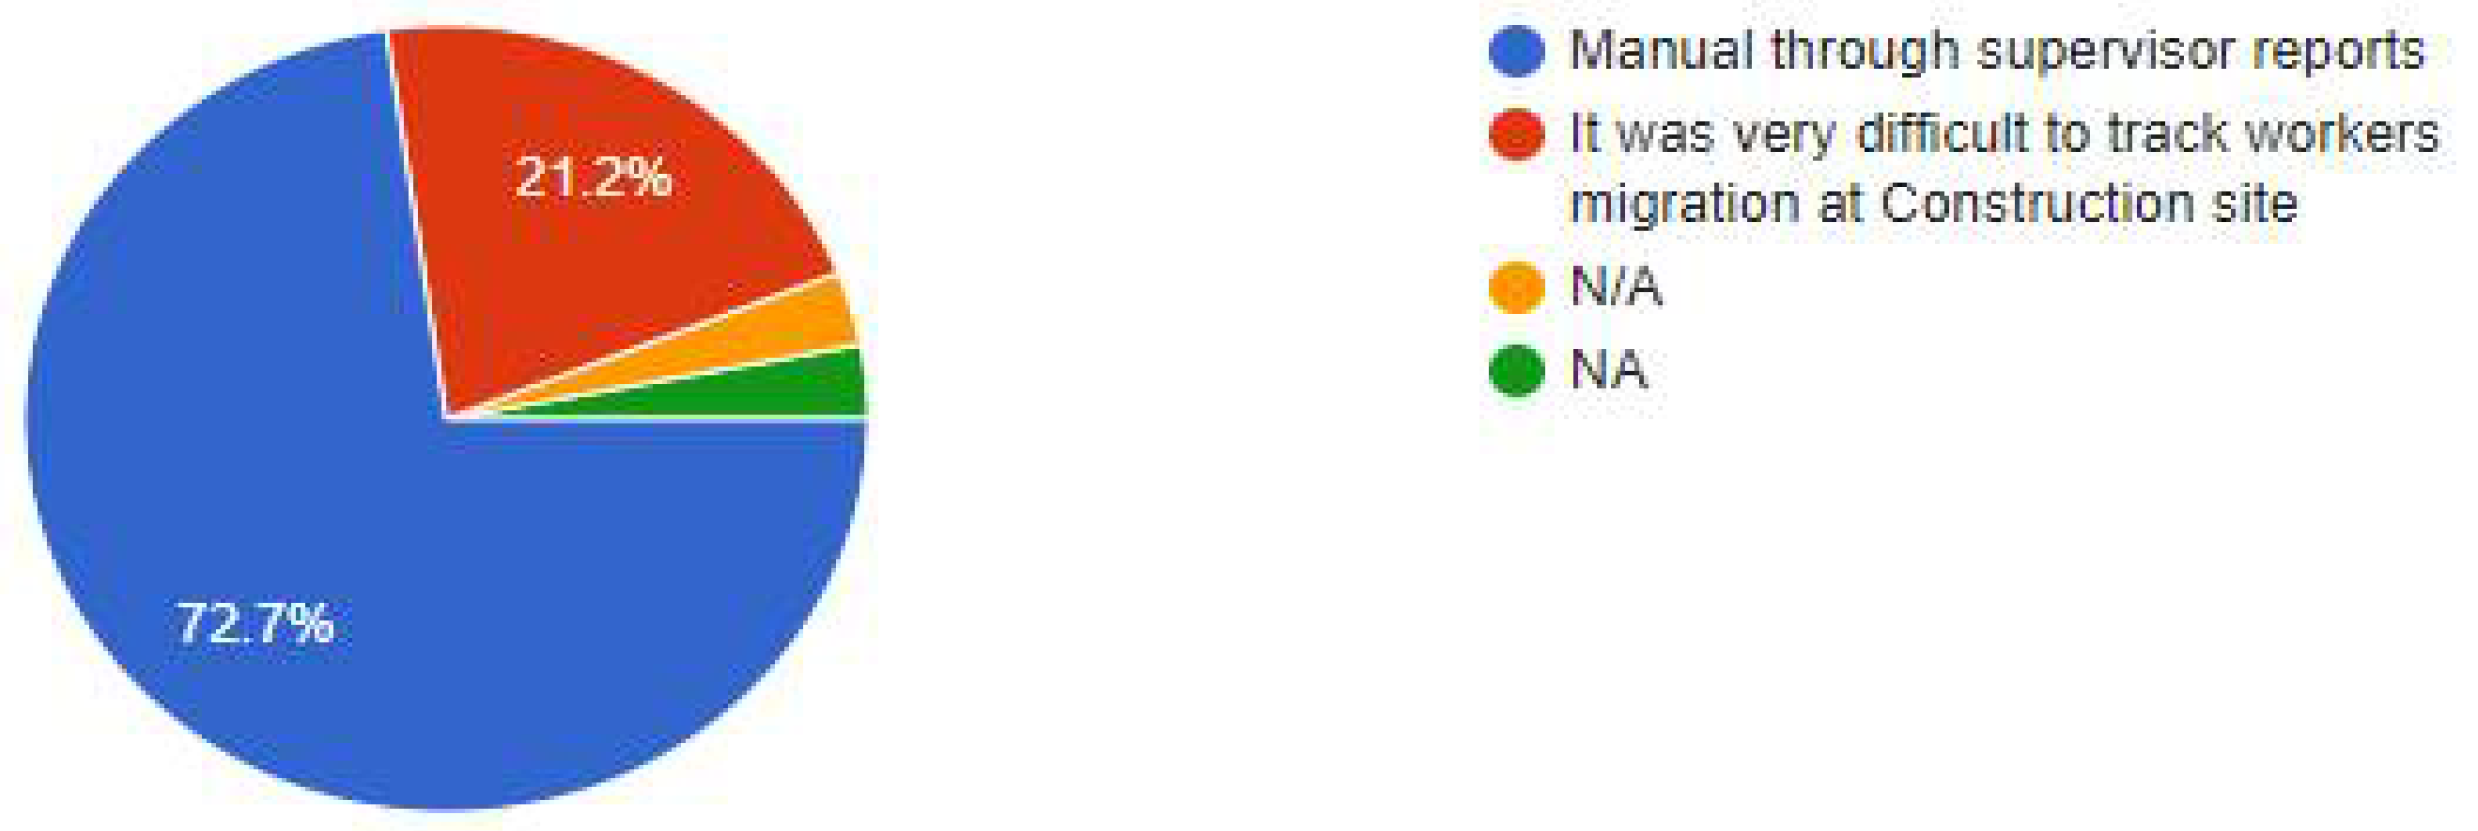
According to the survey results highlighted in
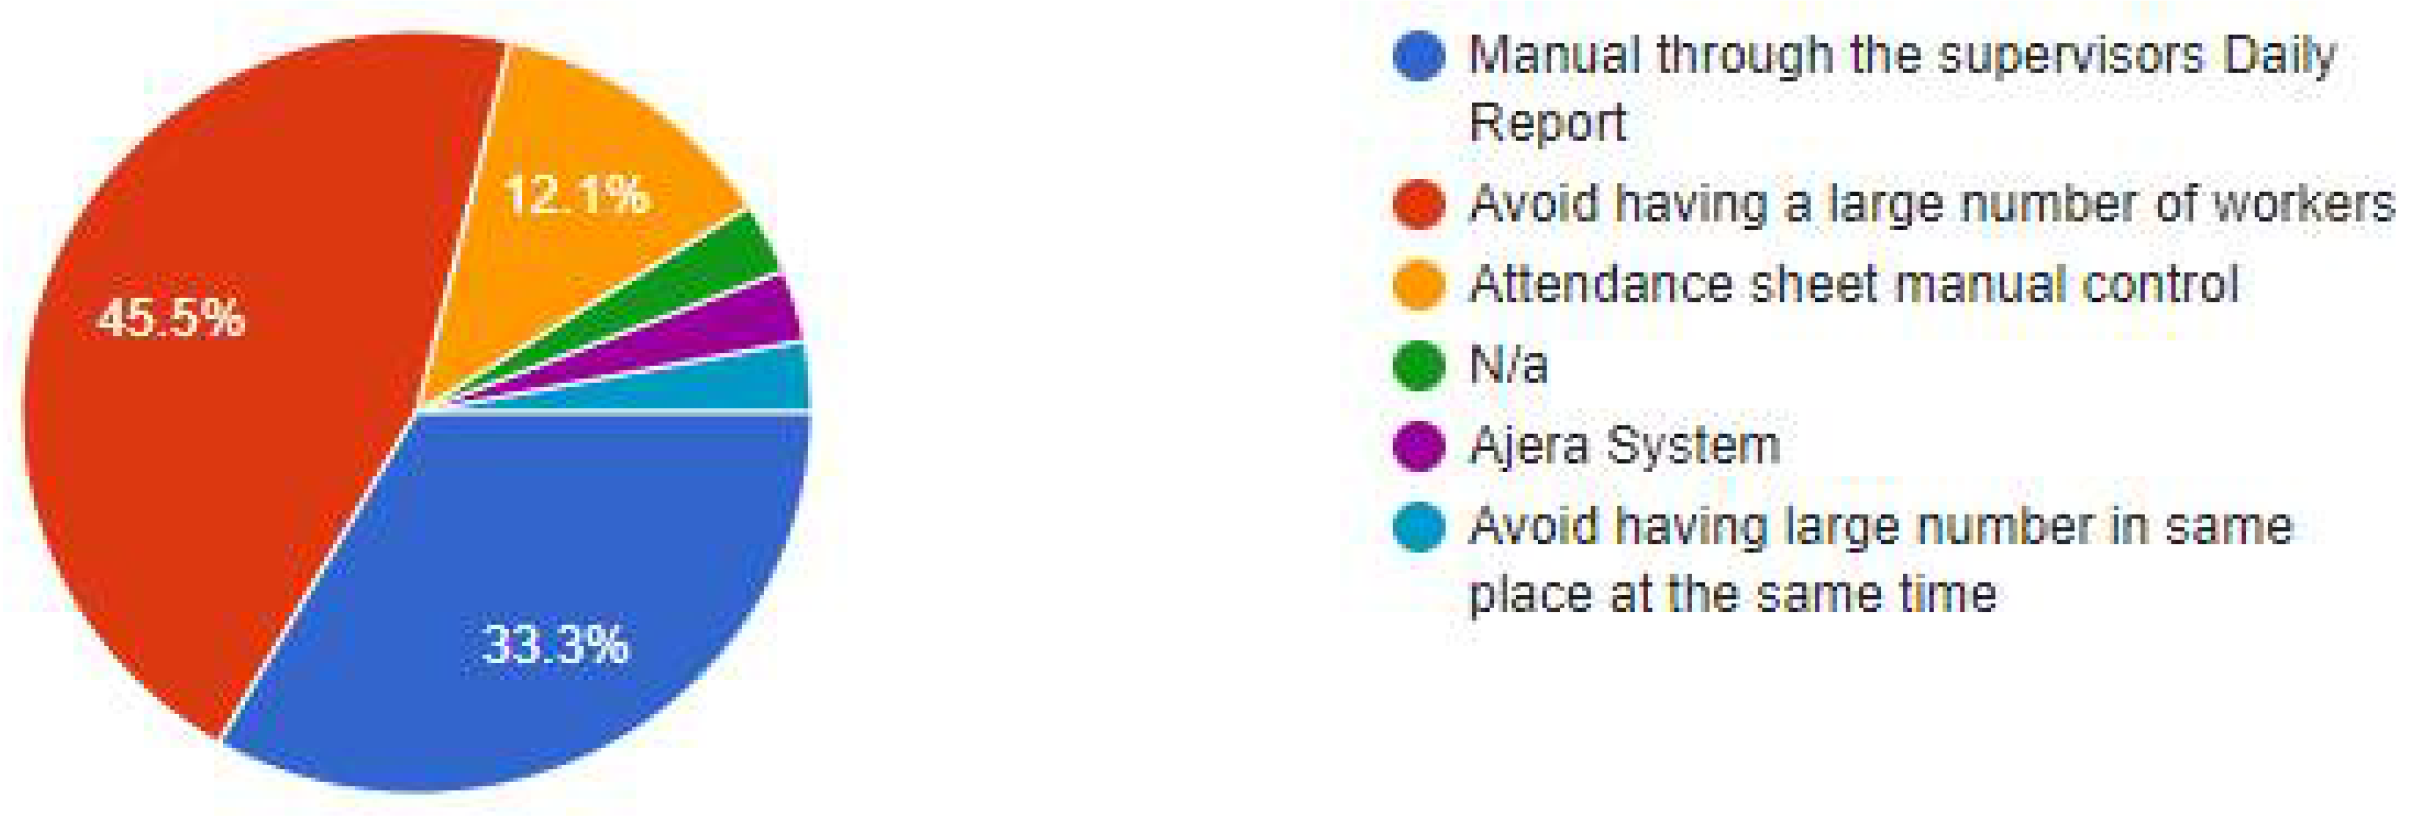
Figure 35, there is a discrepancy in tracking workers' migration from one zone to another. Based on the supervisor's presence on site, approximately 70% of the workers recognize the migration manual. Others argue that tracking workers' migration in construction projects is complicated.
The crisis of the COVID-19 pandemic, and the WOH rules to preserve the social distance between workers, have been discussed in the survey's outcomes. As depicted in
Figure 36, most participants advocated not attending workers and then tracking them to maintain a social distance between the two groups.
10.4. Part IV: Autodesk Visualizer Plugin & CEWS Tool Primary Evaluation
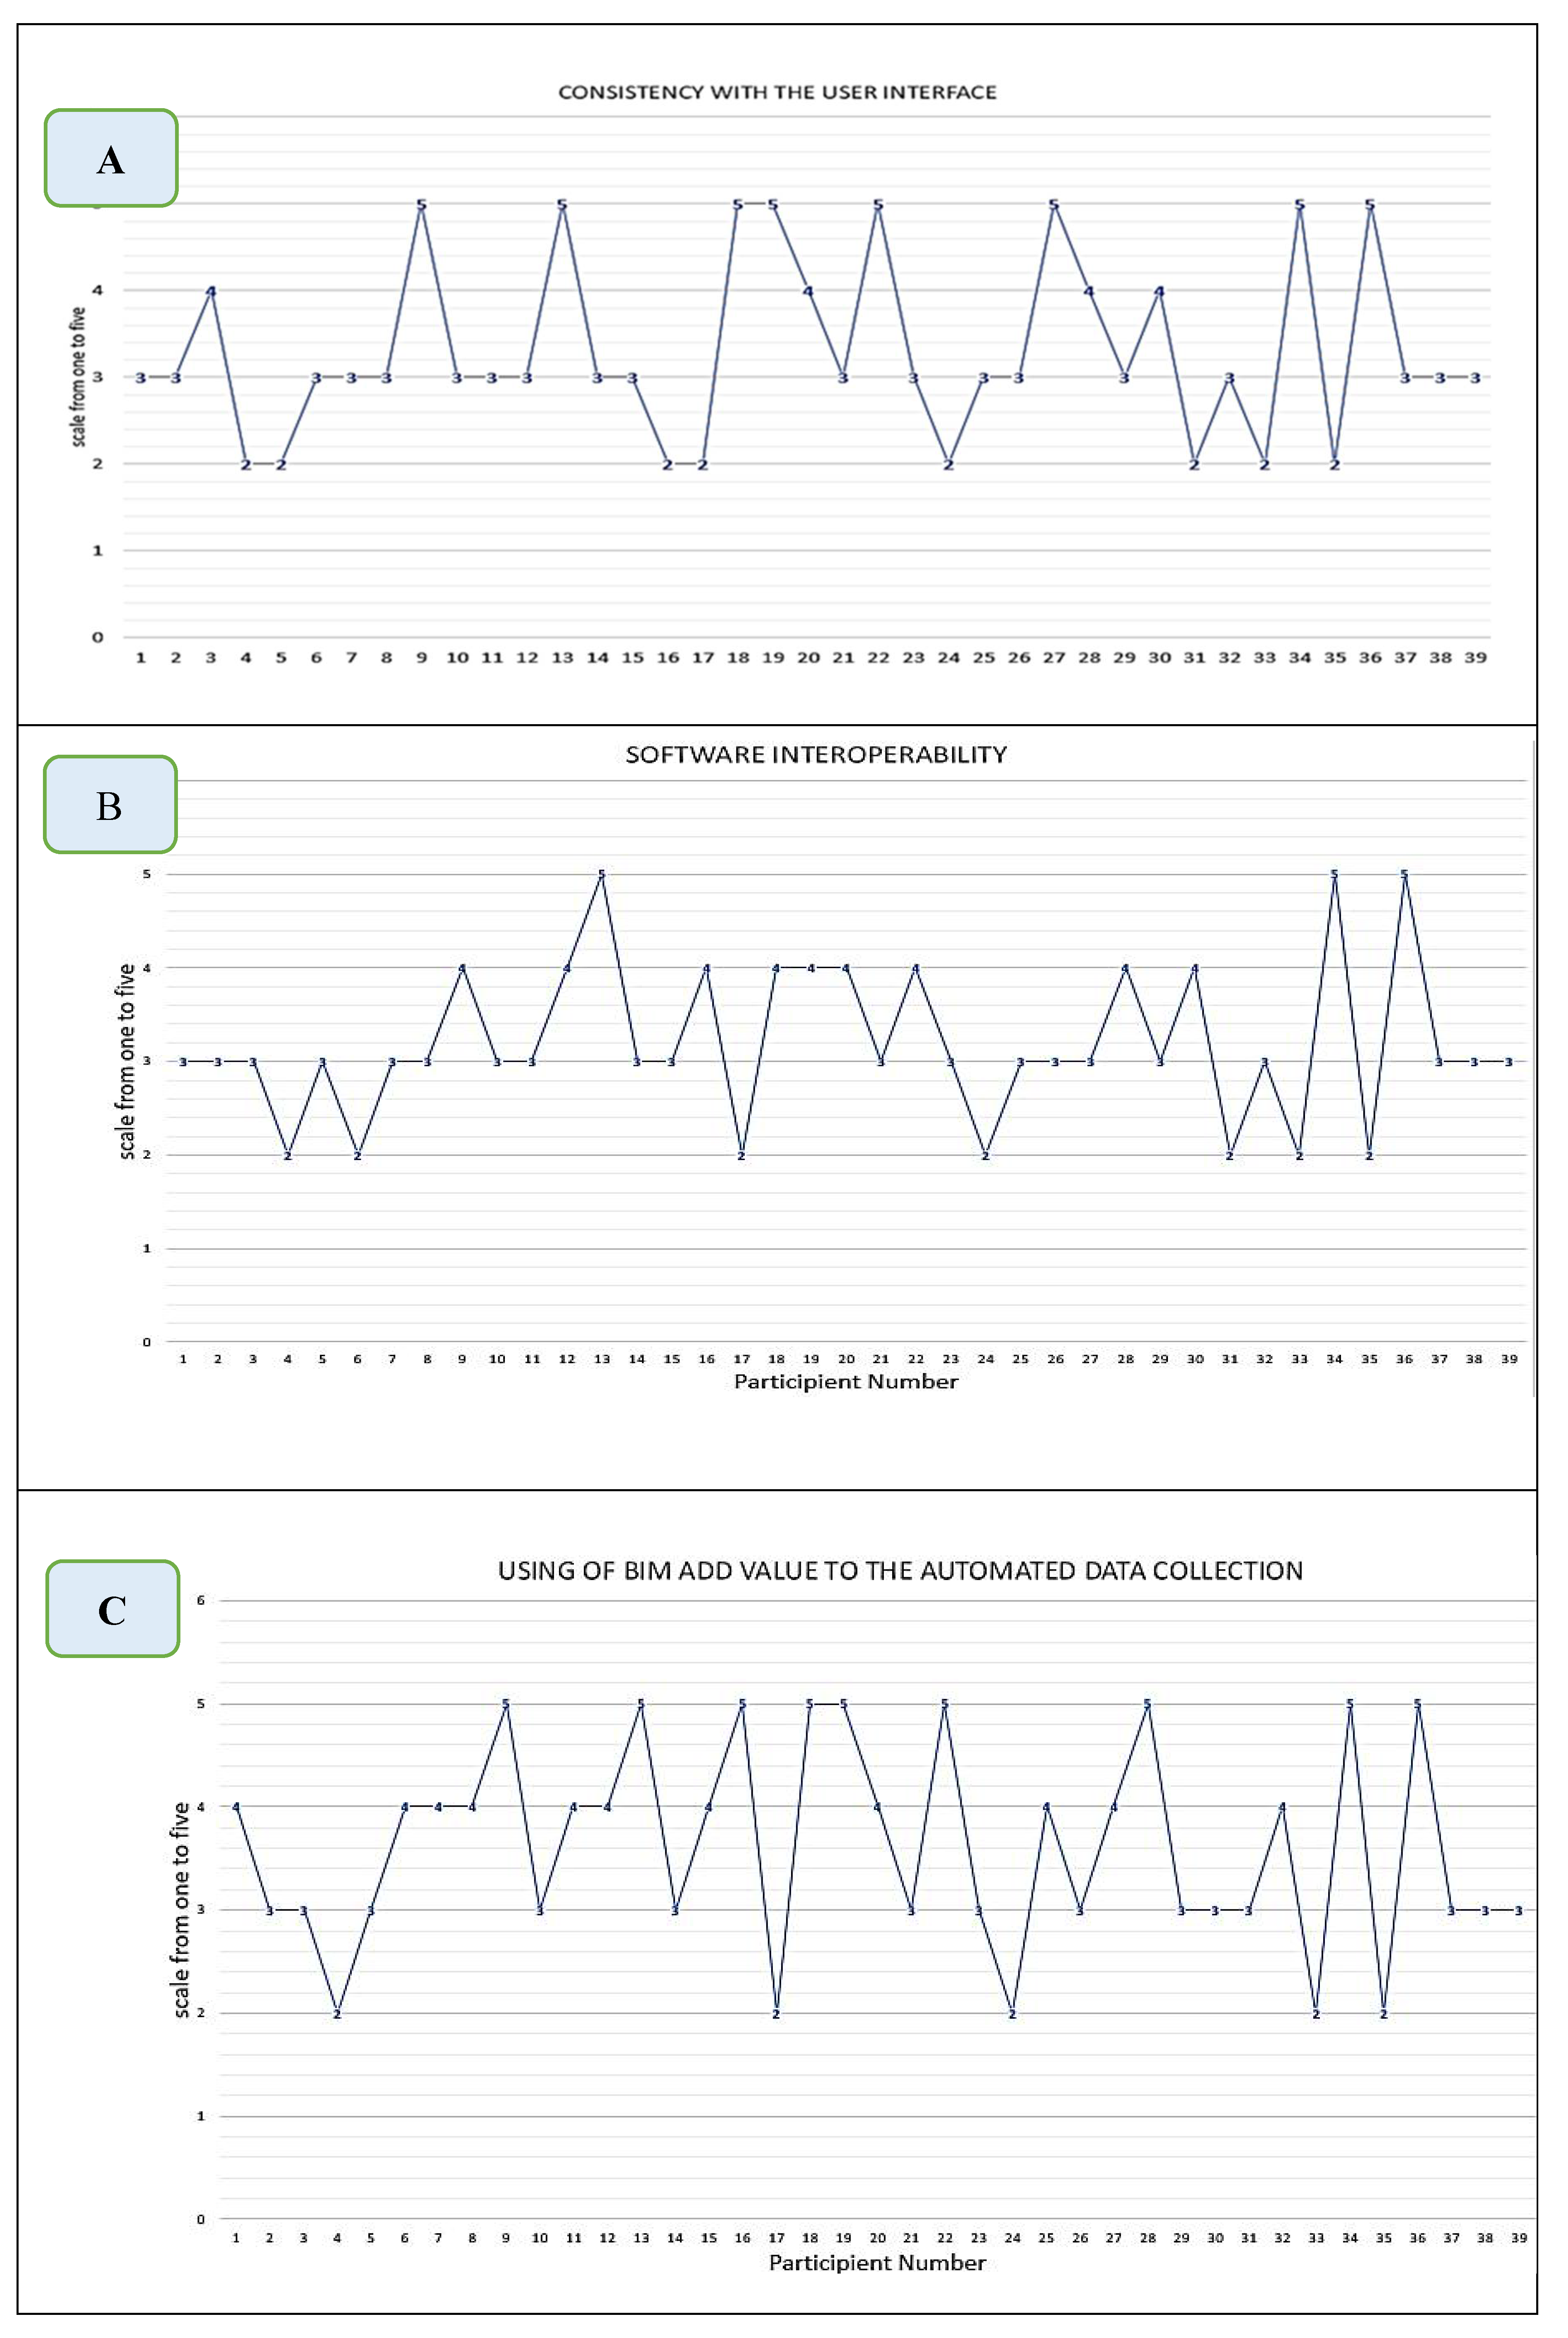
This section of the survey is the most crucial because it covers the participant's thoughts and recommendations on the proposed hybrid tracking solution after trying it. The Autodesk Visualizer Plugin, as well as the CEWS tool, have been assessed, and the level of satisfaction has been graded on a scale from one to five. “One” indicates that users are highly dissatisfied, whereas “five” indicates that they are highly satisfied. Most of the users show their consistency with the interface of the CEWS, as indicated in
Figure 37(A). According to the illustration, no one found it hard to deal with the user interface. Only 20% of surveyed participants expressed dissatisfaction with the user interface. In order to make the application easier to use for users, the participants' opinions will be taken into consideration.
The following notices can be summarized:
While the interoperability across software while using the hybrid tracking system has been demonstrated, some participants declared that it needs further enhancement to be compatible with the wide variety of other software being utilized. It was reported by 27 percent of the participants that it was difficult to utilize the tool for productivity tracking, while the majority (70 percent) claimed that they had no difficulty in estimating productivity using the tracking tool, as indicated in
Figure 37(B).
Eighty-seven percent of those who took part in the survey believe that BIM will be beneficial in the automation of data collection from the construction site, as indicated in
Figure 37(C).
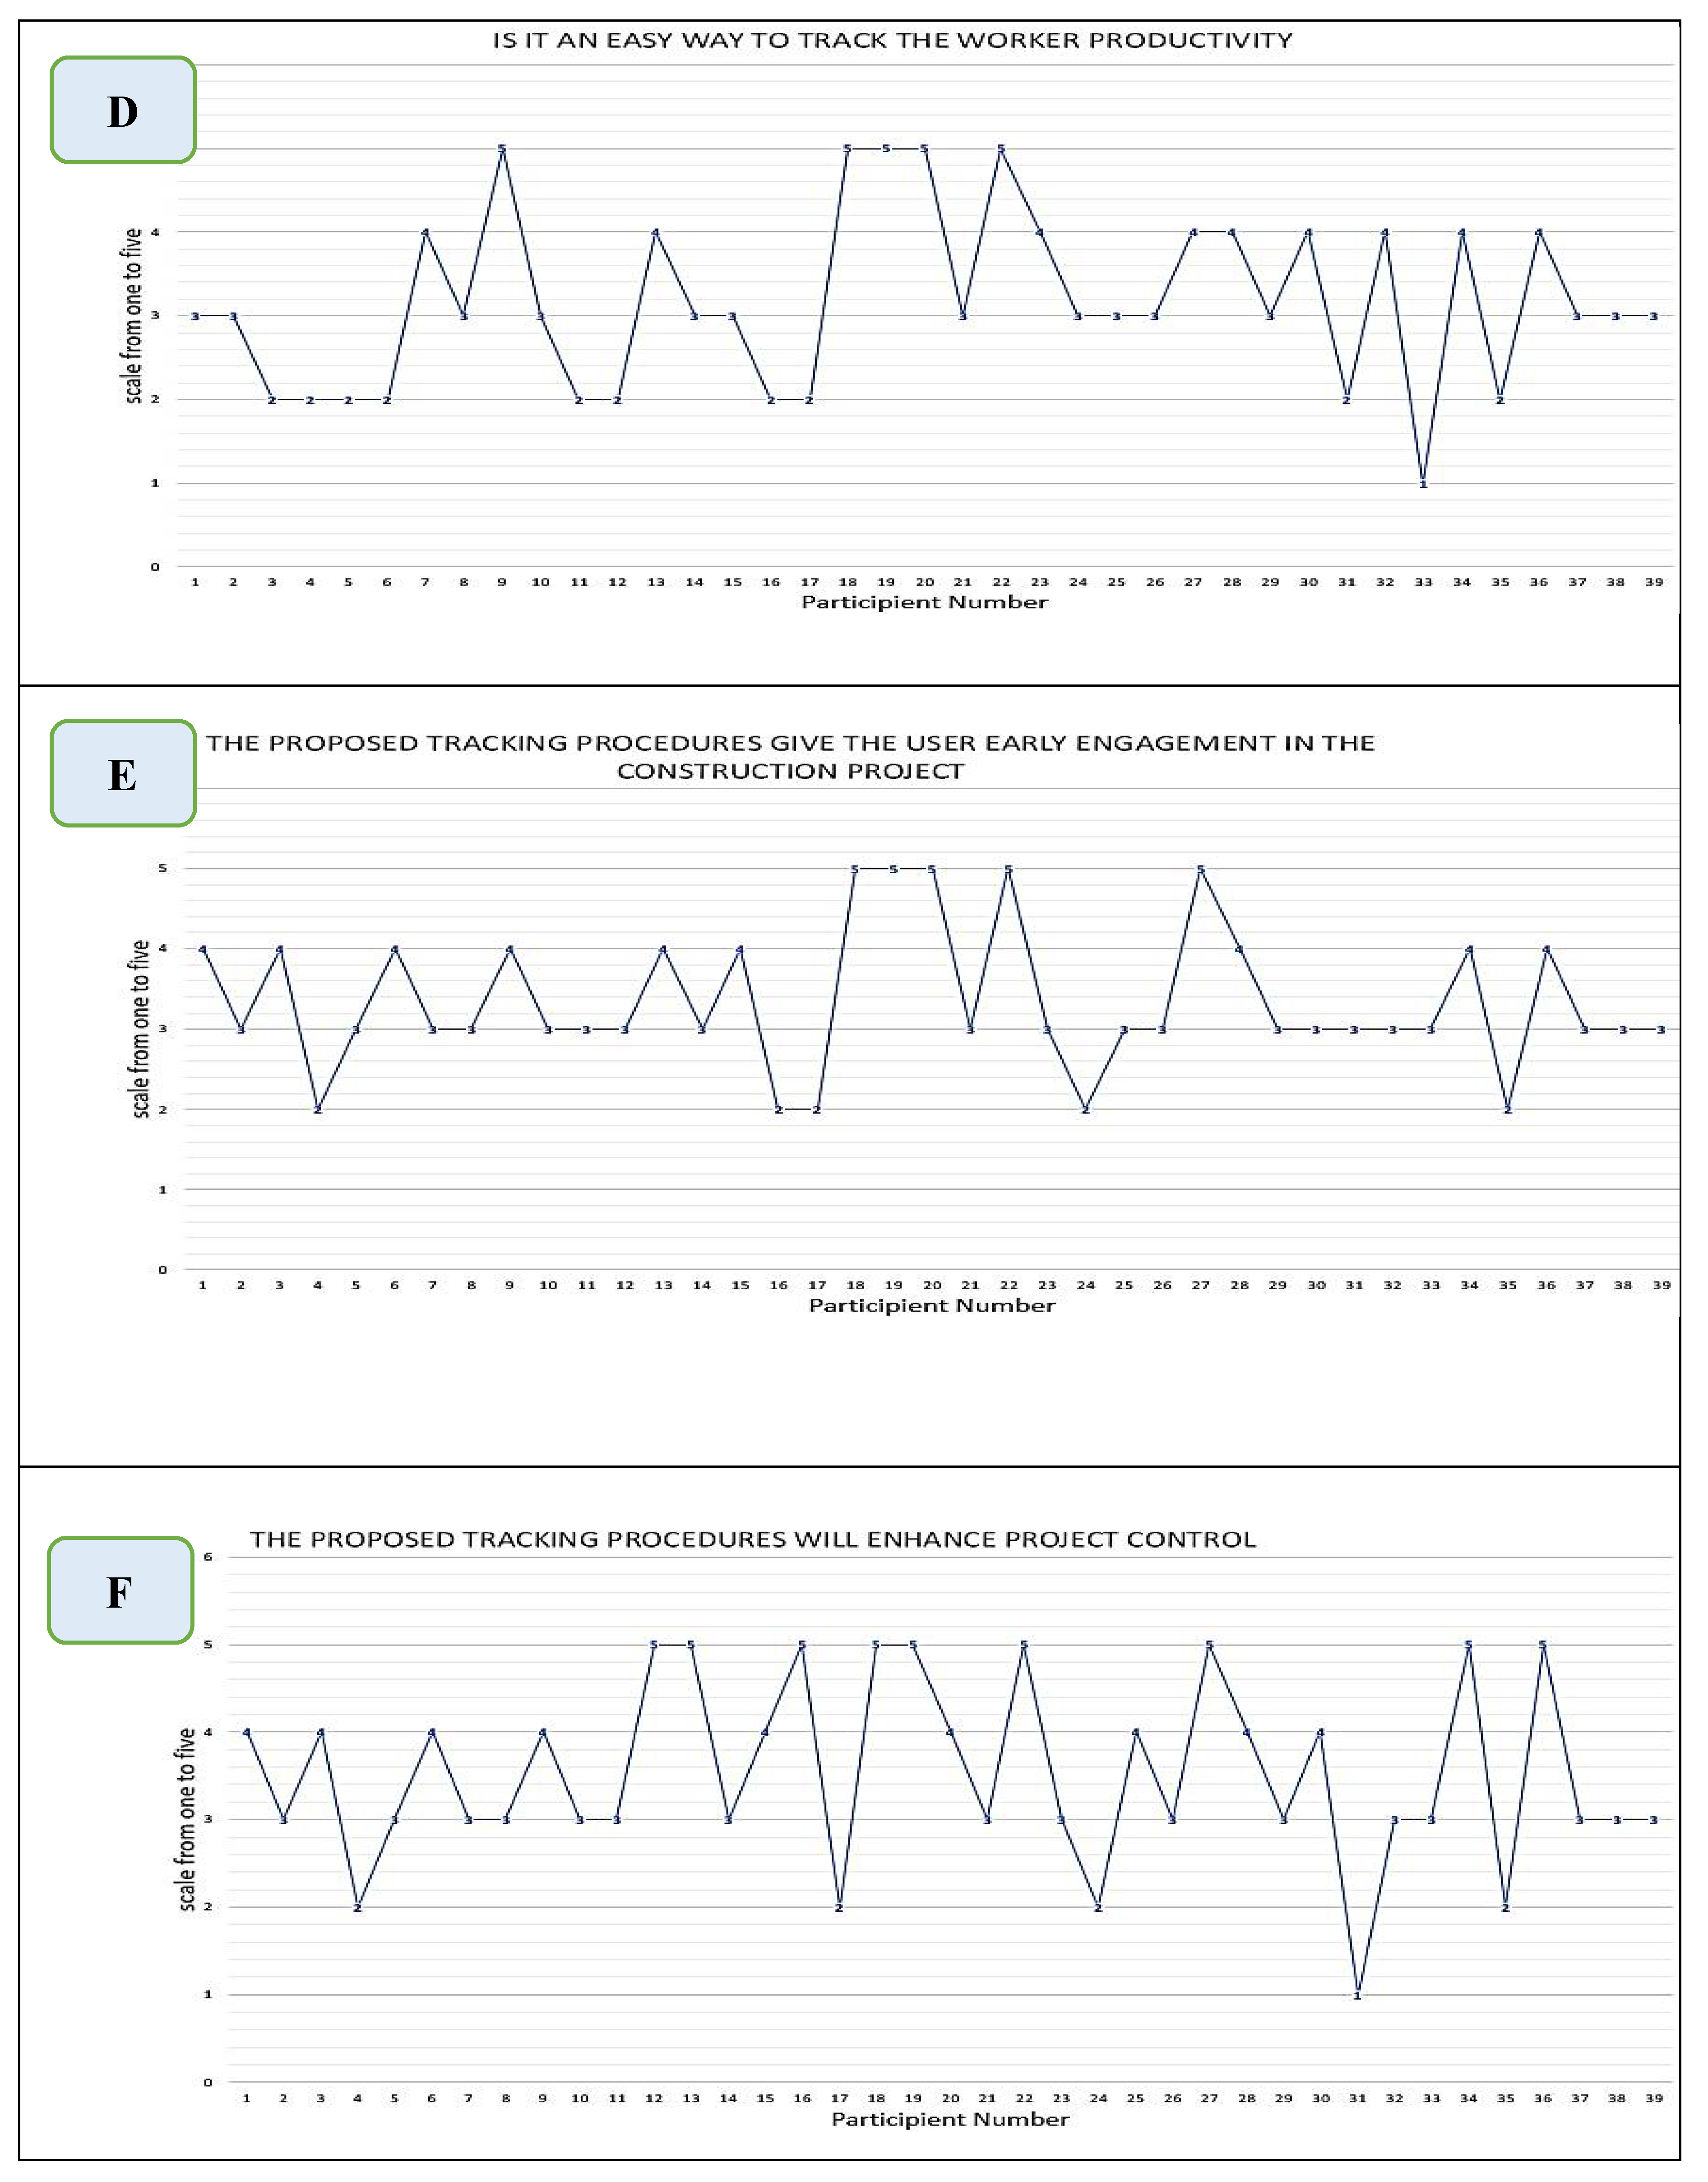
The majority (70 percent) were highly evaluating the estimate of productivity by the tracking tool,
Figure 37(D).
Ninety percent of the participants agreed that the proposed tracking processes allow users to become involved in the construction project early, which will add value to the project, as illustrated in
Figure 37(E). The same percentage stated that using BIM in the study enhances project control, Finally, most of the participants (90 percent) agreed that making an early estimate of the production rate and re-planning based on new productivity through a tracking tool will improve the project's overall progress as indicated in
Figure 37(F).
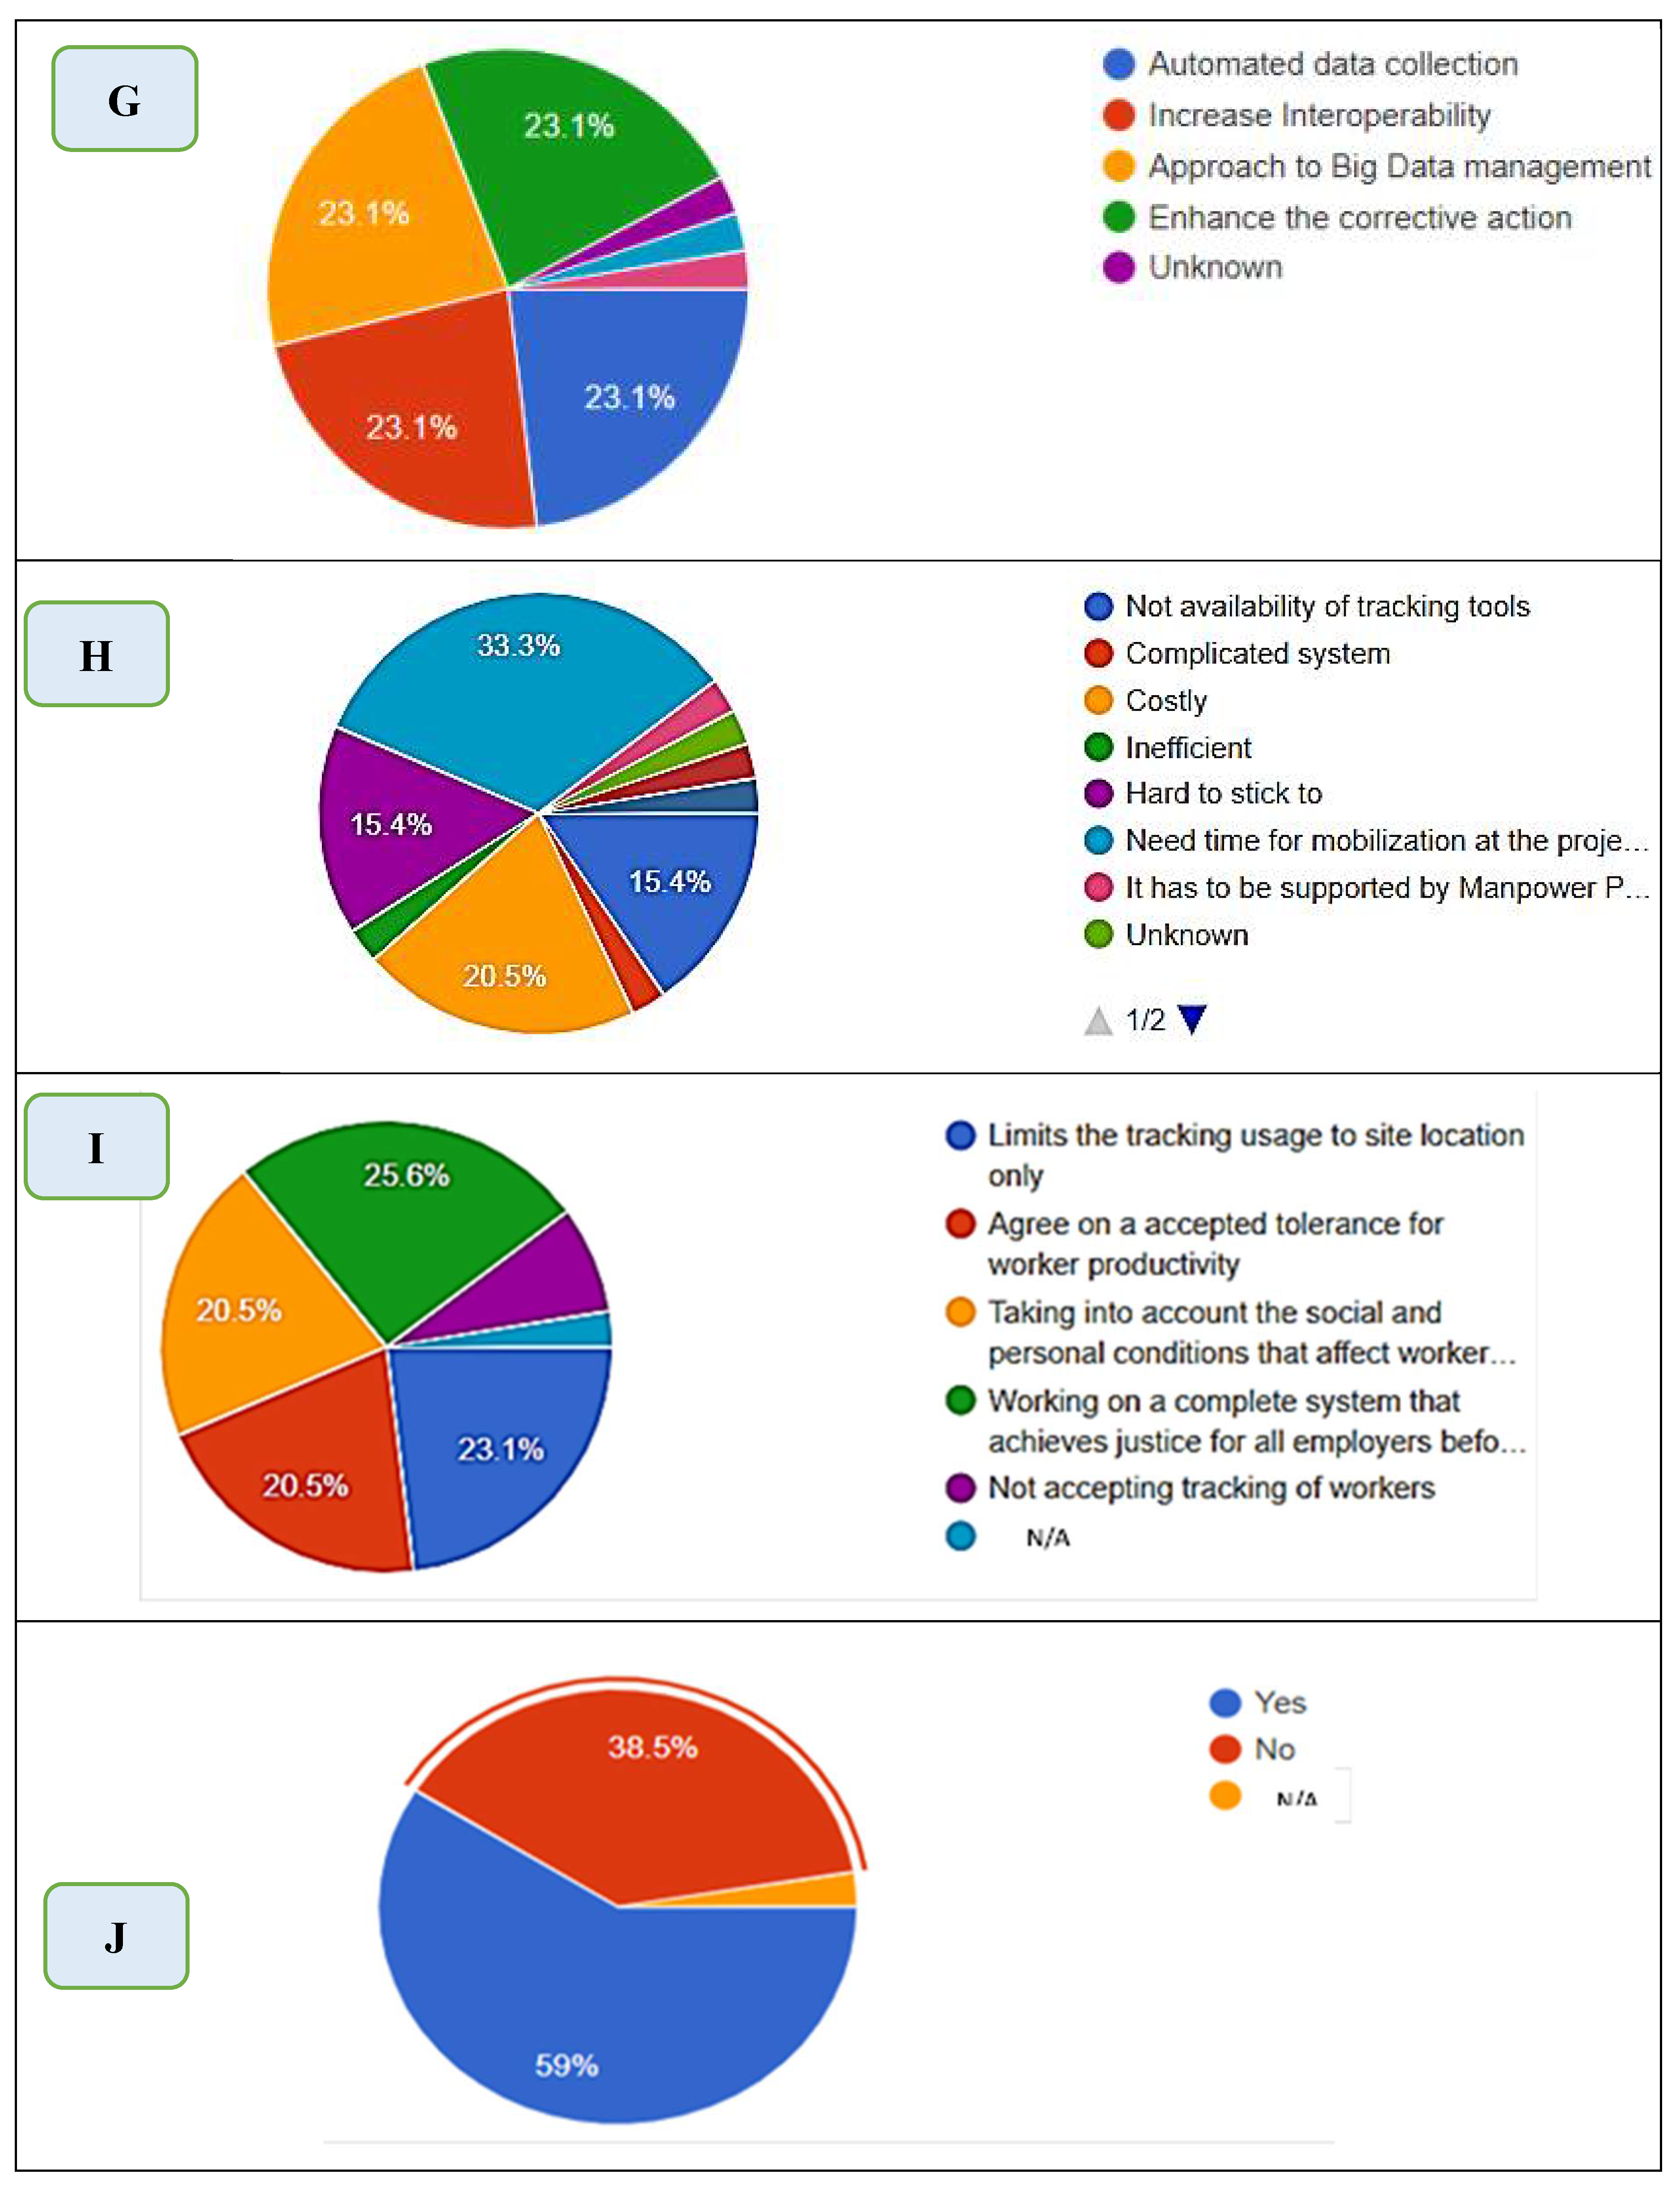
The participants agreed that there are numerous advantages of utilizing the Hybrid solution. The majority of respondents agreed that the benefits could be summarized as follows: automated data gathering, increased interoperability, and the development of an approach to extensive data management. As depicted in
Figure 37(G), only a small number of people believed that software and hardware add no value to the construction industry.
Regarding the disadvantages, 33% of the participants stated that the tools are still not available in the market, and 20% stated that the tool may be costly, as indicated in
Figure 37(H).
Working-place tracking has been the focus of some criticisms from the perspective of human rights advocates. Some participants expressed their desire to see tracking technology improved to respect employees' privacy rights. Some of them stated that it is better to limit the tracking usage to site locations only. Others agreed on an acceptable tolerance for worker productivity. On the other hand, some participants stated that personal conditions might affect operational productivity, which shall be considered. Also, there is some participants did not agree to track workers at all, as seen in
Figure 37(I). After all, nearly 60 percent of those who took part in the survey stated that the implementation of tracking technology in the construction business would take some time,
Figure 37(J).
11. Conclusion
This research significantly contributes to the field of construction engineering and management by introducing a comprehensive, empirically validated methodology for the real-time optimization of construction resources. The integration of ABM, BIM, and BLE technologies, complemented by CEWS and DSS, represents a groundbreaking advancement, shifting the paradigm of monitoring and optimizing construction human resources. The study's methodological rigor lies in its unique combination of real-time tracking, visualization, and predictive analytics, setting a new benchmark in the industry. Beyond enhancing project efficiency, this research offers practical recommendations for practitioners, suggesting how the integrated approach can be adopted in day-to-day construction management practices. While acknowledging limitations such as signal interference and privacy concerns, the research paves the way for future investigations. It aims at extending these methodologies to other resources, thereby fostering more efficient and effective resource allocation in construction projects worldwide, and signifies the potential for a more connected, data-driven, and efficient future in construction management.
Author Contributions
Conceptualization, Ahmed Mohammed Abdelalim and Adel ElSamadony; Data curation, Ahmed Mohammed Abdelalim, Salah Omar Said, AlJawharah A.AL Naser and Mohamed Tantawy; Formal analysis, Ahmed Mohammed Abdelalim and Salah Omar Said; Funding acquisition, Ahmed Mohammed Abdelalim and AlJawharah A.AL Naser; Investigation, Ahmed Mohammed Abdelalim, Salah Omar Said, AlJawharah A.AL Naser and Mohamed Tantawy; Methodology, Ahmed Mohammed Abdelalim and Salah Omar Said; Project administration, Ahmed Mohammed Abdelalim and Adel ElSamadony; Resources, Ahmed Mohammed Abdelalim and Salah Omar Said; Software, Ahmed Mohammed Abdelalim and Salah Omar Said; Supervision, Ahmed Mohammed Abdelalim; Validation, Ahmed Mohammed Abdelalim, Salah Omar Said, AlJawharah A.AL Naser and Ahmed Sharaf; Visualization, Ahmed Mohammed Abdelalim, Salah Omar Said, AlJawharah A.AL Naser, Ahmed Sharaf, Denise-Penelope Kontoni and Mohamed Tantawy; Writing – original draft, Ahmed Mohammed Abdelalim and Salah Omar Said; Writing – review & editing, Ahmed Mohammed Abdelalim, AlJawharah A.AL Naser, Denise-Penelope Kontoni and Mohamed Tantawy.
Funding
The authors extend their appreciation to the Researchers Supporting Project number (RSPD2024R590), King Saud University, Riyadh, Saudi Arabia.
Data Availability Statement
The data presented in this study are available on request from the corresponding author.
Conflicts of Interest
The authors declare no conflict of interest.
References
- A. Abdelalim, ‘Risks Affecting the Delivery of Construction Projects in Egypt: Identifying, Assessing and Response | SpringerLink’. Accessed: Apr. 24, 2024. [Online]. Available: https://link.springer.com/chapter/10.1007/978-3-030-01905-1_7.
- A. Abdelalim and S. Omar, ‘DYNAMIC LABOR TRACKING SYSTEM IN CONSTRUCTION PROJECT USING BIM TECHNOLOGY’, J. Civ. Struct. Eng., vol. 9, pp. 10–20, Apr. 2021.
- A. Abdelalim, ‘IRVQM; A Conceptual Framework for Integrating Risk, Value and Quality Management for Construction Project Management’, Jan. 2020.
- Y. Pan and L. Zhang, ‘Integrating BIM and AI for Smart Construction Management: Current Status and Future Directions’, Arch. Comput. Methods Eng., vol. 30, no. 2, pp. 1081–1110, Mar. 2023. [CrossRef]
- Y. Fang, J. Yin, and B. Wu, ‘Climate change and tourism: a scientometric analysis using CiteSpace’, J. Sustain. Tour., vol. 26, no. 1, pp. 108–126, Jan. 2018. [CrossRef]
- Abdelalim, A.M., and S. Omar, ‘Theoretical Understanding of Indoor/Outdoor Tracking Systems in the Construction Industry’, vol. 9, pp. 30–36, Apr. 2021.
- H. Si, J. Shi, G. Wu, J. Chen, and X. Zhao, ‘Mapping the bike sharing research published from 2010 to 2018: A scientometric review’, J. Clean. Prod., vol. 213, pp. 415–427, Mar. 2019. [CrossRef]
- J. Chen, Y. Su, H. Si, and J. Chen, ‘Managerial Areas of Construction and Demolition Waste: A Scientometric Review’, Int. J. Environ. Res. Public. Health, vol. 15, no. 11, p. 2350, Oct. 2018. [CrossRef]
- X. Zou and H. L. Vu, ‘Mapping the knowledge domain of road safety studies: A scientometric analysis’, Accid. Anal. Prev., vol. 132, p. 105243, Nov. 2019. [CrossRef]
- I.-M. García-Sánchez and A. García-Sánchez, ‘Corporate Social Responsibility during COVID-19 Pandemic’, J. Open Innov. Technol. Mark. Complex., vol. 6, no. 4, p. 126, Dec. 2020. [CrossRef]
- Lee G, Kim H. Development of an Integrated Framework for Construction Resource Management Using Building Information Modeling and Internet of Things. Automation in Construction, 2020; p. 113.
- Zhou M, Lu M, An Integrated System for Real-Time Construction Resource Management Based on BIM and Internet of Things. Automation in Construction 2018; p. 85.
- Abdelalim, A.M. and Abo. Elsaud, Y., 2019. Integrating BIM-based simulation technique for sustainable building design. In Project Management and BIM for Sustainable Modern Cities: Proceedings of the 2nd GeoMEast International Congress and Exhibition on Sustainable Civil Infrastructures, Egypt 2018–The Official International Congress of the Soil-Structure Interaction Group in Egypt (SSIGE) (pp. 209-238). Springer International Publishing. [CrossRef]
- Zhang X, Li H. Integrating BIM and IoT to Realize Construction Resource Management in the Context of Industry 4.0. J Clean Prod. 2017;p. 142.
- Abdelalim, A. M., “Risks Affecting the Delivery of Construction Projects in Egypt: Identifying, Assessing and Response,” in Project Management and BIM for Sustainable Modern Cities, M. Shehata and F. Rodrigues, Eds., in Sustainable Civil Infrastructures. , Cham: Springer International Publishing, 2019, pp. 125–154. [CrossRef]
- R. E. A. Younis, H. Abdelkhalek, and Abdelalim, A. M., “Project Risk Management during Construction Stage According to International Contract (FIDIC),” Feb. 2023. [CrossRef]
- Abdelalim, A. M., E. Elbeltagi, and A. A. Mekky, “Factors affecting productivity and improvement in building construction sites,” Int. J. Productivity and Quality Management., vol. 27, no. 4, p. 464, 2019. [CrossRef]
- Khedr, R. and Abdelalim, A.M., 2021, “Predictors for the Success and Survival of Construction Firms in Egypt”, International Journal of Management and Commerce Innovations ISSN 2348-7585 (Online), Vol. 9, Issue 2, pp.: (192-201).
- Khedr, R. and Abdelalim, A.M., 2021, “The Impact of Strategic Management on Projects Performance of Construction Firms in Egypt”, International Journal of Management and Commerce Innovations ISSN 2348-7585 (Online) Vol. 9, Issue 2, pp.: (202-211).
- Abdelalim, A. M. (2019). Risks Affecting the Delivery of Construction Projects in Egypt: Identifying, Assessing and Response. In Project Management and BIM for Sustainable Modern Cities: Proceedings of the 2nd GeoMEast International Congress and Exhibition on Sustainable Civil Infrastructures, Egypt 2018–The Official International Congress of the Soil-Structure Interaction Group in Egypt (SSIGE) (pp. 125-154). Springer International Publishing. [CrossRef]
- Abdelalim, A.M., El Nawawy, O.A. and Bassiony, M.S., 2016. ’Decision Supporting System for Risk Assessment in Construction Projects: AHP-Simulation Based. IPASJ International Journal of Computer Science (IIJCS), 4(5), pp.22-36. [CrossRef]
- Shawky, K. A., Abdelalim, A. M., & Sherif, A. G. (2024). Standardization of BIM Execution Plans (BEP’s) for Mega Construction Projects: A Comparative and Scientometric Study. [CrossRef]
- Hassanen, M. A. H., & Abdelalim, A. M. (2022). Risk Identification and Assessment of Mega Industrial Projects in Egypt. International Journal of Management and Commerce Innovation (IJMCI), 10(1), 187-199. [CrossRef]
- Hassanen, M. A. H., & Abdelalim, A. M., A Proposed Approach for a Balanced Construction Contract for Mega Industrial Projects in Egypt, 2022, International Journal of Management and Commerce Innovations ISSN 2348-7585, Vol.10, Issue.1, pp: 217-229. [CrossRef]
- Amin Sherif, Abdelalim, A.M., 2023, “Delay Analysis Techniques and Claim Assessment in Construction Projects”, International Journal of Engineering, Management and Humanities (IJEMH), Vol.10, Issue.2, 316-325. [CrossRef]
- Medhat, W., Abdelkhalek, H., & Abdelalim, A. M. (2023). A Comparative Study of the International Construction Contract (FIDIC Red Book 1999) and the Domestic Contract in Egypt (the Administrative Law 182 for the year 2018). [CrossRef]
- Liao, S., Wu, J., Bashir, A. K., Yang, W., Li, J., & Tariq, U. (2021). Digital twin consensus for blockchain-enabled intelligent transportation systems in smart cities. IEEE Transactions on Intelligent Transportation Systems, 23(11), 22619-22629. [CrossRef]
- Yin, X., Liu, H., Chen, Y., & Al-Hussein, M. (2019). Building information modelling for off-site construction: Review and future directions. Automation in construction, 101, 72-91.
- E. Yousri, A. E. B. Sayed, M. A. M. Farag, and A. M. Abdelalim, “Risk Identification of Building Construction Projects in Egypt,” Buildings, vol. 13, no. 4, p. 1084, Apr. 2023. [CrossRef]
- Abdelalim, A. M., E. Elbeltagi, and A. A. Mekky, “Factors affecting productivity and improvement in building construction sites,” Int. J. Productivity and Quality Management., vol. 27, no. 4, p. 464, 2019. [CrossRef]
- Abd El-Hamid, S.M, Farag, S., Abdelalim, A.M., 2023, “Construction Contracts’ Pricing according to Contractual Provisions and Risk Allocation”, International Journal of Civil and Structural Engineering Research ISSN 2348-7607, Vol.11, Issue.1, pp.11-38. [CrossRef]
Figure 1.
Co-occurrence of the top keywords.
Figure 1.
Co-occurrence of the top keywords.
Figure 2.
Evolution of keywords co-occurrence.
Figure 2.
Evolution of keywords co-occurrence.
Figure 3.
(A): Research Methodology. (B): Modules of Research Framework.
Figure 3.
(A): Research Methodology. (B): Modules of Research Framework.
Figure 4.
BLE tags, zones reader, and the worker’s scanner.
Figure 4.
BLE tags, zones reader, and the worker’s scanner.
Figure 5.
Revit Visualizer plugin Version 03.
Figure 5.
Revit Visualizer plugin Version 03.
Figure 6.
Module one: Tag–zone reader’s configuration, embedded system, and worker scanner.
Figure 6.
Module one: Tag–zone reader’s configuration, embedded system, and worker scanner.
Figure 7.
Module Two: The Database Generator.
Figure 7.
Module Two: The Database Generator.
Figure 8.
Construction Documentation Using HOLOBUILDER Platform. The left image is captured using 360° cameras. The right side indicates the same scene in the BIM model.
Figure 8.
Construction Documentation Using HOLOBUILDER Platform. The left image is captured using 360° cameras. The right side indicates the same scene in the BIM model.
Figure 9.
Module Three: Construction Documentation and Client Early Warning System.
Figure 9.
Module Three: Construction Documentation and Client Early Warning System.
Figure 10.
Field test plan with the location of the BLE zone.
Figure 10.
Field test plan with the location of the BLE zone.
Figure 11.
BIM model for the case study using Revit file.
Figure 11.
BIM model for the case study using Revit file.
Figure 12.
Type of Parameters for Windows Activity.
Figure 12.
Type of Parameters for Windows Activity.
Figure 13.
Section of the comprehensive Decision Support System Excel spreadsheet.
Figure 13.
Section of the comprehensive Decision Support System Excel spreadsheet.
Figure 14.
Client Early Warning System Output sheet (only for one week).
Figure 14.
Client Early Warning System Output sheet (only for one week).
Figure 15.
Client Early Warning System Main Dashboard.
Figure 15.
Client Early Warning System Main Dashboard.
Figure 16.
Indoor tracking of workers using the BIM technique.
Figure 16.
Indoor tracking of workers using the BIM technique.
Figure 17.
Visualization of the activities progress of work.
Figure 17.
Visualization of the activities progress of work.
Figure 18.
Indoor Live tracking for workers using Revit Visualization Tool.
Figure 18.
Indoor Live tracking for workers using Revit Visualization Tool.
Figure 19.
Client Early Warning System Main Dashboard indicates the change in project weeks.
Figure 19.
Client Early Warning System Main Dashboard indicates the change in project weeks.
Figure 20.
Duration (Day) vs. Cumulative Productivity (Unit/Day/ Worker) for all Activities in the first week.
Figure 20.
Duration (Day) vs. Cumulative Productivity (Unit/Day/ Worker) for all Activities in the first week.
Figure 21.
Status of zone two for ceiling and Windows activity for the second week.
Figure 21.
Status of zone two for ceiling and Windows activity for the second week.
Figure 22.
The participant’s position and role in the survey.
Figure 22.
The participant’s position and role in the survey.
Figure 23.
The participant's years of experience.
Figure 23.
The participant's years of experience.
Figure 24.
The participant’s geographical locations for the executed survey.
Figure 24.
The participant’s geographical locations for the executed survey.
Figure 25.
The participant’s projects sector.
Figure 25.
The participant’s projects sector.
Figure 26.
Participant’s Organization Type.
Figure 26.
Participant’s Organization Type.
Figure 27.
Using BIM in the project.
Figure 27.
Using BIM in the project.
Figure 28.
The used BIM standard for each participant.
Figure 28.
The used BIM standard for each participant.
Figure 29.
Participant opinions regarding using BIM to collect and present the worker behavior and percentage of completion.
Figure 29.
Participant opinions regarding using BIM to collect and present the worker behavior and percentage of completion.
Figure 30.
Typical values (Million US $) of the project.
Figure 30.
Typical values (Million US $) of the project.
Figure 31.
Typical duration of the current project(s).
Figure 31.
Typical duration of the current project(s).
Figure 32.
Maximum daily number of workers at the rush hour required to carry out the work.
Figure 32.
Maximum daily number of workers at the rush hour required to carry out the work.
Figure 33.
Worker productivity can participate in project delay.
Figure 33.
Worker productivity can participate in project delay.
Figure 34.
The current worker's tracking tool.
Figure 34.
The current worker's tracking tool.
Figure 35.
Track worker's migration method in a construction project.
Figure 35.
Track worker's migration method in a construction project.
Figure 36.
The tracking tool to maintain the social distance between workers.
Figure 36.
The tracking tool to maintain the social distance between workers.
Figure 37.
Participants' Evaluation of the tracking hybrid proposed approach.
Figure 37.
Participants' Evaluation of the tracking hybrid proposed approach.
Table 1.
Data Mapping and interoperability between different software.
Table 1.
Data Mapping and interoperability between different software.
| Decision support system parameters |
Unit |
Data Source |
Integrated with DSS through |
| Activity zone names |
Text |
Autodesk Revit |
API and Excel |
| Activity Code |
Text |
Autodesk Revit |
API and Excel |
| Activity Description |
Text |
Autodesk Revit |
API and Excel |
| Avg. planned number of workers/ days |
Worker/ day |
DSS Equation |
Equation |
| Planned productivity per worker per activity |
M² /day
or Number /day |
Primavera |
Excel |
| Planned productivity per worker per crew |
M² /day or Number /days |
DSS Equation |
Equation |
| Planned duration |
days |
Primavera |
Excel |
| Actual zone area |
M² |
Autodesk Revit |
API and Excel |
| Maximum number of workers (Social distance) |
Number |
MOH |
Input data |
| Planned quantities |
M² or Number |
Autodesk Revit |
API and Excel |
| Planned Schedule |
days |
Primavera |
Excel sheet integration |
| Actual working hours |
Hour |
BLE Devices |
BLE and Excel |
| Actual Quantities |
M² or Number |
HOLOBUILDER |
HOLOBUILDER and Excel |
| Actual productivity |
M² /day or Number /days |
DSS Equation |
Equation |
Table 2.
Comparison of Tracking Technology Procedures, Faults, and Proposed Solutions.
Table 2.
Comparison of Tracking Technology Procedures, Faults, and Proposed Solutions.
| No |
Tracking Method |
Indoor Tracking Procedures |
Faults and Solutions |
| 1 |
Global Positioning Systems (GPS) |
Not applicable |
GPS can be used efficiently for outdoor localization; no robust solution is ready for widespread implementation in the indoor environment. |
| 2 |
Inertial Navigation Systems (INS) |
Not applicable |
INS-based technology suffers from its significant and distance-related drifting fault |
| 3 |
Ultra-Wide Band (UWB), |
Not applicable |
Transmits data over a large bandwidth, making it less prone to signal interference and easier to pass through walls.
Expensive. |
| 4 |
Laser scan or fixed camera |
Workers can be monitored through image analysis and machine learning technology. |
The motion is the significant factor background subtraction is not applicable to detect the fixed or still object or hidden.
Solution: it is better to use another technology to detect the fixed and movable object, such as RFID or WIFI
|
| 5 |
WLAN |
Not applicable |
hard to implement on sites under construction where no WLAN infrastructure is available |
| 6 |
Radio-Frequency Identification (RFID) |
Each zone shall install an RFID Gate.
The worker shall scan his Owen RFID card and then enter the zone |
It detects workers just entering the room for the first time through the zone entrance gate, but not accurately scanning for existence inside the zone.
The worker can move from one zone to another without any tracking. Also, it is a manual identification at the zone entrance RFID gates, and Sometimes RFID interfaces with materials.
Solution: it is better to use another technology that has a field radius of detection, such as WIFI
|
| 7 |
Wireless Fidelity (WIFI) |
Each worker shall hold a MAC to be used as a card.
Each zone shall install a WIFI Router Module to receive signals from workers. |
The procedures satisfied the field radius requirement, but; the Ranges are incontrollable and have a very high field radius out of the zone area.
WIFI produces a high-power consumption for a portable device.
Solution: It was suggested to use modules with limited ranges of a few meters and more economical like Bluetooth. |
| 8 |
Bluetooth (BT) |
Each worker should have a Bluetooth device
Each zone shall install Bluetooth Modules in the room center. |
All workers should connect to get their address, yielding undesirable consequences in controlling random workers’ entrance Compatibility timing.
Still not so power efficient for a portable device,
Solution: Suggested finding another technology that facilitates detection, such as Bluetooth low energy or developing a mobile application. |
| 9 |
Business Smart
phone |
It was assumed that each worker should hold a business mobile and set up a specific mobile application to sign in. |
Each worker shall have a business mobile which is not applicable.
The battery consumption became faster than before.
Smartphones are sometimes heated because an application runs on during working hours.
Solution: it is better to find another technology that facilitates the workers’ scanning and detection without connection and power efficiency, such as Bluetooth Low Energy. |
| 10 |
Bluetooth Low Energy (BLE) |
Tags to be configured as needed.
Tags to be distributed to the workers.
BLE receiver to be installed at each zone center |
Using the BLE technology gives the user many advantages such as:
Limited range while allowing zoning procedures for the large area.
Beacon mode allows broadcasting ID without connecting like traditional BL ways.
It is broadcasting on Interval bases and sleeping the rest yields high power efficiency.
Has a field of radius and works without worker interaction.
Large native ecosystem.
Provides more data and less energy consumption.
Communicates without wires or WIFI,
Bluetooth works in rugged, harsh environments.
Accordingly, BLE is selected to be the engine of indoor tracking in this study
|
Table 3.
Embedded system daily attendance sheet from 8.00 am to 10:15 pm.
Table 3.
Embedded system daily attendance sheet from 8.00 am to 10:15 pm.
| Date |
Time |
Zone Name |
Ceiling worker ID # 01 |
Ceiling worker ID # 02 |
Window worker ID # 01 |
Window worker ID # 02 |
| 30/08/2020 |
8:00 |
Zone 1 |
Found |
Not found |
Not found |
Found |
| 30/08/2020 |
8:15 |
Zone 2 |
Found |
Not found |
Not found |
Found |
| 30/08/2020 |
8:30 |
Zone 3 |
Found |
Not found |
Not found |
Found |
| 30/08/2020 |
8:45 |
Zone 1 |
Found |
Not found |
Not found |
Found |
| 30/08/2020 |
9:00 |
Zone 2 |
Found |
Not found |
Not found |
Found |
| 30/08/2020 |
9:15 |
Zone 3 |
Found |
Not found |
Not found |
Found |
| 30/08/2020 |
9:30 |
Room 1 |
Found |
Not found |
Not found |
Found |
| 30/08/2020 |
9:45 |
Room 2 |
Found |
Not found |
Not found |
Found |
| 30/08/2020 |
10:00 |
Room 1 |
Found |
Not found |
Not found |
Found |
| 30/08/2020 |
10:15 |
Room 2 |
Found |
Not found |
Not found |
Found |
|
Disclaimer/Publisher’s Note: The statements, opinions and data contained in all publications are solely those of the individual author(s) and contributor(s) and not of MDPI and/or the editor(s). MDPI and/or the editor(s) disclaim responsibility for any injury to people or property resulting from any ideas, methods, instructions or products referred to in the content. |
© 2024 by the authors. Licensee MDPI, Basel, Switzerland. This article is an open access article distributed under the terms and conditions of the Creative Commons Attribution (CC BY) license (http://creativecommons.org/licenses/by/4.0/).
