Submitted:
09 May 2024
Posted:
13 May 2024
You are already at the latest version
Abstract
Keywords:
1. Introduction
2. Materials and Methods
2.1. Synthesis of Red CQDs (rCQDs)
2.2. Preparation of SPEEK/rCQDs composite
2.3. Ion Exchange Capacity (IEC)
2.4. Water Uptake (WU)
2.5. Raman Spectroscopy
2.6. Fourier-Transform Infrared Spectroscopy (FTIR)
2.7. X-Ray Photoemission Spectroscopy (XPS)
2.8. Atomic Force Microscopy (AFM)
2.9. UV/VIS/NIR Absorption Spectroscopy
2.10. Photoluminescence Spectroscopy
2.11. Inductively Coupled Plasma – Optical Emission Spectroscopy (ICP-OES)
2.12. Batch Sorption Studies
2.13. Stability Test of Composite Membranes
3. Results and Discussion
5. Conclusions
Author Contributions
Funding
Data Availability Statement
Conflicts of Interest
References
- Hickner, M.A. Ion-containing polymers: New energy & clean water. Mater Today 2010, 13, 34–41. [Google Scholar]
- Narducci, R.; Di Vona, M.L.; Knauth, P. Cation-conducting ionomers made by ion exchange of sulfonated poly-ether-ether-ketone: Hydration, mechanical and thermal properties and ionic conductivity. J Membr Sci 2014, 465, 185–192. [Google Scholar] [CrossRef]
- Di Vona, M.L.; Licoccia, S.; Knauth, P. Organic-inorganic hybrid membranes based on sulfonated polyaryl-ether-ketones: Correlation between water uptake and electrical conductivity. Solid State Ion 2008, 179, 1161–1165. [Google Scholar] [CrossRef]
- Sgreccia, E.; Rogalska, C.; Gallardo Gonzalez, F.S.; Prosposito, P.; Burratti, L.; Knauth, P.; Di Vona, M.L. Heavy metal decontamination by ion exchange polymers for water purification: Counterintuitive cation removal by an anion exchange polymer. J Mater Sci 2024, 59, 2776–2787. [Google Scholar] [CrossRef]
- WHO: Guidelines for drinking-water quality: Fourth edition incorporating the first and second addenda. 2022; ISBN: 978-92-4-004506-4.
- Nordberg, G.F.N., M.; Fowler, B.A.; Friberg, L. Handbook on the Toxicology of Metals. Elsevier Science: Burlington, 2011. [Google Scholar]
- Medeiros, G.A.; da Silva Rodrigues, C.V.; Spencer, J.; Neto, B.A.D. 7 - Carbon dots (C-dots): Fluorescence processes and bioimaging. In Quantum Materials, Devices, and Applications; Henini, M., Rodrigues, M.O., Eds.; Elsevier, 2023; pp. 201–213. [Google Scholar]
- Li, L.; Wu, G.; Yang, G.; Peng, J.; Zhao, J.; Zhu, J.-J. Focusing on luminescent graphene quantum dots: Current status and future perspectives. Nanoscale 2013, 5, 4015–4039. [Google Scholar] [CrossRef] [PubMed]
- Gude, V.; Das, A.; Chatterjee, T.; Mandal, P.K. Molecular origin of photoluminescence of carbon dots: Aggregation-induced orange-red emission. Phys Chem Chem Phys 2016, 18, 28274–28280. [Google Scholar] [CrossRef] [PubMed]
- Zhang, Q.; Wang, R.; Feng, B.; Zhong, X.; Ostrikov, K. Photoluminescence mechanism of carbon dots: Triggering high-color-purity red fluorescence emission through edge amino protonation. Nat Commun 2021, 12, 6856. [Google Scholar] [CrossRef] [PubMed]
- Yoo, D.; Park, Y.; Cheon, B.; Park, M.H. Carbon Dots as an Effective Fluorescent Sensing Platform for Metal Ion Detection. Nanoscale Res Lett 2019, 14. [Google Scholar] [CrossRef]
- Bao, L.; Zhang, Z.L.; Tian, Z.Q.; Zhang, L.; Liu, C.; Lin, Y.; Qi, B.P.; Pang, D.W. Electrochemical Tuning of Luminescent Carbon Nanodots: From Preparation to Luminescence Mechanism. Adv Mater 2011, 23, 5801–5806. [Google Scholar] [CrossRef] [PubMed]
- Gao, X.H.; Du, C.; Zhuang, Z.H.; Chen, W. Carbon quantum dot-based nanoprobes for metal ion detection. J Mater Chem C. 2016, 4, 6927–6945. [Google Scholar] [CrossRef]
- Dai, D.H.; Yang, J.; Wang, Y.; Yang, Y.W. Recent Progress in Functional Materials for Selective Detection and Removal of Mercury(II) Ions. Adv Funct Mater 2021, 31. [Google Scholar] [CrossRef]
- Jiang, Y.L.; Wang, Y.X.; Meng, F.D.; Wang, B.X.; Cheng, Y.X.; Zhu, C.J. N-doped carbon dots synthesized by rapid microwave irradiation as highly fluorescent probes for Pb2+ detection. New J Chem 2015, 39, 3357–3360. [Google Scholar] [CrossRef]
- Wang, Z.X.; Yu, X.H.; Li, F.; Kong, F.Y.; Lv, W.X.; Fan, D.H.; Wang, W. Preparation of boron-doped carbon dots for fluorometric determination of Pb(II), Cu(II) and pyrophosphate ions. Microchim Acta 2017, 184, 4775–4783. [Google Scholar] [CrossRef]
- Tan, Q.; Li, X.; Wang, L.; Zhao, J.; Yang, Q.; Sun, P.; Deng, Y.; Shen, G. One-step synthesis of highly fluorescent carbon dots as fluorescence sensors for the parallel detection of cadmium and mercury ions. Front Chem 2022, 10. [Google Scholar] [CrossRef]
- Sun, Z.; Li, X.; Wu, Y.; Wei, C.; Zeng, H. Origin of green luminescence in carbon quantum dots: Specific emission bands originate from oxidized carbon groups. New J Chem 2018, 42, 4603–4611. [Google Scholar] [CrossRef]
- Devi, P.; Rajput, P.; Thakur, A.; Kim, K.-H.; Kumar, P. Recent advances in carbon quantum dot-based sensing of heavy metals in water. TrAC, Trends Anal Chem 2019, 14, 171–195. [Google Scholar] [CrossRef]
- Han, Z.; Nan, D.; Yang, H.; Sun, Q.; Pan, S.; Liu, H.; Hu, X. Carbon quantum dots based ratiometric fluorescence probe for sensitive and selective detection of Cu2+ and glutathione. Sens Actuators B Chem 2019, 298, 126842. [Google Scholar] [CrossRef]
- He, Y.R.; Zhao, D.L.; Chung, T.S. Na+ functionalized carbon quantum dot incorporated thin-film nanocomposite membranes for selenium and arsenic removal. J Membr Sci 2018, 564, 483–491. [Google Scholar] [CrossRef]
- Lu, H.Z.; Xu, S.F.; Liu, J.Q. One Pot Generation of Blue and Red Carbon Dots in One Binary Solvent System for Dual Channel Detection of Cr3+ and Pb2+ Based on Ion Imprinted Fluorescence Polymers. Acs Sensors 2019, 4, 1917–1924. [Google Scholar] [CrossRef]
- Islam, M.S.; Vogler, R.J.; Al Hasnine, S.M.A.; Hernandez, S.; Malekzadeh, N.; Hoelen, T.P.; Hatakeyama, E.S.; Bhattacharyya, D. Mercury Removal from Wastewater Using Cysteamine Functionalized Membranes. Acs Omega 2020, 5, 22255–22267. [Google Scholar] [CrossRef]
- Nallayagari, A.R.; Sgreccia, E.; Pizzoferrato, R.; Cabibbo, M.; Kaciulis, S.; Bolli, E.; Pasquini, L.; Knauth, P.; Di Vona, M.L. Tuneable properties of carbon quantum dots by different synthetic methods. J Nanostructure Chem 2022, 12, 565–580. [Google Scholar] [CrossRef]
- Chen, J.; Wei, J.-S.; Zhang, P.; Niu, X.-Q.; Zhao, W.; Zhu, Z.-Y.; Ding, H.; Xiong, H.-M. Red-Emissive Carbon Dots for Fingerprints Detection by Spray Method: Coffee Ring Effect and Unquenched Fluorescence in Drying Process. ACS Appl Mater Interfaces 2017, 9, 18429–18433. [Google Scholar] [CrossRef] [PubMed]
- Knauth, P.; Di Vona, M.L. Sulfonated aromatic ionomers: Analysis of proton conductivity and proton mobility. Solid State Ion 2012, 225, 255–259. [Google Scholar] [CrossRef]
- Burratti, L.; Maranges, V.; Sisani, M.; Naryyev, E.; De Matteis, F.; Francini, R.; Prosposito, P. Determination of Pb(II) Ions in Water by Fluorescence Spectroscopy Based on Silver Nanoclusters. Chemosensors 2022, 10, 385. [Google Scholar] [CrossRef]
- Thang, P.N.; Hung, L.X.; Thuan, D.N.; Yen, N.H.; Hien, N.T.T.; Hanh, V.T.H.; Khang, N.C.; Laverdant, J.; Thu, P. Temperature-dependent Raman investigation and photoluminescence of graphene quantum dots with and without nitrogen-doping. J Mater Sci 2021, 56, 4979–4990. [Google Scholar] [CrossRef]
- Pan, D.Y.; Zhang, J.C.; Li, Z.; Wu, M.H. Hydrothermal Route for Cutting Graphene Sheets into Blue-Luminescent Graphene Quantum Dots. Adv Mater 2010, 22, 734–738. [Google Scholar] [CrossRef] [PubMed]
- Hallaji, Z.; Bagheri, Z.; Kalji, S.-O.; Ermis, E.; Ranjbar, B. Recent advances in the rational synthesis of red-emissive carbon dots for nanomedicine applications: A review. FlatChem 2021, 29, 100271. [Google Scholar] [CrossRef]
- Gao, D.; Zhao, H.; Chen, X.; Fan, H. Recent advance in red-emissive carbon dots and their photoluminescent mechanisms. Mater Today Chem 2018, 9, 103–113. [Google Scholar] [CrossRef]
- Barzetti, T.; Selli, E.; Moscotti, D.; Forni, L. Pyridine and ammonia as probes for FTIR analysis of solid acid catalysts. J Chem Soc, Faraday trans 1996, 92, 1401–1407. [Google Scholar] [CrossRef]
- Sciortino, A.; Cannas, M.; Messina, F. Temperature-Dependence of Solvent-Induced Stokes Shift and Fluorescence Tunability in Carbon Nanodots. C 2019, 5, 20. [Google Scholar] [CrossRef]
- Kasha, M. Characterization of electronic transitions in complex molecules. Discuss Faraday Soc 1950, 9, 14–19. [Google Scholar] [CrossRef]
- Dager, A.; Uchida, T.; Maekawa, T.; Tachibana, M. Synthesis and characterization of Mono-disperse Carbon Quantum Dots from Fennel Seeds: Photoluminescence analysis using Machine Learning. Sci Rep 2019, 9. [Google Scholar] [CrossRef] [PubMed]
- Okpalugo, T.I.T.; Papakonstantinou, P.; Murphy, H.; McLaughlin, J.; Brown, N.M.D. High resolution XPS characterization of chemical functionalised MWCNTs and SWCNTs. Carbon 2005, 43, 153–161. [Google Scholar] [CrossRef]
- Kingsbury, R.S.; Bruning, K.; Zhu, S.; Flotron, S.; Miller, C.T.; Coronell, O. Influence of Water Uptake, Charge, Manning Parameter, and Contact Angle on Water and Salt Transport in Commercial Ion Exchange Membranes. Ind Eng Chem Res 2019, 58, 18663–18674. [Google Scholar] [CrossRef]
- Xing, P.; Robertson, G.P.; Guiver, M.D.; Mikhailenko, S.D.; Wang, K.; Kaliaguine, S. Synthesis and characterization of sulfonated poly(ether ether ketone) for proton exchange membranes. J Membr Sci 2004, 229, 95–106. [Google Scholar] [CrossRef]
- Lofrano, G.; Carotenuto, M.; Libralato, G.; Domingos, R.F.; Markus, A.; Dini, L.; Gautam, R.K.; Baldantoni, D.; Rossi, M.; Sharma, S.K.; et al. Polymer functionalized nanocomposites for metals removal from water and wastewater: An overview. Water Res 2016, 92, 22–37. [Google Scholar] [CrossRef]
- Conway, B.E.; Ayranci, E. Effective Ionic Radii and Hydration Volumes for Evaluation of Solution Properties and Ionic Adsorption. J. Solution Chem 1999, 28, 163–192. [Google Scholar] [CrossRef]

| Pb(II) | ||
|---|---|---|
| Ci mg/L (mM) |
Cf mg/L |
RE% |
| 2238 (10.8) | 1253 | 44 |
| 1036 (5.0) | 83 | 92 |
| 207 (1.0) | 0 | 100 |
| Cd(II) | ||
| 1130 (10) | 346 | 41 |
| 125 (1.1) | 3.8 | 97 |
| 63 (0.55) | 0 | 100 |
| 31 (0.27) | 0 | 100 |
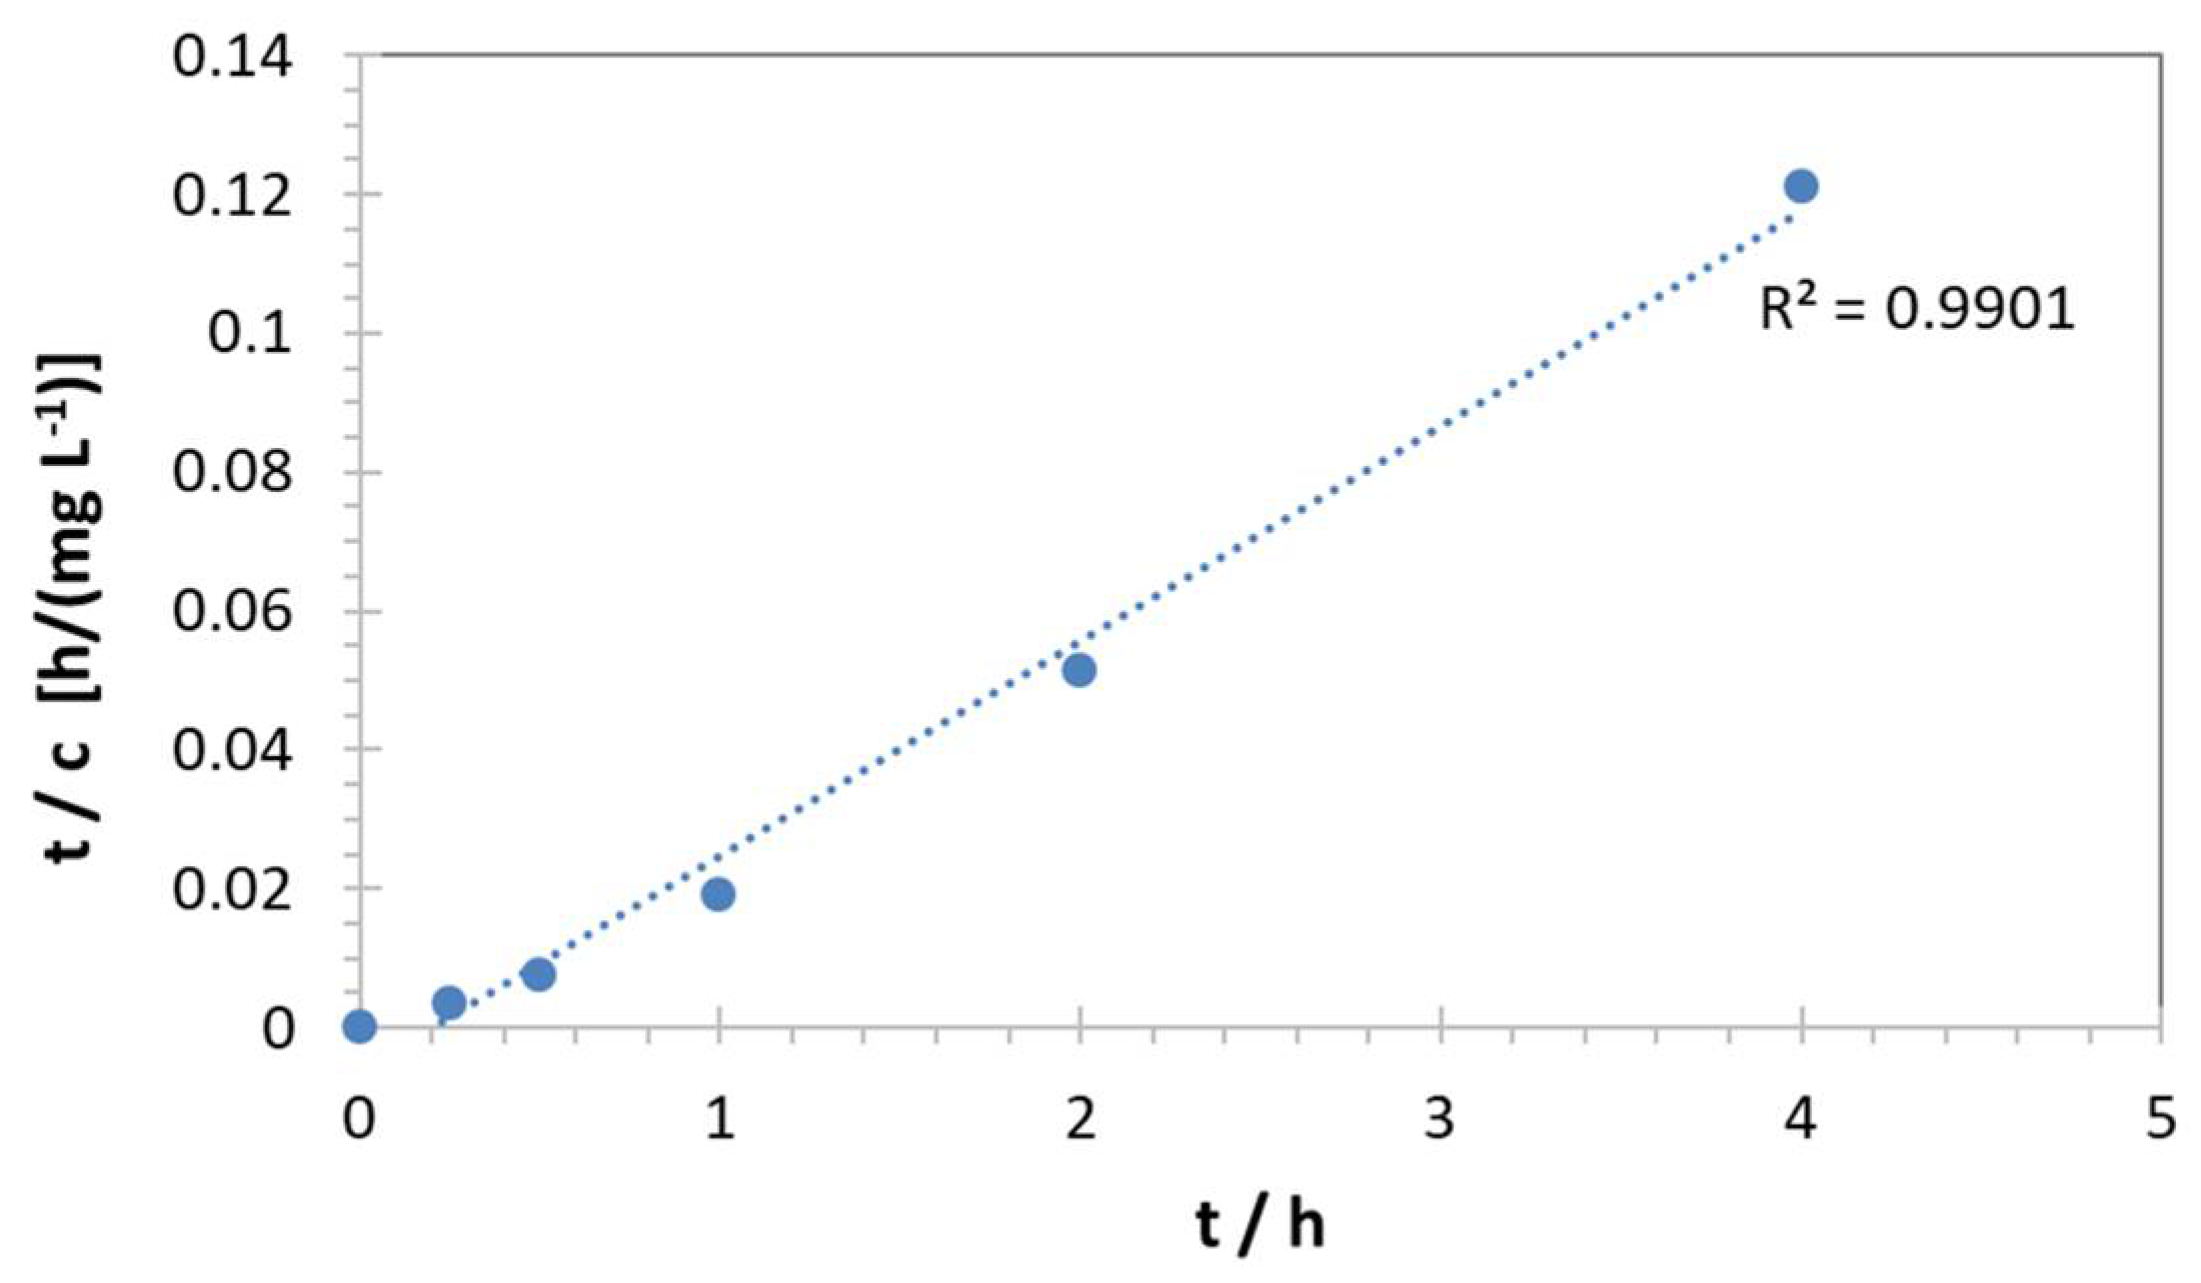
| Time (h) | Pb(II) concentration / mg/L (mM) | RE (%) |
| 0 | 145 (0.7) | 0 |
| 0.25 | 116 | 20 |
| 0.5 | 109 | 33 |
| 1 | 89 | 39 |
| 2 | 75 | 48 |
| 4 | 55 | 62 |
| Cd(II) concentration / mg/L (mM) | ||
| 0 | 85 (0.7) | 0 |
| 0.25 | 72 | 15 |
| 0.5 | 65 | 23 |
| 1 | 52 | 38 |
| 2 | 39 | 53 |
| 4 | 33 | 61 |
Disclaimer/Publisher’s Note: The statements, opinions and data contained in all publications are solely those of the individual author(s) and contributor(s) and not of MDPI and/or the editor(s). MDPI and/or the editor(s) disclaim responsibility for any injury to people or property resulting from any ideas, methods, instructions or products referred to in the content. |
© 2024 by the authors. Licensee MDPI, Basel, Switzerland. This article is an open access article distributed under the terms and conditions of the Creative Commons Attribution (CC BY) license (http://creativecommons.org/licenses/by/4.0/).


