1. Introduction
Titanium and its alloys are known for their high specific strength, high heat resistance, and high resistance to erosion and corrosion [
1,
2,
3,
4,
5,
6,
7,
8,
9,
10,
11,
12,
13,
14]. Friction Stir Processing (FSP) was derived from friction stir welding (FSW) in 2000 and was first reported by Mishra et al. [
15]. As first reported by Mishra et al. [
15] in 2000, friction stir processing (FSP) was derived from friction stir welding (FSW). FSP is identical to FSW except that in FSP the rotating tool does not weld the parts to one another. Because FSP is a severe plastic deformation process, it aims to attain a stir zone with a very fine grain size and hence to improve the mechanical properties of the material being processed. Applying FSW, and hence FSP, to Ti and its alloys is somewhat challenging due to the high melting temperature of titanium (1668
0C), thus requiring welding tool materials that are more resistant to temperature and wear [
3,
7,
8,
9,
10,
11,
12,
13,
16,
17,
18,
19,
20].
Several studies, among them [
8,
9,
10,
11,
12,
13,
14,
21], have examined the microstructure obtained during FSP of commercially-pure (CP) Ti. Yet these studies are marked by many discrepancies, including the sizes and shapes of the grains as well as the influence of the processing parameters on grain shape and size and the metallurgical processes involved. Several researchers mentioned the occurrence of DRX during FSP. Bahl et al. [
8], who processed the material at rotational speeds of 600 and 1250 rpm and a transverse speed of 200 mm/min, reported on grain refinement at the SZ from 57 µm down to 19 µm and 13 µm for 600 and 1250 rpm, respectively. They claimed that Ti, which has a high stacking-fault-energy (SFE), tends to undergo geometric dynamic recrystallization (GDRX) and continuous dynamic recrystallization (CDRX) rather than discontinuous dynamic recrystallization (DDRX). Yet they also noted the occurrence of grain boundary bulging at the stir zone (SZ) as an indication that DDRX took place to some extent, and therefore concluded that all three types of DRX are responsible for the grain refinement. Jiang et al. [
9] reported on an average grain size of 33.1 mm in the case of the PM, which decreased to 5.8 mm in the case of processing at 180 rpm, whereas processing at 270 rpm yielded a bimodal grain size distribution with an average value of 13 mm at the surface and 9.3 mm at 1 mm deep. Singh et al. [
10] reported on grain refinement from 11.61±6.69 mm down to about 1 mm at the SZ, using processing parameters of 600 rpm and 350 mm/min. Vakili-Azghandi et al. [
11] processed the material at 1400 rpm and 14 mm/min. They reported grain refinement down to 4.5 mm after the first FSP pass and further refinement down to 3.1 mm together with the formation of a Widmanstätten structure after the third pass. However, they did not report anything about the BM grain size. Fattah-alhosseini et al. [
12] processed the material at a rotational speed of 1400 rpm and a transverse speed of 40 mm/min. They also reported more extensive grain refinement when the number of passes was increased from an average BM grain size of 25 mm down to submicron size after three passes, though they did not state the exact grain size obtained after FSP. Zhang et al. [
14] processed the material at 200-400 rpm and 60-120 mm/min. They reported that the microstructure of the BM consisted of equiaxed grains with an average size of ~38 mm, while the SZ consisted of fine grains with an average grain size of ~6 mm. According to Zhang et al. [
14], both CDRX and DDRX took place at the SZ. Nevertheless, the consensus among researchers seems to be that the development of the microstructure during FSW is a complex, multi-stage process that is based on various types of DRX, as stated in the reviews by Sajid et al. [
21], Zykove et al. [
22], and Ding et al. [
23].
Previous studies conducted by the authors on FSW’ed CP-Ti [
24,
25] indicated that the weld was not the weakest link, either at high temperatures or at RT. Both for tensile tests conducted at RT and for creep tests conducted at high temperatures, failure always occurred at the parent material (PM) rather than at the weld. This led to the conclusion that FSP has the potential to produce an improved microstructure and hence to yield improved mechanical properties. In all cases reported, the consensus in the literature seems to be that both the hardness [
9,
10,
11,
13] and the tensile properties [
9] of the FSP’ed material are higher than those of the PM. With respect to fractography, the only reported fractography study was in Jiang et al. [
9] and this study was quite limited.
The current paper focuses on the mechanical properties, namely tension and hardness, at RT as well as on fractography of the FSP’ed material compared to the parent material. The microstructure of FSW’ed CP-Ti and hence of FSP’ed CP-Ti has been discussed in the authors’ previous publications [
24,
25]. The current study presents and discusses certain topics regarding microstructural and mechanical changes along the processed strip and across its cross-sectional area. The main finding of the current study is that the microstructure of the cross- section as well as its mechanical properties are not uniform either longitudinally or transversally. Heavy deformation bands characterized by very high hardness values and extra fine grains were detected, and the shape and distribution of these bands changed along the processed strip. Neither these bands nor their influence on the mechanical properties of the FSP’ed material have been noted in any of the references mentioned, motivating the decision to study these bands and their origin.
HRSEM as well as EBSD analysis carried out on these bands revealed that they were composed of extra-fine equiaxed a-Ti grains having an average radius of 1-2 microns. In addition, retained b phase was detected at the grain boundaries of these a-Ti, together with a small quantity of separate b grains. A fractography study conducted on broken tensile specimens indicated that the FSP’ed material was free of defects and that the fracture started at these bands. A qualitative model was proposed on the basis of these findings. According to this model, the grains mentioned above were formed due to DRX taking place during FSP. The retained b phase at the grain boundaries and in a few cases as separate b grains shows that the a-b phase transformation temperature of about 8800C in the case of pure Ti was reached during FSP. The microstructure observed in the current study at these bands, namely, a sort of a+b extra fine equiaxed grain microstructure, is a result of increased deformation during FSP. This in turn led to excessive DRX resulting in a higher degree of grain refinement, while the a-b phase transformation contributed to an even higher degree of grain refinement.
The practical conclusion of the current study is that the mechanical properties of the FSP’ed material at room temperature were superior to those of the RT mechanical properties of the parent material. This means, in turn, that FSP of CP-Ti has the potential to become an industrial means of improving the mechanical properties of the material. Several questions still require further research: How stable is this microstructure at high temperatures? Is the correct selection of process parameters capable of yielding a uniform cross-section composed entirely of the a+b extra-fine microstructure, as observed at the excessive deformation regions detected?
3. Results
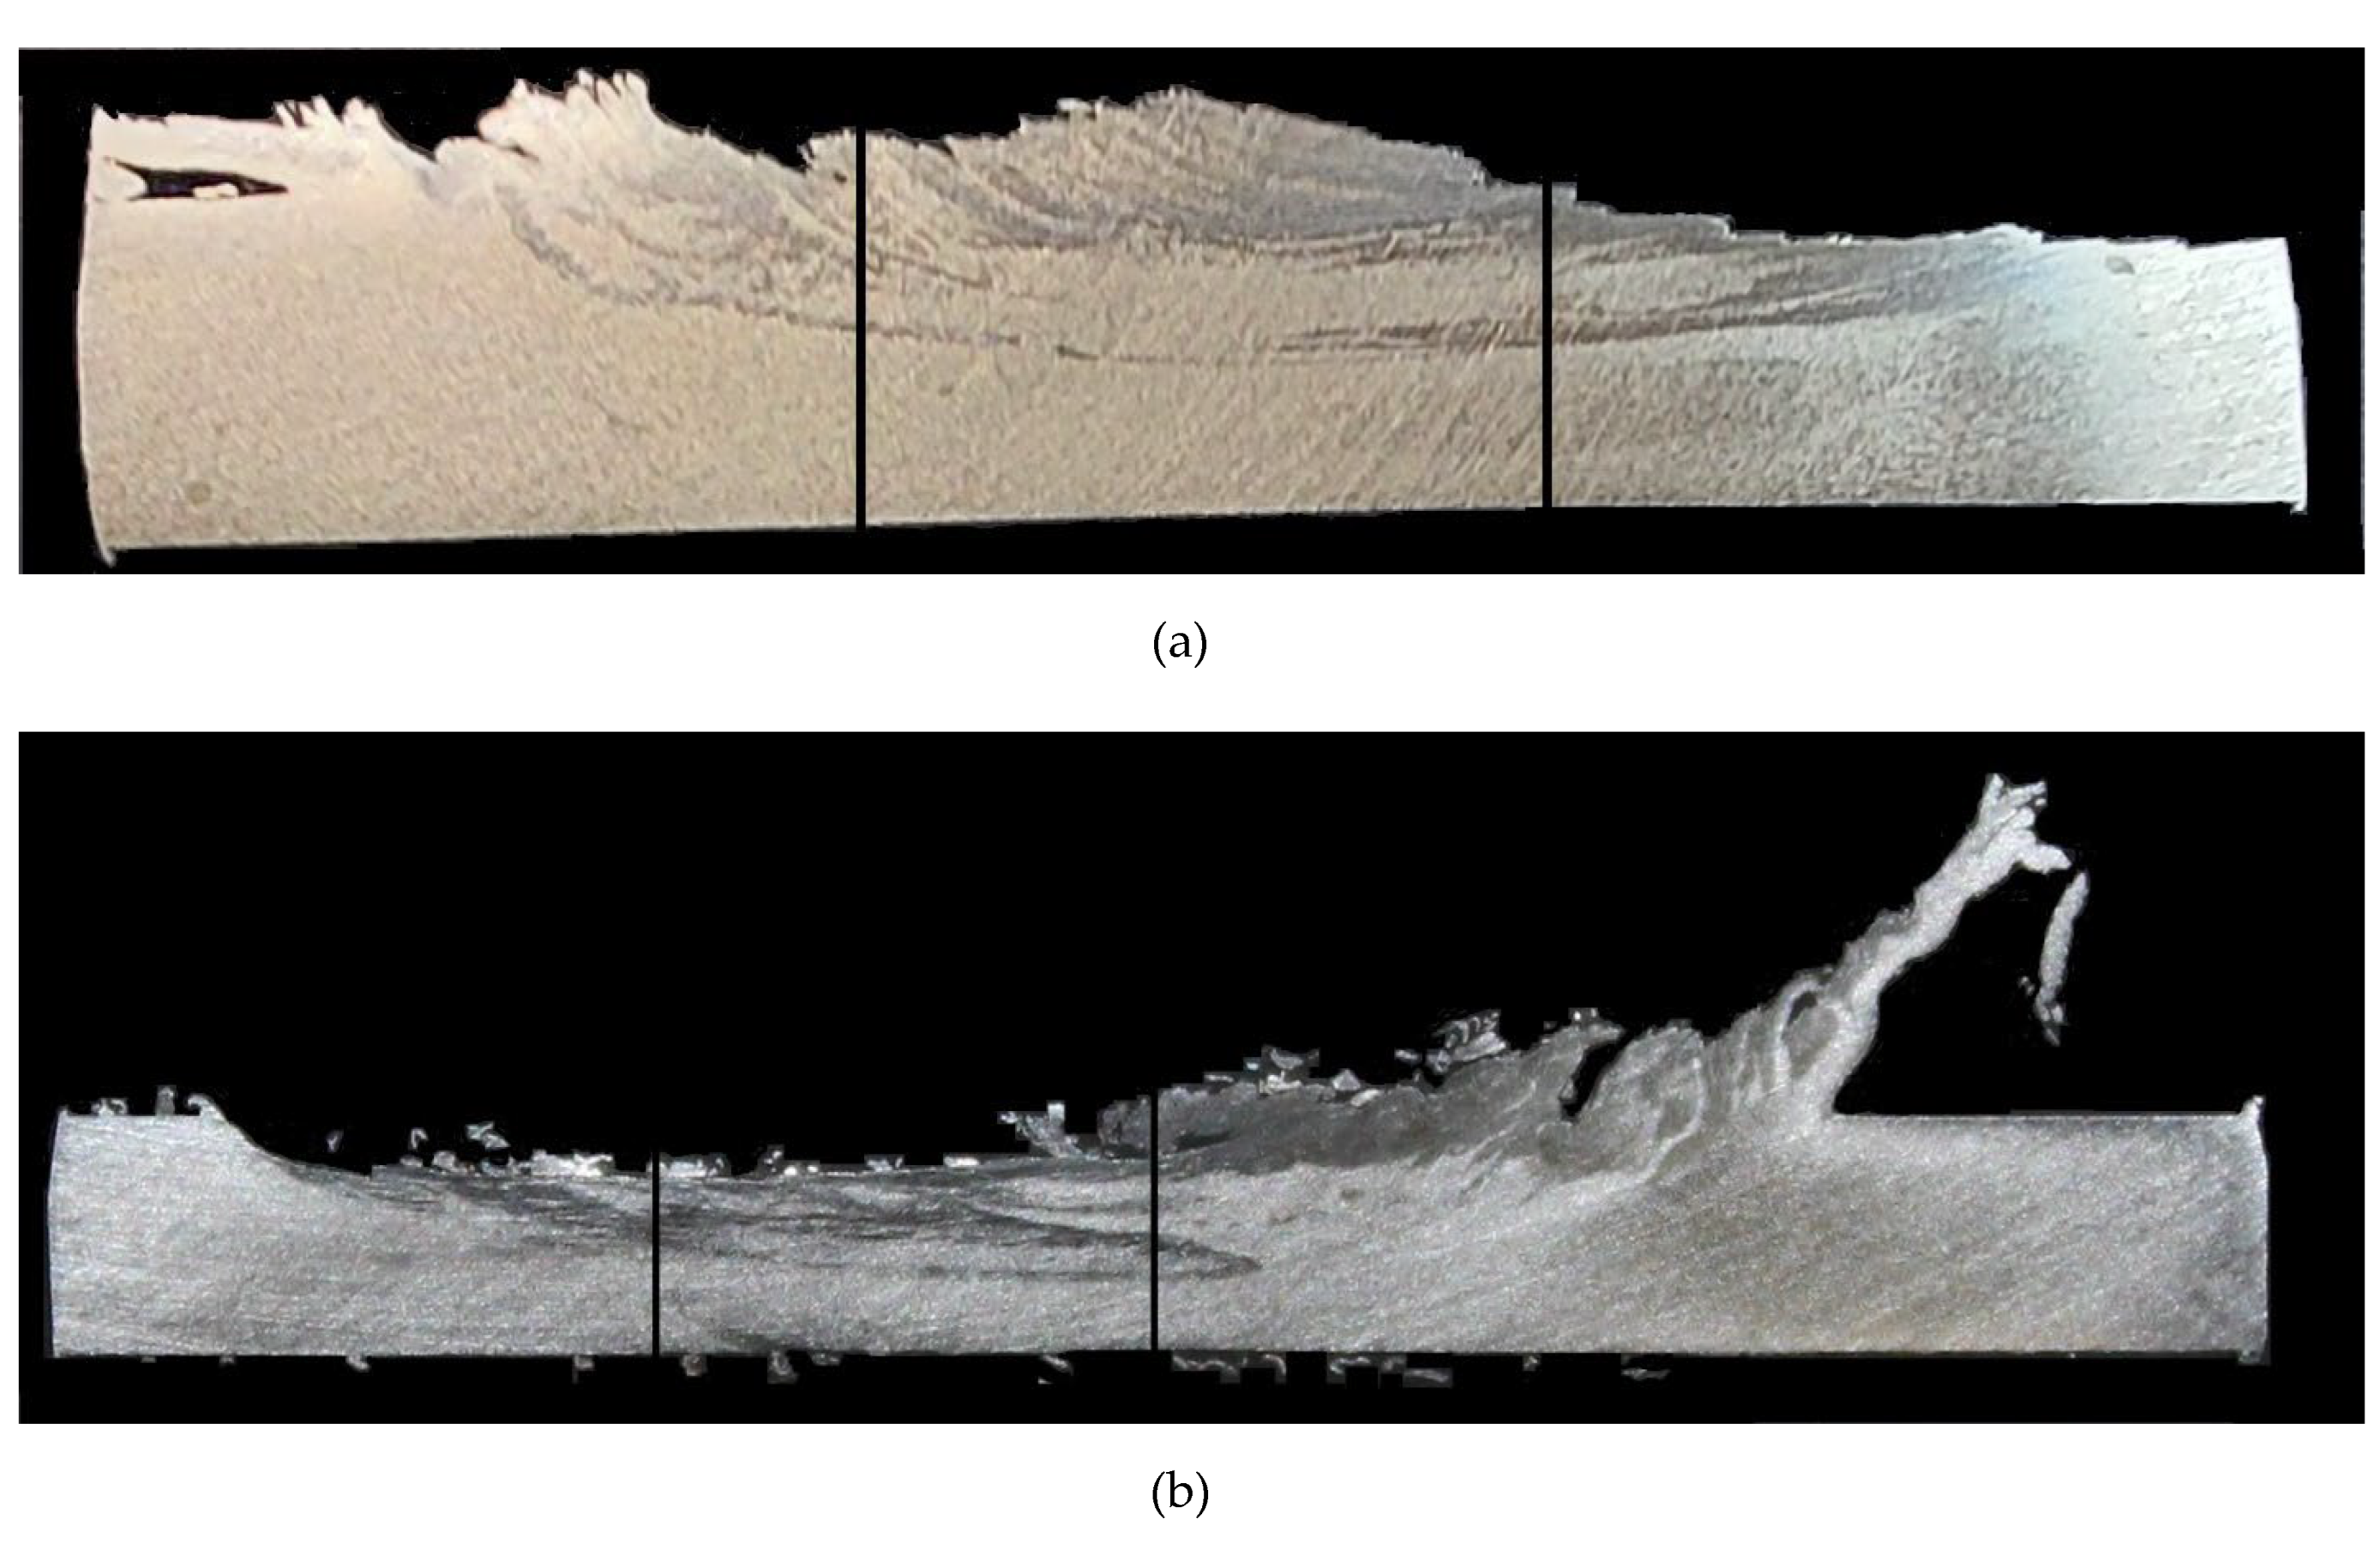
Figure 2a-c show optical images of three cross-sections taken along the processed strip after the first third, second third and final third of the processed strip, respectively. In addition, bright bands similar to the ones reported in [
24] are discernible across the cross-section in all three cases.
A comparison of
Figure 2a-c shows that the shape and the dimensions of the bright bands across the cross-section vary along the processed strip. Microhardness mapping of these cross-sections was carried out in order to find correlations with the appearance of these bright bands.
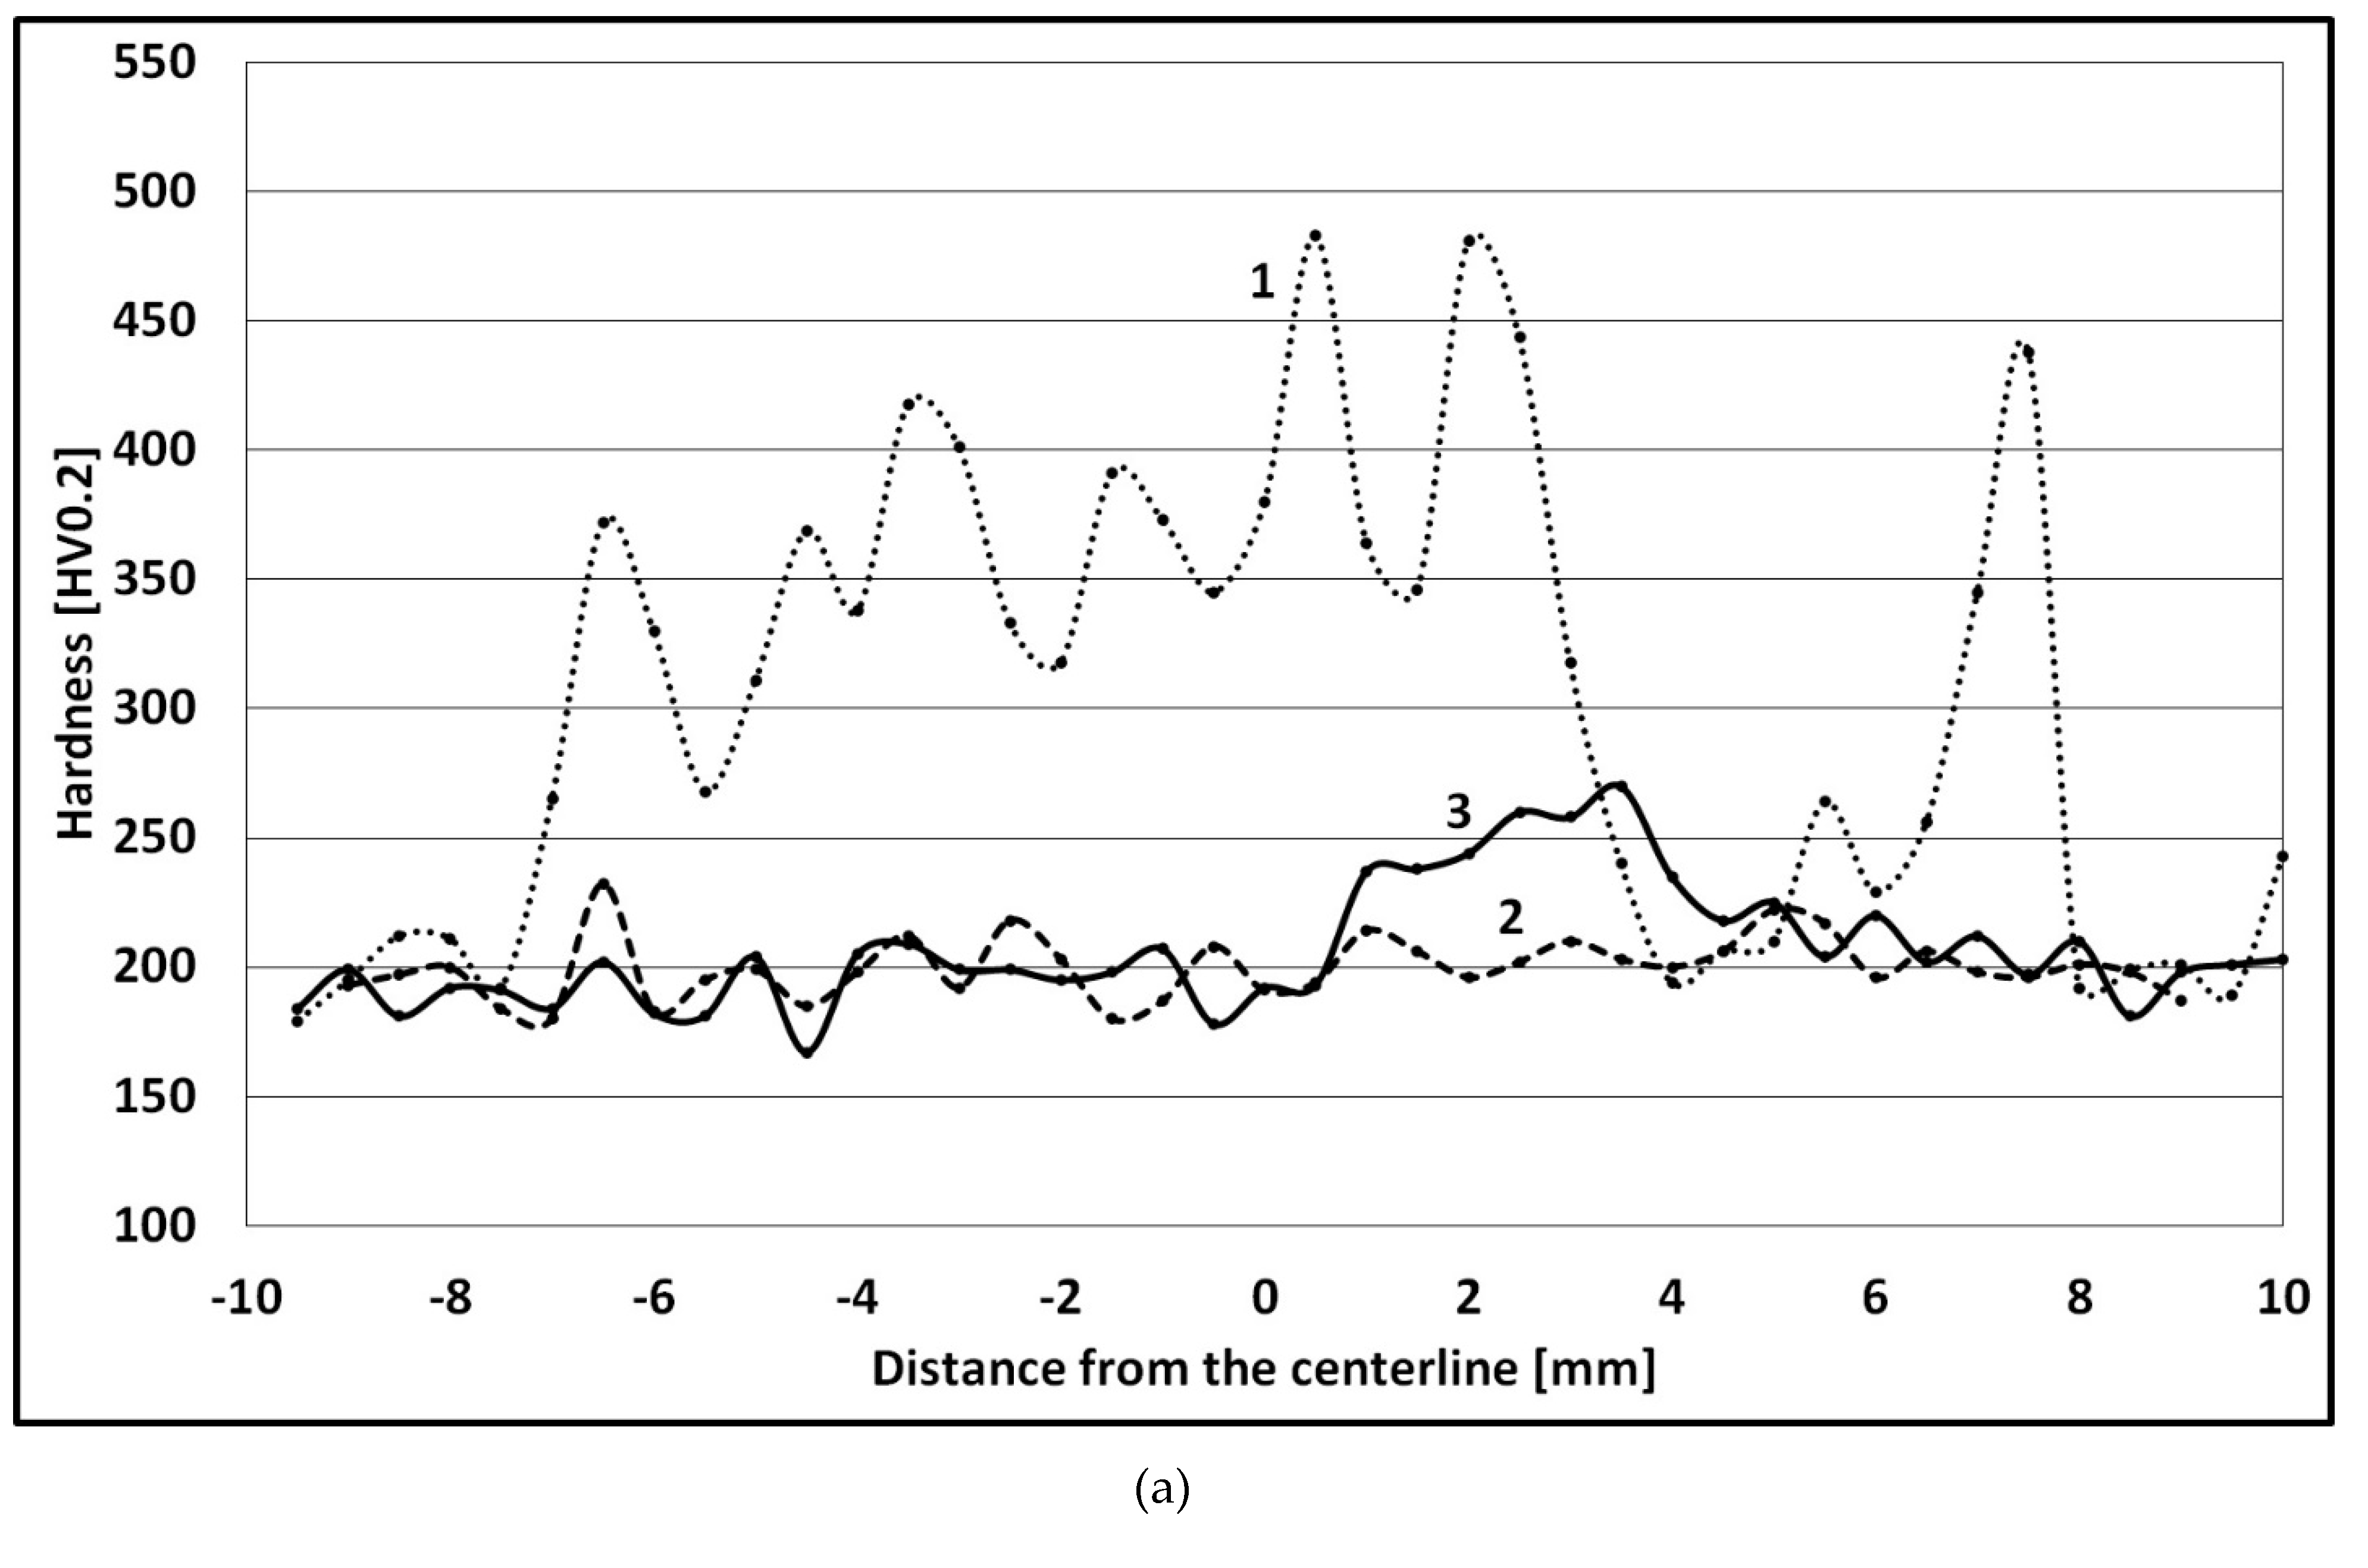
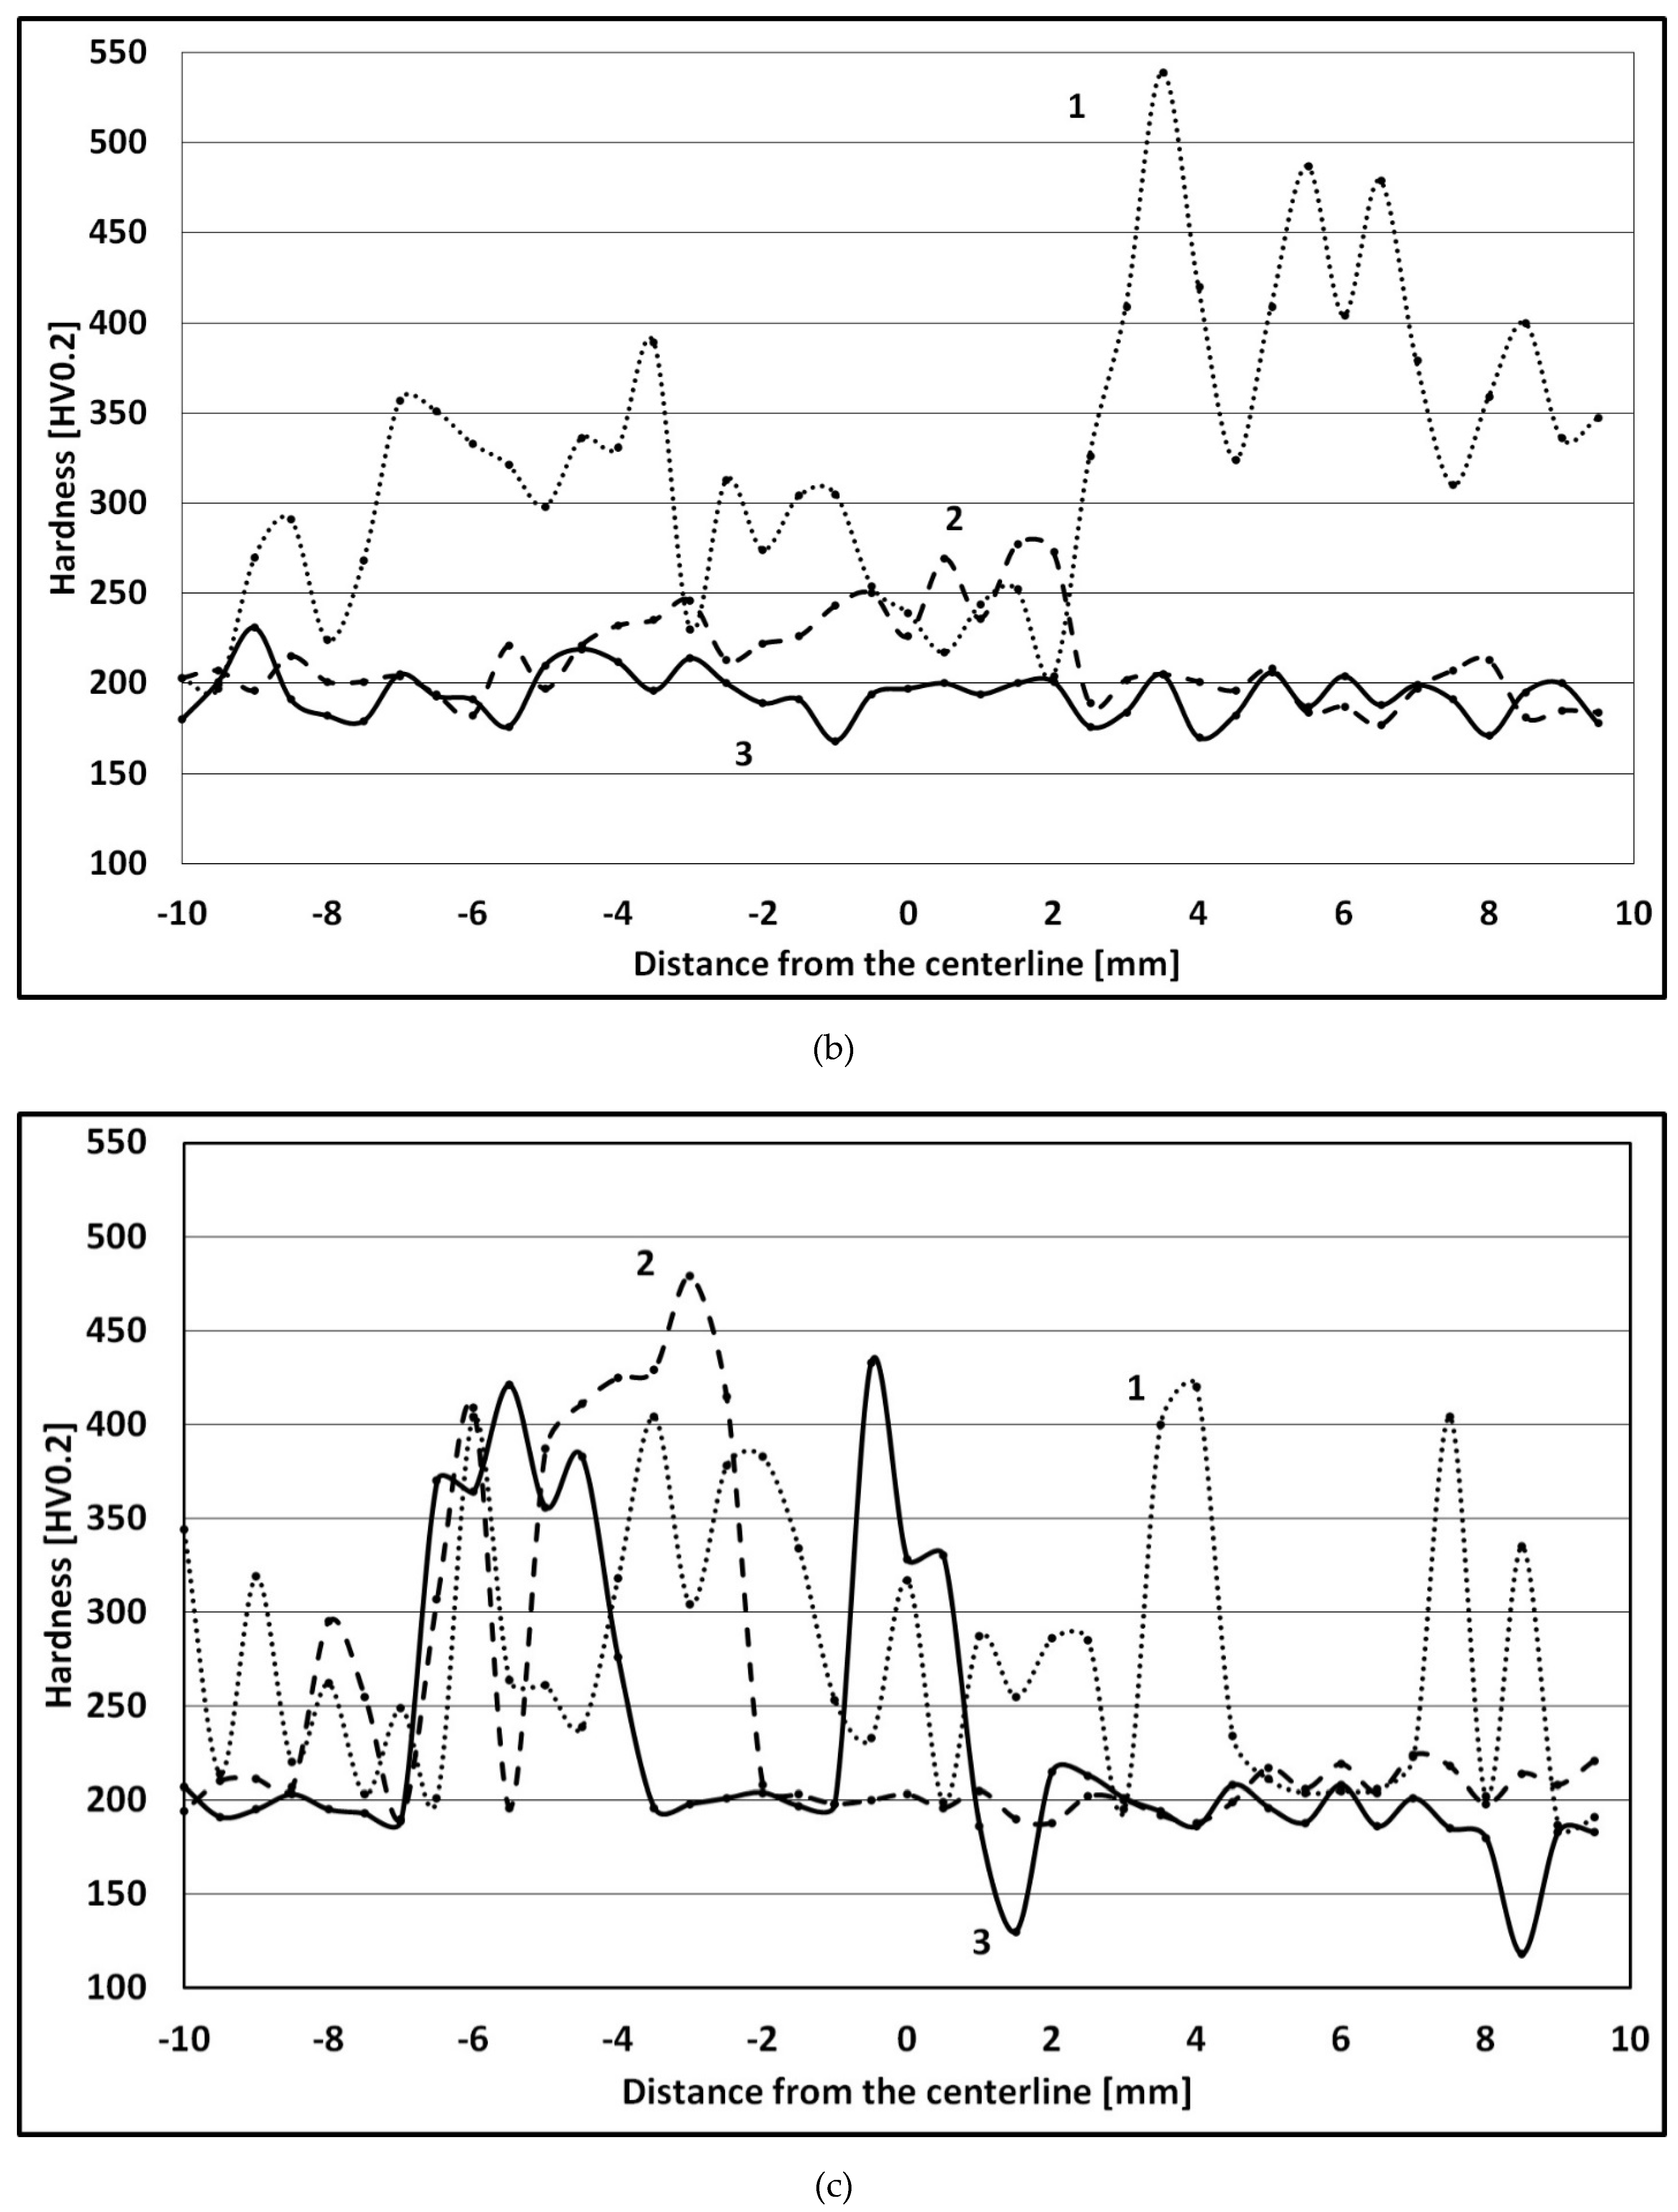
Figure 3a–c depict microhardness profiles taken from the specimens shown in
Figure 2a-c, respectively. Each of
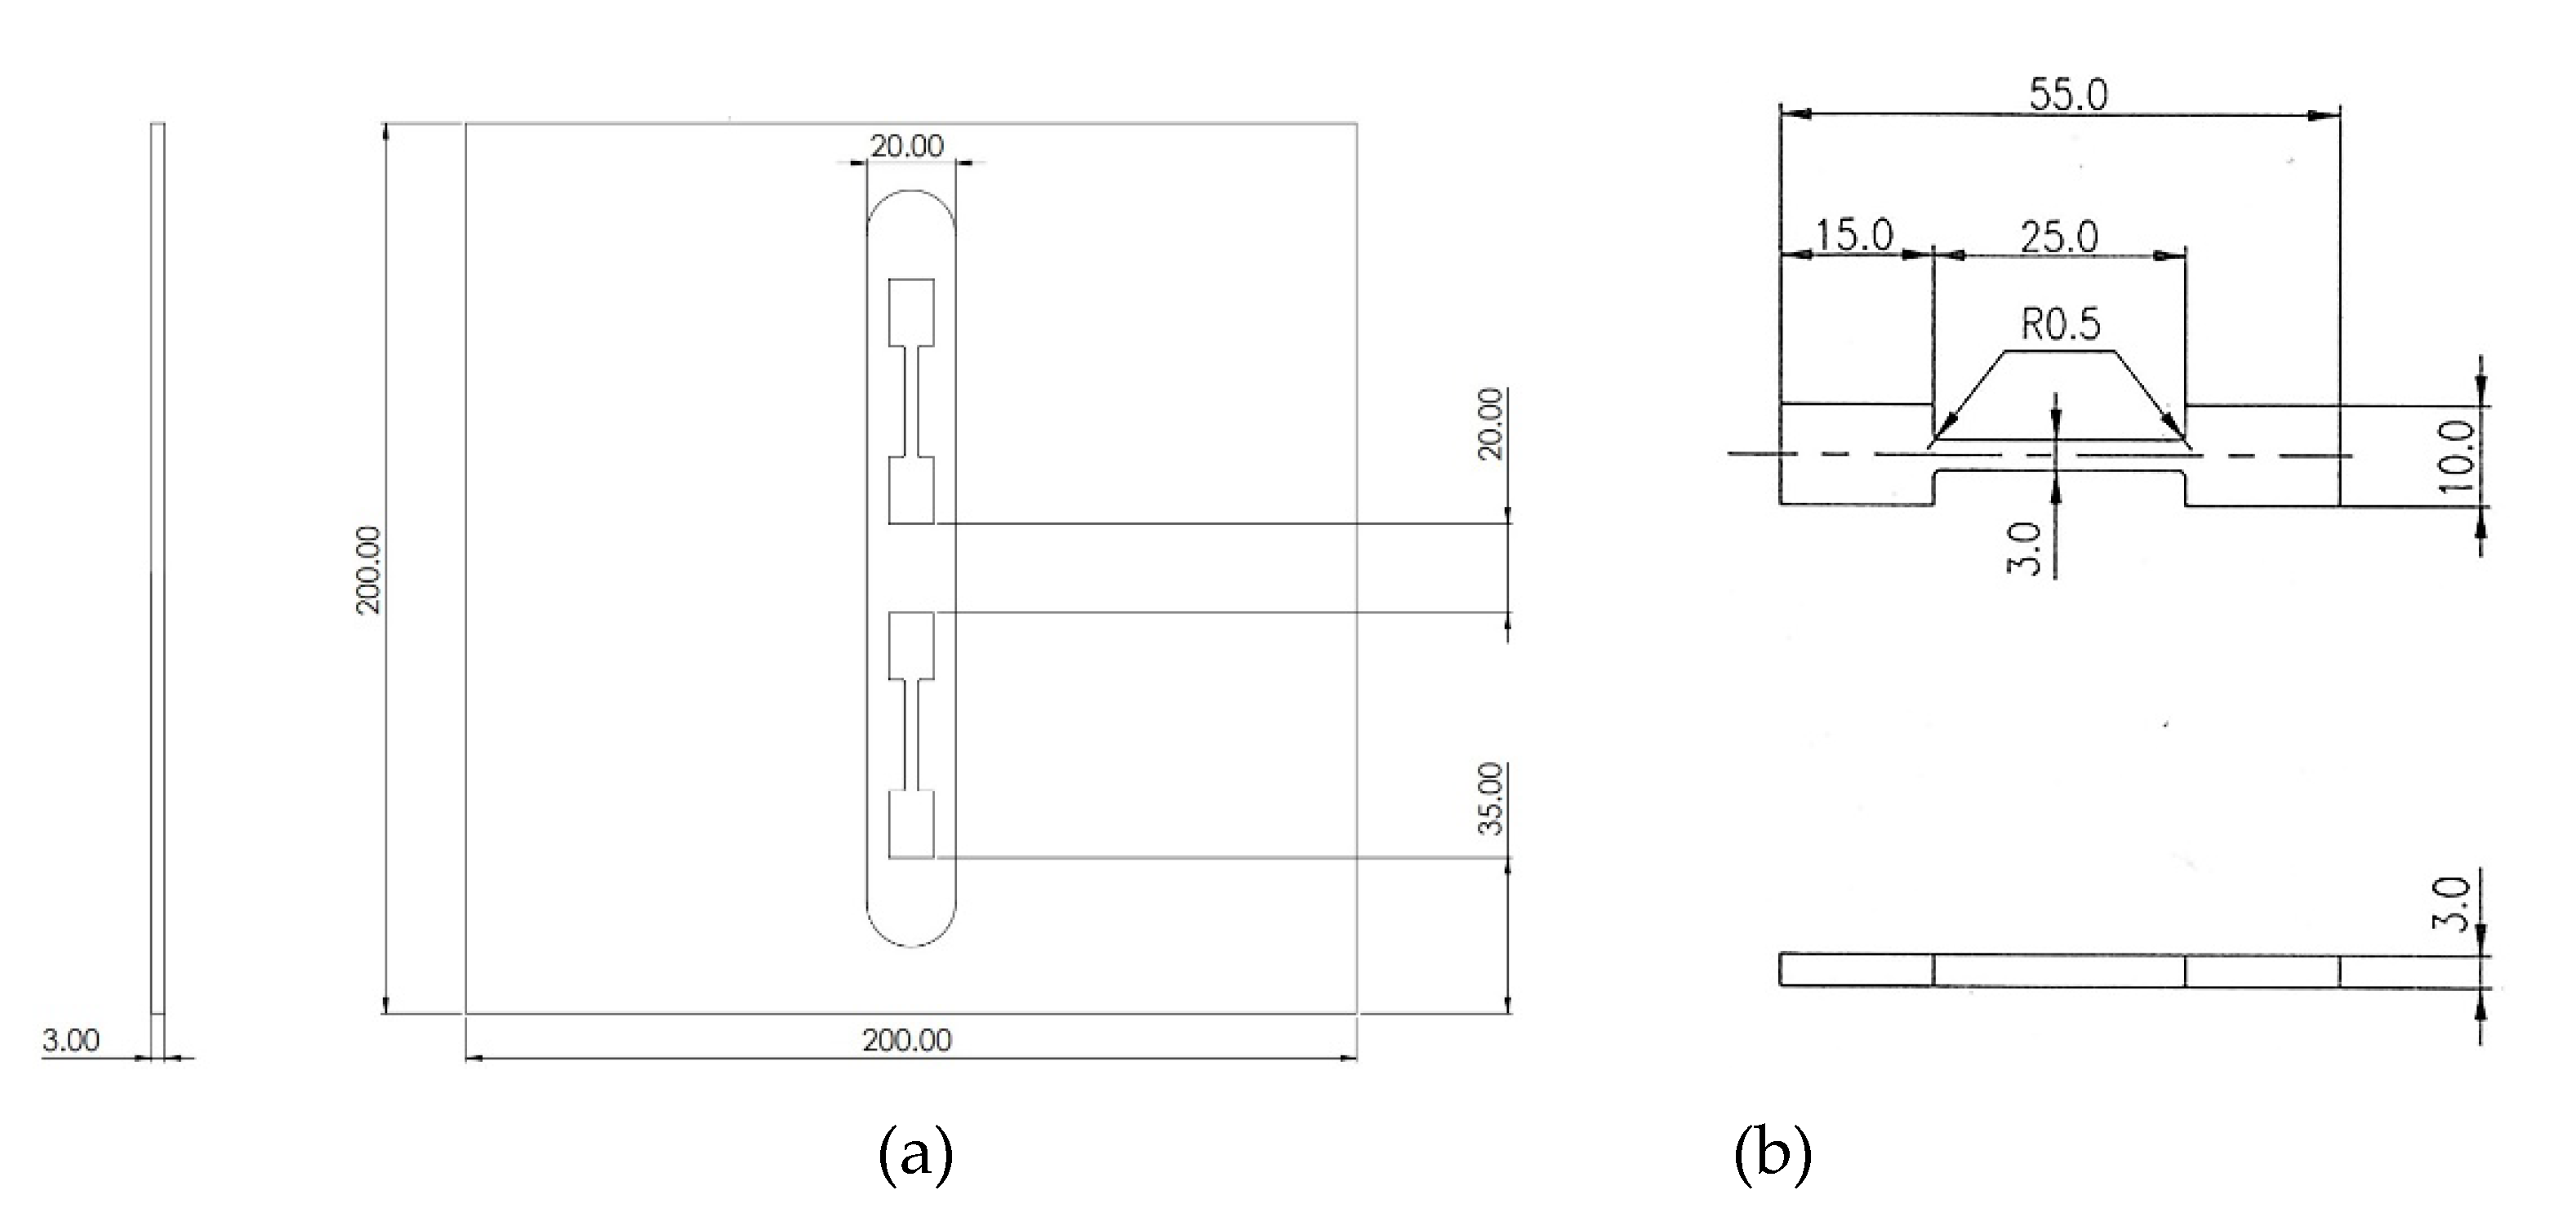
Figure 3a-c depicts three microhardness profiles taken across the processed strip at 0.5 mm above the lower surface, 1.2 mm above the lower surface, and 0.5 mm below the upper surface taken across the processed strip, perpendicular to its longitudinal axis, while maintaining a distance of 0.5 mm from one indentation to another. As stated earlier, the diameter of the tool’s pin was 6 mm, indicating in turn that the SZ spanned an area of at least -3 to 3 mm from the centerline. The borders of the SZ are shown by vertical lines in
Figure 2a-c.
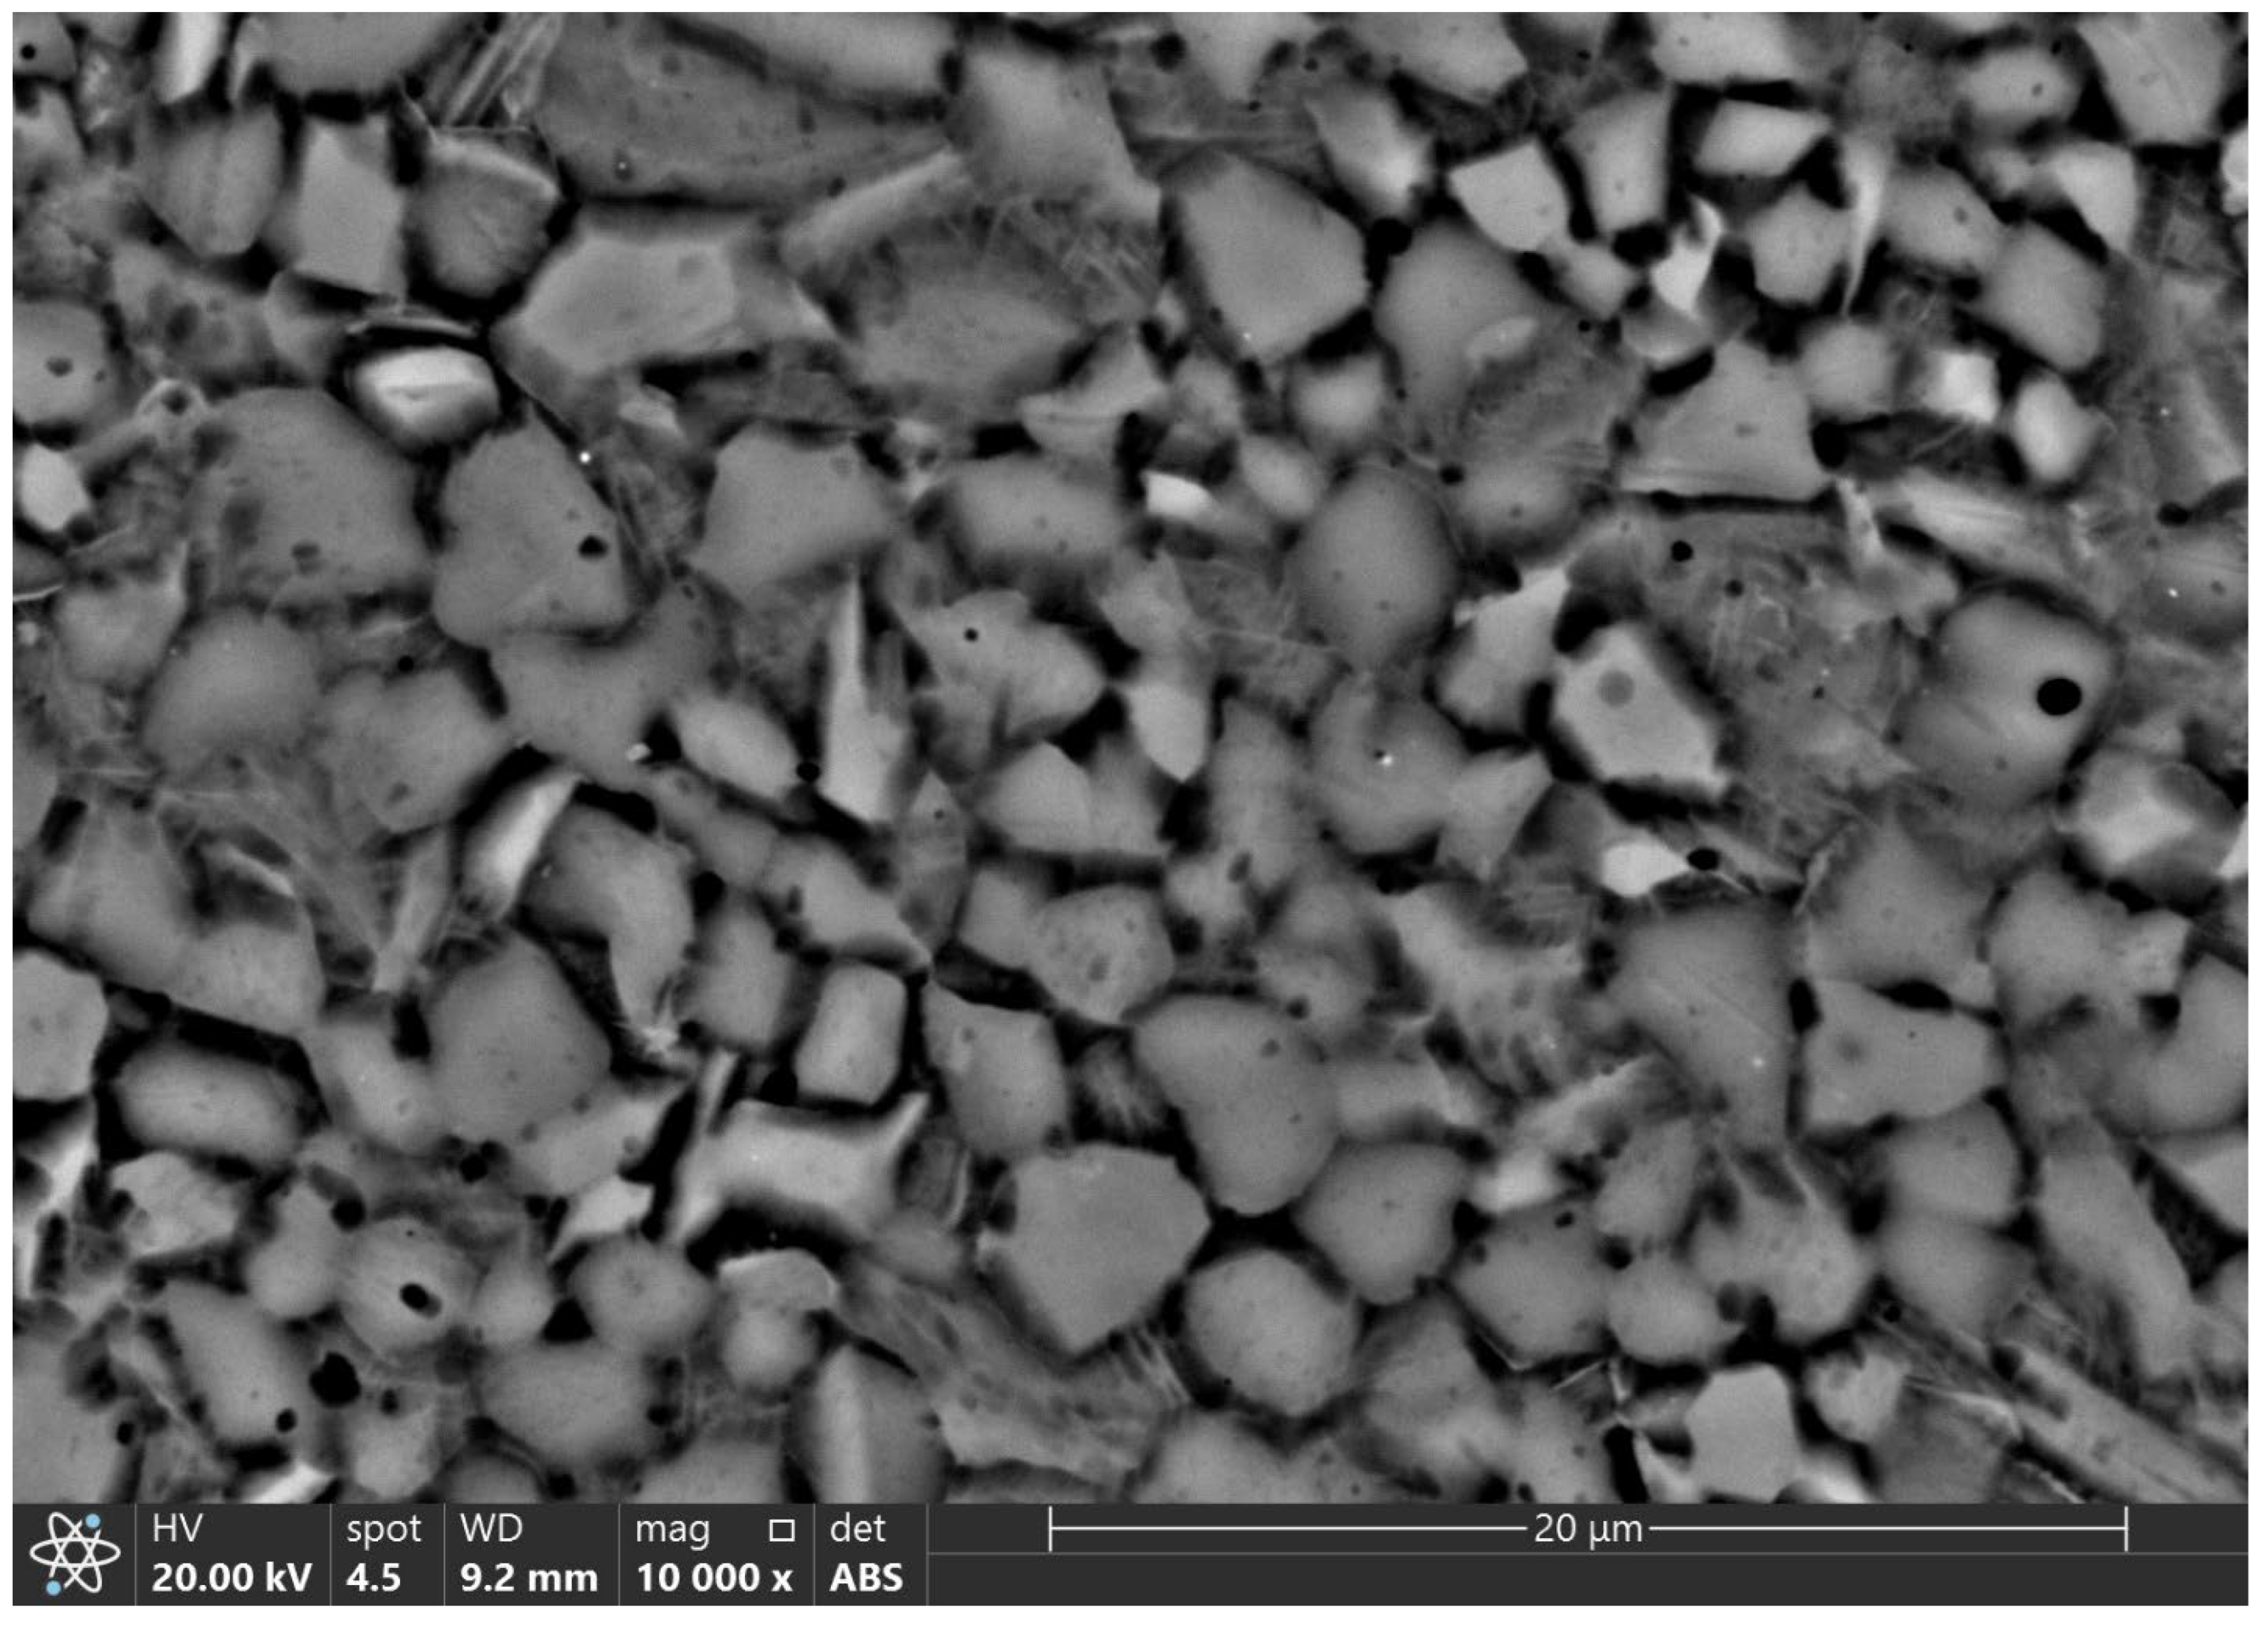
Figure 4 depicts an SEM micrograph taken from one of the bright bands shown in
Figure 2. As can be seen in the figure, most of the grains are fine equiaxed with an average size of one to two microns. In addition, a small fraction of the grains have a fibrous morphology. This structure is discernible in all cases within the above-mentioned bright bands.
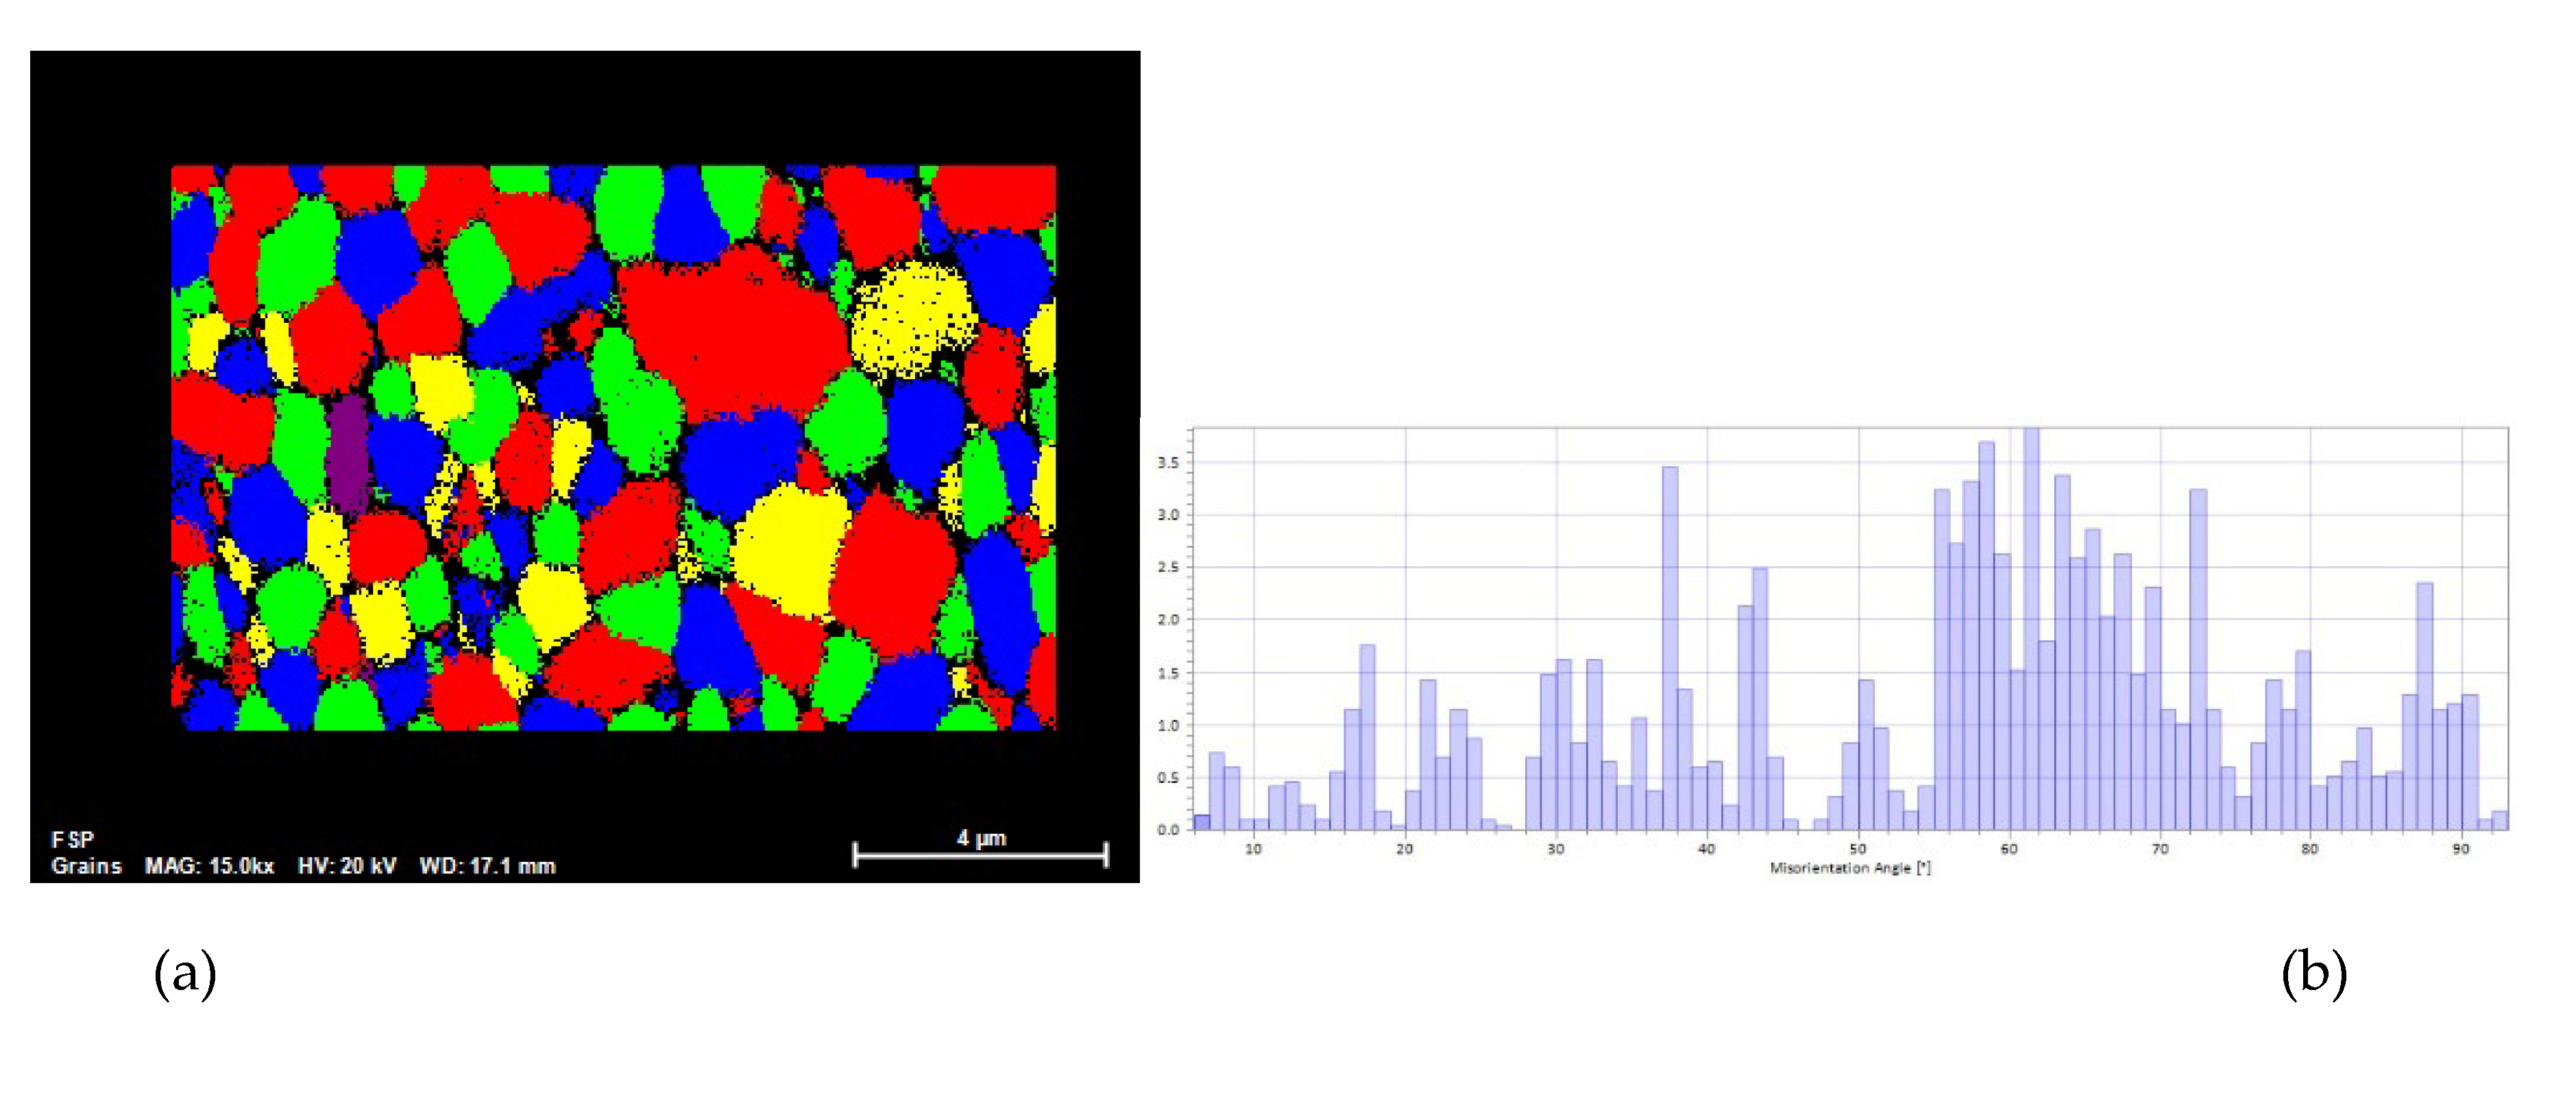
Figure 5a depicts a high-resolution scanning electron microscope (HRSEM) grain map obtained by electron back scattered diffraction (EBSD) taken from one of the bright bands under magnification of x15000, and
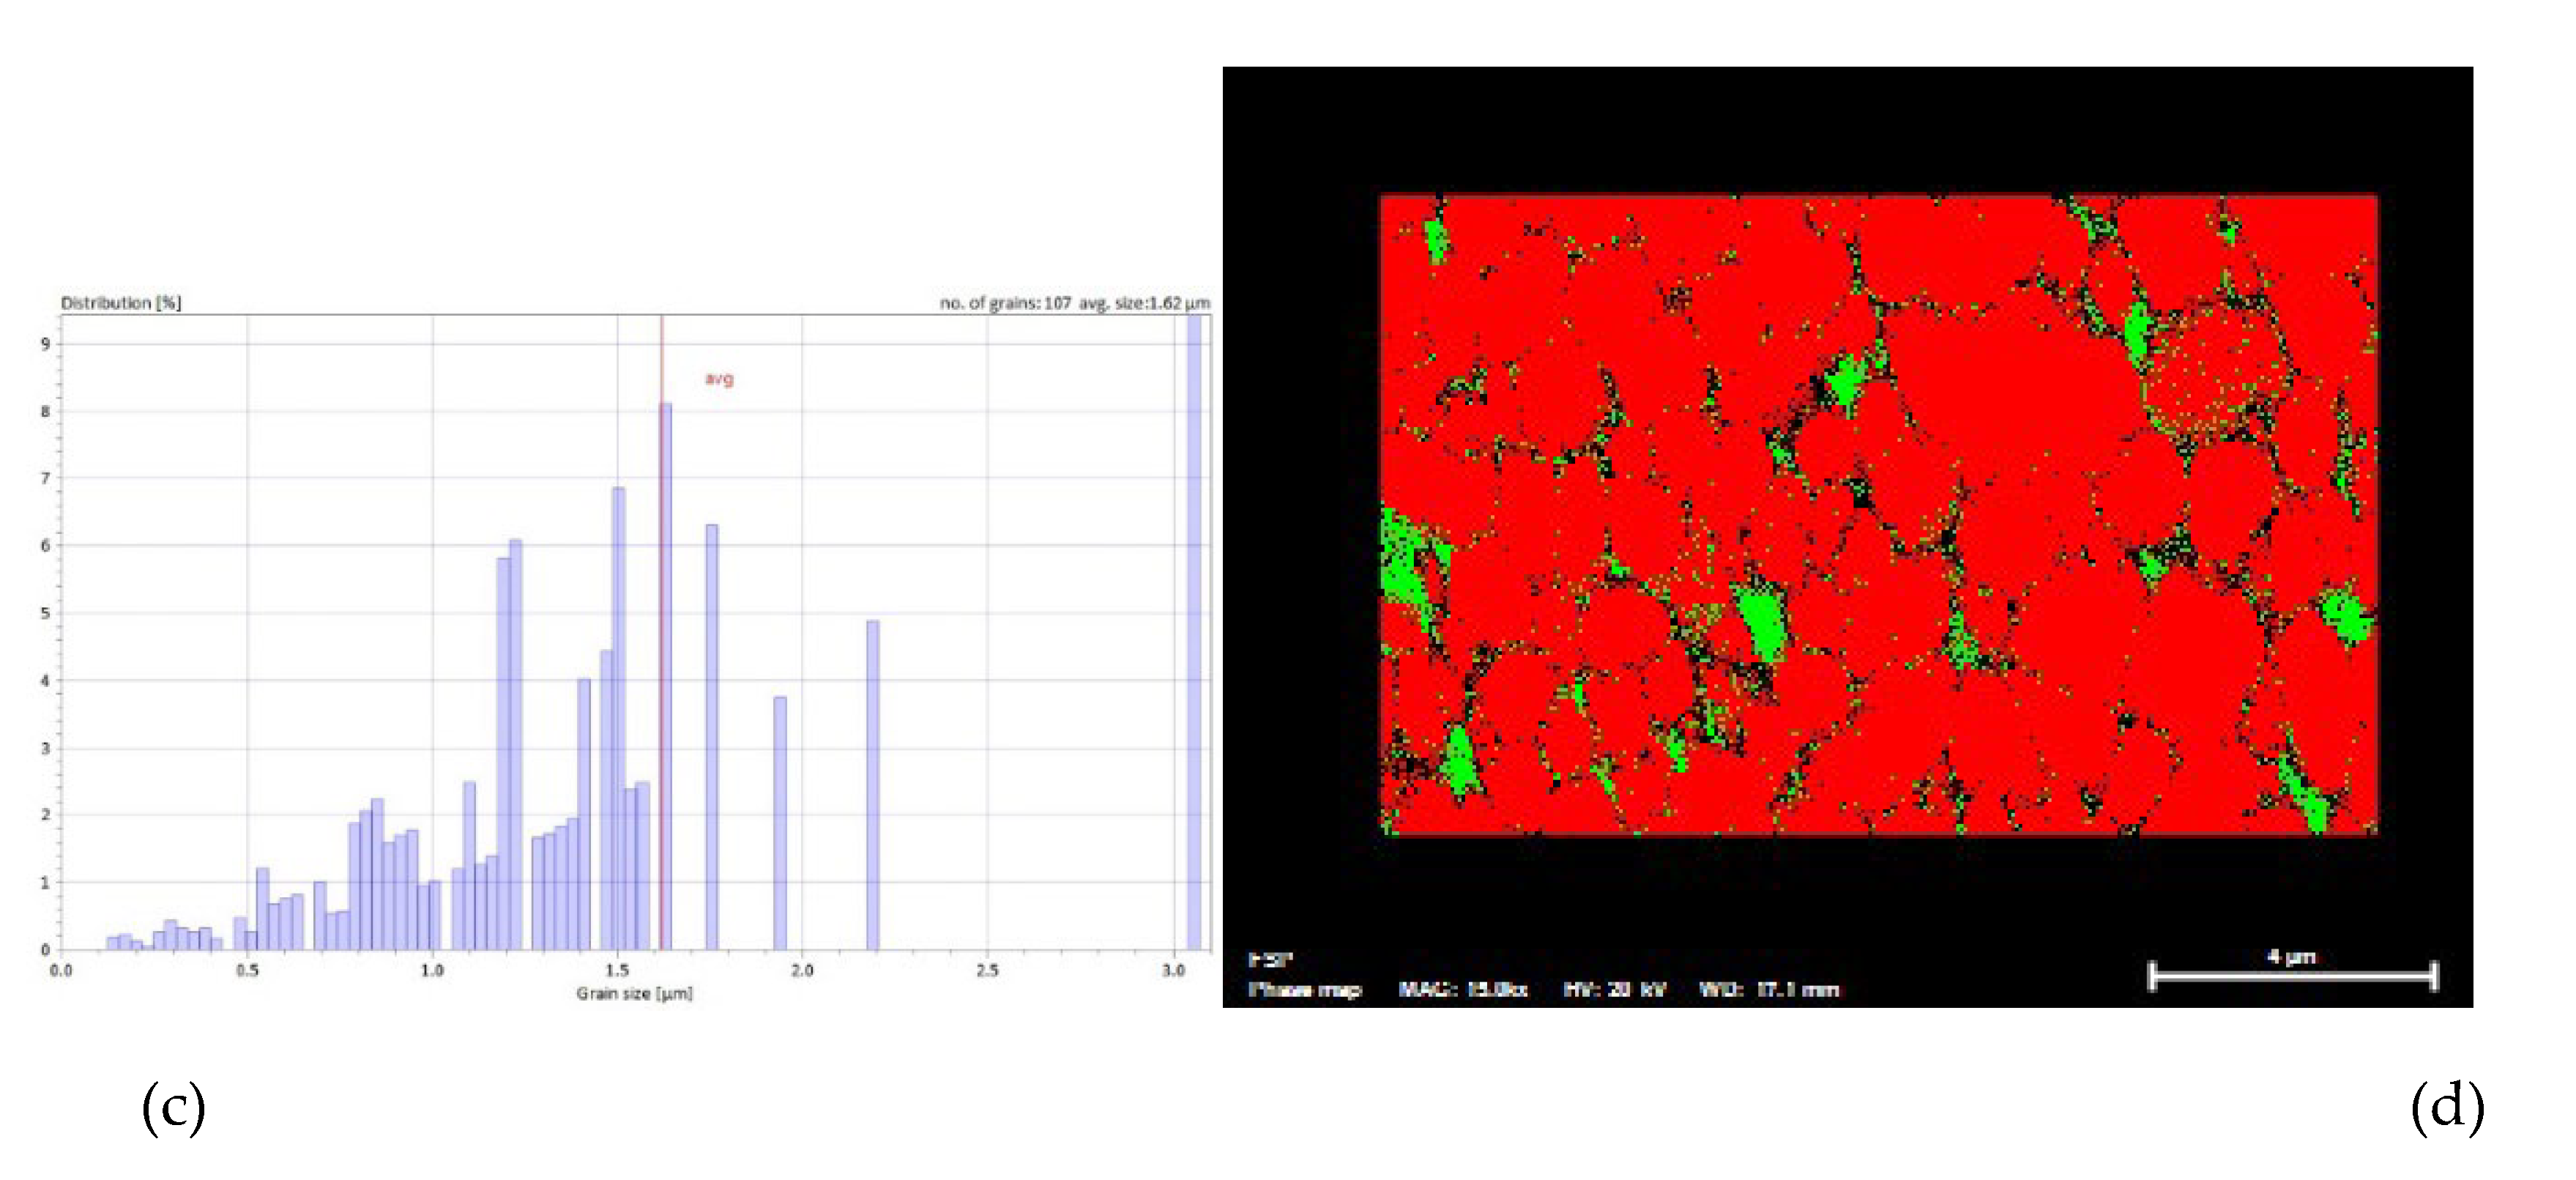
Figure 5b depicts the respective misorientation angle histogram. The large misorientation angles show that most of the grains are separate grains rather than subgrains. A grain size histogram referring to the same region is shown in
Figure 5c. The average grain size according to this histogram is 1.62 mm based on a sample size of 107 grains.
Figure 5d depicts a phase map image of the respective region shown in
Figure 5a. The red color represents the a-Ti phase, while the green color represents the b-Ti phase. The b-Ti phase is concentrated at the grain boundaries of the a-Ti but also appears as separate grains in a few cases.
Table 1 summarizes the tensile test results for five parent materials (PM), as well as for five FSP’ed specimens. It should be noted that the PM tensile test results have already been published elsewhere [
24] and are given here for the sake of comparison with the FSP’ed material.
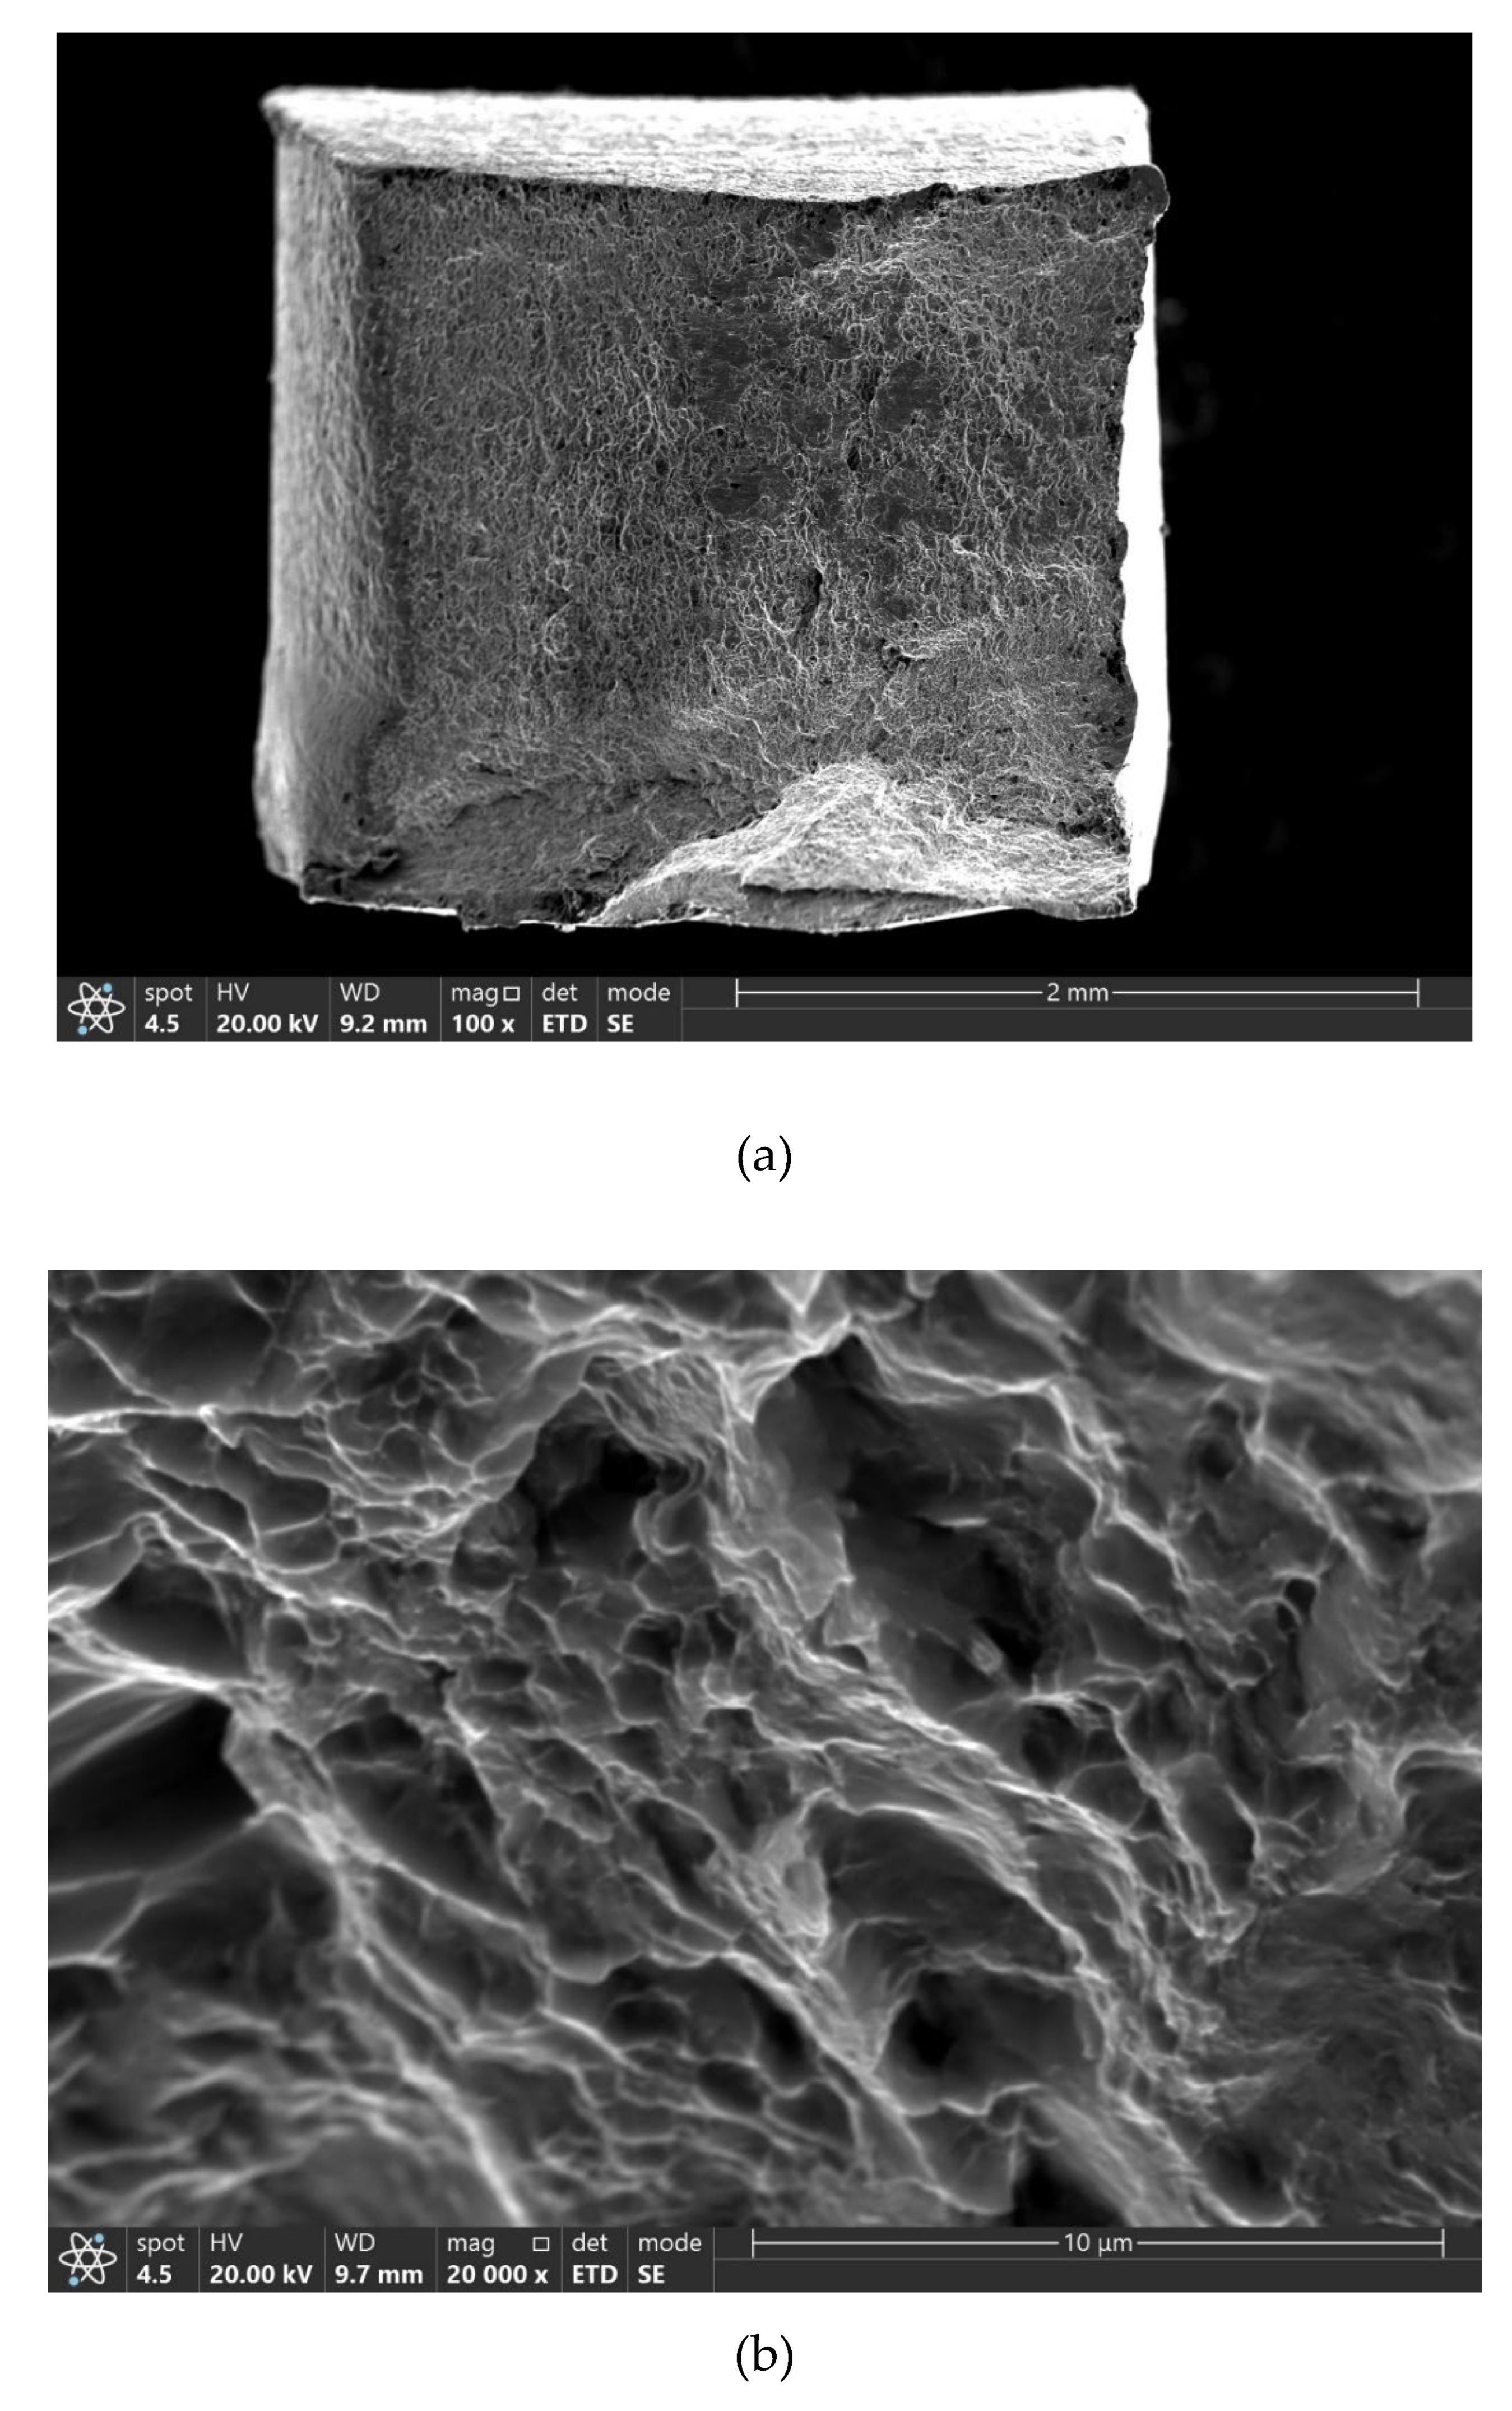
Figure 6a provides an SEM general view of the fracture surface of a broken FSP’ed tensile specimen, and
Figure 6b shows the region where the fracture was initiated under higher magnification. It is evident from
Figure 6a that the fracture surface had a ductile fracture character.
Figure 6a also shows that the fracture initiated at the lower right corner of the cross-section, as indicated by the arrow, and propagated upwards and left toward the middle of the cross-section. The size of the dimples shown in
Figure 6b varies from less than one micron up to 2-3 microns. No evidence of pre-existing cracks or other defects was detected.
4. Discussion
As stated earlier, the microstructure of FSW’ed Ti was studied and reported in detail in a previous publication by the authors [
24]. Keeping in mind that the microstructure of FSP’ed Ti corresponds to the stir zone of the FSW’ed material welded under the same parameters, it is evident that the average grain size of the FSP’ed material is similar to that of the SZ of the FSW’ed material, namely, several microns compared to the coarse equiaxed grains of the PM, which have an average diameter of 20-30 mm.
In the case of
Figure 2a, the bright bands mentioned above appear only at the upper half of the cross-section. Profiles 2 and 3 of
Figure 3a show that the average hardness of the processed material is around 200 HV0.2 with relatively small variations, in line with the findings of a previous study [
24]. Unlike profiles 2 and 3 of
Figure 3a, the microhardness values of profile 1, which was taken next to the upper surface where bright bands can be seen, are markedly higher and reach up to 483 HV0.2. In the case of
Figure 2b, no bands are discernible next to the lower surface. Moreover, the values of profile 3 in
Figure 3b are in good agreement with the hardness of the processed zone, whereas profile 2 and especially profile 1 show higher values that reach 539 HV0.2 (in the case of profile 1), correlating well with the existence and location of the bright bands. In the case of
Figure 2c, the entire cross-section contains bright bands, whereas all three microhardness profiles shown in
Figure 3c exhibit values higher than 400 HV0.2, in some cases even reaching 479 HV0.2. The conclusion is that the cross-section is non-homogenous along its depth axis as well as along its longitudinal axis. As shown in
Figure 1b, the dimensions of the cross-section of the gauge length of the tensile specimens were 3x3, in turn indicating that they were machined out from between -1.5 to 1.5 mm from the centerline. Keeping in mind that the diameter of the processing tool’s pin was 6mm, one can assume that the whole gauge length of the tensile specimens was within the stir zone (SZ). Nevertheless,
Figure 2 and
Figure 3 show that both the microstructure and the hardness properties of the tensile specimens differed markedly not only from one another but also along the longitudinal axis of each specimen.
A comparison of the hardness values of the bright bands mentioned above to the findings of other publications shows that they are significantly higher. Jiang et al. [
9] reported on hardness values of up to 190±10 HV, while Singh et al. [
10] reported on maximum values of 287 HV. The maximum hardness value according to Vakili-Azghandi [
11] was 269 HV after three consecutive FSP passes, while one pass yielded 199 HV. In another publication of Singh et al. [
13] the authors reported on maximum values of 248±20 HV.
The fine grain size detected within the bright bands seen in
Figure 4 leads to the conclusion that these bands are due to extensive grain refinement and therefore show increased hardness. It may be assumed, therefore, that these bright bands are due to a more extensive plastic deformation during FSP and hence, a more extensive grain refinement resulting from DRX. As stated earlier, many discrepancies exist among researchers regarding whether all three types of DRX, namely GDRX, CDRX and DDRX [
8], are the prevalent microstructure formation process mechanisms or whether the mechanisms are just CDRX and DDRX [
14] or Widmanstätten formation [
11]. Nonetheless, it seems that except for the bright bands, the microstructure of the PM as reported by the authors [
24] and the refined structure within the SZ are in line with the publications mentioned above.
Nevertheless, the above reported grain sizes are still coarser than the average grain size inside the bright bands as measured in the current study. The average grain size was found to be 1.62 mm based on a sample size of 107 grains (see
Figure 5c). As stated earlier, the high misorientation angles between the grains (see
Figure 5c) show that these are separate grains rather than sub-grains. This leads, in turn, to the conclusion that these grains were formed due to DRX taking place during FSP. The retained b phase at the grain boundaries, and in a few cases as separate grains as depicted at the phase map (see
Figure 5d), shows that the a-b phase transformation temperature of about 880
0C in the case of pure Ti was reached during FSP. Vakili-Azghandi et al. [
11] referred to the occurrence of a-b phase transformation at the SZ during FSP of pure Ti. Upon examining the influence of repeated passes, these authors reported that one pass resulted in a refined equiaxed structure while three passes yielded the formation of a Widmanstätten structure. However, the microstructure they reported is different than the one observed in the current study at the deformation bands, namely, a sort of a+b extra fine equiaxed grain microstructure.
Based on the findings reported in the current paper, the following qualitative model is proposed. The microstructure of these bands is a result of increased deformation during FSP, which in turn led to excessive DRX resulting in a higher degree of grain refinement. The a-b phase transformation temperature of 880
0C was reached during FSP so that the a-b phase transformation contributed, in turn, to a higher degree of grain refinement, as expected in the case of allotropic transformations. This sequence explains the existence of the extra-refined grains, while the rapid cooling yielded a retained b phase at the grain boundaries as well as separate b grains to a certain extent that comprise the microstructure shown in
Figure 5d.
As can be seen in
Table 1, both the yield strength and the ultimate tensile strength of the FSP’ed material were markedly higher than those of the parent material, while the elongation of the FSP’ed material was markedly lower. Taking the significantly higher hardness values of the bright deformation bands into account, one may assume that these bands are the strengthening constituent of the microstructure. It can also be assumed that the values of the yield strength and of the ultimate tensile strength are somewhere between the strengthening constituent, namely, the deformation bands, and the rest of the SZ, as in the case of composite materials. The larger scattering in the case of the FSP’ed material, especially of the ultimate tensile strength, may be related to the variations of the microstructure, namely, the size and distribution of the heavy deformation bands, as noted earlier. Nevertheless, even though the mechanical properties of the FSP’ed material are non-uniform compared to those of the PM, they are superior to the PM.
Figure 6a shows that the location of the fracture initiation point is close to the outer upper surface, where the deformation bands were detected. A comparison of
Figure 6b and
Figure 4 indicates that the size of the dimples seen in
Figure 6b fits the grain size within the deformation bands. It may be concluded, therefore, that fracture tends to start at the deformation bands. This is not surprising by itself because these recrystallized bands, besides being stronger, are expected to be less ductile than the rest of the material.
To summarize, the microstructure obtained by FSP of CP-Ti was found to be non-uniform. Clear evidence of DRX was revealed. Nevertheless, the cross-section contained certain regions that underwent a more significant DRX, in turn yielding a finer equiaxed grain microstructure. The size and distribution of these regions across the cross-section were found to change along the processed strip. The variance in size and shape of these extra fine-grained regions yielded variance in the mechanical properties of the FSP’ed material. These regions were also responsible for crack nucleation during tensile test. Yet as far as the RT mechanical properties are concerned, FSP yielded an improved structure compared to that of the parent material. Keeping in mind that, as stated earlier, the deformation bands are characterized by significantly higher hardness values than the rest of the SZ, in addition to a sort of a+b extra fine microstructure, it may be claimed that these bands have a different microstructure than the one expected at the SZ. This microstructure seems to be advantageous with respect to the common microstructure of the SZ. The practical question to be asked at this point is whether suitable processing parameters can yield an entire cross-section having this preferred microstructure. The next stage of the current study will focus on the creep properties of FSP’ed CP-Ti. Another important aspect that also should be studied is the stability of the microstructure of the deformation bands upon exposure to high temperatures.
