Preprint
Article

Simulation of the Impact of Humidity on the Species Generated by a One-Dimensional Discharge of Helium Gas

Altmetrics

Downloads

190

Views

67

Comments

0

Submitted:

11 May 2024

Posted:

14 May 2024

You are already at the latest version

Alerts
Abstract
Dielectric barrier discharge (DBD) plasma has several applications in different fields. One of these fundamental applications is medical usages, where various methods are employed to improve the plasma treatment process. The combination of different gases is one of the important strategies to improve the performance of plasma in treatment. In this paper, the optimized plasma parameters for one-dimensional radiofrequency discharge produced at low pressures in a helium gas combination is studied. In this research, the optimal combination of H2O and He is identified to attain the highest amount of reactive oxygen species (ROS). Considered mixture are 5,10,15 and 20 precent of H2O for one dimensional helium gas discharge. The results show that the parameters of the output plasma are highly dependent on the composition of the input gases. It is found that the greatest concentrations of H+, He+, Hes (excited helium), and OH/ densities are observed when the H2O percentage is 10%. Moreover, the density distributions of various species and the temperatures of electrons are numerically calculated during the electrical discharge process. These findings provide useful knowledge on how to optimize plasma parameters for biomedical applications, which may lead to improved treatment results in several therapeutic areas.
Keywords: 
Subject: Physical Sciences  -   Fluids and Plasmas Physics

Introduction

The plasma medicine is a relatively recent issue which offers novel approaches to treat a wide range of illnesses. Due to the unusual quality and extended range of medical applications, including bio-sterilization [1], skin regeneration [2], wound healing [3], teeth whitening [4], blood coagulation, cancer cells treatment [5,6,7], and engineering of biomaterials and tissues [8], cold plasma discharge produced at atmospheric pressure has paid more attention in recent years. Generally, cells, tissues, and organs can all be treated employing the so-called cold atmospheric plasmas. The term "cold" describes a crucial characteristic of particular types of plasma, such as the fact that the temperature of the ions and other heavy species present in the plasma is much lower than that of the plasma's electrons [9,10].
Dielectric barrier discharge (DBD) offers a higher intensity, more flexible, and regulated discharge in comparison to other plasma sources which is used by the majority of biomedical devices utilizing in the cold plasma discharge [11]. A lot of literatures has been focused on identifying and analyzing the plasma properties and active species during performing successful experimental research on atmospheric pressure plasma applications in surface treatment, engineering [12,13] processing technology, and sterilizing [14,15]. Additionally, different research groups have studied on simulating DBD plasmas at atmospheric pressure. For instance, Gadkari et al. [16] used a 2-D fluid model in COMSOL Multiphysics to simulate a co-axial DBD plasma reactor in pure helium. They examined how partial packing affected the helium dielectric barrier discharge's properties. In addition, Pan et al. [17] numerically studied on different features of the atmospheric-pressure CF4 plasma in a dielectric barrier discharge using the fluid model. They obtained the plasma parameters in steady state. Furthermore, Abidat et al. [18] investigated a one-dimensional model of atmospheric pressure helium gas dielectric barrier discharge with COMSOL Multiphysics simulation. They reported the effect of dielectric coefficient and distance between electrodes on Lissajous curve. Golubovskii et al. [19] used the numerical methods to study the spatiotemporal properties of the homogeneous barrier discharge in helium. They utilized a one-dimensional fluid model to investigate how the main processes affect the discharge via rate constants. Moreover, they extracted the plasma parameters in steady state.
Enterally, combining gases is one of the key methods to enhance the plasma performance in medical applications [20,21,22]. This is because using different gas combinations can produce other active species that are beneficial for medical applications. Employing various types of gases with different compositions is one of the ever-toughest techniques in plasma modeling. Therefore, in this study, a simulation is performed for exploring of inlet gas combination portion in cold plasma. Different portions of H2O are mixed with helium gas and plasma characteristics had been investigated. As a result, the best and effective combination of these two gases was determined for medical applications.

Theoretical Equations

DBD Simulations in Sterilization Process

In this section, the governing fluid dynamic equations in the DBD simulation for sterilization purpose are described. In order to account for the reactions of various species, and as well as the rate of production and losses at the electrode surfaces, surface chemistry was applied [23]. The pair of propulsion and propagation equations were solved to compute the electron density and electron mean energy. The electron continuity equation and the flow equation can be explained by equations (1) and (2), respectively as below:
n e t + . Γ e = R e u . n e
Γ e = ( μ e . E ) n e D e . n e
where, n e represents the electron density, E is electric field, D e indicates the electron diffusion coefficient, Γ e   is electron flux, u is average species fluid velocity, and R e represent the rate of electron creation.
It should be mentioned that two terms construct the electron flux: i) one term is originated from the electric field, and ii) the other is created from the density gradient. Equation governing on the electron energy density can be calculated by:
n ε t + . Γ ε + E . Γ ε = R ε ( u . ) n ε
Γ ε = ( μ ε . E ) n ε D ε . n ε
where the energy received by the electron from the electric field is denoted by the E . Γ ε . In addition, the energy rate resulting from inelastic collisions can be expressed by the following equations:
R ε = S e n + Q + Q g e n q
D ε = μ ε T D e = μ e T e μ ε = 5 3 μ e .
In above equation, u e is the energy mobility, and Q g e n is the thermal source, S e   is the power dissipation, Q is the primary source of heat, and q is the electron charge. It should be mentioned that due to knowing that the electron source could be determined from the Townsend coefficients must be used as:
R e = j = 1 M x j a j N n Γ e
where, M is the number of reactions, x j is the molar percentage of the target species for the reaction j , a j is the Townsend coefficient for the j process, and N n is the total number of the neutral species considering that p is the number of non-elastic collisions of an electron.
R ε = j = 1 p x j a j N n Γ e Δ ε j
here, Δ ε j represents the energy released through the j reaction. Generally, for each mass fraction in non-electron species, the following equations must be solved:
ρ w k t + ρ ( u . ) w k = . j k + R k
where, w k is the ion density and J k is the ion energy flow. The equation (10) can be utilized for determining the electrostatic field as follows:
. ( ε 0 ε r E ) = ρ
where, ε r is the relative dielectric constant and ε 0 is the permittivity of the vacuum. The following equations explains the boundary conditions for electron flux and energy flux as bellows:
n ^ . Γ e = ( 1 2 υ e t h n e ) p γ p ( Γ p . n ^ )
n ^ . Γ ε = ( 5 6 υ e t h n e ) p ε p γ p ( Γ p . n ^ )
The electron is produced according to secondary emission, as shown by the second term on the right side of Eq. (11) Here, γ p is the secondary emission coefficient. It should be noted that the second term in equation (12) is the secondary emission energy flux, where ε p is the mean energy of the secondary electrons.
Ions and excited species are neutralized particles on the electrode surface through the surface reactions. The coefficient β j which determines the probability of j species functioning is used to imitate the surface interactions on the electrodes. The conjugation equation for the discharge's ion species is expressed as follows:
n i t + . ( n i u ) = . ( μ i n i q i φ D i n i ) + S i
where, φ and S i show the electrostatic potential and the rate of variation of electron density, respectively.

Chemical Model

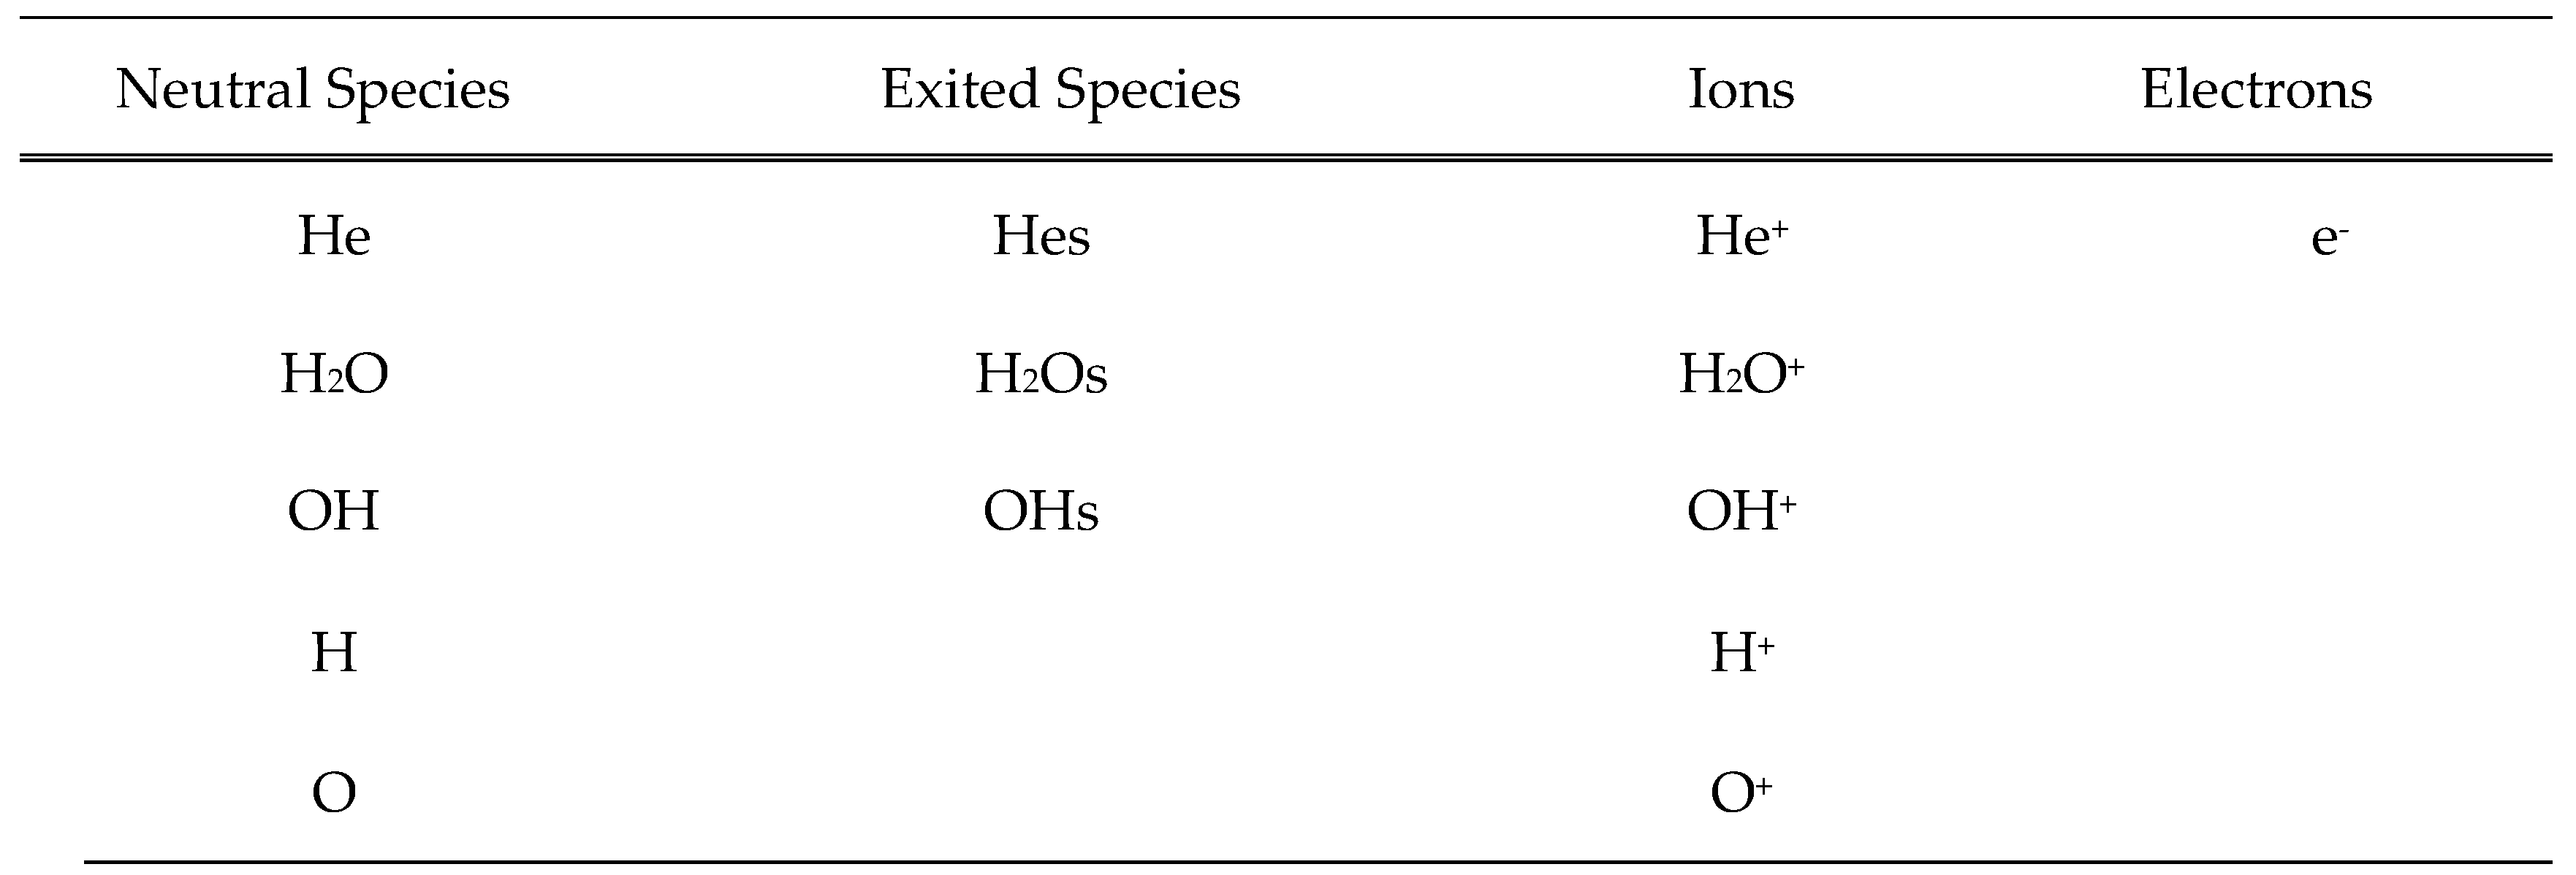
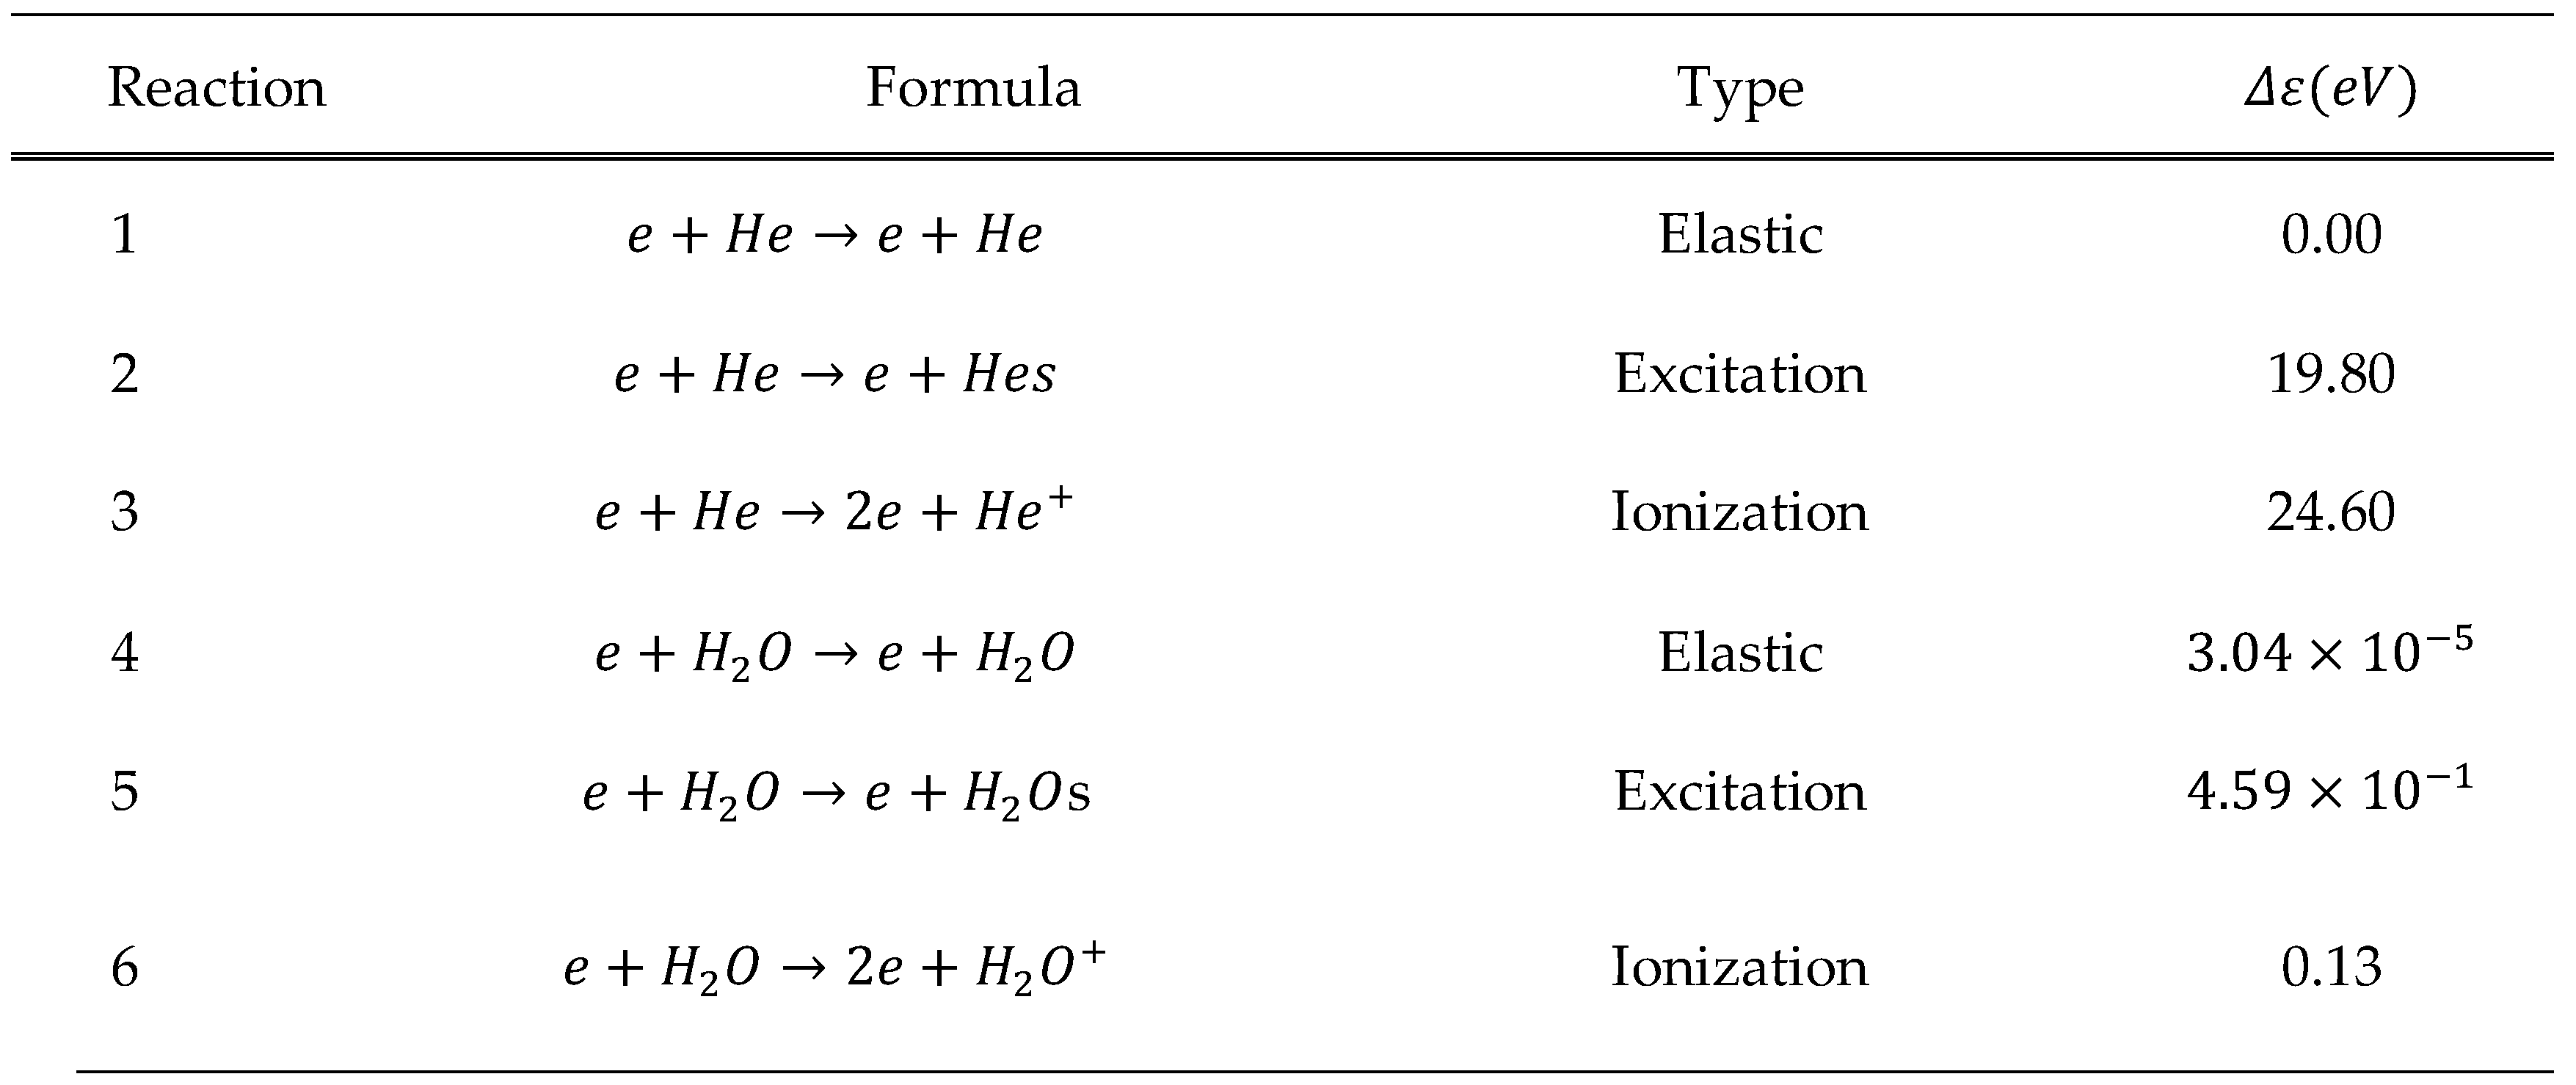
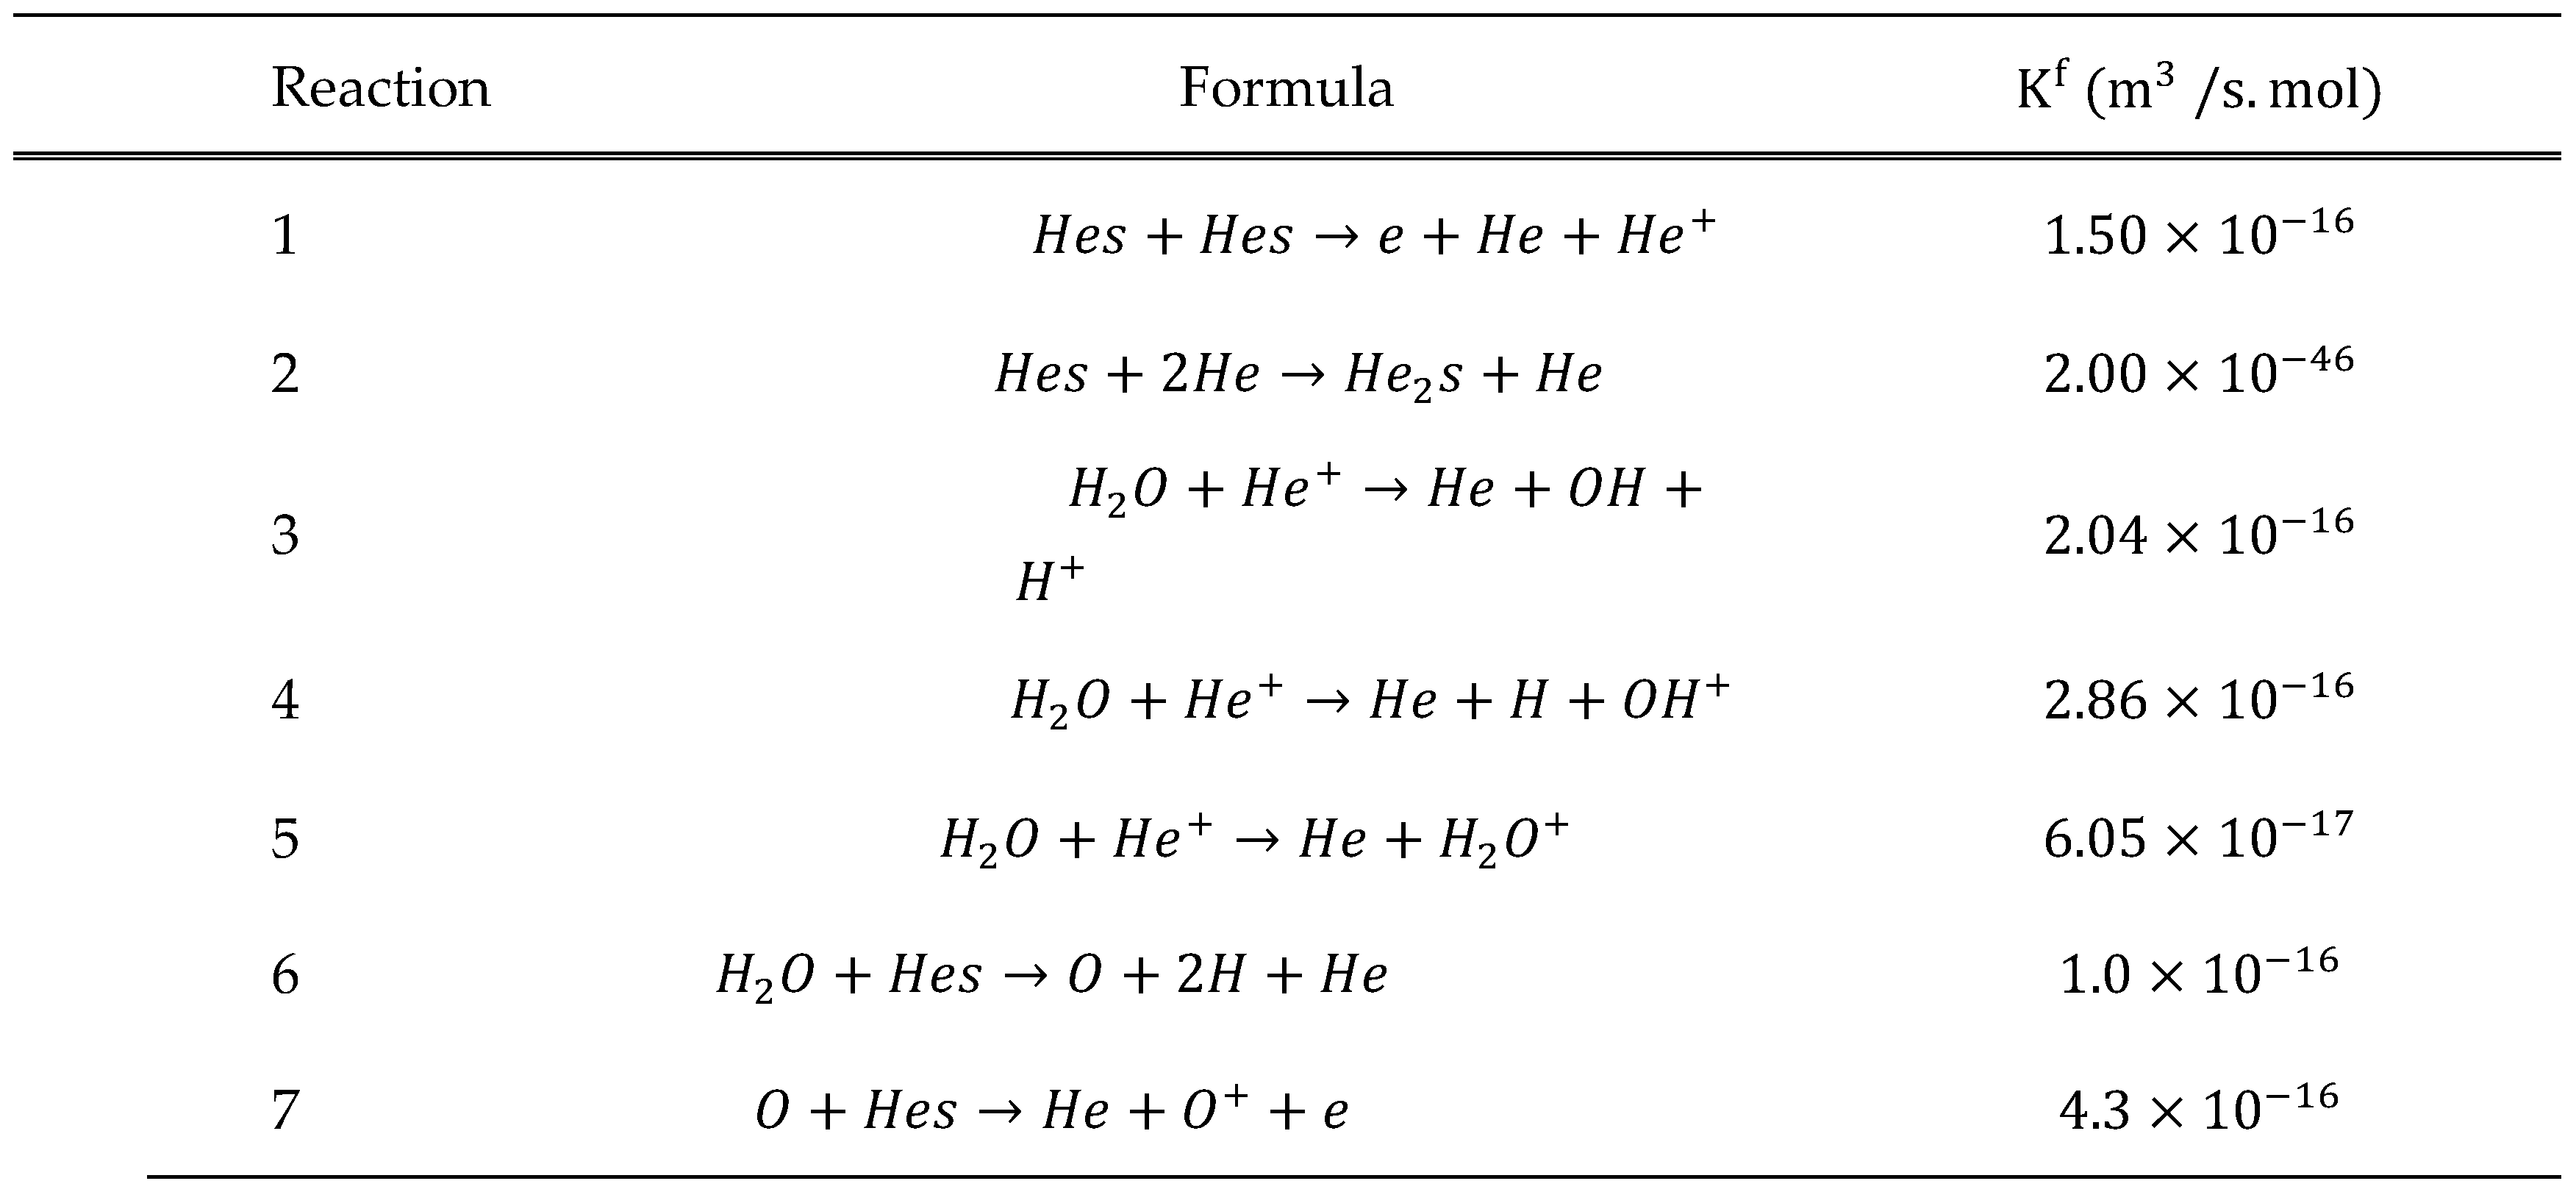
This model incorporates the ground-state species of helium atoms (He), steam molecules (H2O), OH molecules, and hydrogen atoms (H). Additionally, excited species above the ground state level have been taken into account. These include helium atoms (Hes), steam molecules (H2Os) and OH molecules (OHs), respectively. Moreover, helium ions (He+), H2O ions (H2O+), hydrogen positive ions (H+), OH positive ions (OH+), Oxygen atom (O) and electrons (e) have been considered. These species are extremely important due to their presence and applications in He-H2O plasma which has been discussed in experimental works [24,25,26,27]. The different species included in the plasma model are listed in Table 1. In total, 14 plasma species and 19 distinct processes are all involved in the He–H2O mixture. In this model, Table 2 and Table 3 provide an extensive overview of the possible reactions that were taken into consideration for helium and H2O species.
Generally, surface interactions enable heavy species, such as positive ions, atoms, and metastable atoms to be transferred to the reactor wall. Since negative ions are unable to escape from the ambipolar field or reach to the reactor walls, no surface reactions are required. It is noticed that the only way to extract negative ions from the plasma is interaction with positive ions. This model includes the surface reactions listed in Table 4. Moreover, the decay coefficient rate for neutral particles to the wall surface is calculated using the sticking coefficients.

Boundary Conditions and Reactions

In this research, the initial magnitude of the electron density in the plasma is constant equal to 1 × 10 13 m 3 , and the densities of neutral species of helium and water molecules are initially considered constant at fractional scales. In addition, the temperature of the gas is considered equal to the room temperature i.e., 300 K. The initial electric potential is in ground state condition i.e., as 0 V, and the initial mean electron energy throughout the whole domain is considered as 5 V. Moreover, the discharge is powered by a Sino negative voltage power source at 750 V.
Here, a dimensional axisymmetric model is utilized to describe the electrical and energetic characteristics of the RF discharge in the He/H2O combination. The finite element method is employed for calculating different plasma parameters.
In this research, the simulation's material elements are defined in the air medium by considering the species' pertinent reactions. The Boltzmann's equations are solved and using the cross-sections from the LXCAT data source [30], rate coefficients were determined. The reaction rates are extracted from different references [24,25] as mentioned in above tables. One of the electrodes is used in this insulation simulation, and the other one is the same of that.
Here, the electrodes are circular plates with a diameter of 0.1m. All sections have a predetermined spacing of 2 × 10 4 m between the electrode and the insulation, which is the empty area where plasma production occurs. The computational environment for implementing one-dimensional reactor geometry and the related meshes is depicted in Figure 1. Here, the dielectric distance is 1 × 10 4 m . For the meshing of the discharge space, a mesh with a symmetrical distribution with element number of 200 and rate of 5 is used. Moreover, for the dielectric space, it is selected from the predefined (extremely fine) mesh with maximum element size of 3 × 10 6 m .

Results and Discussion

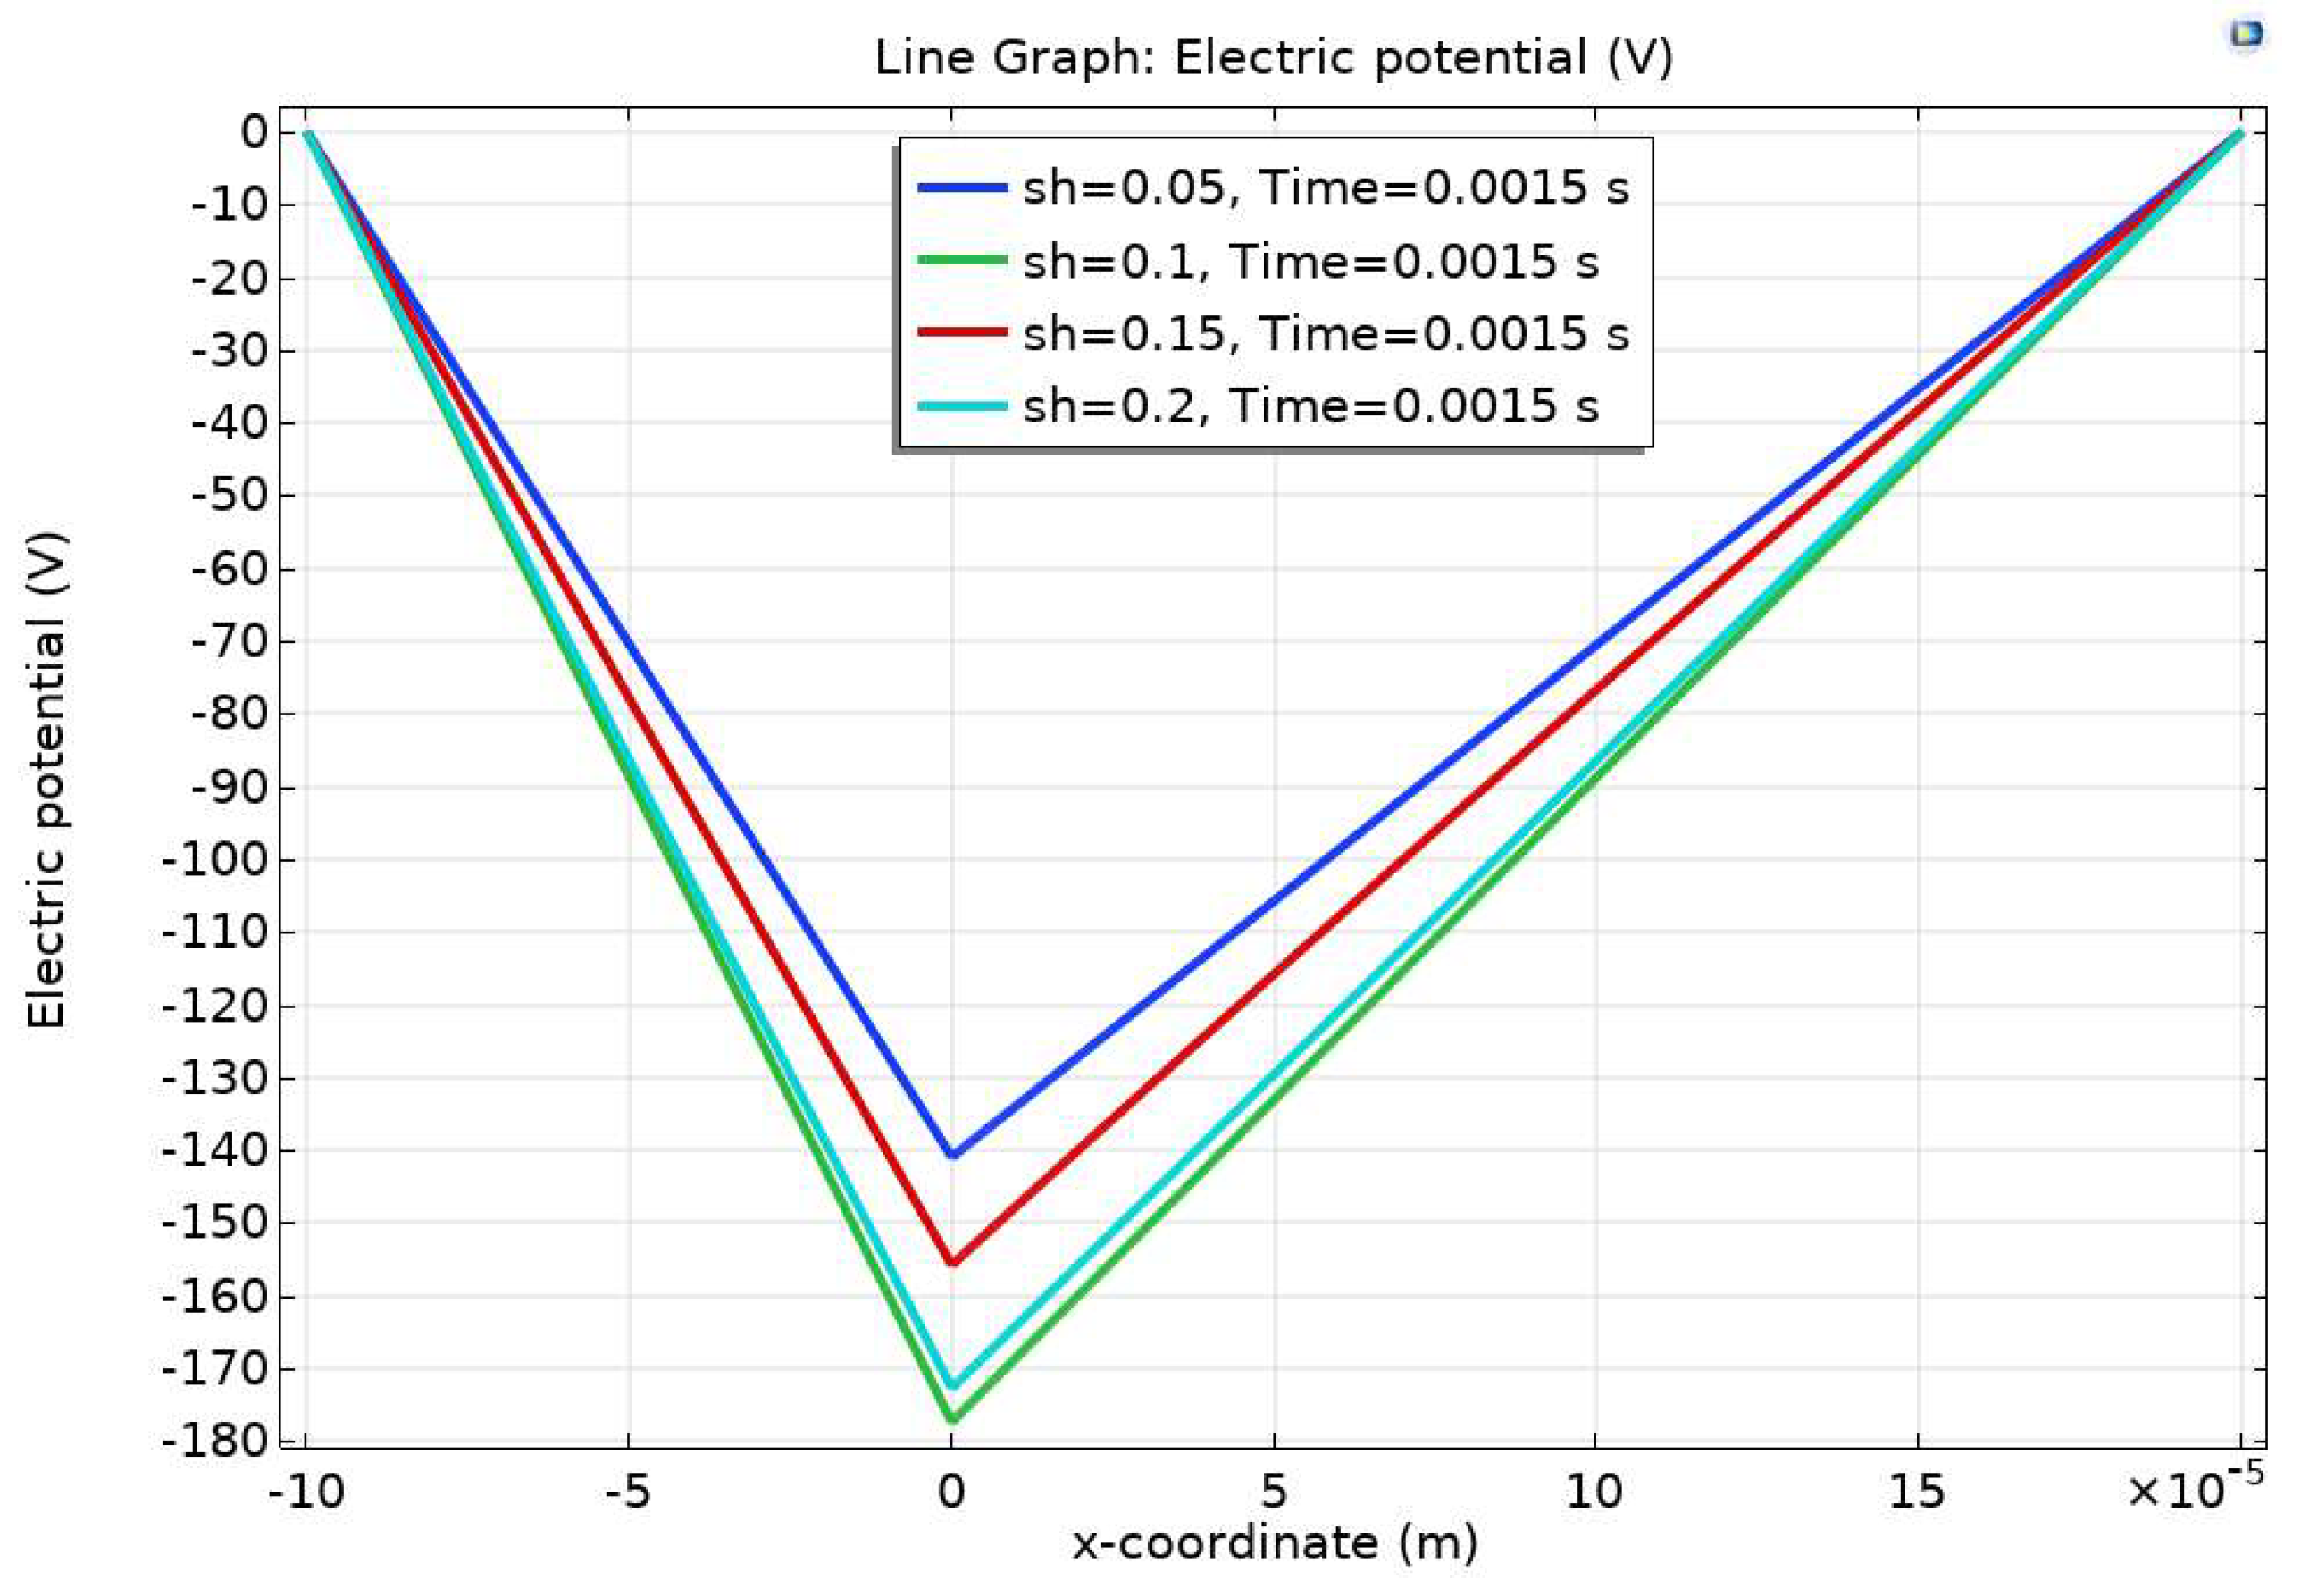
As referred in different [31,32] the electron density and its temperature have a significant impact on medical applications. Therefore, in this paper, the main purpose is finding the optimized plasma parameters for utilizing in biomedical surface sterilization. Here, the plasma is a radiofrequency discharge operating at 1 atm pressure. Furthermore, about 20% of the gas combination is made from H2O. As a first step, the evolution of the electric potential as a function of distance is shown in Figure 1, in the various percentages of He + H2O mixtures like: He + 20% H2O, He +15% H2O, He +10% H2O, and He + 5% H2O at 0.0015 s. As it is clearly seen in this figure, a concavity is observed in 0. Moreover, the highest magnitudes of electric field are related to He + 5% H2O mixture.
Figure 2. The evolution of the electric potential versus distance, for various percentages of H2O mixtures of 0.05, 0.10, 0.15, and 0.20.
Preprints 106288 g002
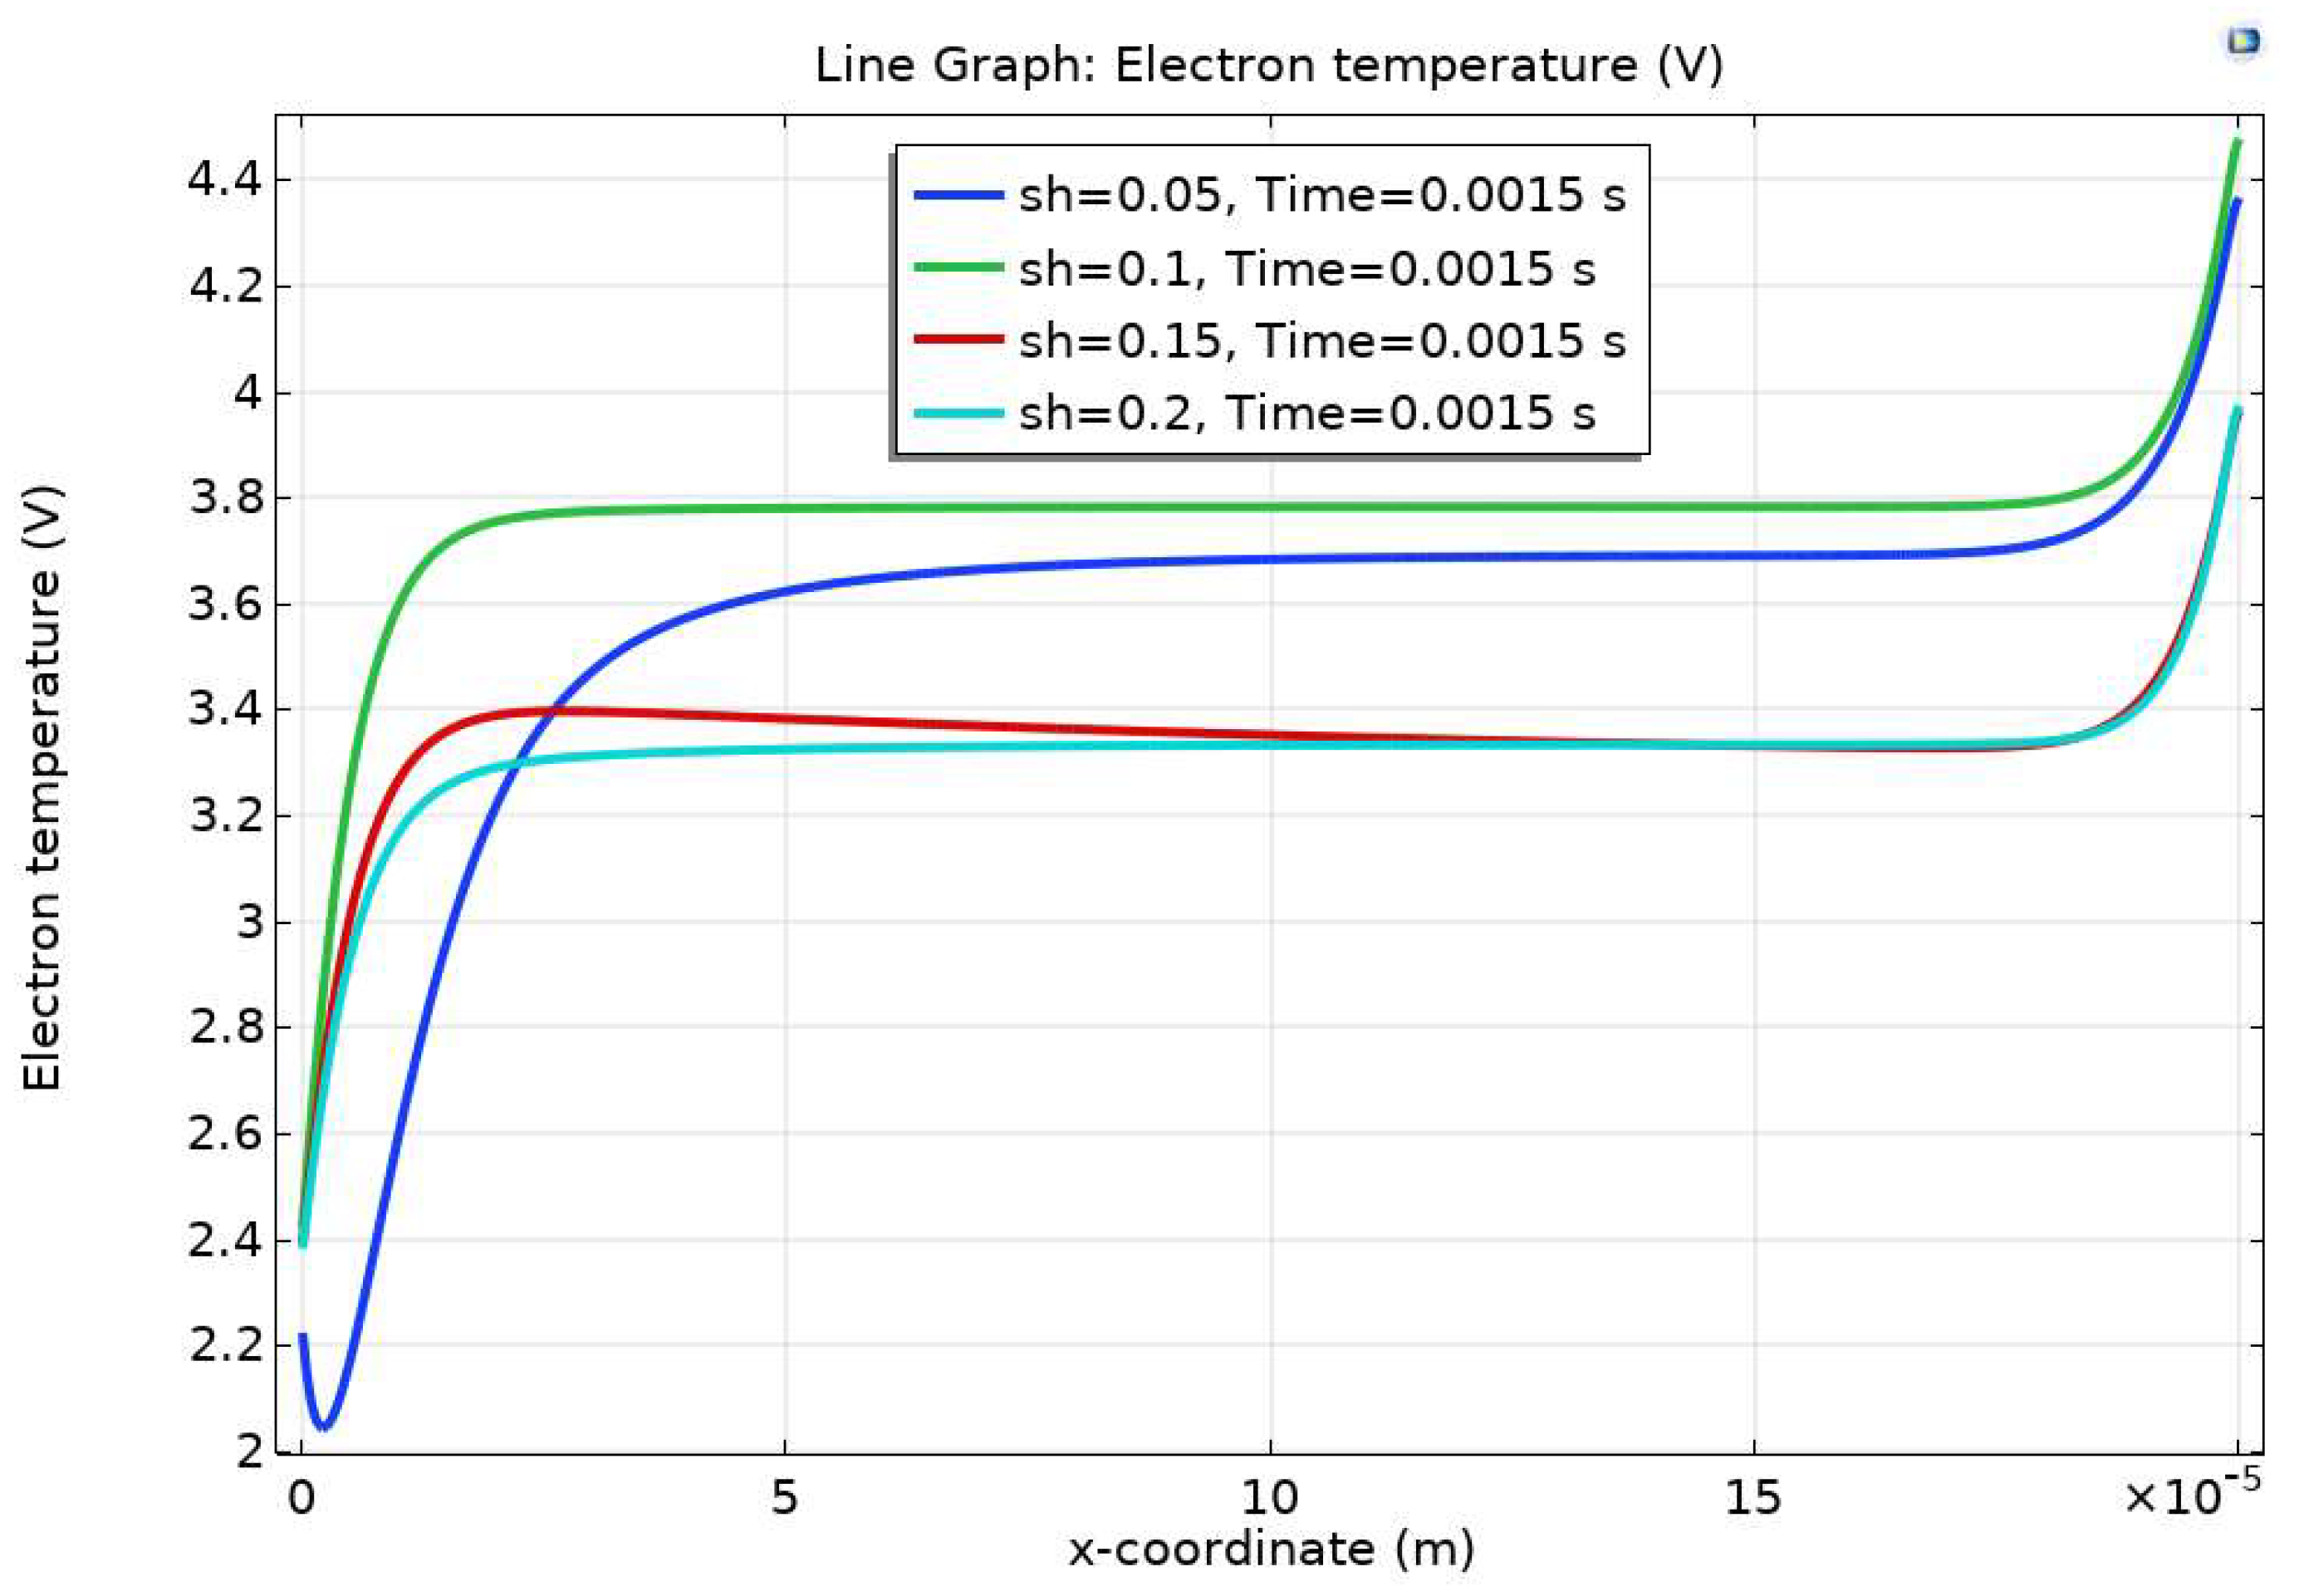
In addition, spatial distribution of electron temperature is presented in Figure 3 as a function of different percentages of H2O (5, 10, 15, and 20 %). As it is obviously seen in Figure 3, the maximum magnitude of temperature is happened at sh=0.1. Moreover, at lower positions, a minimum is observed especially at 0.05, but it will be vice versa at higher positions or near to electrode.
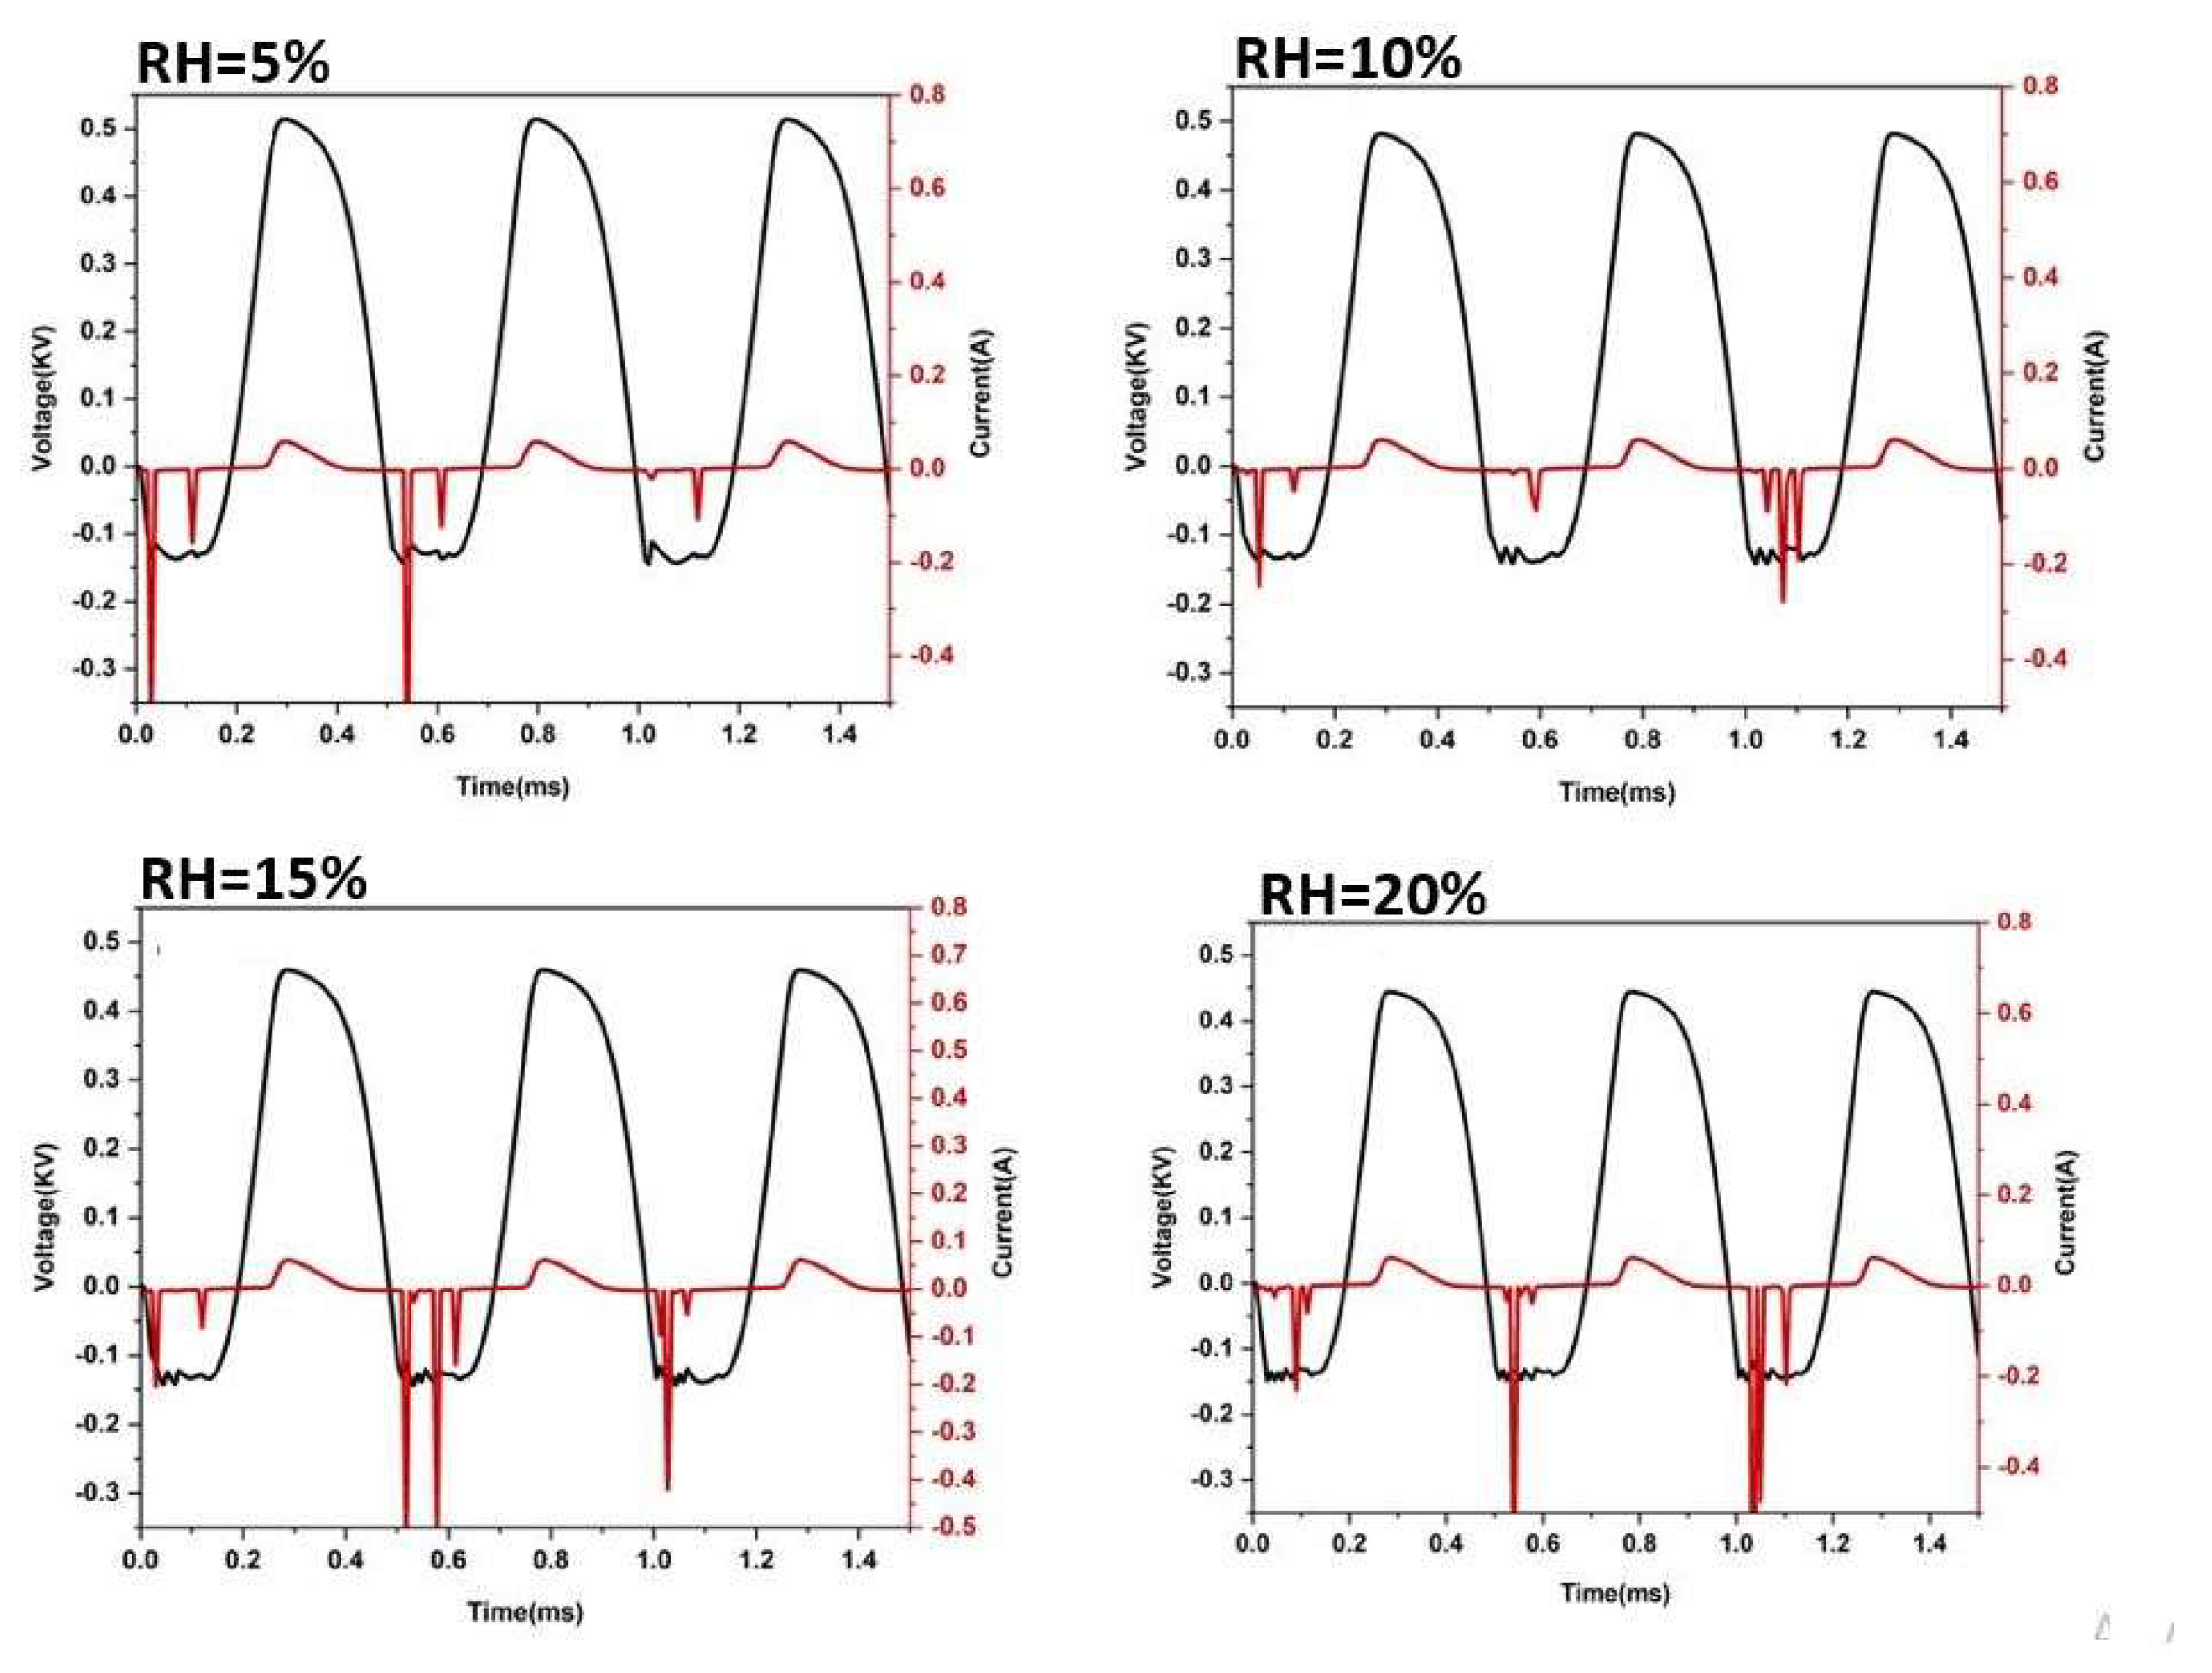
A comparison among various voltages and currents of different percentages of H2O mixture in He gas is presented in Figure 4. As shown in this figure, an oscillational behavior is appeared for voltage variations. According to the Figure 4, the lowest electric current is obtained at the humidity level of 0.1, which can be caused by more electron collisions at this humidity level, where fewer electrons reach the opposite surface and less current is obtained. These collisions lead to the production of electrons and the density of more positive species. The accumulation of heavy species causes the deviation of electrons and causes fewer electrons to reach the opposite plane.
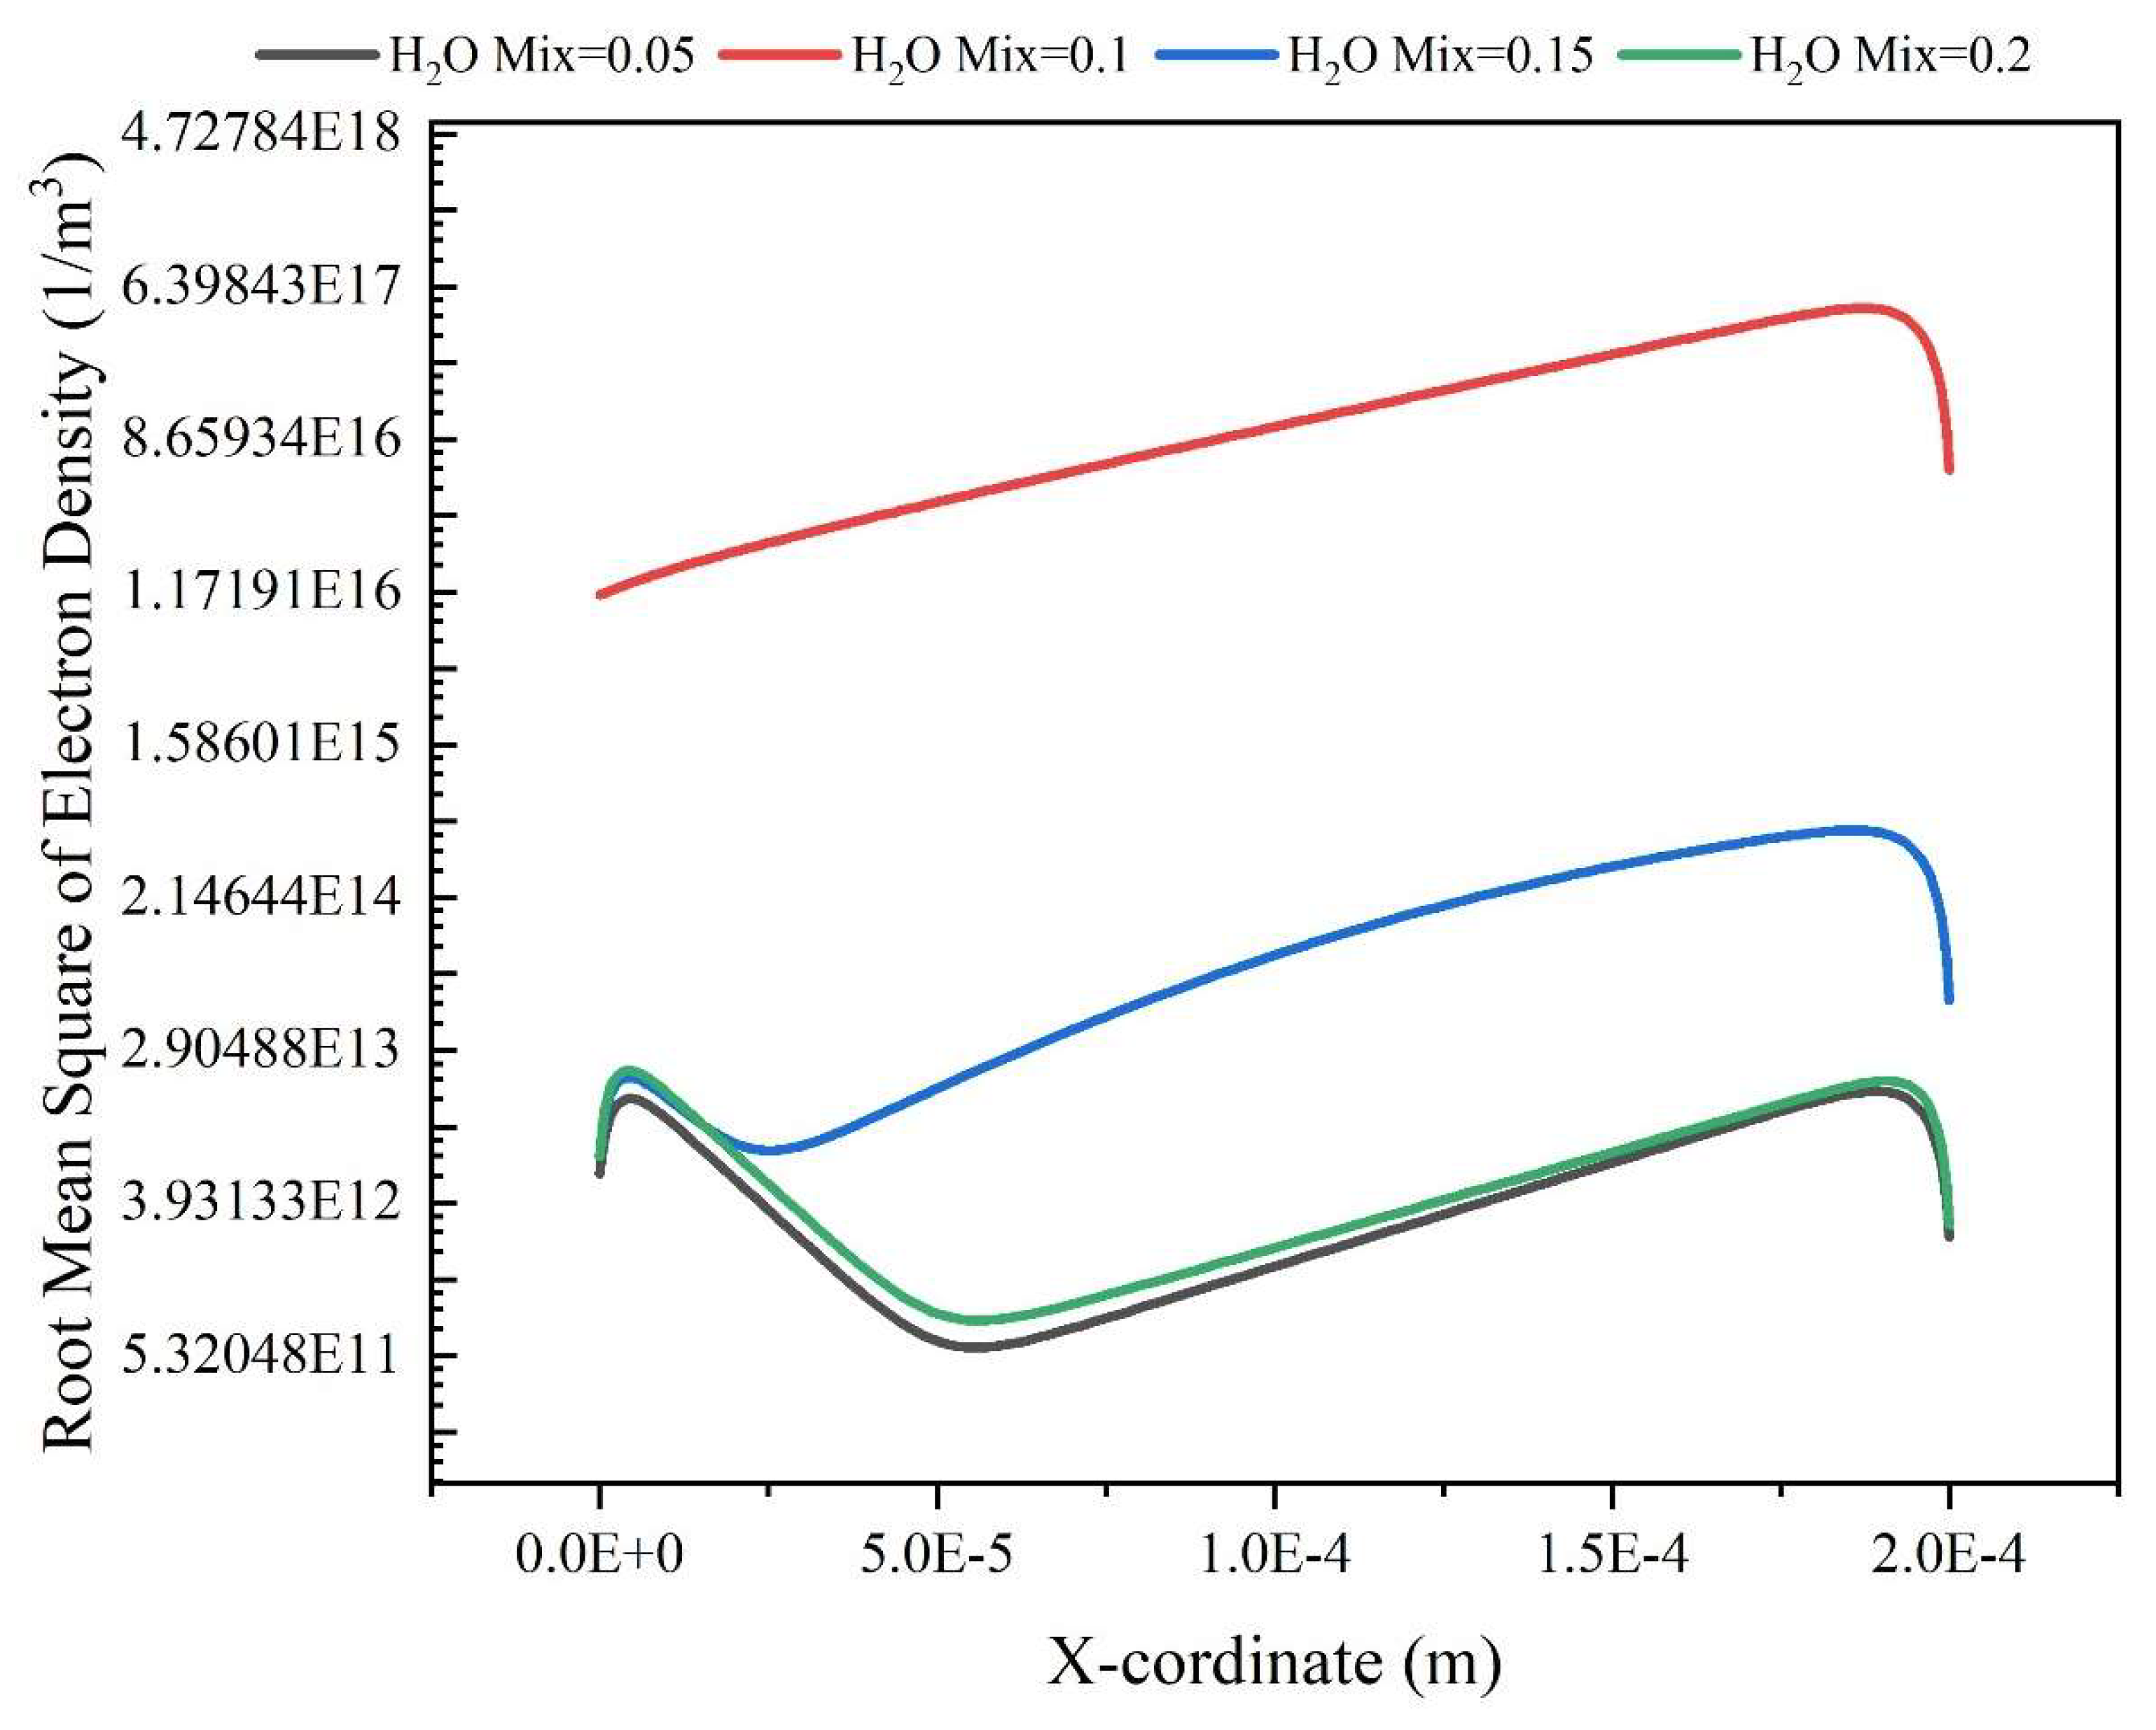
FIGURE 5 represents the Root Mean Square (RMS) variations of the electron density for different mixtures of H2O in He gas as a function of distance. A similar trend in magnitudes as seen in Figure 3 can be observed in Figure 5 too. On the other hand, the greatest values in the electron density occur for 0.1 of H2O similar to the case of the maximum magnitudes of the electron temperature. In all mixtures, after x=5.0E-5, a growth in electron densities is presented, while a downward trend is shown near to electrode surface. Moreover, a minimum in density is observed for whole H2O mixture except to 0.1.
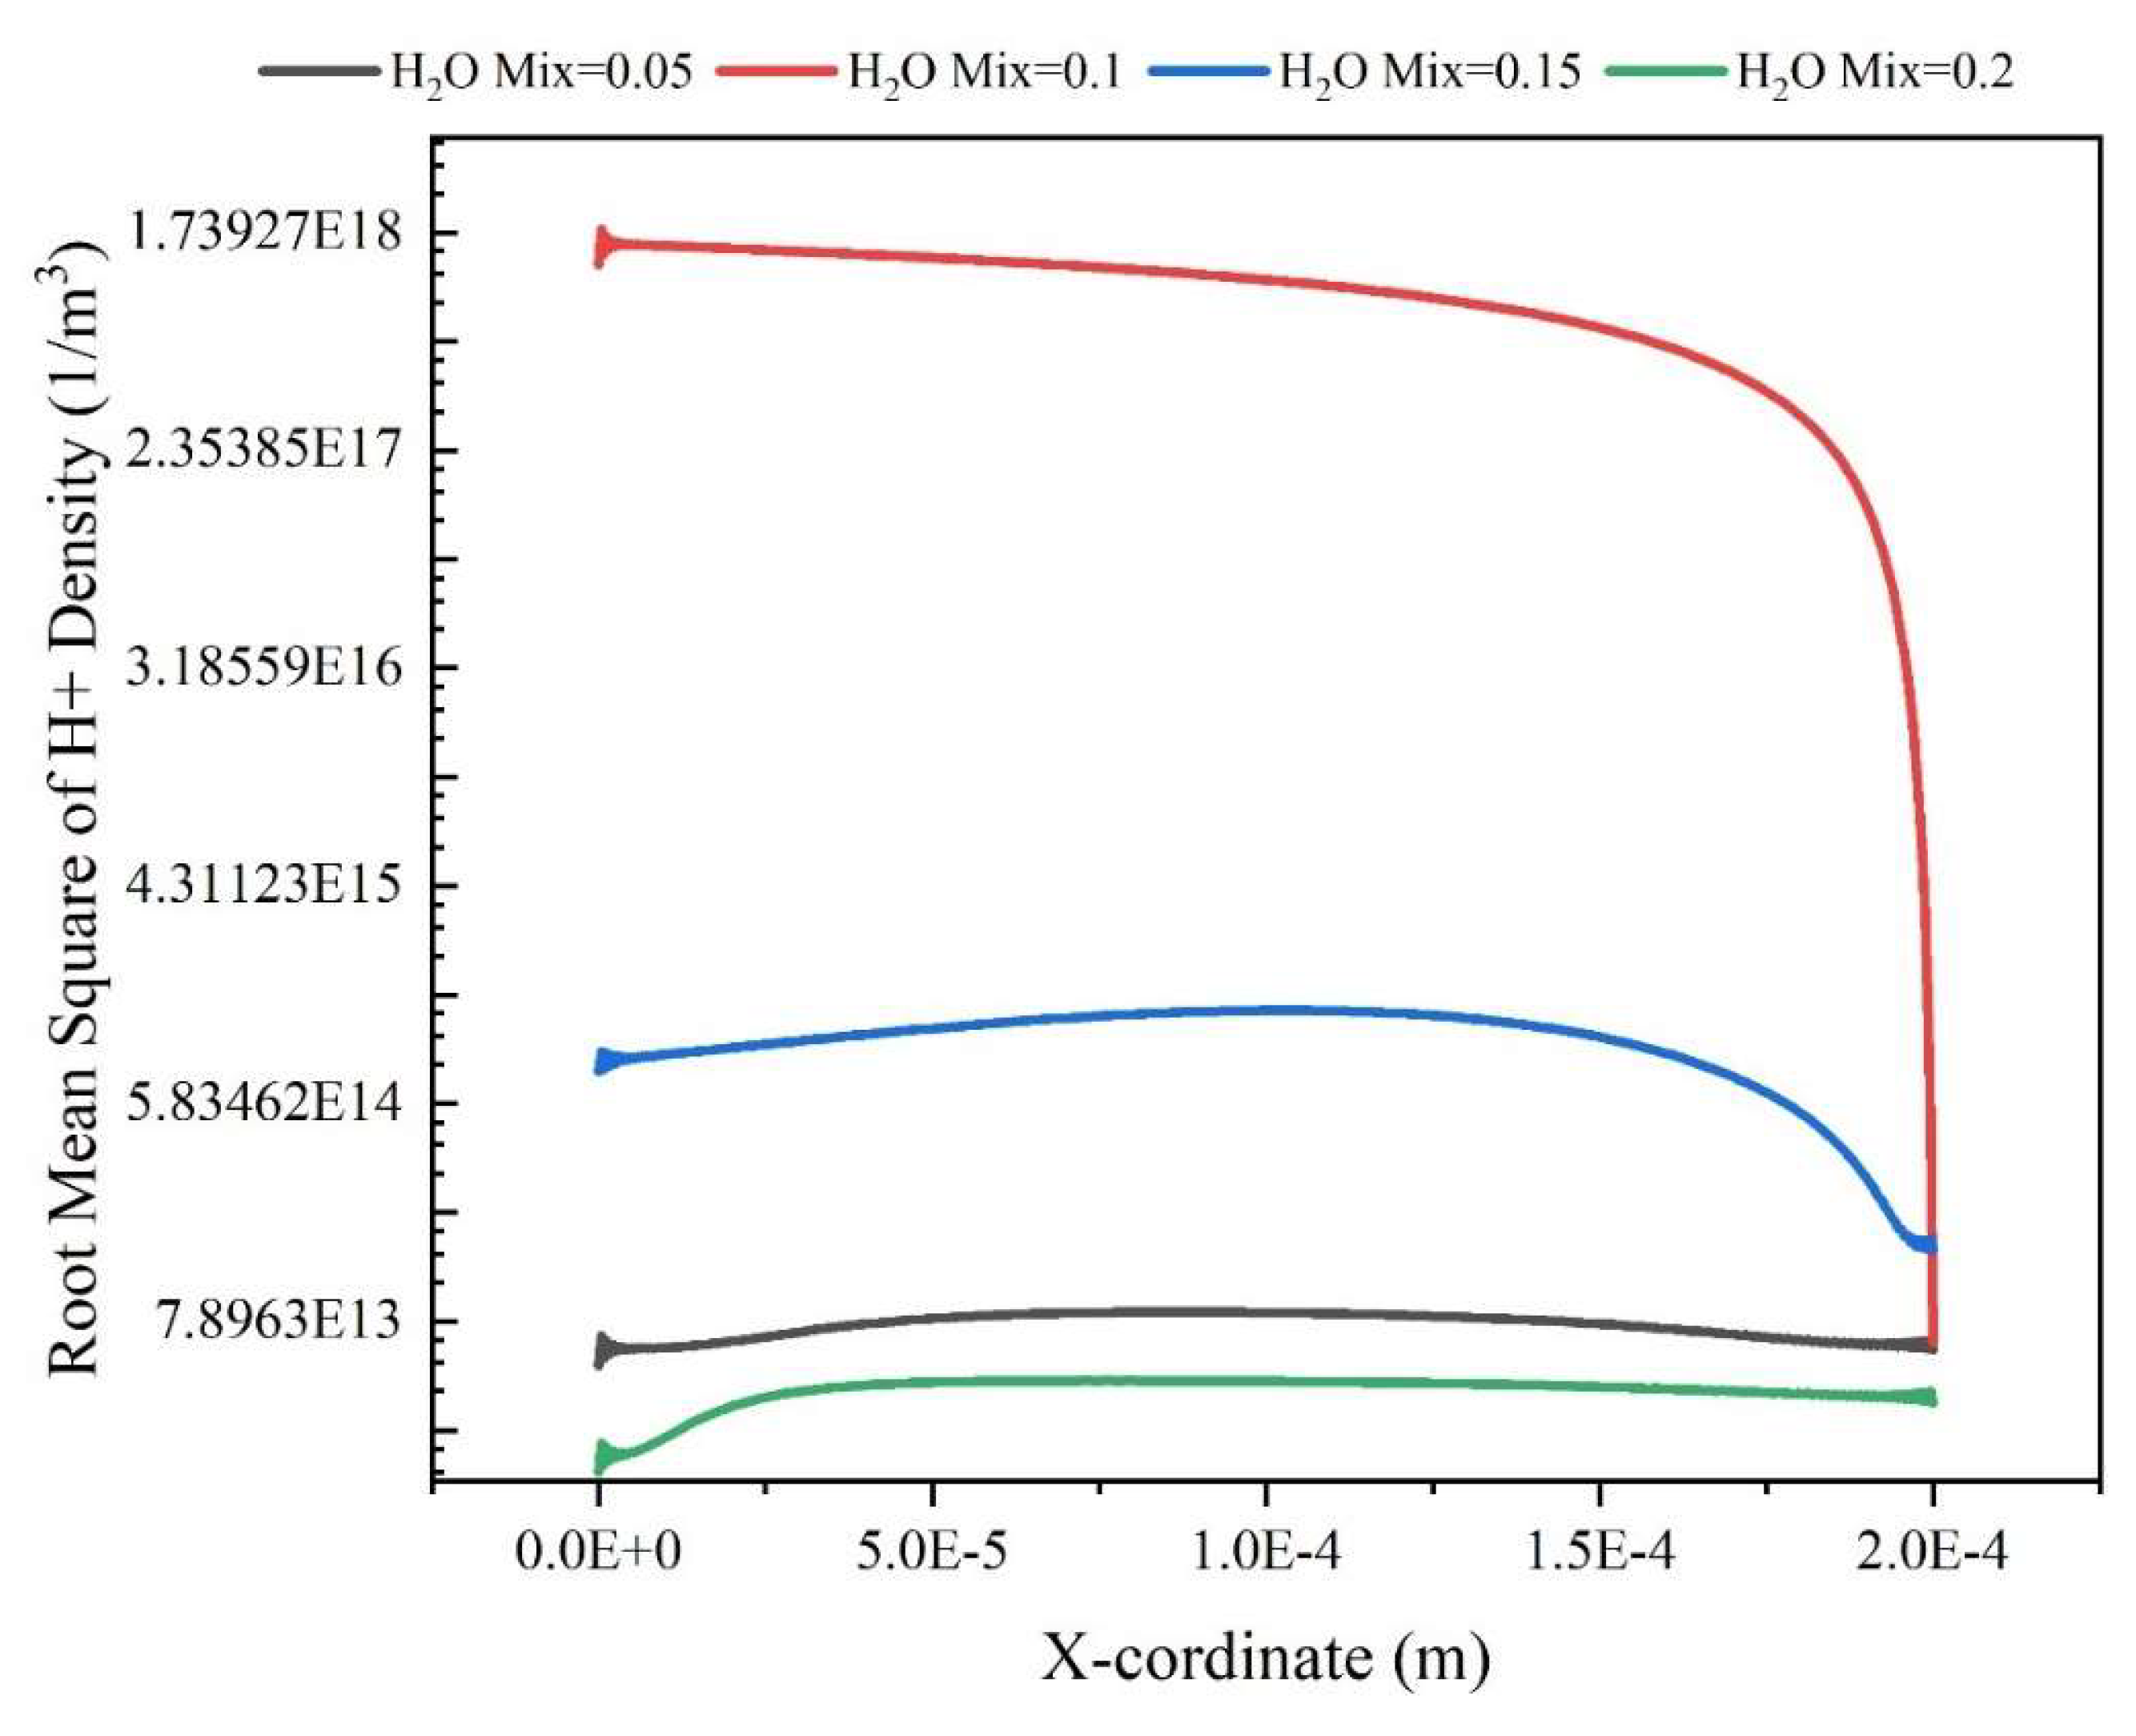
The RMS distribution of H+ density for various H2O mixtures in the He gas are shown in Figure 6 as a function of distance. As it is seen in this figure, the greatest magnitude of H+ density occurs at 0.1 H2O and then, a sudden downward trend is observed in this concentration. Furthermore, for two mixtures of 0.1 and 0.15, a decrease in H+ densities are observed in x=2E-4, i.e. in the vicinity of the electrode surface. The numerical value obtained for the electron density for an atmospheric pressure plasma is in good agreement with previous simulation and experimental works [33,34].
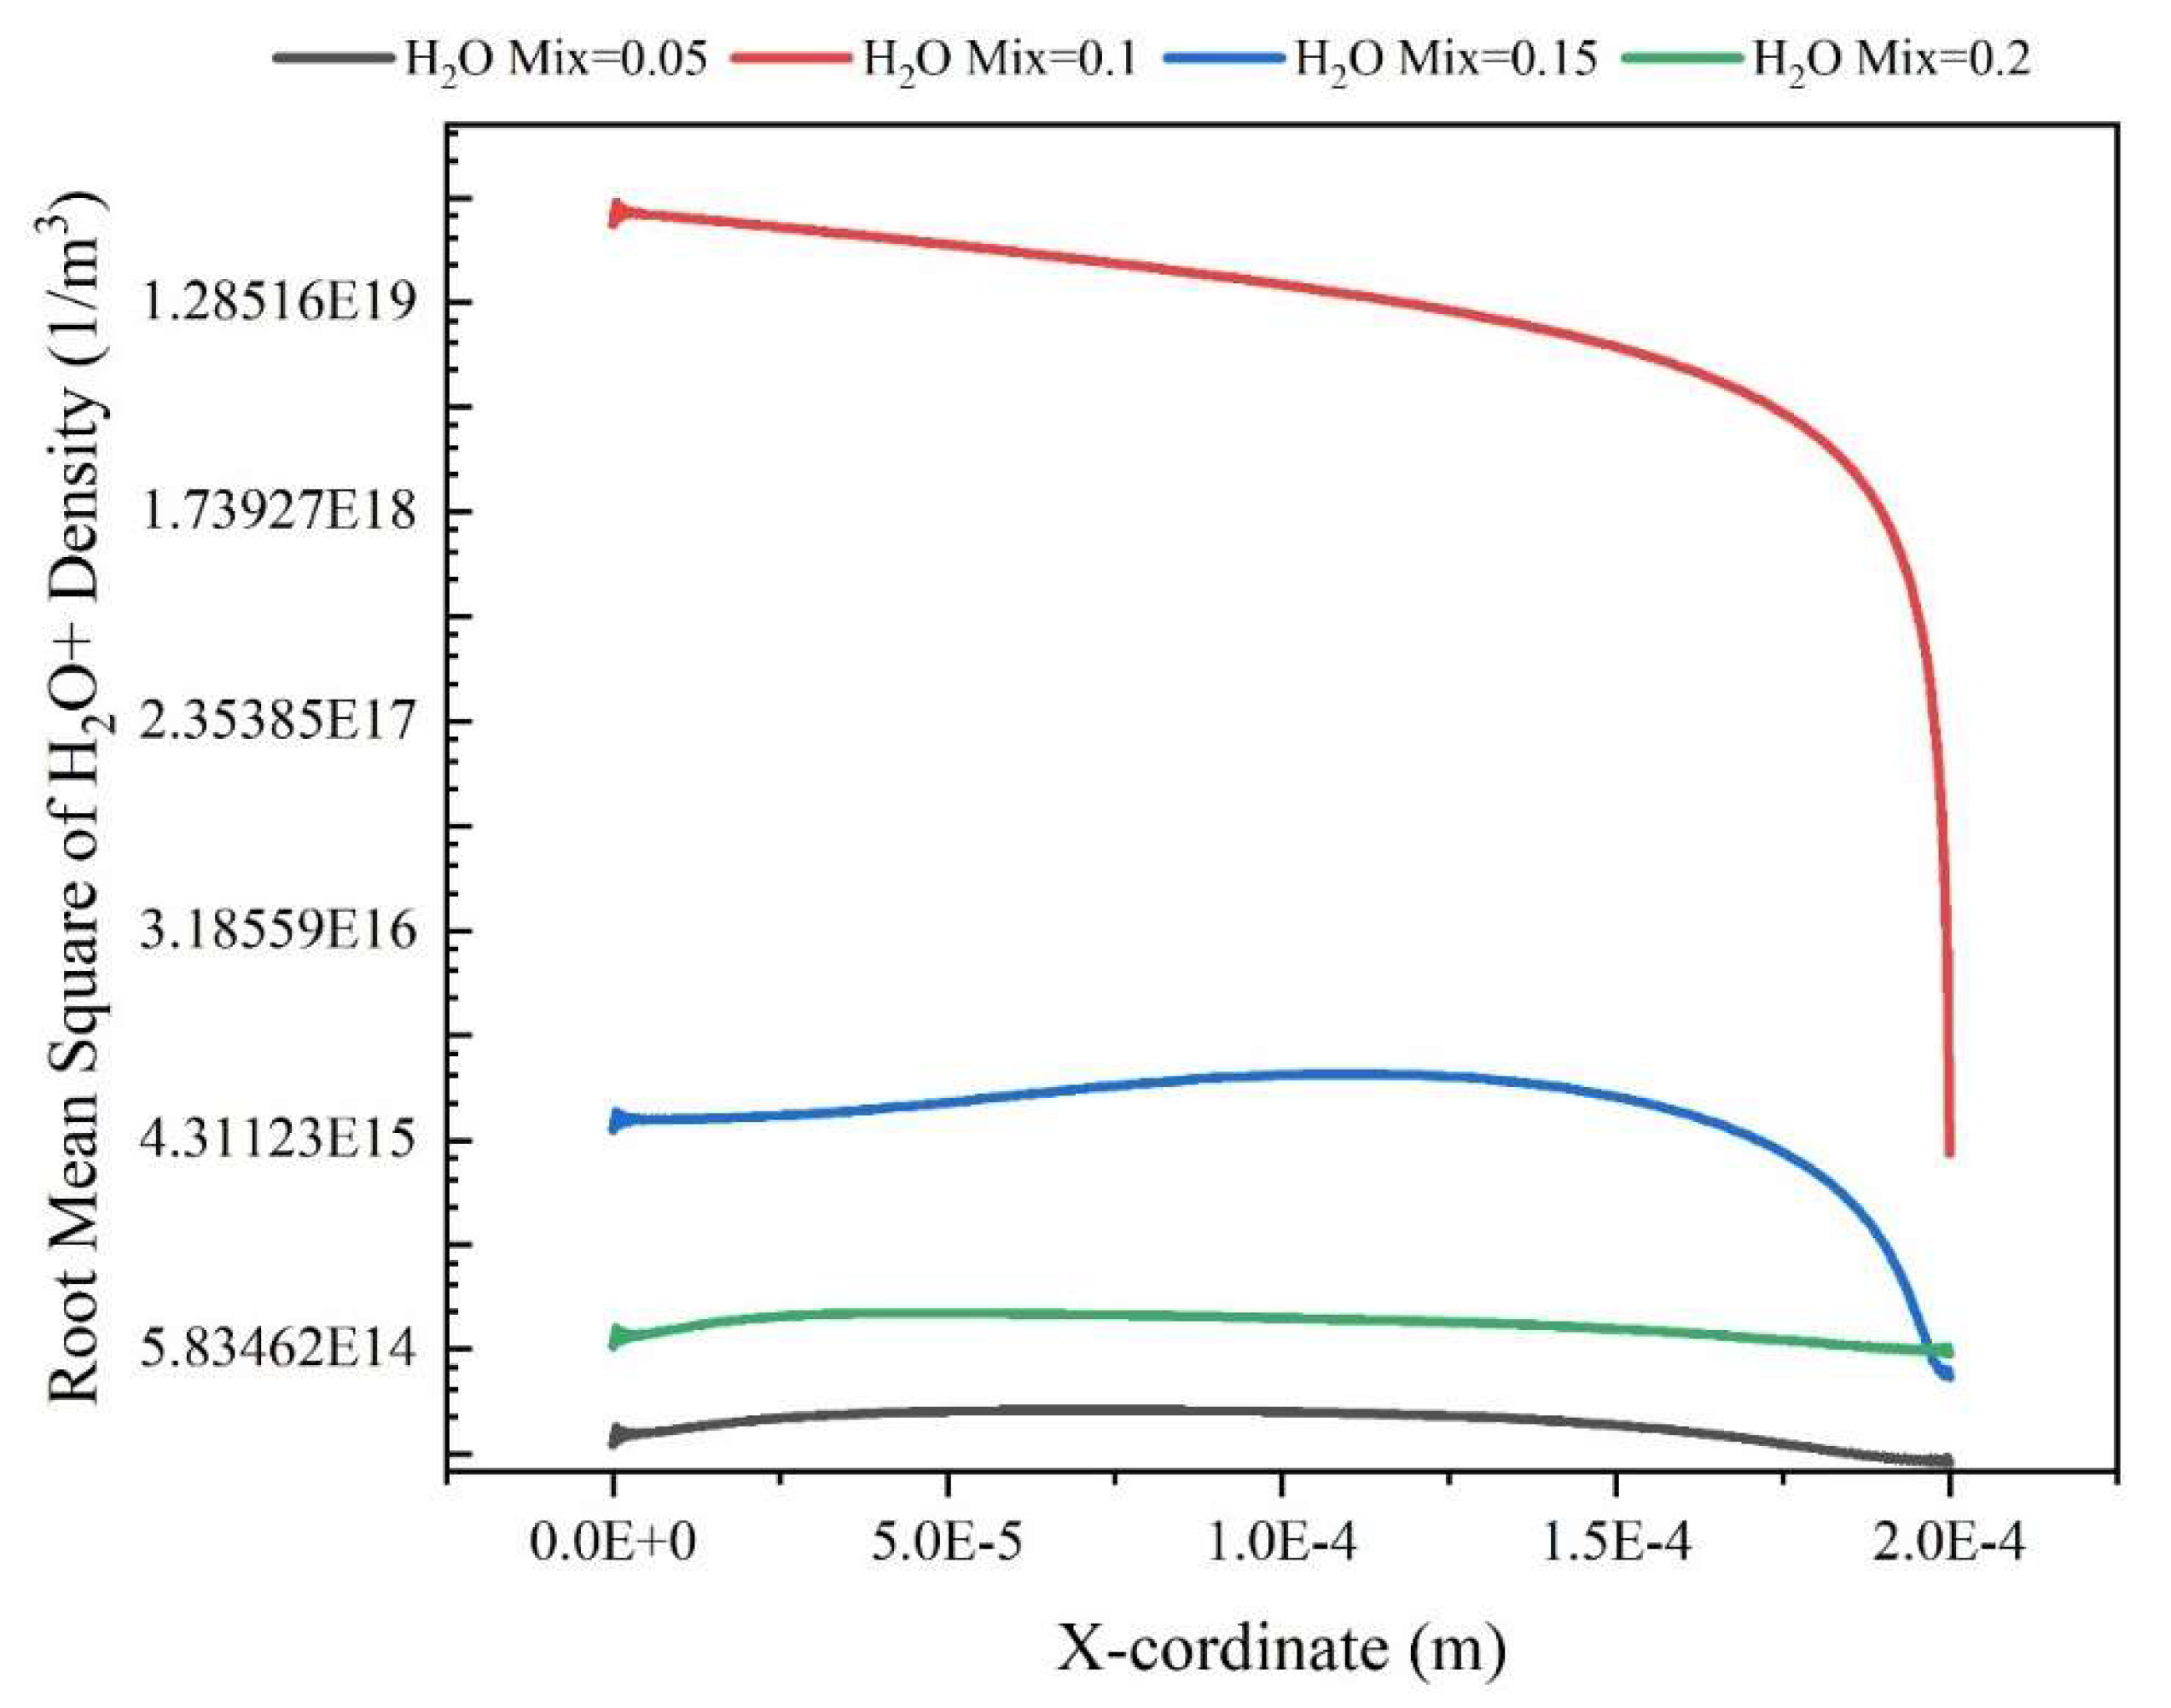
In Figure 7, the evolution of the H2O+ density is presented as a function of distance. As it is shown in this figure, the H2O+ density for 0.1 mixture has a downward trend. Figure 7 also shows a similar behavior in magnitude to that of Figure 6. As it is seen in this figure, the other percentages represent approximately constant magnitudes with respect to the distance from the electrodes.
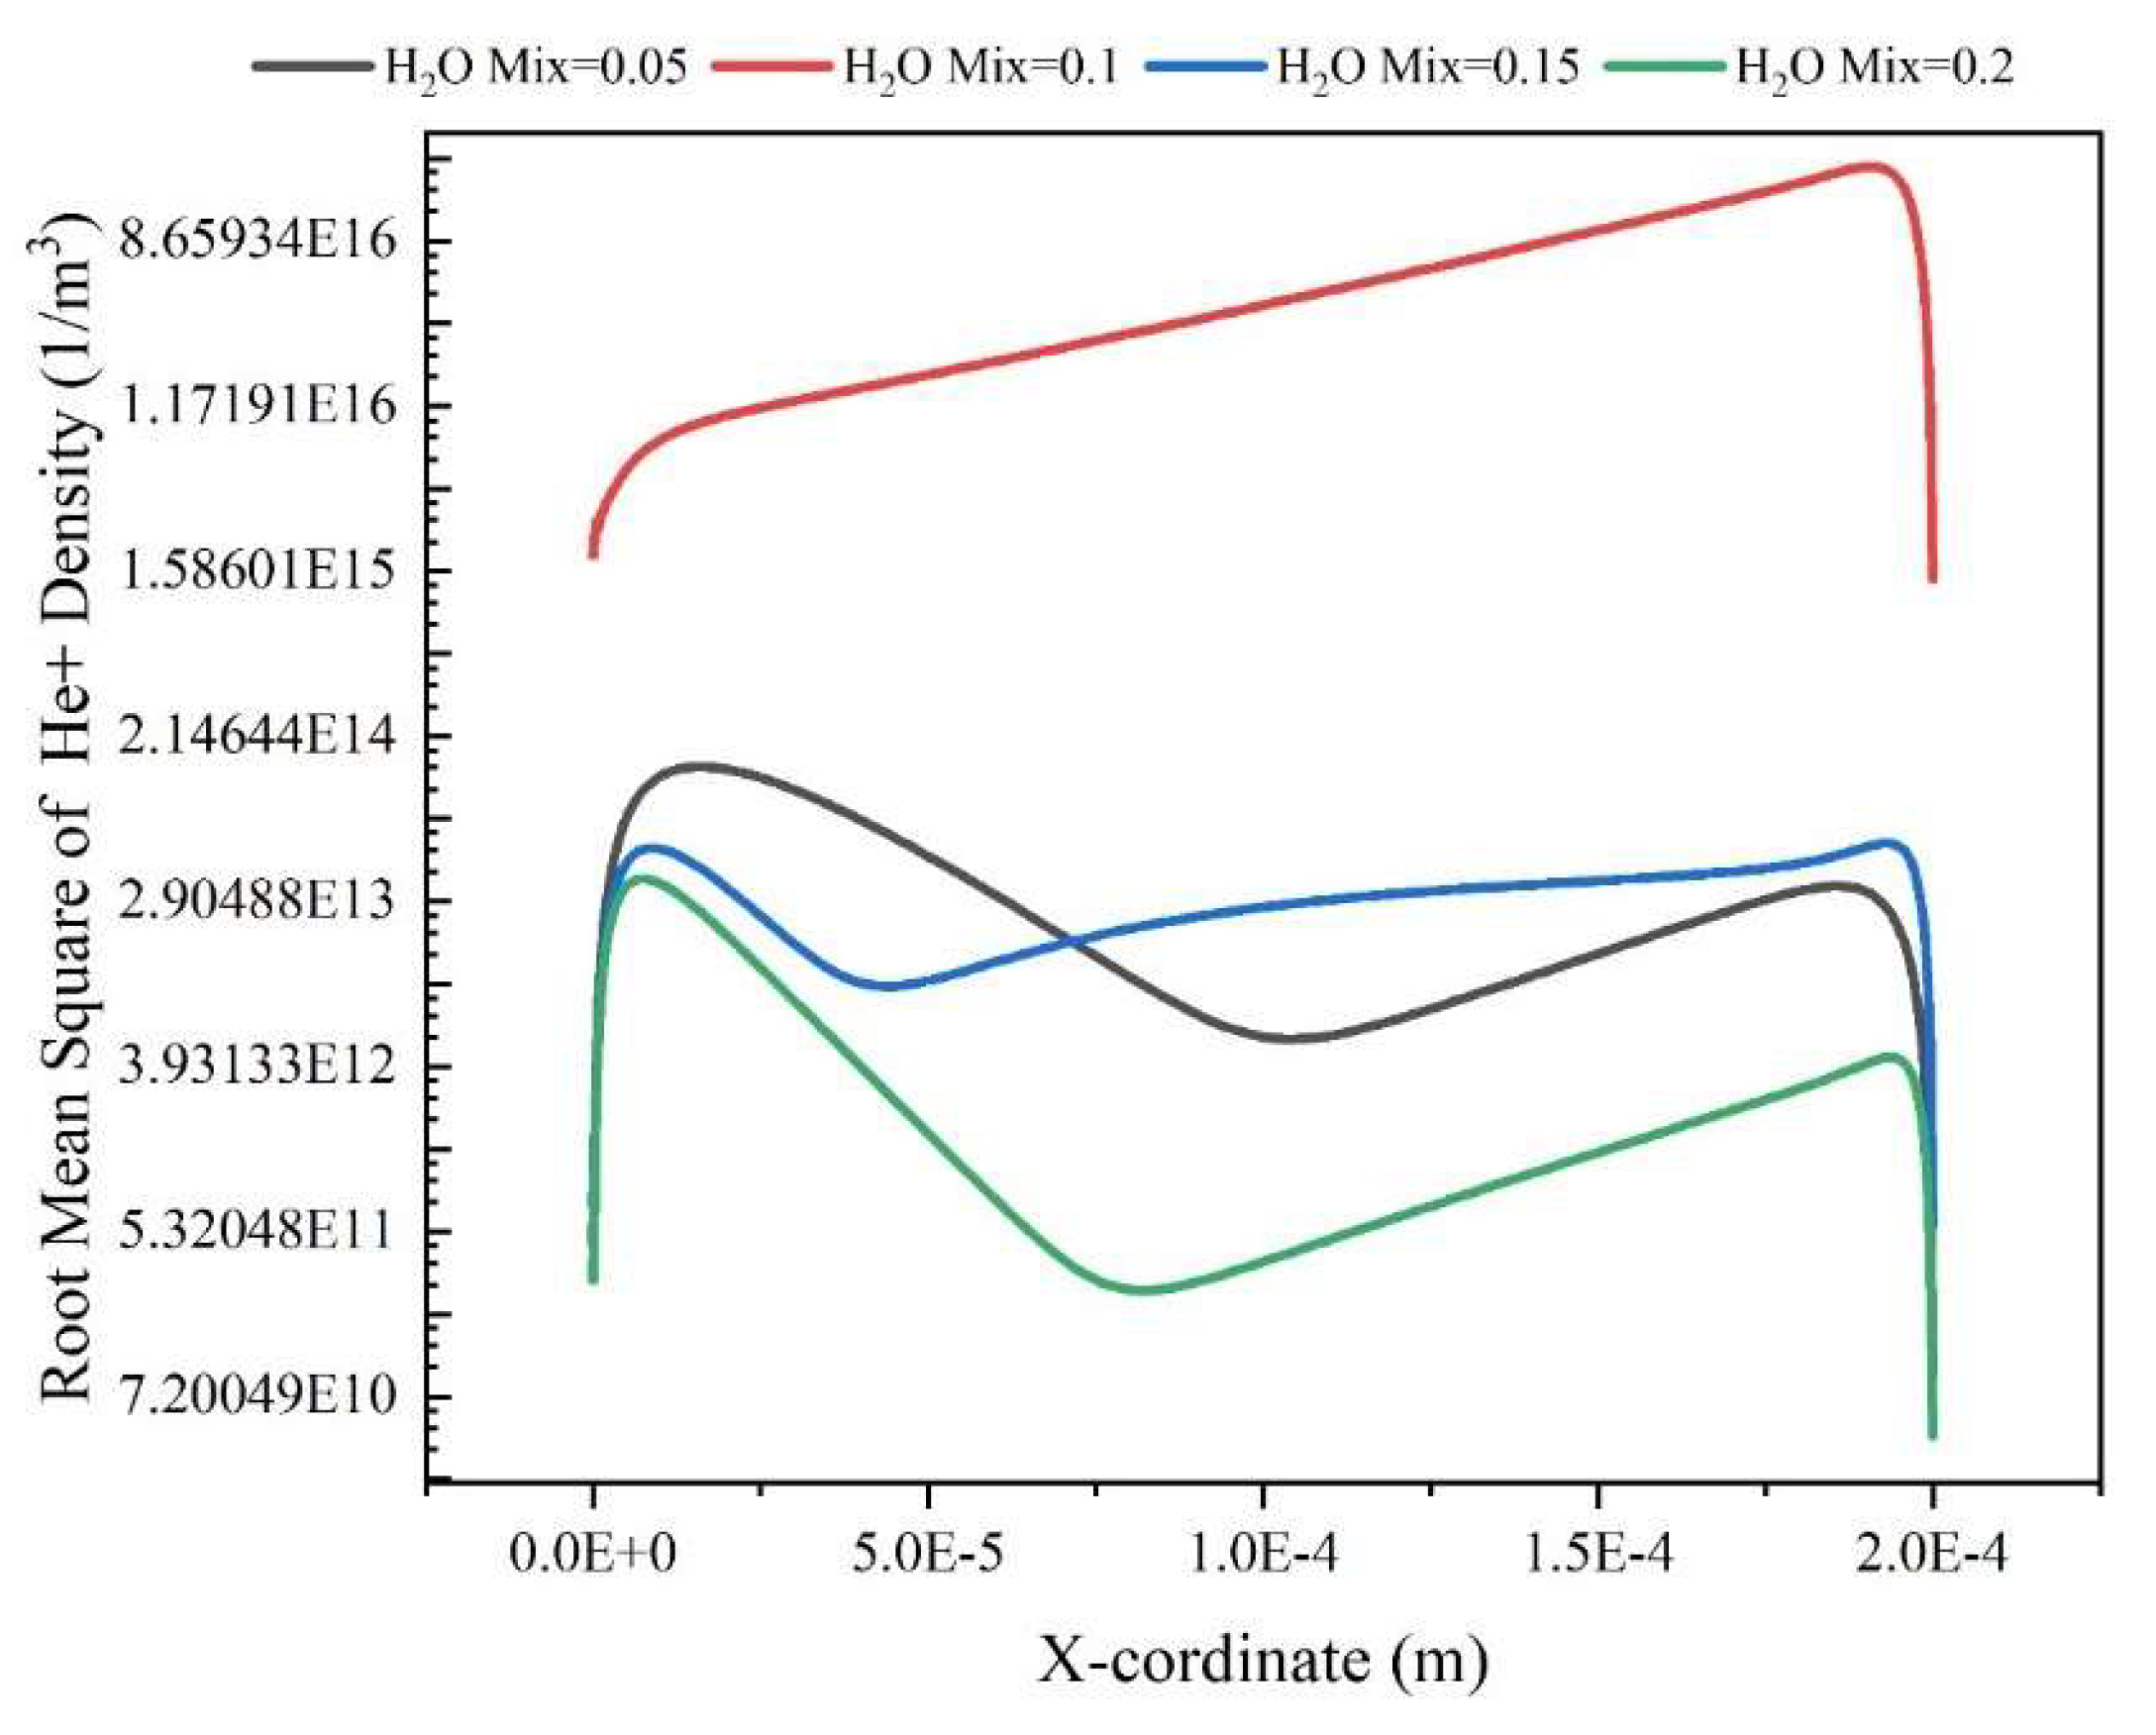
The spatial evolution of He+ density is illustrated in Figure 8 which represents the highest magnitude for 0.1 mixture. Furthermore, at 0.1 mixture, first an increasing trend is seen, but decreasing trend is observed at 2.0E-4. For two percentages of 5% and 20%, a concavity appears at an approximately distance of 1.0E-4 from the dielectric, while for the 15%, the minimum is occurred at 5.0 E-5.
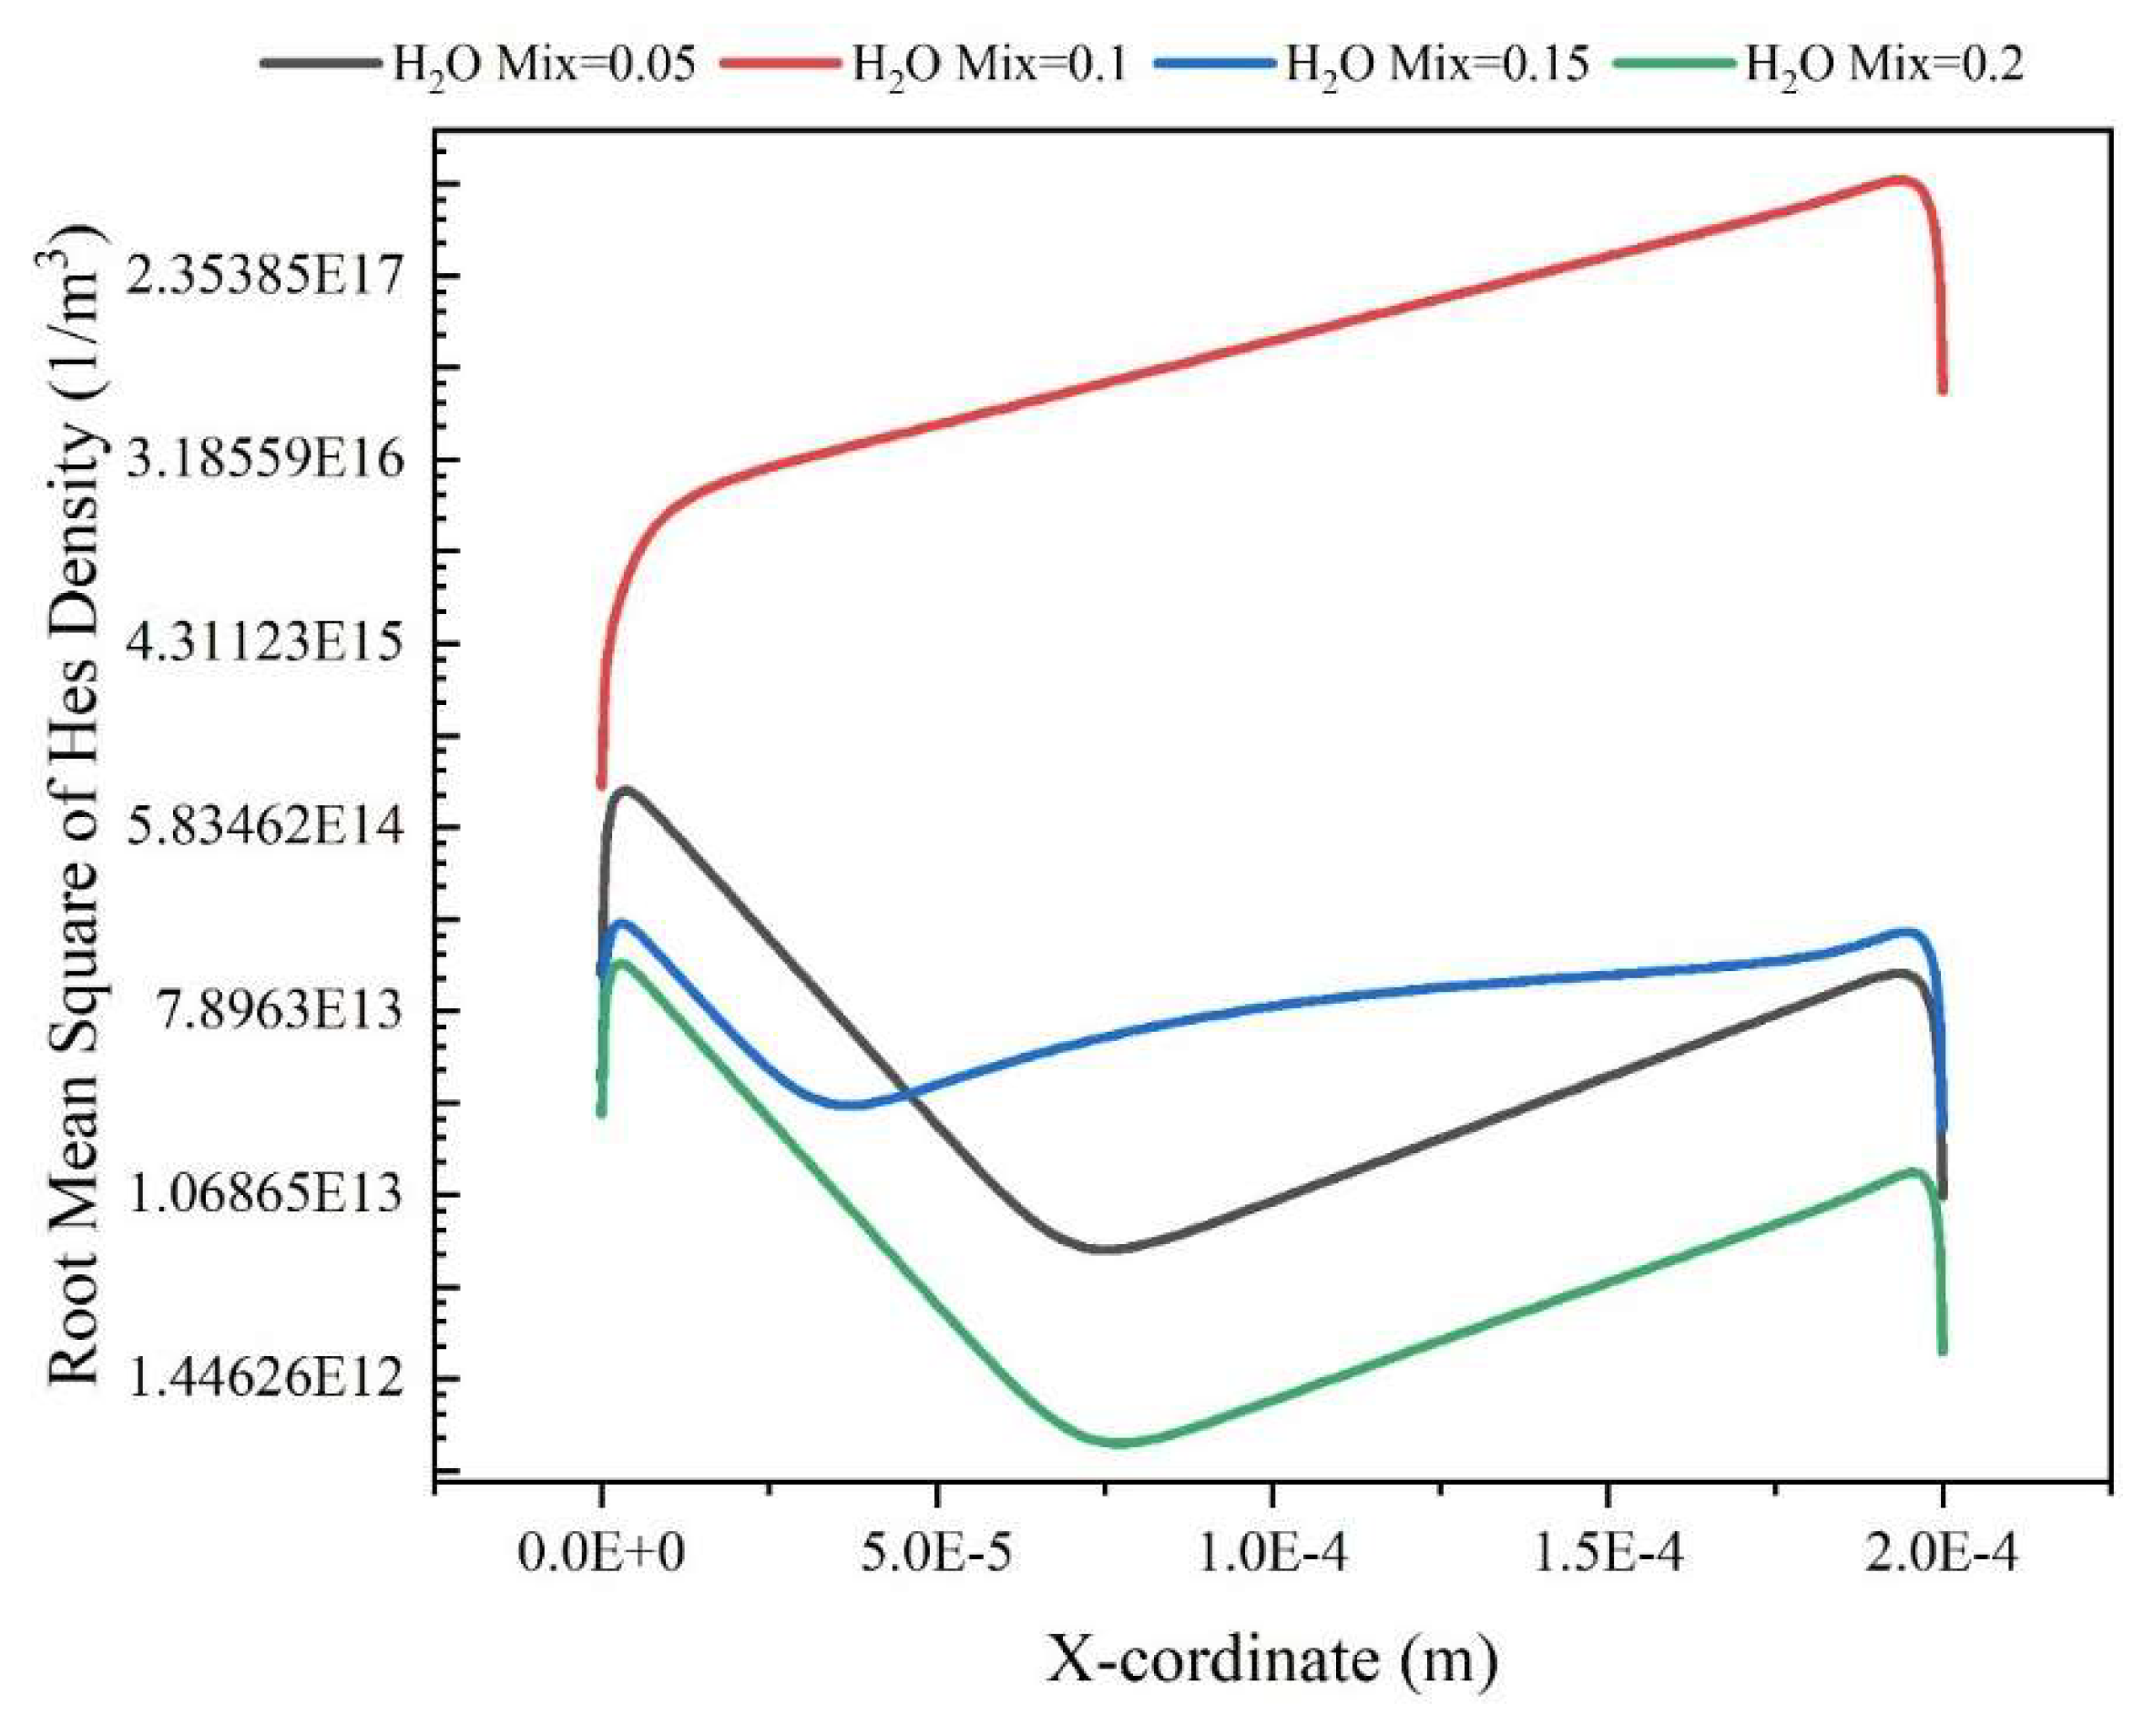
The density of excited helium is illustrated in Figure 9. Clearly, at 0.1 H2O mixture, with highest magnitude show an upward trend between two electrodes. In addition, for all combinations, a drop is presented near the electrode surfaces at x=0 and 2E-4 m. Moreover, at a distance of 0.75E-4 from the dielectric, a concavity is presented for two percentages of 5 and 20 %.
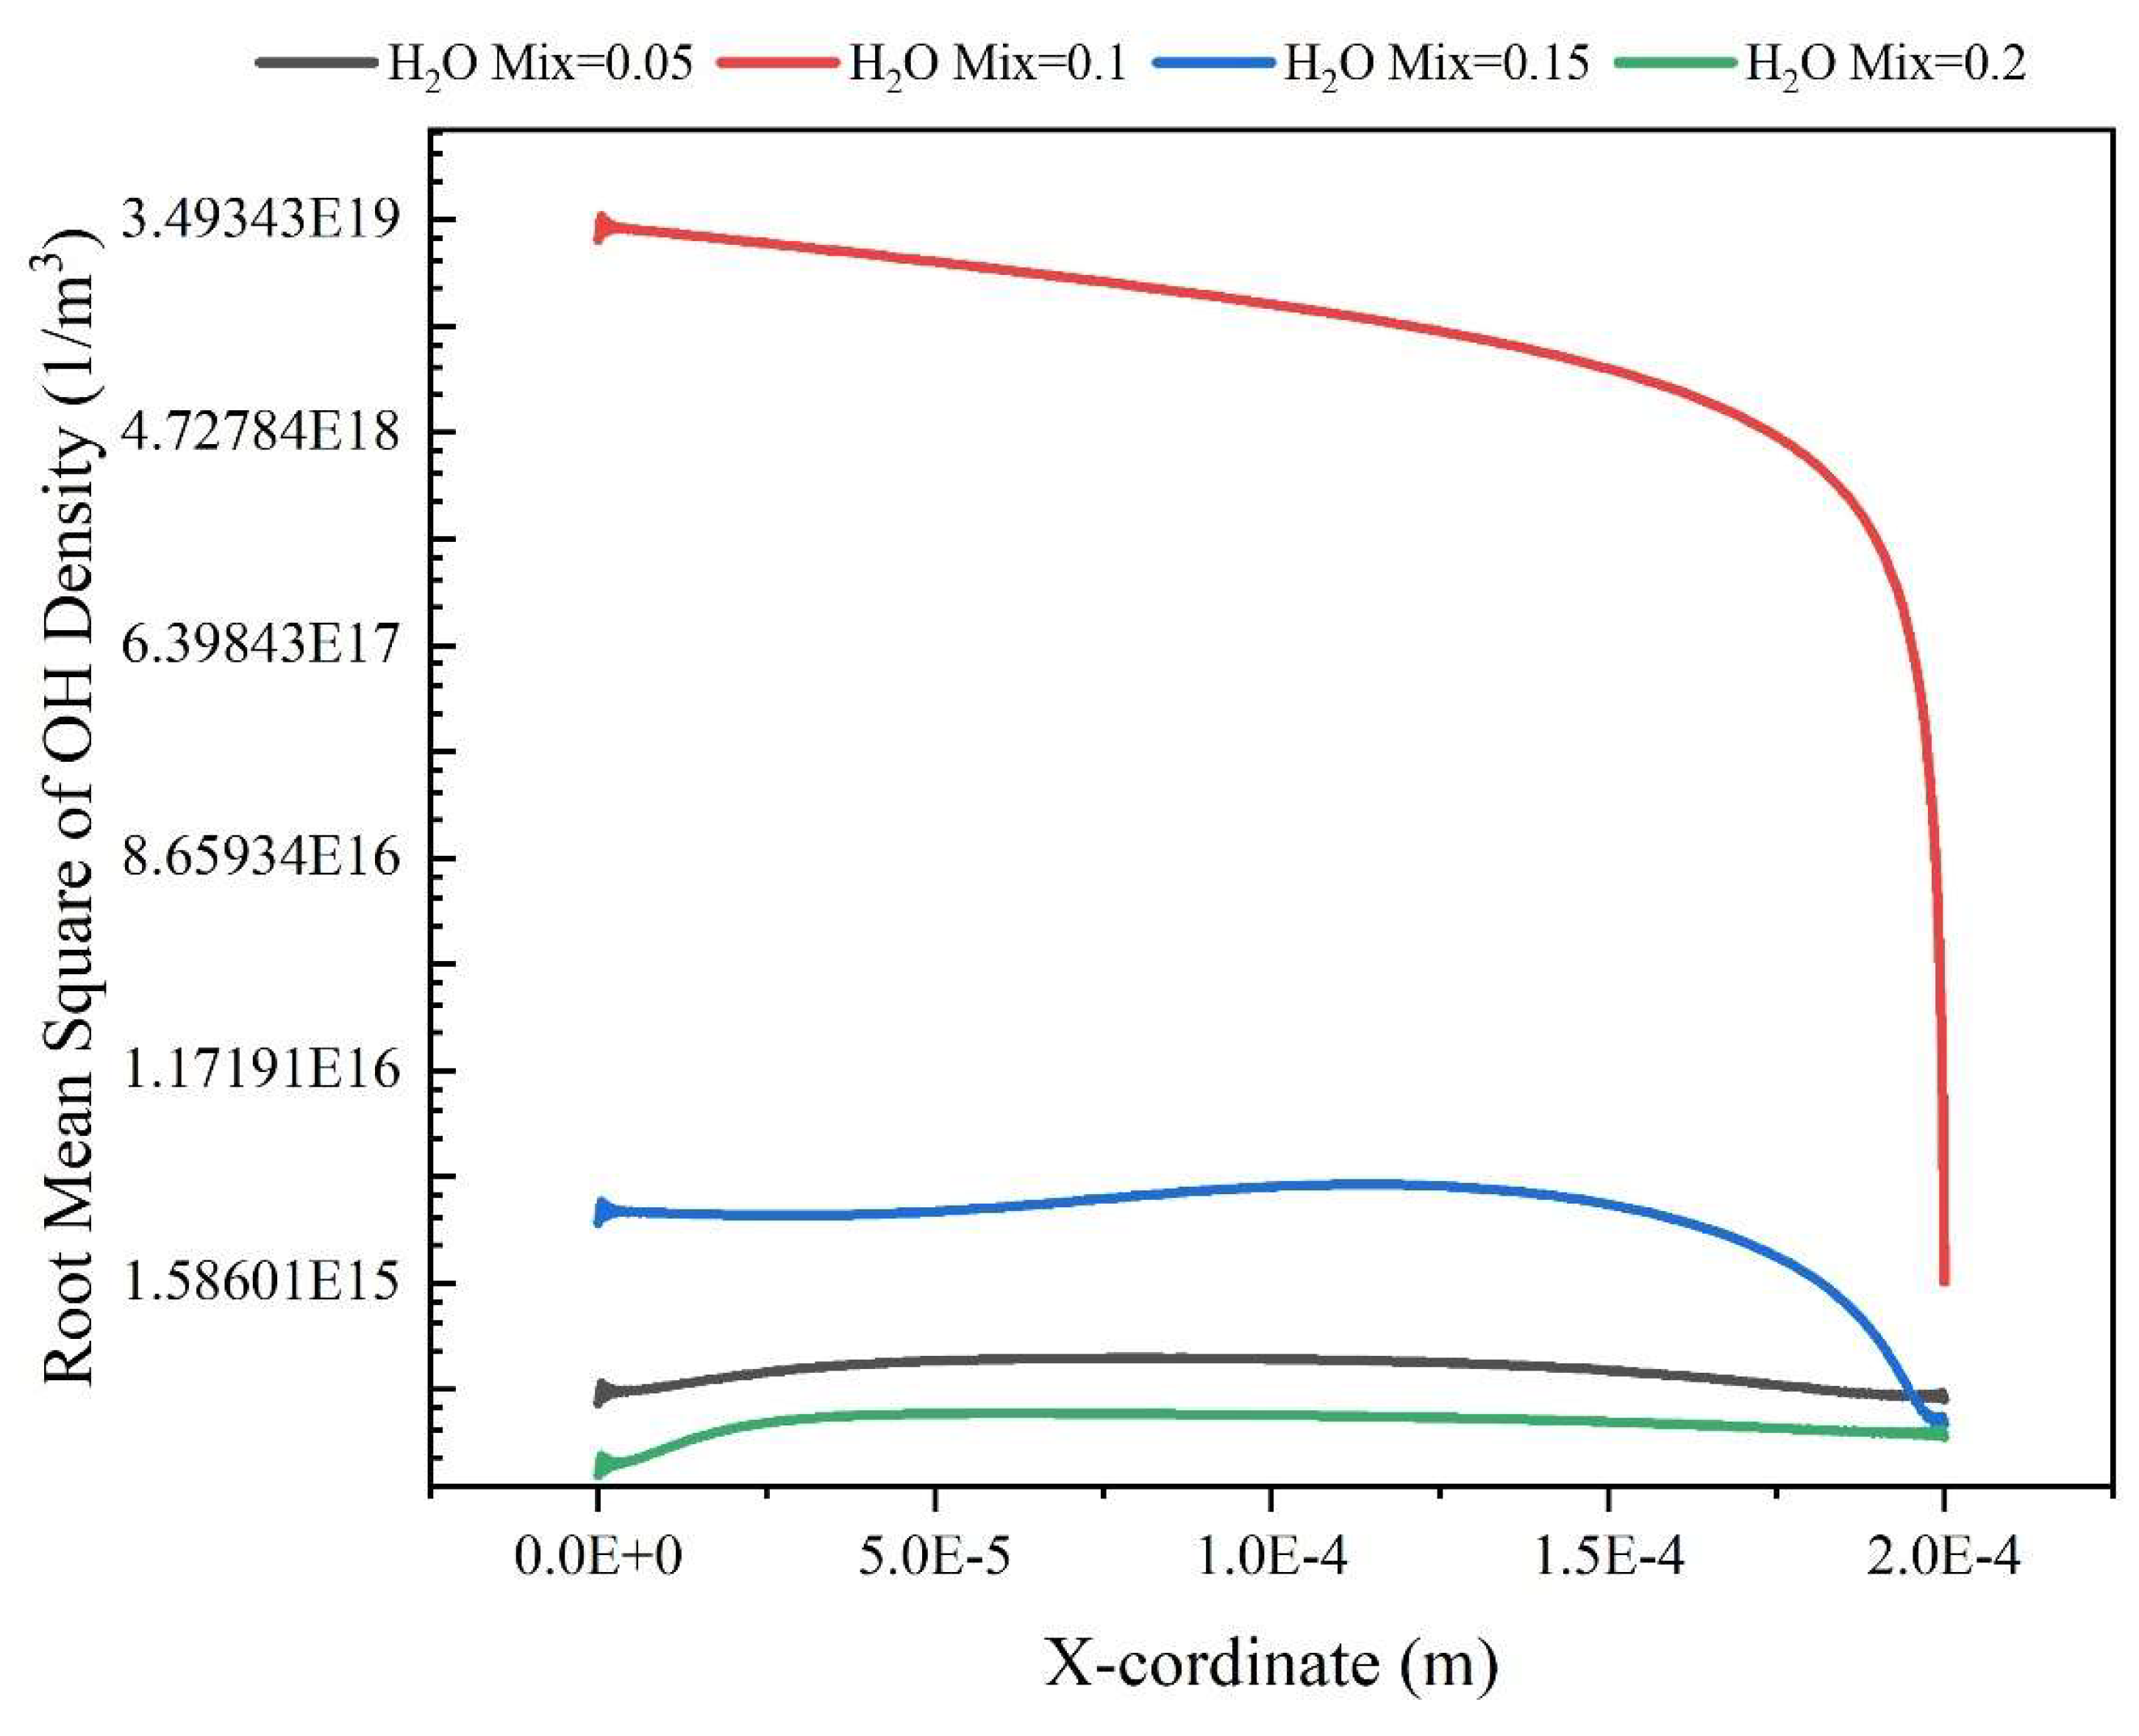
OH radicals have been reported to enhance chemical processes [35] and can cause damage to the fatty acid side chains of lipids in different membranes, including the mitochondrial membranes of cells [36]. Figure 10 demonstrates the variations of OH density as function of x coordinate. In this figure for percentage of H2O 0.1 mixed, a downward trend is represented, especially at distance of 2E-4 from the first dielectric. In the other mixtures, a constant density is observed, while at 2E-4 meters from the dielectric, all the graphs converged.
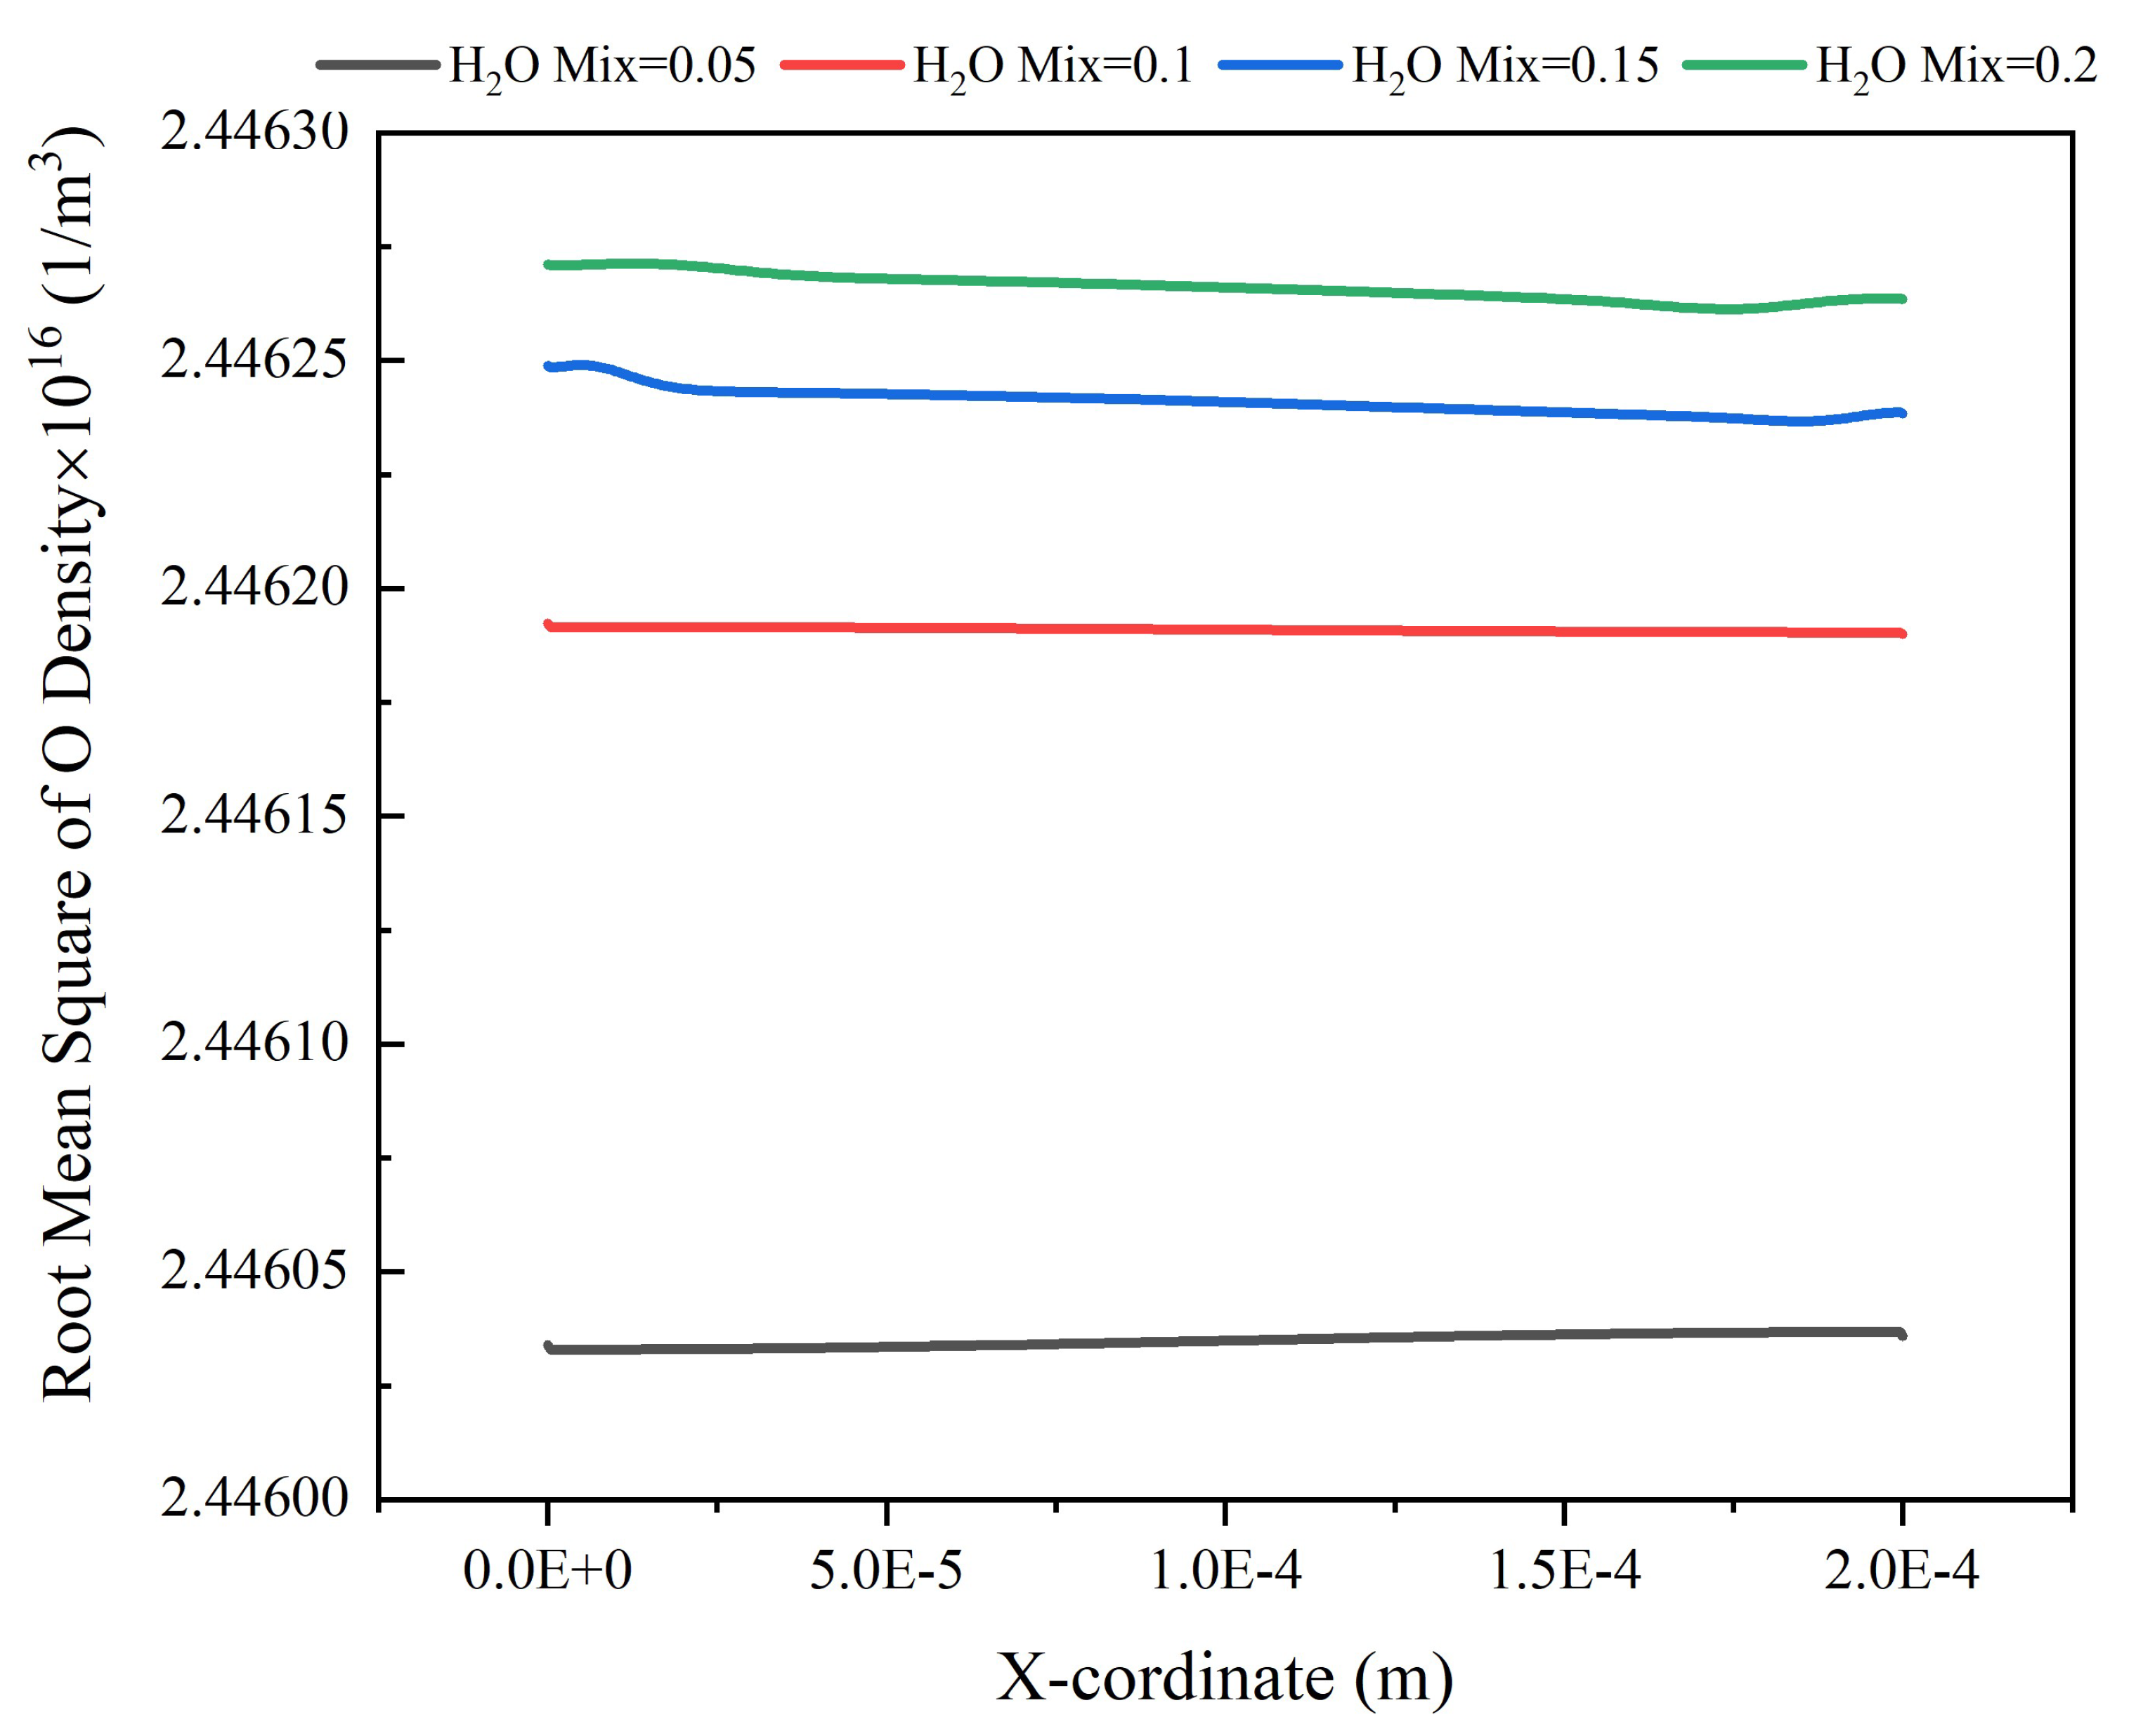
The existence of atomic O, an active species, in plasma-especially cold plasma-is crucial, particularly for applications in medicine. As shown in Figure 11. As the amount of moisture increases, the atomic number of oxygen increases, but this change is not very significant due to the lower contribution.
The amount obtained for the species was compared with previous works. Due to the fact that the plasmas utilized in the earlier studies were specifically tailored for various purposes, the parameters of the plasma, such as voltage, were set at greater levels, thus resulting in an increase in the discharge gap. However, the particle density is directly proportional to the atmospheric pressure plasma of helium-water gas [24,34,37].

Conclusions

In this paper, research was conducted on the optimized plasma parameters for the generation of radiofrequency discharge plasma under low pressures in a combination of helium. The main purpose was to investigate the potential of this plasma discharge in the field of biomedical surface sterilization. Through numerical calculations, the density distributions of various species and the temperatures of electrons during the electrical discharge process were determined. The results showed that the highest magnitudes of electric field were related to He + 5% H2O mixture. Furthermore, it was shown that the maximum magnitude of electron temperature was happened at sh=0.1 or percentage of He + 10% H2O mixture. On the other hand, it was found that the lowest magnitudes of current occurred at 0.1 mixture of H2O. In addition, similar to the case of the maximum magnitudes of the electron temperature, it was seen that the greatest values in the electron density occurred for 10 percentage of H2O. Moreover, it was found that the highest magnitudes of H+, He+, Hes (exited helium) and OH+ densities occurred at 10% H2O percentage. Therefore, it was concluded that the best optimization plasma parameters may observe at He with 10% H2O percentage.

Author Contributions

Ramin Mehrabifard conceived the presented idea. Zahra Soltani performed the simulation. Ramin Mehrabifard and Hamed Soltani completed the simulation. Zahra Soltani wrote the manuscript. Mohammad Mohsen Hatami, Fatemeh Rezaei and Ramin Mehrabifard edited the manuscript. Mohammad Mohsen Hatami and Fatemeh Rezaei supervised the findings of this work. All authors discussed the results and contributed to the final manuscript.

Acknowledgments

This work was supported by Slovak Research and Development Agency APVV-22-0247 and Comenius University Grant UK/3032/2024.

Ethics Approval

This article does not contain any studies with human participants or animals.

Consent to Participate

Not applicable.

Consent for Publication

Not applicable.

Competing Interests

The authors declare no competing interests.

Data Availability

All data generated or analyzed during this study are included in this published article.

References

  1. Z. Machala and M. J. Pavlovich, “A New Phase in Applied Biology,” Trends Biotechnol., vol. 36, no. 6, pp. 577–578, 2018. [CrossRef]
  2. J. M. Jung et al., “Cold Plasma Treatment Promotes Full-thickness Healing of Skin Wounds in Murine Models,” Int. J. Low. Extrem. Wounds, vol. 22, no. 1, pp. 77–84, 2023. [CrossRef]
  3. S. K. Dubey et al., “Cold atmospheric plasma therapy in wound healing,” Process Biochem., vol. 112, pp. 112–123, 2022. [CrossRef]
  4. S. Cha and Y. S. Park, “Plasma in dentistry,” Clin. Plasma Med., vol. 2, no. 1, pp. 4–10, 2014. [CrossRef]
  5. R. Mehrabifard, H. Mehdian, and mahdi bakhshzadmahmodi, “Effect of non-thermal atmospheric pressure plasma on MDA-MB-231 breast cancer cells,” Pharm. Biomed. Res., vol. 3, no. 3, pp. 12–16, 2017. [CrossRef]
  6. R. Mehrabifard, H. Mehdian, K. Hajisharifi, and E. Amini, “Improving Cold Atmospheric Pressure Plasma Efficacy on Breast Cancer Cells Control-Ability and Mortality Using Vitamin C and Static Magnetic Field,” Plasma Chem. Plasma Process., vol. 40, no. 2, pp. 511–526, Nov. 2020. [CrossRef]
  7. D. Sersenová, Z. Machala, V. Repiská, and H. Gbelcová, “Selective apoptotic effect of plasma activated liquids on human cancer cell lines,” Molecules, vol. 26, no. 14, 2021. [CrossRef]
  8. D. Dobrynin et al., “Physical and biological mechanisms of direct plasma interaction with living tissue,” New J. Phys., vol. 11, no. 11, p. 115020, 2009. [CrossRef]
  9. M. Amini, M. Momeni, and A. Jahandideh, “Floating Discharge Plasma for Healing of Tendon Injury,” High Temp., vol. 58, no. 6, pp. 795–799, 2020. [CrossRef]
  10. M. Schröder, A. Ochoa, and C. Breitkopf, “ Numerical simulation of an atmospheric pressure RF-driven plasma needle and heat transfer to adjacent human skin using COMSOL ,” Biointerphases, vol. 10, no. 2, p. 029508, Jun. 2015. [CrossRef]
  11. X. Lu et al., “On the chronological understanding of the homogeneous dielectric barrier discharge,” High Volt., vol. 8, no. 6, pp. 1132–1150, 2023. [CrossRef]
  12. .
  13. S. Hajikhani, R. Mehrabifard, and H. Soltani Ahmadi, “A numerical analysis of the impact of gas pressure and dielectric material on the generation of body force in an air gas plasma actuator,” Radiat. Phys. Eng., vol. 5, no. 2, pp. 51–60, Apr. 2024. [CrossRef]
  14. F. Sohbatzadeh, A. Hosseinzadeh Colagar, S. Mirzanejhad, and S. Mahmodi, “E. coli, P. aeruginosa, and B. cereus Bacteria Sterilization Using Afterglow of Non-Thermal Plasma at Atmospheric Pressure,” Appl. Biochem. Biotechnol., vol. 160, no. 7, pp. 1978–1984, Apr. 2010. [CrossRef]
  15. J. R. Roth, “Industrial plasma engineering: Volume 2: Applications to nonthermal plasma processing,” Ind. Plasma Eng. Vol. 2 Appl. to Nonthermal Plasma Process., vol. 2, pp. 1–628, Jan. 2001.
  16. S. Gadkari, ; Xin, ; T., S. Gu, and X. Tu, “Fluid model for a partially packed dielectric barrier discharge plasma reactor,” Phys. Plasmas, vol. 24, p. 93510, 2017. [CrossRef]
  17. J. Pan, L. Li, B. Chen, Y. Song, Y. Zhao, and X. Xiu, “Numerical simulation of evolution features of the atmospheric-pressure CF4 plasma generated by the pulsed dielectric barrier discharge,” Eur. Phys. J. D 2016 706, vol. 70, no. 6, pp. 1–8, Jun. 2016. [CrossRef]
  18. R. Abidat, S. Rebiai, and L. Benterrouche, “Numerical simulation of atmospheric Dielectric Barrier Discharge in helium gas using COMSOL Multiphysics,” 2013 3rd Int. Conf. Syst. Control. ICSC 2013, pp. 134–139, 2013. [CrossRef]
  19. Y. B. Golubovskii, V. A. Maiorov, J. Behnke, and J. F. Behnke, “Modelling of the homogeneous barrier discharge in helium at atmospheric pressure,” J. Phys. D. Appl. Phys., vol. 36, no. 1, p. 39, Dec. 2002. [CrossRef]
  20. S. Tappi et al., “Effect of cold plasma generated with different gas mixtures on safety, quality and nutritional aspects of fresh sea bream fillets,” Innov. Food Sci. Emerg. Technol., vol. 89, 2023. [CrossRef]
  21. Y. Ucar, Z. Ceylan, M. Durmus, O. Tomar, and T. Cetinkaya, “Application of cold plasma technology in the food industry and its combination with other emerging technologies,” Trends Food Sci. Technol., vol. 114, pp. 355–371, 2021. [CrossRef]
  22. Schmidt, S. Bekeschus, H. Jablonowski, A. Barton, K. D. Weltmann, and K. Wende, “Role of Ambient Gas Composition on Cold Physical Plasma-Elicited Cell Signaling in Keratinocytes,” Biophys. J., vol. 112, no. 11, pp. 2397–2407, 2017. [CrossRef]
  23. R. Mehrabifard, “Two-dimensional simulation of Argon dielectric barrier discharge (DBD) in plasma actuator structure with COMSOL Multiphysics,” Radiat. Phys. Eng., vol. 4, no. 4, pp. 43–50, 2023. [CrossRef]
  24. G. V. Naidis, “Modelling of OH production in cold atmospheric-pressure He-H2O plasma jets,” Plasma Sources Sci. Technol., vol. 22, no. 3, 2013. [CrossRef]
  25. K. Shuaibov, A. I. Dashchenko, and I. V. Shevera, “Emission from a DC glow discharge in a He/H2O mixture,” Tech. Phys., vol. 46, no. 11, pp. 1484–1487, 2001. [CrossRef]
  26. X. Pei, Y. Lu, S. Wu, Q. Xiong, and X. Lu, “A study on the temporally and spatially resolved OH radical distribution of a room-temperature atmospheric-pressure plasma jet by laser-induced fluorescence imaging,” Plasma Sources Sci. Technol., vol. 22, no. 2, 2013. [CrossRef]
  27. E. Ilik, C. Durmus, and T. Akan, “Adding Water Droplets into Atmospheric Pressure Plasma Jet of Helium,” IEEE Trans. Plasma Sci., vol. 47, no. 11, pp. 5000–5005, 2019. [CrossRef]
  28. K. Ding, M. A. Lieberman, and A. J. Lichtenberg, “Hybrid model of neutral diffusion, sheaths, and the α to γ transition in an atmospheric pressure He/H2O bounded rf discharge,” J. Phys. D. Appl. Phys., vol. 47, no. 30, 2014. [CrossRef]
  29. L. C. Pitchford et al., “LXCat: an Open-Access, Web-Based Platform for Data Needed for Modeling Low Temperature Plasmas,” Plasma Process. Polym., vol. 14, no. 1–2, 2017. [CrossRef]
  30. M. Hayashi, “Electron Collision Cross-Sections for Molecules Determined from Beam and Swarm Data,” Swarm Stud. Inelast. Electron-Molecule Collisions, pp. 167–187, 1987. [CrossRef]
  31. R. Mehrabifard, Z. Kabarkouhi, F. Rezaei, K. Hajisharifi, H. Mehdian, and E. Robert, “Physical understanding of the static magnetic field’s synergistic enhancement of cold atmospheric pressure plasma treatment,” Apr. 2023. [CrossRef]
  32. H. Halfmann, N. Bibinov, J. Wunderlich, and P. Awakowicz, “A double inductively coupled plasma for sterilization of medical devices,” J. Phys. D. Appl. Phys., vol. 40, no. 14, p. 4145, Jun. 2007. [CrossRef]
  33. F. Sohbatzadeh and H. Soltani, “Time-dependent one-dimensional simulation of atmospheric dielectric barrier discharge in N2/O2/H2O using COMSOL Multiphysics,” J. Theor. Appl. Phys., vol. 12, no. 1, pp. 53–63, 2018. [CrossRef]
  34. M. M. Iqbal and M. M. Turner, “Influence of Gap Spacing between Dielectric Barriers in Atmospheric Pressure Discharges,” Contrib. to Plasma Phys., vol. 55, no. 6, pp. 444–458, 2015. [CrossRef]
  35. S. Kanazawa et al., “LIF imaging of OH radicals in DC positive streamer coronas,” Thin Solid Films, vol. 515, no. 9, pp. 4266–4271, 2007. [CrossRef]
  36. Y. J. Hong et al., “Measurement of hydroxyl radical density generated from the atmospheric pressure bioplasma jet,” J. Instrum., vol. 7, no. 03, p. C03046, Mar. 2012. [CrossRef]
  37. S. Schröter et al., “Chemical kinetics in an atmospheric pressure helium plasma containing humidity,” Phys. Chem. Chem. Phys., vol. 20, no. 37, pp. 24263–24286, 2018. [CrossRef]
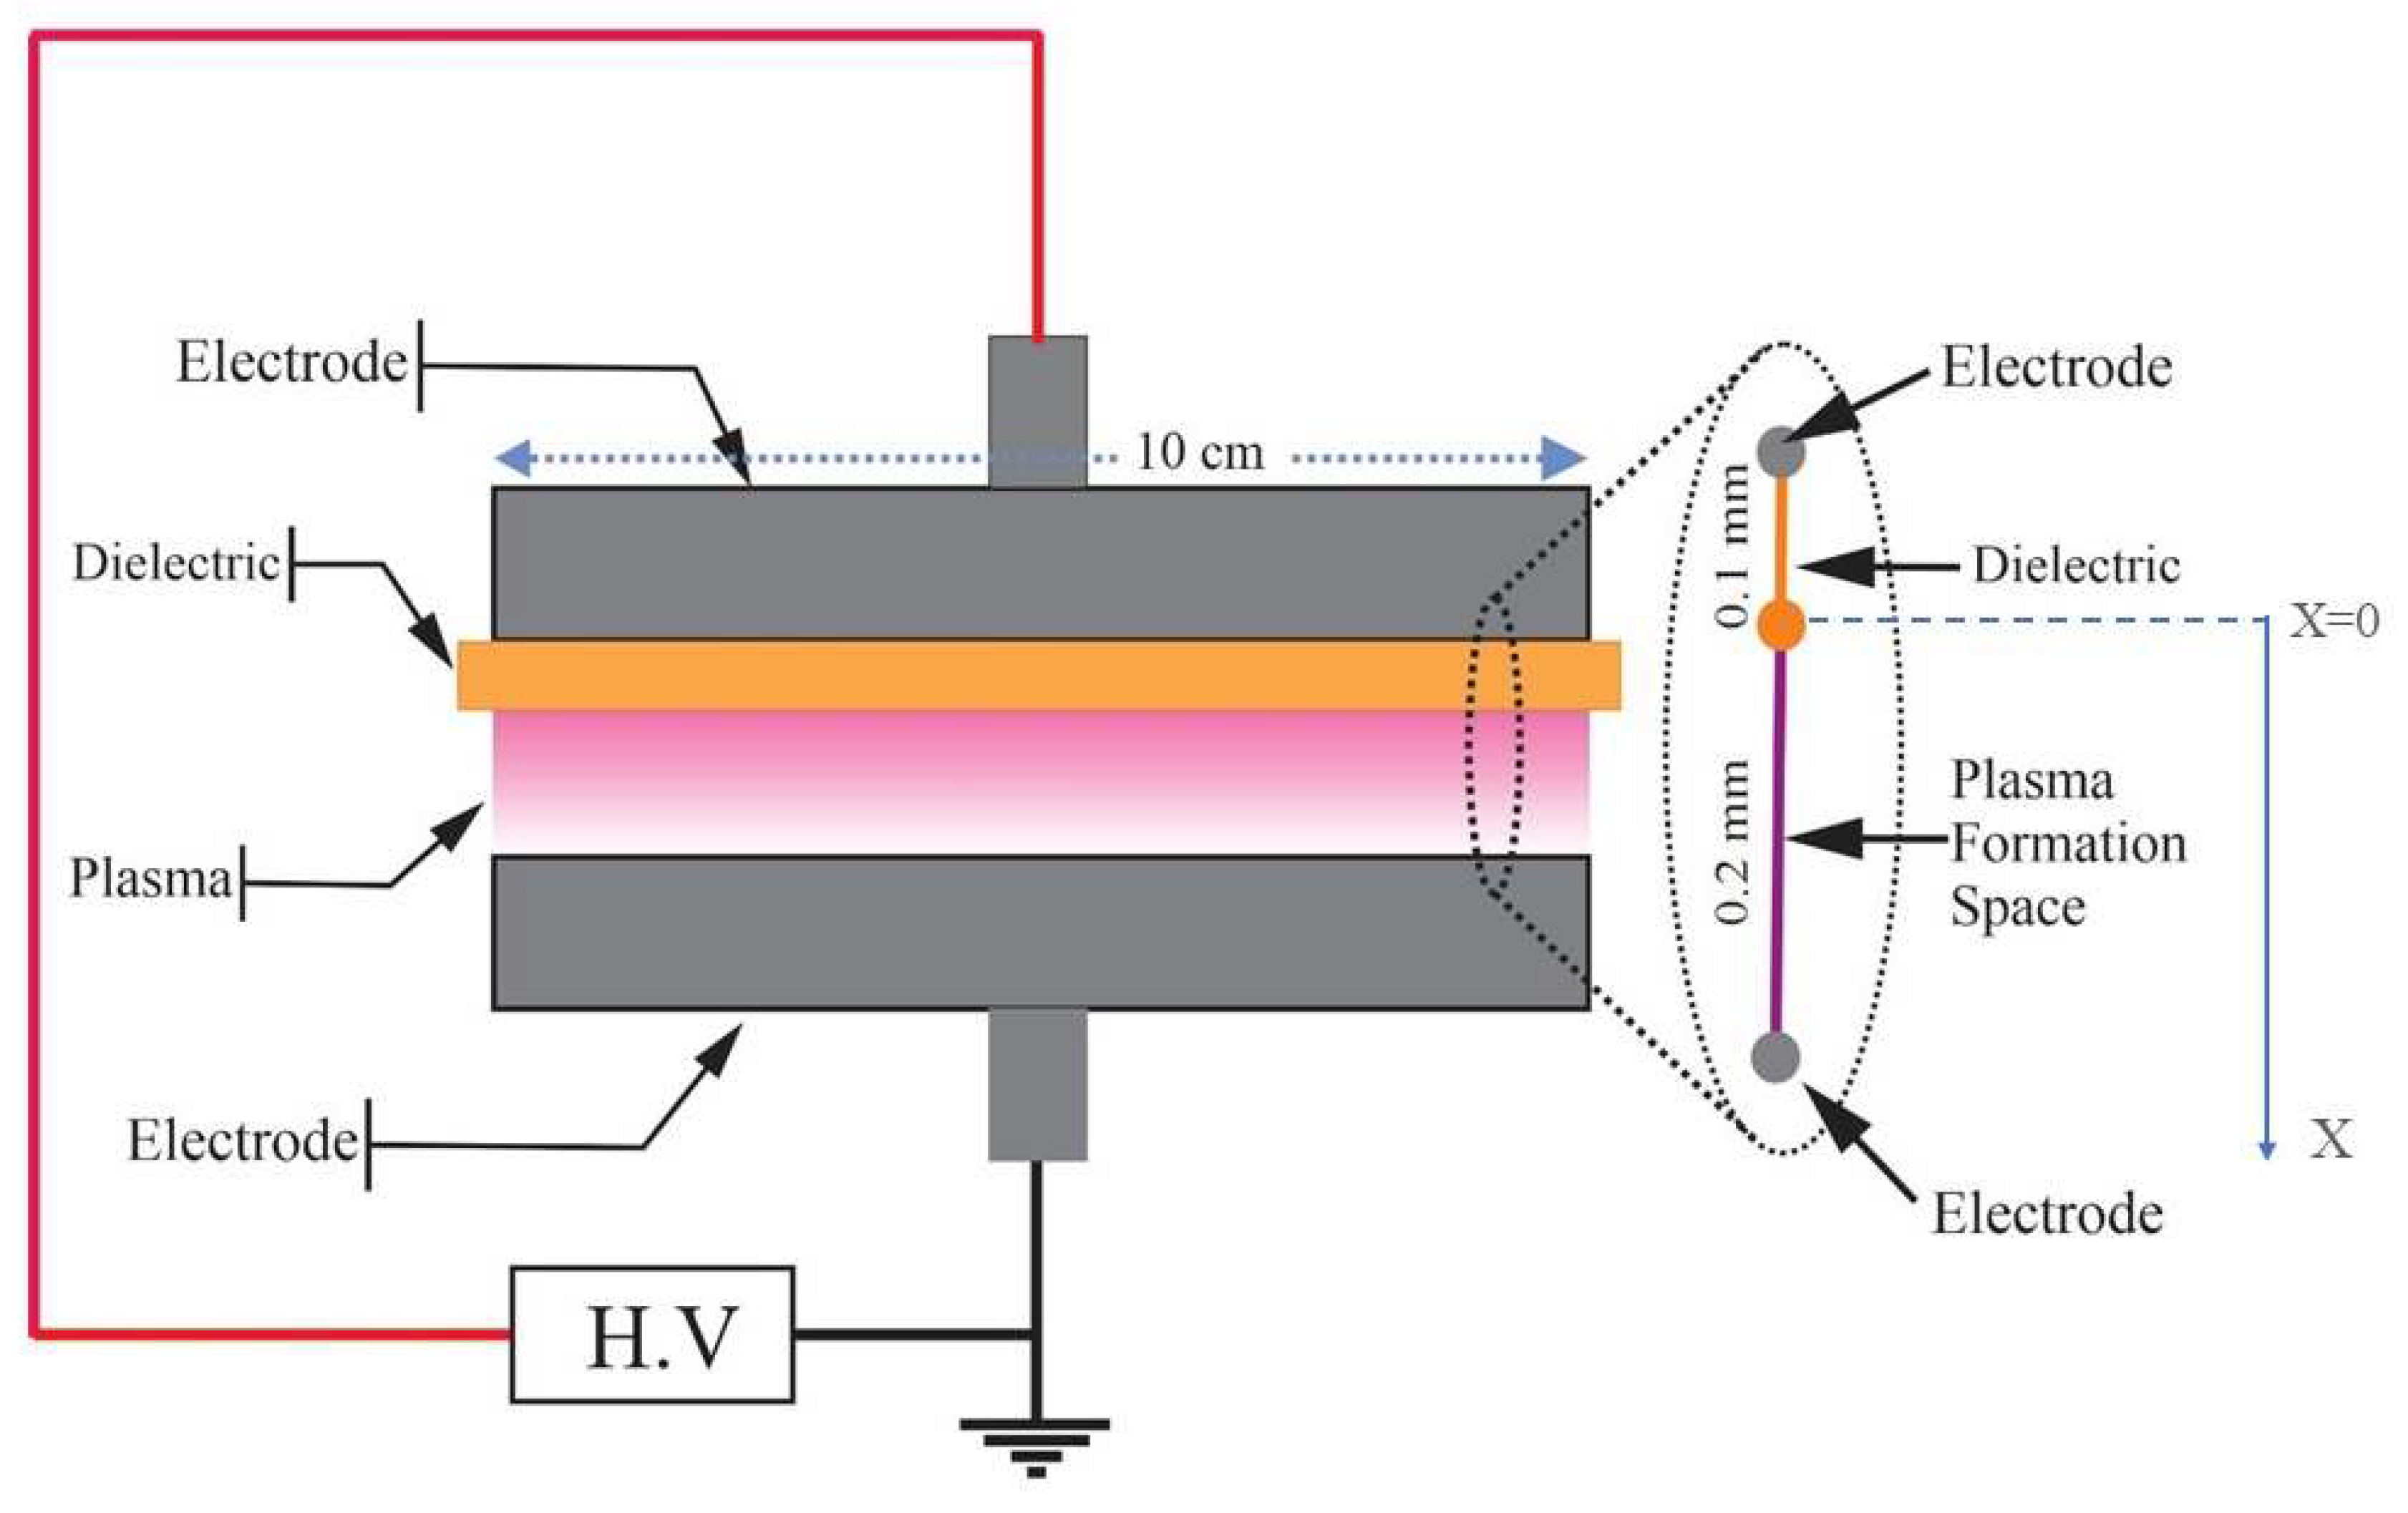
Figure 1. A schematic of the structure of the plasma by presenting the locations of the electrodes on the surface and inside of the behind dielectric.
Preprints 106288 g001
Figure 3. The spatial distribution of the electron temperature at 0.0015 s, for different percentages of H2O at sh = 0.05, 0.1, 0.15, and 0.2.
Preprints 106288 g003
Figure 4. The evolution of voltage and current versus time, for different percentages of H2O.
Preprints 106288 g004
Figure 5. The spatial distribution of the electron density for different percentages of H2O at sh=0.05, 0.1, 0.15 and 0.2.
Preprints 106288 g005
Figure 6. The spatial distribution of H+ density for various H2O percentages of sh=0.05, 0.1, 0.15 and 0.2.
Preprints 106288 g006
Figure 7. The regional distribution of the H2O+ density for different H2O ratios for various mixtures of sh=0.05,0.1,0.15, and 0.2.
Preprints 106288 g007
Figure 8. The evolution of He+ density versus distance, for different percentages of 0.05,0.10,0.15, and 0.20.
Preprints 106288 g008
Figure 9. The spatial distribution of the exited helium density for different percentages of H2O at sh=0.05, 0.1, 0.15, and 0.2.
Preprints 106288 g009
Figure 10. Variations of OH density as a function of distance, for different mixtures of H2O with 0.05, 0.1, 0.15, and 0.2.
Preprints 106288 g010
Figure 11. Variations of O density as a function of distance, for different mixtures of H2O with 0.05, 0.1, 0.15, and 0.2.
Preprints 106288 g011
Table 1. Various species incorporated in the plasma model simulation.
Preprints 106288 i001
Table 2. List of the main reactions including elastic, excitation, and ionization phenomena [28].
Preprints 106288 i002
Table 3. List of some reactions with He specie by insertion of rate coefficient [28].
Preprints 106288 i003
Table 4. Surface reactions with insertion of the sticking coefficient [29].
Preprints 106288 i004
Disclaimer/Publisher’s Note: The statements, opinions and data contained in all publications are solely those of the individual author(s) and contributor(s) and not of MDPI and/or the editor(s). MDPI and/or the editor(s) disclaim responsibility for any injury to people or property resulting from any ideas, methods, instructions or products referred to in the content.
Copyright: This open access article is published under a Creative Commons CC BY 4.0 license, which permit the free download, distribution, and reuse, provided that the author and preprint are cited in any reuse.
Prerpints.org logo

Preprints.org is a free preprint server supported by MDPI in Basel, Switzerland.

Subscribe

© 2024 MDPI (Basel, Switzerland) unless otherwise stated