1. Introduction
Biological treatment process is a treatment process that is employed to transform biodegradable colloidal or dissolved organics found in the wastewater into acceptable end products [
1]. One of the notable and widely-used technology is Moving Bed Bio Film Reactor (MBBR) that is known as an advanced biological treatment which adapts the advantages of both biofilm and activated sludge processes (ASP) [
2]. MBBR employs biomass as biofilms on solid carriers which move freely within a single reactor which in turn, are able to remove the organics contained in the wastewater [
3]. Increasing the treatment capacity [
3], reducing the sludge bulking [
3,
4], and eliminating sludge recycling [
5] are the important benefits of using MBBR as compared to ASP. Optimum MBBR operational conditions can be achieved by having biomass which grows on the free movable media [
3]. Therefore, well controlled environmental conditions and microorganisms are required, especially to be familiar with the new environments inside MBBR, to optimize the removal efficiency [
6]. This can be obtained by doing the seeding and acclimatization processes (SAP) of microorganisms prior to the MBBR operation.
Study on SAP is thus crucial in familiarizing microorganisms with the wastewater; and can also support the enhancement of wastewater technologies especially the effect of the acclimatized microorganisms on the removal efficiency [
7,
8]. Many studies were then done concerning SAP. Most of them did the acclimatization process as part of their researches e.g., before running the treatment processes. Some of these researches acclimatized microorganisms in a laboratory-scale MBBR [
9,
10,
11]; some in a fixed bed [
12,
13]. To the best of our knowledge, only few studied the acclimatization process specifically [
14]. Lemire et al. (2015) [
14] did the SAP in the MBBR proxies. Moreover, from all the above previous researches, only Wałega et al. (2018) [
12] acclimatized microorganisms using a real sewage sampled from the septic tank (septage), although they also used ASP; yet they did the acclimatization in a hybrid plastic carriers fixed bed bioreactor laboratory model. Most of others did the acclimatization of microorganisms using ASP, either mixed it or not with other wastewaters [
9,
13]. The remaining studies used fresh sewage from the sewage treatment system, used synthetic wastewaters [
10,
11]; or used other waters i.e., oil sands process water (OSPW) and growth medium [
14]. There is still a need to study the SAP in the pilot or field scale treatment plant, particularly in the MBBR technology.
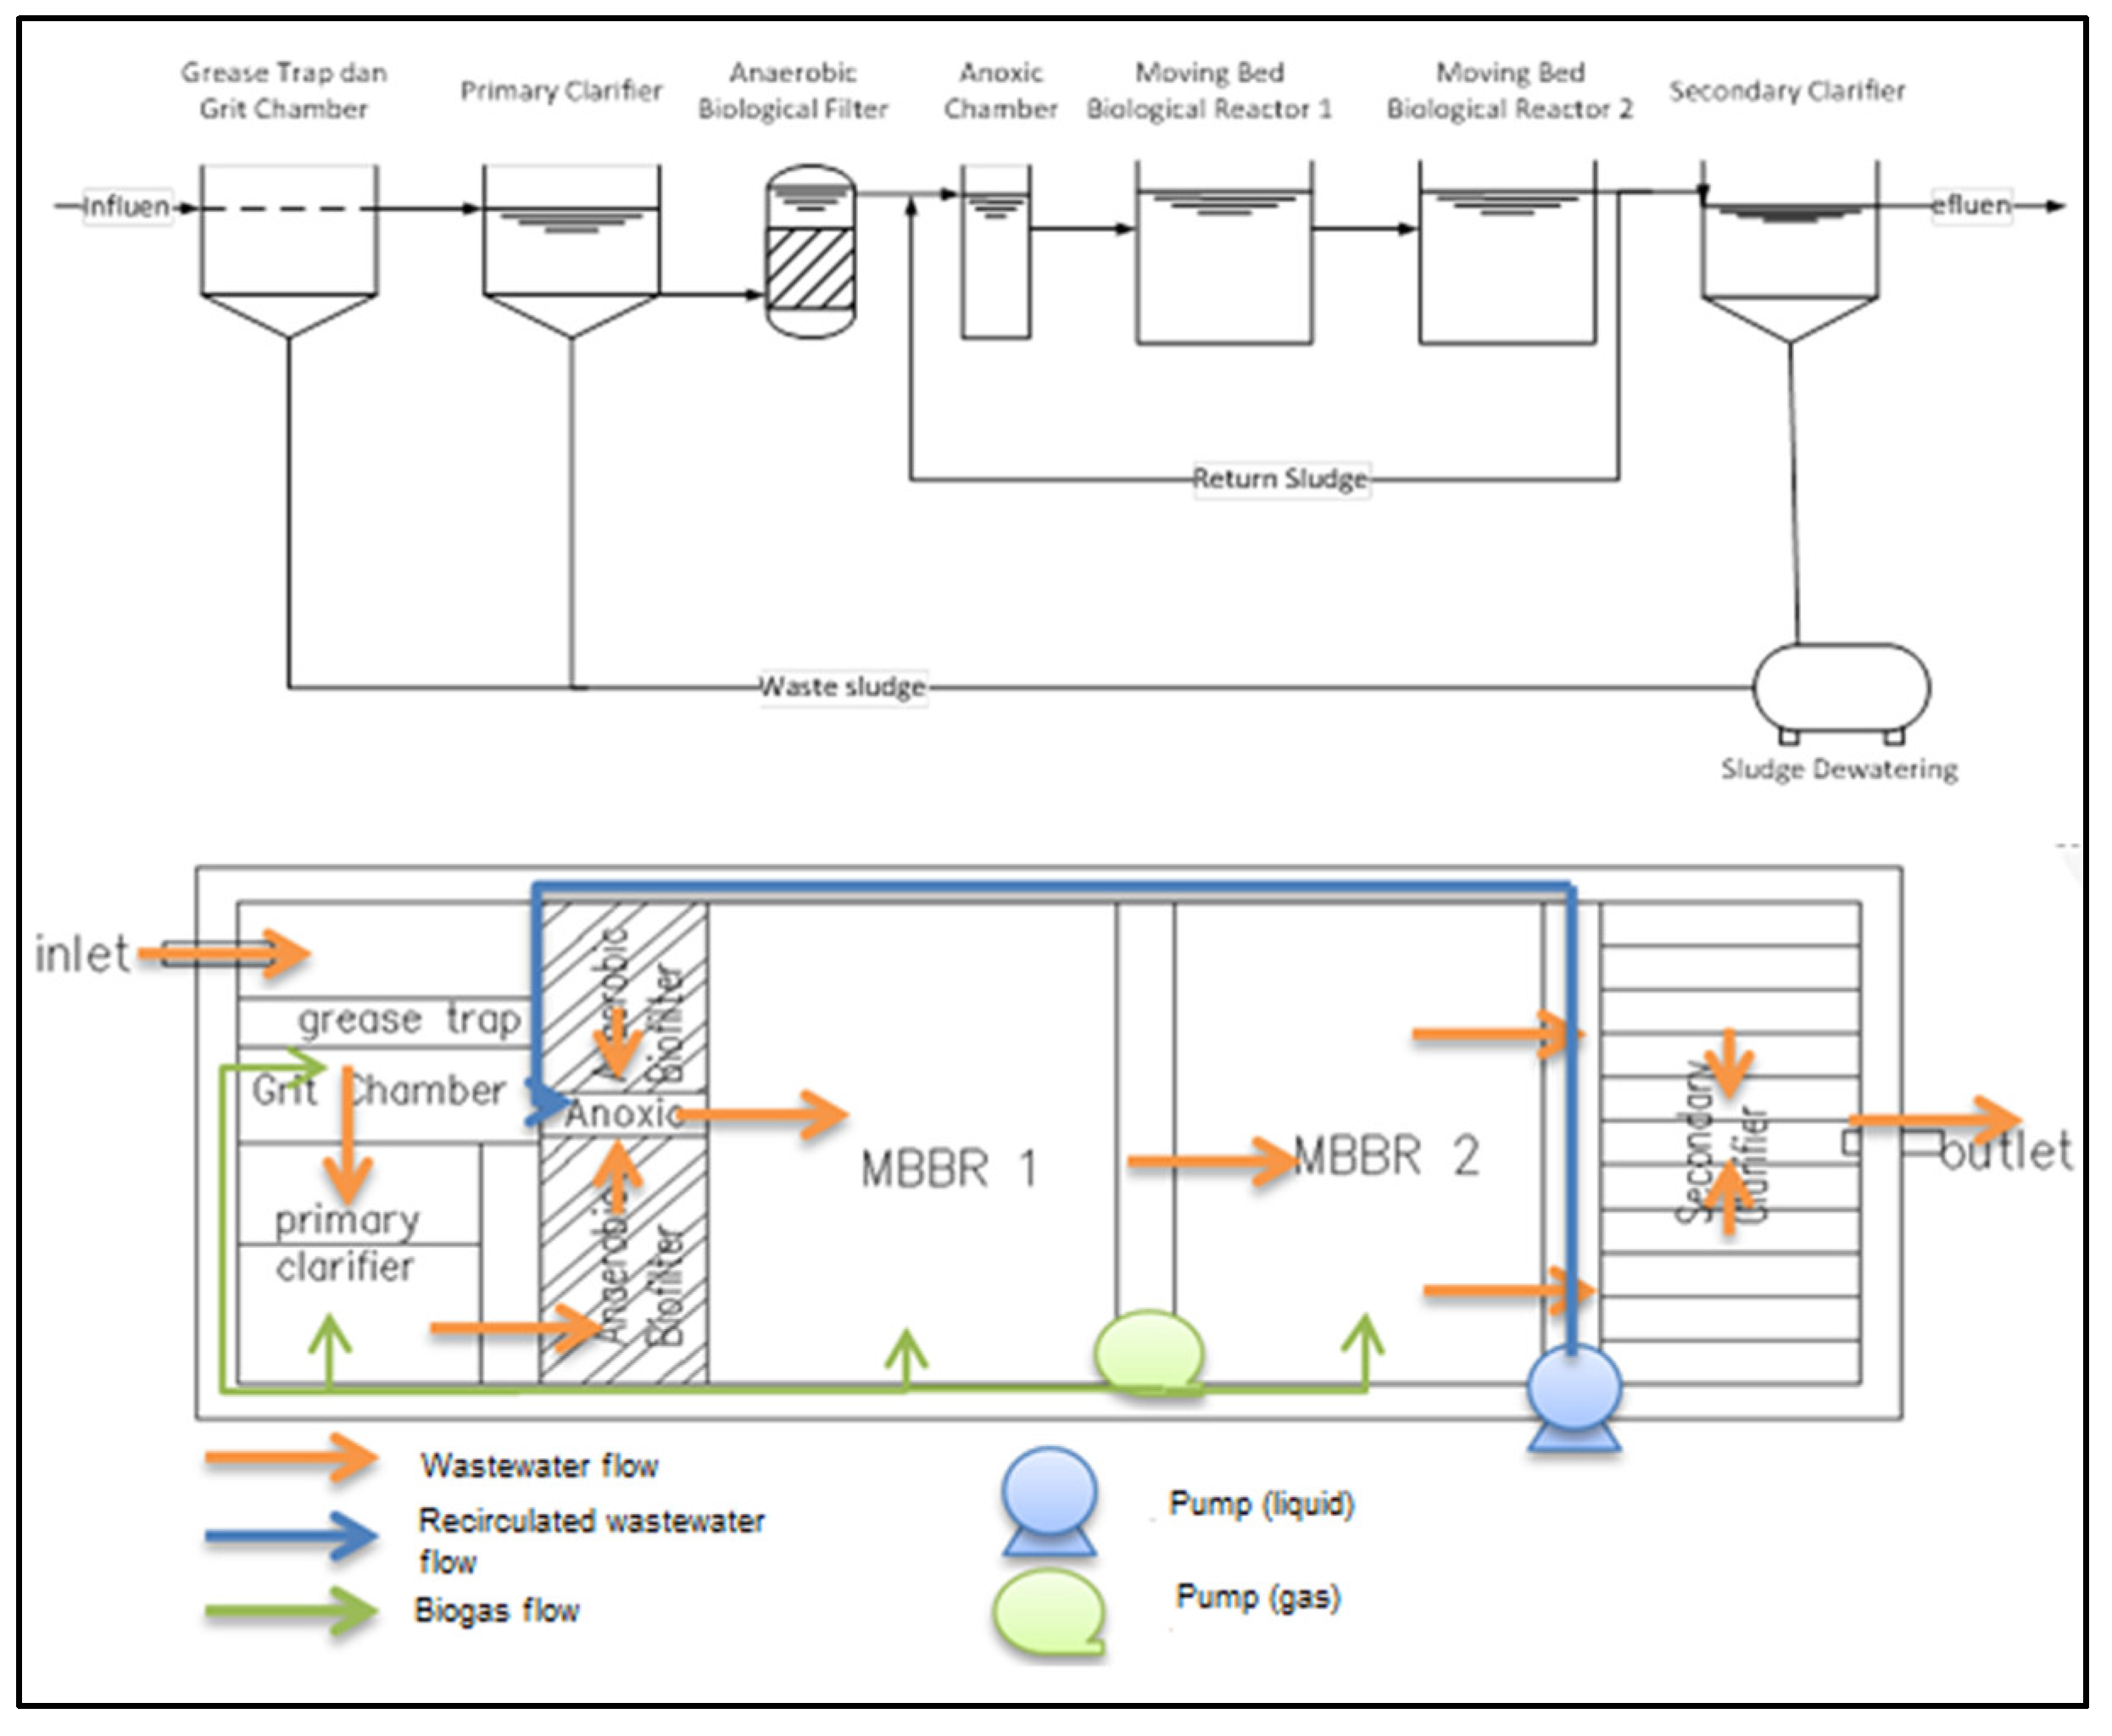
Therefore, this research was done to study the SAP in the pilot scale MBBR units embedded in a Compact Sewage Treatment Plant (CSTP) using septage from the septic tank. CSTP is considered as a compact mobile plant thus this innovative technology will overcome the high cost of investment dealing with the expensive construction cost (i.e., land acquisition) as compared to a conventional septage treatment plant. In this study, the times required for SAP, the magnitudes/conditions/concentrations of seeding and acclimatization parameters, and the growth of microorganisms during the acclimatization process executed in the MBBR units’ plant of CSTP were investigated specifically. CSTP consisted of several biological treatment units Figure 1, but this research was focused only on MBBR as it is considered as the main unit to remove organics using movable kaldnes media to support the growth of microorganisms. In this study, the effects of the SAP to the growth of biomass as well as on the removal efficiencies were able to be seen.
Figure 1.
Schematic process diagram and layout of the CSTP.
Figure 1.
Schematic process diagram and layout of the CSTP.
2. Materials and Methods
2.1. CSTP Pilot Scale
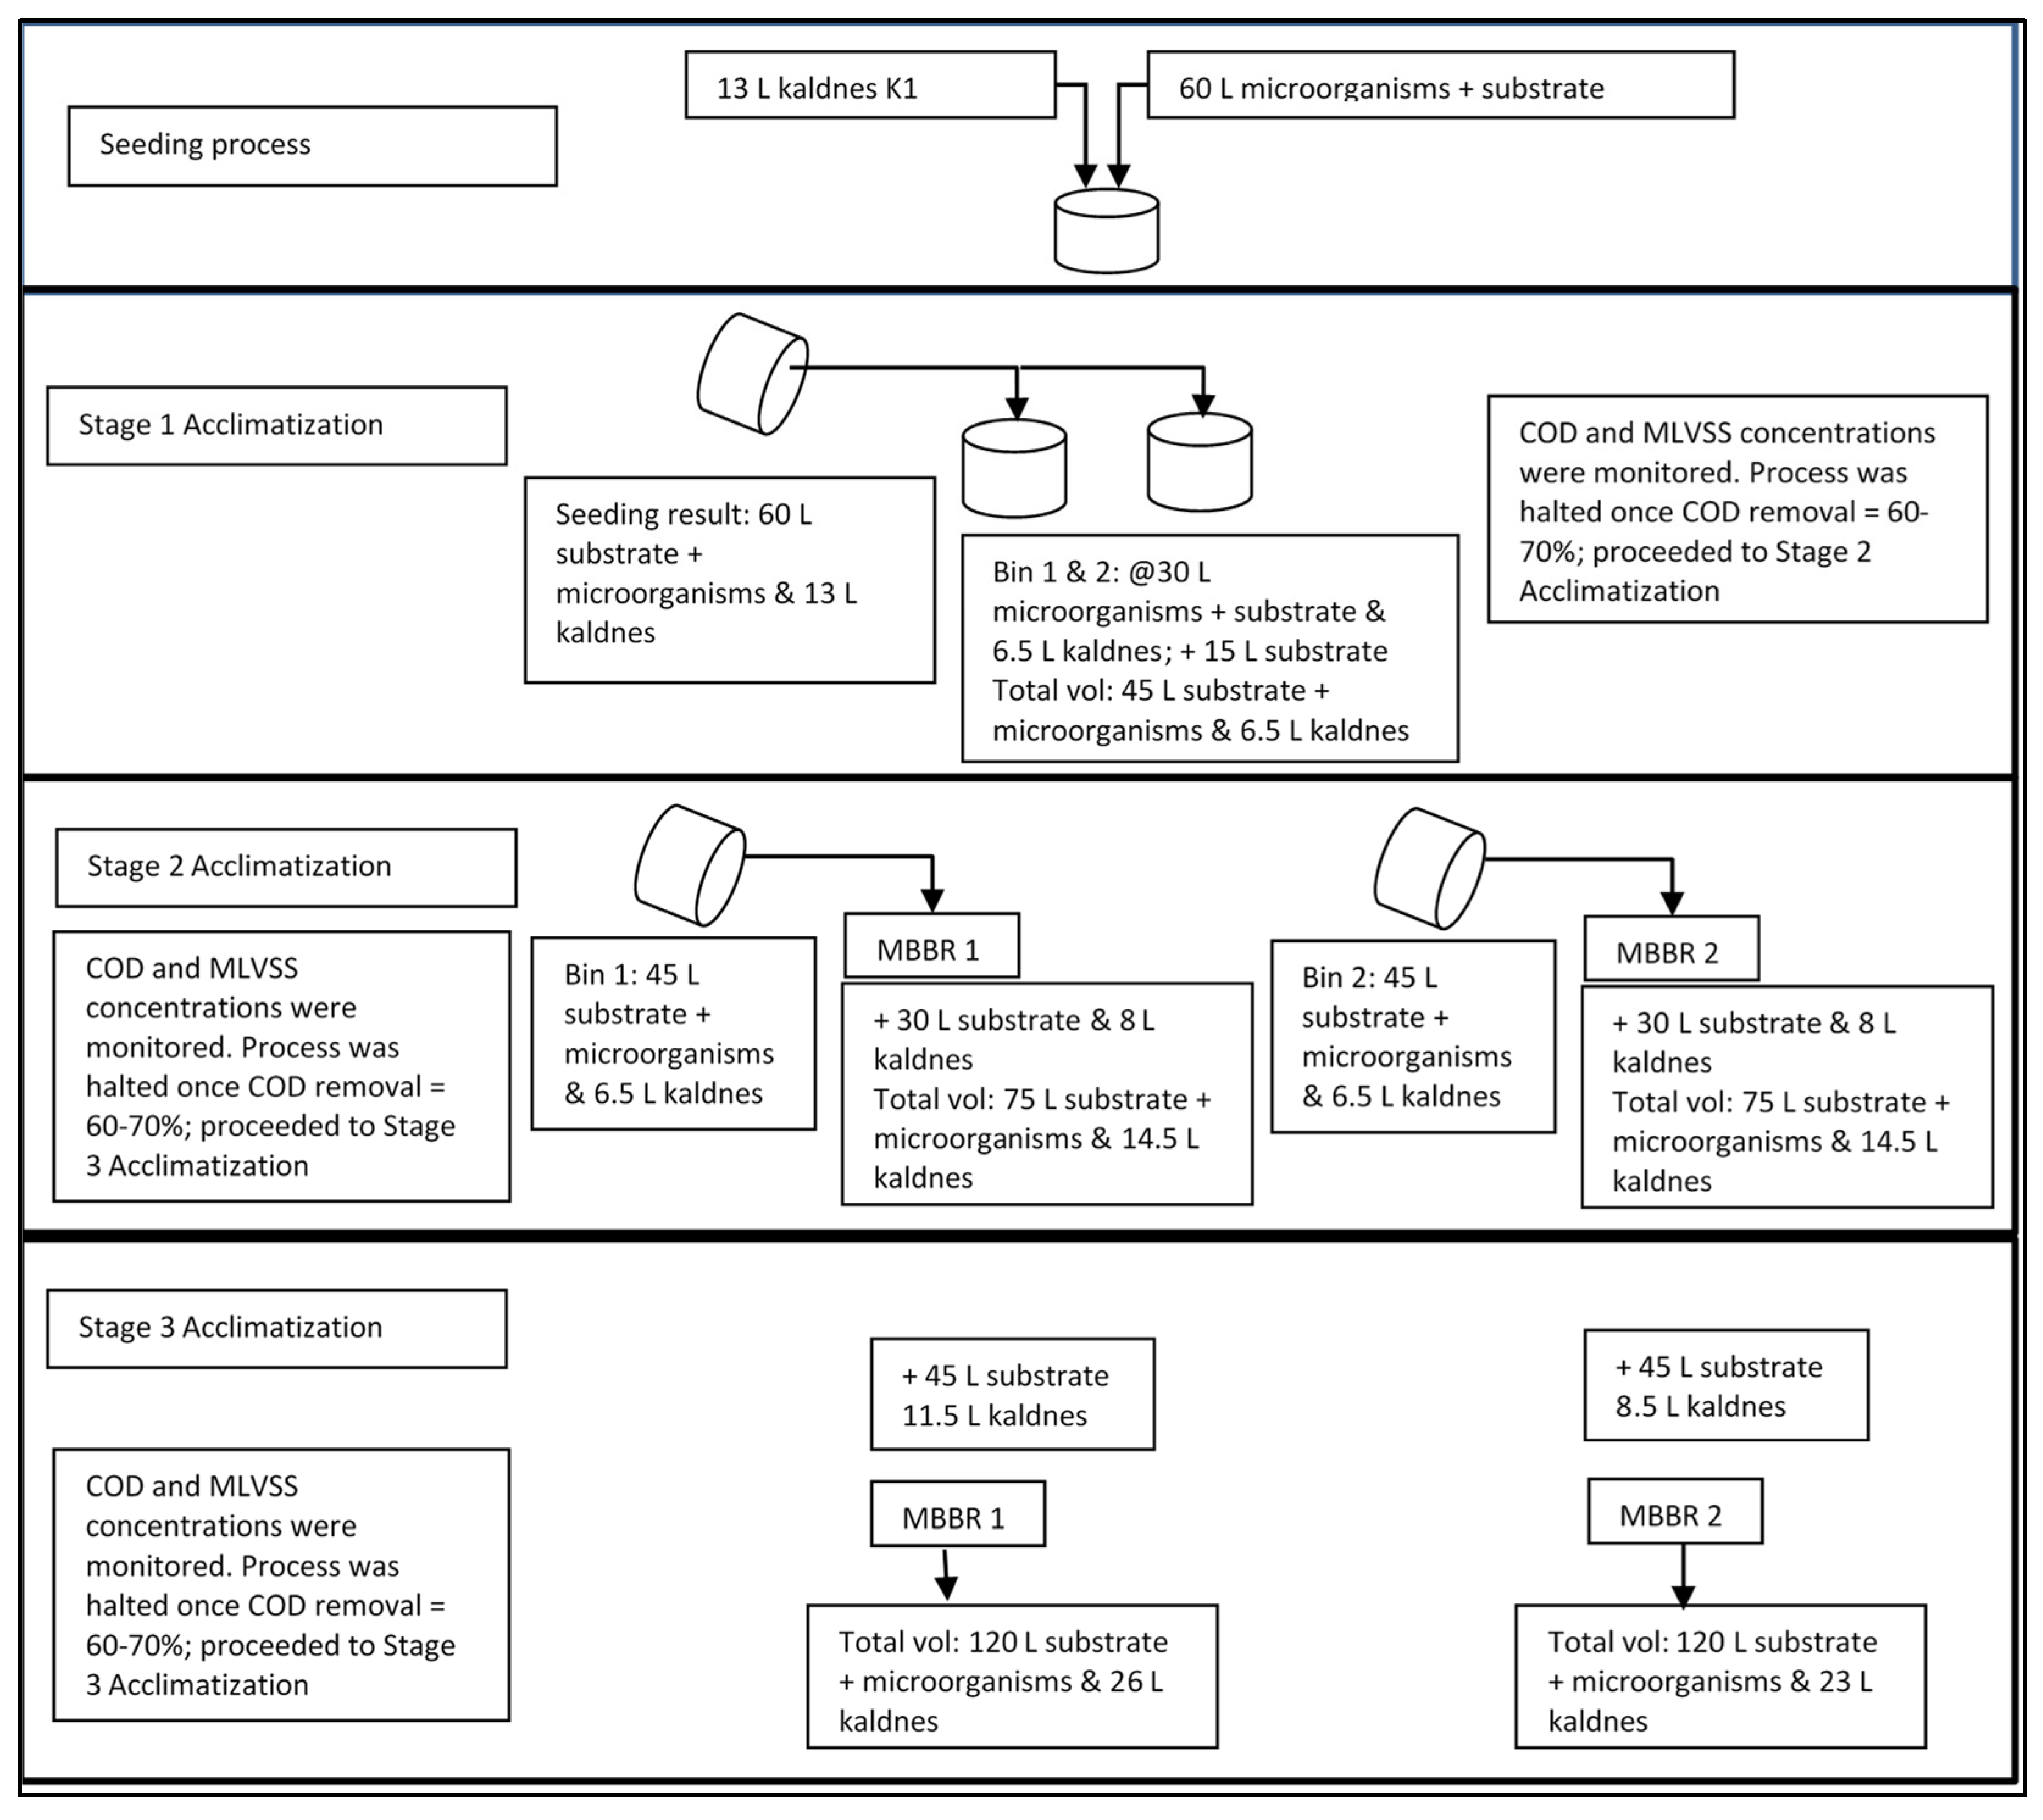
The pilot scale of CSTP was designed and constructed with a capacity of 1.4 m3/d which consists of grit chamber, primary clarifier, anaerobic biofilter, anoxic chamber, MBBR 1 and 2, and secondary clarifier unit Figure 1. SAP was done in a batch mode Figure 2. Seeding and analysis of all parameters of SAP were done in the Final Project Laboratory, Environmental Engineering Department (EED), Institut Teknologi Nasional (Itenas), Bandung, Indonesia; acclimatization was executed in the MBBR units of pilot plant CSTP located in the EED.
Figure 2.
Seeding and acclimatization process.
Figure 2.
Seeding and acclimatization process.
2.2. Seeding Procedure
2.2.1. Preparation of Microorganisms
Mixed liquor packed undefined microorganisms purchased from Environmental Engineering Study Program, Bandung Institute of Technology, Indonesia, were used in this study. The microorganisms were diluted into 7 Liter water and kept in a 100 Liter plastic bucket before used. In this study, the dilution was done with the septage, to avoid the death or inactivation of microorganisms due to chlor contained in the tap water.
2.2.2. Carrier Media
Carrier media purchased from Evolution Aqua Ltd. Englanda were in the form of circular polyethylene kaldnes K1 biofilm media with the specific gravity of 150 kg/m
3; diameter of 9.1 mm; length of 7.1 mm; and specific surface area of 500 m
2/m
3. Polyethylene carrier was employed in this study due to the advantage of thin, distributed and smooth biomass growth on their surface [
15].
2.2.3. Seeding and Adding Substrate & Kaldnes Media
Seeding was done on the microorganisms in a batch mode using septage as the substrate
Figure 2 to increase their growth because of rich content of organics, carbon, fats and oils. Air was continuously injected during the seeding process to trigger the growth of aerobic microorganisms [
16].
2.2.4. Analyzed Parameters
Visual and weight of 24 kaldnes media were analyzed during the seeding process to get the representative results [
9]. The weight of kaldnes media were measured, before and after the seeding process, using a Mettler Toledo analytical weight measurement in the EED Laboratory of Itenas, Bandung, Indonesia.
2.3. Acclimatization Procedure
Substrate was added in three stages to avoid shock loading of susceptible and unstable microorganisms [
17]. Air was continuously injected during the acclimatization process, and temperature was in accordance with the MBBR condition which was operated under aerobic condition therefore aerobic microorganisms were expected to grow
Figure 2 [
18].
2.3.1. Adding Substrate
Details of substrate additions are shown in
Figure 2.
2.3.2. Adding Kaldnes Media
Kaldnes media were also added into MBBR during the acclimatization process (Stage 2 & 3) to enhance the specific surface area where new microorganisms could attach and grow onto resulted from the addition of substrate during the acclimatization process. Kaldnes media were only added in Stage 2 & 3 due to the additions of substrate in Stage 2 & 3 were quite high, hence the microorganisms were expected to grow significantly; thus, more media were required.
The available kaldnes media was 7.4 kg with the specific gravity of 150 kg/m
3 and were divided proportionally with the volume of each MBBR unit (270 L and 240 L of MBBR 1&2 subsequently) (
Table 1), based on
Equation 1, thus each unit had the same filling ratio i.e., the ratio of the volume of the added media towards the water volume in the unit. Hence the organics removal efficiency by microorganisms in each unit was expected to be proportional.
Similar values of filling ratio (≈10%) in each MBBR unit were obtained using
Equation 2.
Table 1.
Addition of substrate & kaldnes media in seeding & acclimatization processes.
Table 1.
Addition of substrate & kaldnes media in seeding & acclimatization processes.
| Process |
Substrate Added (L) |
Kaldnes Media Added (L) |
| MBBR 1 |
MBBR 2 |
MBBR 1 |
MBBR 2 |
| Seeding |
53 L+7 L microorganisms = 60 L @ 30 L |
13 L @ 6.5L |
| Acclimatization Stage 1 |
15 |
15 |
- |
- |
| Acclimatization Stage 2 |
30 |
30 |
8 |
8 |
| Acclimatization Stage 3 |
45 |
45 |
11.5 |
8.5 |
| Total |
120 |
120 |
26 |
23 |
2.3.3. Analyzed Parameters
Parameters analyzed every day during the acclimatization process were Chemical Oxygen Demand (COD) and Mixed Liquor Volatile Suspended Solid (MLVSS) concentrations [
9,
10,
11,
19]; and pH and temperature in influent and effluent samples (
Table 2) [
9,
10]. Microorganisms were always fed with 20 gr glucose for every 200 mg/L drop of COD [
20]. All chemicals used were purchased from PT Merck Tbk, Indonesia, and were of reagent grade. Sampling was done only in MBBR 2 as each MBBR unit was treated equally.
Table 2.
Analyzed parameters.
Table 2.
Analyzed parameters.
| No. |
Parameter |
Analytical Method |
| 1. |
COD |
Closed reflux titrimetric (Indonesian National Standard (INS) No. 06-6989.2-2004) [21] |
| 2. |
MLVSS |
Gravimetric (INS No. 06-6989.3-2004) [22] |
| 3. |
pH |
Potentiometric electrode (INS No.06-6989.11.2004) [23] |
| 4. |
Temperature |
Potentiometric electrode (INS No.06-6989.11.2004) [23] |
2.4. Analysis of Biomass Growth
The results were presented as the MLVSS and COD concentrations. Relationship of both parameters was then analyzed and reviewed in accordance with the biomass growth based on the related literatures.
3. Results and Discussion
3.1. Seeding Process
Seeding was halted on day-6 when the colour of kaldnes media changed from white (before) into brown (after seeding) (
Figure 3). The change in colour suggested the attachment of microorganisms on the kaldnes carriers to create the biofilm [
24]. It is to note that Lemire et al., (2015) who used similar K1 seed carriers but from a different manufacture (Veolia Water Technologies) obtained shorter period of seeding (5 days). This may due to the used of the growth medium (soy broth, salts, and yeast extract) as compared to none used in this study [
14].
Figure 3.
Observed kaldnes media (a) Before seeding (b) After seeding.
Figure 3.
Observed kaldnes media (a) Before seeding (b) After seeding.
In the MBBR system, biomass plays a key role to control the performance of the system. The attachment of biomass to the carriers’ surface is particularly very important hence was studied by many other researchers [
9,
10,
12].
The kaldnes media were weighed before and after seeding; and the difference was found to be 0.074 gr/carrier showing the growth of biomass on the surface of the carrier [
9]. Other researchers weighed the biomass after the acclimatization [
9].
The fundamental target of MBBR is to immobilize the biomass on the carrier. Plastic (polyethylene, polypropylene) carriers are designed accordingly so as to protect biofilm loss and promote the growth of biofilm on the surface of the media [
25]. The result of this study showed that cylindrical polyethylene carriers were proved to provide area for the growth and stable attachment of microorganisms. Other researchers also claimed the same results [
9,
10,
14]. Freitas et al. (2022) who used a cylindrical shaped polypropylene carrier obtained the similar proof as well [
26].
The attachment of the biomass on the carriers in this study was only observed visually and confirmed by biomass weight. It is suggested that the active attachment of the biomass further observed microscopically (by using scanning electron microscope (SEM) etc.) as shown by other research [
14].
3.2. Acclimatization Process
Table 3 shows the results of Stage 1-3 acclimatization process i.e., the changes of measured parameters of pH, temperature, COD, and MLVSS.
Table 3.
Results of analyzed parameters during acclimatization process.
Table 3.
Results of analyzed parameters during acclimatization process.
| Acclimatization |
Day |
COD (mg/L) |
COD Removal Rate (%) |
MLVSS (mg/L) |
pH |
Temperature (oC) |
| Stage 1 |
1 |
1,144.6 |
- |
644.9 |
7.65 |
26.0 |
| 2 |
886.2 |
22.6 |
316.0 |
7.50 |
26.5 |
| 3 |
646.2 |
43.5 |
594.2 |
7.77 |
25.5 |
| 4 |
738.5 |
35.5 |
562.0 |
7.65 |
26.0 |
| 5 |
400.0 |
65.1 |
794.0 |
7.15 |
25.9 |
| Stage 2 |
1 |
965.4 |
- |
824.0 |
6.54 |
26.9 |
| 2 |
733.9 |
24.0 |
478.0 |
7.31 |
25.8 |
| 3 |
576.6 |
40.3 |
414.0 |
7.34 |
24.3 |
| 4 |
368.7 |
61.8 |
562.0 |
7.53 |
25.1 |
| Stage 3 |
1 |
1,009.0 |
- |
909.0 |
7.10 |
24.7 |
| 2 |
654.5 |
35.1 |
638.0 |
6.88 |
25.3 |
| 3 |
344.8 |
65.8 |
316.0 |
6.50 |
26.7 |
| 4 |
475.7 |
52.9 |
488.0 |
6.54 |
25.8 |
| 5 |
275.9 |
72.7 |
770.0 |
7.15 |
25.9 |
| 6 |
206.9 |
79.5 |
908.0 |
7.31 |
26.9 |
| 7 |
275.8 |
72.7 |
972.0 |
7.77 |
26.0 |
3.2.1. pH
pH measured was in the range of 6.50-7.77; which was in-line with the optimum pH for carbon oxidation, i.e., 6.50-8.50 [
27]; the growth of bacteria in general, i.e., 6.50-7.50 [
1]; nitrification bacteria, i.e., 7.20-8.00 [
28]; and polyphosphate-accumulating organisms (PAOs), i.e., 5.00-6.50, or 6.50-7.00 (5.5>8.5) [
29]. Therefore, it is postulated that the organotroph microorganisms were considered to be well alive (and grow) in the system under this condition.
3.2.2. Temperature
Temperature measured was in the range of 24.30-26.90°C showing the conditions where mesophilic bacteria are active enough to degrade organics, i.e., 25-40°C [
30]; nitrification bacteria can live, i.e., 23.00-30.00°C; and are optimum, i.e., 25.00-30.00°C [
31]. However, this range did not comply with the range of temperature where PAOs bacteria can survive, i.e., 5-20°C [
32]. Nevertheless, the temperature values supported the environment where organic degrading microorganisms could grow well.
3.2.3. Stage 1 Acclimatization Process
COD, MLVSS, pH and temperature were analyzed every day to monitor the process of microorganisms’ growth, so as the formed microorganisms would be able to adapt with and survive in their new environments displayed by the stability of the removal rate of COD, and the constant growth rate of microorganisms.
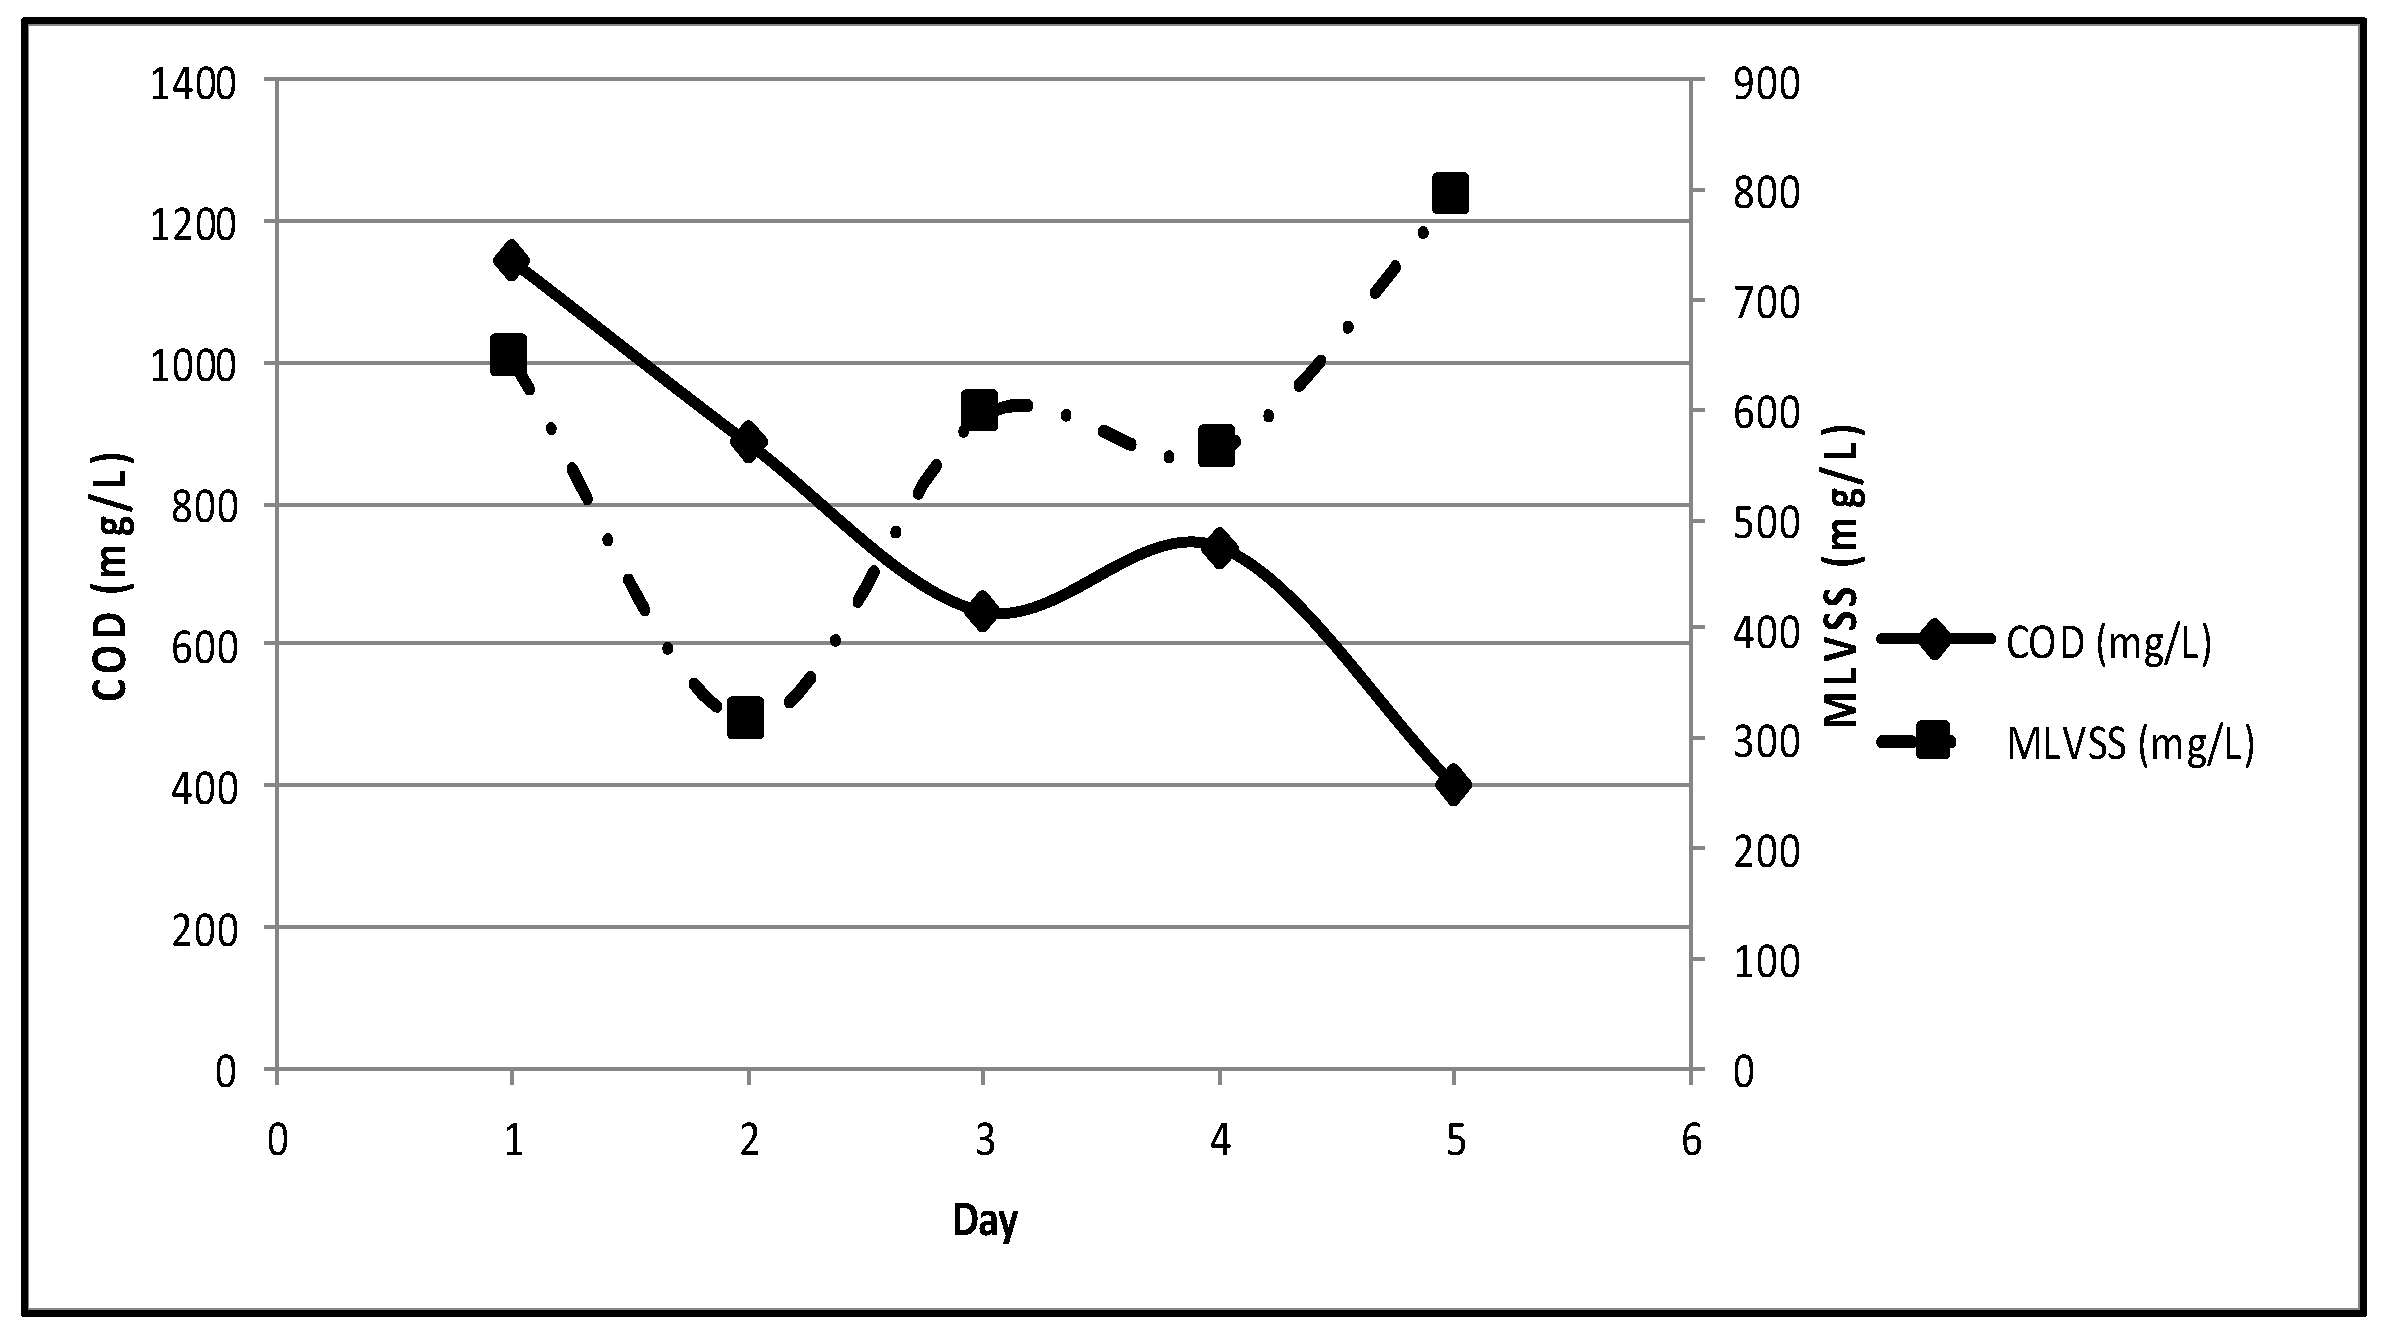
On day-1, COD was 1,145 mg/L and the acclimatization stage was terminated on day-5 when COD was 400 mg/L, and MLVSS was 794 mg/L (
Figure 4); resulting in the removal rate of 65.1%. Tchobanoglous et al. (2014) stated that the optimum removal rate in the biological process generally was about 60-70%; thus, the result was somehow expected [
1]. In addition, acclimatization (in day-5) was halted to avoid the further decrease of COD resulting in the lack of the remaining substrate for microorganisms.
Figure 4.
COD and MLVSS in stage 1 acclimatization.
Figure 4.
COD and MLVSS in stage 1 acclimatization.
3.2.4. Stage 2 Acclimatization Process
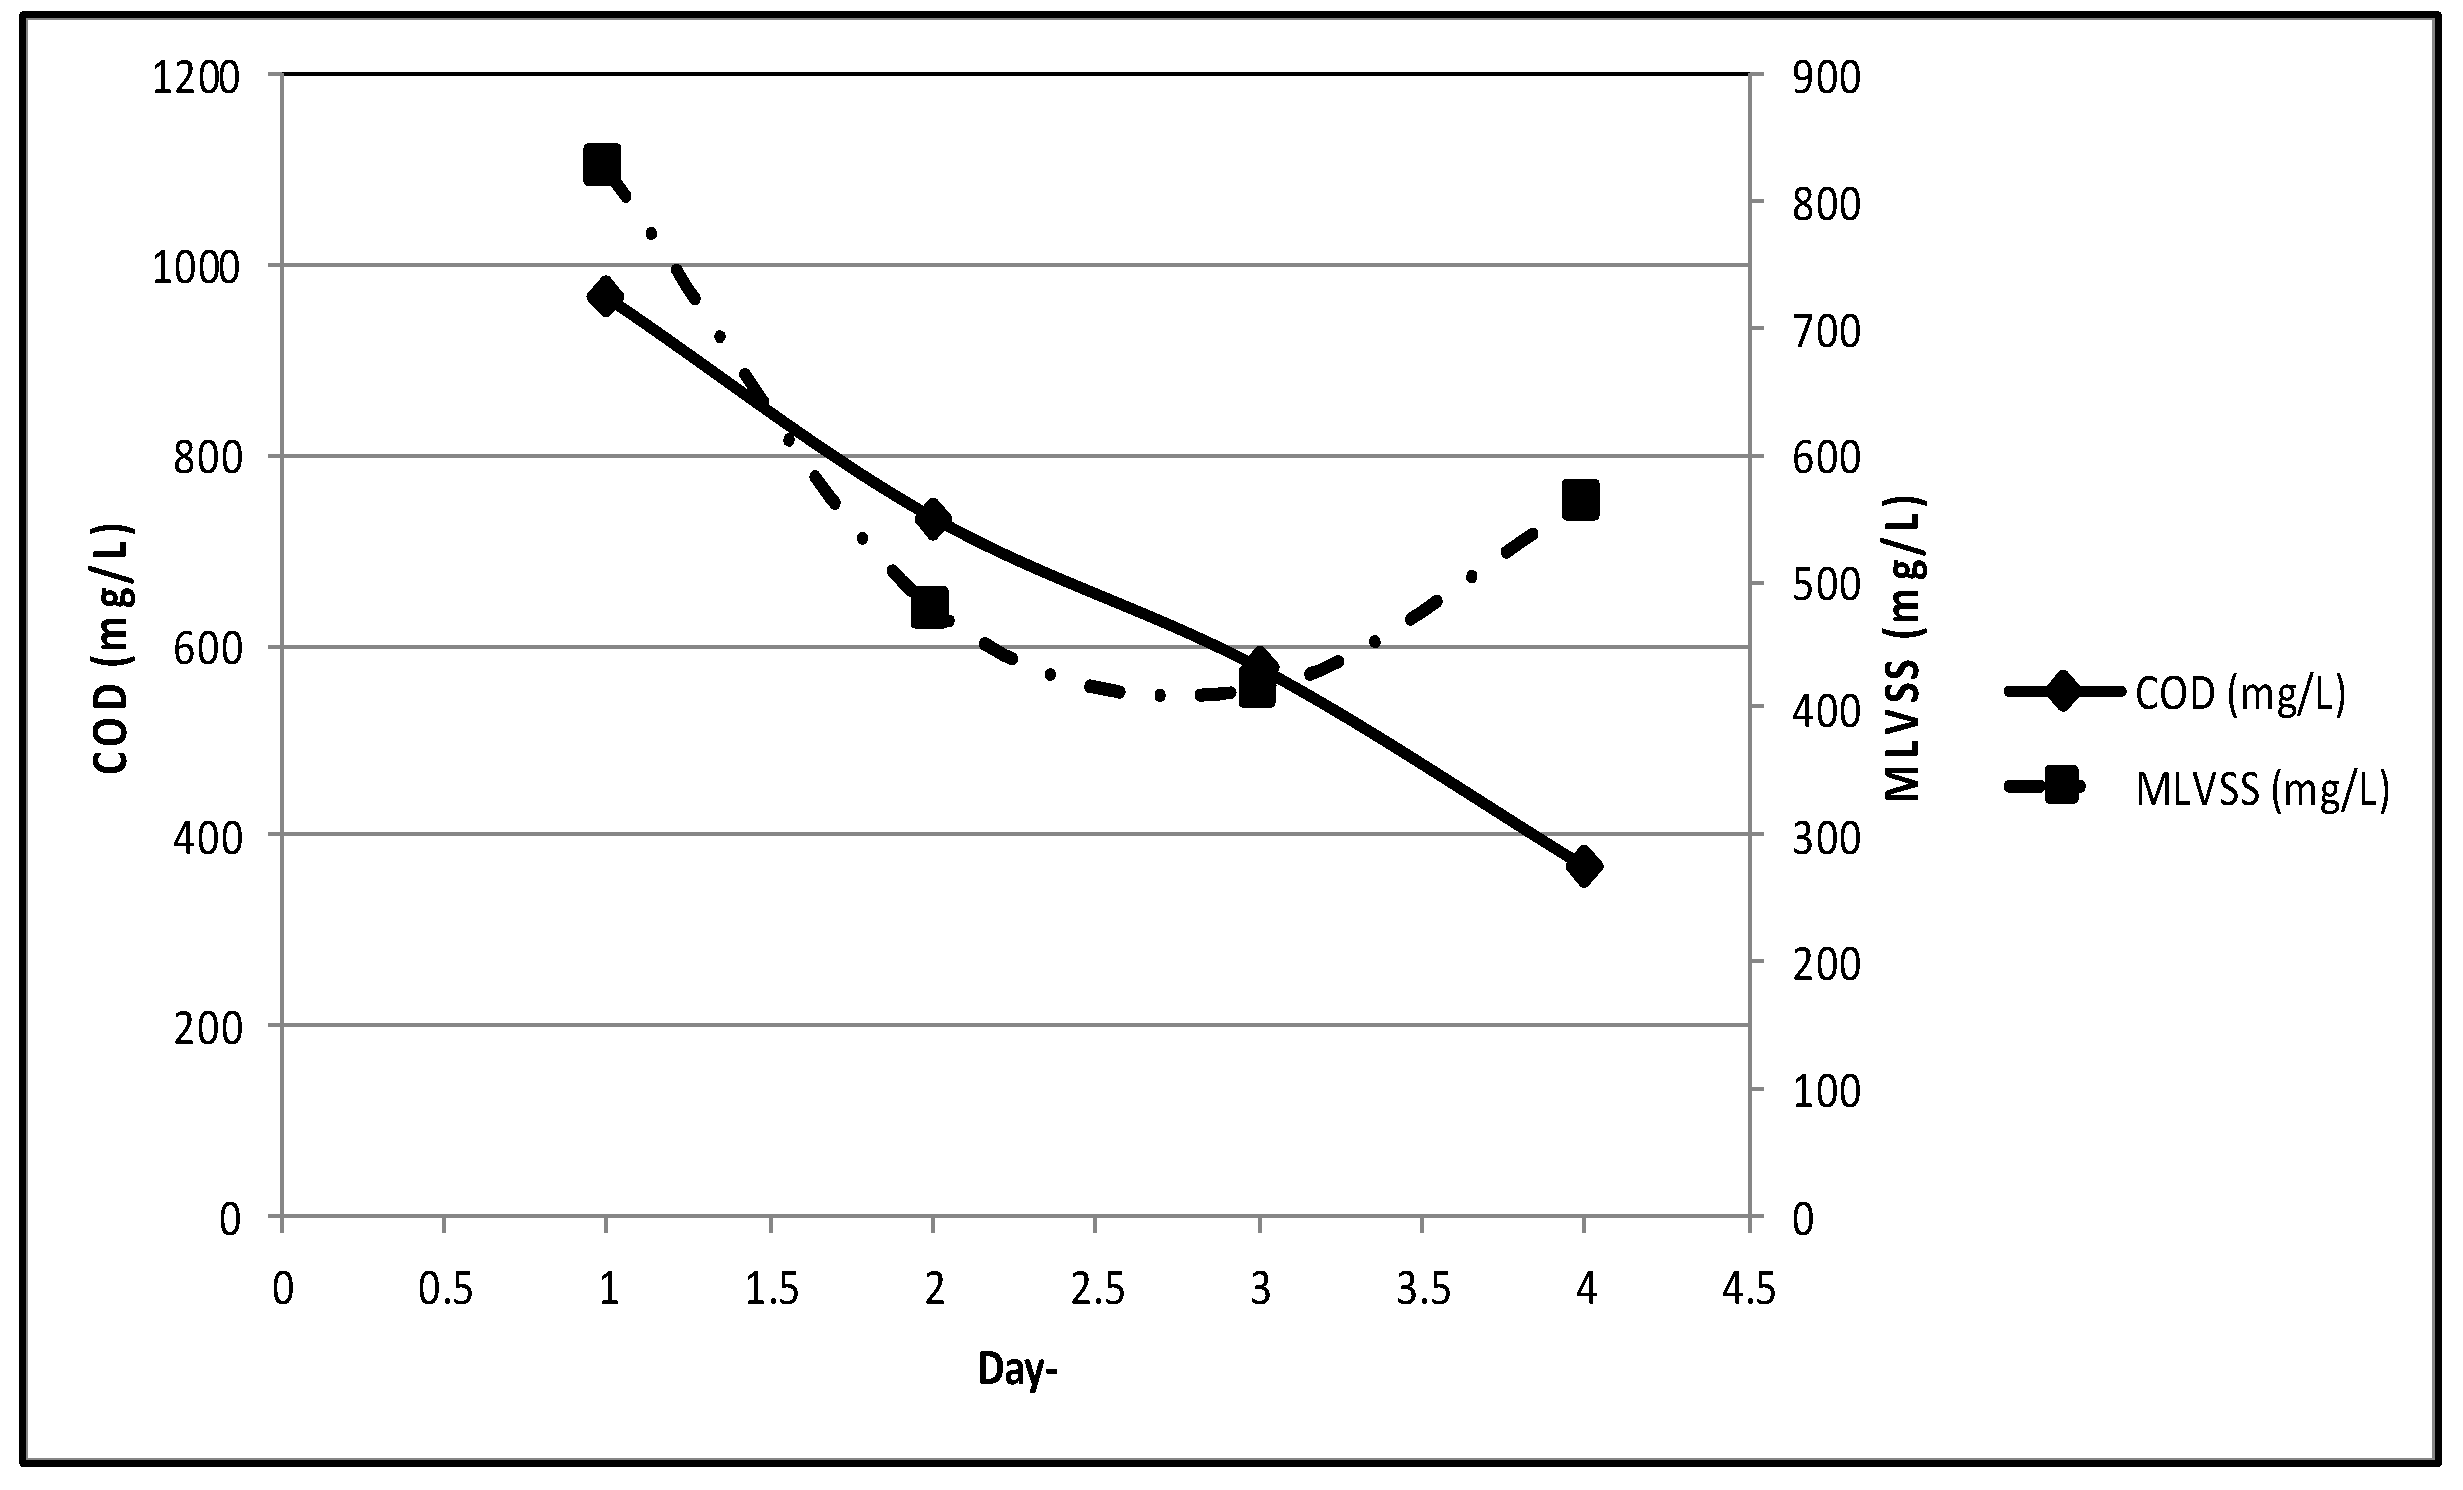
In Stage 2.30 L, new substrate was added to each MBBR unit to avoid the lack of nutrition for the microorganisms, as only 400 mg/L substrate (as COD) remained in Stage 1. On day-1, COD was 965 mg/L, and MLVSS was 824 mg/L. On day-4, acclimatization was terminated once COD reached 368.68 mg/L, and MLVSS was measured of 562 mg/L (
Figure 5). The removal rate was 61.8%, as expected, and was in conformity with Tchobanoglous (2014) [
1].
Figure 5.
COD and MLVSS in stage 2 acclimatization.
Figure 5.
COD and MLVSS in stage 2 acclimatization.
3.2.5. Stage 3 Acclimatization Process
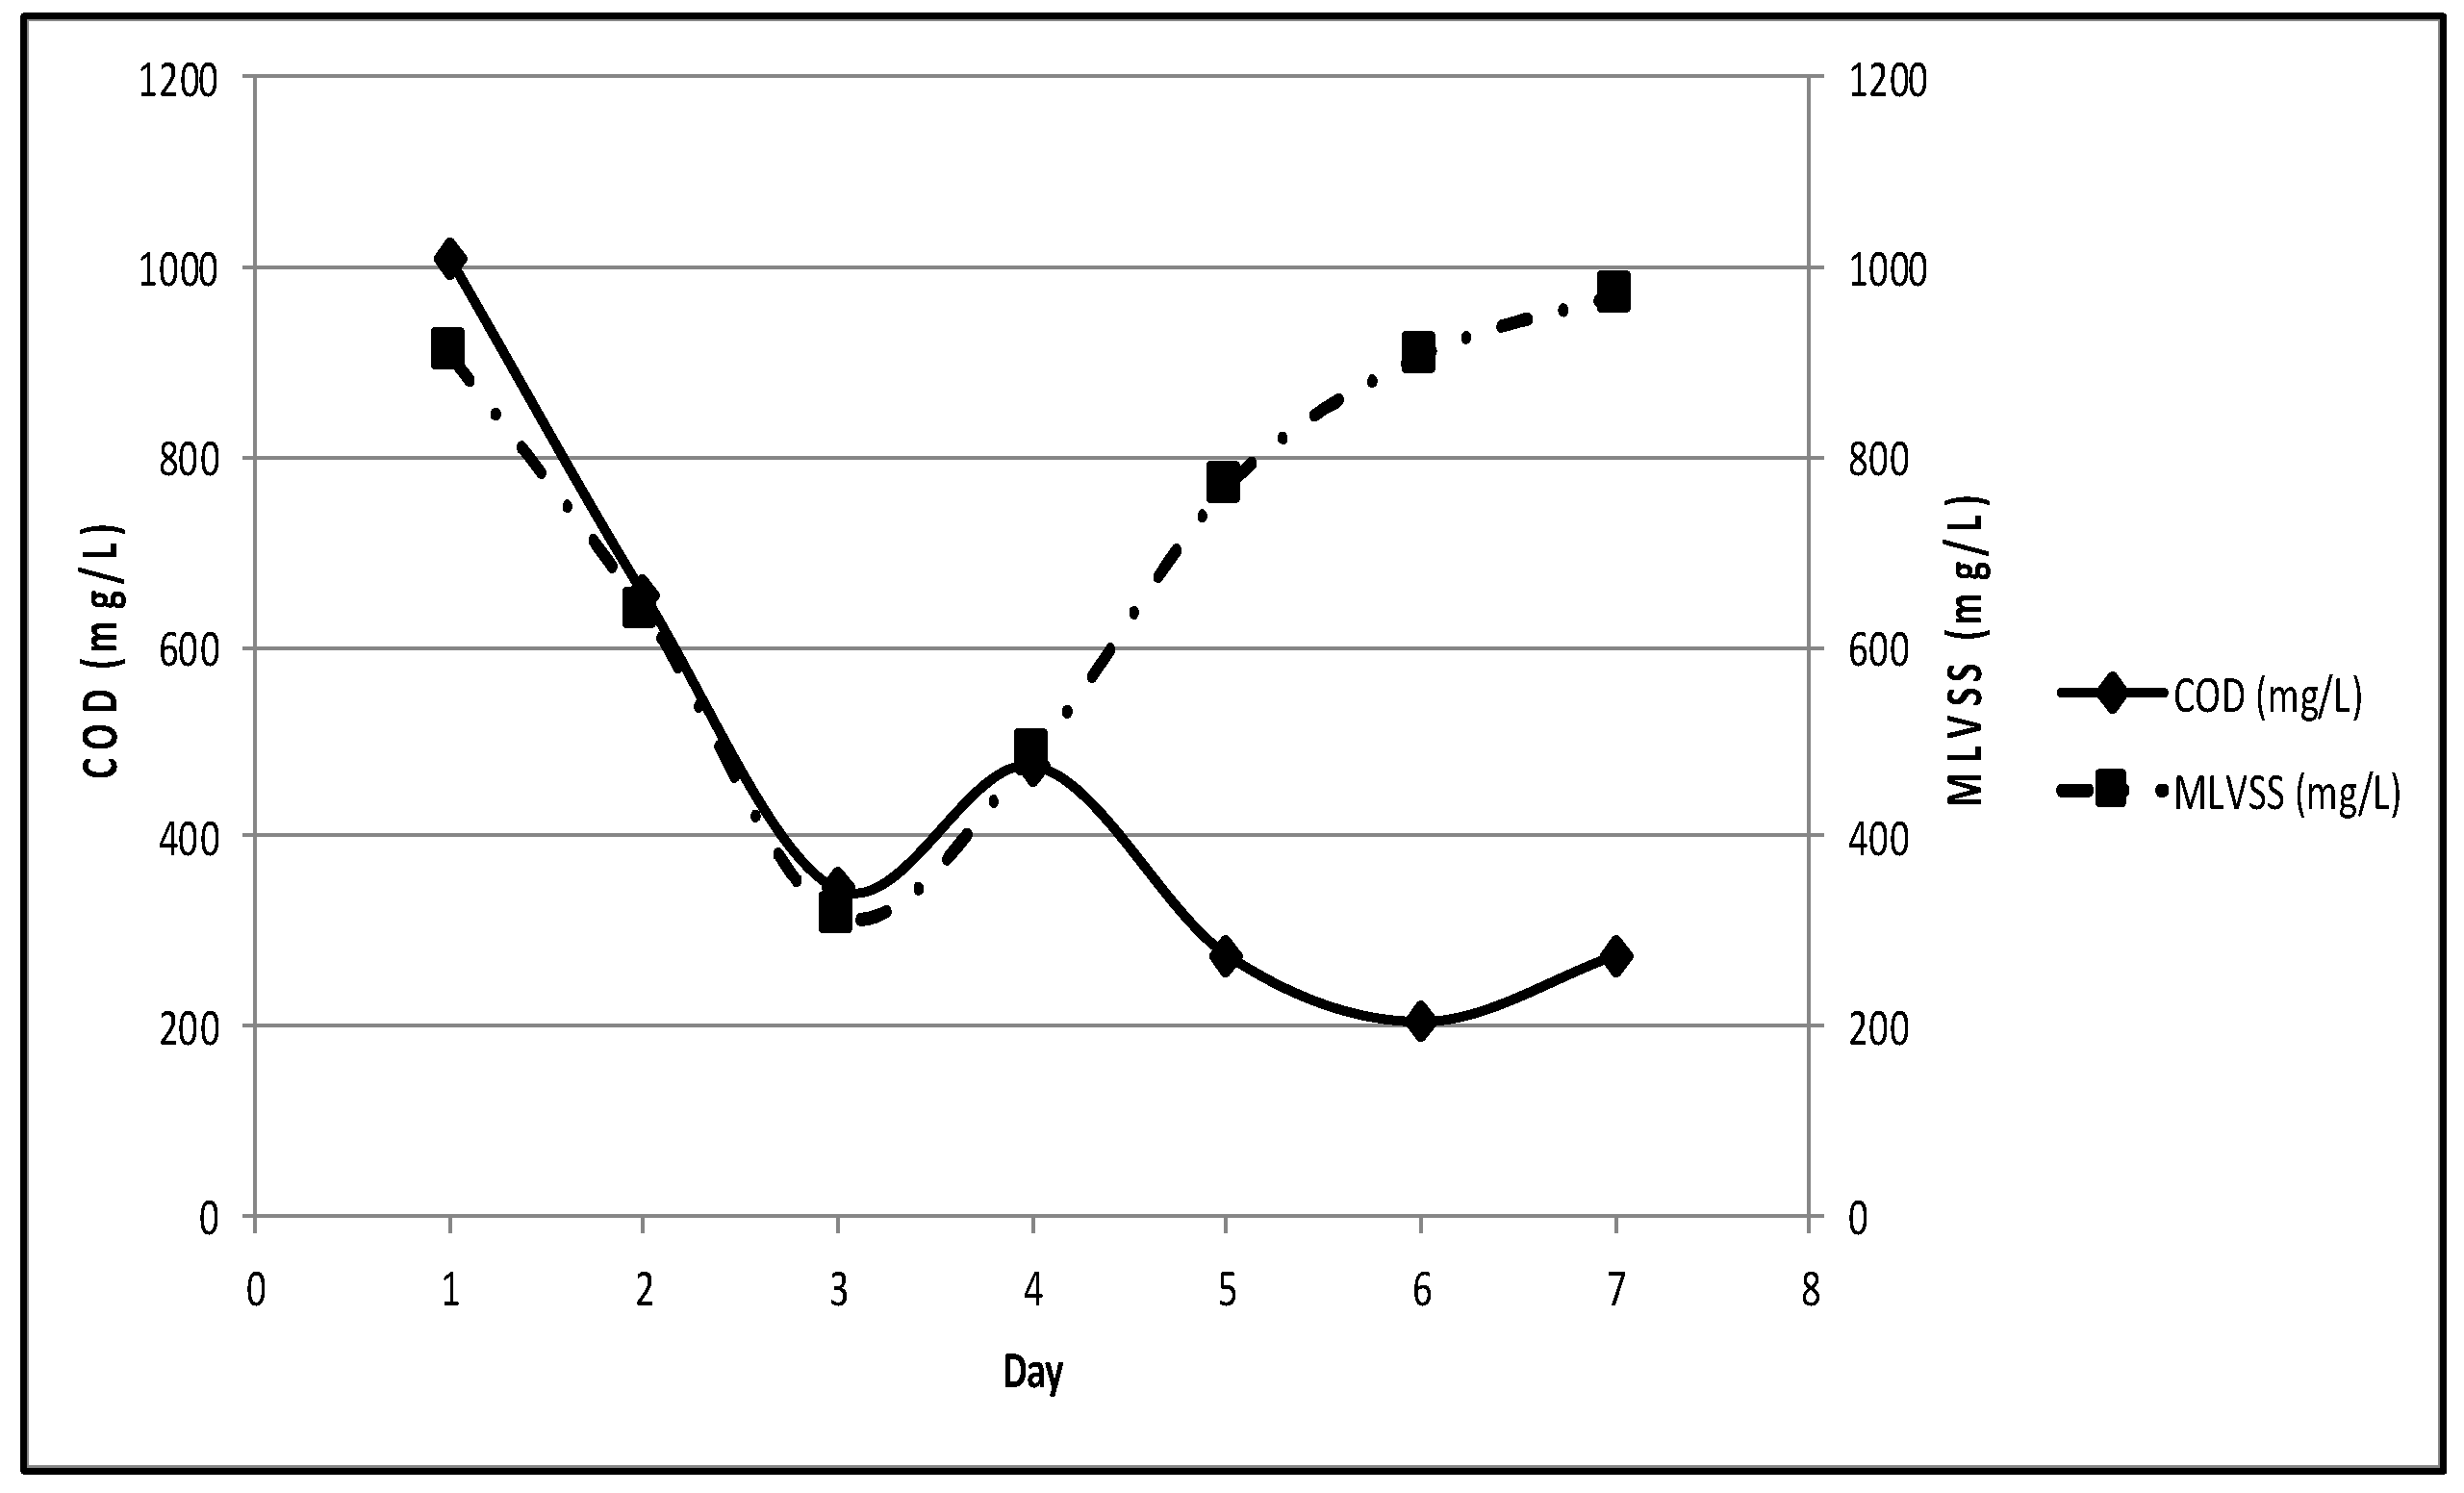
With the same previous reason, new substrate was added to each MBBR in Stage 3. COD on day-1 was measured of 1,009 mg/L while MLVSS was 909 mg/L. Acclimatization was halted on day-7 once COD reached 276 mg/L, while MLVSS measured was of 972 mg/L (
Figure 6). The removal rates of COD on day-5-7 were 72.66%, 79.50%, and 72.66% respectively with the differences of less than 10%; in-line with Tchobanoglous (2014) who stated that acclimatization was done once the constant removal rate of COD was achieved or the difference of removal rate was nearly 10% [
1]. This was also in agreement with Maulidiany (2015) and Rifaldi (2015) who stated that stabilized or less than 10% fluctuation of COD reflected high activity rate of bacteria to degrade the organics [
19,
20]. In addition, the 73-79.50% removal rates were the optimum removal rates as defined by Tchobanoglous (2014) [
1].
Figure 6.
COD and MLVSS in stage 3 acclimatization.
Figure 6.
COD and MLVSS in stage 3 acclimatization.
All this showed that the acclimatization process was considered to be completed, and the microorganisms well adapted to the MBBR system, hence could be further applied to treat septage using CSTP. The whole acclimatization process was 16 days in total; and with seeding, the total process of growing and adapting microorganism in the MBBR system was 22 days. This acclimatization time was shorter than Adabju (2013) that reported 30 days of acclimatization period. This might be due to the K1 kaldnes carriers used in this study was smaller (diameter = 9.1 mm) than Adjabu (2013) (diameter =4.5 cm); resulted in higher surface area (=500 m
2/m
3), hence promoting faster adaption of microorganisms to the carriers [
33].
3.2.6. The Growth of Biomass
MLVSS was used as a proxy to find out the bacterial growth during the acclimatization process. However, in this study, the measured MLVSS could not represent the whole biomass grown in the MBBR, as MBBR is an attached growth system. For the attached growth system, 90% microorganisms would attach to the carriers, so the measured MLVSS only represented the number of suspended microorganisms, i.e., 10%, hence the attached microorganisms could not be measured in this study [
34]. However, the growth of biomass analysis was still be done using the assumption that by having the constant removal rate of COD, microorganisms were considered able to grow, proliferate, and stabilized, hence could be employed to degrade organics in the MBBR system.
By using this assumption, the growth phases of microorganisms were clearly shown in Stage 3; the acclimatization process was thus halted as the stabilized growth was observed. In Stage 3, a lag phase occurred on day 1-3, shown by the decrease of MLVSS. On day-1, substrate was just added, so as available food for microorganisms was excessive, thus the rate of microorganisms’ growth and proliferation was limited by their ability to adapt to degrade the food [
35]. The decrease in MLVSS concentration indicated the adaptation process of microorganisms towards their environments (to cultivate the substrate); both the decrease of organics in septage and also the increase growth of new microorganisms (that were adaptable with the new environments) on the kaldnes media. The growth of microorganisms was marked by the reduction of COD on day 1-3 describing the removal of organics (by microorganisms) used for their metabolisms and protoplasm synthesis processes [
36,
37].
After the microorganisms could well adapt with their new environments, constant increases of the exponential growth of microorganisms occurred (constant growth rate), on day 3-5, thus the removal of organics occurred in the same rate as shown by the constant exponential increase in the MLVSS, and the decrease in COD concentration [
36,
37]. On day 5-7, the growth rate of microorganisms started to constantly decline (declining growth rate), hence, the removal of organics reduced in the same rate as indicated by the decreasing of MLVSS enhancement and of COD constantly [
36,
37]. Stationary and endogenous phases were not detected as the acclimatization process was terminated on day-7.
For Stage 1 & 2, the growth phases of microorganisms were not clearly seen, due to the acclimatization processes were already halted on day-5 and 4 for Stage 1 & 2 subsequently. However, similar to Stage 3, in Stage 1 & 2, a lag phase also existed where the reduction of MLVSS occurred (on day 1-2 for Stage 1, and day 1-3 for Stage 2), accompanied by the decrease of COD.
For Stage 1, the growth rates of microorganisms were fluctuated; increased on day 2-3 and 4-5; yet decreased on day 3-4; indicating the growth of microorganisms was not yet stabile. For Stage 2, the growth rates of microorganisms went up on day 3-4; however, the growth of microorganisms could not be seen further as the acclimatization process was stopped on day-4.
4. Conclusions
SAP was done totally in 22 days; 6 days for seeding and 16 days for acclimatization process. Seeding was terminated on day-6 as the carrier changed into brown (from white, before seeding); and was 0.0740 gr heavier than before seeding. Acclimatization was completed on day-16 once the difference in the removal rate ≤ 10% (the removal rate ranged from 72.7 to 79.5%); and MLVSS were considered stabile (day -15-16 = 908-972 mg/L). pH during acclimatization were 6.50-7.77; thus, organotroph microorganisms were considered to survive and could degrade organics contained in the septage. Temperature values were observed within a range of 24.3-26.9°C, hence mesophilic bacteria were considered to be active to remove organics, and nitrification bacteria could survive. The growth of microorganisms was clearly seen in Stage 3 acclimatization, where a lag phase; and a growth phase showing a constant increase of microorganisms followed by a declining growth rate of microorganisms were occurred.
The completed acclimatization showed that microorganisms could well adapt with the MBBR system, and ready to degrade organics contained in septage in CSTP. Further research needed involving the use of scanning electron microscope (SEM) to observe and confirm the biomass attachment on the carriers’ media.
Author Contributions
Conceptualization, methodology, resources, supervision, validation, writing-original draft, writing-reviewing and editing, project administration R.S.D.; conceptualization, data curation, formal analysis, investigation, methodology, visualization, L.R., W.I.; writing-original draft, D.A.P., S.A.S.; conceptualization, methodology, resources, W.H.S.; visualization, writing-reviewing and editing, G.S.
Data Availability Statement
The original contributions presented in the study are included in the article, further inquiries can be directed to the corresponding author/s.
Conflicts of Interest
The authors declare no conflict of interest.
References
- Tchobanoglous, G. Wastewater Engineering: Treatment and Resource Recovery; McGraw Hill: New York City, 2014. [Google Scholar]
- Gupta, B.; Gupta, A.K.; Ghosal, P.S.; Lal, S.; Saidulu, D.; Srivastava, A.; Upadhyay, M. Recent advances in application of moving bed biofilm reactor for wastewater treatment: Insights into critical operational parameters, modifications, field-scale performance, and sustainable aspects. Journal of Environmental Chemical Engineering 2022, 10, 107742. [Google Scholar] [CrossRef]
- Dezotti, M.; Lippel, G.; Bassin, J.P.; Bassin, J.P.; Dezotti, M. Moving bed biofilm reactor (MBBR). Advanced Biological Processes for Wastewater Treatment: Emerging, Consolidated Technologies and Introduction to Molecular Techniques. 2018; 37–74. [Google Scholar]
- Sehar, S.; Naz, I. Role of the biofilms in wastewater treatment. Microbial biofilms-importance and applications, 2016; 121–144. [Google Scholar]
- Leyva-Díaz, J.C.; Monteoliva-García, A.; Martín-Pascual, J.; Munio, M.; García-Mesa, J.; Poyatos, J. Moving bed biofilm reactor as an alternative wastewater treatment process for nutrient removal and recovery in the circular economy model. Bioresource Technology 2020, 299, 122631. [Google Scholar] [CrossRef] [PubMed]
- Boyle, K. Optimization of Moving Bed Biofilm Reactor (MBBR) Operation for Brewery Wastewater Treatment. Université d’Ottawa/University of Ottawa, 2019.
- Loganath, R.; Mazumder, D. Performance study on organic carbon, total nitrogen, suspended solids removal and biogas production in hybrid UASB reactor treating real slaughterhouse wastewater. Journal of Environmental Chemical Engineering 2018, 6, 3474–3484. [Google Scholar] [CrossRef]
- Suryawan, I.W.K.; Prajati, G.; Afifah, A.S.; Apritama, M.R. NH3-N and COD Reduction in Endek (Balinese Textile) Wastewater by Activated Sludge Under Different do Condition with Ozone Pretreatment. Walailak Journal of Science and Technology (WJST) 2021, 18, 9127. [Google Scholar] [CrossRef]
- Ateia, M.; Nasr, M.; Yoshimura, C.; Fujii, M. Organic matter removal from saline agricultural drainage wastewater using a moving bed biofilm reactor. Water Science and Technology 2015, 72, 1327–1333. [Google Scholar] [CrossRef] [PubMed]
- Oregon. Moving Bed Biofilm Reactor for Onsite Treatment of Winery Wastewater Final Technical Report; Oregon State University: Oregon, 2017. [Google Scholar]
- Magdum, S.; Kalyanraman, V. Evaluation of high rate MBBR to predict optimal design parameters for higher carbon and subsequent ammoniacal nitrogen remova. Current Science 2019, 116, 2083–2088. [Google Scholar] [CrossRef]
- Wałęga, A.; Chmielowski, K.; Młyński, D. Influence of the hybrid sewage treatment plant’s exploitation on its operation effectiveness in rural areas. Sustainability 2018, 10, 2689. [Google Scholar] [CrossRef]
- Khaing, N.N.M. , Theingi Ye Thin Kyi, Cho Cho Nitrogen Removal from Municipal Wastewater Using Integrated Fixed Film Activated Sludge Process and Anoxic Process. ASEAN Engineering Journal 2019, 9, 17–27. [Google Scholar] [CrossRef]
- Lemire, J.A.; Demeter, M.A.; George, I.; Ceri, H.; Turner, R.J. A novel approach for harnessing biofilm communities in moving bed biofilm reactors for industrial wastewater treatment. AIMS Bioengineering 2015, 2, 387–403. [Google Scholar] [CrossRef]
- Chen, Y.-T.; Xie, X.-L.; Zou, S.-Q.; Qiu, R.; Zhong, G.-J.; Lai, B.; Li, Z.-M. Tailored surface porosity of polyethylene-based co-continuous structures for moving bed biofilm reactor carriers. ACS Applied Polymer Materials 2020, 2, 3226–3233. [Google Scholar] [CrossRef]
- Purwanti, I.F.; Yoedihanto, G.; Masduqi, A. Test of Air Supply Variations in Processing Fecal Sludge with an Aerobic Digester. Jurnal Purifikasi 2020, 1–12. [Google Scholar]
- Widhyasih, K.; Budhijanto, W.; Purnomo, C.W. Evaluasi Waktu Start Up pada Proses Peruraian Limbah Stillage secara Anaerobik Menggunakan Reaktor Fluidized Bed Kontinyu dengan Zeolit sebagai Media Imobilisasi. In Proceedings of the Seminar Nasional Teknik Kimia” Kejuangan”; 2016; p. 11. [Google Scholar]
- Skouteris, G.; Rodriguez-Garcia, G.; Reinecke, S.; Hampel, U. The use of pure oxygen for aeration in aerobic wastewater treatment: A review of its potential and limitations. Bioresource technology 2020, 312, 123595. [Google Scholar] [CrossRef] [PubMed]
- Maulidiany, N.D. Organic and Nutrient Removal in Domestic Wastewater by Moving Bed Biofilm Reactor System Using Biochips. Bandung Institute of Technology, Bandung, 2015.
- Rifaldi, R.P. Removal of Total Phosphate and Determination of Alkalinity Levels in Domestic Liquid Waste Using Moving Bed Biofilm Reactor (MBBR). Bandung Institute of Technology, Bandung, 2019.
- BSN. SNI 6989.2:2019 Water and Wastewater-Part 2: How to Test Chemical Oxygen Demand (COD) with Closed Reflux Spectrophotometrically. 2019.
- BSN. SNI 6989.3:2019 Water and Wastewater-Part 3: How to Test Total Suspended Solids (TSS) Gravimetrically. 2019.
- BSN. SNI 6989.11:2019 Water and Wastewater-Part 11: How to Test the Degree of Acidity (pH) Using a pH Meter. 2019.
- Yeshanew, M.M.; Frunzo, L.; Luongo, V.; Pirozzi, F.; Lens, P.N.; Esposito, G. Start-up of an anaerobic fluidized bed reactor treating synthetic carbohydrate rich wastewater. Journal of environmental management 2016, 184, 456–464. [Google Scholar] [CrossRef] [PubMed]
- Deena, S.R.; Kumar, G.; Vickram, A.; Singhania, R.R.; Dong, C.D.; Rohini, K.; Anbarasu, K.; Thanigaivel, S.; Ponnusamy, V.K. Efficiency of various biofilm carriers and microbial interactions with substrate in moving bed-biofilm reactor for environmental wastewater treatment. Bioresource technology 2022, 359, 127421. [Google Scholar]
- Freitas, B.d.O.; Leite, L.d.S.; Hoffmann, M.T.; Lamon, A.W.; Daniel, L.A. Application of alternative carriers without protected surface in moving bed biofilm reactor for domestic wastewater treatment. Water Practice & Technology 2022, 17, 544–554. [Google Scholar]
- Li, Z.; Peng, Y.; Gao, H. Enhanced long-term advanced denitrogenation from nitrate wastewater by anammox consortia: Dissimilatory nitrate reduction to ammonium (DNRA) coupling with anammox in an upflow biofilter reactor equipped with EDTA-2Na/Fe (II) ratio and pH control. Bioresource Technology 2020, 305, 123083. [Google Scholar] [CrossRef] [PubMed]
- García-Ríos, L.; Miranda-Baeza, A.; Coelho-Emerenciano, M.G.; Huerta-Rábago, J.A.; Osuna-Amarillas, P. Biofloc technology (BFT) applied to tilapia fingerlings production using different carbon sources: Emphasis on commercial applications. Aquaculture 2019, 502, 26–31. [Google Scholar] [CrossRef]
- Weerasekara, A.W.; Jenkins, S.; Abbott, L.K.; Waite, I.; McGrath, J.W.; Larma, I.; Eroglu, E.; O’Donnell, A.; Whiteley, A.S. Microbial phylogenetic and functional responses within acidified wastewater communities exhibiting enhanced phosphate uptake. Bioresource technology 2016, 220, 55–61. [Google Scholar] [CrossRef] [PubMed]
- Schiraldi, C.; De Rosa, M. Mesophilic organisms. Encyclopedia of membranes 2014, 1–2. [Google Scholar]
- Wang, H.; Xu, Y.; Chai, B. Effect of Temperature on Microorganisms and Nitrogen Removal in a Multi-Stage Surface Flow Constructed Wetland. Water 2023, 15, 1256. [Google Scholar] [CrossRef]
- Zhang, Y.; Qiu, X.; Luo, J.; Li, H.; How, S.-W.; Wu, D.; He, J.; Cheng, Z.; Gao, Y.; Lu, H. A review of the phosphorus removal of polyphosphate-accumulating organisms in natural and engineered systems. Science of The Total Environment 2023, 169103. [Google Scholar] [CrossRef] [PubMed]
- Adabju, S. Specific Moving Bed Biofilm Reactor For Organic Removal from Synthetic Municipal Wastewater University of Technology, Sydney, Sydney, 2013.
- Barwal, A.; Chaudhary, R. To study the performance of biocarriers in moving bed biofilm reactor (MBBR) technology and kinetics of biofilm for retrofitting the existing aerobic treatment systems: a review. Reviews in Environmental Science and Bio/Technology 2014, 13, 285–299. [Google Scholar] [CrossRef]
- Owens, F.N.; Basalan, M. Ruminal fermentation. Rumenology 2016, 63–102. [Google Scholar]
- Maier, R.M.; Pepper, I.L. Bacterial growth. In Environmental microbiology; Elsevier: 2015; pp. 37–56.
- Rich, L.G. Unit Processes of Sanitary Engineering; John Wiley and Sons: New York, 1963. [Google Scholar]
|
Disclaimer/Publisher’s Note: The statements, opinions and data contained in all publications are solely those of the individual author(s) and contributor(s) and not of MDPI and/or the editor(s). MDPI and/or the editor(s) disclaim responsibility for any injury to people or property resulting from any ideas, methods, instructions or products referred to in the content. |
© 2024 by the authors. Licensee MDPI, Basel, Switzerland. This article is an open access article distributed under the terms and conditions of the Creative Commons Attribution (CC BY) license (http://creativecommons.org/licenses/by/4.0/).
