Submitted:
13 May 2024
Posted:
14 May 2024
You are already at the latest version
Abstract
Keywords:
1. Introduction
2. Materials and Methods
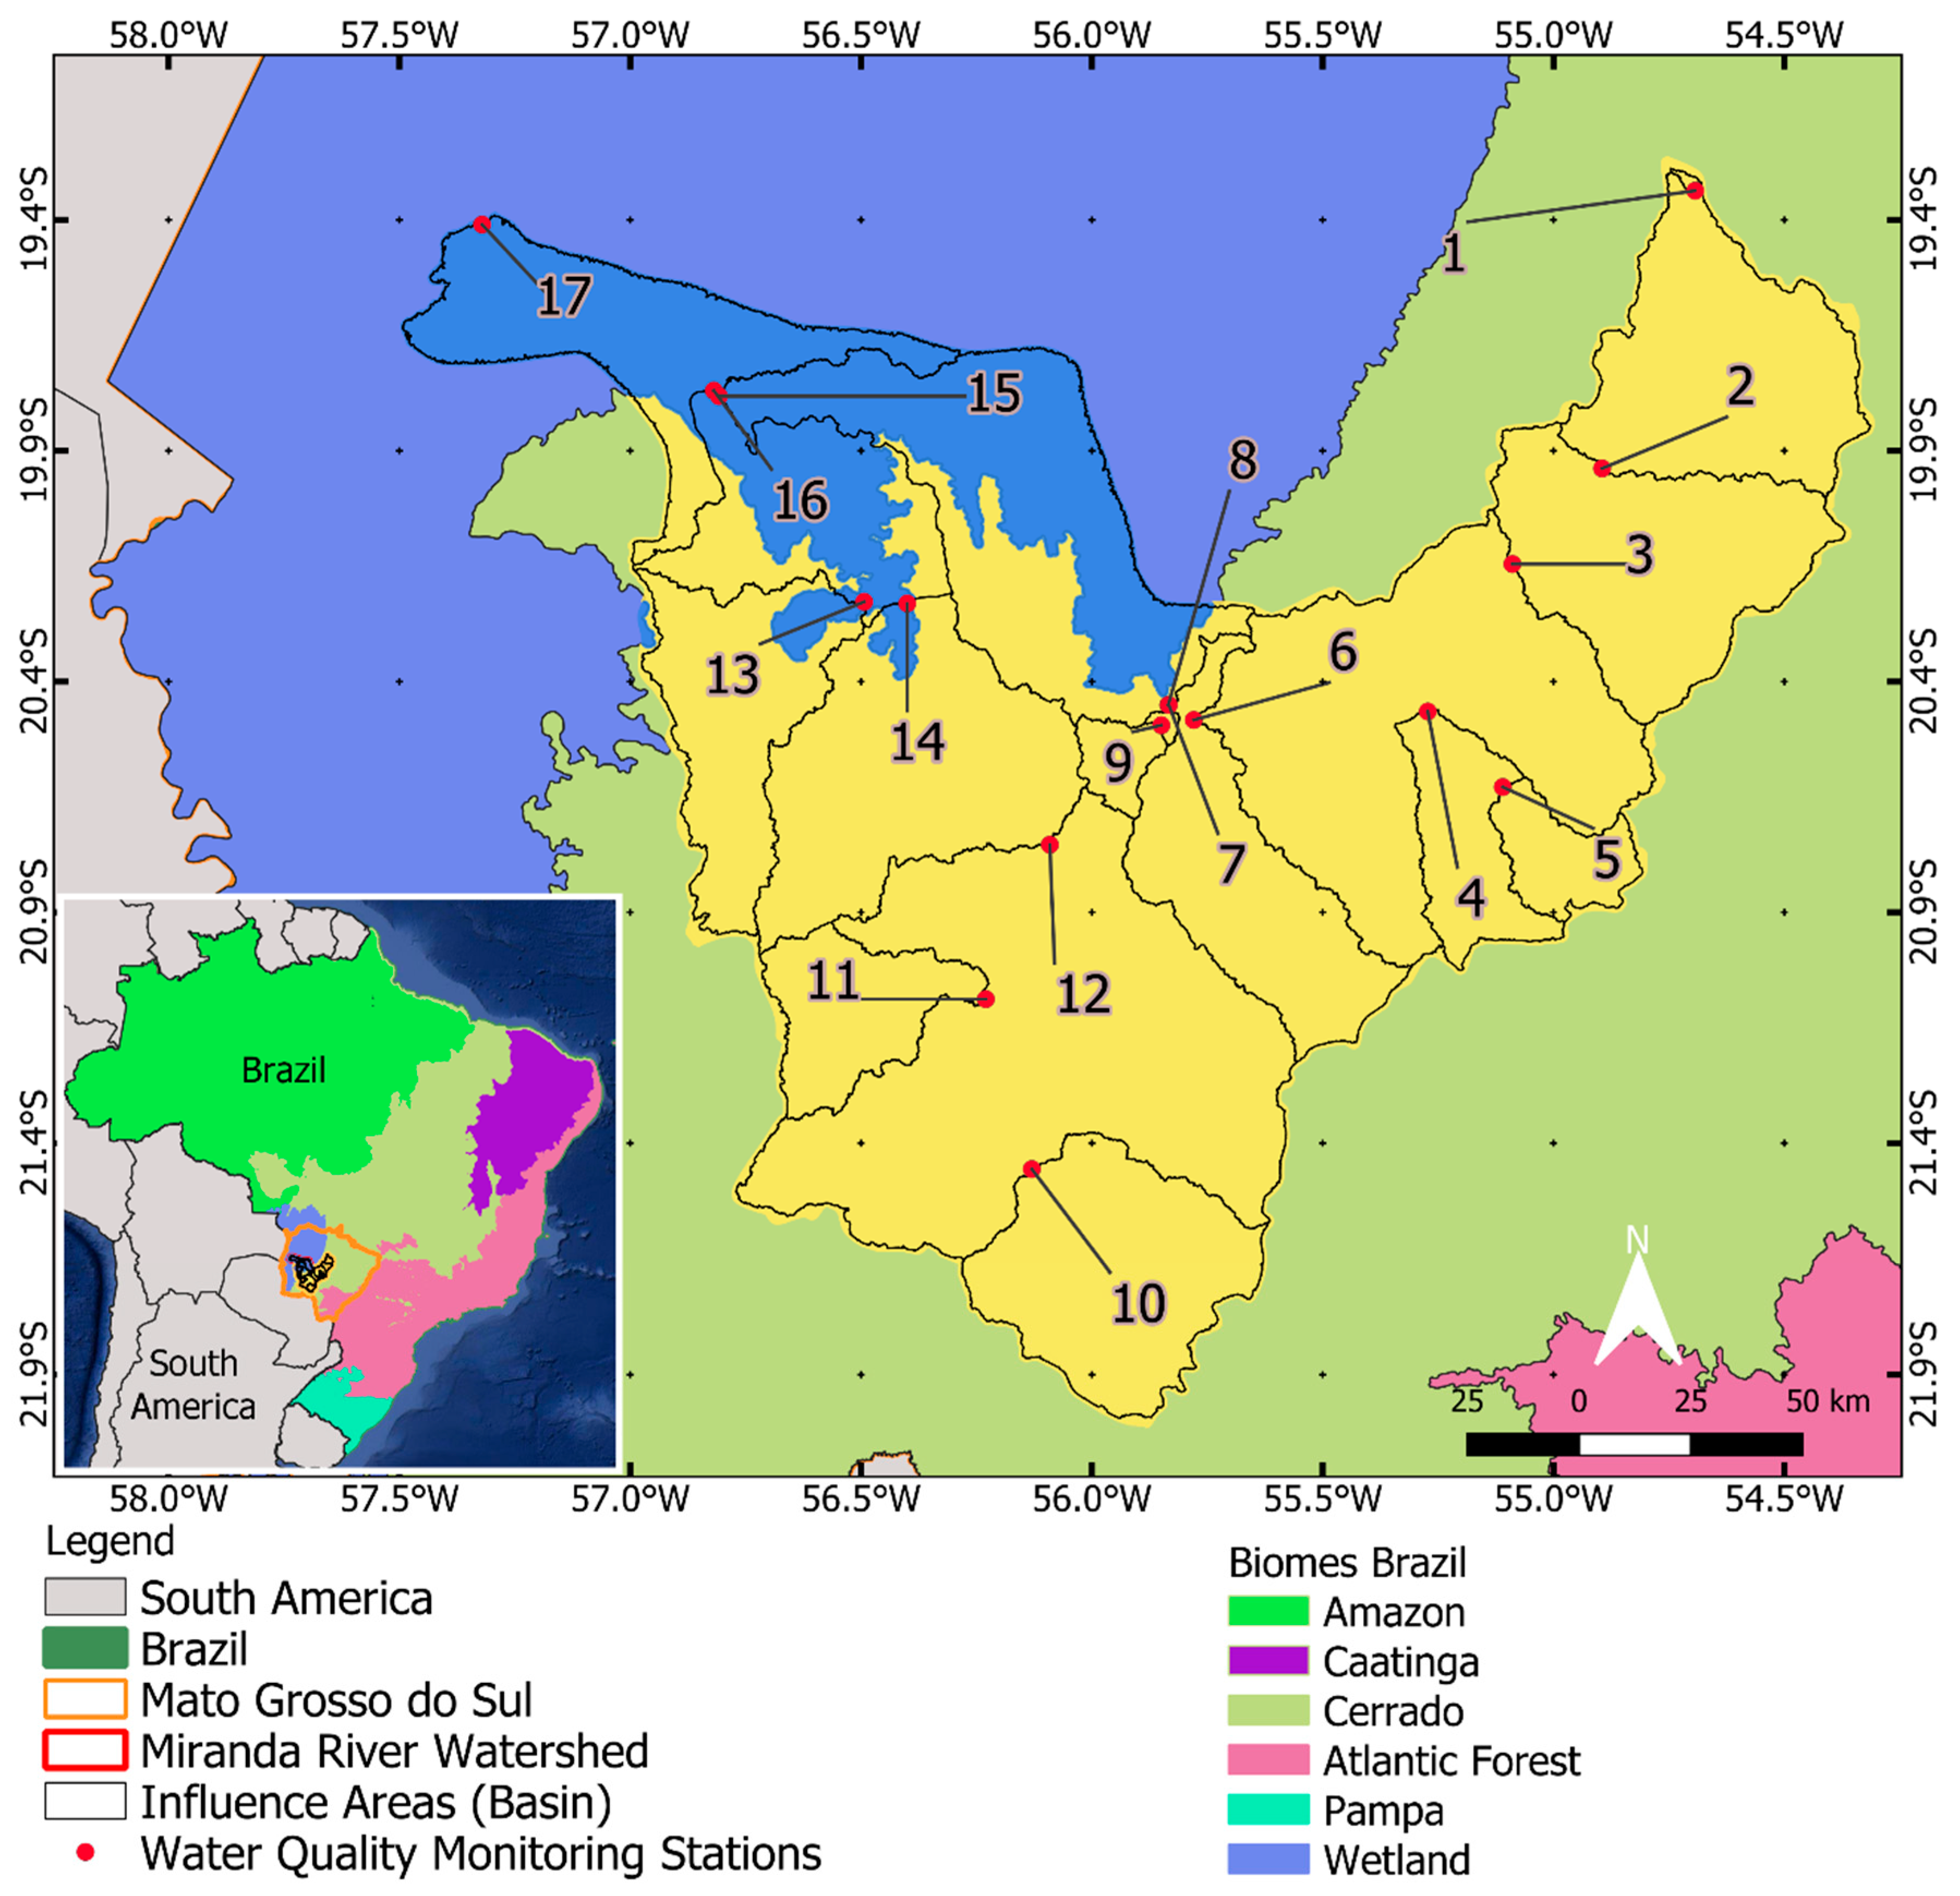
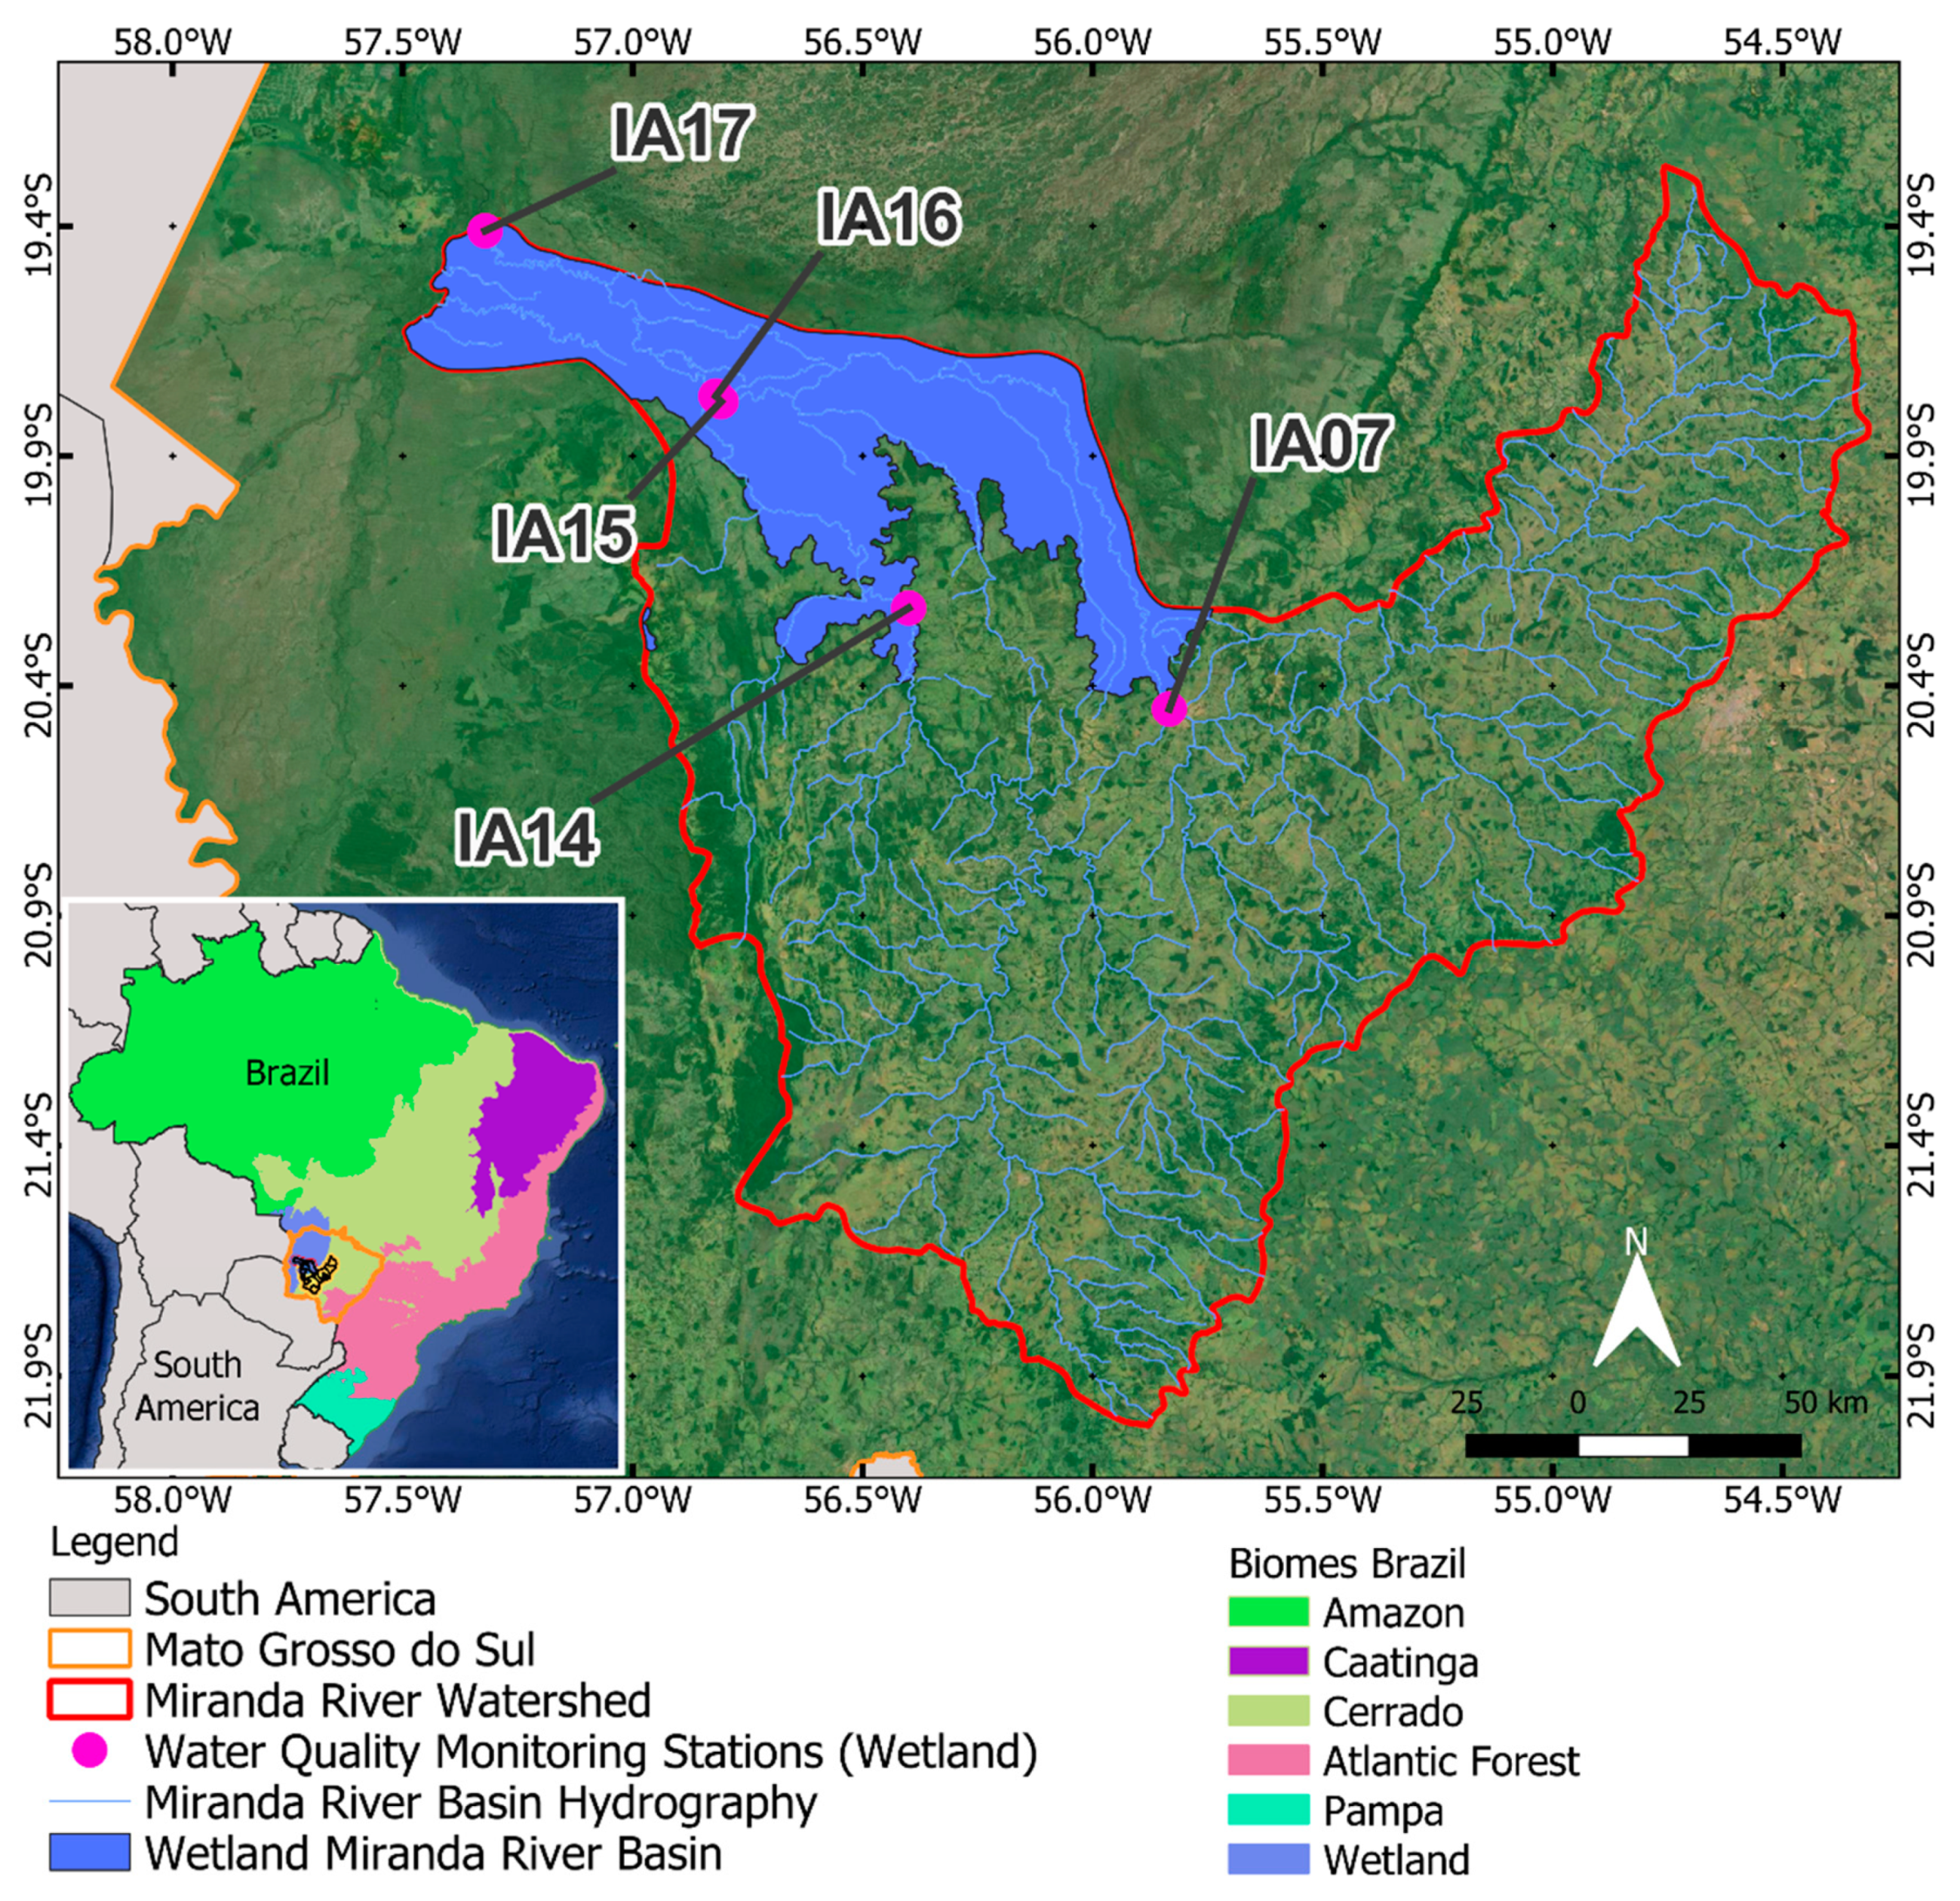
2.1. Study Area
2.2. Delimitation of Influence Areas
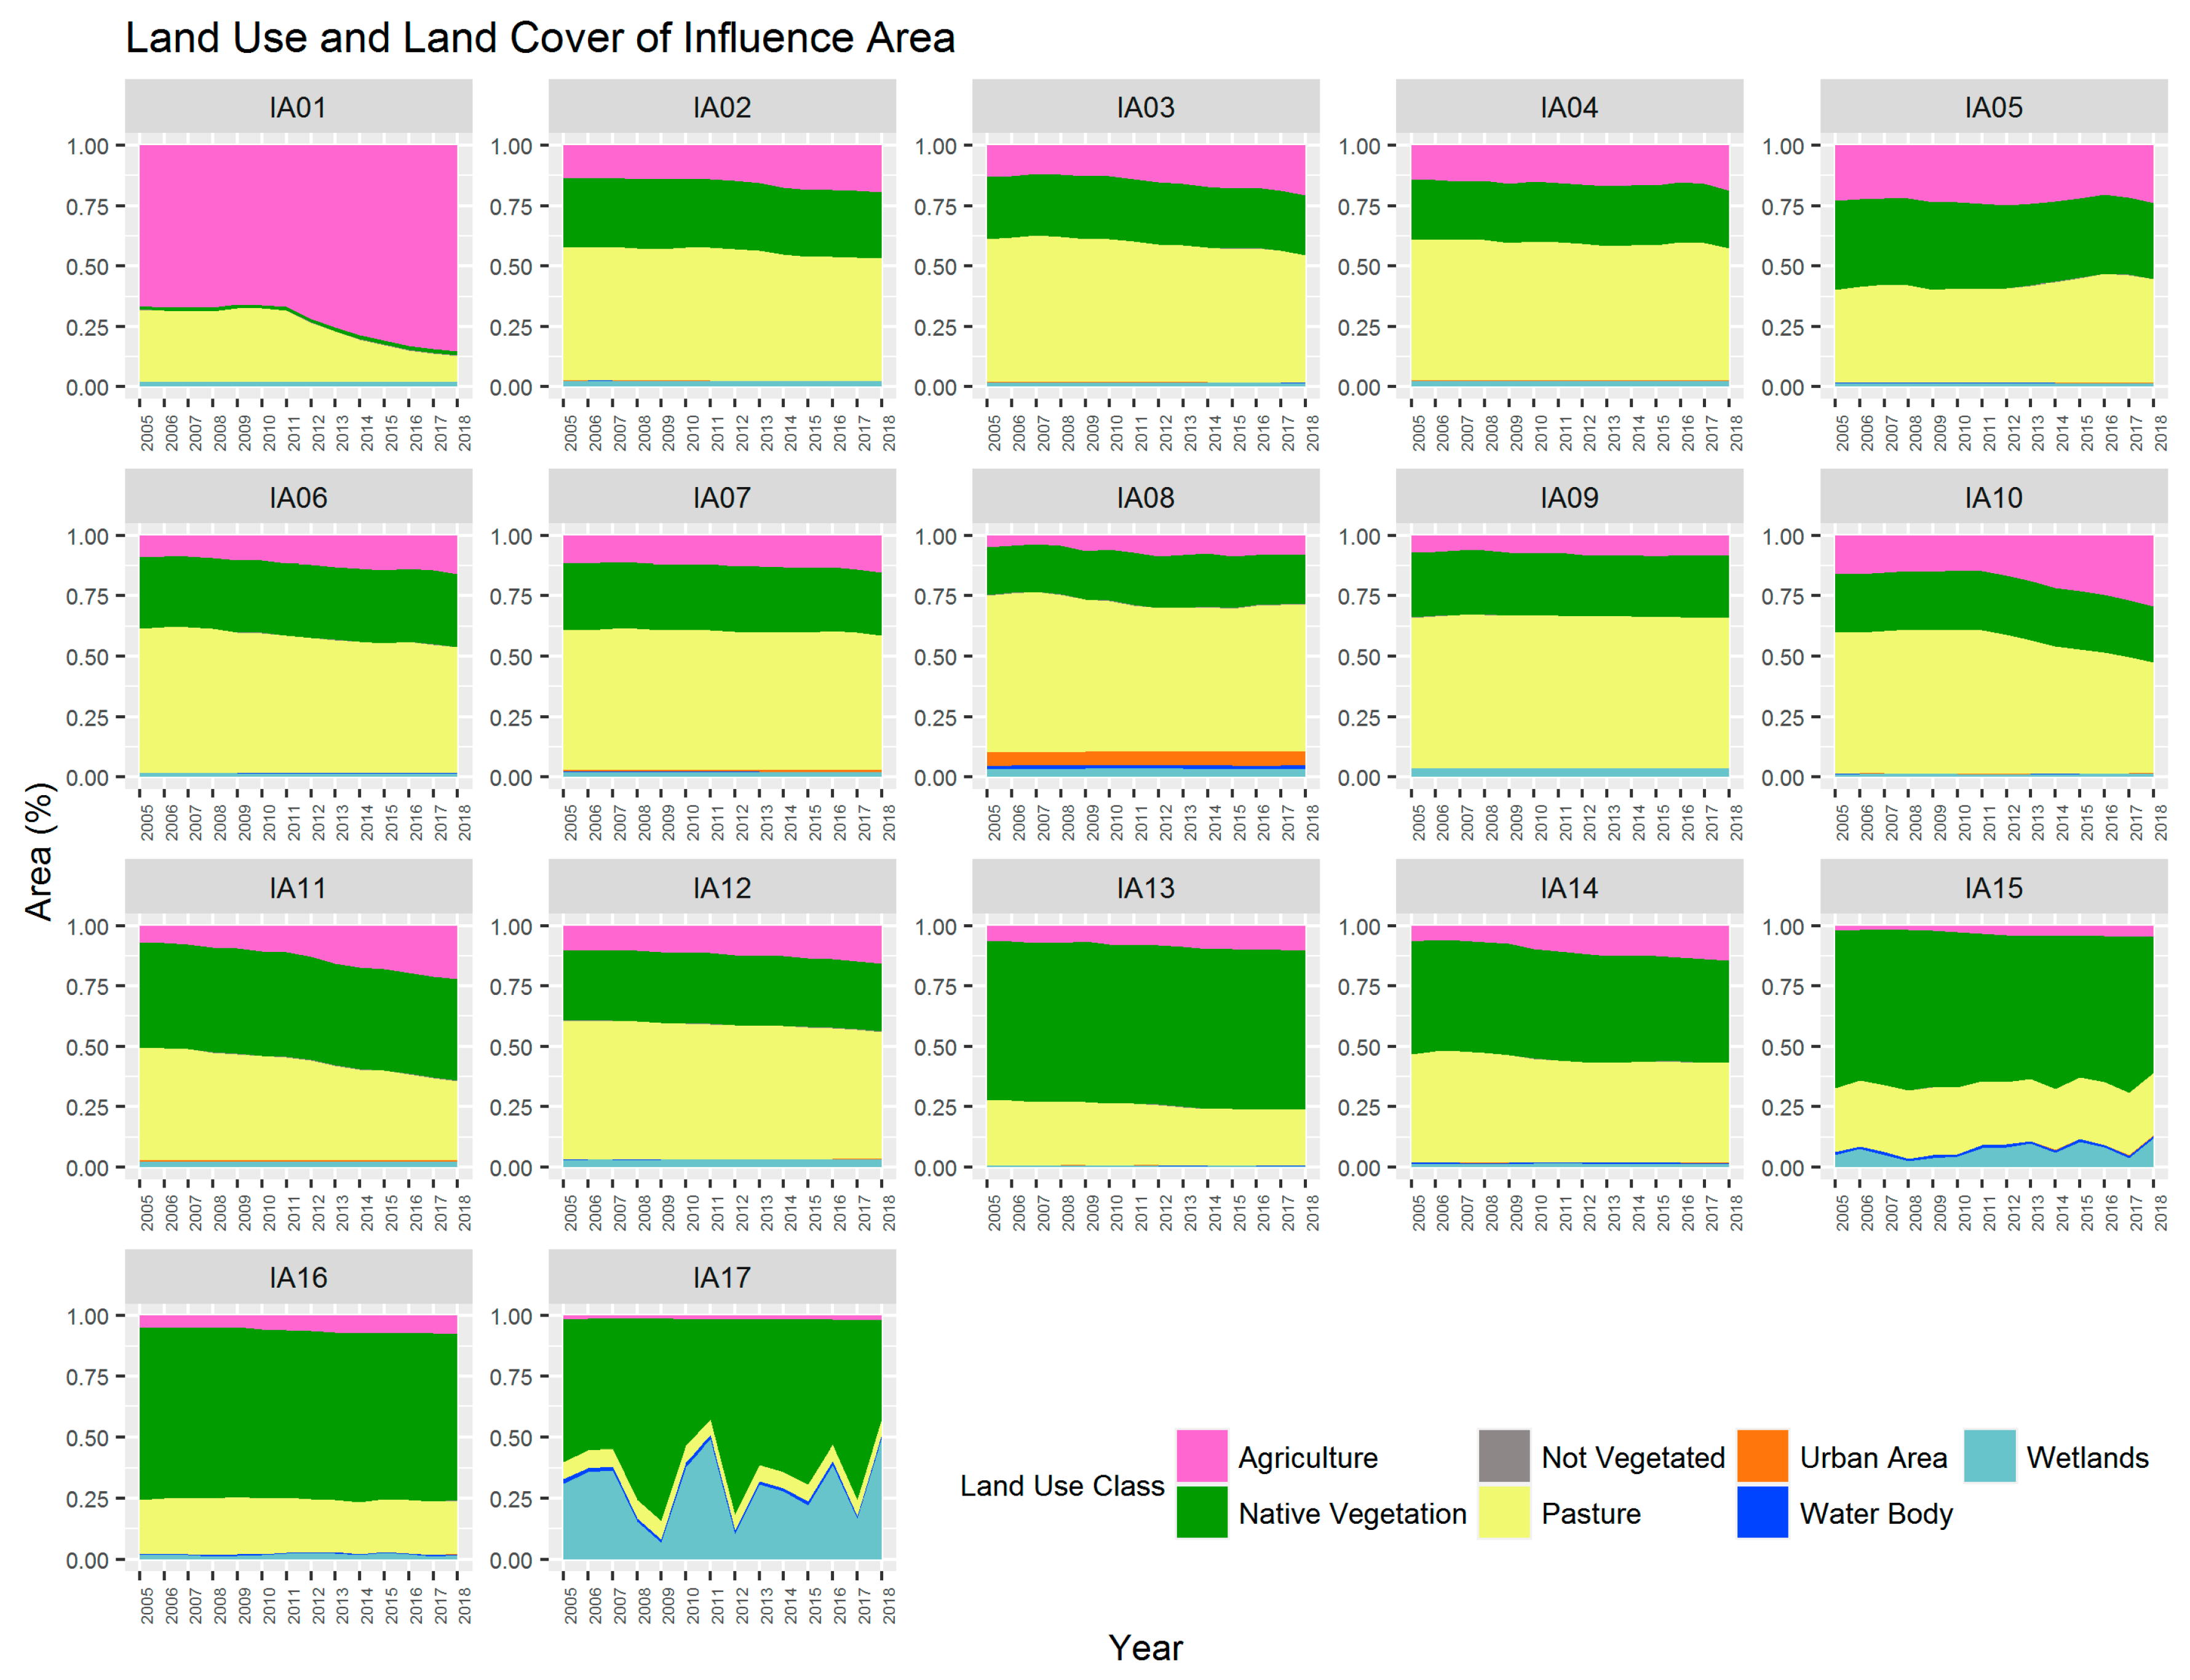
2.3. Land Use and Land Cover in the Miranda River Watershed
2.4. Water Quality Data Collection
2.5. Correlation between Land Use and Land Cover and Water Quality
2.6. Influence of Wetlands on Water Quality in the Miranda River Watershed
3. Results and Discussion
3.1. Changes in Land Use and Land Cover in the Miranda River Watershed
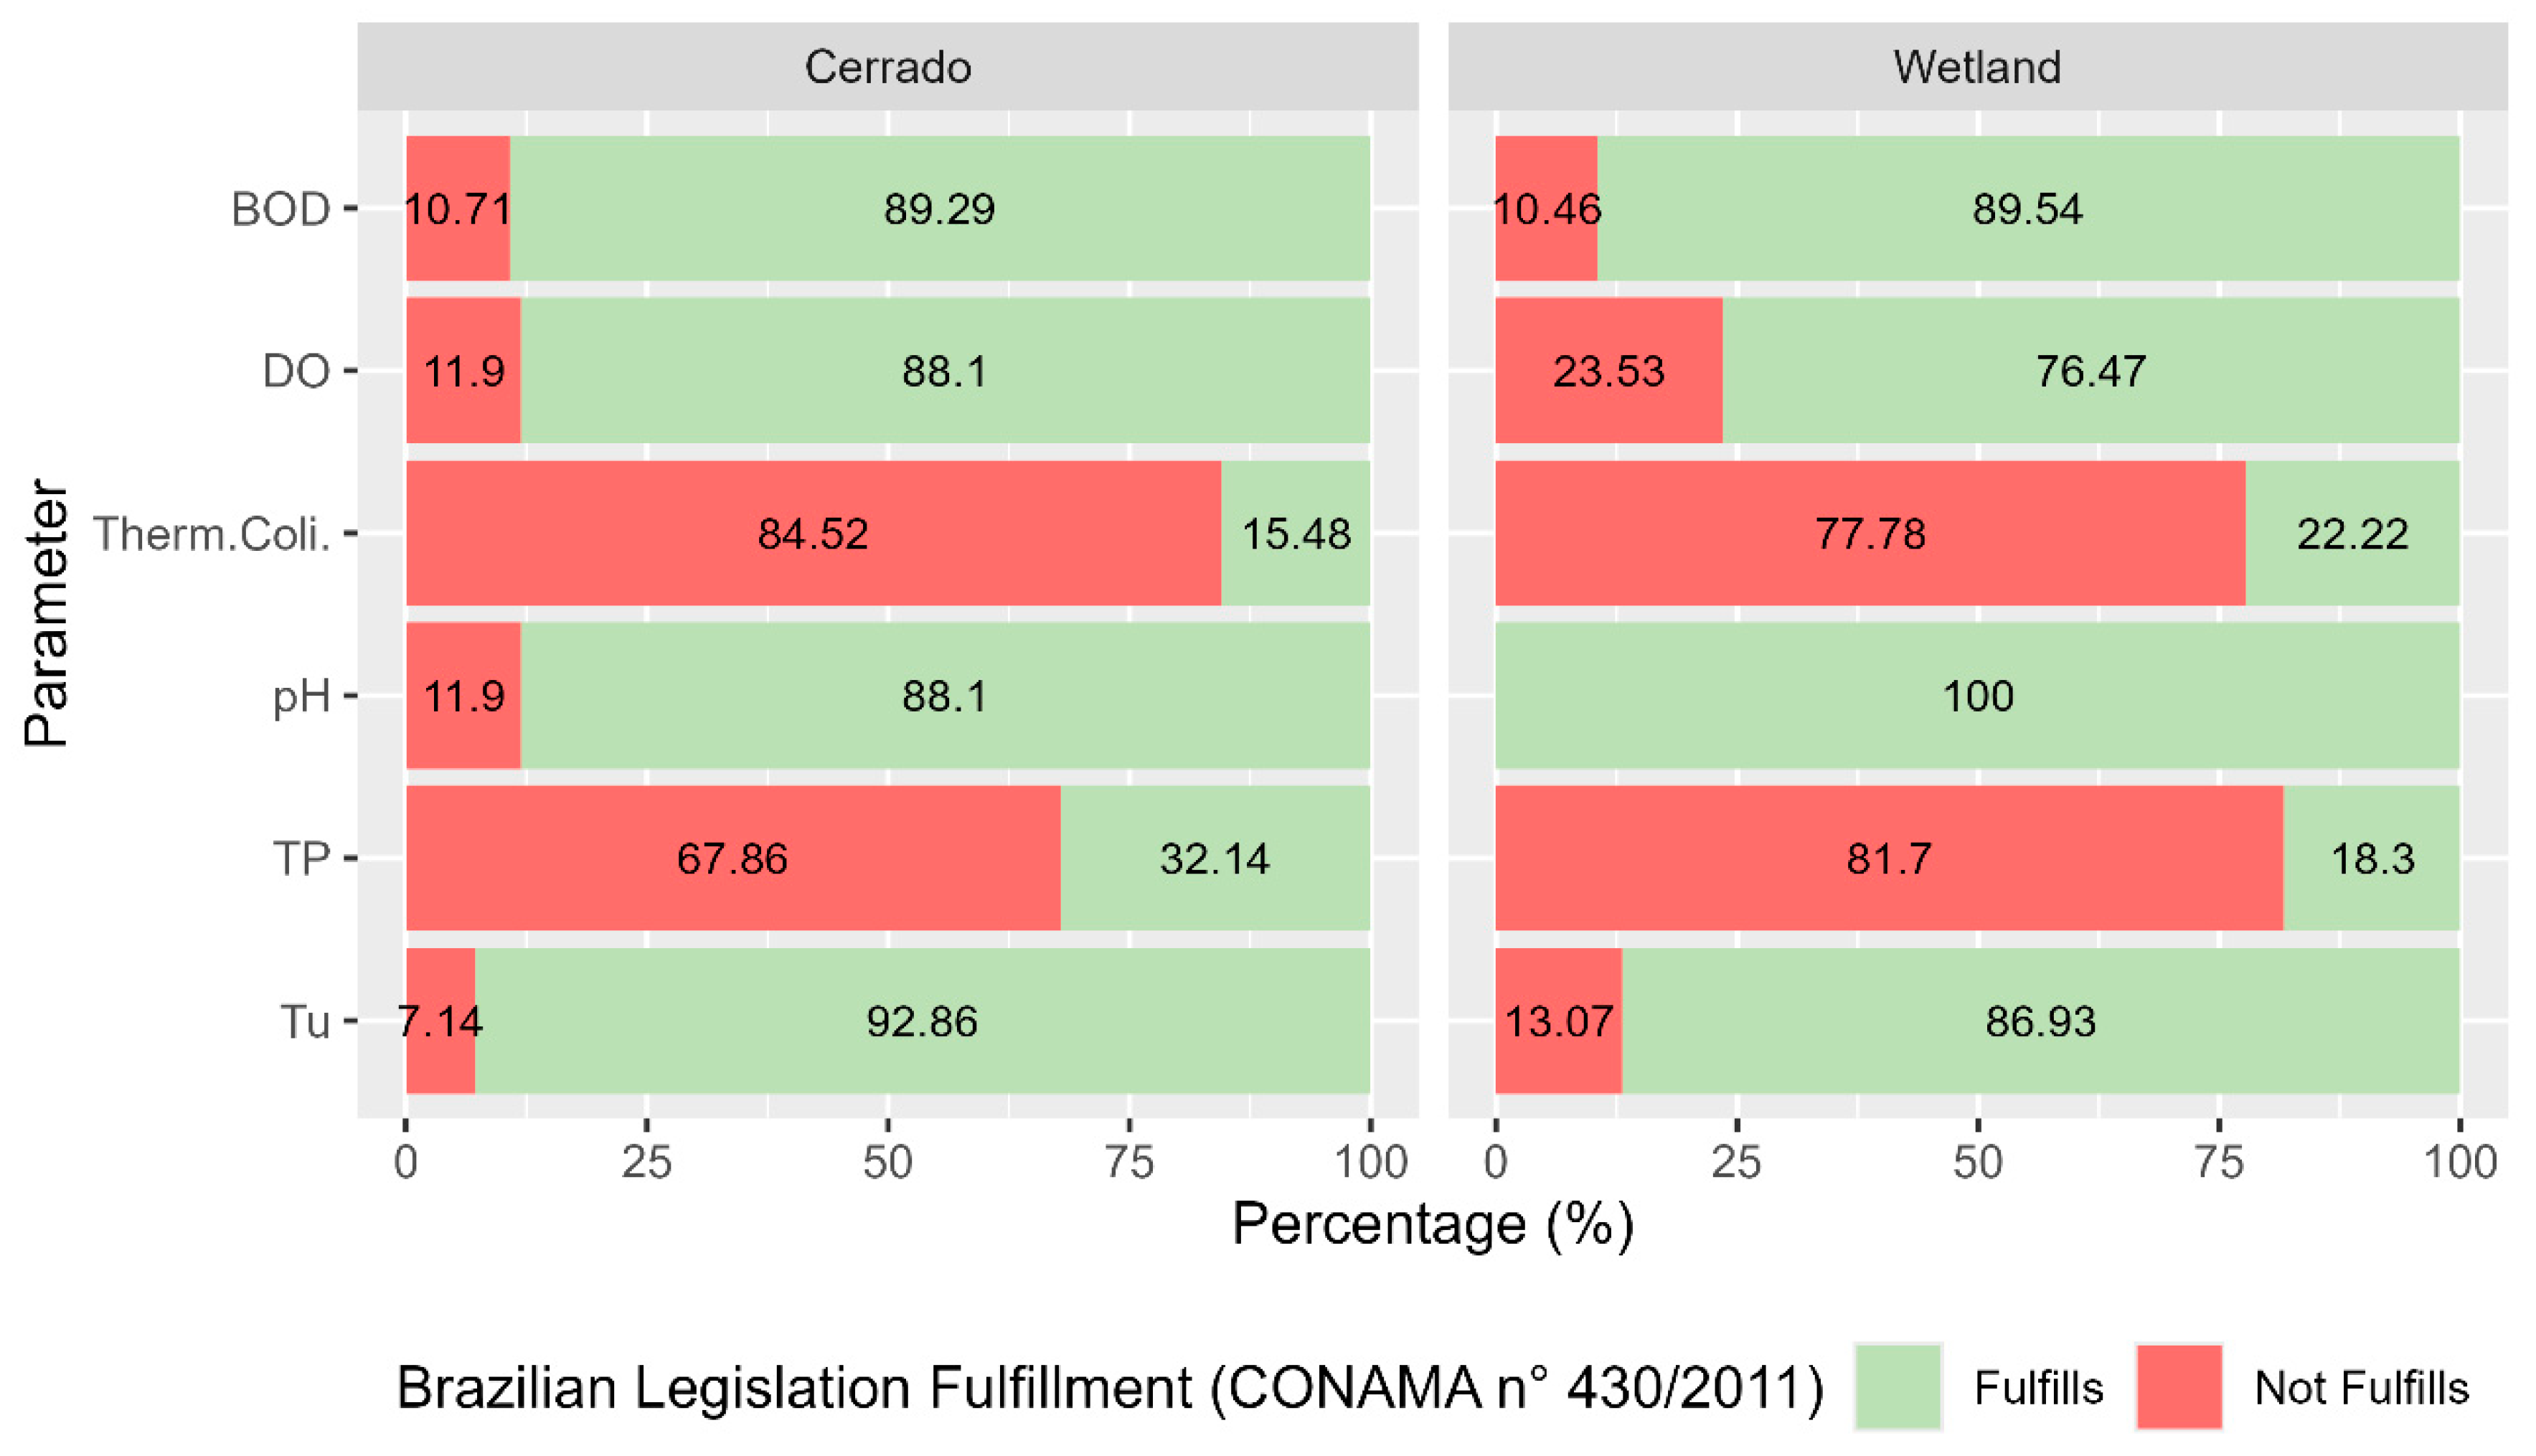
3.2. Water Quality in the Miranda River Watershed
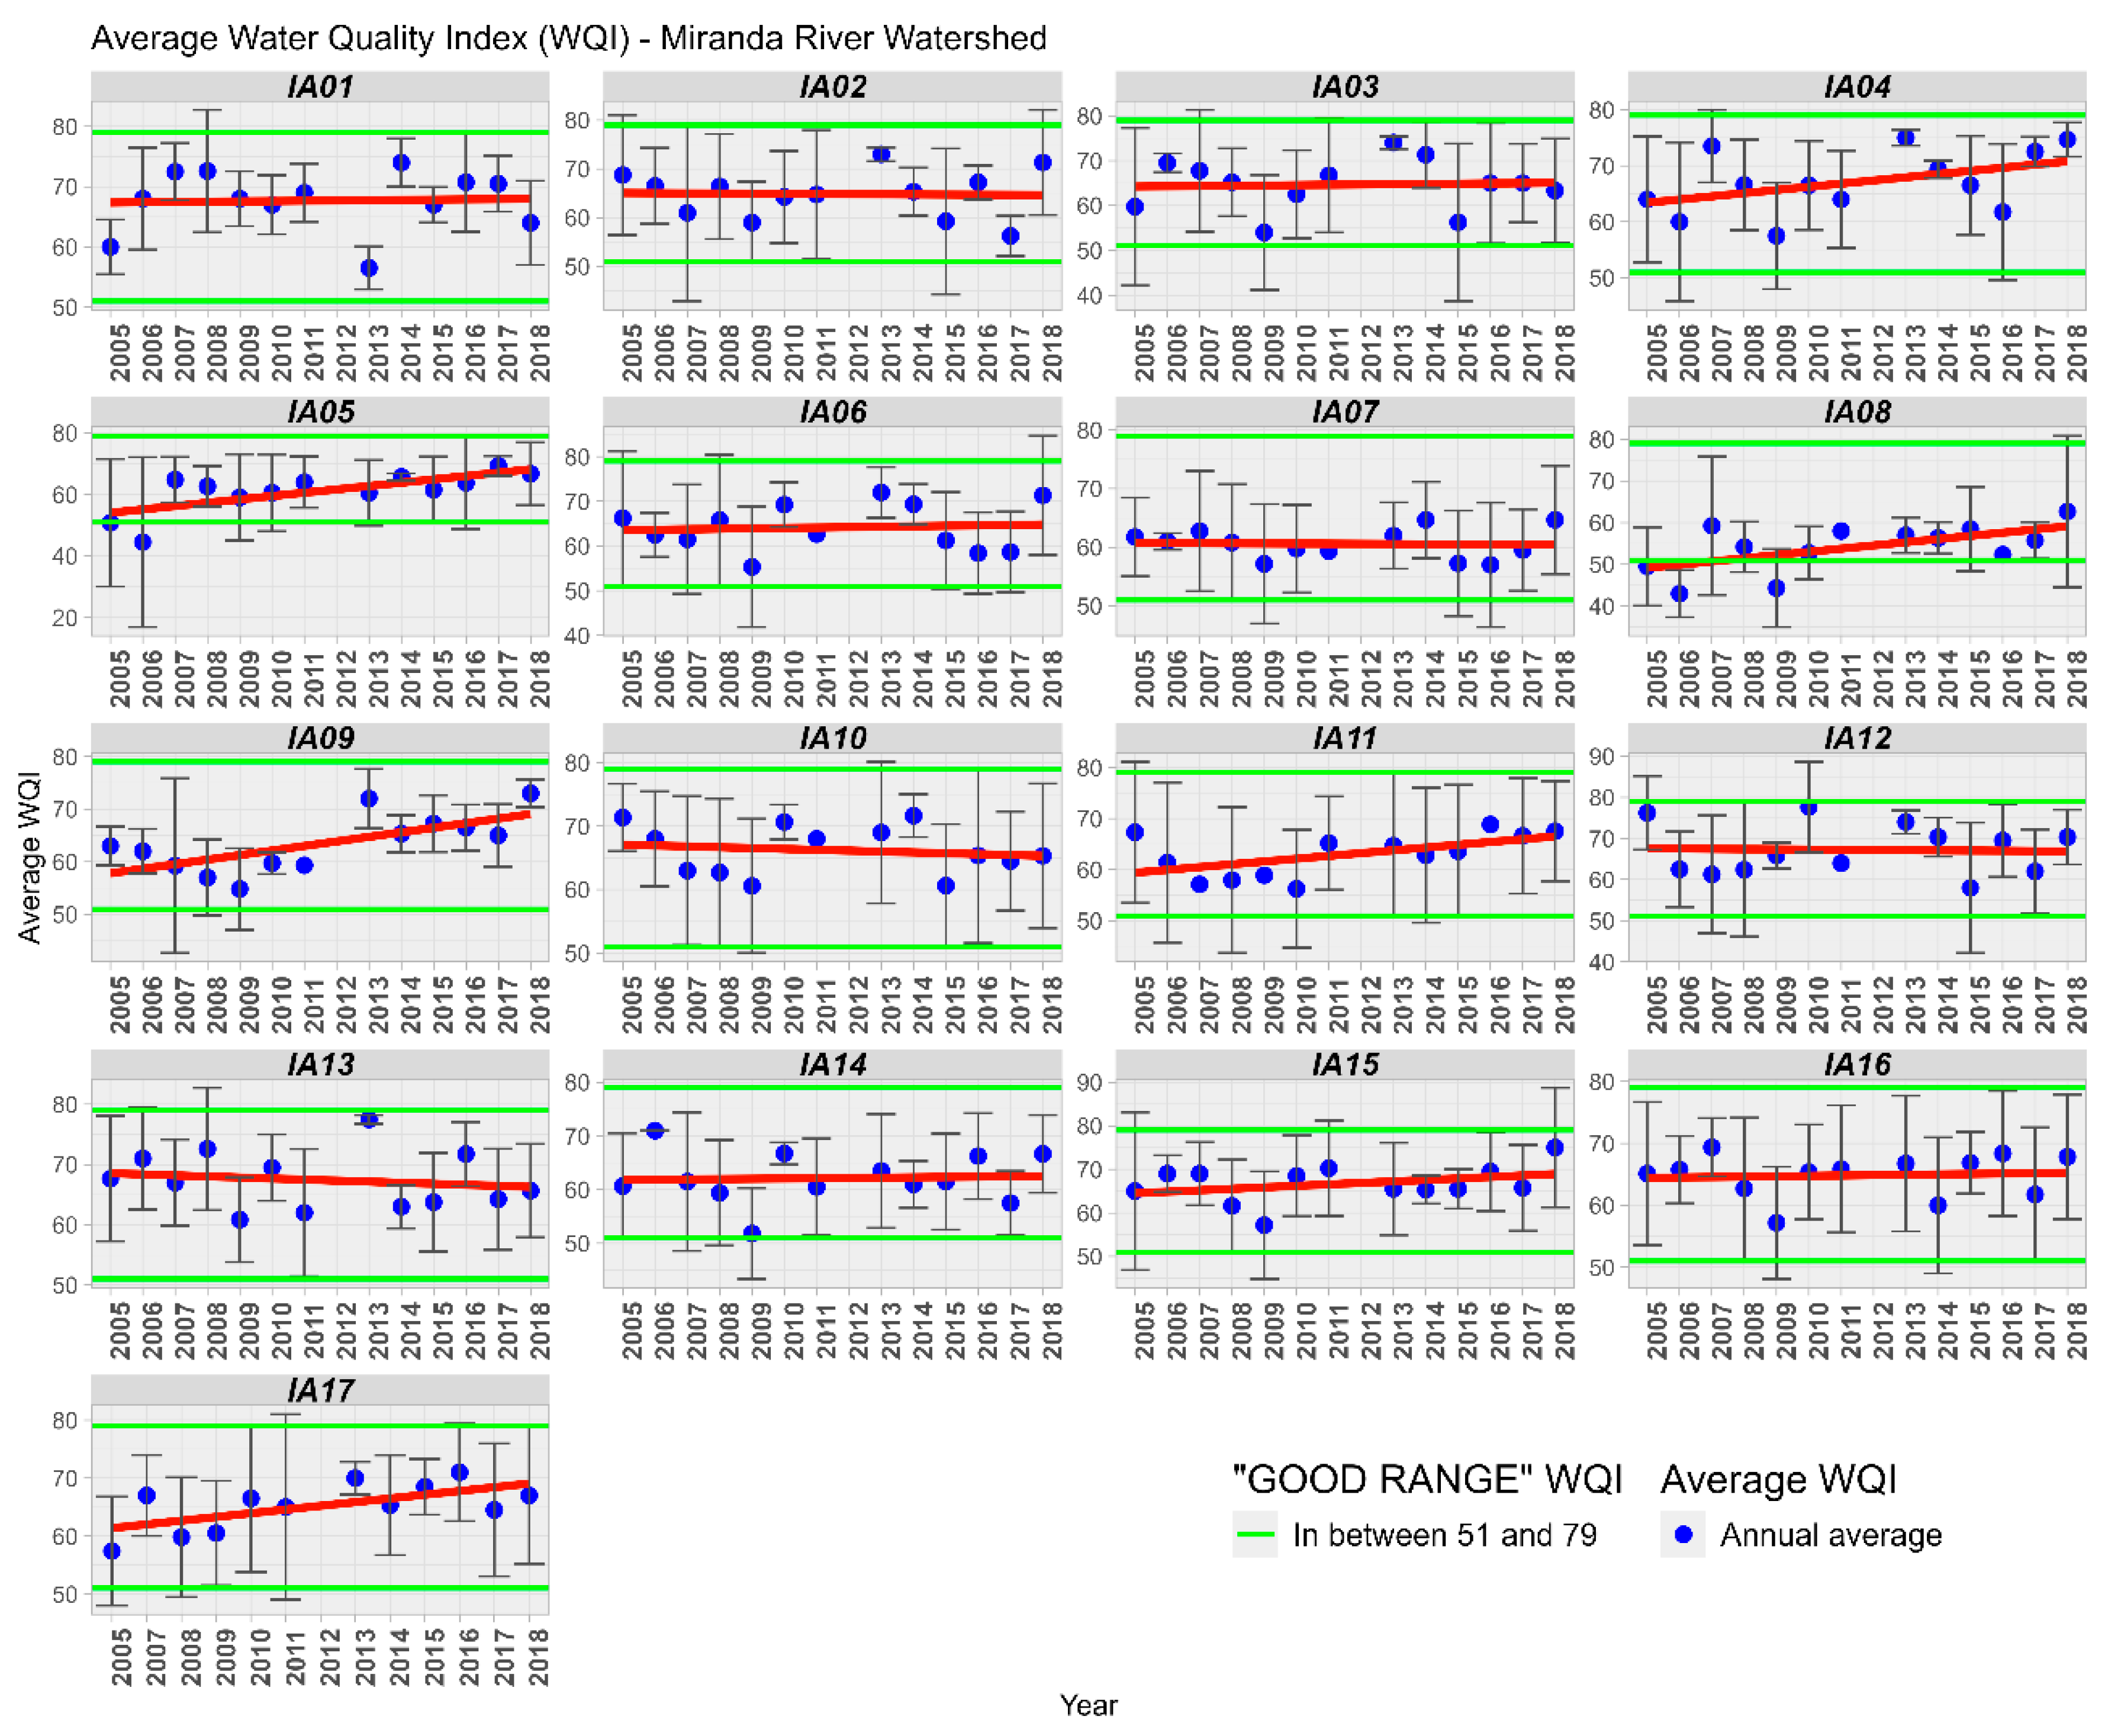
3.3. Water Quality Index
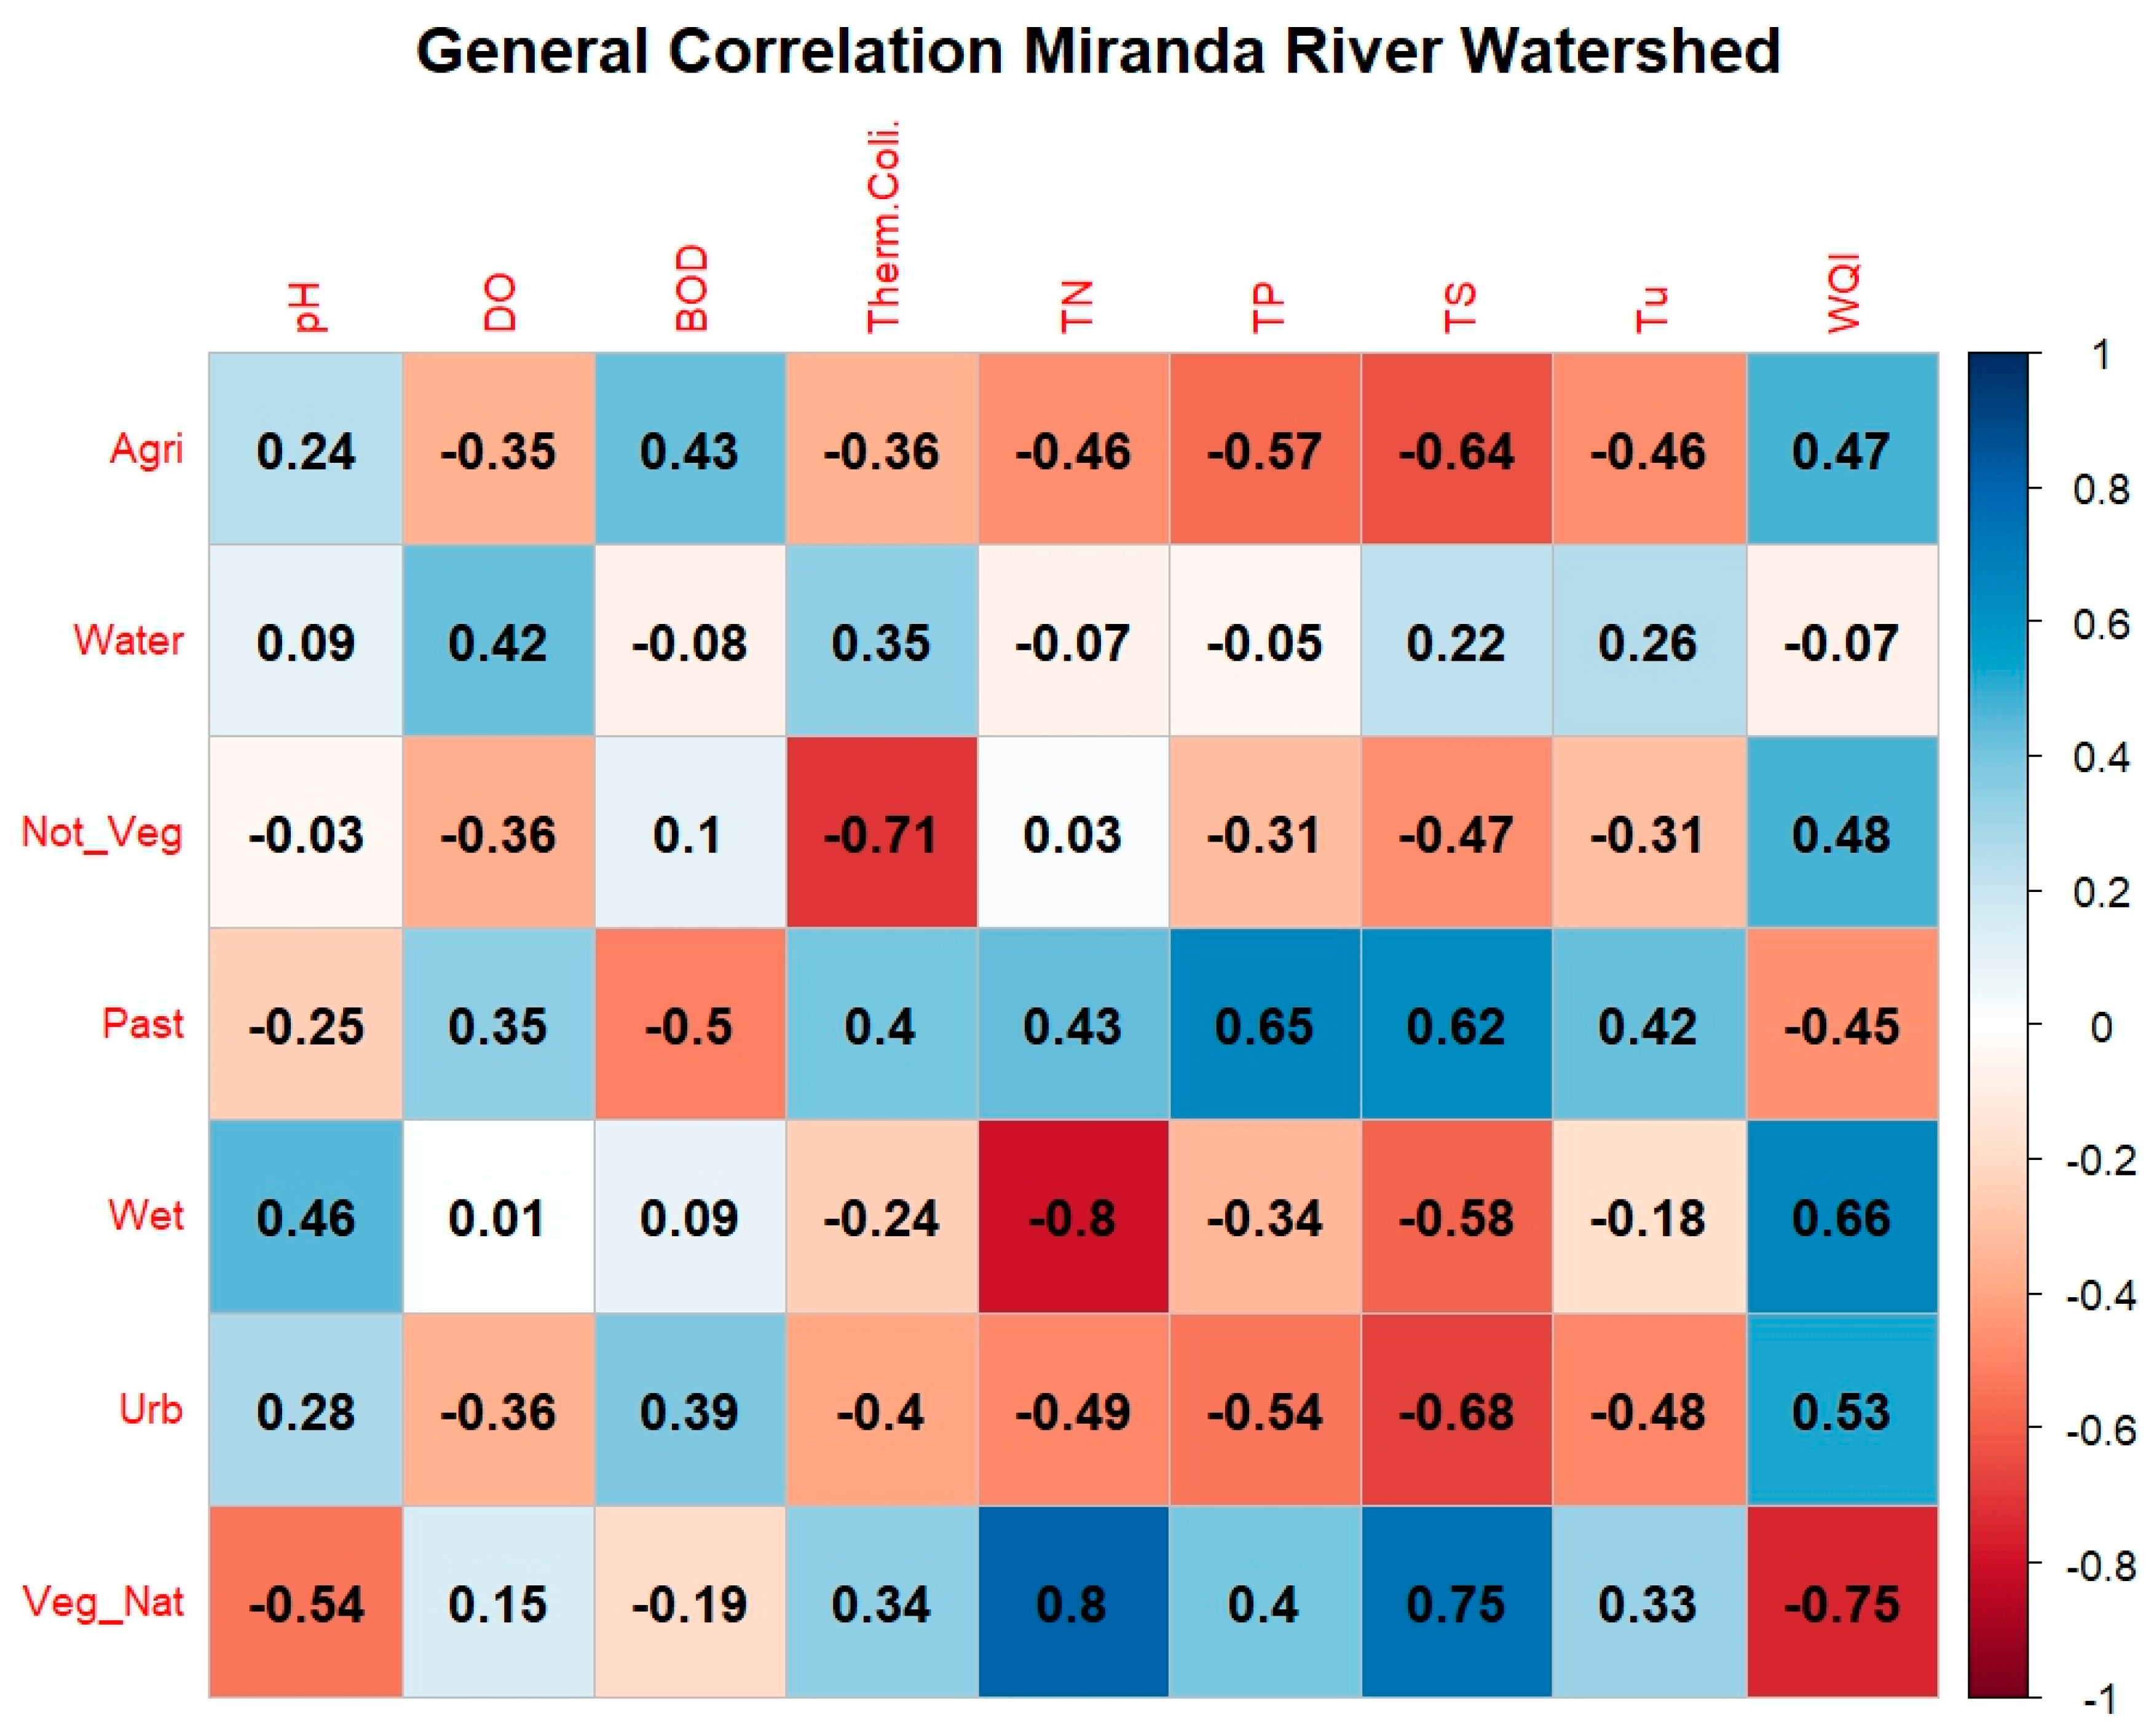
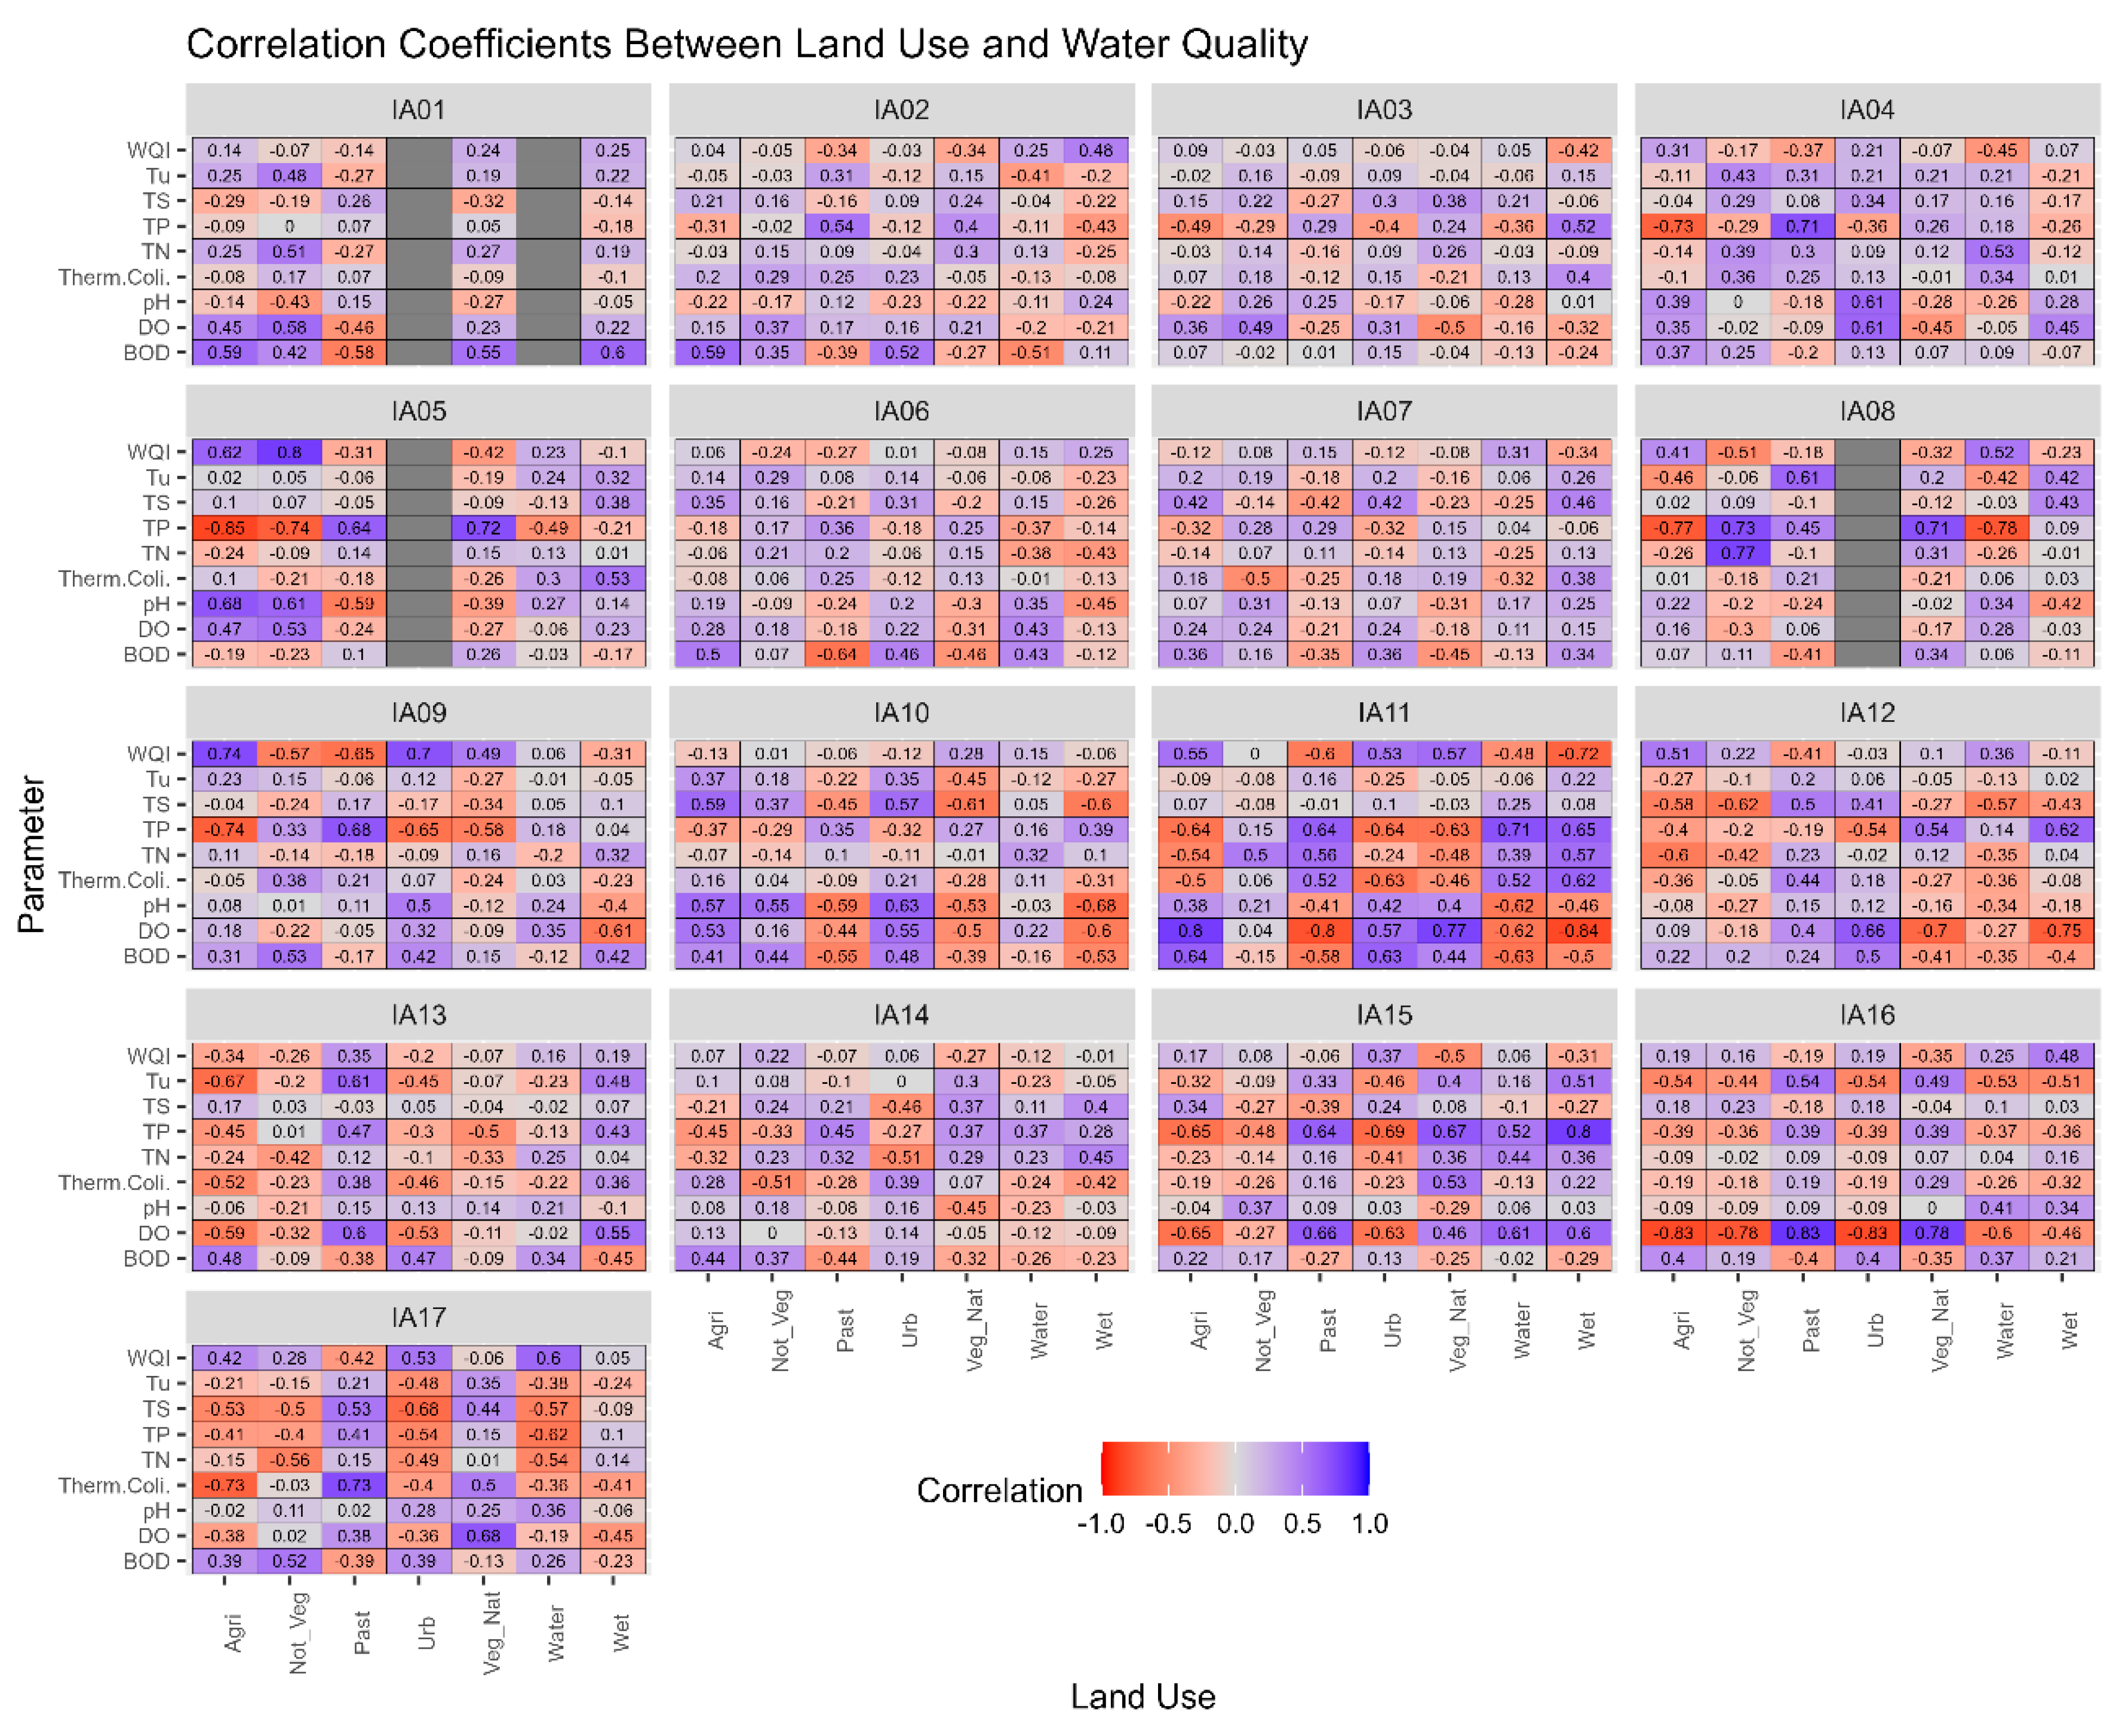
3.4. Correlation between Land Use and Land Cover and Water Quality
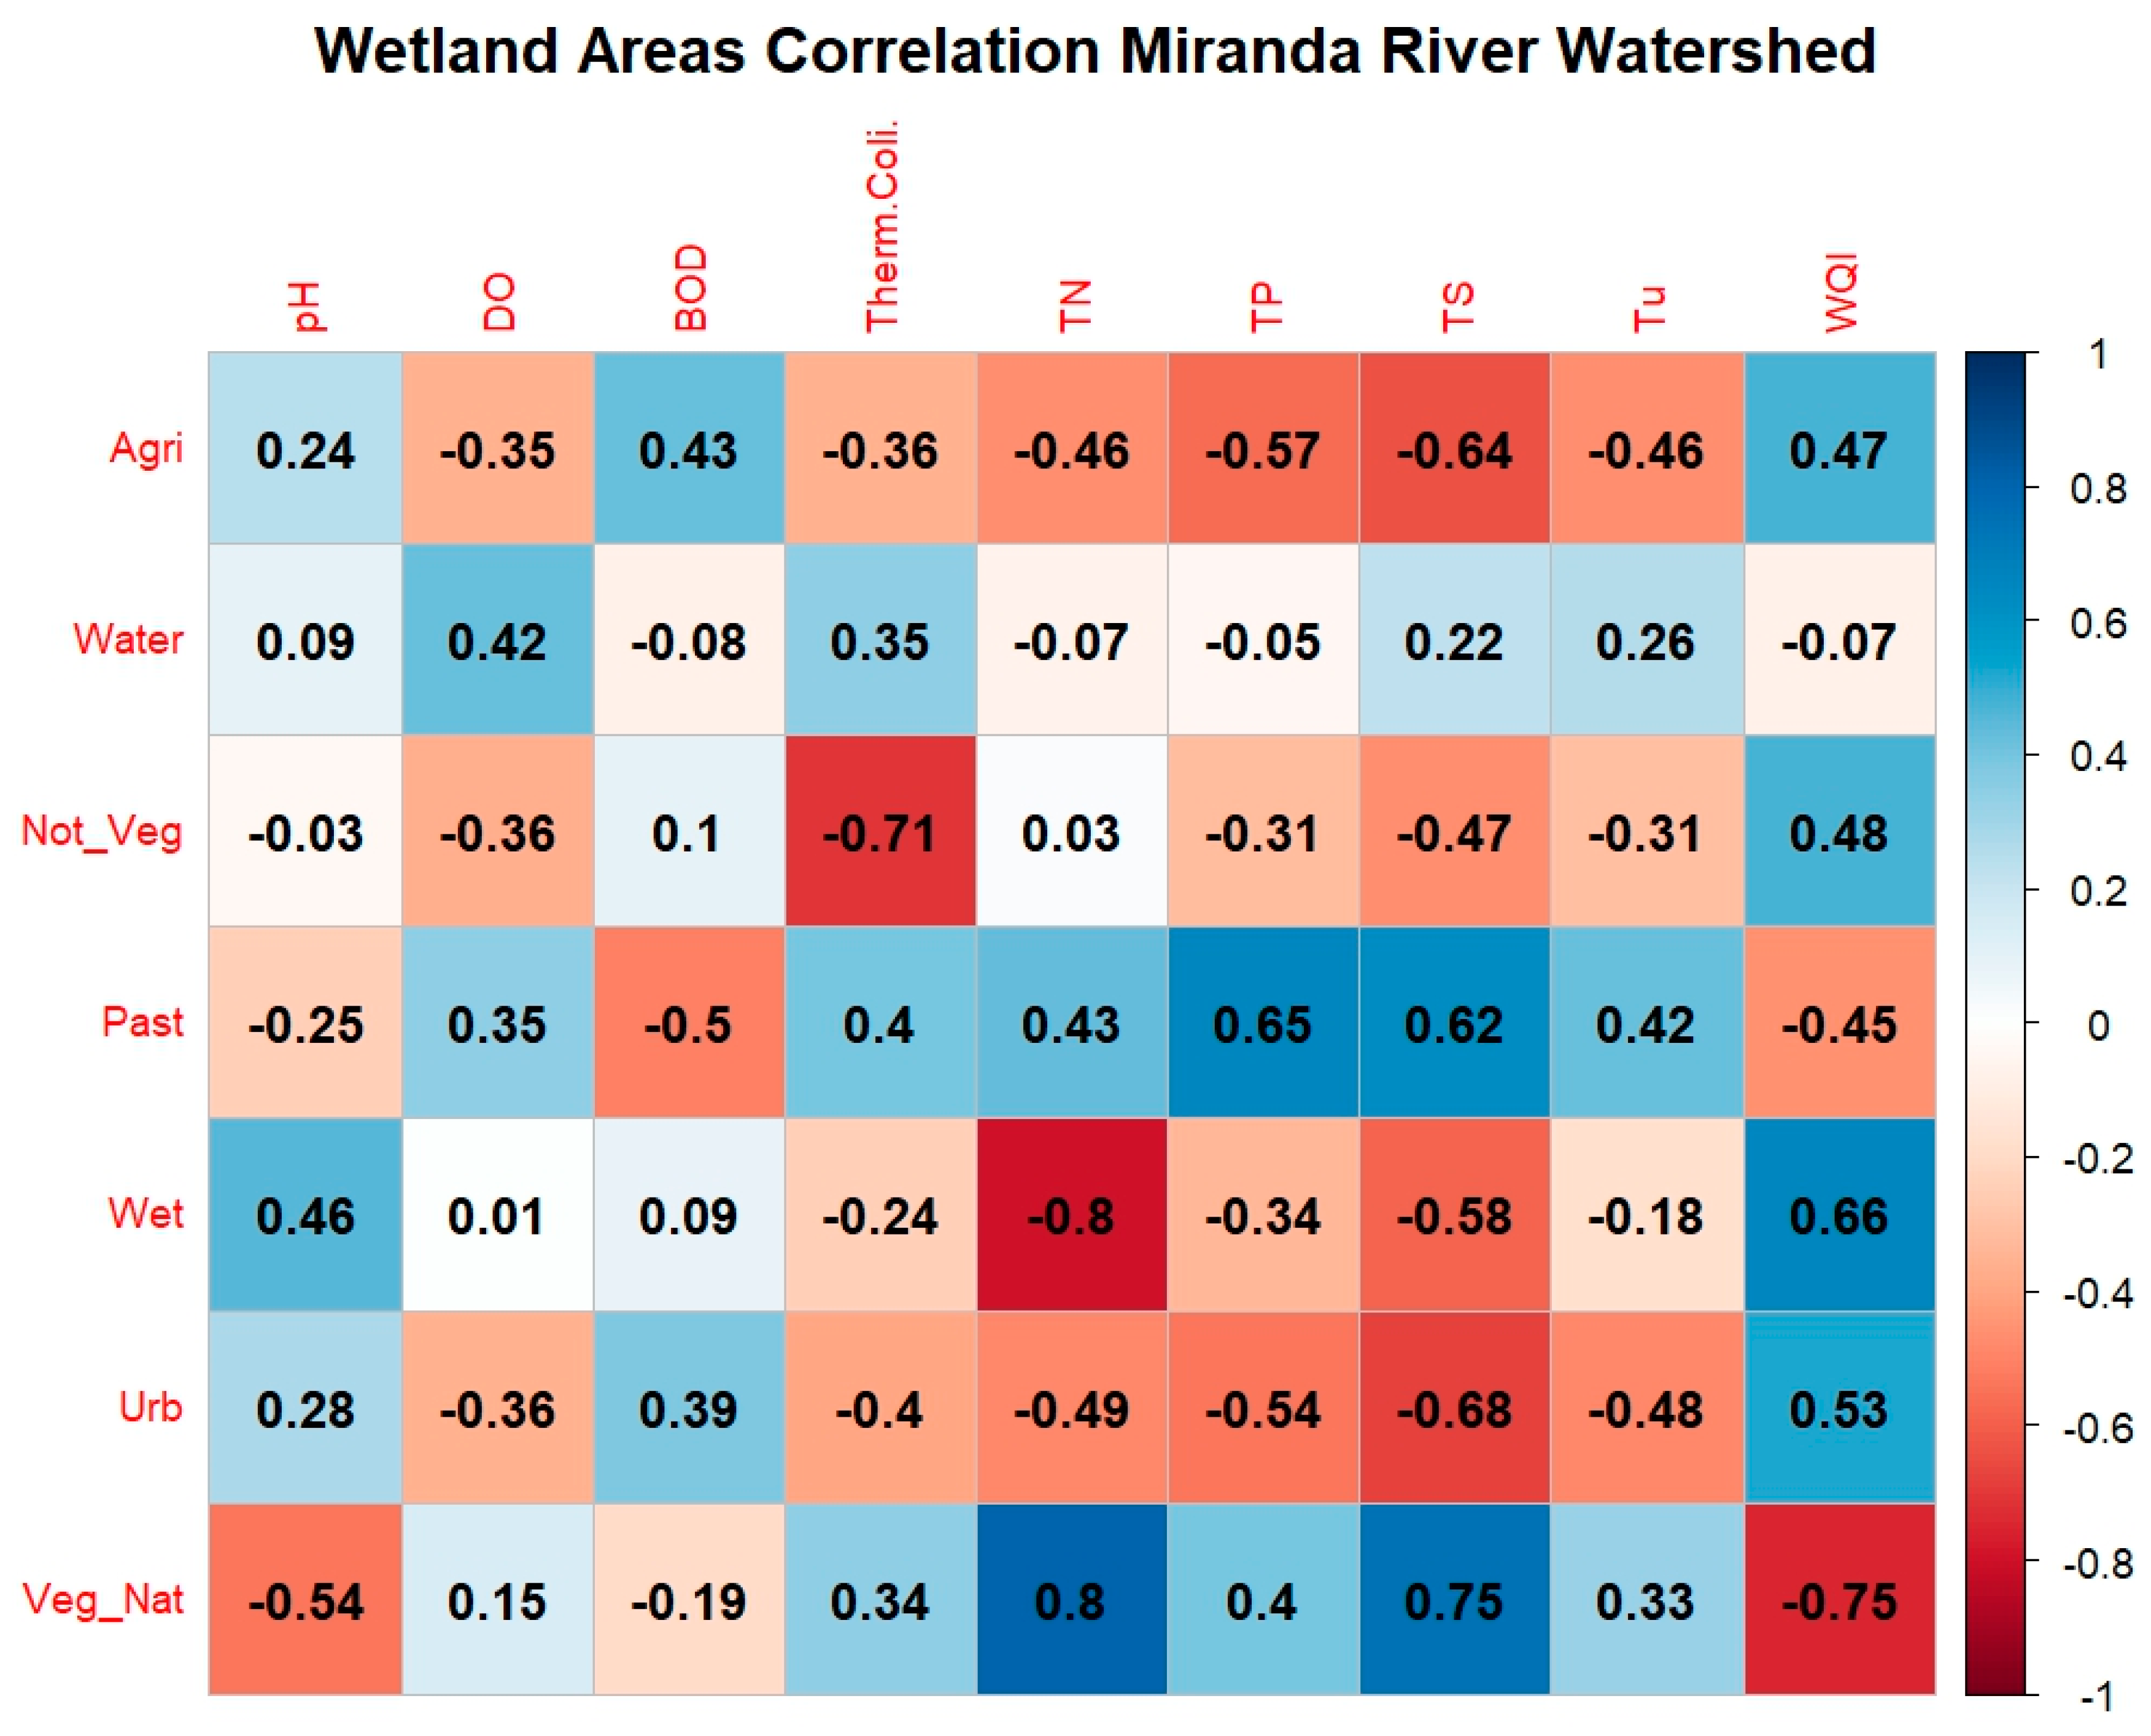
3.5. Influence of Wetlands on Water Quality
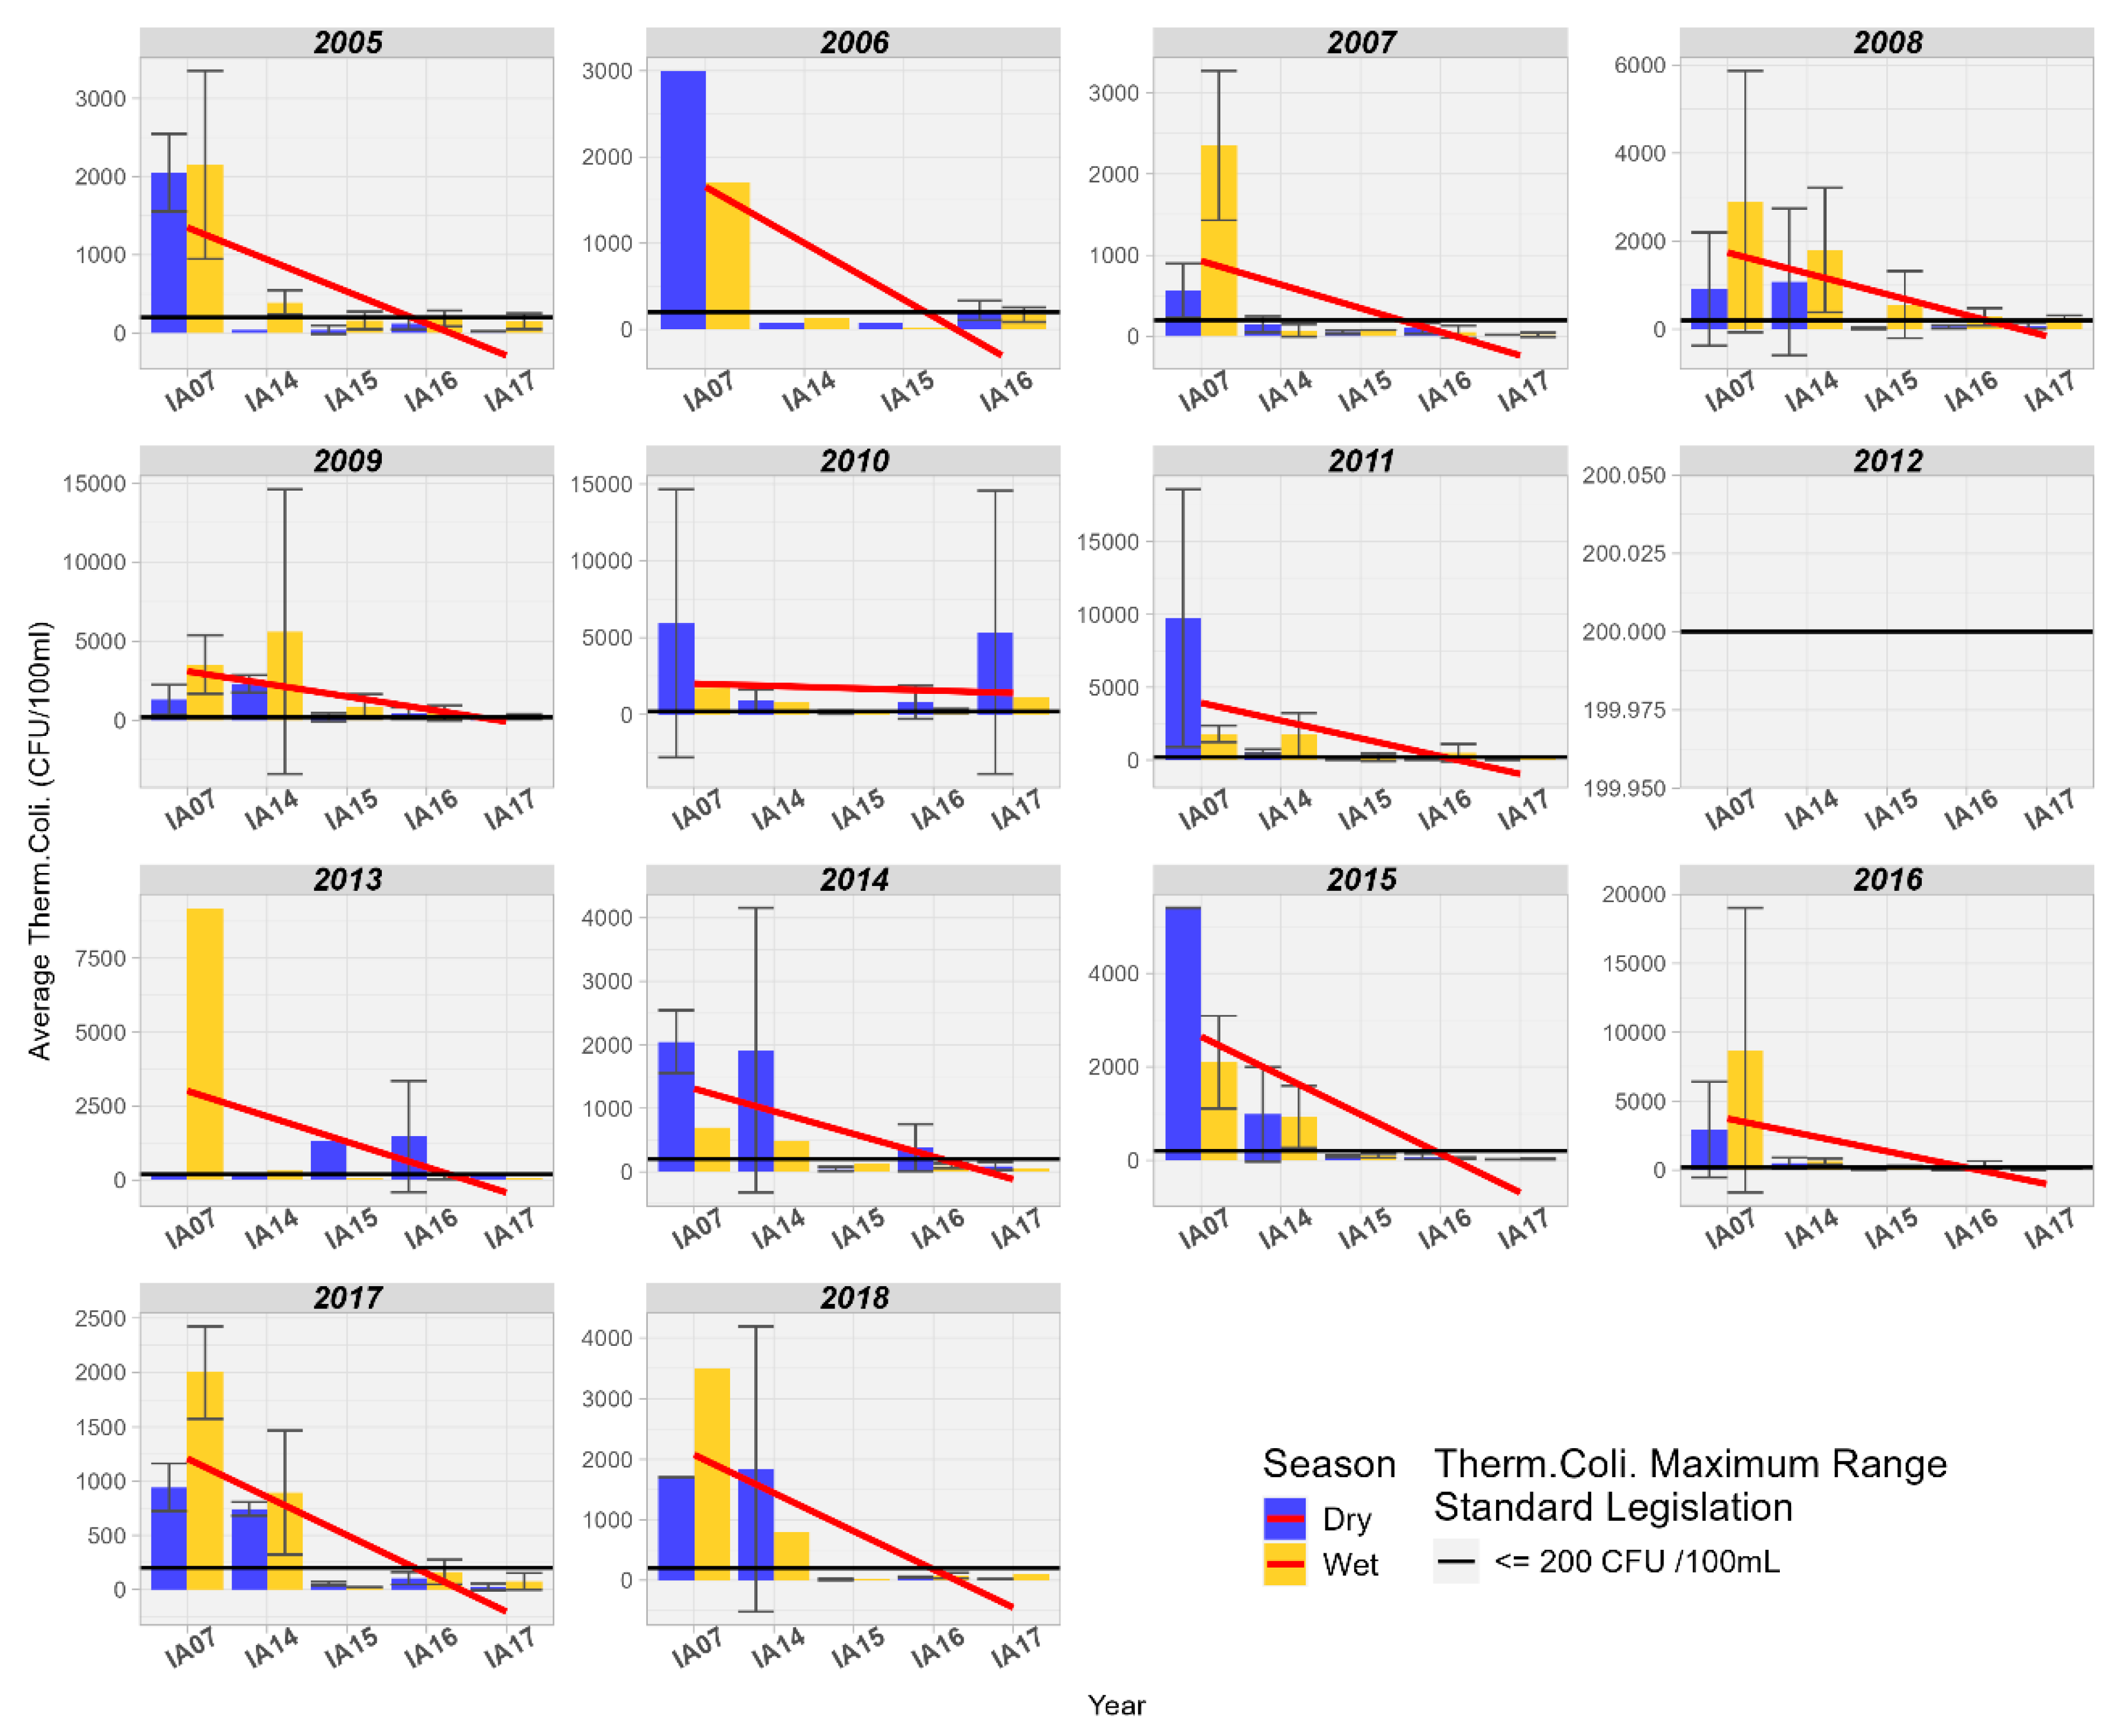
3.5.1. Thermotolerant Coliforms
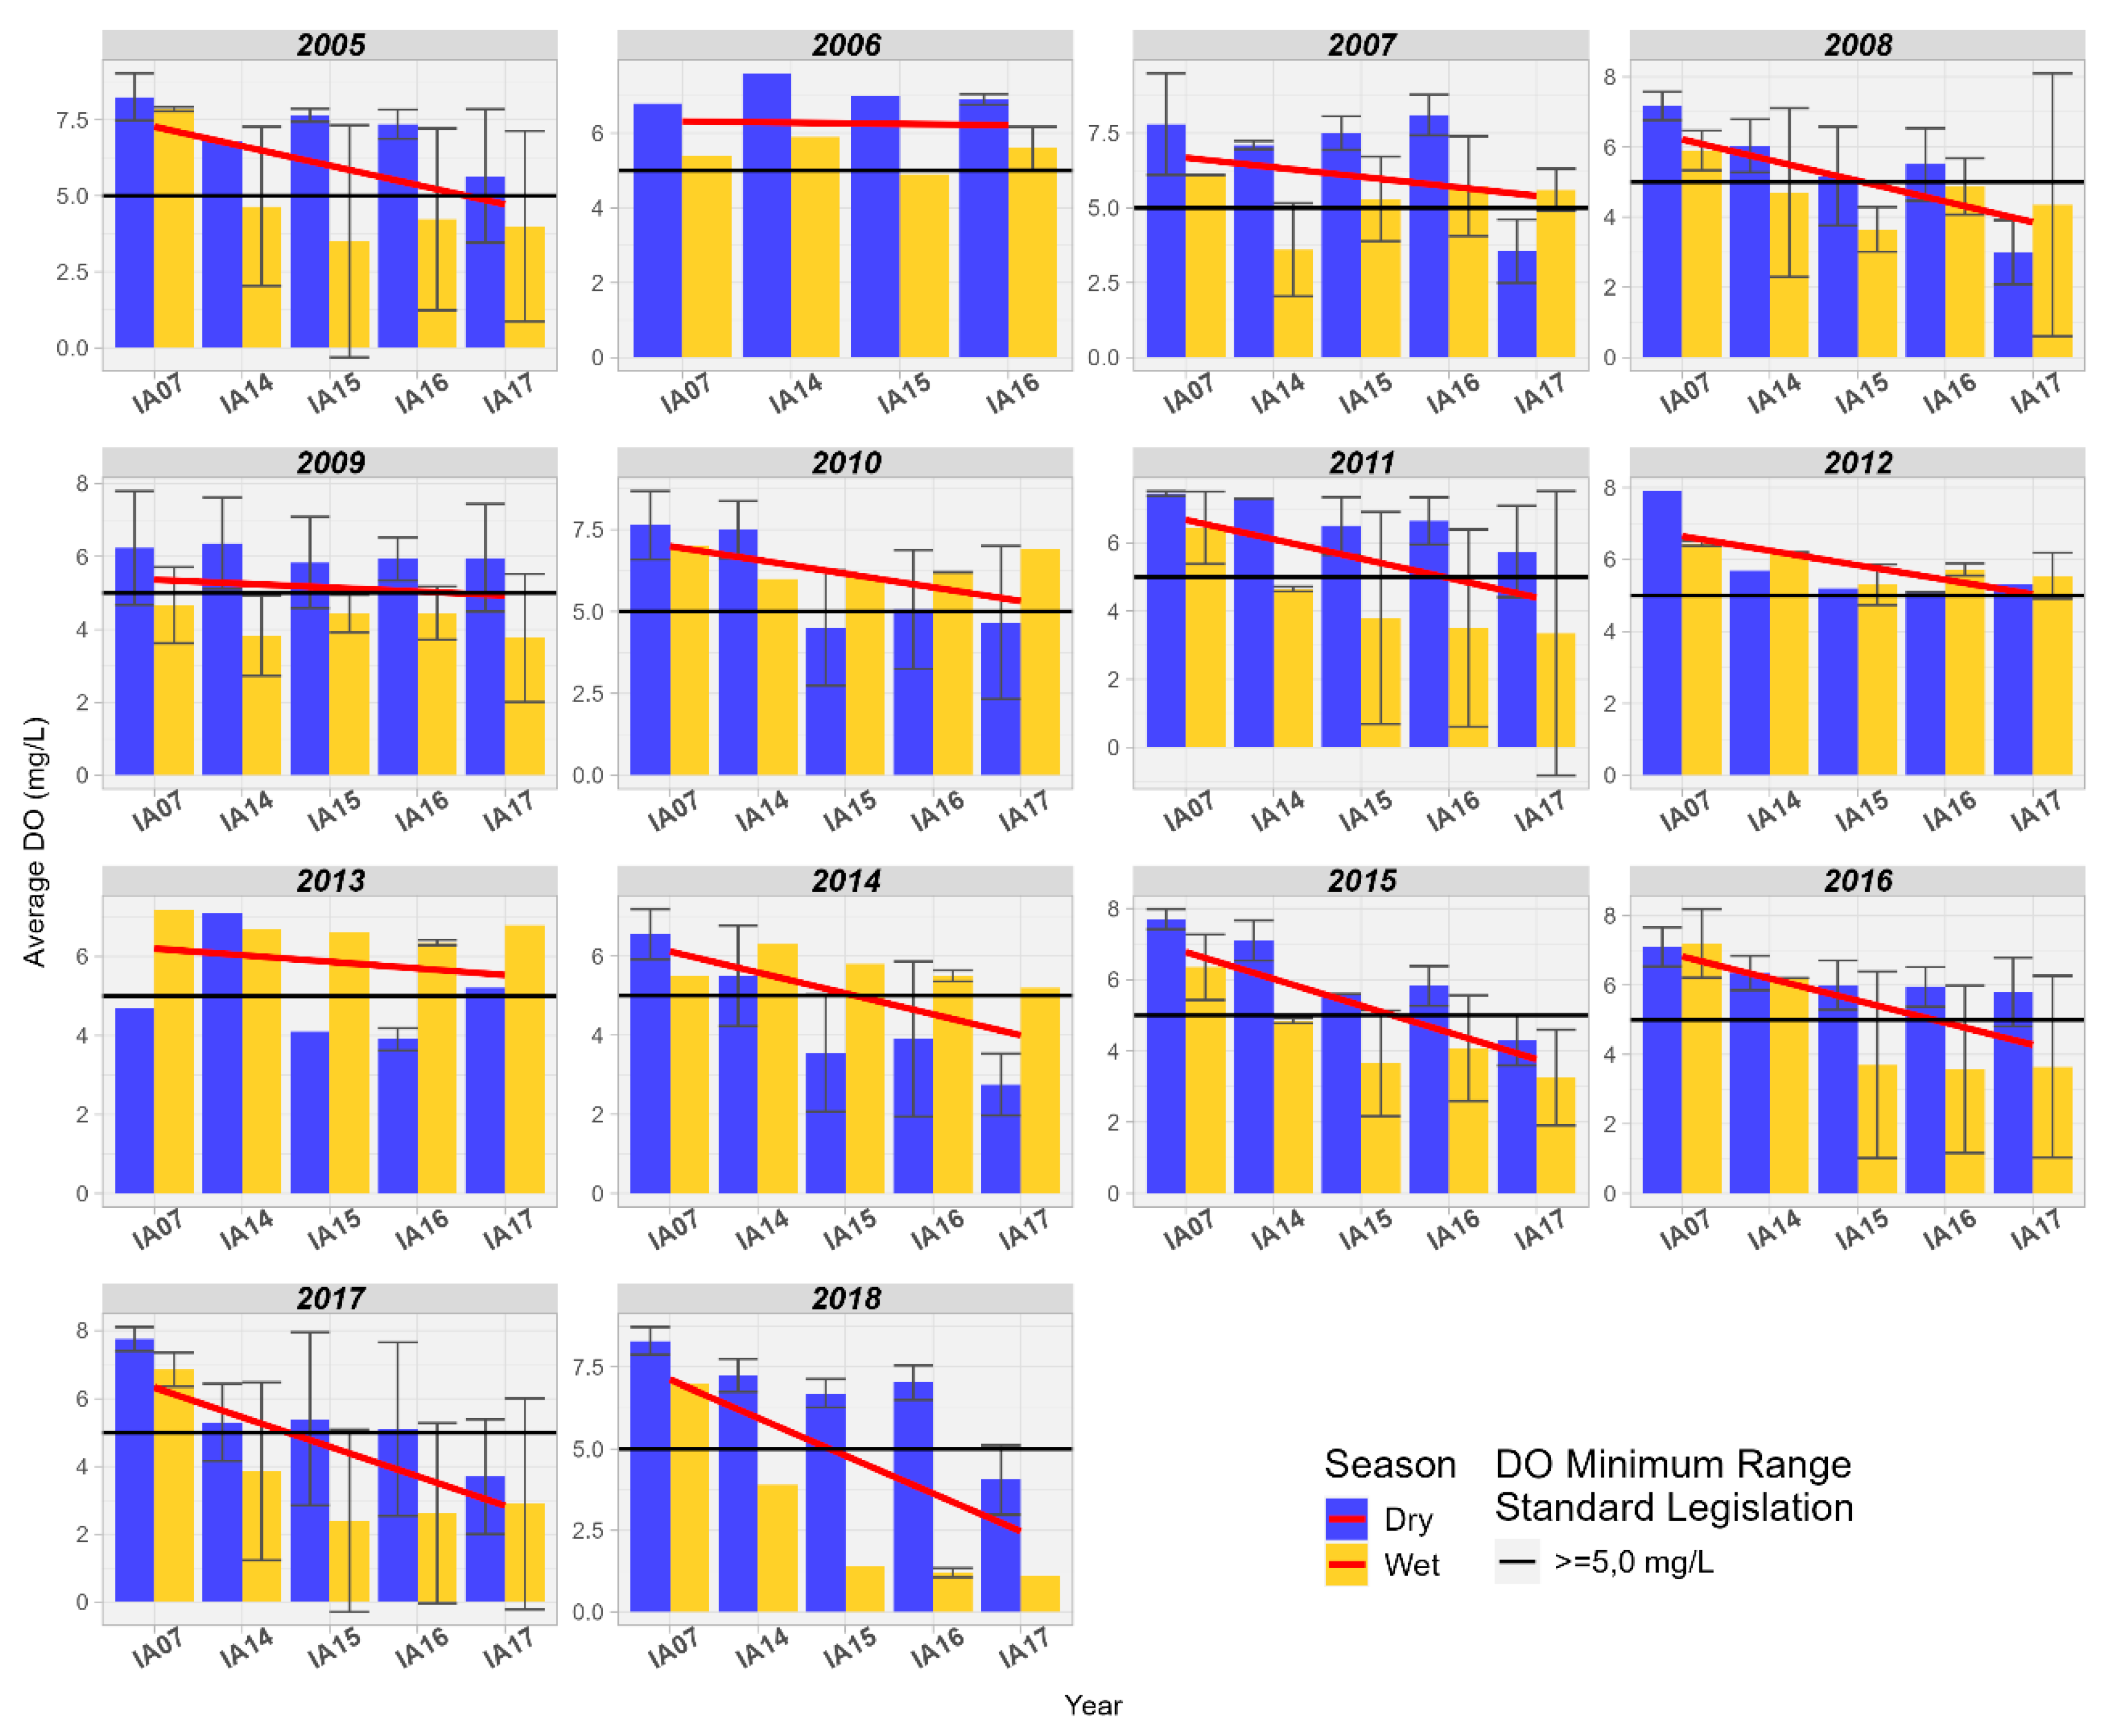
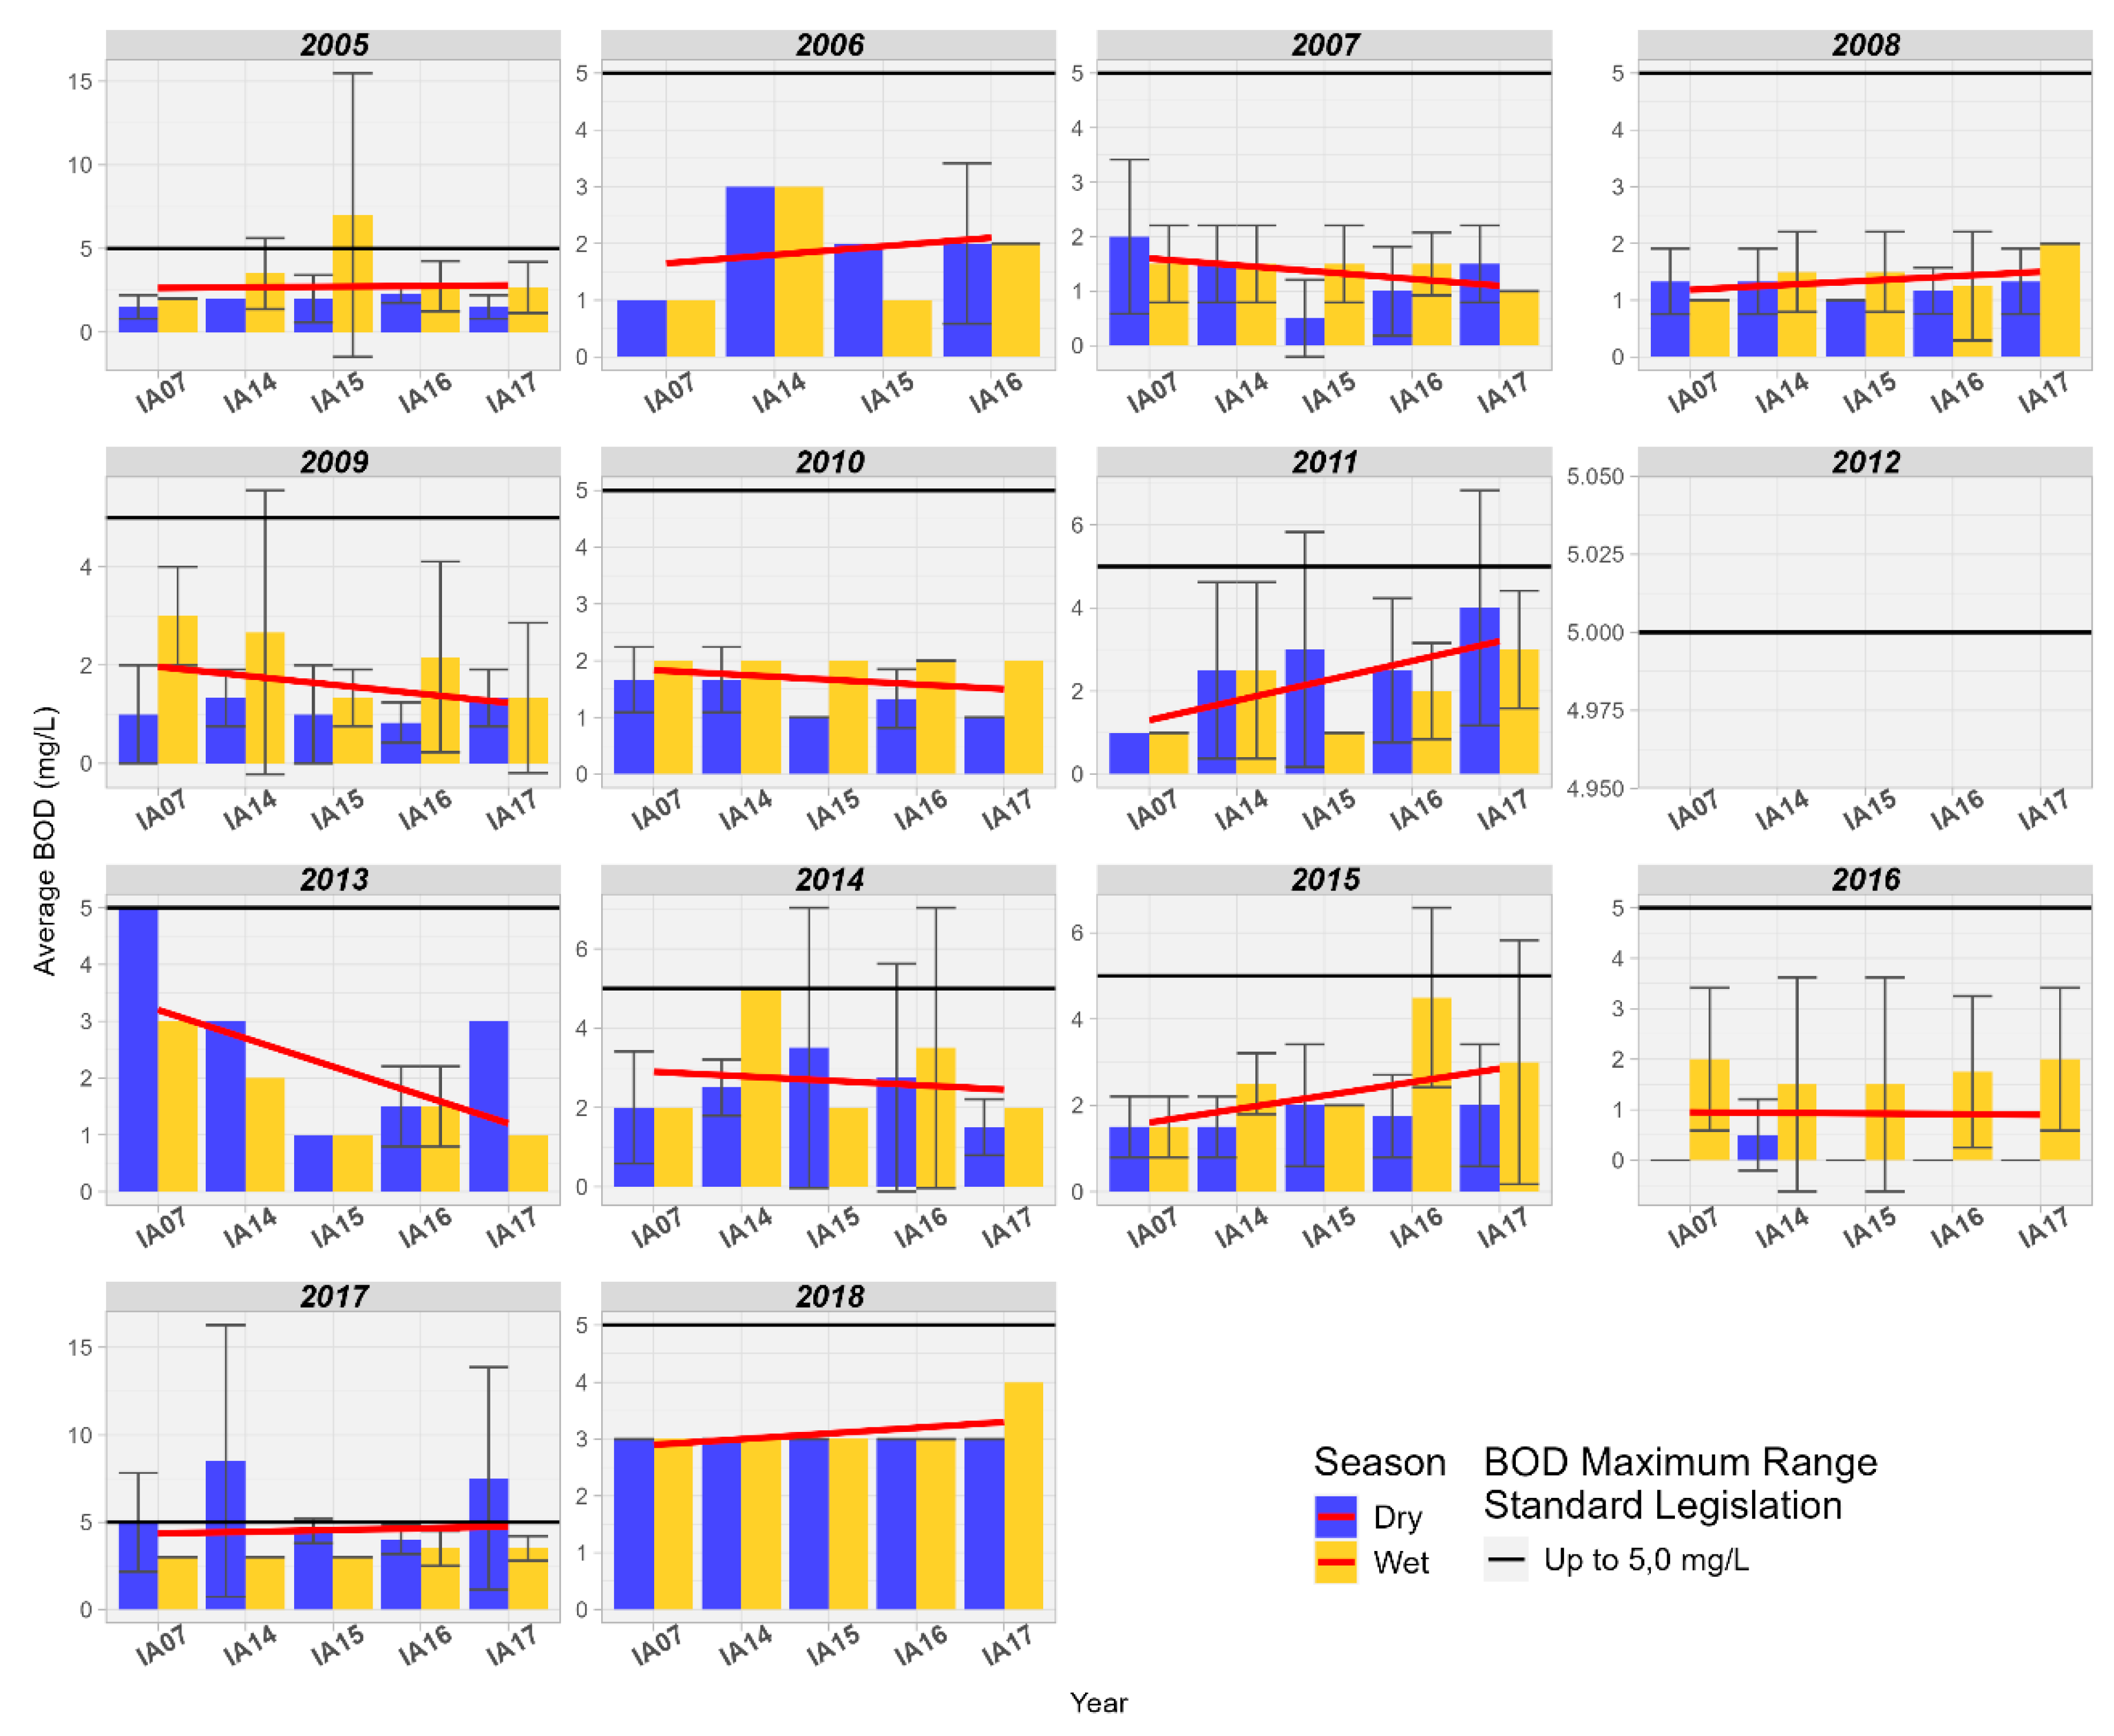
3.5.2. Dissolved Oxygen and Biochemical Oxygen Demand Assessment
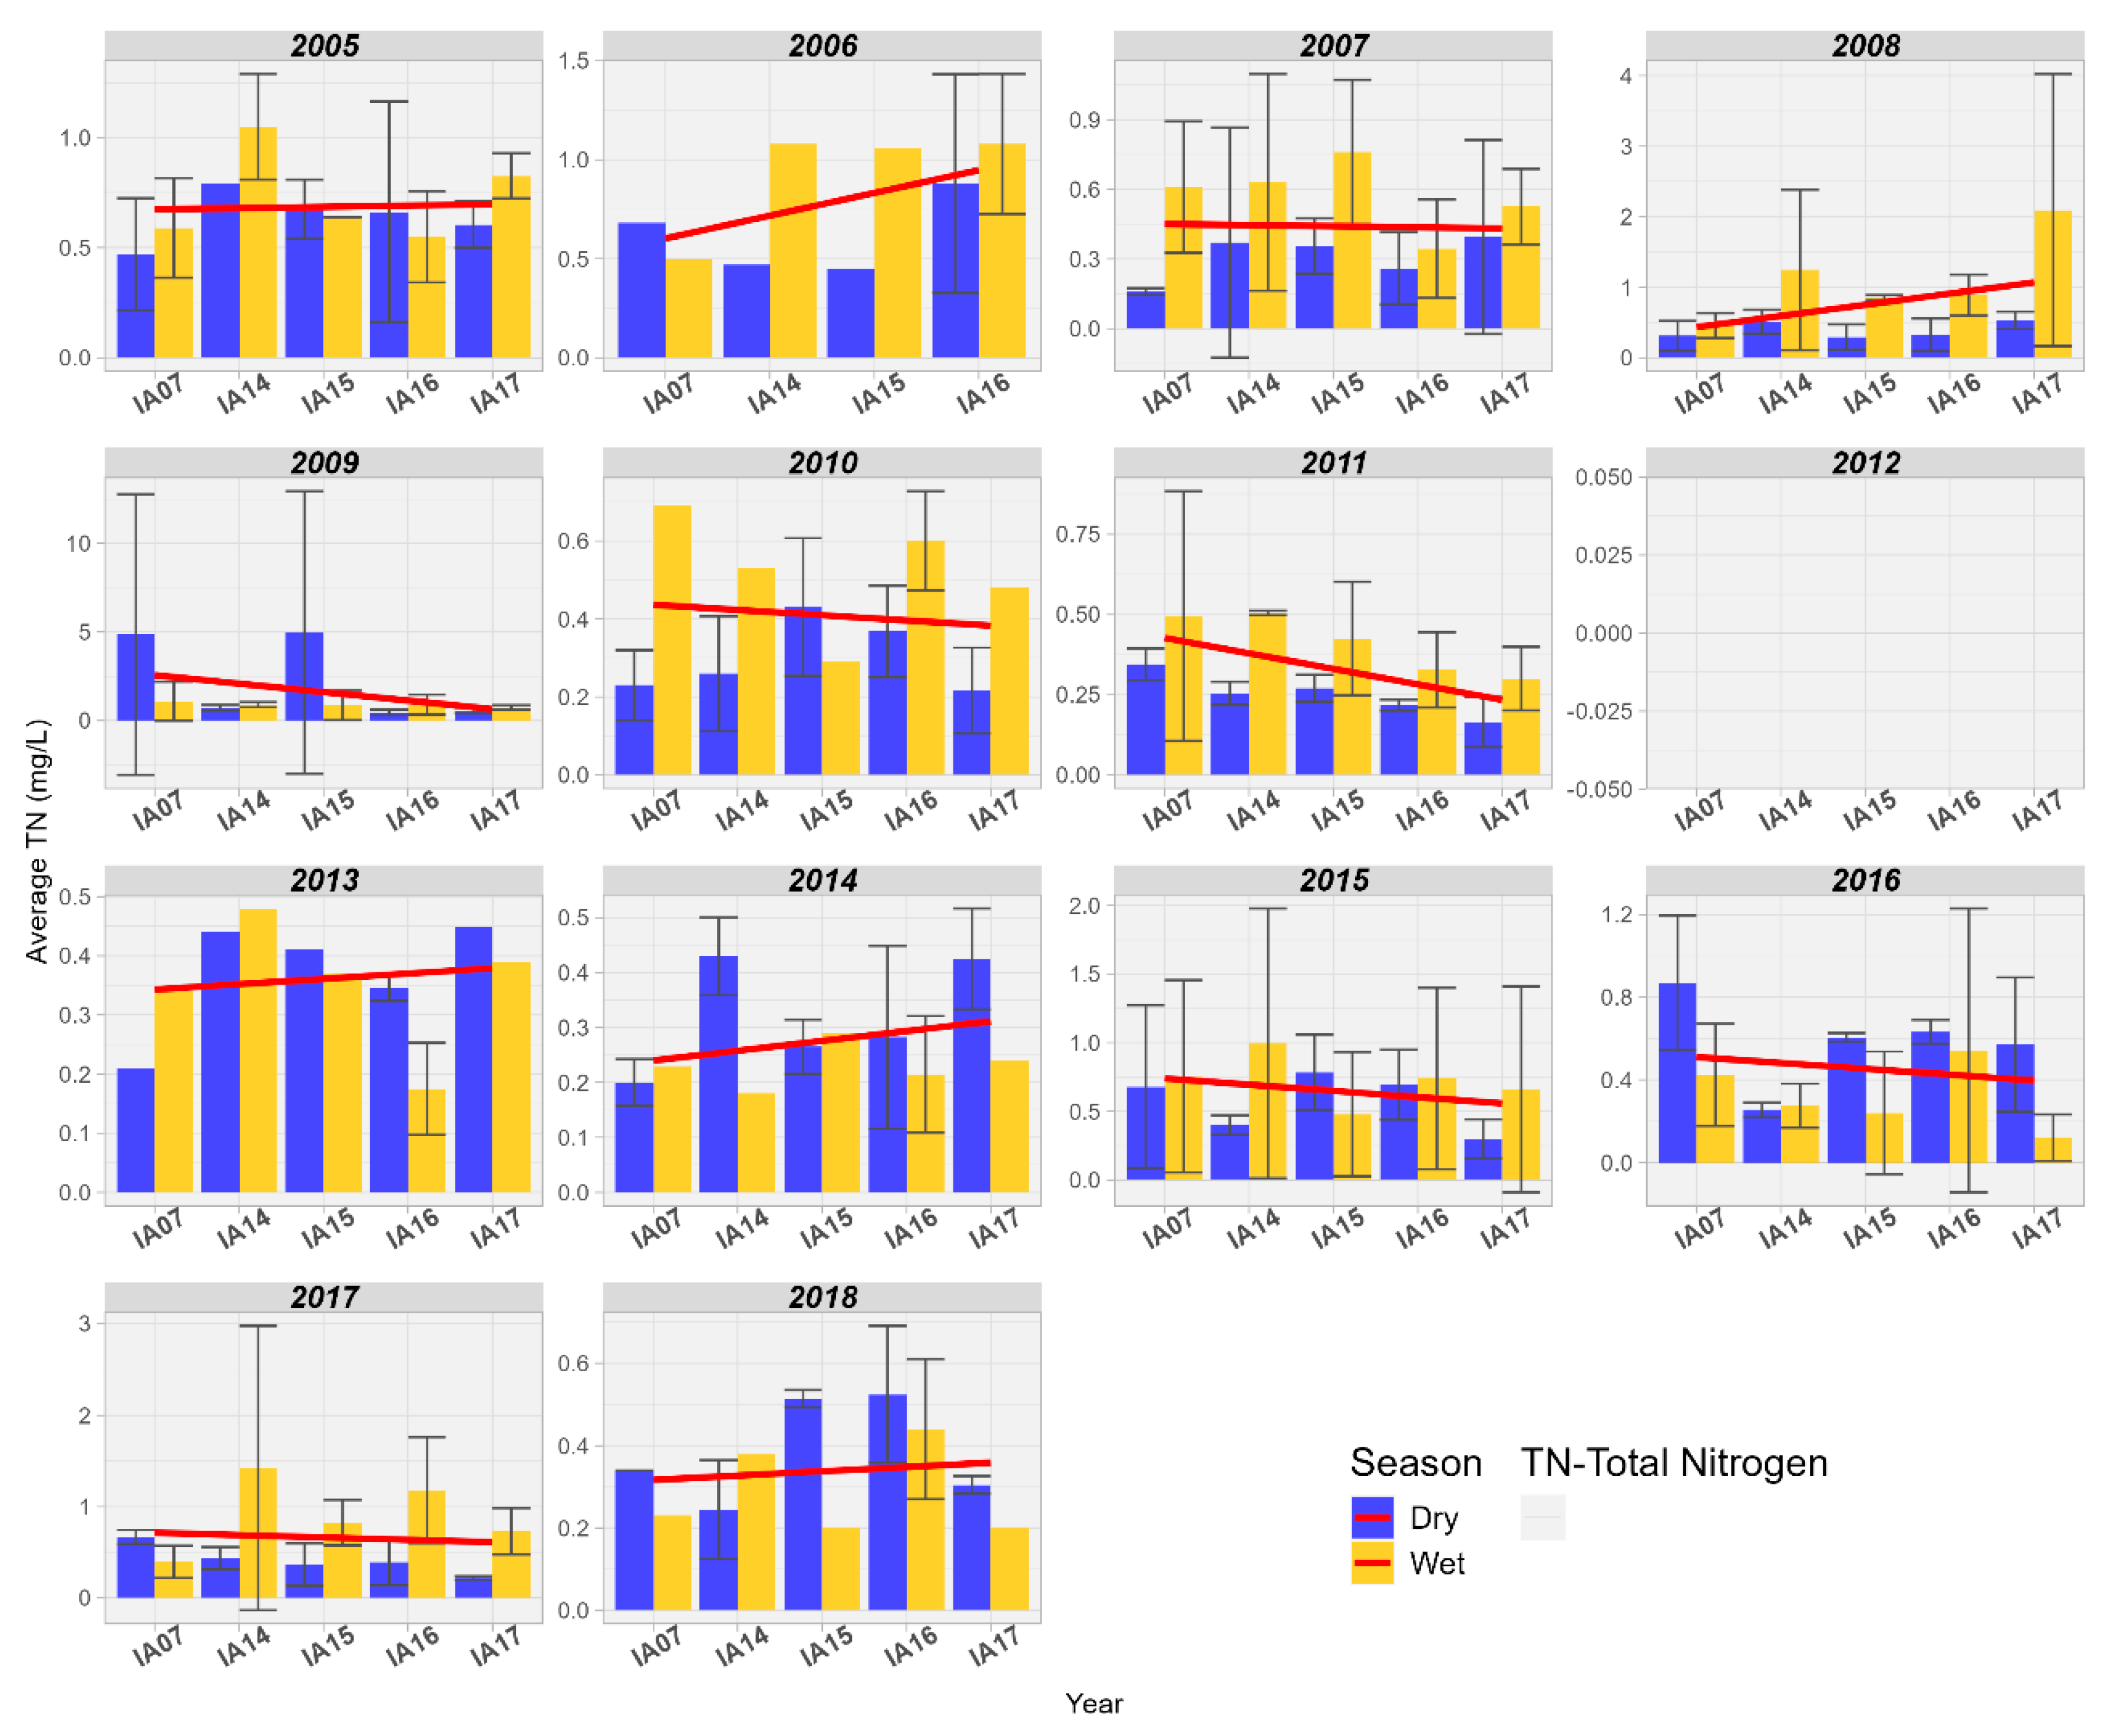
3.5.3. Total Nitrogen Assessment
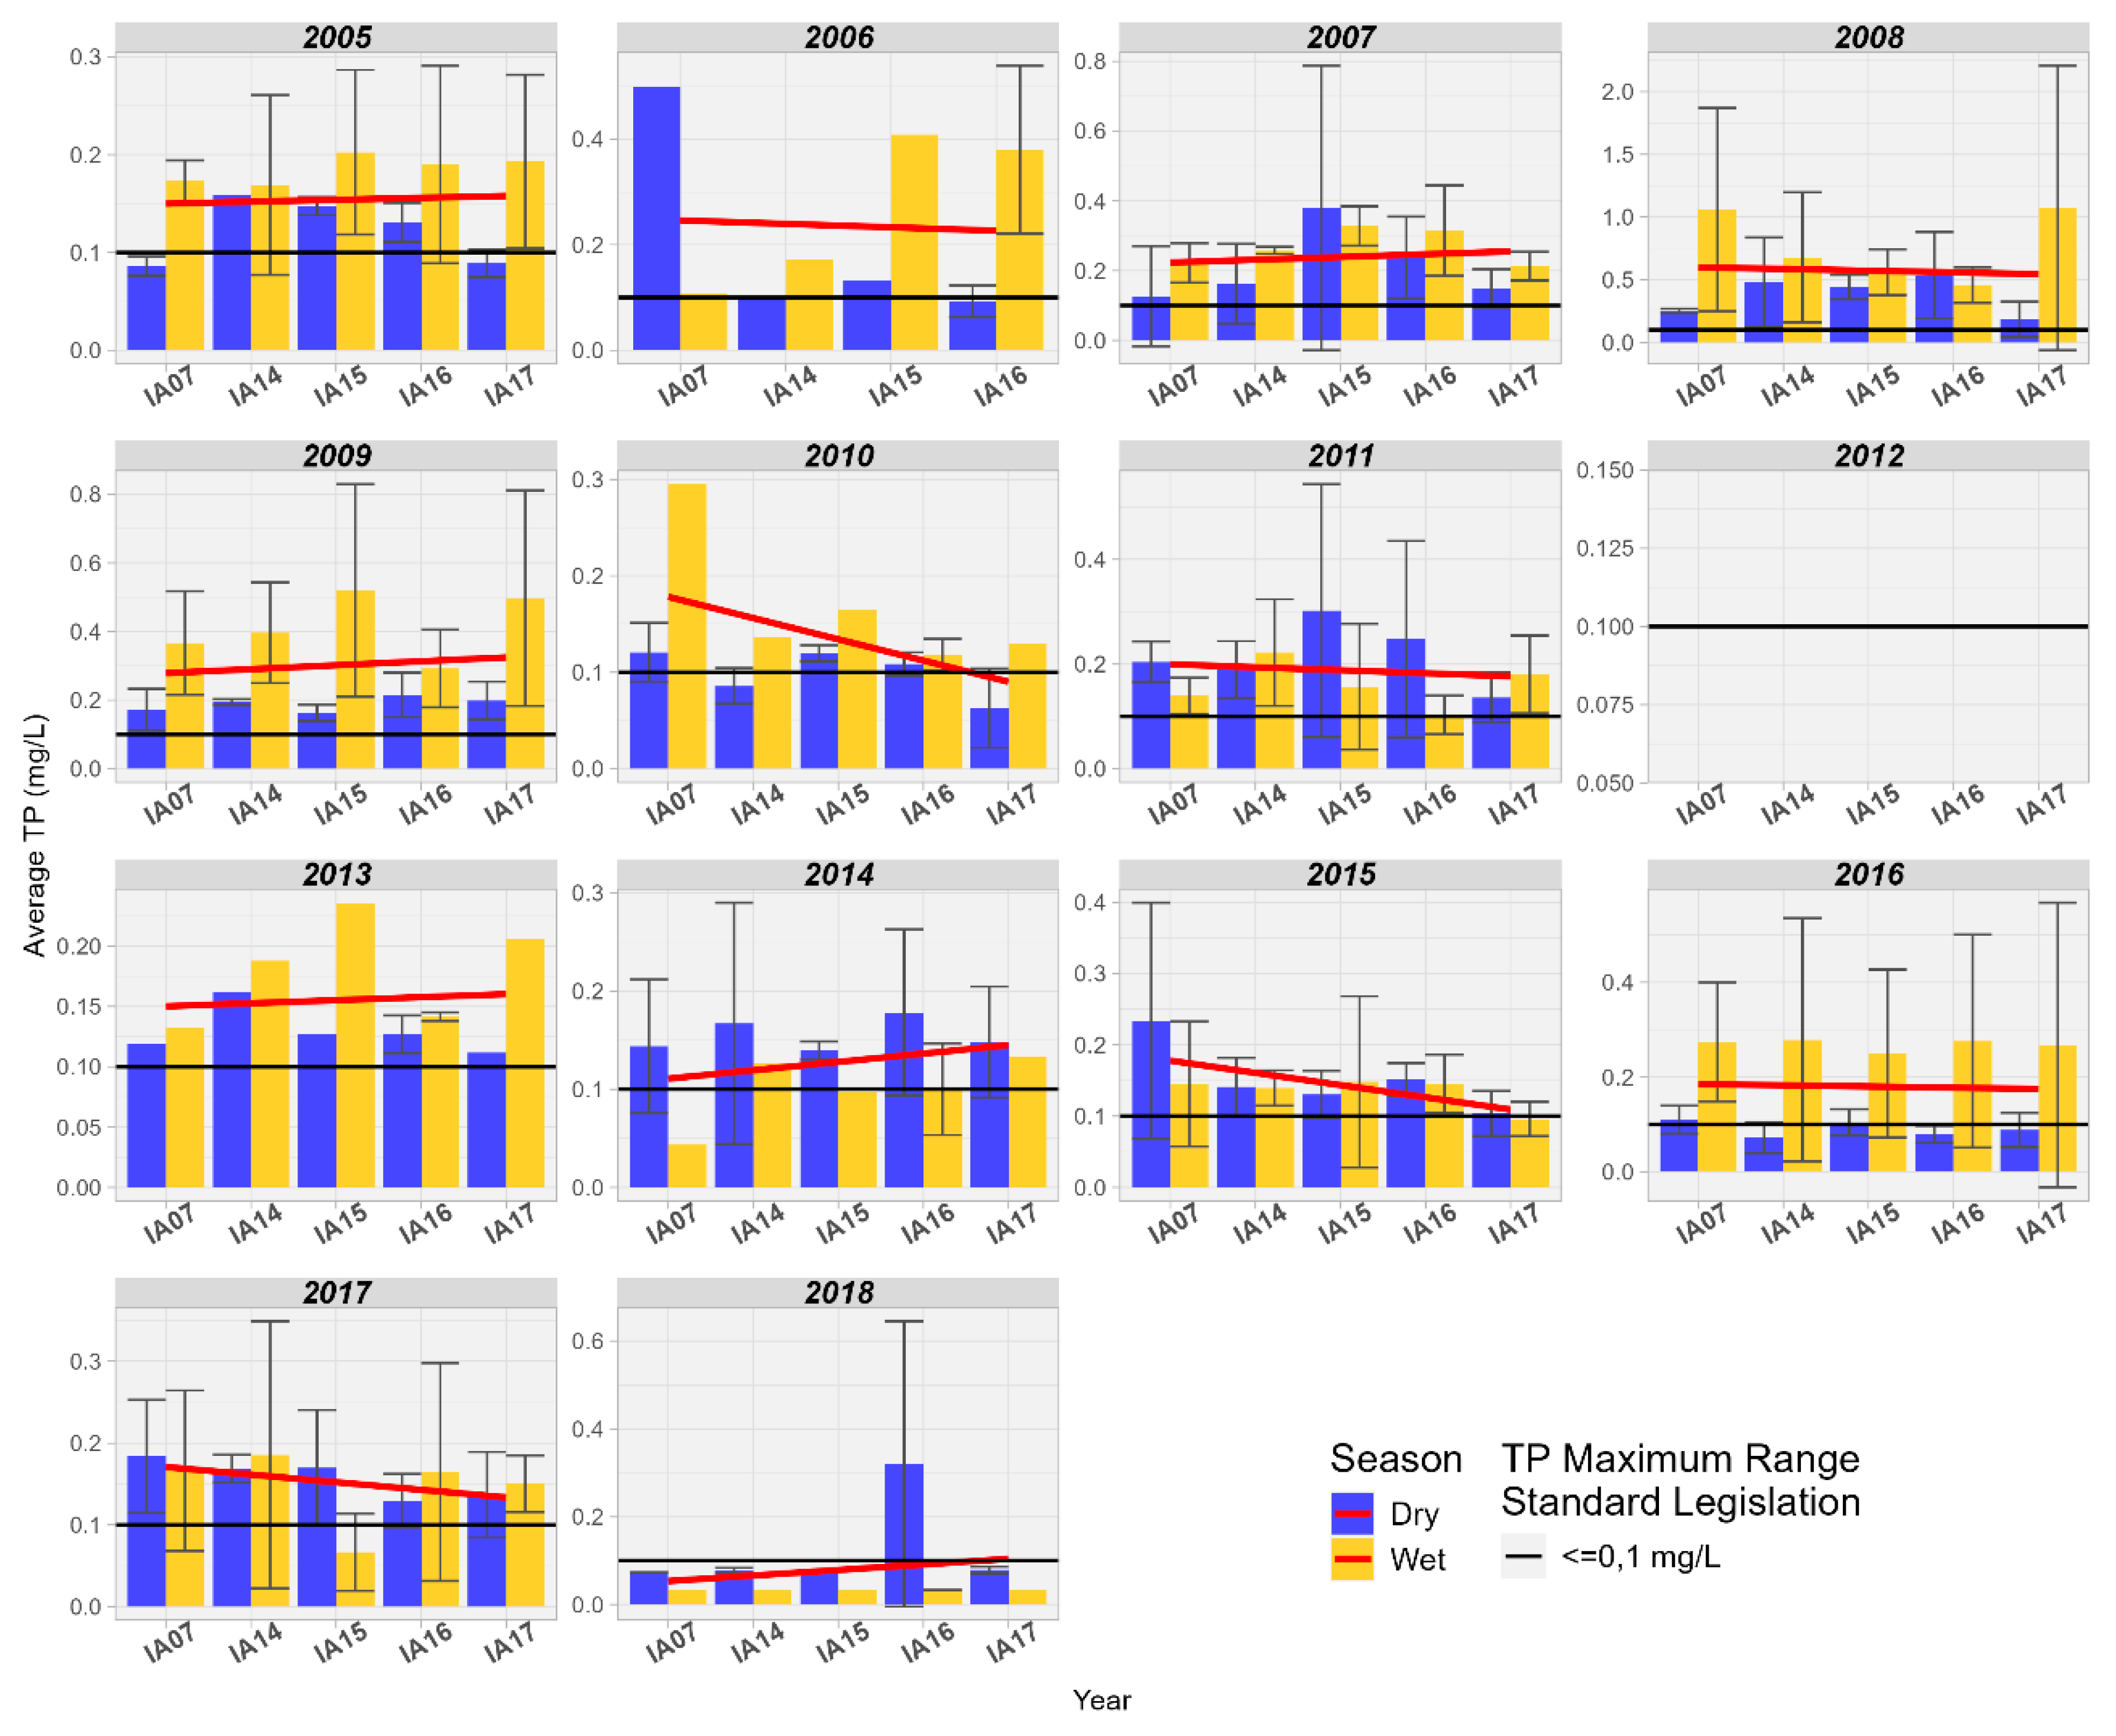
3.5.4. Total Phosphorus Assessment
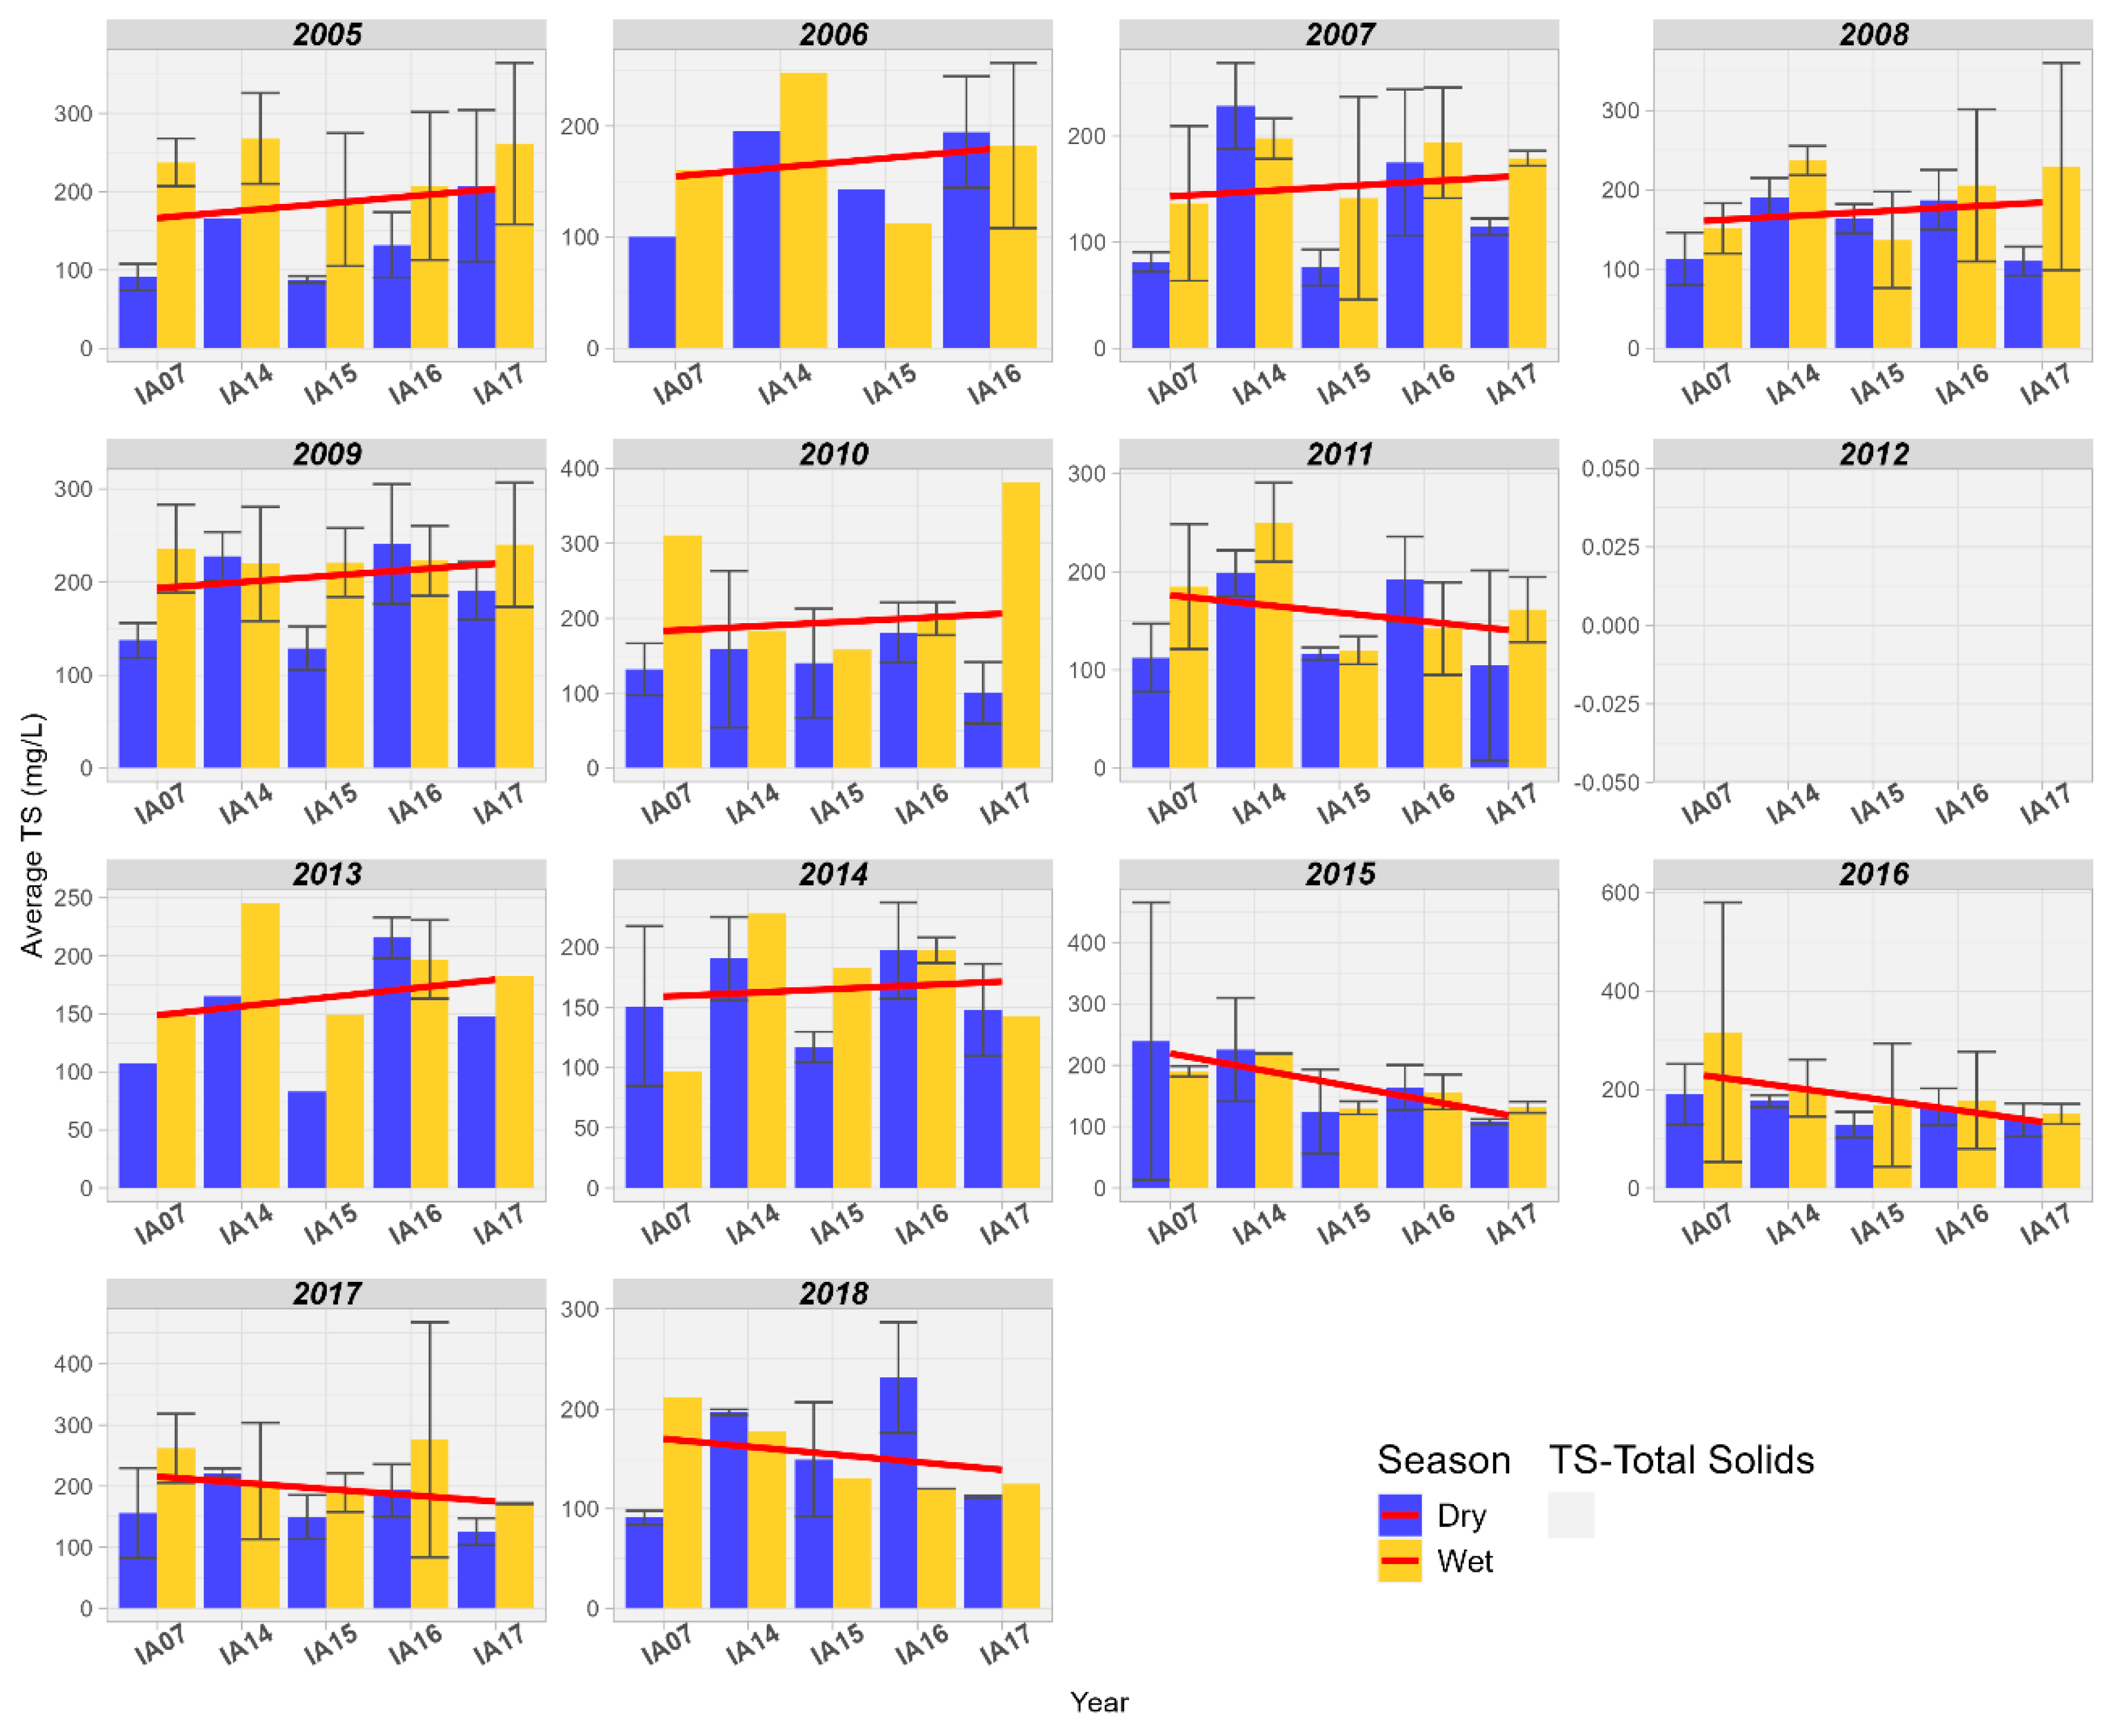
3.5.5. Total Solids Assessment
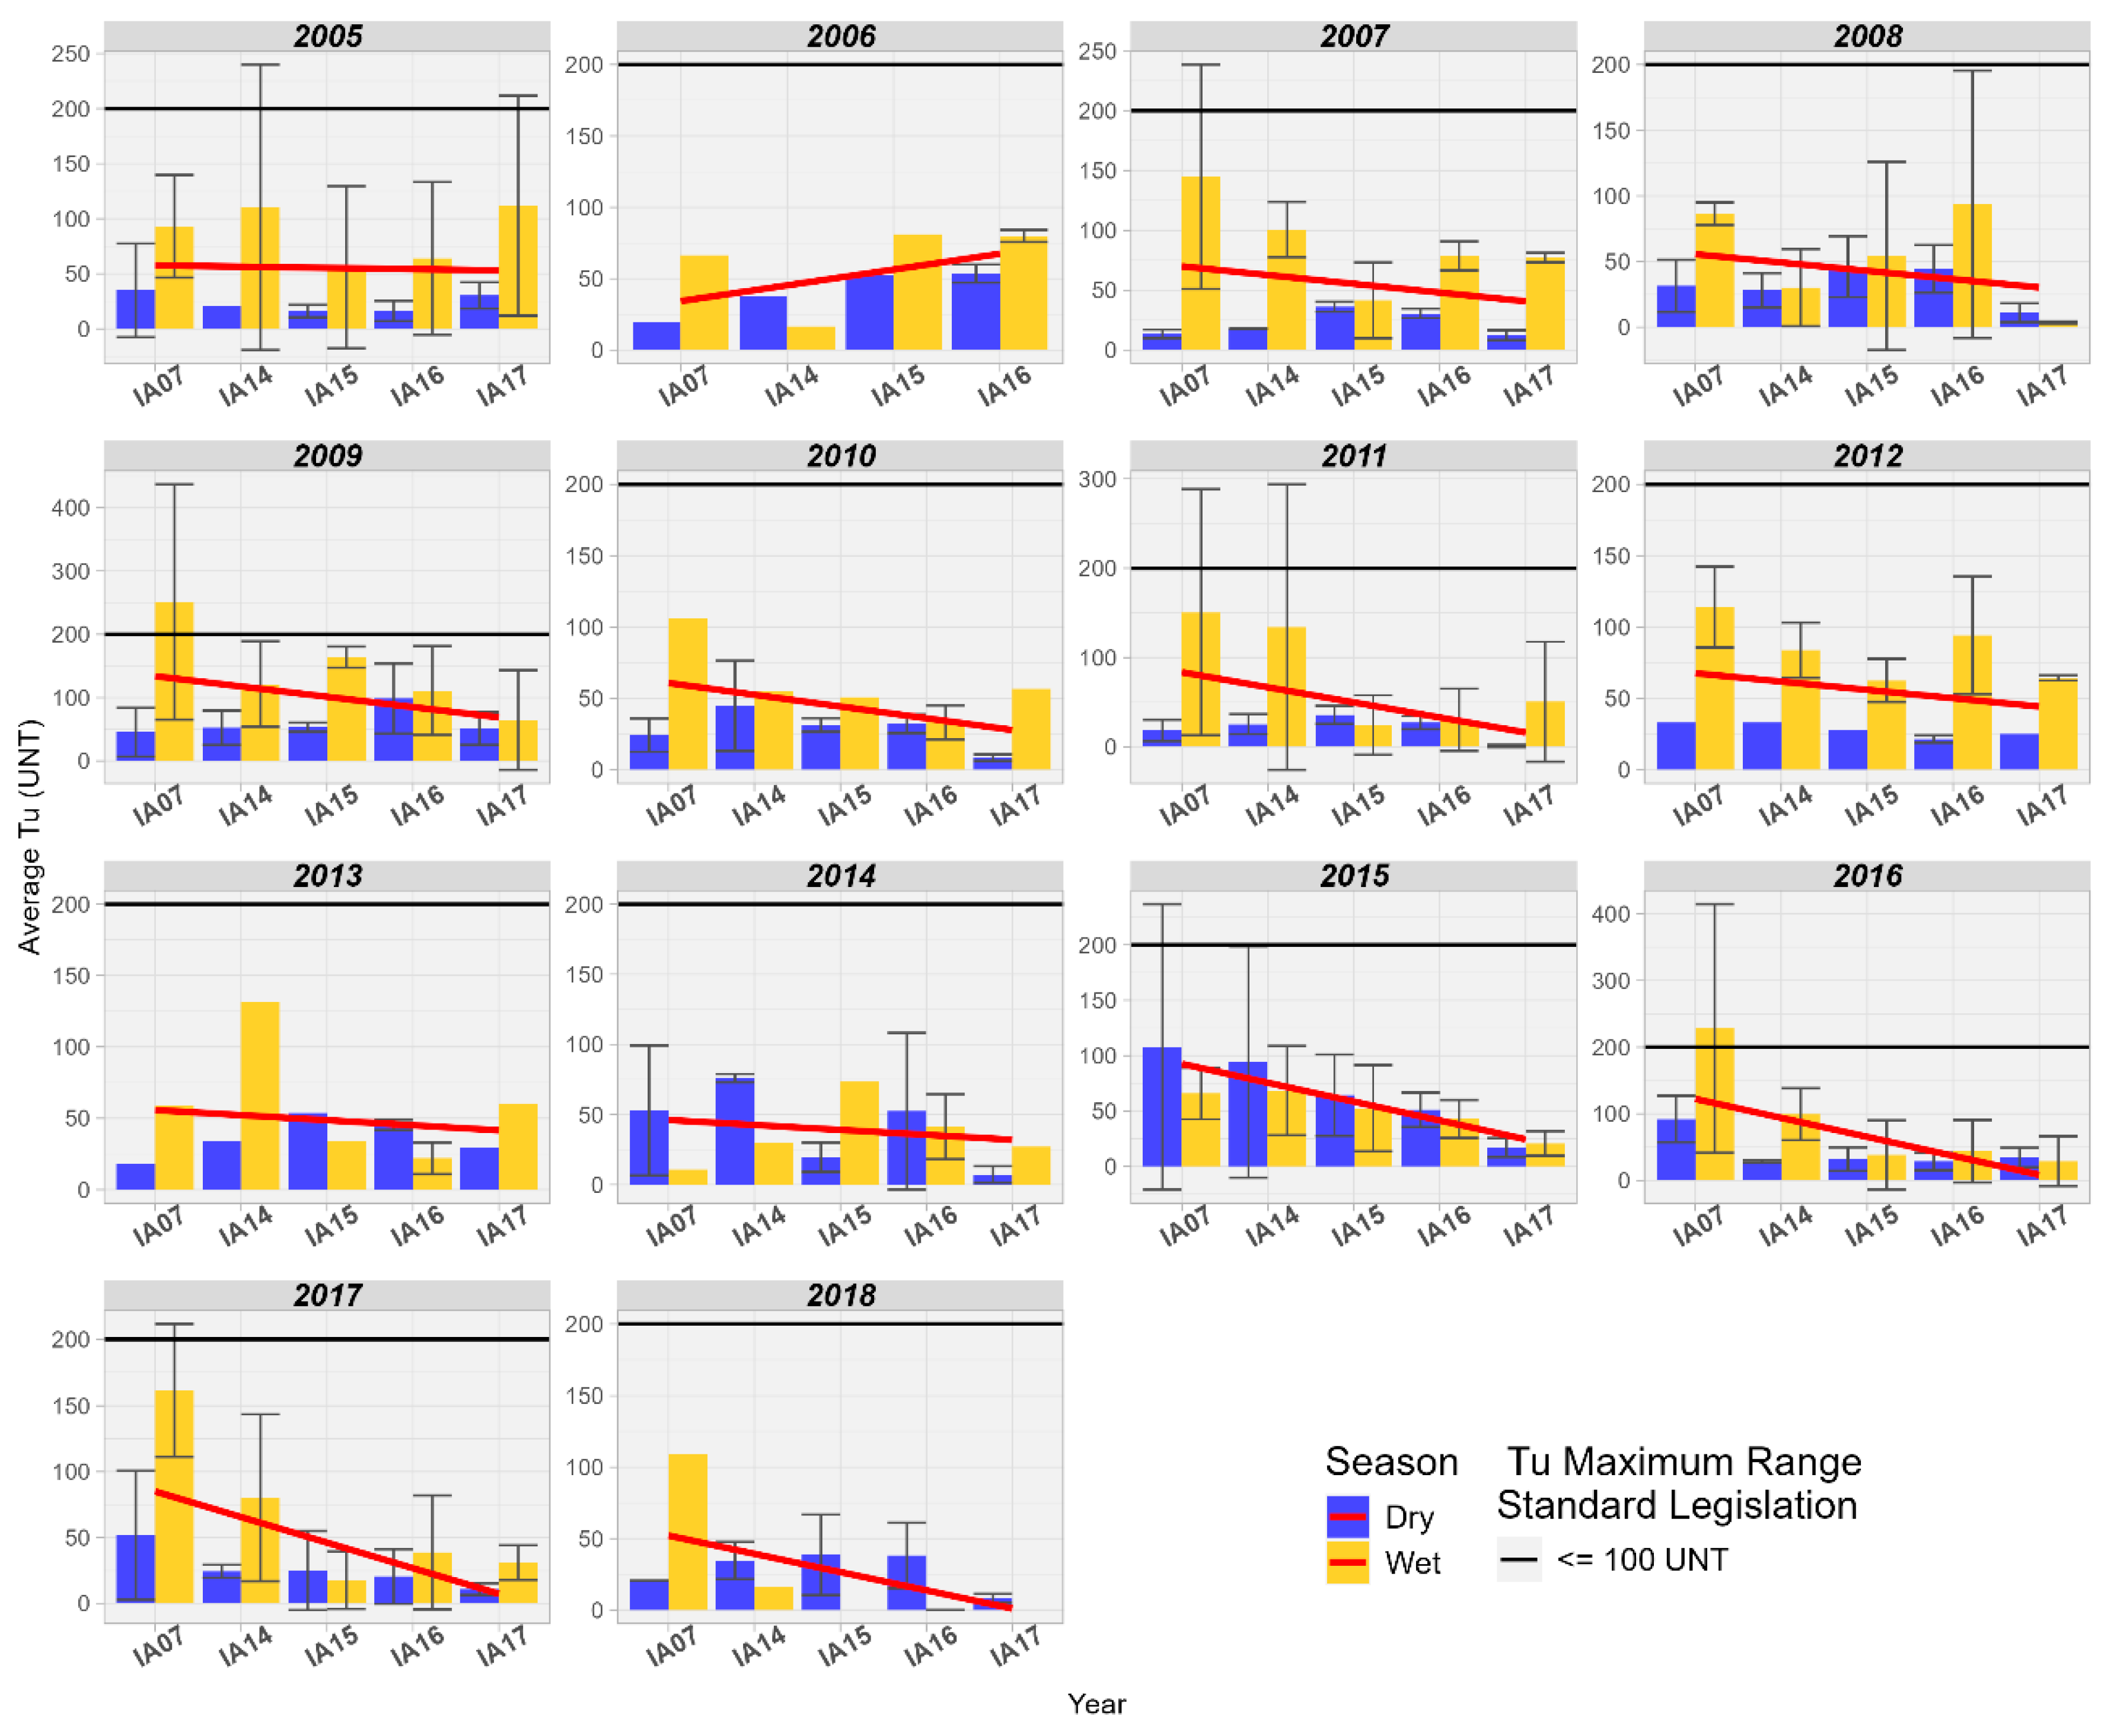
3.5.6. Turbidity Assessment
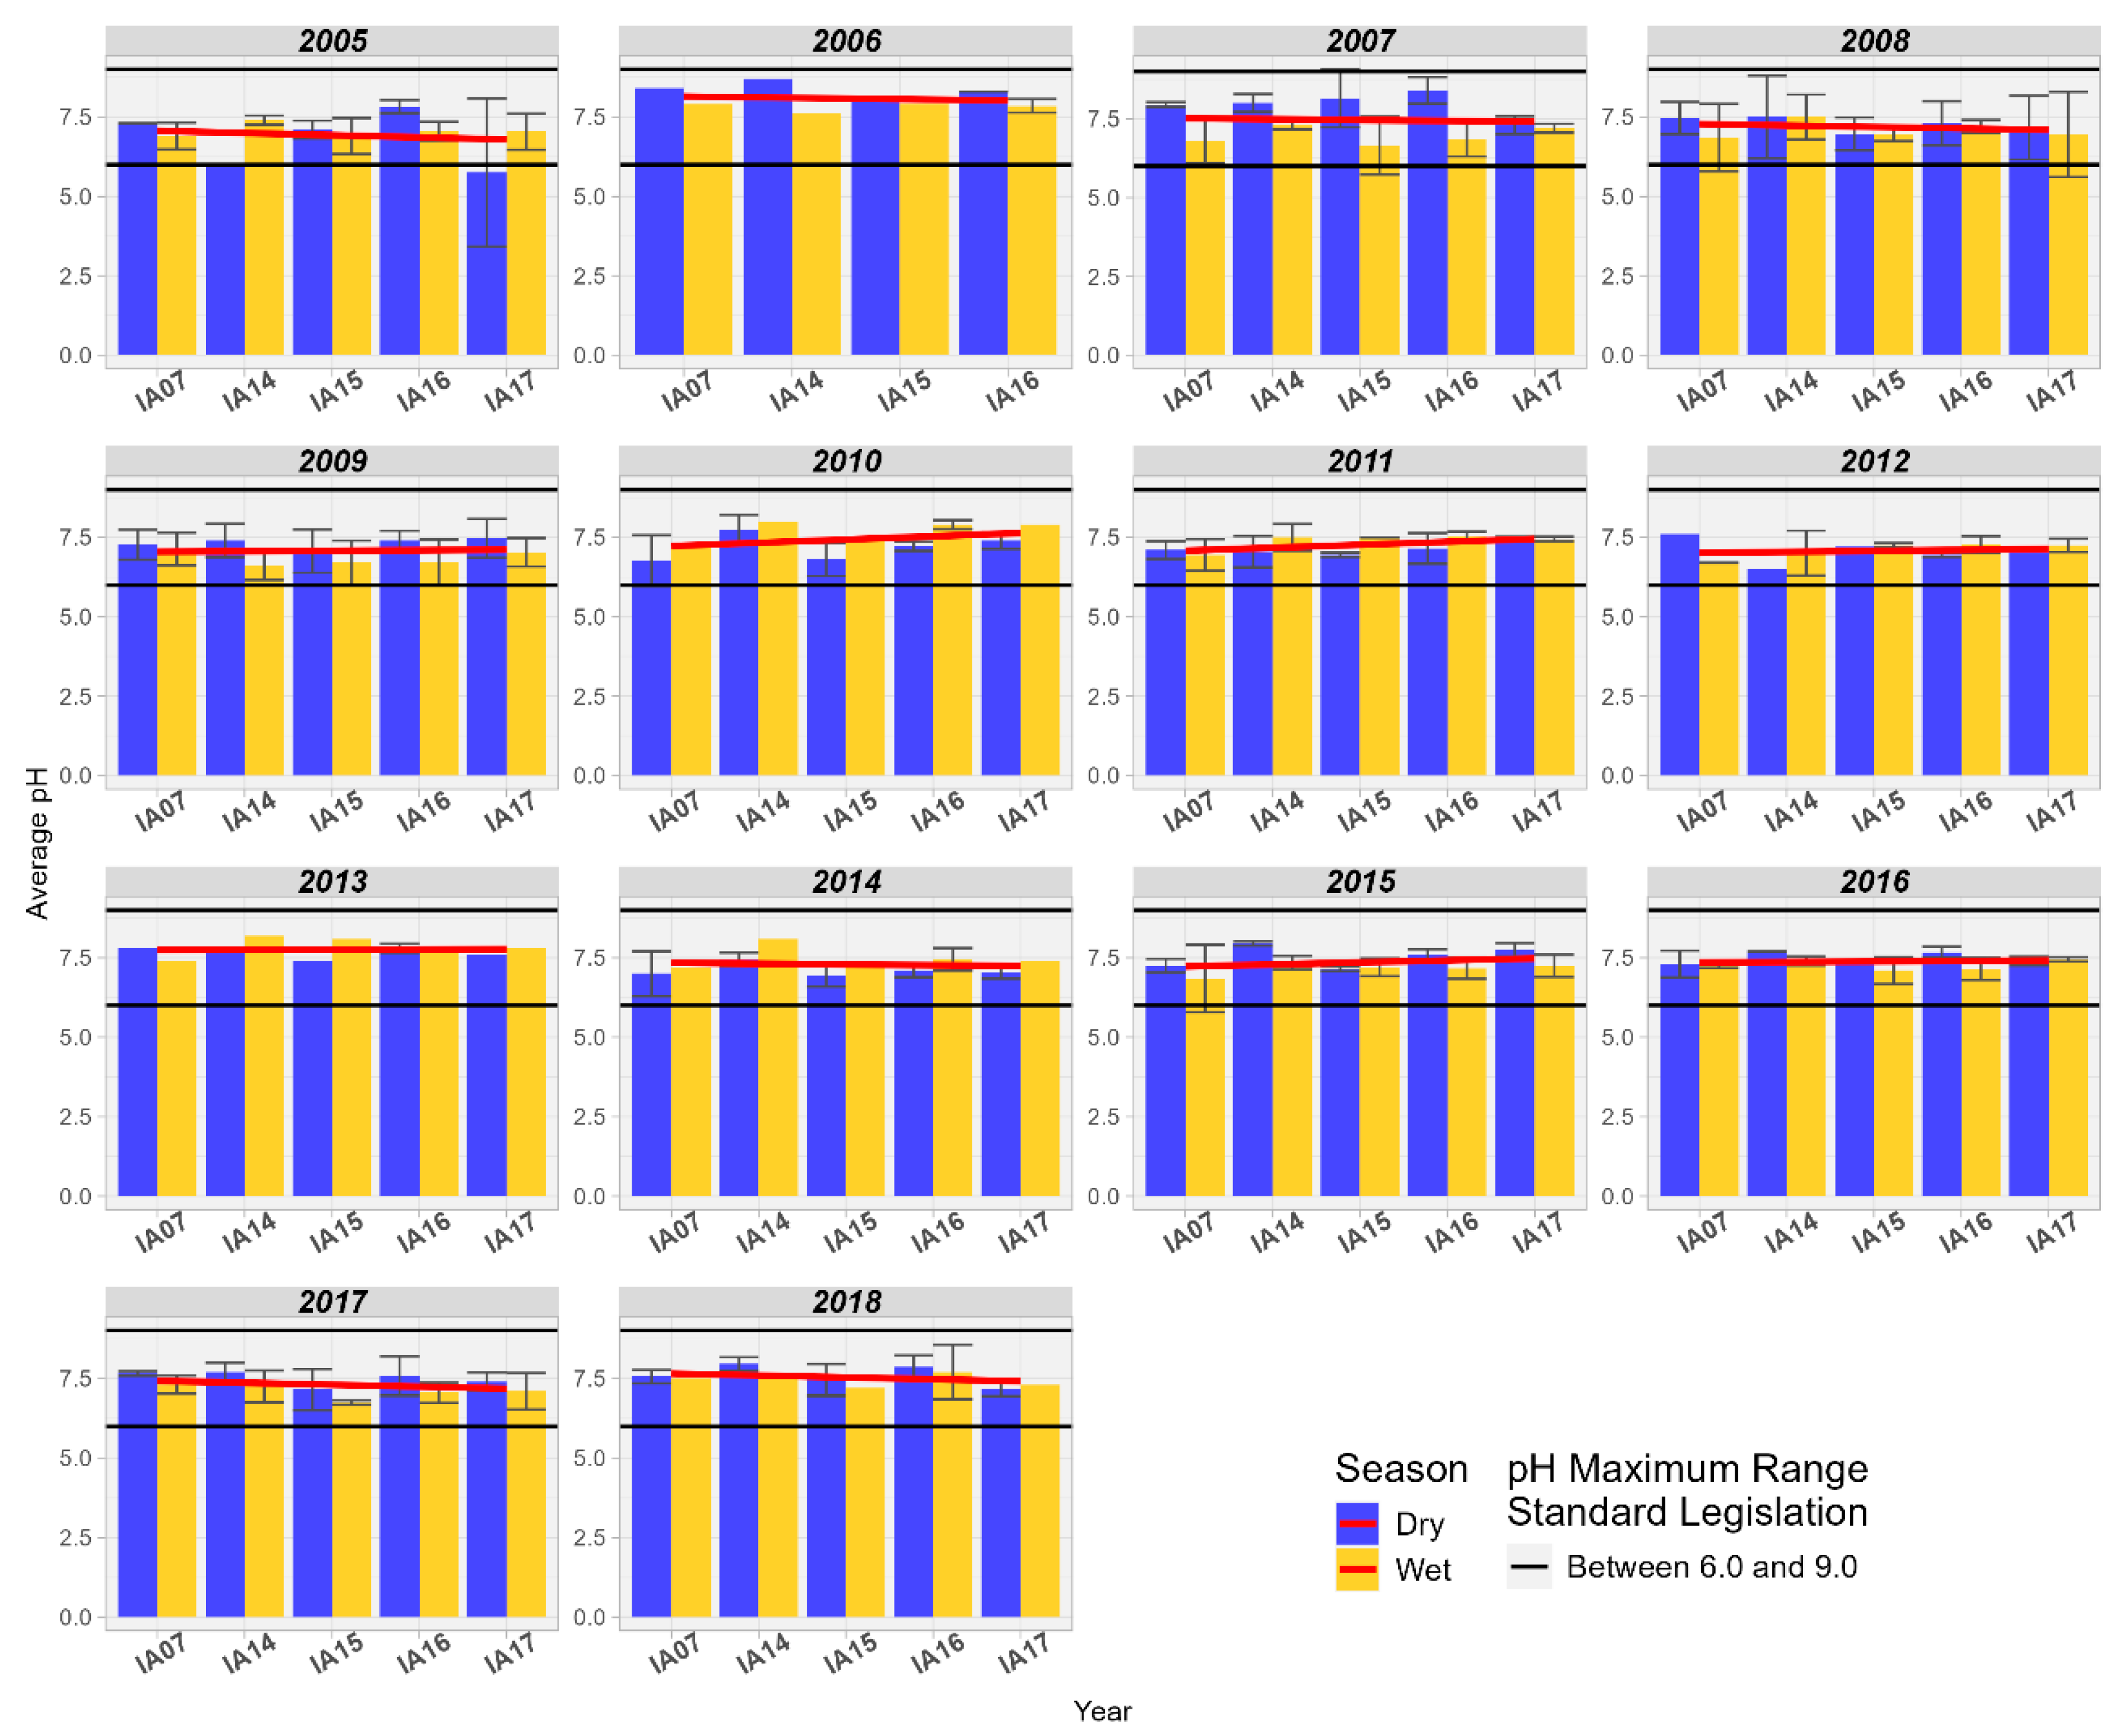
3.5.7. pH Assessment
3.5.8. Water Quality Index (WQI)
4. Conclusions
Author Contributions
Funding
Institutional Review Board Statement
Informed Consent Statement
Acknowledgments
Conflicts of Interest
References
- Arenas-Sánchez, A., Rico, A., Vighi, M. Effects of water scarcity and chemical pollution in aquatic ecosystems: State of the art. Science of The Total Environment 2016, 572, 390–403. [CrossRef] [PubMed]
- Ipea-Objetivos do Desenvolvimento Sustentável, 2022. Available online: https://www.ipea.gov.br/ods/index.html (accessed on 6 May 2024).
- Von Sperling, M., Chernicharo, C.A.L. Biological wastewater treatment in warm climate regions. Volume 1. Publisher: IWA Publishing, UK, 2005, p. 1496. http://www.iwapublishing.com/open-access-ebooks/3567.
- Song, Y., Song, X., Shao, G., Hu, T. Effects of Land Use on Stream Water Quality in the Rapidly Urbanized Areas: A Multiscale Analysis. Water 2020, 12, 1123. [CrossRef]
- Braga, B., Hespanhol, I., Conejo, J.L., Mierzwa, J.C., Barros, M.T. de, Spencer, M., Porto, M., Nucci, N., Juliano, N., Eiger, S., Gallardo, A., Boneccarrere, J., Souza, T. de, Contrera, R. Introdução à engenharia ambiental, 3th Edition. Editor: Simone de Fraga, Publisher: Bookman, Brasil, 2021, pp 392.
- Da Silva, J.D.S.V., De Moura, A.M., Pott A., De Arruda, M.R. Fragile ecosystem: the Brazilian Pantanal wetland. In: Sanchez L.E., editor. Area Studies-Brazil: Regional Sustainable Development Review. Oxford, United Kingdom: Eolss Publishers Co. Ltd., 2009 pp 302-339.
- Giri, S., Qiu, Z. Understanding the relationship of land uses and water quality in Twenty First Century: A review. Journal of Environmental Management 2016, 173, 41–48. [CrossRef]
- Menezes, J.P.C., Bittencourt, R.P., Farias, M. de S., Bello, I. P., Fia, R., Oliveira, L.F.C. de. Relação entre padrões de uso e ocupação do solo e qualidade da água em uma bacia hidrográfica urbana. Engenharia Sanitaria e Ambiental 2016, 21, 519–534. [CrossRef]
- Dias, R.Z., Baptista, G.M.de M. Wetland nutrient retention and multitemporal growth - Case study of Riacho Fundo’s Wetland. Acta Limnologica Brasiliensia 2015, 27, 254–264. [CrossRef]
- Mello, K. de, Valente, R.A., Randhir, T.O., dos Santos, A.C.A., Vettorazzi, C.A. Effects of land use and land cover on water quality of low-order streams in Southeastern Brazil: Watershed versus riparian zone. CATENA 2018, 167, 130–138. [CrossRef]
- Shi, P., Zhang, Y., Li, Z., Li, P., Xu, G. Influence of land use and land cover patterns on seasonal water quality at multi-spatial scales. CATENA 2017, 151, 182–190. [CrossRef]
- Fisher, J., Acreman, M.C. Wetland nutrient removal: A review of the evidence. Hydrology and Earth System Sciences 2004, 8, 673–685. [CrossRef]
- Projeto MapBiomas - Coleção 6 da Série Anual de Mapas de Cobertura e Uso da Terra do Brasil. Available online: http://brasil.mapbiomas.org/ (accessed on 28 March 2024).
- IMASUL. Relatórios de Monitoramento da Qualidade das Águas Superficiais de Mato Grosso do Sul, 2020. Available online: http://www.imasul.ms.gov.br/relatorios-de-monitoramento-da-qualidade-das-aguas-superficiais/ (accessed on 28 March 2024).
- American Public Health Association, American Water Works Association, Water Environment Federation. Lipps WC, Braun-Howland EB, Baxter TE, eds. Standard Methods for the Examination of Water and Wastewater. 24th ed. Washington DC: APHA Press; 2023.
- ASTM International. ASTM D888-12e1, "Standard Test Methods for Dissolved Oxygen in Water" West Conshohocken, United States.
- ABNT: Associação Brasileira de normas técnicas. ABNT NBR 13796:1997-04-30: água-Determinação de nitrogênio orgãnico, kjeldahl e total - Métodos macro e semimicro Kjeldahl.
- IBGE: Instituto Brasileiro de Geografia e Estatística. Biomas e Sistema Costeiro-Marinho do Brasil-PGI. Available online: https://www.ibge.gov.br/apps/biomas/#/home (accessed on 28 March 2024).
- Plano de Recursos Hídricos da Região Hidrográfica do Paraguai - PRH Paraguai, Produto Parcial PP-04 - Definição das Metas do PRH Paraguai e Diretrizes e Estudos para os Instrumentos de Gestão. Agência Nacional de Águas - Brasília: ANA/SPR, ENGECORPS ENGENHARIA S.A., 2017.
- Ferraz, R.G.B. Antropização da bacia hidrográfica do Rio Miranda: alterações climáticas, recursos naturais e desenvolvimento. 2006. Dissertação de Mestrado, orientação do Prof. Dr. Reginaldo Brito da Costa- Campo Grande-MS, UCDB, Brasil.
- Padovani, C.R. Conversão da vegetação natural do Pantanal para uso antrópico de 1976 até 2017 e projeção para 2050. Comunicado Técnico 2017, 109, 1–6. [Google Scholar]
- Landau, E.C., Resende, R.M.S., Matos Neto, F. da C. Evolução da área ocupada por pastagens. In: Landau, E.C.; Silva, G.A. Da; Moura, L.; Hirsch, A.; Guimarães, D. P. (Ed.). Dinâmica da produção agropecuária e da paisagem natural no Brasil nas últimas décadas: produtos de origem animal e da silvicultura. Brasília, DF: Embrapa, 2020. v. 3, cap. 46, p. 1555-1578. Available online: http://www.alice.cnptia.embrapa.br/handle/doc/1122718 (accessed on 28 March 2024).
- Lamas, F. M. Artigo-A dinâmica da agricultura em Mato Grosso do Sul. EMBRAPA 2021. Available online: https://www.embrapa.br/busca-de-noticias/-/noticia/65083174/artigo---a-dinamica-da-agricultura-em-mato-grosso-do-sul (accessed on 28 March 2024).
- Bergier, I., Assine, M.L. (Edt.). Dynamics of the Pantanal Wetland in South America (Vol. 37). 2016. Springer International Publishing. [CrossRef]
- Dise, N. B. Biogeochemical Dynamics III: The Critical Role of Carbon in Wetlands. Em E. Maltby & T. Barker (Orgs.), The Wetlands Handbook, 2009). (p. 249-265). Wiley-Blackwell. [CrossRef]
- Souza, A.V.V. Avaliação da influência dos usos e ocupação do solo na qualidade da água do rio Vermelho no sudeste de Mato Grosso. Dissertação, 2015, Programa de Pós-Graduação em Geografia. Universidade Federal de Mato Grosso. Rondonópolis,p. 82.
- CETESB, Environmental Sanitation Technology Company Relatório de qualidade das águas interiores do Estado de São Paulo. São Paulo, Brazil. 2008. Available online: http://cetesb.sp.gov.br/aguas-interiores/wpcontent/uploads/sites/12/2013/11/relatorio_2008.zip (accessed on 28 March 2024).
- Lima, A. F. Dinâmica da qualidade da água na bacia Paraguai/Diamantino - Mato Grosso. 2017. Dissertação Mestrado (Ambiente e Sistema de Produção Agrícola), Universidade Estadual do Mato Grosso, Tangará da Serra-MT, pp: 51.
- Santos, J. P. dos. Influências da composição e estrutura da paisagem sobre a qualidade da água em múltiplas extensões espaciais na unidade hidrológica do Rio Doce em Minas Gerais. Dissertação de Mestrado 2020, Brasil. Available online: https://repositorio.ufmg.br/handle/1843/36487 (accessed on 28 March 2024).
- Chen, D., Elhadj, A., Xu, H., Xu, X., Qiao, Z. A Study on the Relationship between Land Use Change and Water Quality of the Mitidja Watershed in Algeria Based on GIS and RS. Sustainability 2020, 12, 3510. [CrossRef]
- Ullah, K., Jiang, J., Wang, P. Land use impacts on surface water quality by statistical approaches. Global Journal of Environmental Science and Management 2018, 4. [CrossRef]
- Padovani, C.R. Dinâmica espaço-temporal das inundações do pantanal. Tese de Doutorado, 2010. Ecologia de Agroecossistemas, Universidade de São Paulo, Piracicaba, Brasil. [CrossRef]
- Yu, X., Hawley-Howard, J., Pitt, A.L., Wang, J.-J., Baldwin, R.F., Chow, A.T. Water quality of small seasonal wetlands in the Piedmont ecoregion, South Carolina, USA: Effects of land use and hydrological connectivity. Water Research 2015, 73, 98–108. [CrossRef]
- Knox, A.K., Dahlgren, R.A., Tate, K.W., Atwill, E.R. Efficacy of Natural Wetlands to Retain Nutrient, Sediment and Microbial Pollutants. Journal of Environmental Quality 2008, 37, 1837–1846. [CrossRef] [PubMed]
- Wilcock, R.J., Müller, K., van Assema, G.B., Bellingham, M.A., Ovenden, R. Attenuation of Nitrogen, Phosphorus and E. coli Inputs from Pasture Runoff to Surface Waters by a Farm Wetland: The Importance of Wetland Shape and Residence Time. Water, Air, & Soil Pollution 2012, 223, 499–509. [CrossRef]
- Calheiros, D.F., Ferreira, C.J.A. alterações limnológicas no rio paraguai ("dequada") e o fenômeno natural de mortandade de peixes no Pantanal Mato-Grossense. MS. Corumbá. MS: EMBRAPA-CPAP, 1996. 51p. (EMBRAPA-CPAP. Boletim de Pesquisa, 7).
- Jeng, H., Hong, Y.-J. Assessment of a Natural Wetland for use in Wastewater Remediation. Environmental Monitoring and Assessment 2005, 111, 113–131. [CrossRef] [PubMed]
- Silva, P.L., Muniz, C. C., Rieder, A., & Carvalho, A. M. Variação da concentração dos teores de oxigênio dissolvido na água na baia negra e salobra, Rio Paraguai, Cáceres, Alto Pantanal, Mato Grosso, Brasil. 2004. Available online: https://www.cpap.embrapa.br/agencia/simpan/sumario/resumos/asperctos/pdf/abiotico/102AB-Correlacao%20baias%20odPLS1-OK.PDF (accessed on 28 March 2024).
- Menezes Junior, M.Q. de M., Junior, E.S.O., Souza, C.A. de. The "decoada" phenomenon effect on the Paraguay river water quality, Northern Pantanal. Revista Ibero-Americana de Ciências Ambientais 2020, 11, 5. [CrossRef]
- Oliveira M.D. de, Calheiros D.F., Padovani C.R. Mapeamento e descrição das áreas de ocorrência dos eventos de decoada no Pantanal. Embrapa Pantanal, Corumbá. Boletim de Pesquisa e Desenvolvimento, 121, 2013. Available online: https://ainfo.cnptia.embrapa.br/digital/bitstream/item/83348/1/BP121.pdf (accessed on 28 March 2024).
- Uuemaa, E., Palliser, C., Hughes, A., Tanner, C. Effectiveness of a Natural Headwater Wetland for Reducing Agricultural Nitrogen Loads. Water 2018, 10, 287. [CrossRef]
- White, J.R., Reddy, K.R. Biogeochemical Dynamics I: Nitrogen Cycling in Wetlands. Em E. Maltby & T. Barker (Edt.), The Wetlands Handbook. 2009, p. 213-227. Wiley-Blackwell. [CrossRef]
- Fisher, J., Stratford, C.J., Buckton, S. Variation in nutrient removal in three wetland blocks in relation to vegetation composition, inflow nutrient concentration and hydraulic loading. Ecological Engineering 2009, 35, 1387–1394. [CrossRef]
- Walton, C.R., Zak, D., Audet, J., Petersen, R.J., Lange, J., Oehmke, C., Wichtmann W., Kreyling J., Grygoruk M., Jaboska E., Kotowski W., Winiewska M.M., Ziegler R., .Hoffmann, C. C. Wetland buffer zones for nitrogen and phosphorus retention: Impacts of soil type, hydrology and vegetation. Science of the Total Environment 2020, 727, 138709.
- Gericke, A., Nguyen, H.H., Fischer, P., Kail, J., Venohr, M. Deriving a bayesian network to assess the retention efficacy of riparian buffer zones. Water 2020, 12, 617. [CrossRef]
- Reddy, K.R., Kadlec, R.H., Flaig, E., Gale, P.M. Phosphorus Retention in Streams and Wetlands: A Review. Critical Reviews in Environmental Science and Technology 1999, 29, 83–146. [CrossRef]
- Marois, D.E., Mitsch, W.J., Song, K., Miao, S., Zhang, L., Nguyen, C. T. Estimating the importance of aquatic primary productivity for phosphorus retention in Florida Everglades mesocosms. Wetlands 2015, 35, 357–368. [CrossRef]
- Neves, A., Santos, F. Nem tudo são flores no Pantanal. Ciência Hoje 2008. 245, 71-73. Available online: https://www2.ib.unicamp.br/profs/fsantos/refer/CH-2008-41-245-71.pdf (accessed on 28 March 2024).
- Dodds, W.K. The role of periphyton in phosphorus retention in shallow freshwater aquatic systems. Journal of Phycology 2003, 39, 840–849. [Google Scholar] [CrossRef]
- Richardson, C.J., Vaithiyanathan, P. Biogeochemical Dynamics II: Cycling and Storage of Phosphorus in Wetlands. E. Maltby and T. Barker (Edt.), The Wetlands Handbook, 2009. (p. 228-248). Wiley-Blackwell. [CrossRef]
- Chang, H., Makido, Y., Foster, E. Effects of land use change, wetland fragmentation, and best management practices on total suspended solids concentrations in an urbanizing Oregon watershed, USA. Journal of Environmental Management 2021, 282, 111962. [CrossRef] [PubMed]
- Juneau Watershed Partnership. Final Report Duck Creek Nancy Street Wetland Water Quality Assessment 2018. https://dec.alaska.gov/media/17146/2018-duck-creek-nancy-st-wetland-assessment.
- Reddy, K.R., Wetzel, R.G., Kadlec, R.H. Biogeochemistry of Phosphorus in Wetlands. Em Phosphorus: Agriculture and the Environment 2005. (p. 263-316). John Wiley & Sons, Ltd. [CrossRef]
- Schmutz, S., Moog, O. Dams: Ecological Impacts and Management. Em S. Schmutz & J. Sendzimir (Edt), Riverine Ecosystem Management: Science for Governing Towards a Sustainable Future, 2018. (p. 111-127). Springer International Publishing. [CrossRef]
- Sánchez-Carrillo, S., Álvarez-Cobelas, M., Angeler, D.G. Sedimentation in the semi-arid freshwater wetland las tablas de Daimiel (Spain). Wetlands 2001, 21, 112–124. [CrossRef]
- Madsen, J.D., Chambers, P.A., James, W.F., Koch, E.W., Westlake, D.F. The interaction between water movement, sediment dynamics and submersed macrophytes. Hydrobiologia 2001, 444, 71–84. [CrossRef]
- Crossetti, L.O., Cardoso, L. de S., Callegaro, V.L.M., Silva, S.M.A. da, Werner, V.R., Rosa, Z. M., Marques, D.M.L. da M. Influence of the hydrological changes on the phytoplantkton structure and dynamics in a subtropical wetland-lake system. 2007. Acta limnologica brasiliensia. São Paulo, SP. Vol. 19, n.3, p.315-329. https://lume.ufrgs.br/handle/10183/249605.
- Reid, R.J., Mosley, L.M. Comparative contributions of solution geochemistry, microbial metabolism and aquatic photosynthesis to the development of high pH in ephemeral wetlands in South East Australia. Science of The Total Environment 2016, 542, 334–343. [CrossRef]
- Gitau, J.K. Effectiveness of natural wetland in waste water treatment: A case study of tibia wetland, Limuru Municipality, Kenya. 2014. https://ir-library.ku.ac.ke/handle/123456789/12070.
| Parameter | Unit | Analytical Method | Class 2 Limit Value |
|---|---|---|---|
| pH | - | 4500–H [15] | 6-9 |
| Dissolved Oxygen (DO) | mg/L | ASTM D888-12 [16] | >5.0 |
| Biochemical Oxygen Demand (5-day BOD Test) | mg/L | 5210-D [15] | ≤5.0 |
| Fecal coliforms | MPN. 100 m/L | 9221–E [15] | ≤200 |
| Total Nitrogen (TN) | mg/L | NBR 13796 [17] | - |
| Total Phosphorus (TP) | mg/L | 4500 P–B, E [15] | ≤0.1 |
| Total Solids (TS) | mg/L | 2540 – C [15] | - |
| Turbidity (Tu) | NTU | 2130-B [15] | ≤100 |
| Water Quality Index (WQI) | - | Calculated | - |
| Position | Station code [19] | Name (Influence Areas) | River |
|---|---|---|---|
| Start | 00MS23AQ2284 | IA07 | Aquidauana |
| Start | 00MS23MI1292 | IA14 | Miranda |
| Intermediate | 00MS23AQ2000 | IA15 | Aquidauana |
| Intermediate | 00MS23MI2147 | IA16 | Miranda |
| Mouth | 00MS23MI2000 | IA17 | Mouth of Miranda |
Disclaimer/Publisher’s Note: The statements, opinions and data contained in all publications are solely those of the individual author(s) and contributor(s) and not of MDPI and/or the editor(s). MDPI and/or the editor(s) disclaim responsibility for any injury to people or property resulting from any ideas, methods, instructions or products referred to in the content. |
© 2024 by the authors. Licensee MDPI, Basel, Switzerland. This article is an open access article distributed under the terms and conditions of the Creative Commons Attribution (CC BY) license (http://creativecommons.org/licenses/by/4.0/).


