Preprint
Article

Discussion and Analysis of the Core Structure of the Internet

Altmetrics

Downloads

98

Views

43

Comments

0

This version is not peer-reviewed

Submitted:

14 May 2024

Posted:

14 May 2024

You are already at the latest version

Alerts
Abstract
The Internet's core network, crucial for key services, lacks a clear definition, hindering Internet development and security research. This study analyzes important Autonomous Systems (ASes) and proposes a rule-filtering, top-down method to infer the Internet's core network. It identifies two core memberships: Tier-1 ASes and Regional Tier-1 ASes. Despite a gap, Regional Tier-1 ASes show potential to join the core. Our proposed core structure, unlike traditional methods that randomly select TOP-K nodes, offers improved rationality and interpretability. Historical data analysis reveals the Internet's core structure as a tightly interconnected network of large provider ASes. Despite some changes, this structure shows remarkable stability and growing influence, potentially encouraging other ASes to establish direct connections with the core ASes, accelerating the trend towards a flattened Internet structure. Furthermore, the core structure may be evolving from a majority to a more minority-centric structure.
Keywords: 
Subject: Computer Science and Mathematics  -   Computer Science

1. Introduction

The Internet, an indispensable communication medium for humanity, is composed of tens of thousands of Autonomous Systems (ASes), each possessing a globally unique identifier (ASN) [1]. Although the Internet is characterized by a dynamic and time-varying nature, unlike other complex networks, many of its critical services are heavily reliant on a few significant provider ASes. In light of the Internet’s scale-free nature, malicious entities are predisposed to target key nodes to amplify the reach and destructive potential of their attacks [2]. Consequently, comprehending the topology and business relationships among the core ASes in the Internet is of paramount importance. This understanding aids in enhancing network protocols, optimizing network performance, fortifying defenses against security threats, and exploring pertinent issues such as evolutionary patterns [3,4,5].
To date, an explicit methodology for identifying the Internet’s core networks remains undeveloped [6]. The prevailing approach to discerning the core nodes of complex networks involves the use of importance metrics, with the network composed of the TOP-K nodes typically considered as the core network [7,8,9,10,11,12,13]. However, this top-k node-based core network construction scheme is ill-suited for the Internet due to its unique characteristics that starkly differentiate it from other complex networks. For instance, an Autonomous System (AS) in the Internet possesses the flexibility to establish its own routing policy. Furthermore, the empirically set k-value lacks interpretability and can easily lead to misrepresentations of the Internet’s population characteristics and evolutionary laws if it is excessively large or small. Therefore, a more nuanced approach is required for accurately identifying and understanding the core networks of the Internet.
Classic Internet hierarchy model has categorized the Internet into Tier-1 AS, Tier-2 AS, Tier-3 AS, and end-customer AS (Stub AS), concluding that Tier-1 AS represents the core AS [14]. However, it has been noted that there exists a class of networks between Tier-1 and Tier-2 AS that also serve as core AS for the Internet [6]. These networks are typically managed by national monopoly telecommunications companies and exhibit most of the classical behaviors and motivations of Tier-1 AS within specific geographic regions. As such, they are referred to as Regional Tier-1 AS. However, people have not verified the backbone network characteristics of the Regional Tier-1 AS, nor have they clearly pointed out its defined boundaries. People only know the primary distinction between Regional Tier-1 AS and Tier-1 AS is that while Regional Tier-1 AS cannot interconnect without settlement on a global scale, Tier-1 AS can.
In this study, our objective is to delineate the boundaries of core autonomous systems by extracting the unique attributes that core ASes should possess from a list of acknowledged important ASes. Initially, we engage in a discourse on the potential of Regional Tier-1 ASes to become the core of the Internet. The potential of a Regional Tier-1 AS as an Internet core is discerned by comparing Regional Tier-1 ASes with Tier-1 ASes in terms of accessible ASes (termed as “routing view”), AS rankings, the quality and quantity of peripheral ASes, and primary business operations. Subsequently, we introduce a top-down, rule-filtering-based algorithm for inferring the Internet’s core. In contrast to traditional methods that determine the network core based on TOP-K nodes, our algorithm offers enhanced interpretability and reasonableness. Finally, we generate a list of core autonomous systems for the past decade using the inference algorithm. We utilize this decade-long list of Internet’s core ASes as a foundation for examining the evolutionary patterns of the Internet during this period. This analysis yields intriguing conclusions that have hitherto been overlooked:
  • A historical analysis spanning a decade reveals that the core network of the Internet exhibits relative stability. Within this core network, the interconnectivity between nodes is on an upward trend. This pattern suggests an expanding influence of the core network on the overall structure of the Internet, potentially accelerating the trajectory towards a flattened Internet topology.
  • The significance of core ASes is also dynamically evolving. The phenomenon wherein the importance of a handful of core ASes increases while that of most core ASes remains unchanged may indicate a transition in the core structure of the Internet towards fewer core nodes.
  • The United States, owning nearly half of the world’s core ASes, holds a dominant position in the Internet landscape. Conversely, Asian countries have seen a consistent rise in their proportion of core ASes ownership in recent years.
  • In terms of importance, Tier-1 ASes maintain a clear advantage over Regional Tier-1 ASes. Tier-1 ASes are more likely to provide a comprehensive view of routing, and their peripheral networks are more likely to encompass larger-scale networks. Simultaneously, a Tier-1 AS’s primary routing view predominantly originates from its peer AS, which markedly differs from most Regional Tier-1 ASes that rely on customer-provided routing views.

2. Background and Theoretical Framework

2.1. Background

The exponential growth of the Internet has catalyzed profound transformations within human society. As investigations into its intricacies progress, an increasing number of underlying principles are being revealed. The hierarchical structure is a fundamental characteristic of the Internet. Zegura et al. first proposed an intuitive understanding of this hierarchy by dividing the Internet into two domains: Stub and Transit [15]. Subsequently, Ravasz et al. introduced the concept of hierarchical modularity in complex networks after studying the hierarchical organization of the Internet [16]. Zhang et al. built a hierarchical model based on the relationship between node degree and core network [17]. The examination of the hierarchical organization of the Internet facilitates a more precise and comprehensive understanding of its developmental patterns. This, in turn, provides a reliable foundation for formulating recommendations for the Internet’s continued growth and evolution.
The traditional hierarchical structure of the Internet is undergoing a transformation as the connectivity relationships between ASes become increasingly intricate, and a trend towards a flattened AS network structure intensifies [18]. A growing number of ASes are forging direct connections with large content providers such as Google, Amazon, and Microsoft to streamline the traffic delivery path [19]. Internet Service Providers (ISPs) and Internet Content Providers (ICPs) are becoming more closely integrated with the Internet’s core nodes [3]. The power-law characteristic of the Internet enhances the efficiency of content delivery and path redundancy [4]. These developments contribute to the obfuscation of the Internet’s hierarchical structure, rendering traditional methods of analyzing the Internet’s evolutionary patterns based on this structure increasingly obsolete. Recent studies have demonstrated that AS-level networks expand linearly, accompanied by a rise in network density and distributional inhomogeneity. However, the average network diameter and path length of the Internet remain stable [20,21]. This stability underscores the continued significance of the Internet’s core network. Consequently, monitoring and tracking changes in the Internet based on the core AS of the Internet is gaining increasing importance.
In response, an increasing number of scholars have begun to analyze the development trend and evolution law of the Internet by monitoring its core. For instance, Masoud et al. applied graph theory and centrality metrics to quantify the core of AS and analyze Internet flattening [22]. Accongiagioco et al. found, through a fine-grained analysis of topological data, that the large-scale Internet can be decomposed into smaller core and peripheral networks, and suggested that changes in the core part of the Internet can reveal its most important structural properties [23]. Ting et al. reported that despite the gradual flattening of Internet architecture, core autonomous systems remain indispensable [5]. However, due to a lack of consensus on how to define and measure core autonomous systems, there is no authoritative certification for the core network of the Internet.

2.2. Theoretical Framework

In this subsection, we initially introduce the pertinent data utilized in our study. Subsequently, we provide a comprehensive description of the metrics employed to evaluate the topology of the Internet.

2.2.1. Data Source

RIPE RIS and RouteViews, two of the world’s largest purveyors of publicly accessible historical BGP data, aim to amass BGP updates via BGP data collectors deployed globally, thereby facilitating free usage by researchers [24,25]. For our study, we procured historical BGP data from RIPE RIS and RouteViews spanning January 2012 to December 2022. From the amassed BGP update files, we extracted AS paths and eliminated BGP update information containing private ASNs, private IPs, path loops, and compressed path padding. An example of such compression is the conversion of the AS path “ABBC” to “ABC”. To mitigate the volume of data requiring processing, we opted to download the BGP data at five-day intervals.
The data pertaining to the AS relationship is crucial in identifying core ASes. In the realm of business relationships between ASes, there exist three distinct types: Provider-Customer (P2C), Peer-to-Peer (P2P), and Sibling (S2S). However, due to the fact that operators do not publicly disclose their business relationships with other ASes, this data must be inferred from publicly available information [26,27,28,29]. The Cooperative Association for Internet Data Analysis (CAIDA) has made significant strides in this area, providing a range of solutions to the problem of inferring AS relationships and offering historical relationship datasets [26,27]. In our research, we utilized CAIDA’s AS relationship dataset as a foundation [30]. and supplemented it with data directly reported by some Internet Service Providers (ISPs) and Internet Exchange Point (IXP) data reported by PeeringDB [31]. This allowed us to refine the accuracy of CAIDA’s AS relationship data. In 2022, we were able to obtain public data on a total of 74,458 ASes, including 48,473 AS-IX data points collected. This covered 281,130 P2P relationships.
Finally, we obtained a list of important AS based on multiple data sources. While there has been some debate regarding the specific constituent members of core ASes, there are several important ASes that are universally recognized within the Internet community [30,32,33]. These include Tier-1 ASes and major ASes of regional monopoly operators. By carefully selecting important ASes from multiple data sources based on these two characteristics, we got 15 Tier-1 ASes and 9 major ASes of regional monopoly operators. We refer to the primary ASes of regional monopoly operators as Region Tier-1 ASes. We were able to gain valuable insights into the potential topological characteristics of these systems based on these lists.

2.2.2. Neighbor Degree, Transit Degree and Transmission Ratio

Neighbor Degree is a parsimonious measure of node importance in complex networks, which measures network density. It represents the number of neighbors directly connected to a given node, which is denoted by k. Transit Degree refers to the number of unique neighbors on either side of a node. It reflects network density when a node serves as a transmission point and is denoted by t. Neighbor Degree and Transit Degree are distinct concepts with subtle differences. To distinguish between Transit Degree and Neighbor Degree, we define the Transmission Ratio T as T = t k . In the context of internet connectivity, the Transmission Ratio serves as a key metric in determining the significance of an autonomous system in relation to its neighboring AS. This ratio reflects the probability of traffic transmission services provided by one AS to another. A higher Transmission Ratio indicates a greater proportion of traffic transmission services being provided by the AS to its neighboring AS, thereby highlighting its importance within the neighborhood network.

2.2.3. ASRank

ASRank is CAIDA’s ranking of Autonomous Systems (AS) (which approximately map to Internet Service Providers) and organizations (Orgs) (which are a collection of one or more ASes) [34]. This ranking is derived from topological data collected by CAIDA’s Archipelago Measurement Infrastructure and Border Gateway Protocol (BGP) routing data collected by the Route Views Project and RIPE NCC. ASes and Orgs are ranked by their customer cone size, which is the number of their direct and indirect customers.

2.2.4. Clustering Coefficient and Rich-Club Coefficient

The clustering coefficient is an indicator that reflects the degree of network clustering and describes the closeness between neighboring nodes. For node v i with a neighbor degree of k i , it has k i neighbors and there can be at most k i ( k i 1 ) 2 edges between these k i neighbors. The clustering coefficient for node v i is defined as the ratio of the actual number of edges E i between its k i neighbors to the maximum possible number of edges: C i = 2 E i k i ( k i 1 ) .
The Rich-Club phenomenon describes the observation that networks composed of nodes with high Neighbor Degree exhibit greater edge density compared to networks composed of nodes with low Neighbor Degrees. The Rich-club coefficient quantifies the connection density between high-degree nodes in a network. All nodes in the network are arranged in descending order of Transit Degree to form set S r , which represents the top r ranked nodes. The Rich-club coefficient φ is defined as the ratio of the actual number of connections E r between the top r nodes to the maximum possible number of connections: φ = 2 E r S r ( S r 1 ) .

2.2.5. Direct Ratio and P2P Ratio

Tier-1 ASes form a fully interconnected network at the top layer of the Internet and can access all global networks for free traffic billing fees. In contrast, other ASes are unable to access all international networks solely through peer-to-peer relationships (P2P). Therefore, we investigate the connectivity structure between these two types of ASes and define a metric called Direct Ratio ( R T 1 ), which represents the proportion of direct connections between Non-Tier-1 ASes and all Tier-1 ASes. R T 1 = E d N T 1 , in this context, E d represents the number of edges directly connecting to Tier-1 AS, N T 1 refers to the total number of Tier-1 AS.
Additionally, we consider commercial relationships between Non-Tier-1 AS and Tier-1 AS. We define P2P Ratio ( R P ) to indicate the proportion of peer-to-peer (P2P) edges between an AS and all Tier-1 ASes. P2P Ratio R P are expressed as shown below: R P = E P 2 P E d . Where E d represents the number of edges directly connecting to Tier-1 AS, E P 2 P denotes the number of edges that have P2P relationships.

3. Methodology

3.1. Discussion of Core AS

The manuscript commences with an exploration of the pivotal query, “Who constitutes the nucleus of the Internet?”. To ascertain whether Regional Tier-1 ASes possess the potential to evolve into the Internet’s core, we undertake an analysis of a collection of ASes that are widely acknowledged for their significance. A comparative study is conducted between Regional Tier-1 AS and Tier-1 AS, utilizing a comprehensive dataset to highlight their similarities and disparities. The objective of this comparison is to determine if a Regional Tier-1 AS can be classified as a central node within the Internet’s structure.
Initially, we aim to establish a routing perspective of the autonomous system. Theoretically, an AS’s importance is directly proportional to the comprehensiveness of its routing view. However, due to limitations imposed by routing information collection points, acquiring a genuine routing view of each AS is unfeasible. Consequently, we adopt the ratio of the number of ASes accessible by an autonomous system based on AS Path to all visible ASes as a proxy for that AS’s routing view. Despite this definition’s lack of rigor, it enables us to evaluate the capacity of an AS to access a multitude of networks in its entirety, thereby reflecting its significance as a hub node. Simultaneously, we calculate the Clustering Coefficient for the focal AS, a metric employed to gauge the closeness of the network formed by the AS and its neighboring nodes.
Figure 1 presents the routing view of the focal ASes along with their Clustering Coefficients. In Figure 1a, the focal ASes are ranked based on ASRank [34]. The ASes are arranged from left to right, with AS3356 to AS6830 representing Tier-1 ASes, while the remaining ASes are classified as Regional Tier-1 ASes. We employ the designations “1” and “2” to denote Tier-1 ASes and Regional Tier-1 ASes, respectively. It should be noted that these designations are not utilized in Figure 1b.
As depicted in Figure 1a, our findings reveal that a majority of the focal ASes offer a broad spectrum of routing views. Specifically, 50% of the focal ASes furnish more than 50% of routing views, while 75% of the ASes supply over 10% of routing views. Remarkably, certain ASes, such as AS3356 and AS1299, provide in excess of 98% of routing views. Even within the subset of Regional Tier-1 ASes, typically deemed less significant, two ASes deliver more than 80% of routing views. Collectively, these results demonstrate a positive correlation between an AS’s importance and the breadth of routing views it can offer. This implies that Regional Tier-1 ASes possess the potential to serve as core networks, albeit Tier-1 ASes exhibit a greater propensity to provide routing views in comparison to Regional Tier-1 ASes.
However, our study also uncovered that the routing views of certain focus ASes, such as AS4809, AS2828, and AS4134, are notably limited, providing less than 5% of routing views. This phenomenon could be attributed to a couple of factors. On one hand, it may be due to the incompleteness of the routing data we collected, which fails to accurately represent the number of accessible ASes for these particular ASes. On the other hand, it is also plausible that some of the Regional Tier-1 ASes included in our dataset may lack the potential to evolve into core networks.
In Figure 1b, we unexpectedly discover a negative correlation between the closeness of the network formed by an AS with its neighbors and the number of its neighbors. It is important to note that the order of ASes in Figure 1b is not preserved. Conventionally, it is postulated that a node’s importance within a network increases with its Transit Degree, and the network formed by its neighboring nodes may exhibit tighter connections. However, as the Transit Degree of an AS escalates, the density of its neighboring network progressively diminishes. This suggests that an increase in an AS’s Transit Degree also amplifies the likelihood of its neighboring network incorporating small-scale ASes. The interconnection probability among small-scale ASes is low, resulting in a decrease in the Clustering Coefficient for ASes with large transit degrees.
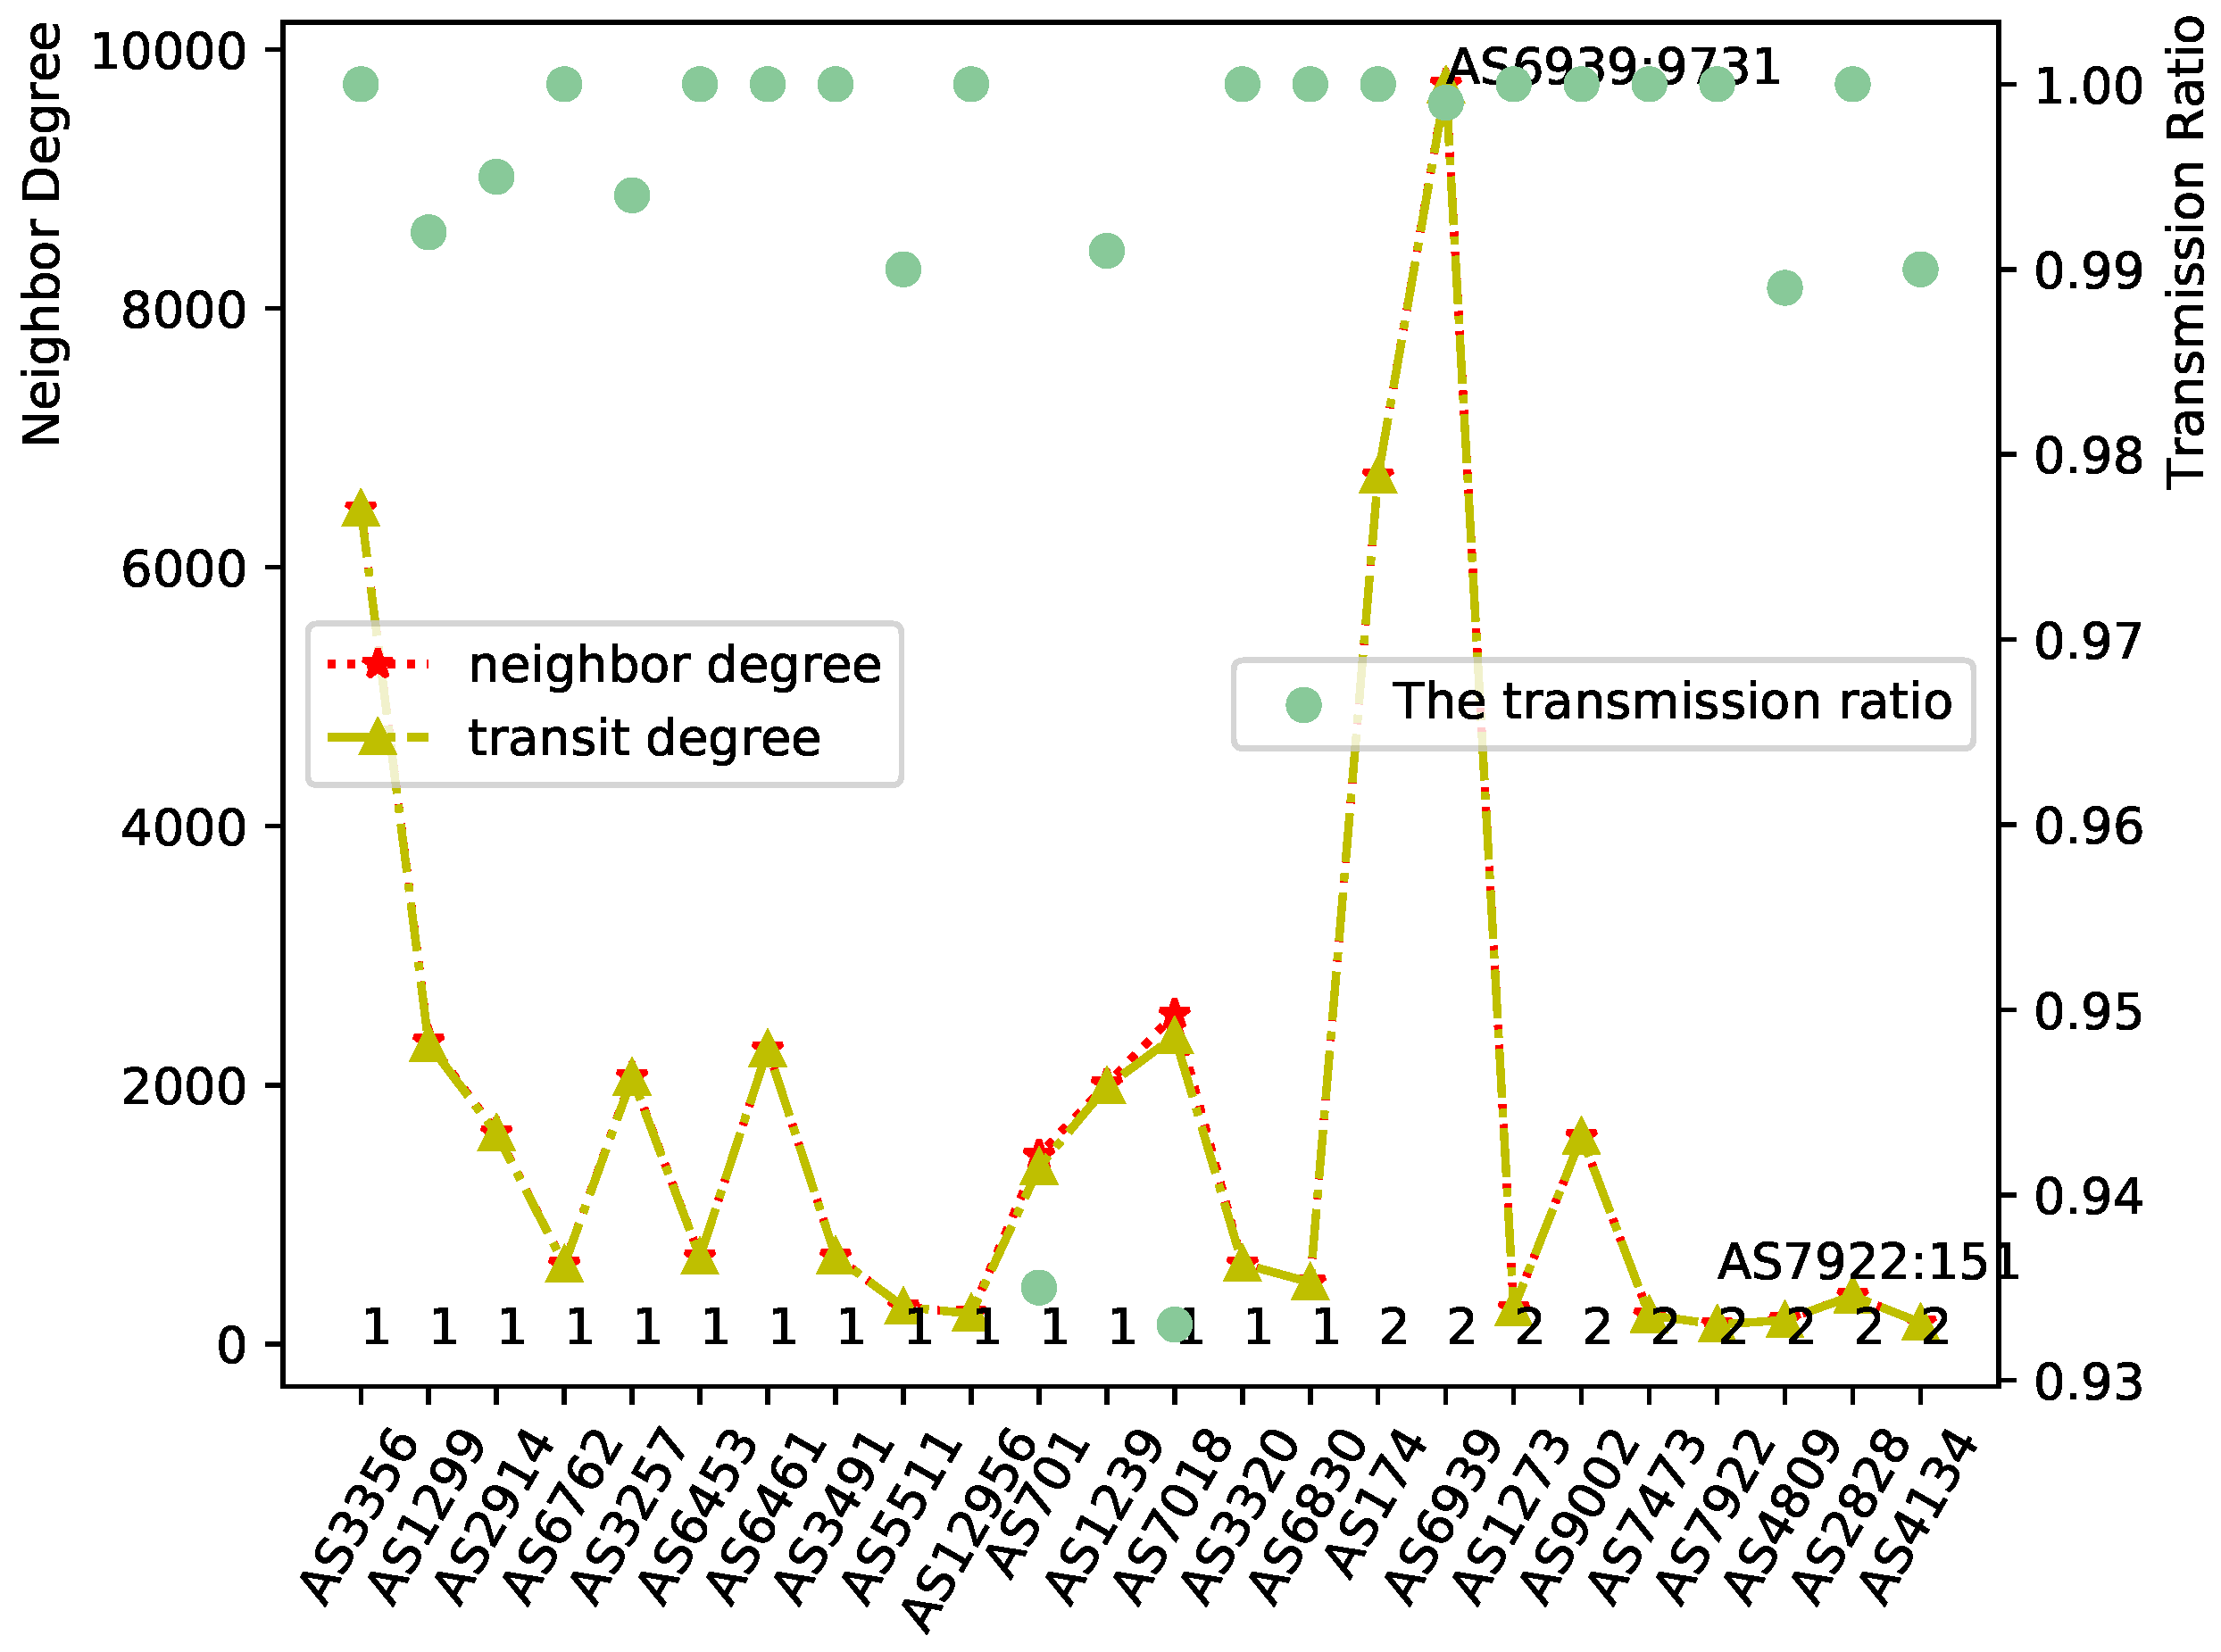
An abundance of neighboring ASes results in a more loosely connected peripheral network for an AS, suggesting that the number of neighboring ASes can influence an AS’s routing view to a certain degree, but does not directly dictate its importance. Figure 2 provides a statistical diagram illustrating the Neighbor Degree, Transit Degree, and Transmission Ratio of the significant ASes we have collected. Interestingly, we observe that the AS with the highest Transit Degree is not AS 3356, which holds the top position in the ASRank, but rather Regional Tier-1 AS 6939. Furthermore, several Tier-1 ASes exhibit a Transit Degree that is smaller than some Regional Tier-1 ASes. This serves as compelling evidence that a larger Transit Degree for an AS does not necessarily equate to greater importance.
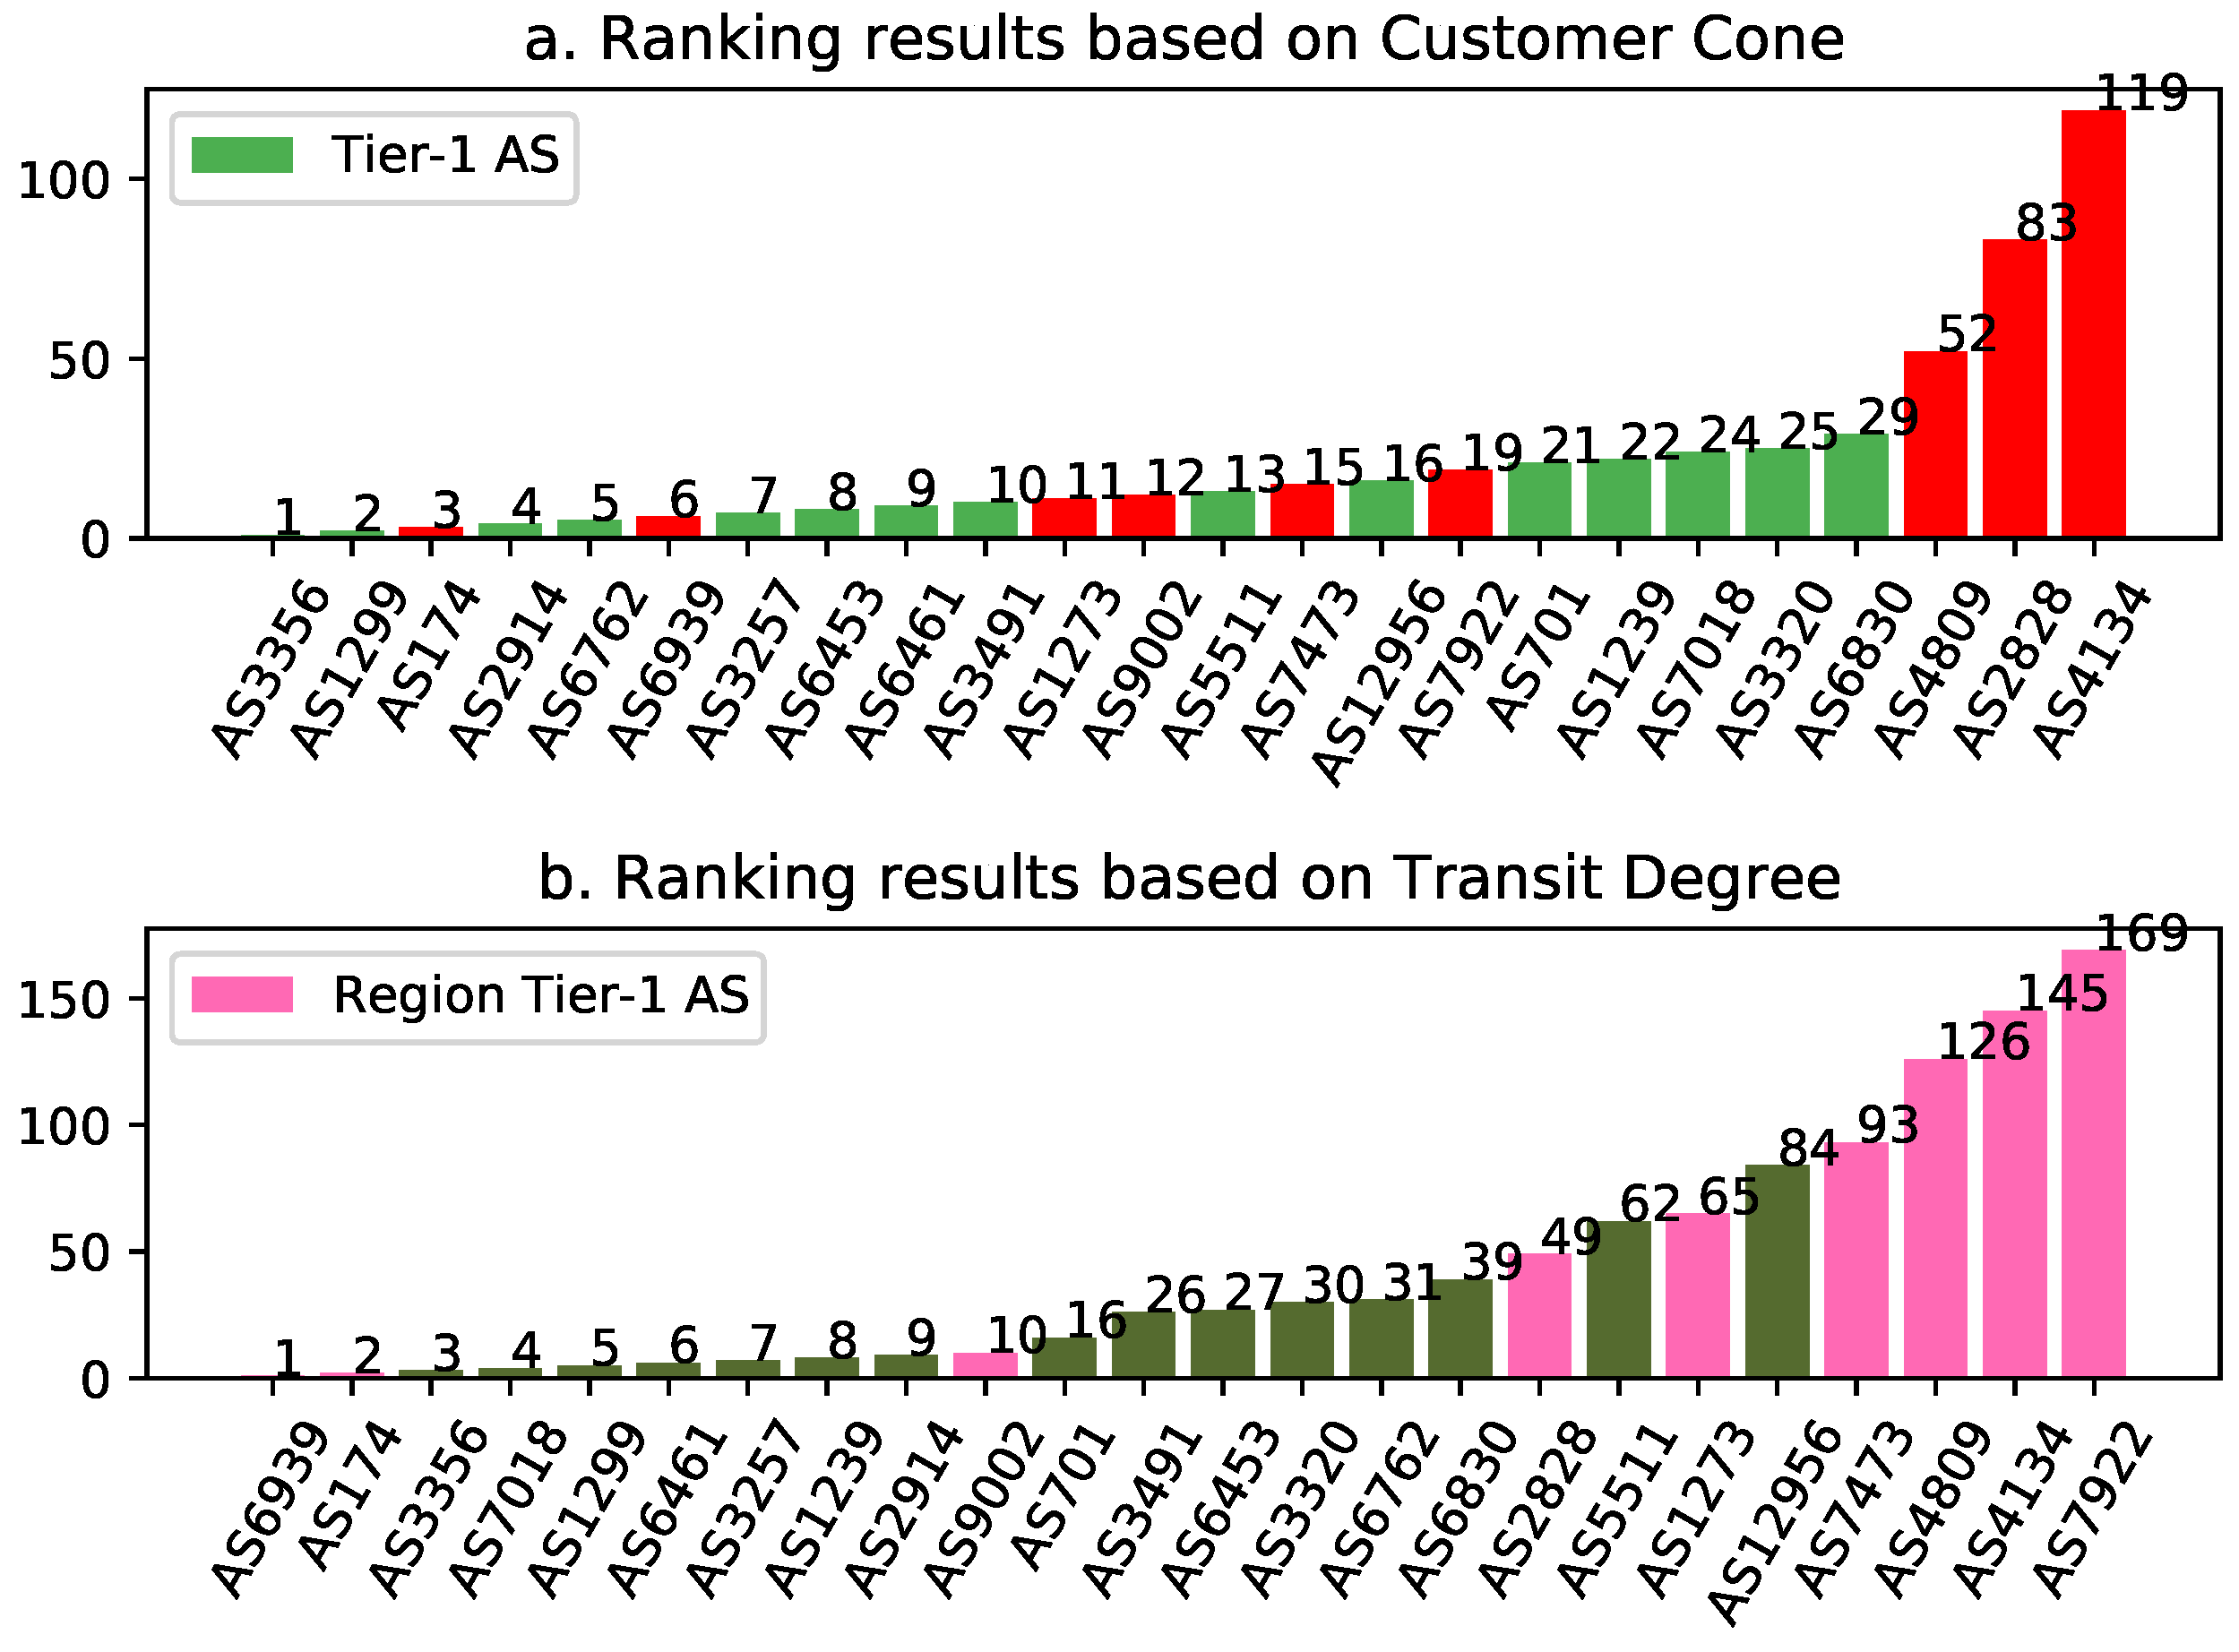
We further employed a Transit Degree-based AS ranking method and a Customer Cone-based AS ranking method (ASRank) to rank the significant ASes we collected, with the results depicted in Figure 3. Our findings indicate that the Customer Cone-based ranking method more accurately reflects the importance of ASes compared to the Transit Degree-based ranking method. Specifically, ASRank assigns higher ranks to Tier-1 ASes and the range of rankings for Regional Tier-1 AS pairs is more concentrated. These observations suggest that ASRank, which ranks based on AS relationships, is more suited to the structure of the Internet than the Transit Degree-based ranking method, which relies solely on graph structure. In Figure 3, Tier-1 ASes are typically ranked higher than Regional Tier-1 ASes. However, in certain instances, some Regional Tier-1 ASes are ranked higher and all focal ASes are ranked within the top 200 results. This further implies that some non-Tier-1 ASes exert an influence comparable to that of Tier-1 ASes.
Figure 1b illustrates that the routing views, derived based on the number of neighboring ASes, are obtained at the cost of the compactness of the neighboring network. This observation prompts us to consider the quality of neighboring ASes in relation to routing views. If an AS possesses an extensive routing view but not a large number of neighbors, it suggests that its neighboring ASes furnish it with a substantial number of routing views, thereby qualifying as high-contributing neighboring ASes. We posit that ASes with a larger count of high-contributing ASes in their neighboring networks, which also boast extensive routing views, wield greater influence and occupy a more significant status within the Internet. This hypothesis is corroborated by Figure 4.
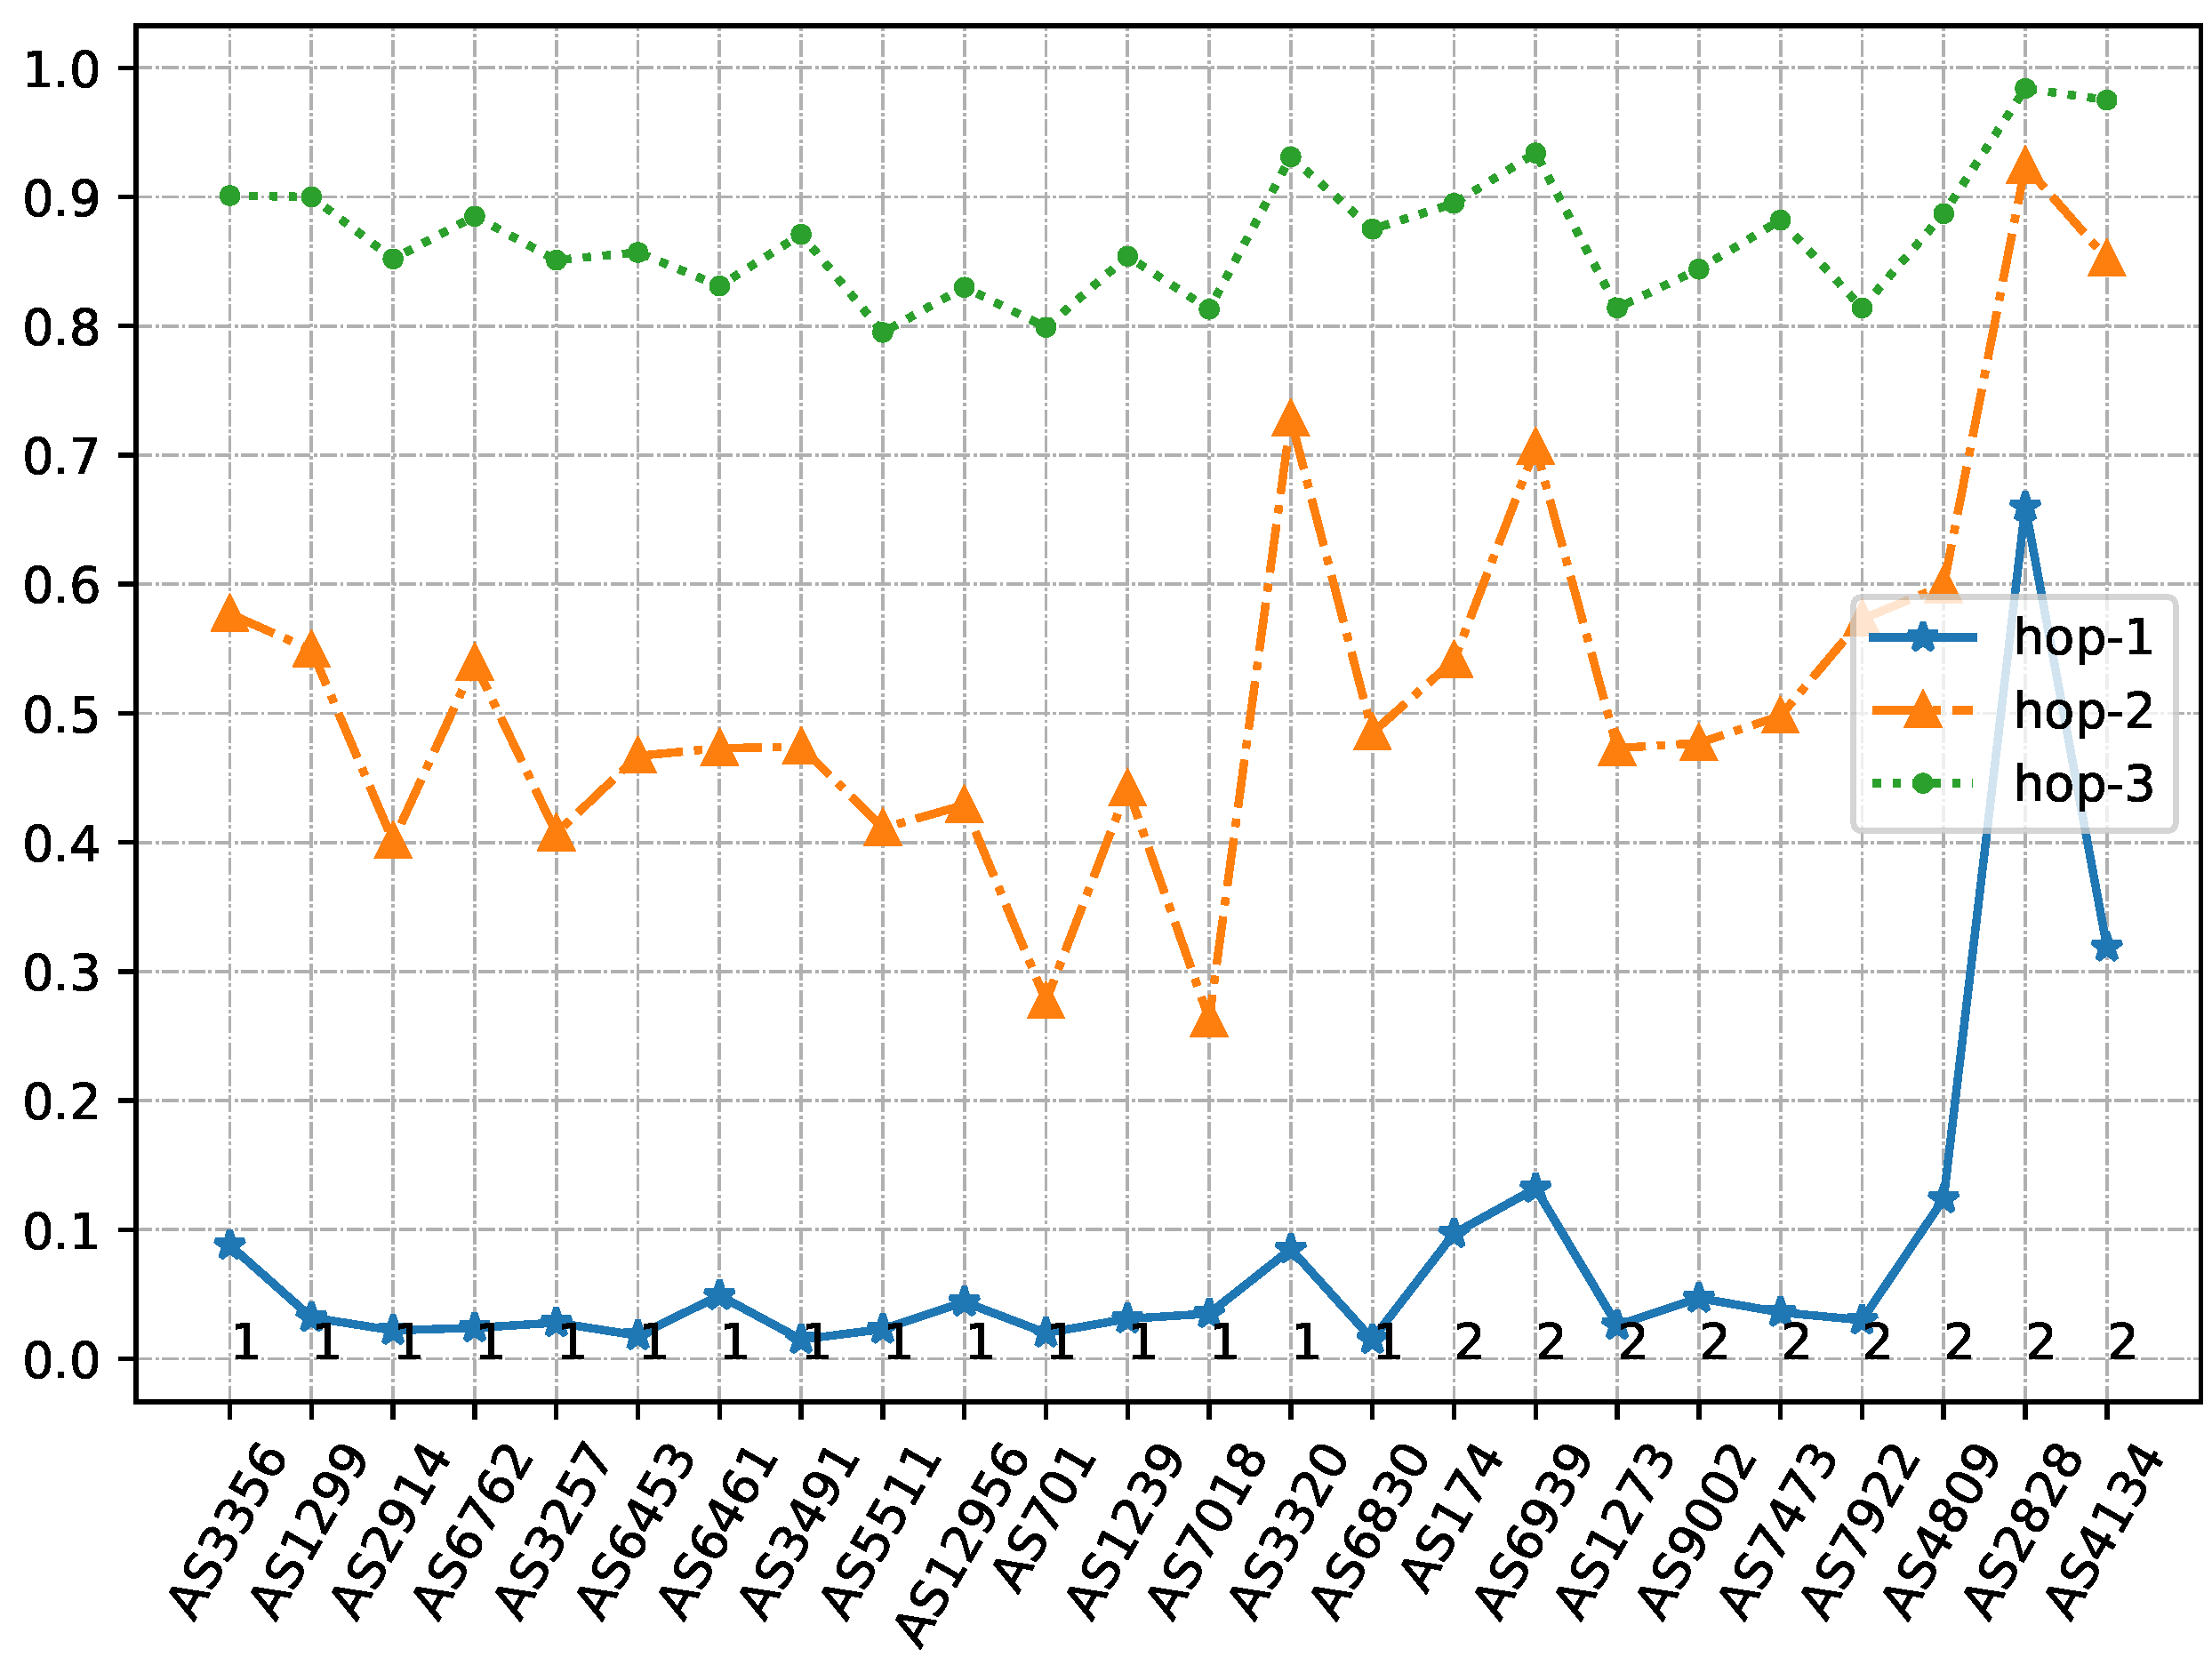
Figure 4 presents the distribution of neighboring nodes of significant ASes, plotted based on the number of routing hops. We quantify the proportion of high-contributing ASes among neighboring ASes by calculating the growth rate of the next-hop visible range. The next-hop visible range is defined as the ratio of the number of visible ASes obtained through the next hop to the total number of visible ASes. An increase in the next-hop visible range signifies a higher proportion of high-contributing ASes present in that hop AS. To this end, we introduce Hop-1, Hop-2, and Hop-3 indices to evaluate the ratio of the number of ASes accessible after one, two, and three hops, respectively, to the total number of accessible ASes. For a vast majority of ASes, 80% of the network can be accessed within three hops. Consequently, our primary focus is on the distribution of observable ASes within three hops of the neighborhood.
As observed in Figure 4, nearly all the focal ASes exhibit low HOP-1 indices, with the exception of AS2828 and AS4134. Over 90% of these focal ASes have HOP-1 indices below 15%. Despite this, all these ASes provide extensive routing views. This suggests that these focal ASes rely on a limited number of neighboring nodes to obtain comprehensive routing views, strongly indicating the presence of a large number of high-contributing ASes in their neighborhoods. As the importance of an AS diminishes, the HOP-1 index gradually increases while the obtained routing views progressively decrease. This observation supports our hypothesis that “ASes with more extensive routing views and a greater number of high-impact neighboring networks are more important ASes”. The majority of the focal ASes demonstrate similar HOP-1 index performance, implying that a substantial number of Regional Tier-1 ASes exert comparable influence in their neighboring networks as Tier-1 ASes.
While we have identified a prominent feature to gauge the importance of an AS, pinpointing high-contributing ASes remains a formidable challenge, given the absence of any related concepts in the existing literature. Tier-1 ASes, being the most crucial networks on the Internet and possessing the largest routing views, are quintessential high-contributing ASes. An analysis of the connectivity of other ASes to Tier-1 ASes can indirectly reflect the high-contributing neighboring ASes associated with that AS and also evaluate the influence of other ASes on the topmost AS. Consequently, we utilize the interconnections of Regional Tier-1 AS with Tier-1 AS to analyze the network influence of Regional Tier-1 AS.
A defining characteristic of Tier-1 ASes is their interconnectivity via Peer-to-Peer (P2P) links, coupled with their ability to access any other visible network free of traffic charges. This is a unique feature not possessed by any other AS. Consequently, it can be intuitively inferred that an AS’s importance escalates with an increase in the number of connected Tier-1 ASes, and the number of edges forming P2P links with Tier-1 ASes. Therefore, we employ the connection relationship between Regional Tier-1 AS and Tier-1 AS as a determinant of the potential of a Regional Tier-1 AS to evolve into a core AS.
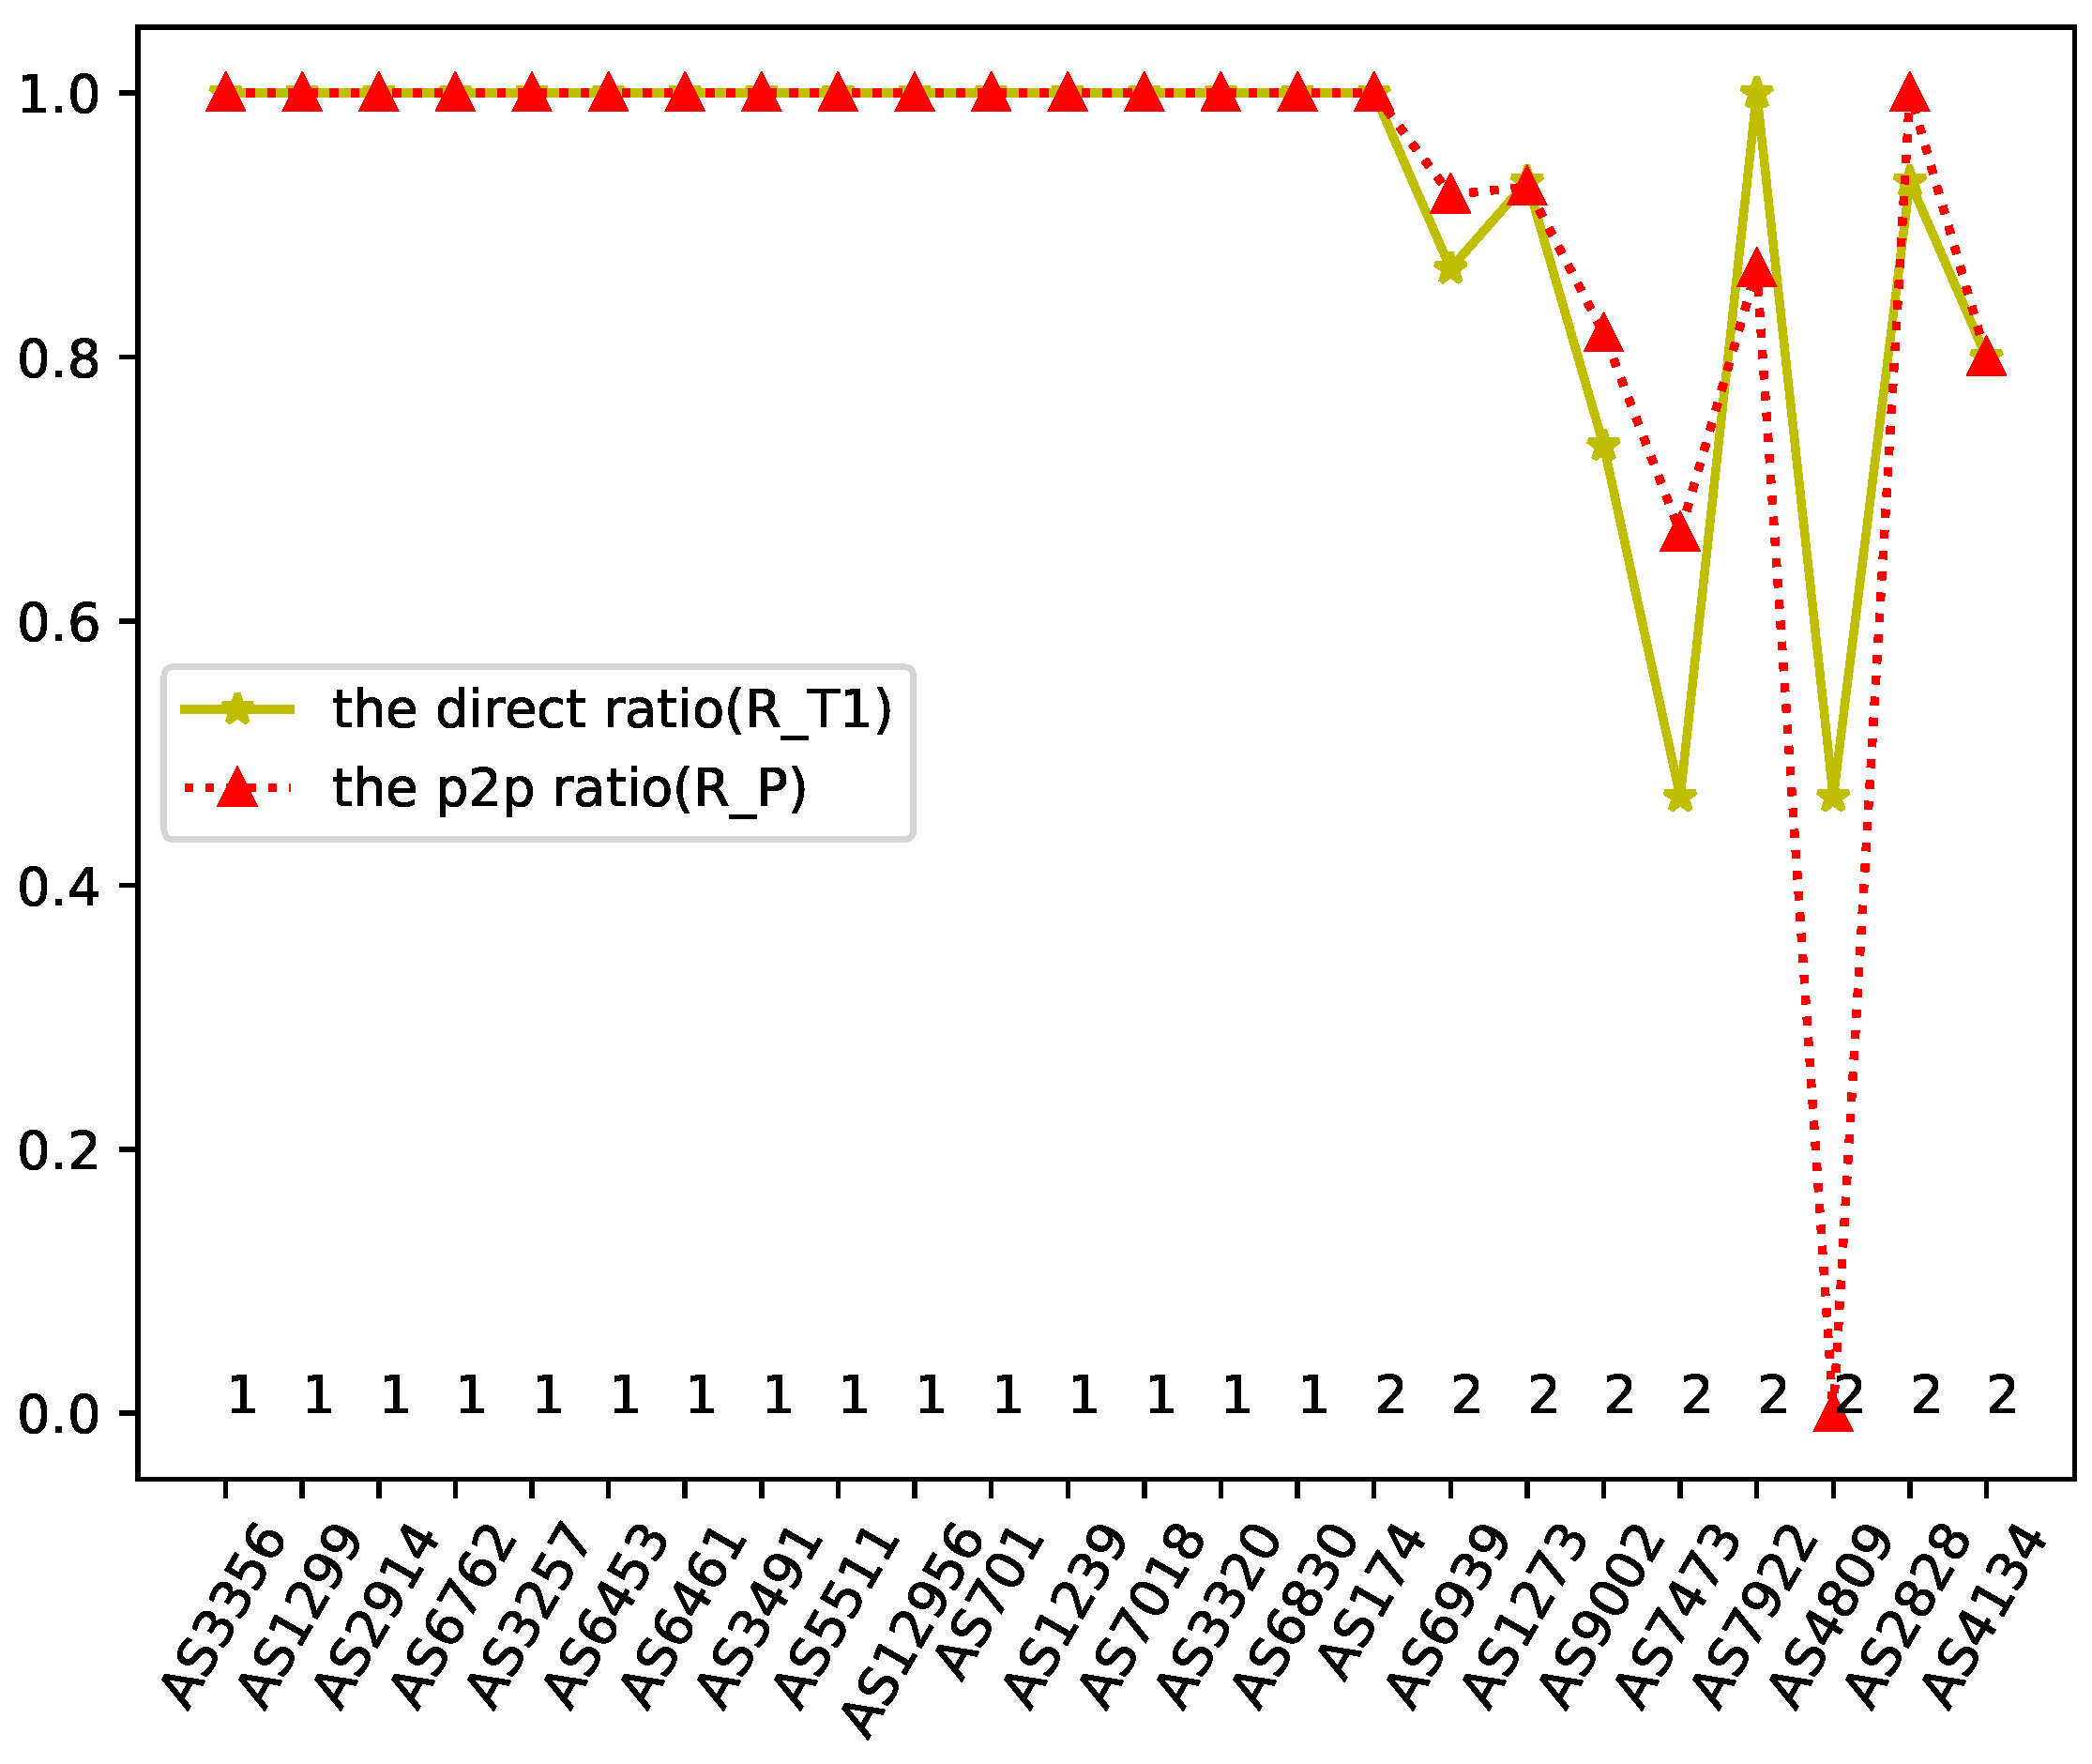
Figure 5 presents the statistics of the Direct Ratio R T 1 and P2P Ratio R P of all focal ASes with all Tier-1 AS. Our findings reveal that the Direct Ratio and P2P Ratio of all Tier-1 ASes are equal to 1. This validates that the network comprising Tier-1 ASes is a fully connected network utilizing P2P relationships for connectivity. For Regional Tier-1 ASes, our analysis indicates that they are directly connected to most of the Tier-1 ASes, although in certain instances, paths to one or more Tier-1 ASes may be absent. For instance, AS9002 lacks a route to Tier-1 AS2914. Furthermore, even when a Regional Tier-1 AS is fully connected to all Tier-1 ASes, it may still possess one or more provider ASes. A prime example is AS7922, which has provider AS3356 despite being fully connected to all Tier-1 ASes.
For the majority of Regional Tier-1 ASes, their Direct Ratio and P2P Ratio exceed 50%, with numerous Regional Tier-1 ASes achieving connectivity comparable to that of Tier-1 ASes. This implies that most Regional Tier-1 ASes exert a significant influence on other Tier-1 ASes, akin to the influence wielded by Tier-1 ASes. It is widely accepted that two ASes will establish P2P links only if they are similar in size. The willingness of most Tier-1 ASes to interconnect with Regional Tier-1 ASes via a P2P relationship suggests a negligible difference in network size between Regional Tier-1 ASes and Tier-1 ASes. For slightly less important Regional Tier-1 ASes, the establishment of peering interconnections with most of the topmost Tier-1 ASes indicates their substantial influence on the Internet, thereby underscoring the significance of Regional Tier-1 ASes within the Internet’s structure.
Lastly, we examine the differences between Regional Tier-1 ASes and Tier-1 ASes in terms of their primary business operations. We introduce the Transmission Ratio metric T as a quantifiable indicator of an AS’s propensity to transmit traffic for other ASes: a higher Transmission Ratio signifies a greater inclination to provide traffic transmission services for other networks. As depicted in Figure 2, the Transmission Degree and Neighbor Degree of the significant AS are nearly identical, with AS7018 exhibiting the smallest Transmission Ratio at T = 0.933 . This suggests that the principal function of these important ASes is to facilitate traffic transmission services for other ASes.
Upon delving deeper into the primary business operations of these significant ASes, we discovered that their managing entities are either multinational telecommunications companies or international network service providers, primarily offering network transmission and value-added services. Concurrently, we identified certain ASes, such as AS13768 and AS30844, that exhibit a relatively small Transit Degree but a large Transmission Ratio. However, these ASes are typically owned by small to medium-sized network operators whose main business is to provide network access or traffic transmission services to local areas. They generally share common characteristics: a relatively small network size, a limited business scope, and affiliation with regional network service providers or content service providers. Despite the similarity in Transmission Ratio, there is a stark contrast between their network size and the core network of the Internet. It is evident that a distinguishing feature of core Internet ASes is their status as scaled transnational provider ASes, with their core business characteristics manifested in traffic transmission services.
Through the aforementioned analysis, we observe that the majority of the collected Regional Tier-1 ASes exhibit considerable consistency with Tier-1 ASes in terms of the number of accessible ASes (termed as “routing view”), AS ranking, quality and quantity of peripheral ASes, and primary business operations. Interestingly, certain Regional Tier-1 ASes may exert more influence than some Tier-1 ASes according to specific metrics. This suggests that Regional Tier-1 ASes wield a similar influence as Tier-1 ASes on the Internet and can potentially serve as members of the Internet core. However, there exist discernible gaps between Regional Tier-1 AS and Tier-1 AS. For instance, the main contributors to the routing view of Tier-1 ASes are the second-hop and third-hop ASes, whereas, for most Regional Tier-1 ASes, the primary contributor to their routing view is the second-hop AS. Despite these differences, it is undeniable that Regional Tier-1 ASes, akin to Tier-1 ASes, significantly influence the Internet, with other ASes being highly dependent on them. Both Tier-1 ASes and Regional Tier-1 ASes have a large number of high-contributing ASes willing to establish direct connections with them. The distinction lies in the fact that some high-contributing ASes are even willing to form interconnections with Tier-1 ASes through secondary connections. Therefore, we include Region Tier-1 AS in the context of the Internet core network.

3.2. Infer the Core Structure of the Internet

In the investigation conducted in the previous section, we explore the potential of the Regional Tier-1 AS to evolve into the core of the Internet. We delineate the characteristics of its backbone network by drawing comparisons with Tier-1 AS. Through a meticulous analysis of the widely recognized Tier-1 AS and Regional Tier-1 AS, we discern that the core structure of the Internet manifests several key characteristics:
  • The backbone of the Internet is constituted by the principal autonomous systems of large multinational telecommunication corporations. These corporations primarily offer traffic transmission services to other ASes, encompassing Tier-1 ASes and large-scale Regional Tier-1 ASes managed by regional monopoly telecommunication carriers.
  • The Internet’s core network typically exhibits a high Transit Degree and Transmission Ratio. Based on the key ASes gathered, the core structure of the Internet is discerned, characterized by distinctive topological features such as a Transmission Ratio exceeding 90% and a Transmission Degree surpassing 100.
  • Upon analysis of the Direct Ratio and P2P Ratio of all targeted ASes, it is inferred that a Tier-1 AS in the Internet must have both R T 1 = 1 and R P = 1 . These values are pivotal in determining an AS’s qualification as a Tier-1 AS. Furthermore, for a Regional Tier-1 AS, both its Direct Ratio and P2P Ratio should exceed 50% in terms of topological characteristics. This is observed in most of the Regional Tier-1 ASes under study.
In light of the three key characteristics observed in the Internet’s core structure, we propose a top-down, rule-based filtering methodology for inferring the Internet’s core. We modify certain parameter values to enhance the coverage of ASes, ensuring a comprehensive inference of member ASes within the Internet’s core structure. We classify those ASes in the Internet with a Transit Degree exceeding 50, a Transmission Ratio greater than 0.8, and both Direct Ratio and P2P Ratio over 50% as Core ASes of the Internet.
Contrary to traditional methods that select TOP-K nodes as core networks based on importance metrics, our approach takes into account the unique properties inherent to the Internet. The inference results place greater emphasis on identifying which autonomous systems possess the potential to evolve into core networks. Consequently, our results offer enhanced interpretability and reasonableness.
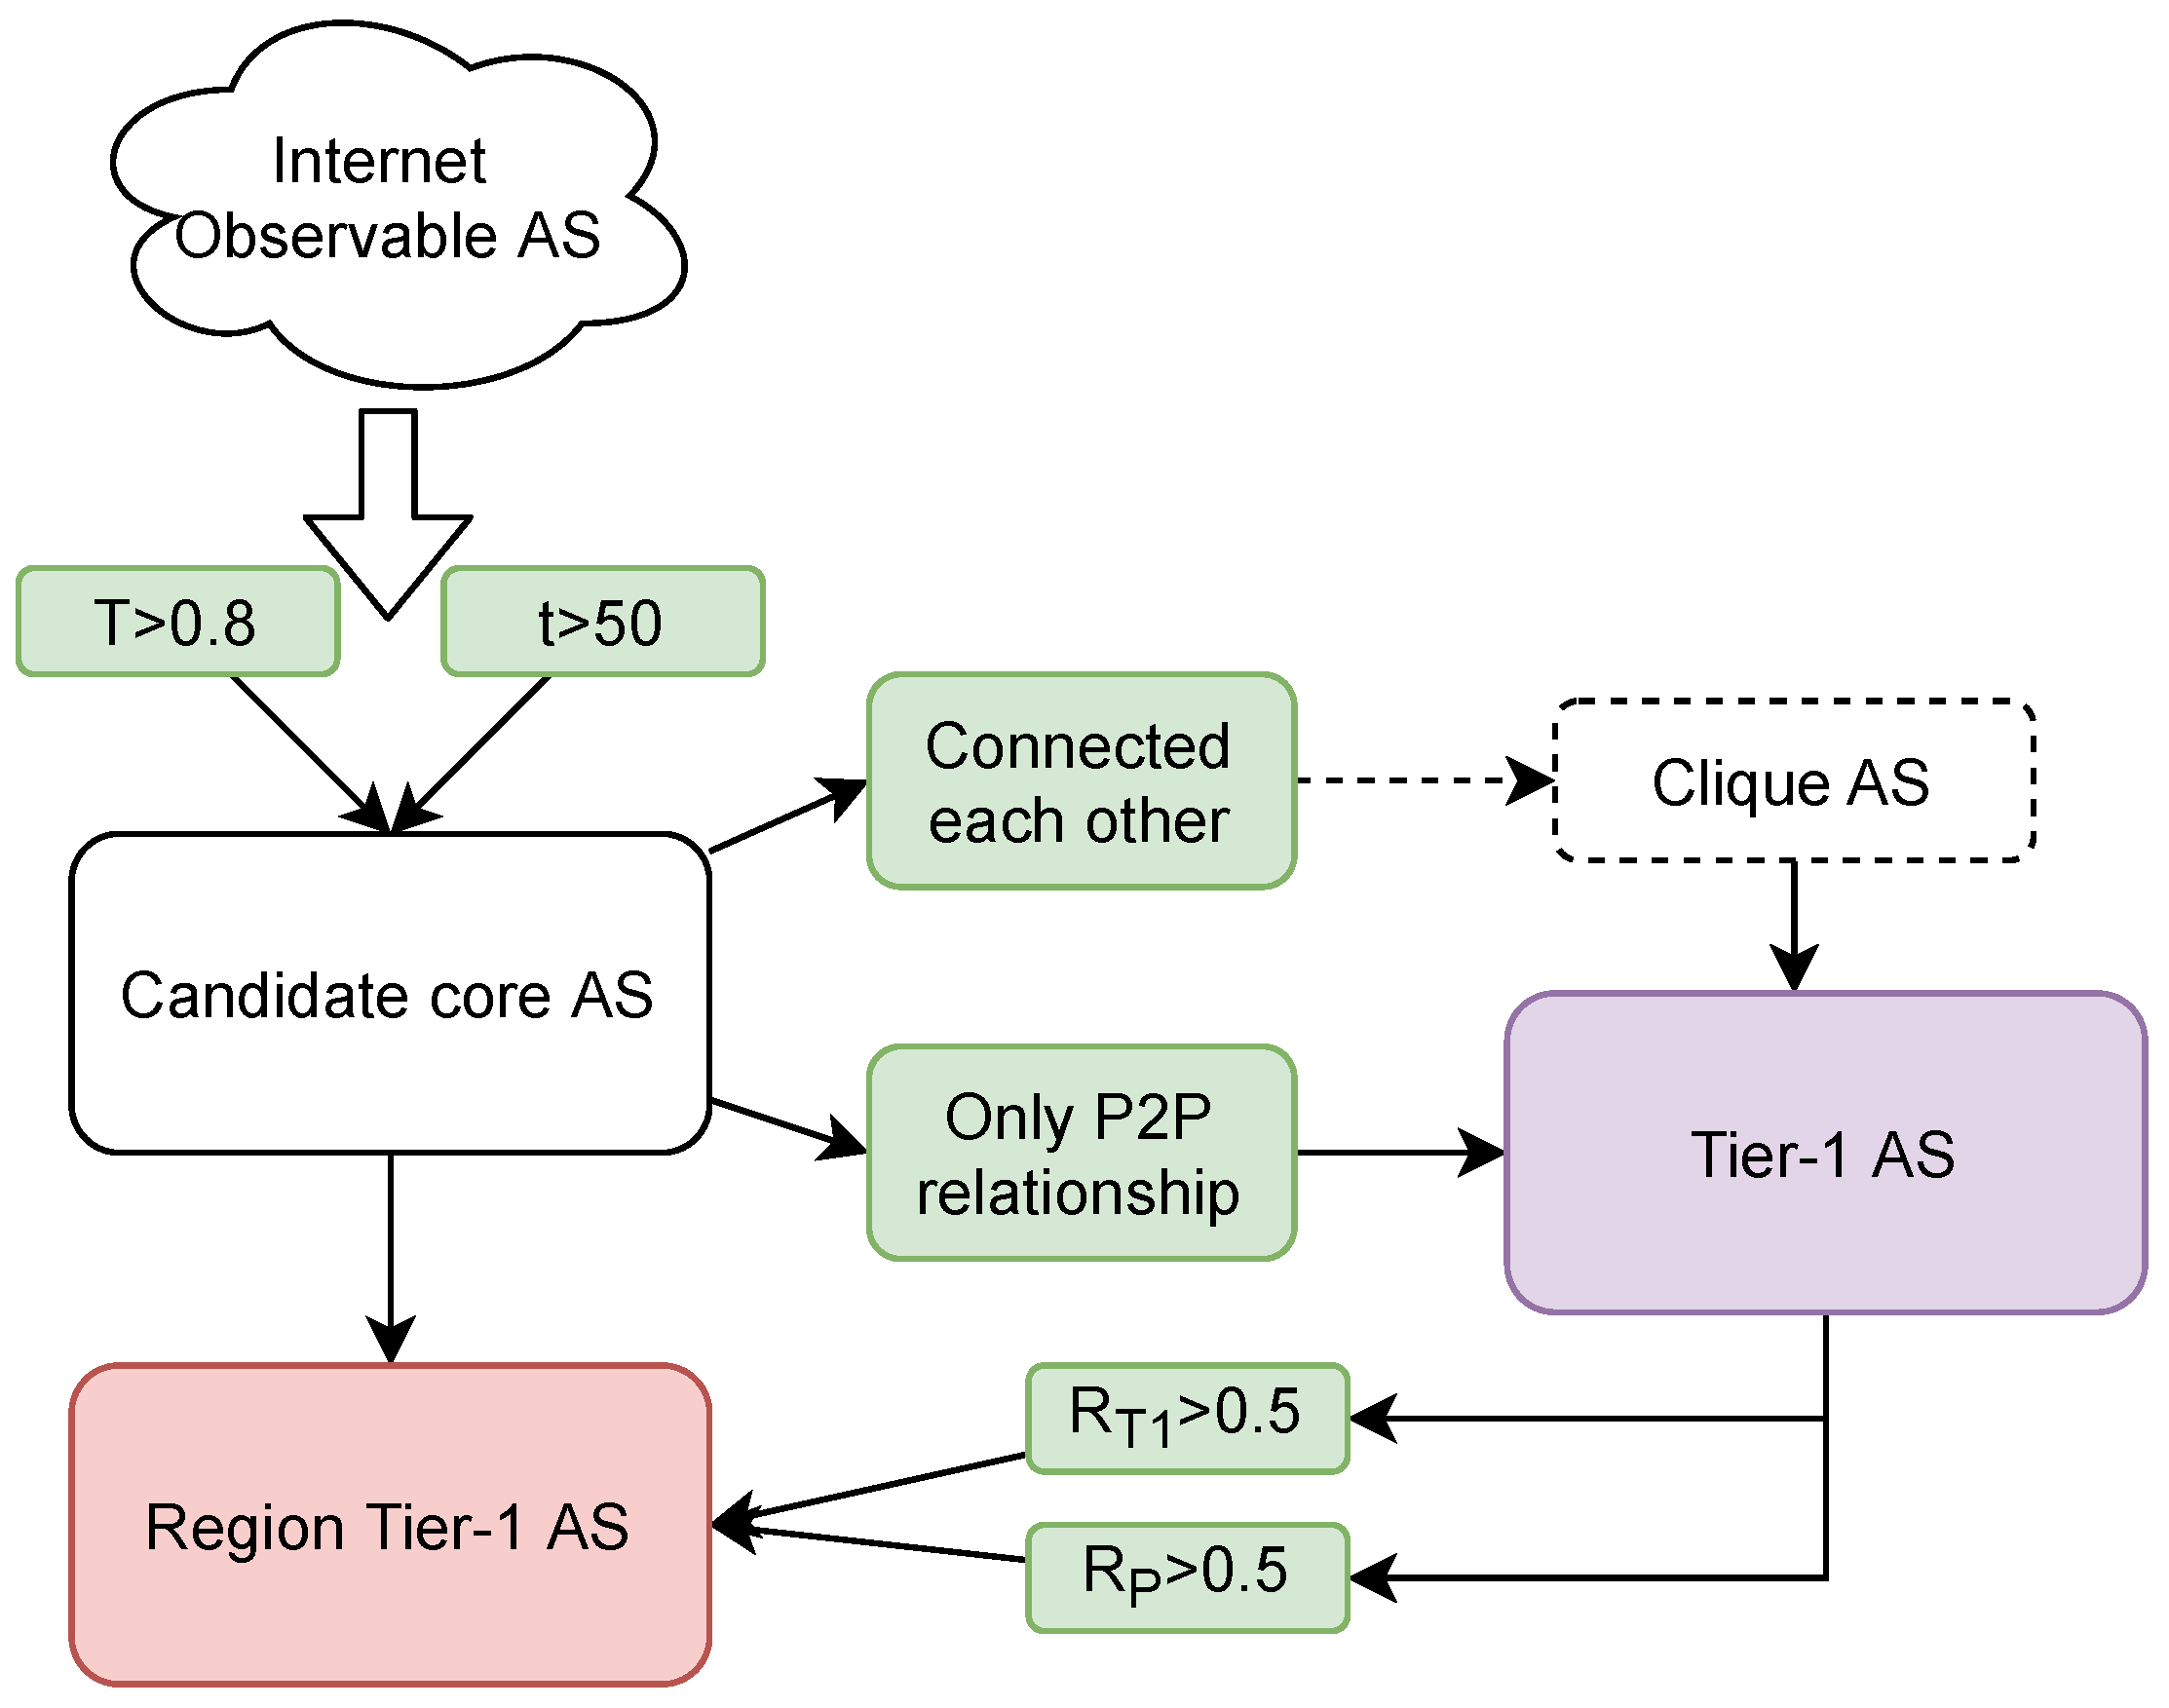
The rule-based filtering methodology for inferring the Internet’s core is primarily divided into four stages, Figure 6 is a schematic flow diagram of the algorithm.
  • Identification of Potential Core ASes: We first identify potential core ASes based on the distinctive topological features of the Internet’s core network. ASes with Transit Degree t > 50 and Transmission Ratio T > 0.8 are filtered out from all observable ASes and are considered as Internet Core Candidate ASes. According to BGP data from December 2022, there are 589 ASes that meet this criterion, accounting for approximately 0.8% of the total number of ASes, which is sufficient to encompass all members of the Internet Core.
  • Iterative Culling Approach: We adopt an “iterative culling” approach to filter the set of potential clique ASes. Clique ASes refers to ASes that are connected to each other. In each iteration, we select a central AS, which must be the one with the highest ASRank among the ASes under consideration. Candidate ASes that lack a direct connectivity relationship with the central AS are then eliminated. For instance, during the first iteration, we find that AS3356 has the highest ASRank ranking and designate it as the central AS for that round. We eliminate candidate ASes that lack a direct connection with AS3356, and the remaining candidate ASes undergo subsequent iterations until all ASes are interconnected.
  • Examination of Edges: We examine all edges within the set of clique ASes. If a non-Peer-to-Peer link exists between any two specific ASes, we cull the AS with a lower ASRank ranking until all connected edges within the clique set are P2P links. The resulting set is considered as the Tier-1 AS set. To avoid overlooking any Tier-1 ASes, we cross-verify all Internet Core Candidate ASes against this constructed Tier-1 set. An AS is also classified as a Tier-1 AS if it exhibits a fully-connected P2P structure with all the identified Tier-1 ASes.
  • Computation of Direct Ratio and P2P Ratio: With the obtained set of Tier-1 ASes, we calculate the Direct Ratio and P2P Ratio for all remaining Internet Core Candidate ASes. An AS candidate is considered as a Regional Tier-1 AS if it satisfies both conditions: Transmission Ratio T > 0.5 and P2P Ratio R P > 0.5 .

4. Results and Analysis

In a comprehensive analysis of public BGP data from RIPE RIS and RouteViews in 2022, our team has identified a total of 34 core autonomous systems. This includes 16 Tier-1 ASes and 18 Region Tier-1 ASes. Our algorithm adds one additional Tier-1 AS, namely AS174, while the rest remain consistent with the focus ASes. Furthermore, we have identified 9 possible Region Tier-1 ASes while excluding AS4809 and AS7473 due to their failure to meet our stringent judgment criteria. The significant increase in the number of Region Tier-1 ASes can be attributed to our fixed measurement standard, which is determined by the minimum standard of typical Region Tier-1 AS.
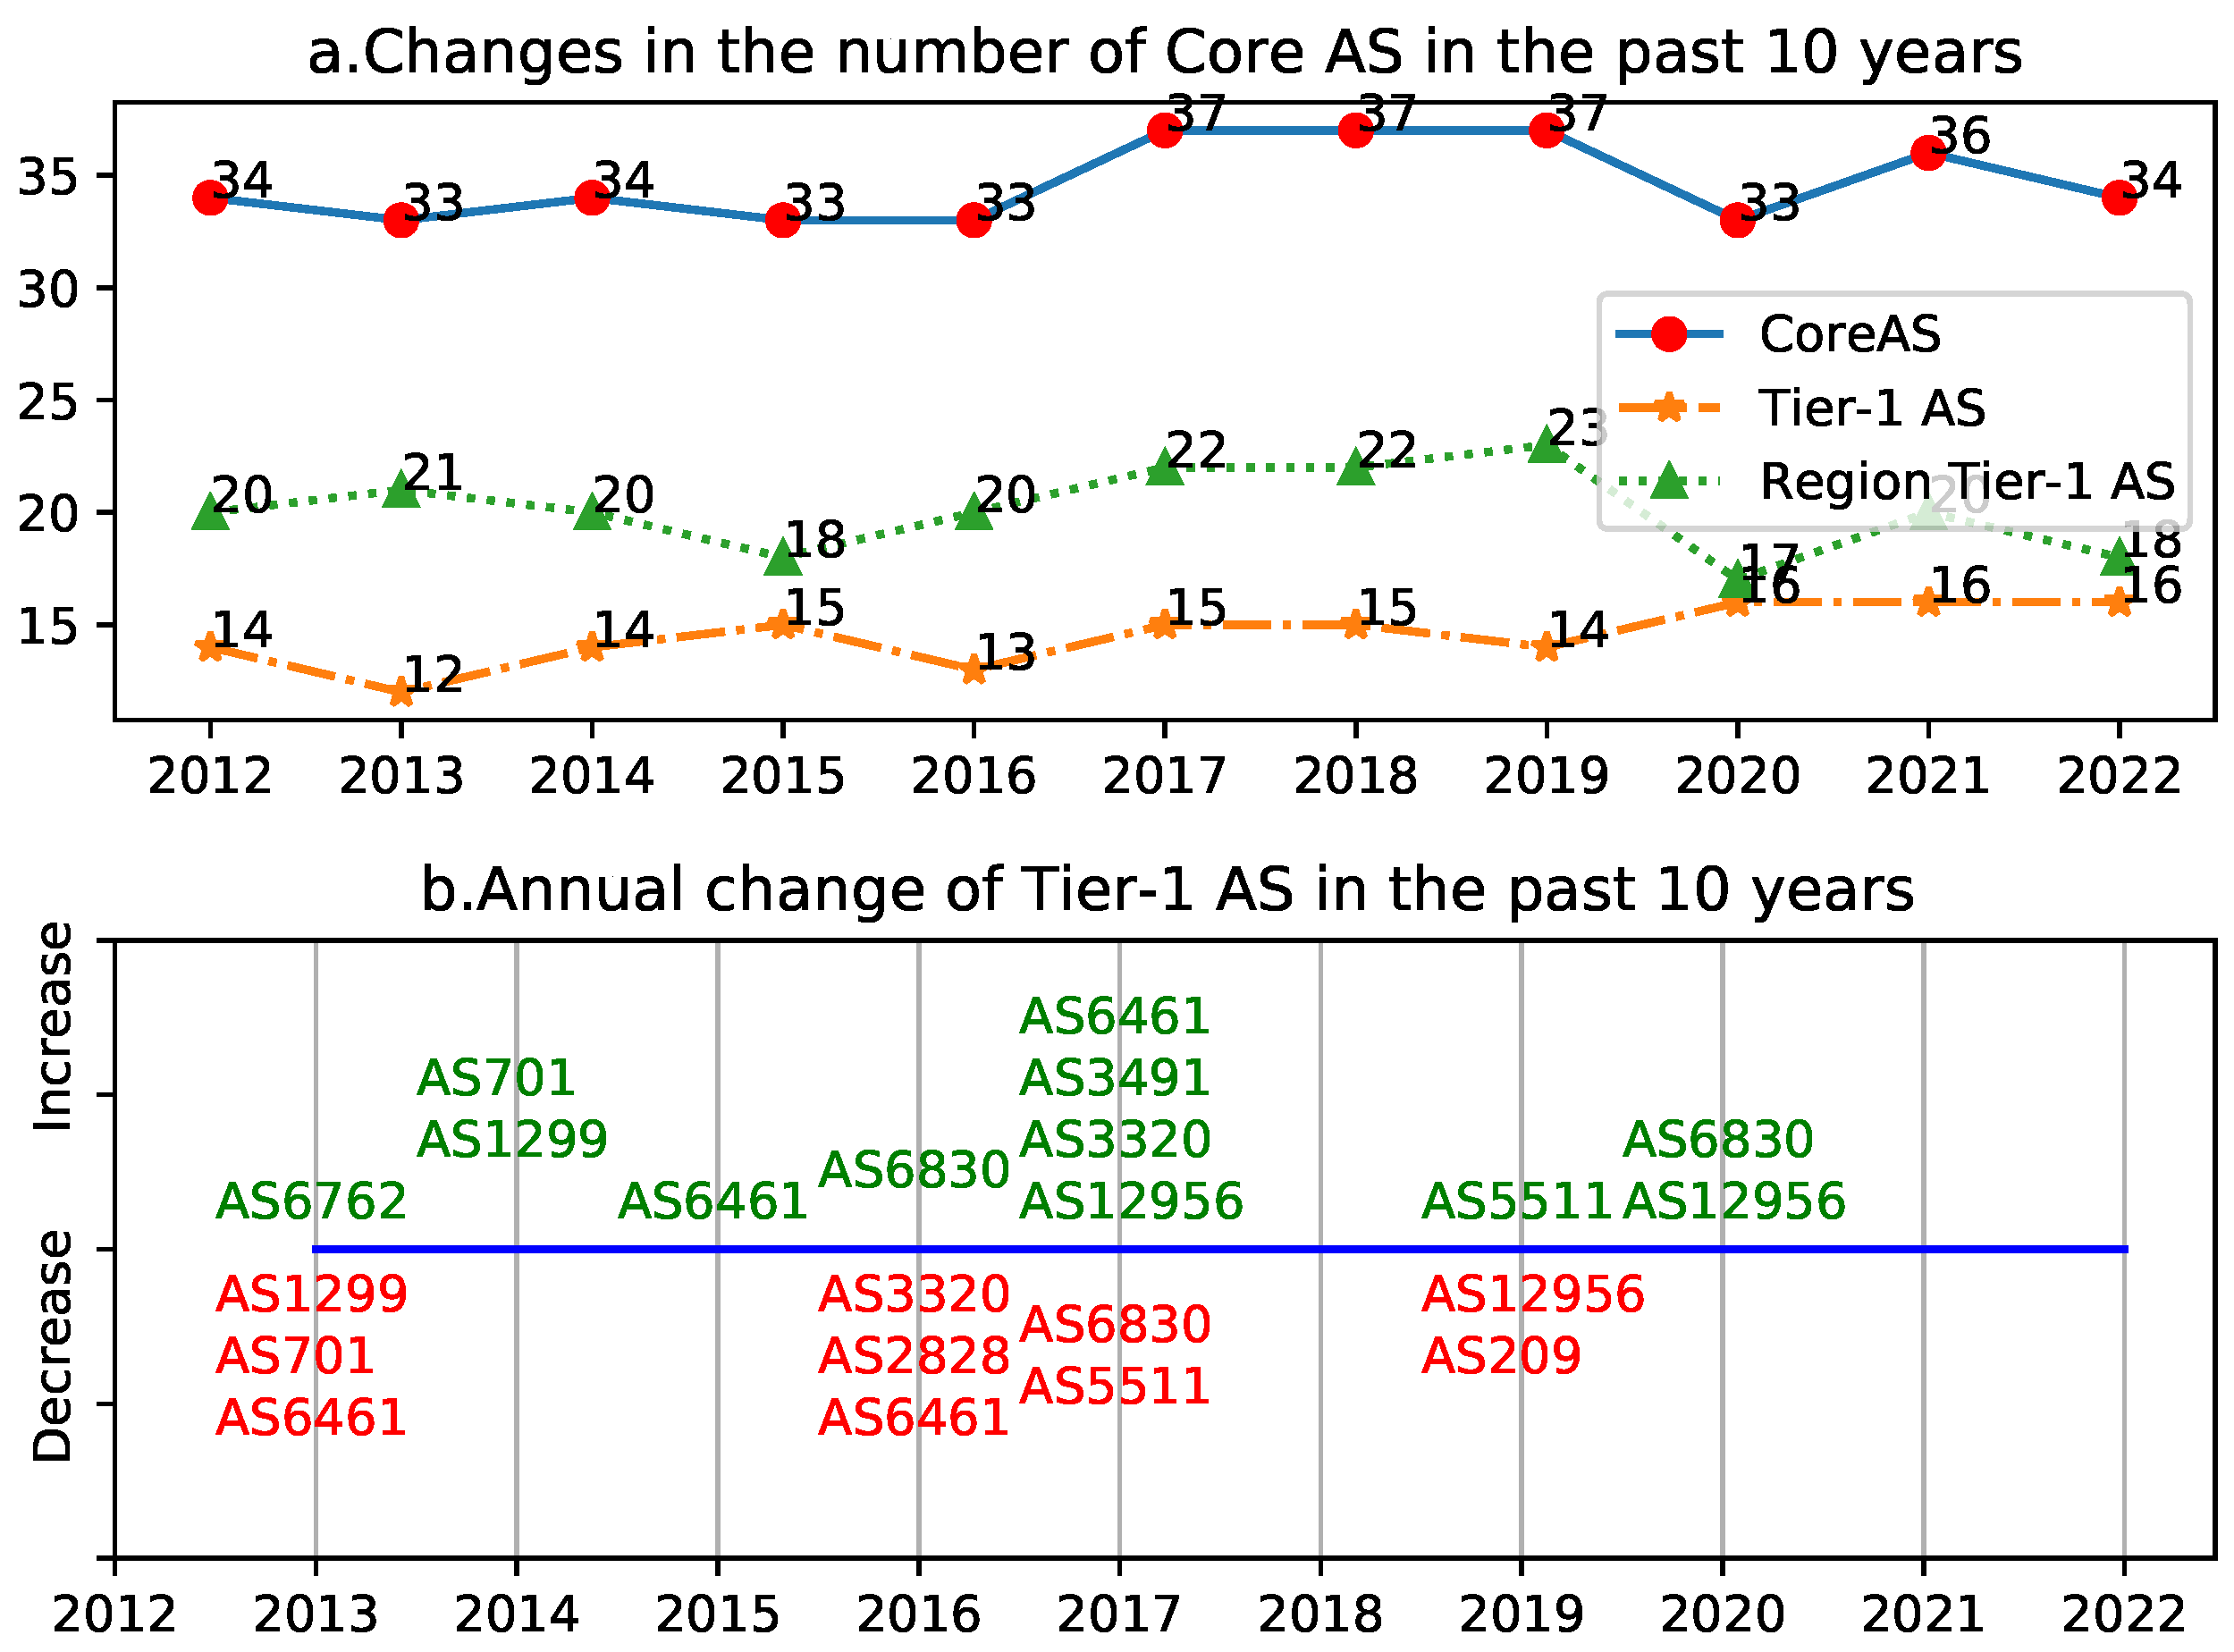
An analysis of public BGP data spanning nearly a decade reveals intriguing insights into the core ASes of the internet. Figure 7 illustrates the evolution of core ASes over the past ten years. As shown in Figure 7a, the number of core ASes has remained relatively stable, fluctuating within a narrow range of 33 to 37. Similarly, both Tier-1 and Region Tier-1 ASes exhibit stability, with only minor fluctuations. These findings suggest that the core network, composed of core ASes, is a robust and stable entity with little change over time. Fluctuations in core AS numbers may be attributed to changes in AS or to incomplete routing views or AS relationships. To further investigate this phenomenon, we examined annual changes in Tier-1 and Region Tier-1 ASes over the past decade.
Figure 7b illustrates the annual fluctuations of Tier-1 ASes over the past decade. Our team obtained these results by comparing the current year’s Tier-1 AS list with that of the previous year. The green ASes above the blue line represent newly added Tier-1 ASes in the current year, while the red ASes below the blue line represent a decrease in Tier-1 ASes compared to the previous year.
Our analysis revealed that most ASes that dropped out of the Tier-1 AS list are temporary, as they may re-enter the Tier-1 AS list in subsequent years. We hypothesize that this phenomenon may be related to the incompleteness of routing views or AS relationship sets. In fact, these ASes are all Tier-1 ASes. A similar phenomenon was also observed in the list of Region Tier-1 ASes over the years. However, two abnormal Tier-1 ASes, namely AS2828, and AS209, have never been added back to the Tier-1 AS list since they fell out of it in 2016 and 2019 respectively. As such, we suspect that changes in their connected structure or AS relationships may have resulted in their downgrade from Tier-1 AS to Region Tier-1 AS. Conversely, we also found that the newly added AS6830 in 2016 and the newly added AS3491 and AS12956 in 2018 may have been upgraded from Region Tier-1 AS to Tier-1 AS. Over the past decade, several ASes have joined or withdrawn from the core AS list. AS2119 (Norway), AS8359 (Russia), and AS5089 (US) have withdrawn from the list, while AS17676 (Japan), AS8220 (UK), AS7713 (Indonesia), and AS41327 (Italy) have joined. Our analysis reveals an increase in the proportion of Asian-owned ASes, while Europe has remained unchanged and North America has experienced a slight decrease.
Our analysis of the geographical distribution of core ASes reveals a concentration of core ASes in a select group of countries. A total of 18 countries host core ASes, with the United States leading the pack with 19 core ASes, including 14 Tier-1 ASes. This dominance suggests that US communication companies wield significant influence at the AS-level, owning nearly half of the world’s core ASes. Other countries with Tier-1 ASes include Spain, Sweden, France, and Germany. Core ASes are primarily located in North America, Europe, and Asia, with a distribution ratio of 20:16:8. Tier-1 ASes are found only in the United States and Europe.
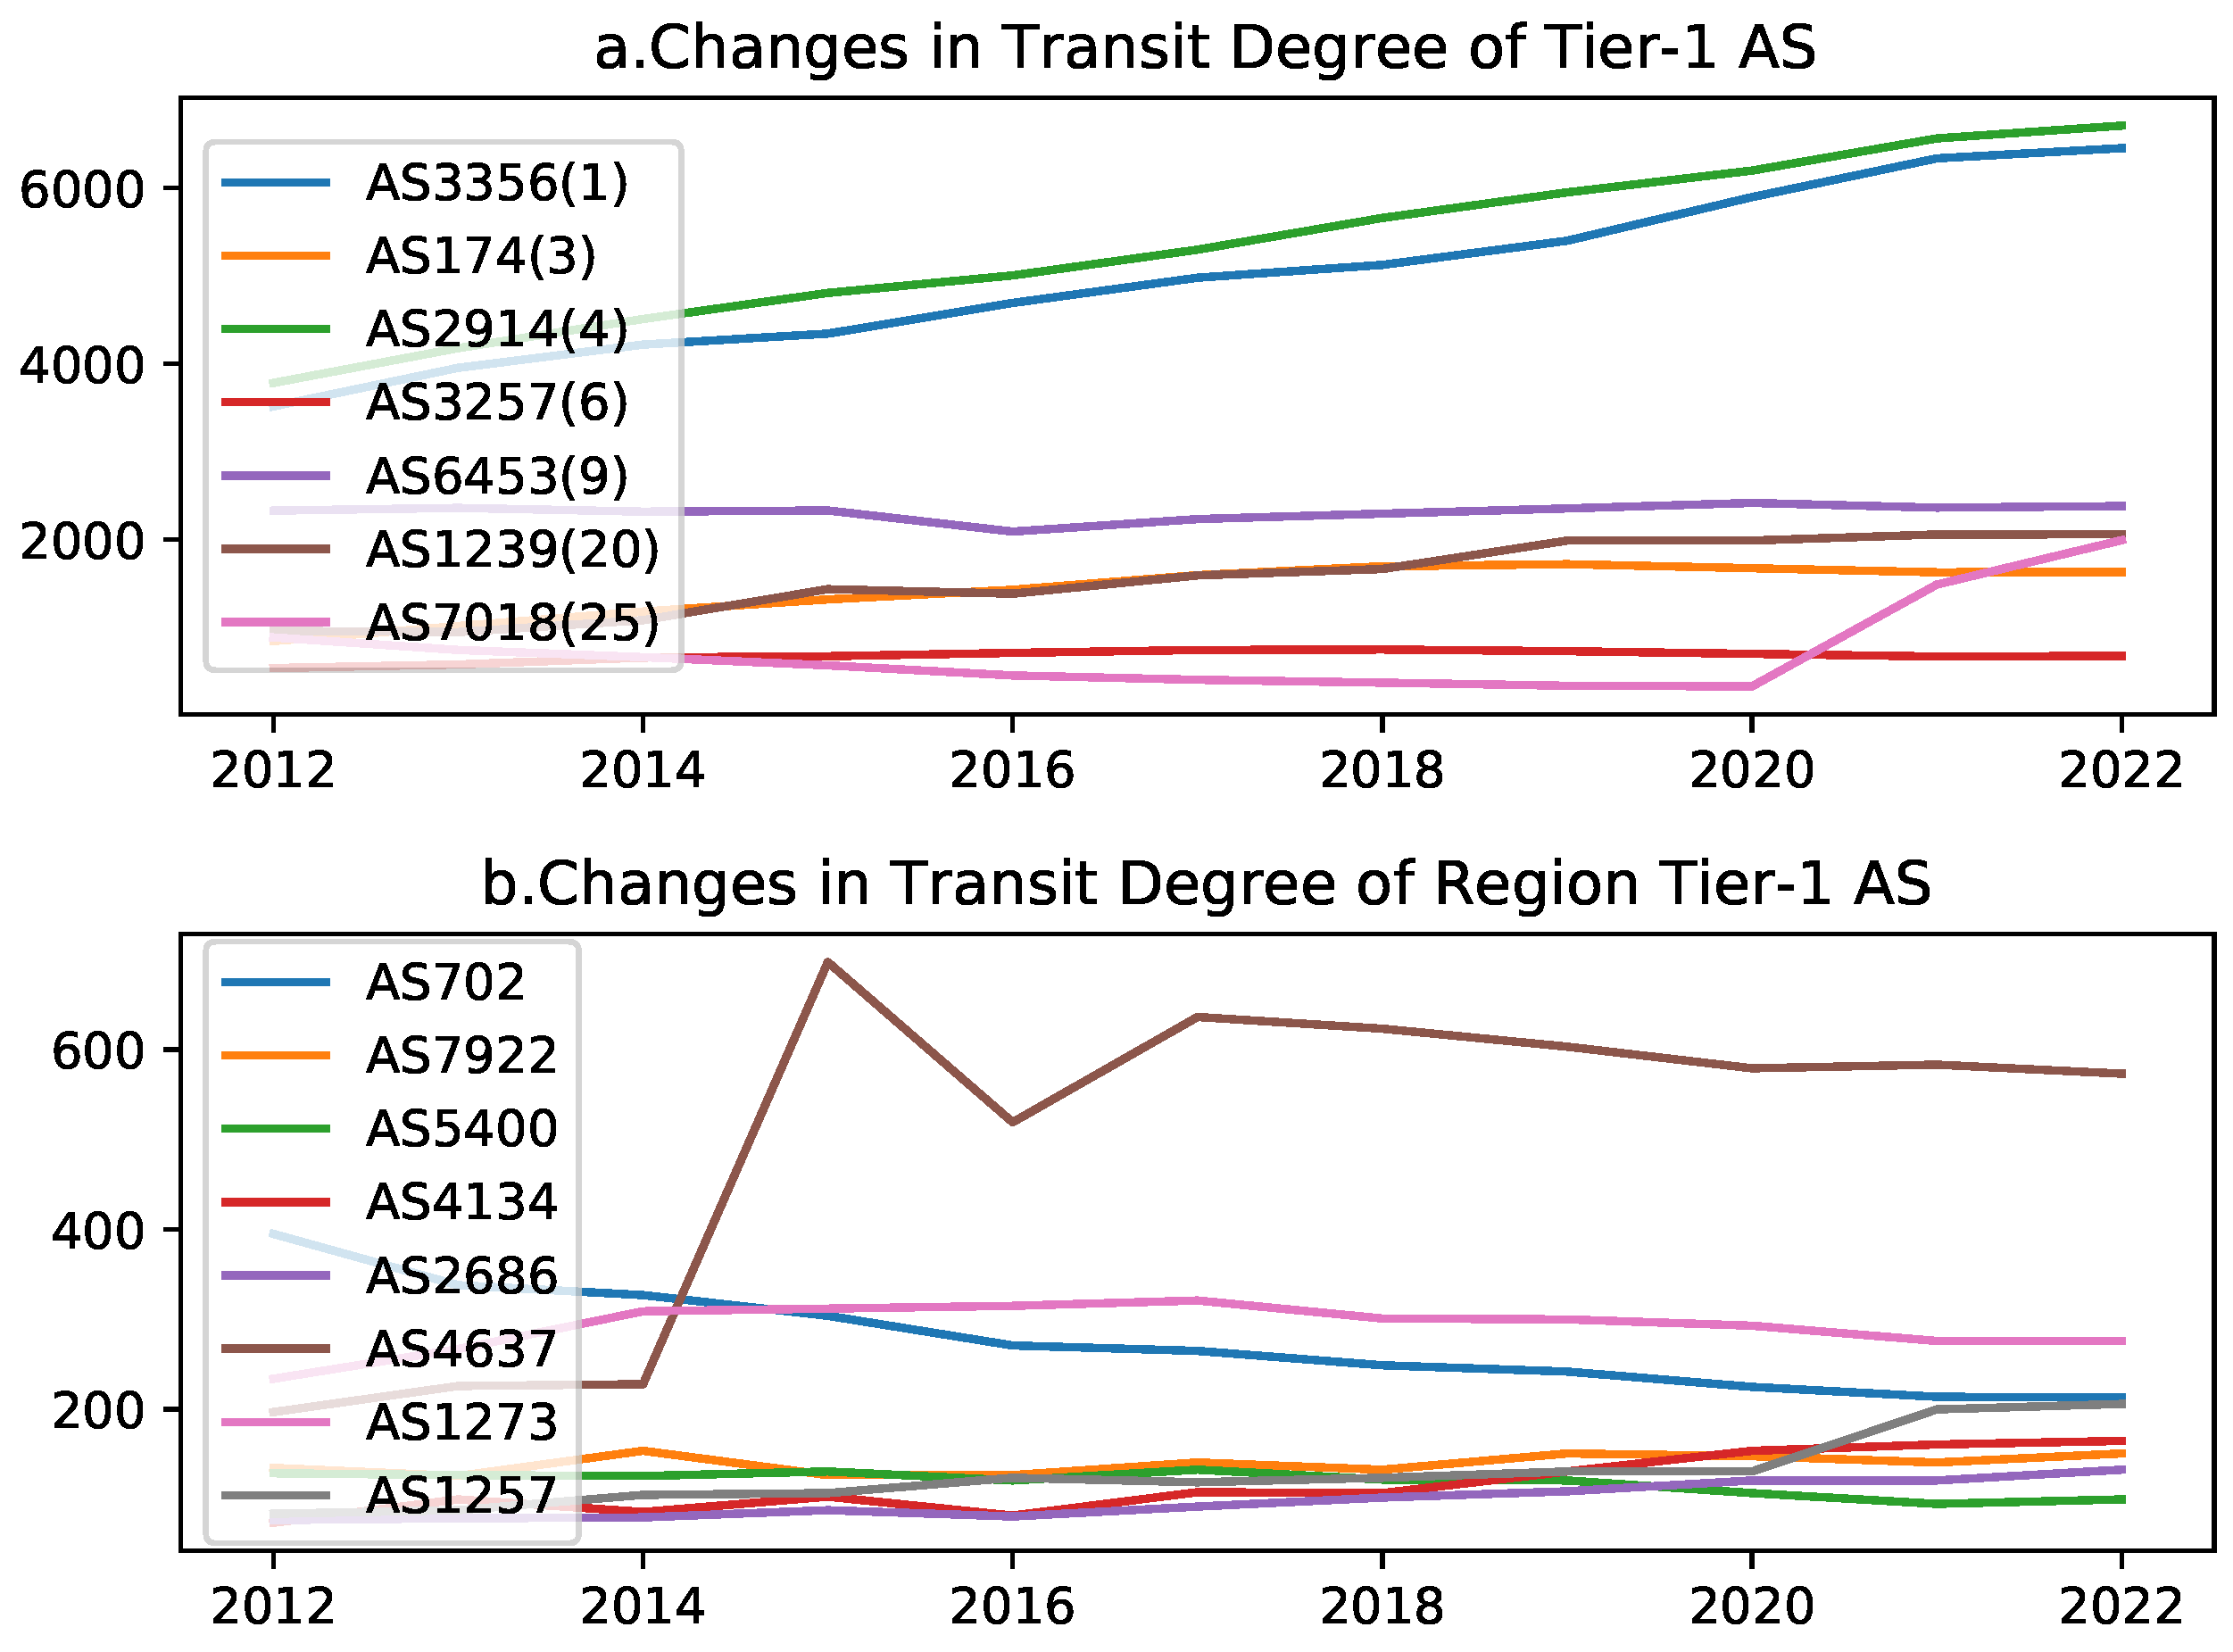
Table 1 presents a comprehensive list of core ASes over the past decade. To further elucidate the distinctions and evolving trends between Tier-1 AS and Region Tier-1 AS, we classified core ASes as “always Tier-1 AS”, “sometimes Tier-1 AS”, “always Region Tier-1 AS”, and “sometimes Region Tier-1 AS” to further differentiate the importance of the AS. Based on "Always Tier-1 AS" and "Always Region Tier-1 AS", we summarized the changes in Transit Degree of typical Tier-1 AS and Region Tier-1 AS in the past ten years, as shown in Figure 8 shown.
Notably, we have incorporated ASRank into the ASN icon in Figure 8a. Our analysis reveals that the majority of core AS have exhibited minimal changes in Transit Degree over the past ten years, remaining relatively stable. Despite a year-on-year increase in the total number of observable AS, the neighbors of most core AS have remained constant, indicating a diminishing significance for these core AS. However, not all core AS are experiencing a stable in Transit Degree. Transit Degrees of AS3356 and AS2914 have demonstrated linear growth, indicating an increase in their importance. AS174 has also exhibited an increase in Transit Degree, this trend has been less pronounced over the past decade. Transit Degrees of some Region Tier-1 ASes are also on an upward trajectory, such as AS4637 and AS1257. Despite similar ASRank values for AS3356, AS2914, and AS174, their respective rates of increase in Transit Degree vary considerably. These findings suggest that the importance of different core AS is subject to change, irrespective of their current status.
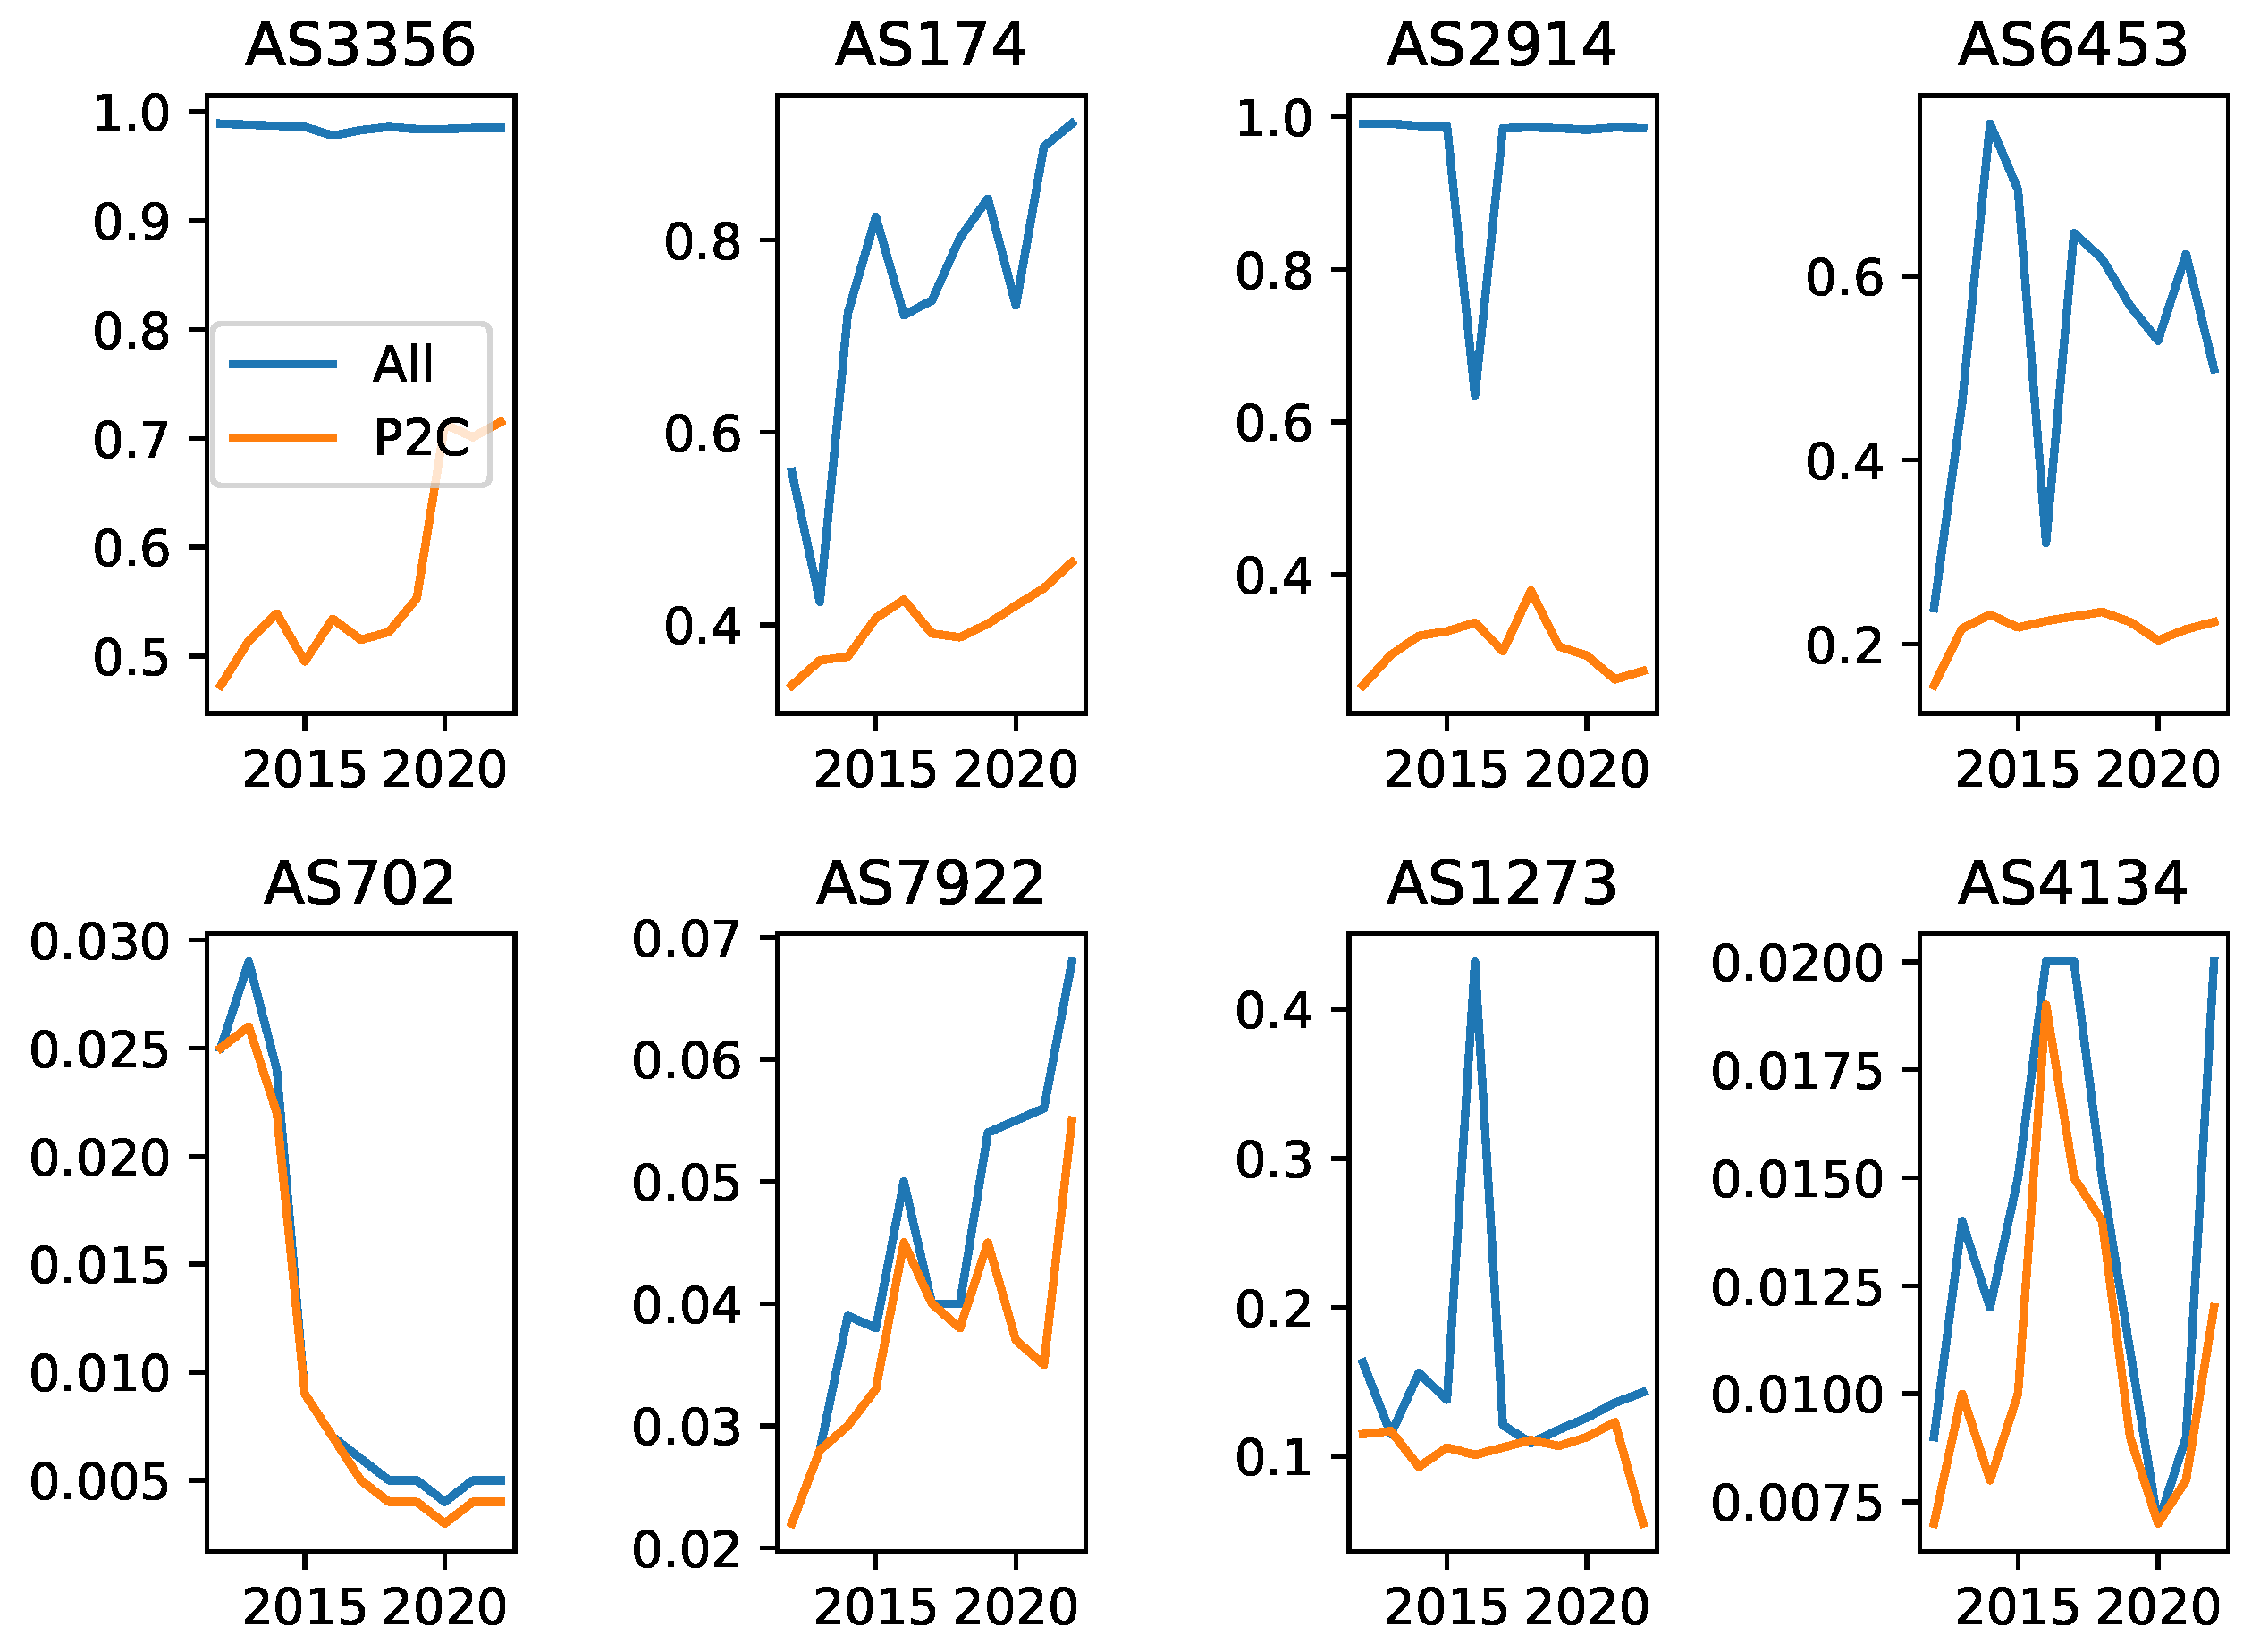
We further investigated the main contributors to the routing view of core ASes by defining two curves: the “ALL” curve and the “P2C” curve. The “ALL” curve represents the ratio of the number of ASes accessible by a core AS to all observable ASes in the Internet, while the “P2C” curve represents the ratio of customer ASes within a core AS to all observable ASes. The “ALL” curve reflects the routing view provided by a core AS, while the “P2C” curve reflects the contribution of customer ASes to the routing view of a core AS.
Figure 9 depicts the “ALL” and “P2C” curves for Tier-1 and Regional Tier-1 ASes. The “ALL” curve for Tier-1 ASes is typically above 0.5, with AS3356 and AS2914 approaching 1. In contrast, the “ALL” curve for Regional Tier-1 ASes is significantly lower. These results corroborate our previous findings that Tier-1 ASes have greater potential to provide a broad routing view.
We found that the “P2C” curve for Regional Tier-1 ASes closely follows the “ALL” curve, indicating that their routing view is primarily derived from customer ASes. In contrast, the “P2C” curve for Tier-1 ASes is significantly lower than the “ALL” curve, suggesting that only a small portion of their routing view comes from customer ASes. Given that Tier-1 ASes are fully connected and peer-to-peer, we infer that most of their routing views are provided by peering ASes. Based on this analysis, we believe that the higher an AS’s importance, the more likely its primary routing view comes from peer-to-peer relationships with other ASes. Conversely, lower-importance ASes are more likely to derive their primary routing view from customer-provider relationships with other ASes.
The “ALL” and “P2C” curves can also be utilized to analyze the business development of AS in recent years. For instance, the “P2C” curve of AS3356 exhibits a continuous upward trend, and its Transit Degree, as shown in Figure 8, also displays an upward trend. This strongly suggests that the growth of AS3356’s business in recent years is primarily driven by customer AS. Similarly, the “ALL” of AS174 shows an observingly upward trend, but its increase in Transit Degree and “P2C” curves are less pronounced. This leads us to infer that AS174’s new neighboring ASes in recent years are more likely to be Peering ASes with P2P relationships. In contrast, the routing view provided by AS702 has been declining over time, particularly between 2013 and 2015. We speculate that AS702 may have experienced significant operational incidents during this period, resulting in the loss of a large number of its customer ASes and a substantial decline in its overall importance.
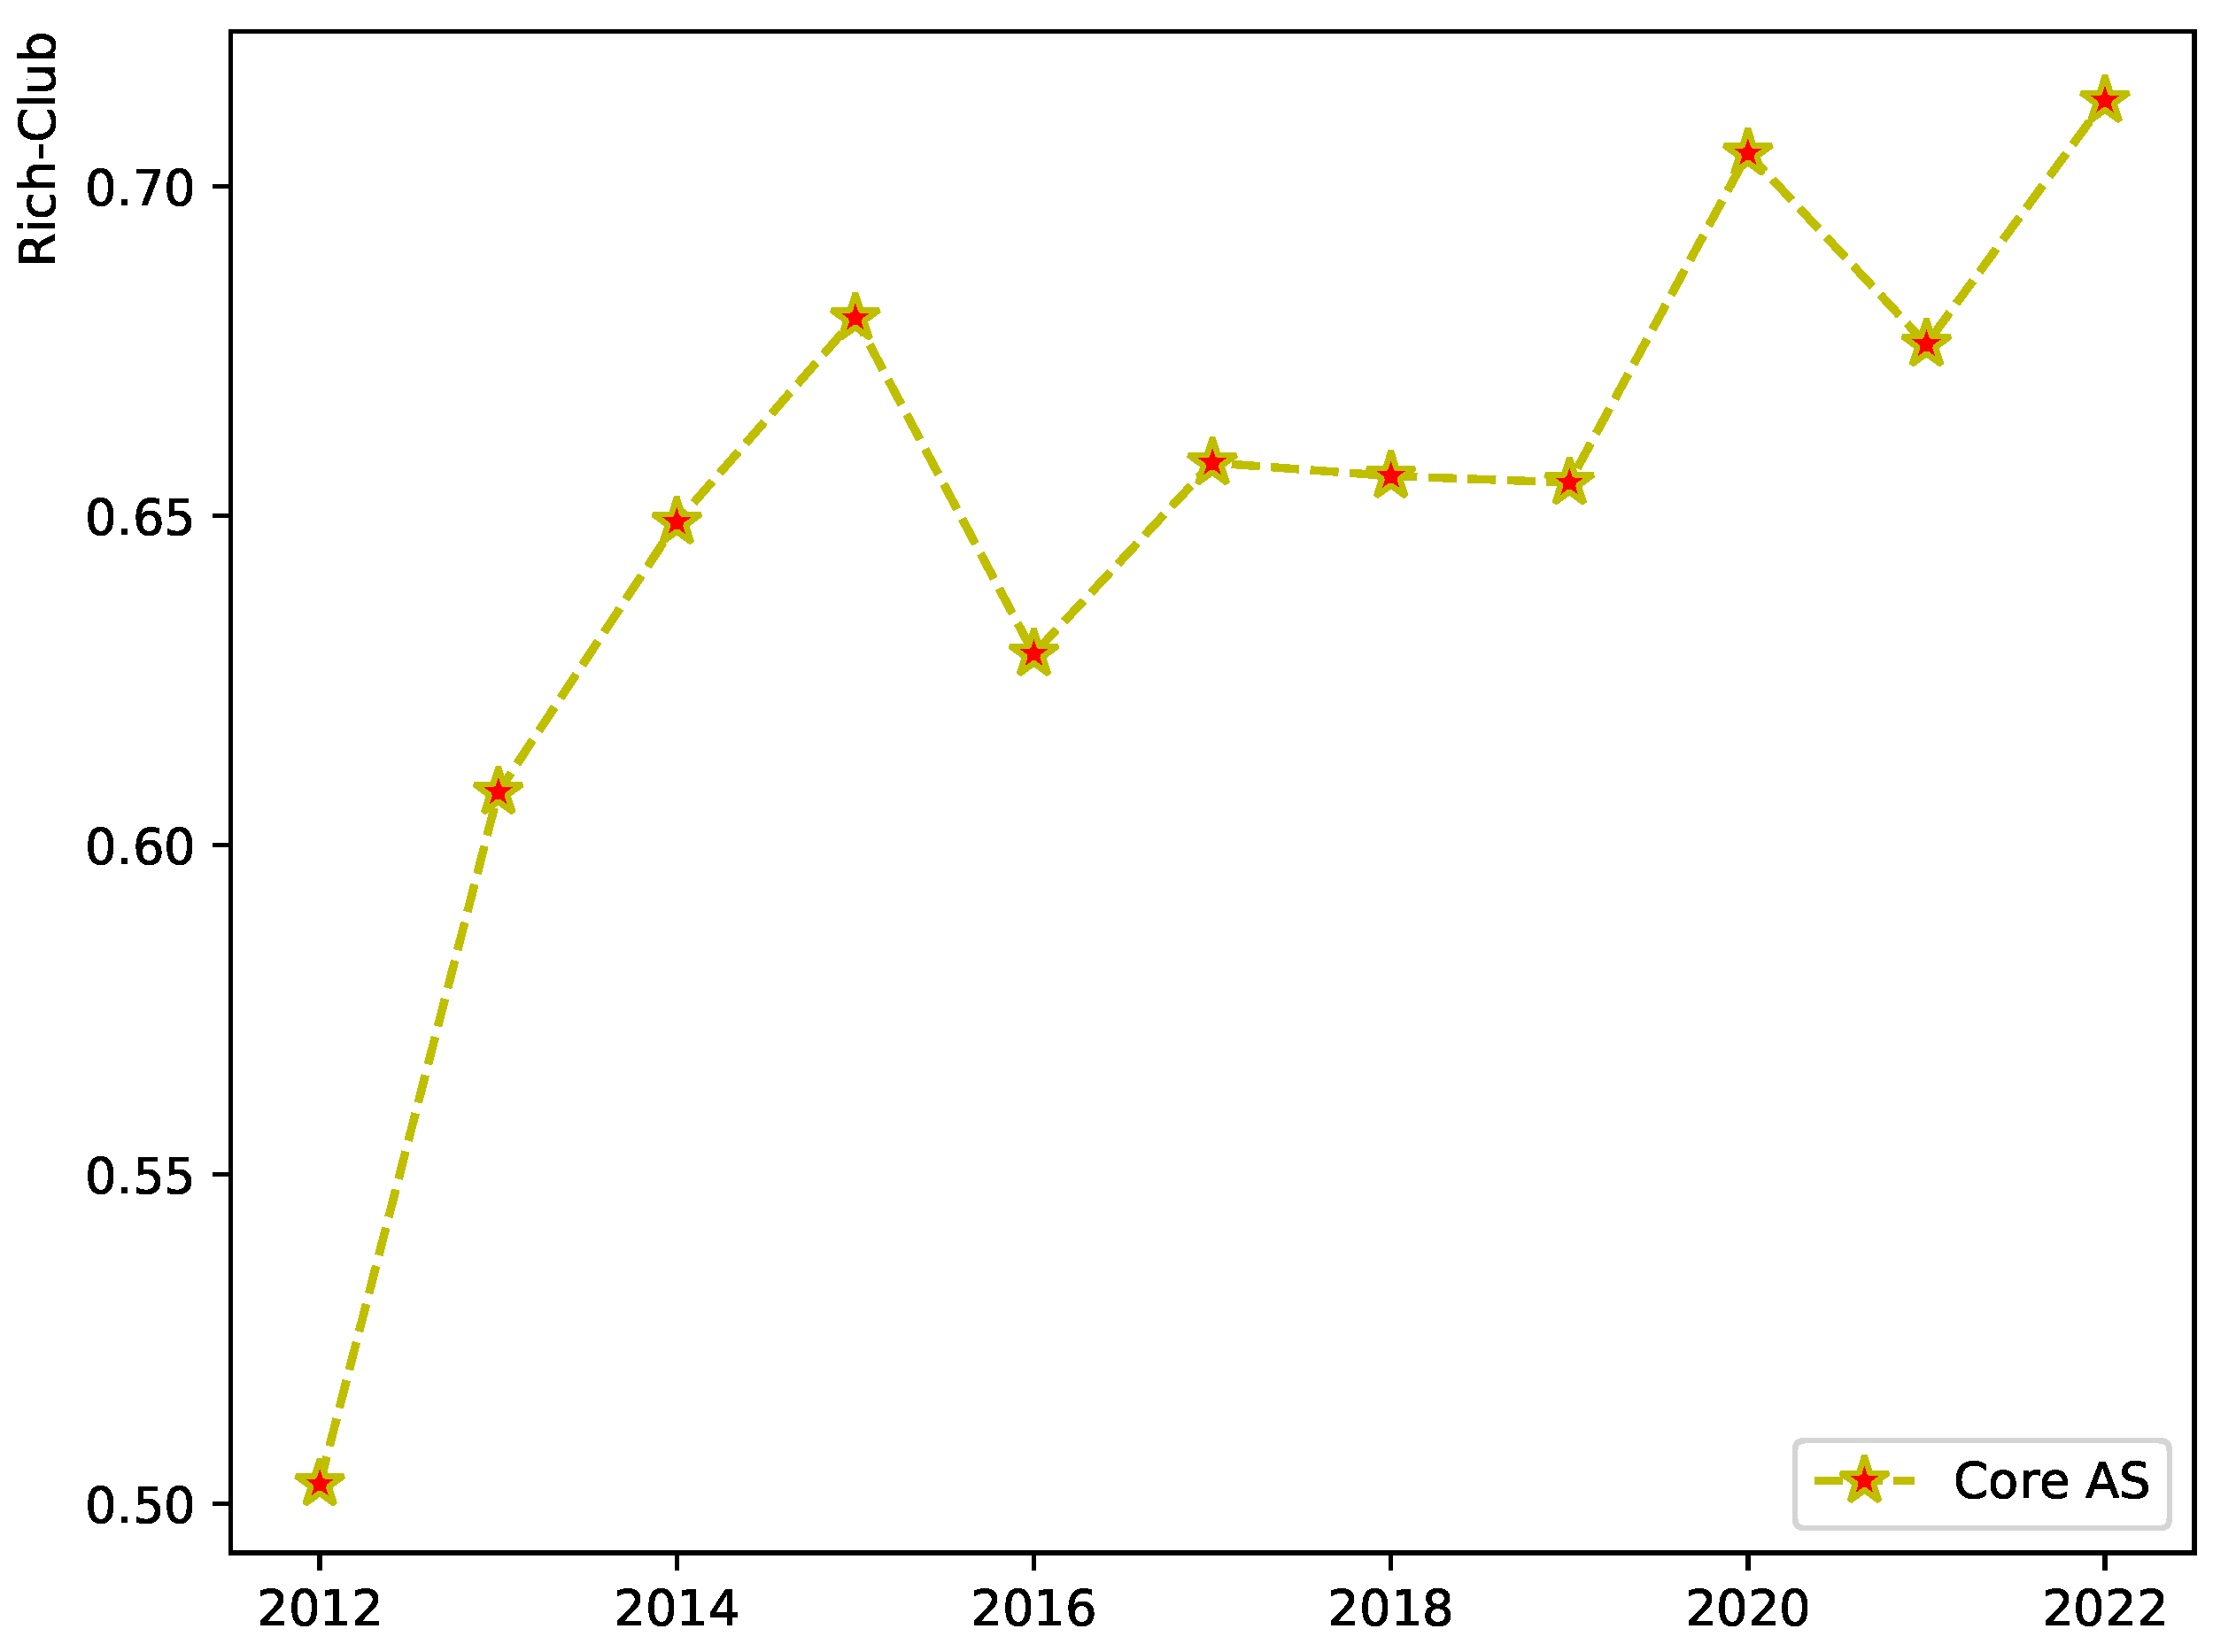
We conducted a statistical analysis of the Rich-Club coefficients of the core network, comprised of core ASes, over the past decade, as depicted in Figure 10. Our findings reveal a gradual increase in the Rich-Club coefficients of the core network over the past ten years, with a particularly noticeable rise between 2012 and 2015. This trend suggests an intensifying connectivity among the nodes of the core network, transforming it into a tightly integrated network. It implies that the influence and importance of the core network within the Internet are steadily growing. This shift may encourage more ASes to bypass local small and medium-sized provider ASes and establish direct connections with the core ASes to enhance network service quality. This development tendency could diminish the role of small and medium-sized provider ASes, leading to further flattening of the Internet structure.
Upon comparing Figure 8 and Figure 10, we note that while the core network consisting of core ASes is gaining significance, the importance of most core ASes appears to be declining, with only a small number of core ASes increasing in importance. This divergence in importance between most nodes and the overall network may suggest that the AS-level core network of the Internet could be evolving towards a structure with fewer cores.

5. Conclusions

This study discerns the potential of Regional Tier-1 ASes to function as the core of the Internet through a meticulous analysis of industry-recognized ASes. This analysis encompasses several aspects, including the number of accessible ASes (“route view”), AS rankings, the quality and quantity of peripheral ASes, and their primary business operations. Through this process, we identify several key characteristics that core Internet ASes should ideally possess. Contrary to traditional methods that rank based on importance and select TOP-K nodes as the network core, our proposed top-down rule-filtering-based Internet core inference method takes into account the unique nature of the Internet. It infers the core structure of the Internet from the perspective of whether AS nodes have the potential to become the core of the Internet. Consequently, our method offers enhanced interpretability and reasonableness compared to traditional methodologies.
Our research reveals that the core structure of the Internet comprises a tightly interconnected network of large provider ASes, whose primary function is to facilitate cross-border traffic. An analysis of historical data pertaining to the Internet’s core ASes over the past decade indicates that the core structure of the Internet demonstrates remarkable stability, despite some changes in the core ASes. The United States, owning nearly half of the world’s Tier-1 ASes, holds a dominant position in the Internet landscape. Conversely, Asian countries have seen a consistent rise in their proportion of core ASes ownership in recent years. Tier-1 ASes are more likely to provide a comprehensive view of routing than Regional Tier-1 ASes, and their peripheral networks are more likely to encompass large-sized networks. Simultaneously, a Tier-1 AS’s primary routing view predominantly originates from its peer AS rather than its customer AS, which is related to the size and importance of the AS itself. Over the past decade, the Internet core network has had an increasingly profound impact on the Internet as a whole. This shift will encourage other ASes to establish direct connections with the core ASes, thus accelerating the trend towards a flattened Internet structure. Moreover, within the core Internet network, the core structure may be gradually evolving from a majority structure to a more minority-centric structure.

Author Contributions

Conceptualization , Y.X.; methodology, Y.X. and H.G; software, H.G. and J.L.; validation, Y.X. and H,G.; formal analysis, Y.X.; investigation, Y.X.; resources, Z.Z. and N.L.; data curation, H.G. and J.L.; writing—original draft preparation, Y.X.; writing—review and editing, Z.Z. and N.L. and H.G.; visualization, Y.X.; supervision, Z.Z. and N.L.; project administration, Z.Z. and N.L.; funding acquisition, Z.Z. and N.L. All authors have read and agreed to the published version of the manuscript.

Funding

This work is supported by Shandong Province Key R&D Project 2020CXGC10103; the National Natural Science Foundation of China (62101159) and the Natural Science Foundation of Shandong Province (ZR2021MF055).

Data Availability Statement

Publicly available datasets were analyzed in this study. This data can be found here: https://github.com/GlobalRouteData/FullGlobalRouteData (accessed on 5 May 2024).

Conflicts of Interest

The authors declare no conflicts of interest.

References

  1. Nur, A.Y. Analysis of Autonomous System Level Internet Topology Graphs and Multigraphs. In Proceedings of the 2021 International Symposium on Networks, Computers and Communications (ISNCC). IEEE; 2021; pp. 1–7. [Google Scholar]
  2. Nur, A.Y.; Tozal, M.E. Record route IP traceback: Combating DoS attacks and the variants. Computers & Security 2018, 72, 13–25. [Google Scholar]
  3. Wang, Y.; Zhang, K. Quantifying the flattening of internet topology. In Proceedings of the Proceedings of the 11th International Conference on Future Internet Technologies, 2016, pp. 113–117.
  4. Fan, Z.; Tang, W.K.S. Interplay of ICP and IXP over the Internet with power-law features. International Journal of Modern Physics C 2018, 29, 1850001. [Google Scholar] [CrossRef]
  5. Ting, L.; Qin, D.; Ge, L. Experimental research on internet ecosystem and AS hierarchy. In Proceedings of the Data Science: 5th International Conference of Pioneering Computer Scientists, Engineers and Educators, ICPCSEE 2019, Guilin, China, September 20–23, 2019, Proceedings, Part I 5. Springer, 2019, pp. 253–263.
  6. wikipedia. Tier 1 network. [online]. available: https://en.wikipedia.org/wiki/Tier-1network/, 2023.
  7. Saxena, A.; Iyengar, S. K-shell rank analysis using local information. In Proceedings of the International Conference on Computational Social Networks. Springer, 2018, pp. 198–210.
  8. Kourtellis, N.; Alahakoon, T.; Simha, R.; Iamnitchi, A.; Tripathi, R. Identifying high betweenness centrality nodes in large social networks. Social Network Analysis and Mining 2013, 3, 899–914. [Google Scholar] [CrossRef]
  9. Agryzkov, T.; Oliver, J.L.; Tortosa, L.; Vicent, J. A new betweenness centrality measure based on an algorithm for ranking the nodes of a network. Applied Mathematics and Computation 2014, 244, 467–478. [Google Scholar] [CrossRef]
  10. Lim, Y.s.; Menasché, D.S.; Ribeiro, B.; Towsley, D.; Basu, P. Online estimating the k central nodes of a network. In Proceedings of the 2011 IEEE Network Science Workshop. IEEE; 2011; pp. 118–122. [Google Scholar]
  11. Okamoto, K.; Chen, W.; Li, X.Y. Ranking of closeness centrality for large-scale social networks. In Proceedings of the International workshop on frontiers in algorithmics. Springer; 2008; pp. 186–195. [Google Scholar]
  12. Bergamini, E.; Borassi, M.; Crescenzi, P.; Marino, A.; Meyerhenke, H. Computing top-k closeness centrality faster in unweighted graphs. ACM Transactions on Knowledge Discovery from Data (TKDD) 2019, 13, 1–40. [Google Scholar] [CrossRef]
  13. Olsen, P.W.; Labouseur, A.G.; Hwang, J.H. Efficient top-k closeness centrality search. In Proceedings of the 2014 IEEE 30th International Conference on Data Engineering. IEEE; 2014; pp. 196–207. [Google Scholar]
  14. Besen, S.M.; Israel, M.A. The evolution of Internet interconnection from hierarchy to “Mesh”: Implications for government regulation. Information Economics and Policy 2013, 25, 235–245. [Google Scholar] [CrossRef]
  15. Zegura, E.W.; Calvert, K.L.; Donahoo, M.J. A quantitative comparison of graph-based models for Internet topology. IEEE/ACM Transactions on networking 1997, 5, 770–783. [Google Scholar] [CrossRef]
  16. Ravasz, E.; Barabási, A.L. Hierarchical organization in complex networks. Physical review E 2003, 67, 026112. [Google Scholar] [CrossRef] [PubMed]
  17. Zhang, J.; Zhao, H.; Zhou, Y. Relationship between degree and core number of internet nodes at router level. Journal of Northeastern University (Natural Science) 2008, 29, 653–656. [Google Scholar]
  18. Ahmad, M.Z.; Guha, R. Impact of Internet exchange points on Internet topology evolution. In Proceedings of the IEEE Local Computer Network Conference. IEEE; 2010; pp. 332–335. [Google Scholar]
  19. Labovitz, C.; Iekel-Johnson, S.; McPherson, D.; Oberheide, J.; Jahanian, F. Internet inter-domain traffic. ACM SIGCOMM Computer Communication Review 2010, 40, 75–86. [Google Scholar] [CrossRef]
  20. Yang, D.; Rong, Z. Evolution of the internet at the autonomous system level. In Proceedings of the 2015 34th Chinese control conference (CCC). IEEE; 2015; pp. 1313–1317. [Google Scholar]
  21. Witono, T.; Yazid, S. Portrait of Indonesia’s internet topology at the autonomous system level. In Proceedings of the Computational Science and Technology: 6th ICCST 2019, Kota Kinabalu, Malaysia, 29-30 August 2019. Springer, 2020, pp. 237–246.
  22. Masoud, M.Z.; Hei, X.; Cheng, W. A graph-theoretic study of the flattening internet as topology. In Proceedings of the 2013 19th IEEE International Conference on Networks (ICON). IEEE; 2013; pp. 1–6. [Google Scholar]
  23. Accongiagioco, G. Modeling and analysis of the internet topology. e-theses.imtlucca.it 2014.
  24. university of Oregon. routeviews. [online]. available: http://www.routeviews.org/routeviews/, 2023.
  25. RIPENCC. routing-information-service-ris. [online]. available: https://www.ripe.net/analyse/internet-measurements/routing-information-service-ris/, 2023.
  26. Luckie, M.; Huffaker, B.; Dhamdhere, A.; Giotsas, V.; Claffy, K. AS relationships, customer cones, and validation. In Proceedings of the Proceedings of the 2013 conference on Internet measurement conference, 2013, pp. 243–256.
  27. Giotsas, V.; Luckie, M.; Huffaker, B.; Claffy, K. Inferring complex AS relationships. In Proceedings of the Proceedings of the 2014 Conference on Internet Measurement Conference, 2014, pp. 23–30.
  28. Jin, Y.; Scott, C.; Dhamdhere, A.; Giotsas, V.; Krishnamurthy, A.; Shenker, S.J. Stable and practical AS relationship inference with problink. In Proceedings of the Networked Systems Design and Implementation; 2019. [Google Scholar]
  29. Jin, Z.; Shi, X.; Yang, Y.; Yin, X.; Wang, Z.; Wu, J. Toposcope: Recover as relationships from fragmentary observations. In Proceedings of the Proceedings of the ACM Internet Measurement Conference, 2020, pp. 266–280.
  30. CAIDA. The CAIDA AS Relationships Dataset. [online]. available: https://www.caida.org/catalog/datasets/as-relationships/, 2012-2022.
  31. PeeringDB. The Peeringdb IXP Dataset. [online]. available: https://www.peeringdb.com/, 2012-2022.
  32. DrPeering. Who are the Tier 1 ISPs? [online]. available: https://drpeering.net/FAQ/Who-are-the-Tier-1-ISPs.php/, 2019.
  33. PCMag. Tier 1 network, 2022. https://www.pcmag.com/encyclopedia/term/tier-1-network/.
  34. CAIDA. The CAIDA ASRank. [online]. available: https://asrank.caida.org/, 2023.
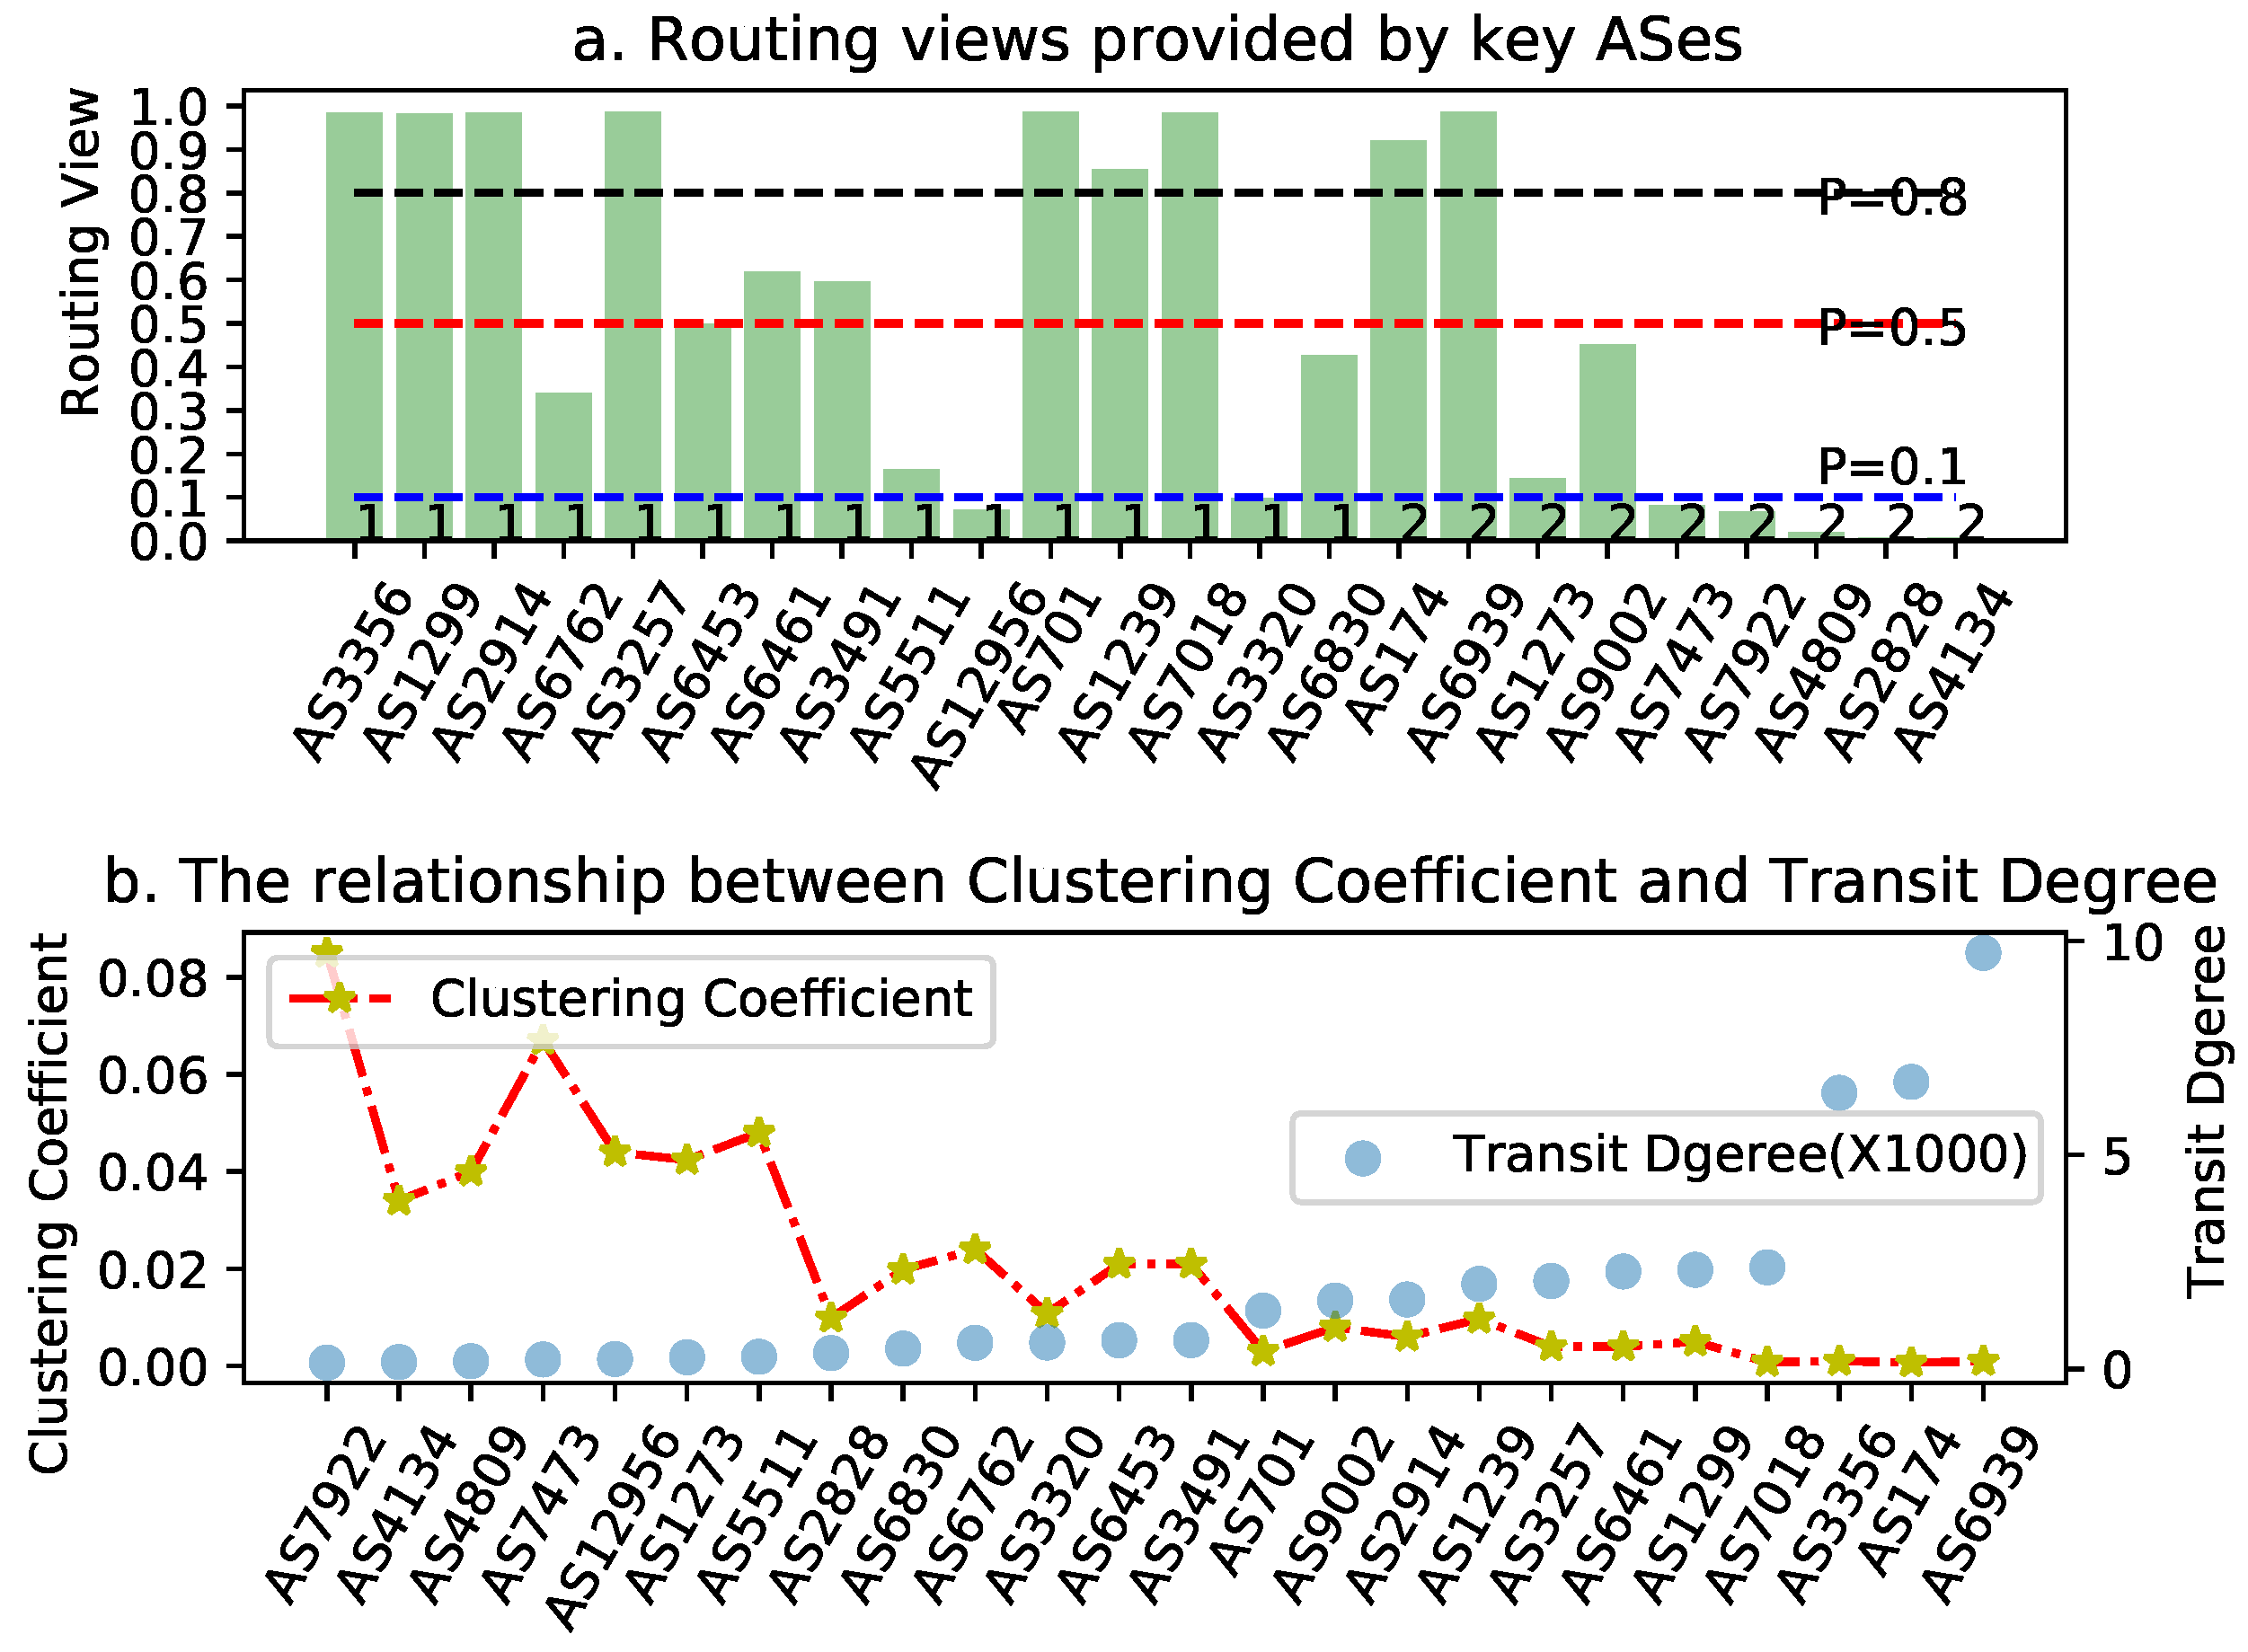
Figure 1. a, Routing views provide by key ASes. b, The relationship between Clustering Coefficient and Transit Degree.
Preprints 106460 g001
Figure 2. Neighbor Degree, Transit Degree, and Transmission Ratio of the important ASes in 2022.
Preprints 106460 g002
Figure 3. a, Ranking results based on customer cone. b, Ranking results based on Transit Degree.
Preprints 106460 g003
Figure 4. Routing view of critical AS based on hop count.
Preprints 106460 g004
Figure 5. The direct ratio R T 1 and the P2P ratio R P of the focus ASes.
Preprints 106460 g005
Figure 6. Top-down Internet Core Network Inference Algorithm for Rule-Based Filtering.
Preprints 106460 g006
Figure 7. a, Changes in the number of Core AS in the past 10 years. b, Annual change of Tier-1 AS in the past 10 years.
Preprints 106460 g007
Figure 8. a,Changes in Transit Degree of Tier-1 AS. b,Changes in Transit Degree of Region Tier-1 AS.
Preprints 106460 g008
Figure 9. “ALL” curve and the “P2C” curve of the core AS.
Preprints 106460 g009
Figure 10. The Rich-Club coefficient of the core network in the past ten years.
Preprints 106460 g010
Table 1. List of core AS in the past ten years.
Type Sub-Type ASN
Tier-1 AS Always 3356,1239,2914,174,3257,7018,6453
Sometimes 6830,701,3320,1299,6461,6762,2828,12956,5511,209,3491
Region Tier-1 AS Always 702,4134,4637,2686,5400,7922,1273,1257
Sometimes 8359,17676,2516,7473,15412,577,3292,9002,5089,8220,20485,
4837,7342,7713,4766,2119,41327,6939
Disclaimer/Publisher’s Note: The statements, opinions and data contained in all publications are solely those of the individual author(s) and contributor(s) and not of MDPI and/or the editor(s). MDPI and/or the editor(s) disclaim responsibility for any injury to people or property resulting from any ideas, methods, instructions or products referred to in the content.
Copyright: This open access article is published under a Creative Commons CC BY 4.0 license, which permit the free download, distribution, and reuse, provided that the author and preprint are cited in any reuse.
Prerpints.org logo

Preprints.org is a free preprint server supported by MDPI in Basel, Switzerland.

Subscribe

© 2024 MDPI (Basel, Switzerland) unless otherwise stated