Preprint
Article

Research on Biomass and Biochar of Reed (Phragmites australis) in U Minh Thuong National Park, Vietnam

Altmetrics

Downloads

81

Views

39

Comments

0

This version is not peer-reviewed

Submitted:

14 May 2024

Posted:

16 May 2024

You are already at the latest version

Alerts
Abstract
Reed (Phragmites autralis) is a plant species with a seasonal reproductive cycle, it has a very high biomass in U Minh Thuong National Park. This characteristic that management of forest fire is dificult in Vietnam. To evaluate height, diameter, density, growth, biomass of fresh and dry, biochar on reed plants; it include plant, stem, leaves, flowers; analysis indicators of growth, biomass, biochar on reed. compare chemical indicators of peat and biochar in U Minh Thuong and Kien Luong of Mekong Delta. Relationship of peat chemical with growth and biomass. Study adsorption from reed biochar with pig urine and inorganic chemical of nitrogen and phosphorus. Study on types of peatland thickness, each one had 5 plots, investigated height (Ht), diameter of stem (D0.0); weigh part of plants, stems, leaves and flowers. the soil samples collected on investigated 20 plots, biochar is analyzed for its chemical composition, then the biochar is adsorbed with pig urine and phosphorus and nitrogen inorganic. The results evaluated fresh biomass on parts of reed plant, dry biomass and biochar on parts of them. Results height 3.39 – 4.74 m, diemeter 1.8 – 3.17 cm, biomass 0.04 – 0.1 m3 / m2, weight 15.46 – 20.54 kg / m2. The dry weight / plant 127.34 – 358.58 g, a dry plant trunk 79.55 – 217.78 g, a dry plant leaves 33.78 – 112.16 g, a dry plant flowers 4.4 – 19.64 g. A plant Biochar 26.16 – 73.57 g, a trunk biochar 14.41 – 39.44 g, a leaf biochar 8.16 – 22.59 g, a flower biochar 2.59 – 11.54 g, Peat analysis, indicators decrease P2O5, SO42-, NH4+ and increase are pH, humic acid, N%, K2O, Fe2+. Compare biochar indicators of U Minh Thuong and Kien Luong indicators higher are 9/11 as humic acid, OM%, Ash%, C%, N%, P%, K%, Ca%, Mg%. Indicators lower are as pH and SiO. Reed biochar can adsorption the pig urine as ammonium, nitrate, nitrogen, phosphorus and it also adsorption inorganic as nitrogen and phosphorus. This discovery it is possible to propose the use of data for environment treatment and application of biochar fertilizer for agriculture in region.
Keywords: 
Subject: Chemistry and Materials Science  -   Materials Science and Technology

1. Introduction

Reed (Phragmites autralis) is a fast growing plant in U Minh Thuong Nationnal park Vietnam[10], highest biological productivity among weed species on peatland as U Minh Thuong National Park and growth of reeds in Quang Ninh on mined land has the ability to reduce some polluted metals during the mining process [4], it grows into a very thick vegetation and invades very quickly with the height to 5 meters to the point of covering the ground where it grows, reduces biodiversity of animals and plants. Biomass harvested during winter will have weaker carelations between mineras but constant morphological parameter because nutrient concerntrations above ground [12]. Especially when they mature in dry season, they die with each part of the stem, leaves and flowers, they creat amass of flamable material from 5 – 10 kilograms per one square meters, spread evenly from tree top to the ground. When is a fire, they burn on the plant tops down the leaves and then spread to the ground. Then the fire area lacks oxygen and the wind from surounding areas spreads to creats an increasing windy and fire will burn quicky and strongly. When finished burning they leave behind red charcoal fires and continue to burn underground in the peat layer and fire underground during many days causing serious damage such as U Minh Thuong National Park.
On the other hand, because reed growth has the highest annual biomass, it is also a very potential renewable resource and research on its biomass serves beneficial purposes not only in reducing the risk of forest fires but also harvest a huge amount of biomass every years.
In study boichar [5] producing rice straw and rice straw and rice husk biochar to improve soil fertility, crop producctivity and reduce greenhouse emissions. In this topic, research on reeds on peat soil in U Minh Thuong National Park, a species of plant that produces the largest amount of flammable material, it is a threat to annual forest fires, the topic will focus on research on growth, biomass of stem, leaves, flowers of frestand dry plants. Its research also made of biochar from reed plant by traditional method to produce into reed biochar.
Studies biochar [7] research on the posibility of using biochar to replace manure and inorganic fertilizers in rice production. This study also analyzed the relationship between peat soil properties and the growth and biomass of reeds on different peat soils in U Minh Thuong National Park. In research [13] The Vietnam Soil and Agrochemical) Institute requires product quality with organic content >30%, humic acid >5%, total NPK>5% and there are mixed ingredients including: Biochar, nitrogen, phosphorus, potassium fertilizer, intermediate elements, trace elements (TE), organic supplements. Reseach using biochar [7] to replace manure and ingnorganic fretilizers in rice production. It also study the chemical composition of biochar, on that basis, we will propose directions for use in treating polluted water environments and using it in agriculture by orgarnic and biologycal fertilizers in the future.
There is a relationship between soil chemical composition and biological density [11]. There is a relationship between soil chemical composition and biologicaldensity [11]. Therefore, this project also studies the chemical parameters of peat soil on distributed reed base to see the growth and biomass productivity are related to chemical indicators.
Study of Amonium and nitrat adsorption [8] Phragmites autralis biochar from aqueous solution in Persian give us look at biochar of reeds. Therefore, studying biomass and biochar of reed (Phragmites autralis) in U Minh Thuong National Park Vietnam is extremely necessary and has practical significance in this region.

2. Material and Methods

2.1. Material

The following steps:
-
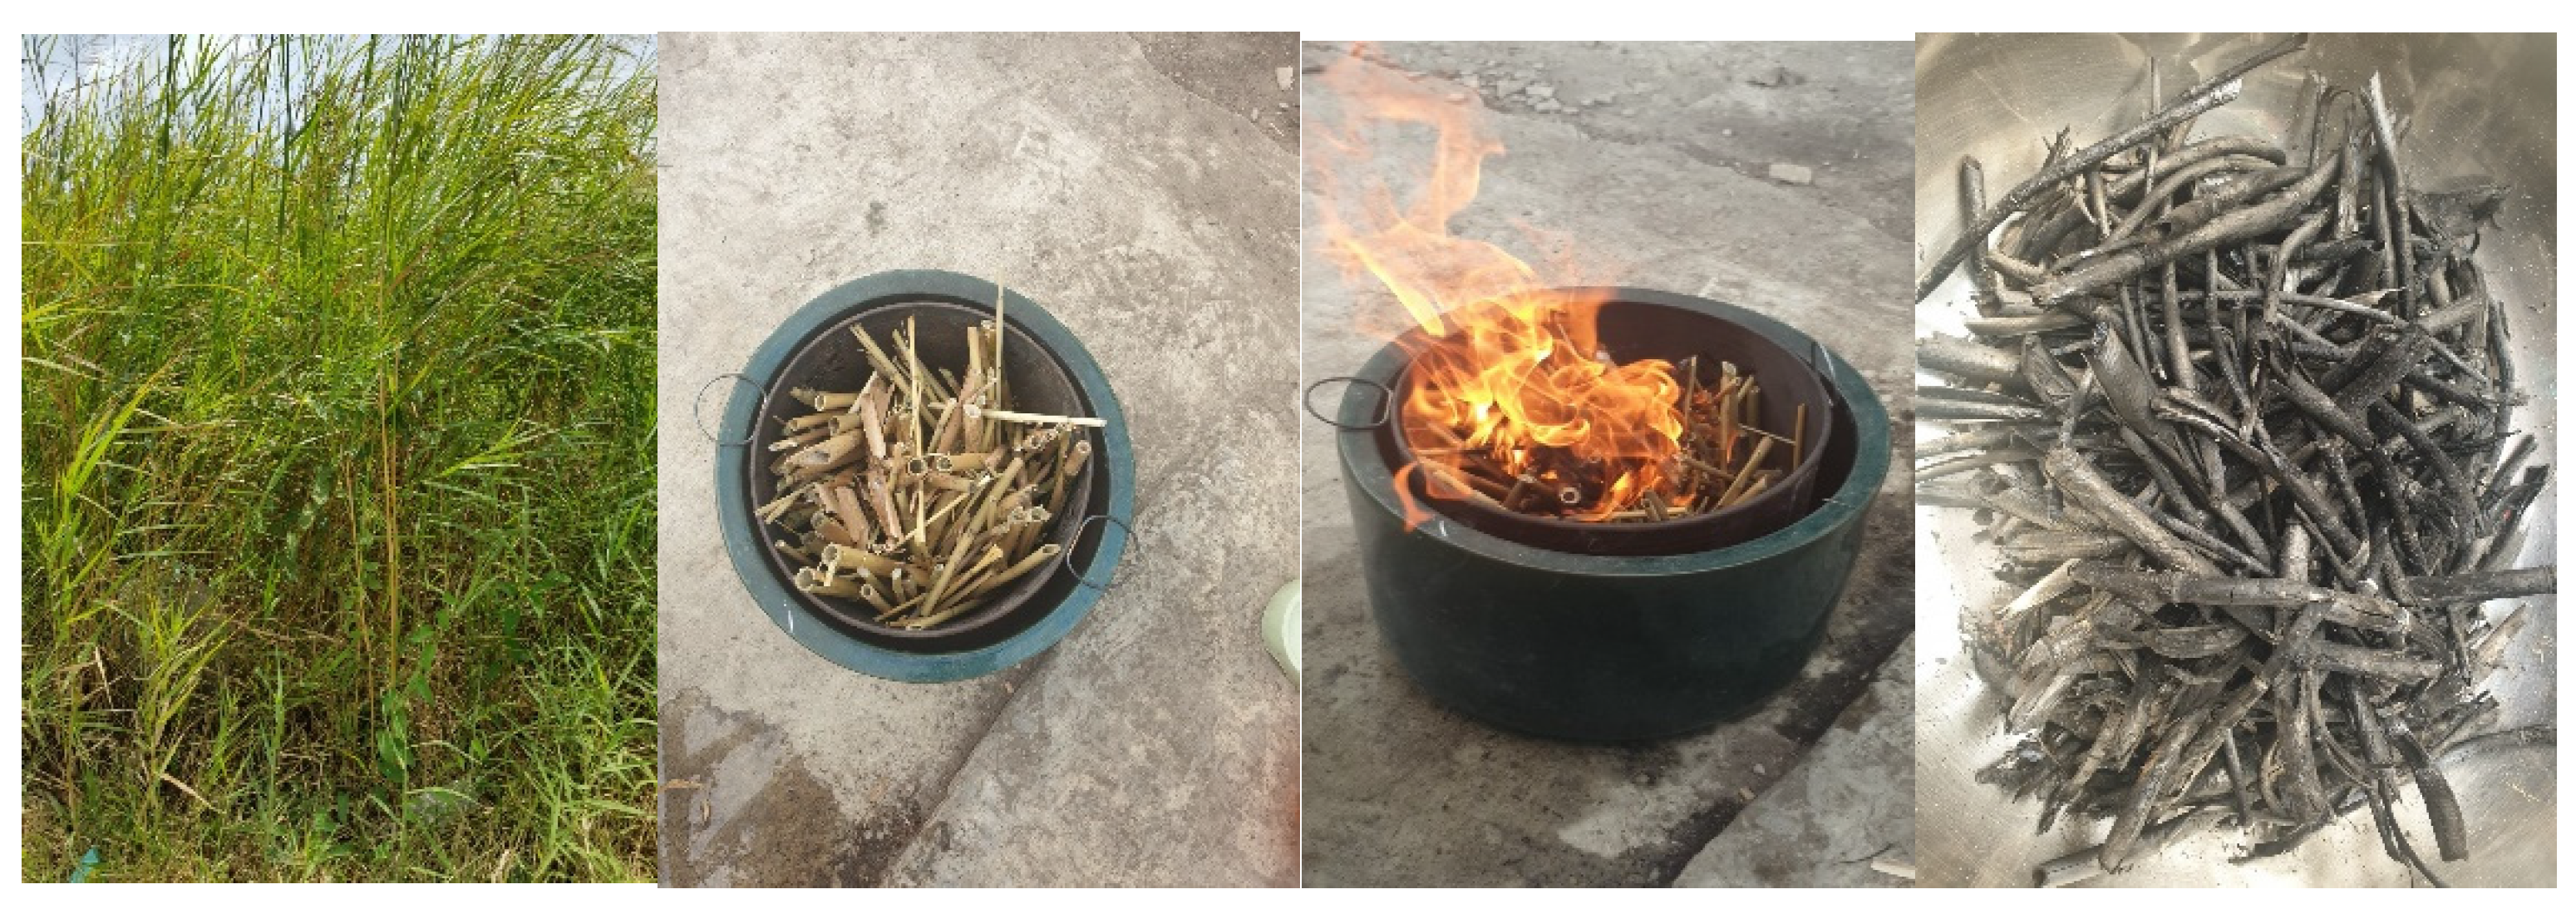
The reed plants are old plants with dry leaves and flowers during in the dry season. The plants are cut and gathered to a place. Designed traditional manual furnace. Separate the dry pát of the trunk, leaves and flowers. Burn until all the smoke is gone, then cut off the oxygen. Collect the biochar to experiment.
-
Use pig urine from the pig farm to filter through biochar
-
Use phosphorus and nitrogen from inorganic fertilizer mixed in water to filter through biochar.

2.2. Biomass Investigation

-
Types of reed vegetation on diferent peat thickness: Peat thickness: ( 0cm); (>0 – 30 cm), (>30 -60 cm); (>60 – 90 cm).
-
Each thickness selected 5 sample plots; Total plots are 20, the area of plot is 4 square meters, in each plot selected 9 reed plants to mearsure them. The indicators of to measure including: the height of plants (H), the diameter at ground of it (D0.0), number of plants in per one meter (N/m2).
-
In 20 sample plots on 4 peat thickness, in a plot select total 9 plants (3 shortest plants, 3 medium plants, 3 highest plants), cut it from the ground, then write number of plant and number plot to take them to the laboratory, then take divide the trunk, leaves, flowers and weigh them invidual each other. After take divide at still fresh weigh them before, next step dry them until the weight is not change at that weigh the dry trunk, dry leaves and dry flower of reed. The third step is burn the trunk, leaves, flowers in the designed biochar burner
-
Determination of fresh plant biomass by weigh total fresh plants (Wft), weigh fresh plant trunks (Wftr), weigh fresh leaves (Wfl), weigh fresh flowers (Wff), unit of weigh is gram (g).
-
Determination of dry plant biomass by weigh total dry plant (Wdt), weigh dry plant trunk (Wdtr), weigh dry plant leaves (Wdfl), weigh dry plant flowers (Wff), unit of weigh is gram (g).
-
Determination of plant biochar by weigh total plant biochar (Wbt), weigh plant trunk biochar (Wbtr), weigh leave biochar (Wbl), weigh plant flower biochar (Wff), unit of weigh is gram (g). (Figure 1)

2.3. Soil Investigation

Based on the high distribution map of peat soil, 20 soil investigation plots were established [9]. Using a hand drill to collect samples, a total of 20 plots were set up to survey the growth of the reed at three different peat thickness levels. There were 5 plots for the thickness 4 level, 0 cm 5 plots, from 5- 30 cm 5 plots; 30 – 60cm 5 plots, from 60 - 90 cm 5 plots (20 plots in total). Each site to collect samples is three [6], and each sample is one kilograms and coded a mumber of the site as UTM1, UTM2, UTM3, UMT4 [3], following the same name of the survey plots, then gets them to the laboratory of Southern Institute of Forestry Science for analysis.
The characteristics of the peat soil were evaluated through the indicators: pH (H2O); Humus (%), Total nitrogen (%), P2O5 (%), K2O (%), Fe2+ (mg/100 g), SO4+ (mg/100 g), humic acid (%). The analysis method of pH (H2O) were determined with a pH meter. Humus content and humic acid were evaluated by Walkley Black [3], total nitrogen by the Kjeldhahl method [3]. P2O5 was indicated by the colorimetric method. All indications were analyzed at the laboratory of the Southern Forest Sciences Institute and the Laboratory of Kien Giang University.

2.4. Reed Biochar Chemical Indicators

Biochar analysis include indicators: pH, Humic acid %, C%, OM%, N% total, P% total, K% total, Ca%, Mg%, Ash %. All of indicators analyzed follow the soil analysis as above.

2.5. Data Analysis

The analysis involves using t-tests and one-way analysis of variance (ANOVA) to compare the mean differences between peat and reed growth on the different thickness levels of peat [1]. Correlation analysis using the Pearson correlation coefficient described the interdependence between peat quality and the development of reed plants. A correlation is considered significant when the p-value is less than 0.05, and the correlation coefficient (r) is more significant than 0.5 in absolute value [2]. The analysis focused on the relationship between the peat environment indicators and the growth of reed plant on different peat thicknesses. Spearman’s correlation coefficient was used for analysis, and the significance level will be set at α=0.05 [2]. If the correlation coefficient of the variable (peat) levels is significant, hypothesis How will be rejected, indicating a correlation between peat characteristics and reed plant growth.
The characteristics of the biochar on reed plants were evaluated through the indicators: pH(H2O), Humidity, humic acid (%), organic matter OM(%), C (%), N(%), P(%), K(%), Ca(%), Mg(%), SiO2(%), The analysis methods of pH by measuring the extration ratio 1: 2.5; K%, Ca%, Mg% mearsured with an atomic absorption machine; Silic mearsured according to method of AOAC (Asociation of analytical communities); Nitogen measured according to method Kjeldahl; Phosphorus measured by wavelength colormetric method; Ash calculated by ashing method.
Data processing, including statistical calculations, description, test hypotheses, and graph drawing, was performed using Microsoft Excel 2016, Statgraplies Centurion 19.12, and IBM SPSS Statistic version 20.0 [1].

3. Results and Discussion

3.1. Research Results of Growth and Fresh Biomass

  • Comments:
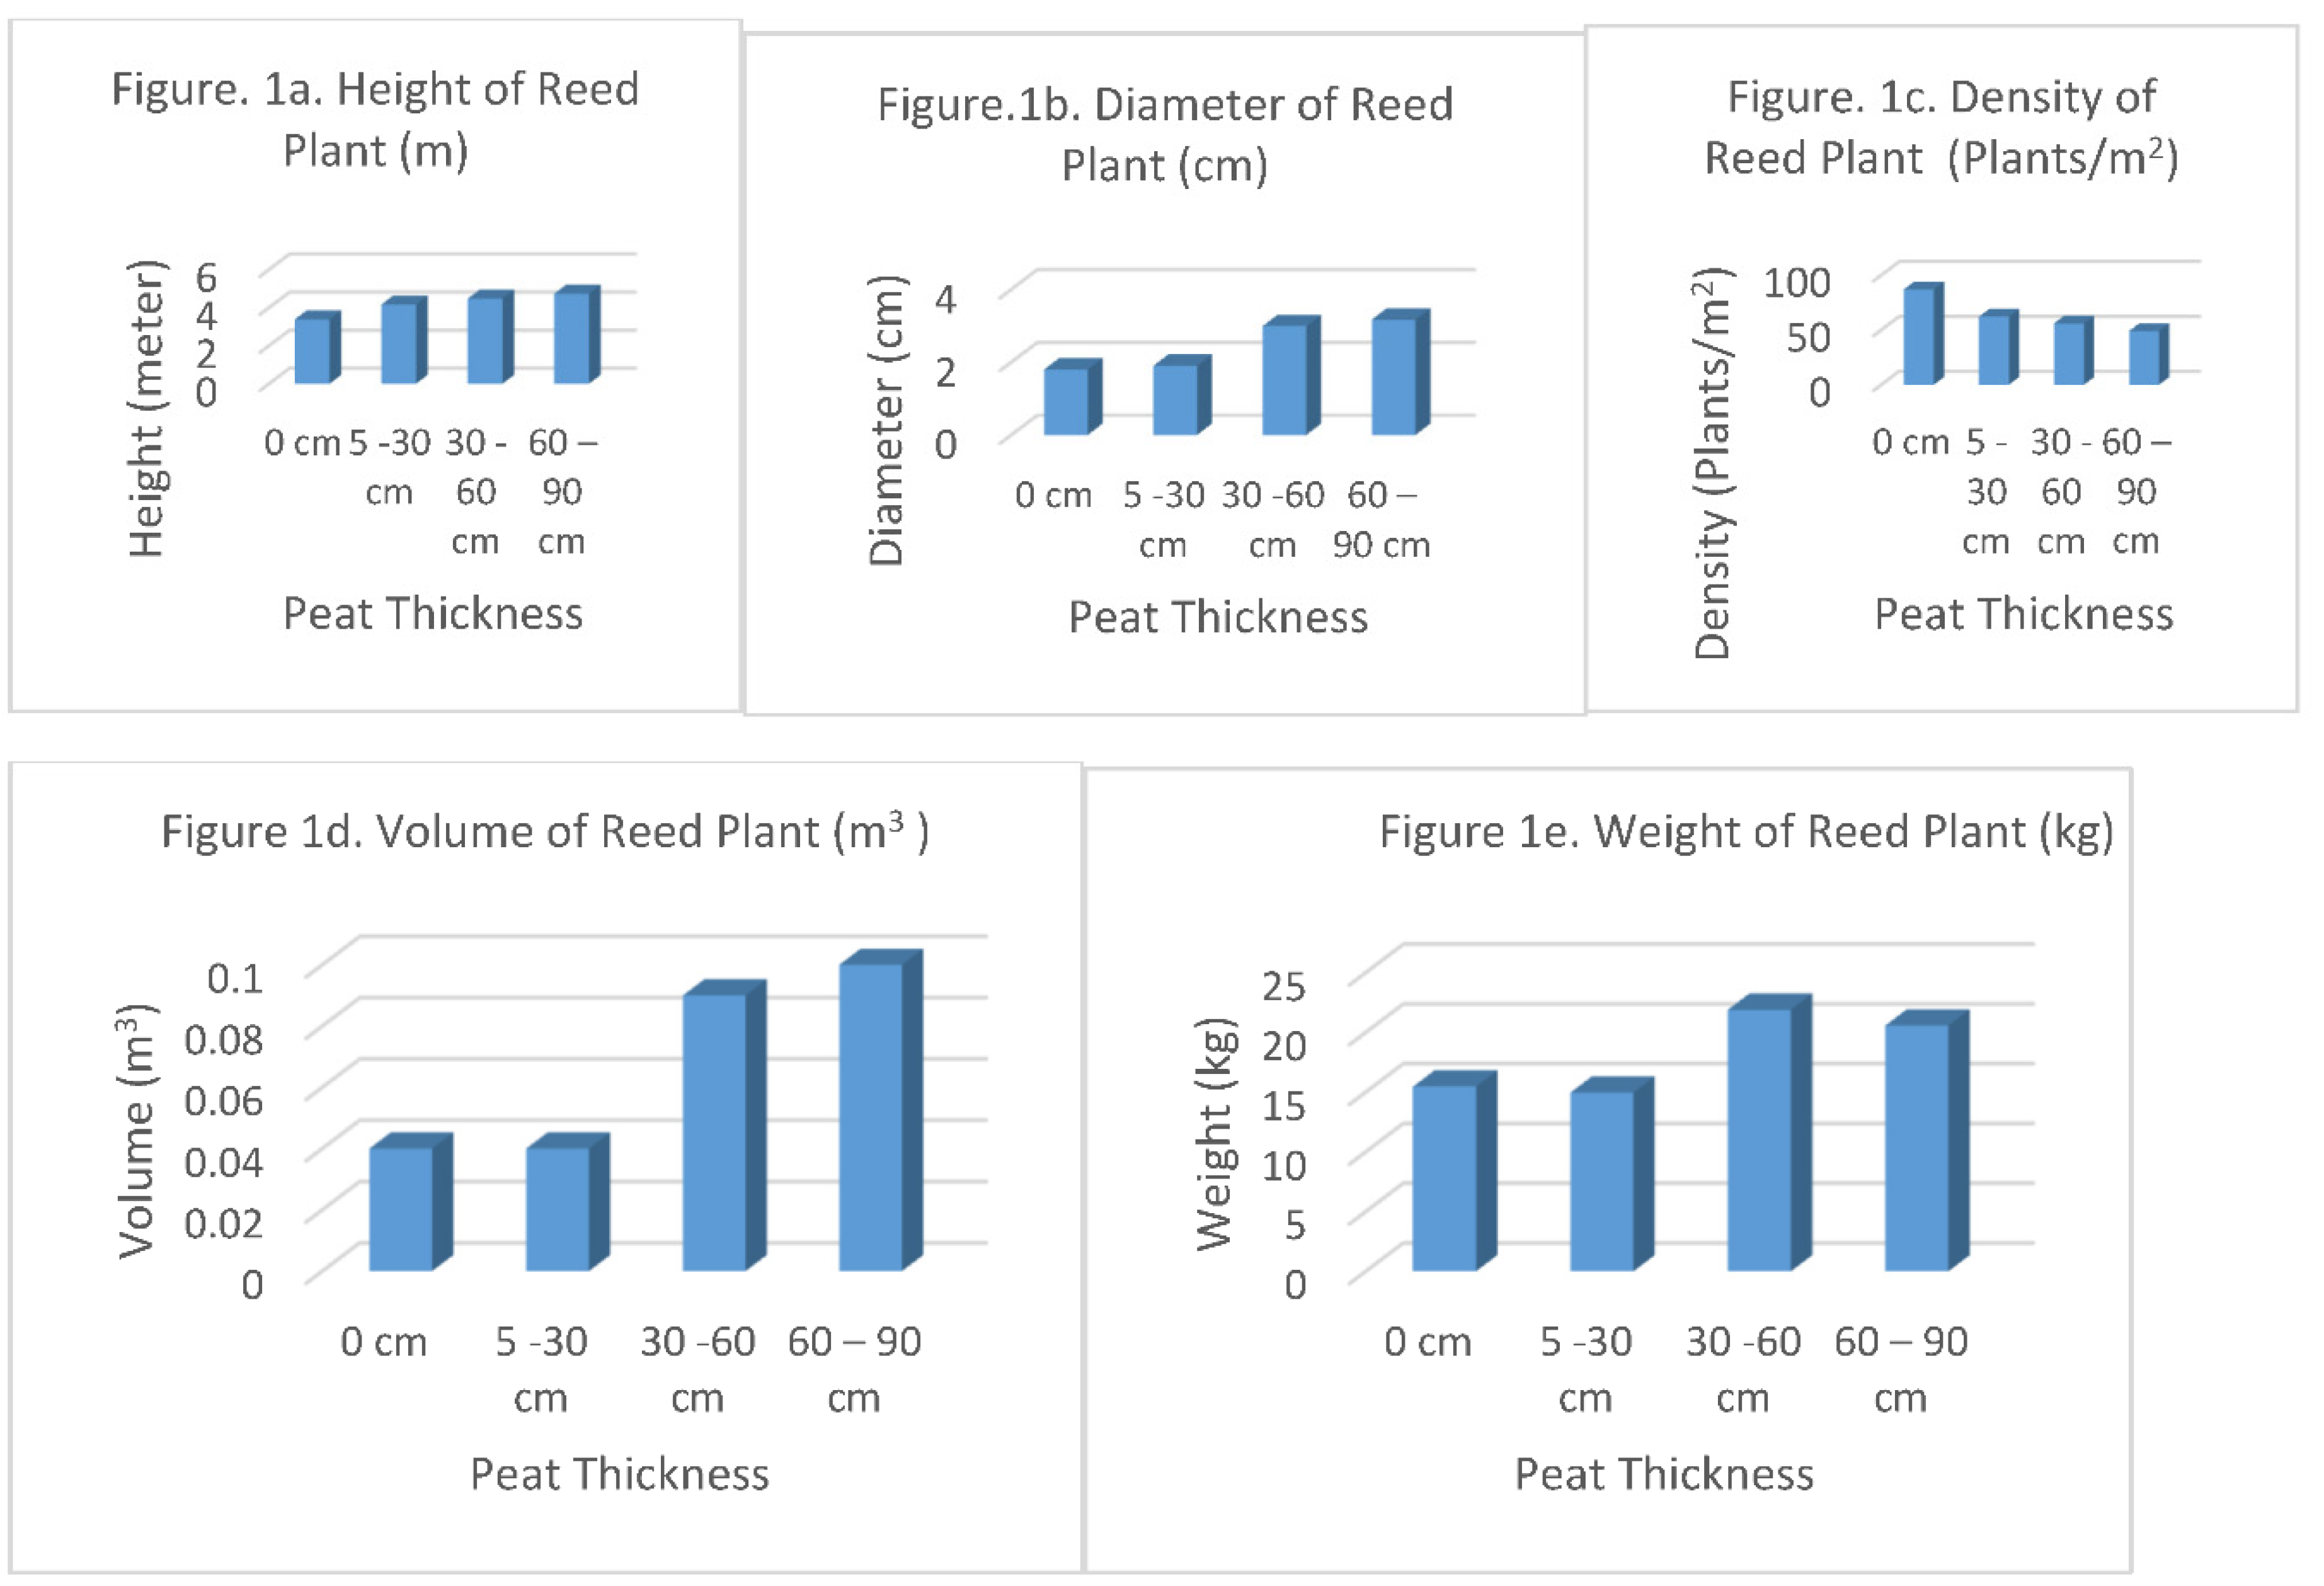
The height of reed (Table 1) at the thickness of 0 centimeter (cm) is 3.39 cm; from 5 – 30 cm is 4.19 cm; from 30 – 60 cm is 4.48 cm; from 60 – 90 cm is 4.47 cm. The diameter (Figure 1b) at ground of reed plant on 0 cm peat thickness is 1.8 cm; at the peat thicness from 5 – 30 cm is 1.9 cm; from 30 – 60 cm is 2.99 cm; from 60 – 90 cm is 3.17 cm. The density of reed plant on the square meters showed at peat thickness 0 cm is 87 plants per m2, at thickness 5 – 30 cm is 62 plants, at thickness 30 – 60 cm is 56 plants and the thickness from 60 – 90 cm is 49 plants. The volume of the reed trunk with 0cm peat thickness on 1 square meters is 0.04 cubic meters, from 5 – 30 cm peat thickness is 0.04 cubic meters, from 30 – 60 cm peat thickness is 0.09 cubic meters per 1 square meter, from 60 -90 cm peat thickness is 0.10 cubic meter per 1 square meter. The weight of reed plant at the 0 cm peat thickness is 15.46 kilogarms per 1 square meter, from 5 -30 cm peat thickness is 14.96 kilograms per 1 square meter, from 30 - 60 cm peat thickness is 21.90 kilograms; from 60 – 90 cm peat thickness is 20.58 kilograms per 1 square meter.
Figure 1. (Figure 1a, Figure 1b, Figure 1c, Figure 1d, Figure 1e) Height, Diameter, Density, Volume and Weight of Reed Plant.
Preprints 106493 g002
Statistical analysis with ANOVA the investigated indicators were all significantly diferent at the α = 0.05, the p-value of indicators had less than 0.001.
In general:
Growth indicators increase with peat thickness such as height, stem diameter volume and biomass of reed plant. The result (Table 1) Showed the Reed height is highest of grass from 3.39 meters to 4.74 meters; the diameter of plant is very big of grass form 1.8 – 3.17 centimeters, the density also very high from 49 – 87 plants per m2, the volume 0.04 – 0.1 m3/m2 equivalent to 400 m3 per hectare (ha) to 1000 m3/ha a volume huge biological productivity and weigh from 15.46 – 20.58 kg/m2 equivalent to 154.600 – 205.810 kg/ha, biological is huge.
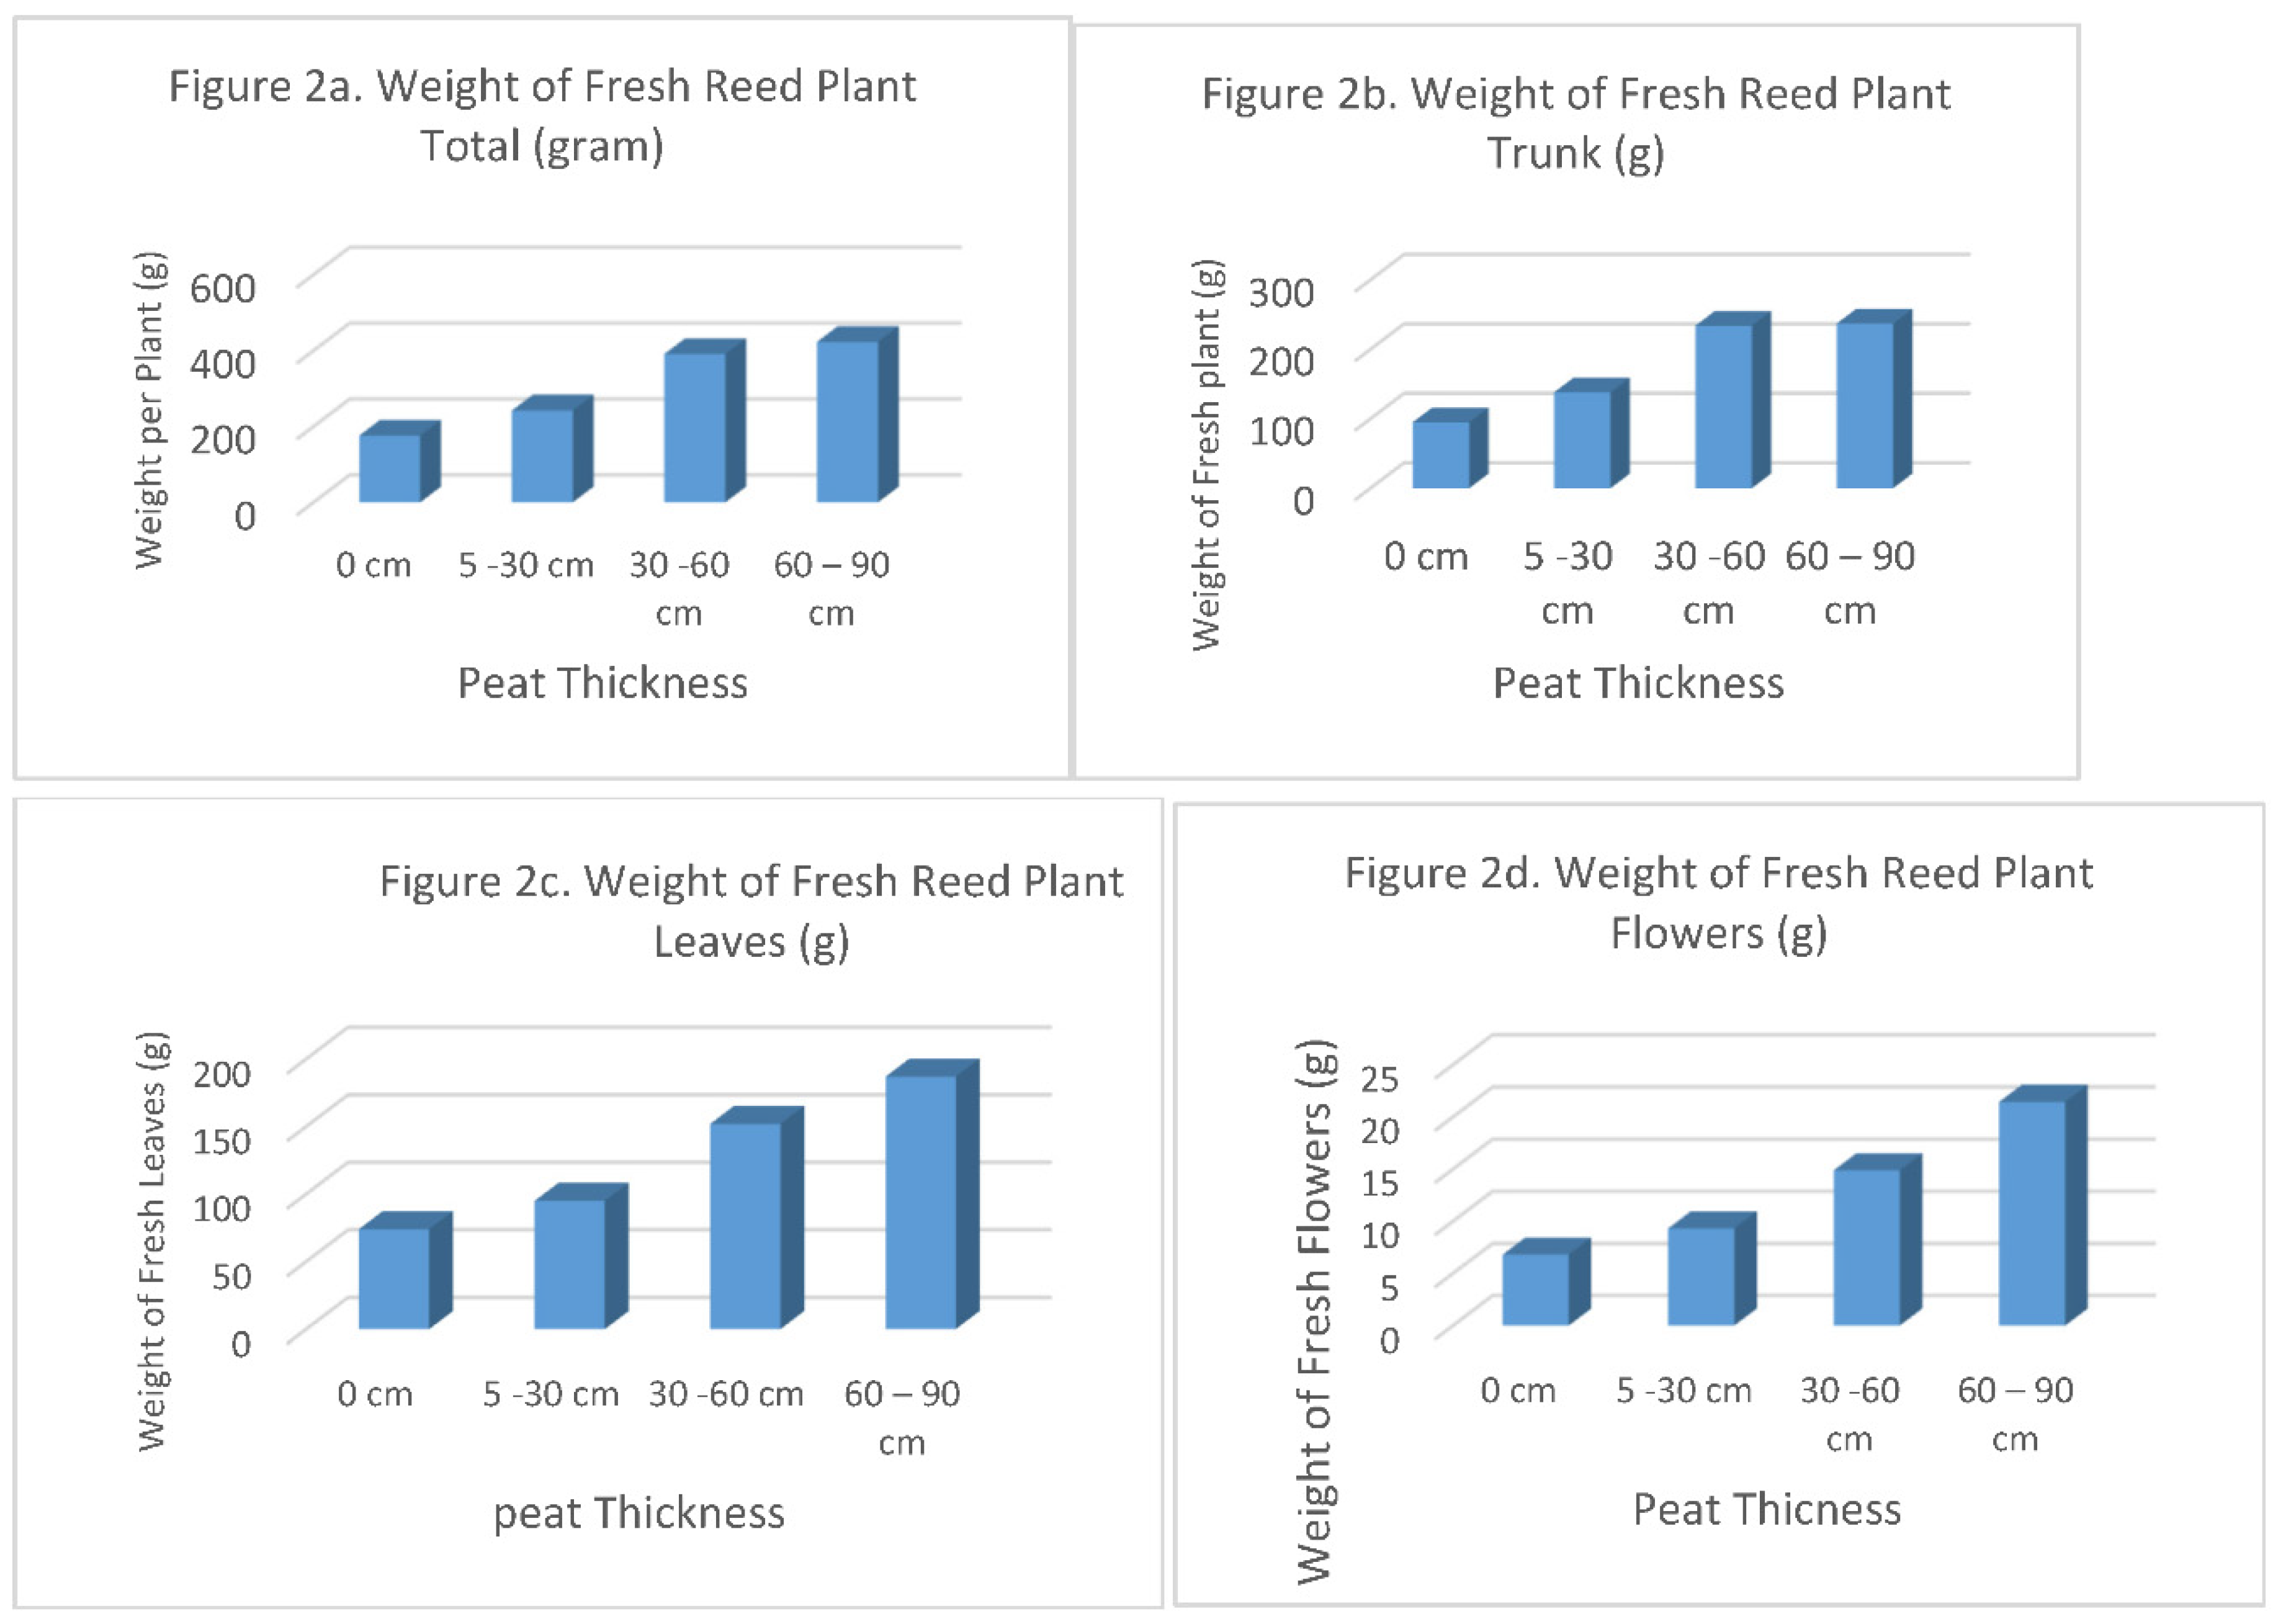
Gigure 2. (Figure 2a, Figure 2b, Figure 2c, Figure 2d) Weight of Fresh Plant, Trunk, Leaves and Flowers.
Preprints 106493 g003
  • Comments:
The fresh plant biomass (Table 2) showed such as: The weight of fresh reed of plant total (Wft) per plant at the 0 cm peat thickness is 176 grams; from 5 – 30 cm peat thickness is 242 grams, from 30 – 60 cm peat thickness is 391 grams, from 60 – 90 cm peat thickness is 423 grams; the weight of the fresh reed trunk (Wftr) at 0 cm peat thicness is 95 grams per plant, from 5 – 30 cm peat thickness is 138 grams; from 30 -60 cm peat thickness is 234 grams; from 60 – 90 cm peat thickness is 237 grams; the weight of the fresh reed leaves at the 0 cm peat thickness is 74 grams per plant; from 5 - 30 cm peat thickness is 95 grams; from 30 – 60 cm peat thickness is 152 grams; from 60 - 90 cm peat thickness is 187 grams. The weight of fresh reed flowers (Wff) at the 0 cm peat thickness is 6.8 grams per plant; from 5 – 30 peat thickness is 9.31 grams; from the 30 – 60 cm peat thickness is 14.87 grams; from 60 – 90 cm peat thickness is 21.44 grams.
Statistical analysis with ANOVA the investigated indicators were all significantly diferent at the α = 0.05, the p-value of indicators had less than 0.001.
  • In general:
The weight indicators increase with peat thickness such as weight of fresh reed plant total (Wft), fresh trunk of reed plant (Wftr), fresh leaves of reed plant (Wfl), fresh flowers of reed plant; these indicators increase with peat thickness. The result showed (Table 2) and (Figure 2a,Gigure 2b, Figure 2c, Figure 2d) weight of a plant from 176 – 423 grams, a plant stem from 95 – 237 grams, a plant leaves from 74 – 187 grams, a plant flowers from 6.8 – 21.44 grams. This result showed the trunk have weight is highest.

3.2. Dry Biomass

  • Comments:
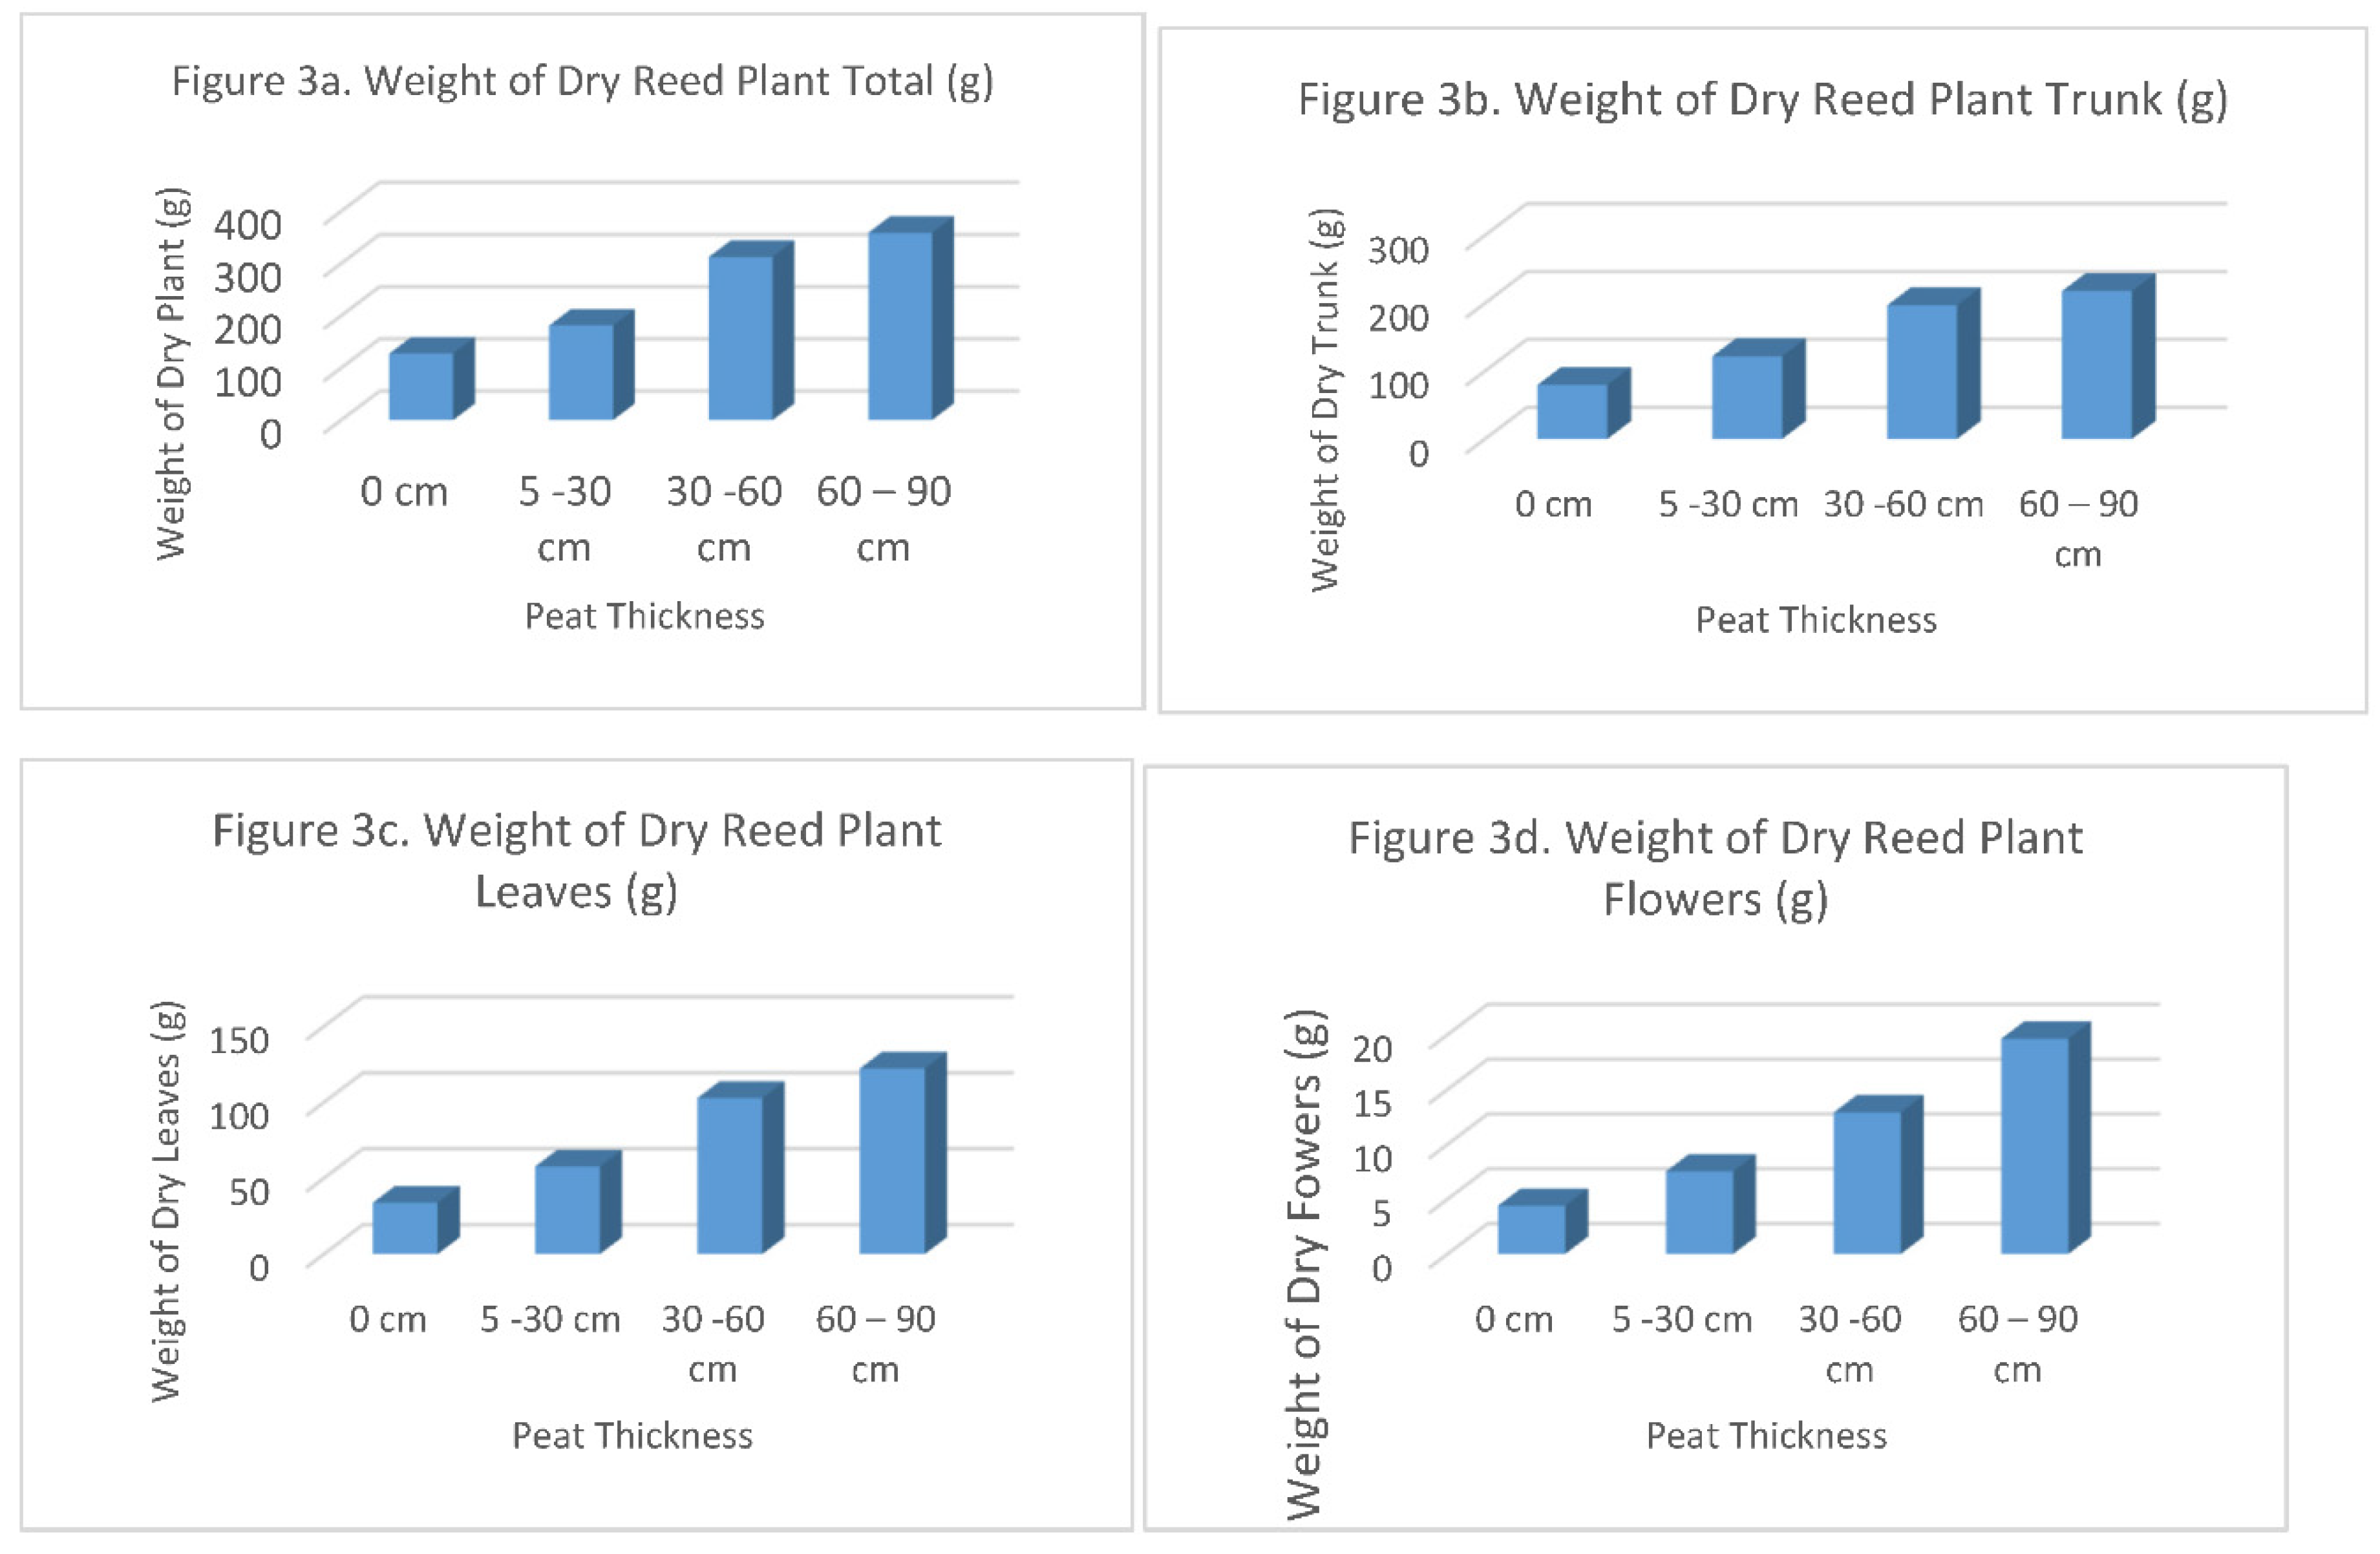
The dry plant biomass (Table 3) showed: The dry biomass total per plant (Wdt) at 0 cm peat thickness per plant is 127.34 grams, from 5 – 30 cm is 181.01 grams, from 30 – 60 cm is 312.42 grams, from 60 -90 cm is 358.58 grams; The dry biomass of plant trunk (Wdtr) at 0 cm peat thickness per plant is 79.55 grams, from 5 – 30 cm is 121.84 grams, from 30 – 60 cm is 196.78 grams, from 60 -90 cm is 217.78 grams. The dry biomass of plant leaves at the 0 cm peat thickness per plant is 33.78 grams, from 5 – 30 cm is 57.64 grams, 30 – 60 cm is 102.73 gram, form 60 – 90 cm is 122.16 grams. The dry biomass of plant flowers at 0 cm peat thickness per plant is 4.4 grams, from 5 - 30 cm is 7.53 gram, from 30 – 60 cm is 12.91 grams, from 60 – 90 cm is 19.64 grams.
Gigure 3. (Figure 3a, Figure 3b, Figure 3c, Figure 3d) Weight of dry Plant, Trunk, Leaves, Flowers.
Preprints 106493 g004
Statistical analysis with ANOVA the investigated indicators were all significantly diferent at the α = 0.05, the p-value of indicators had less than 0.001.
In general:
The weight indicators increase with peat thickness such as weight of dry reed plant total (Wdt), dry trunk of reed plant (Wftr), dry leaves of reed plant (Wfl), dry flowers of reed plant; these indicators increase with peat thickness. The results showed (Table 3, Figure 3), a dry plant from 127.34 – 358.58 grams, a dry plant stem from 79.55 – 217.78 grams, a dry plant leaves from 33.78 – 122.16 grams, a dry plant flowers from 4.4 – 19.64 grams. This results showed the trunk is highest.

3.3. Biochar of Reed in U Minh Thuong

  • Comments:
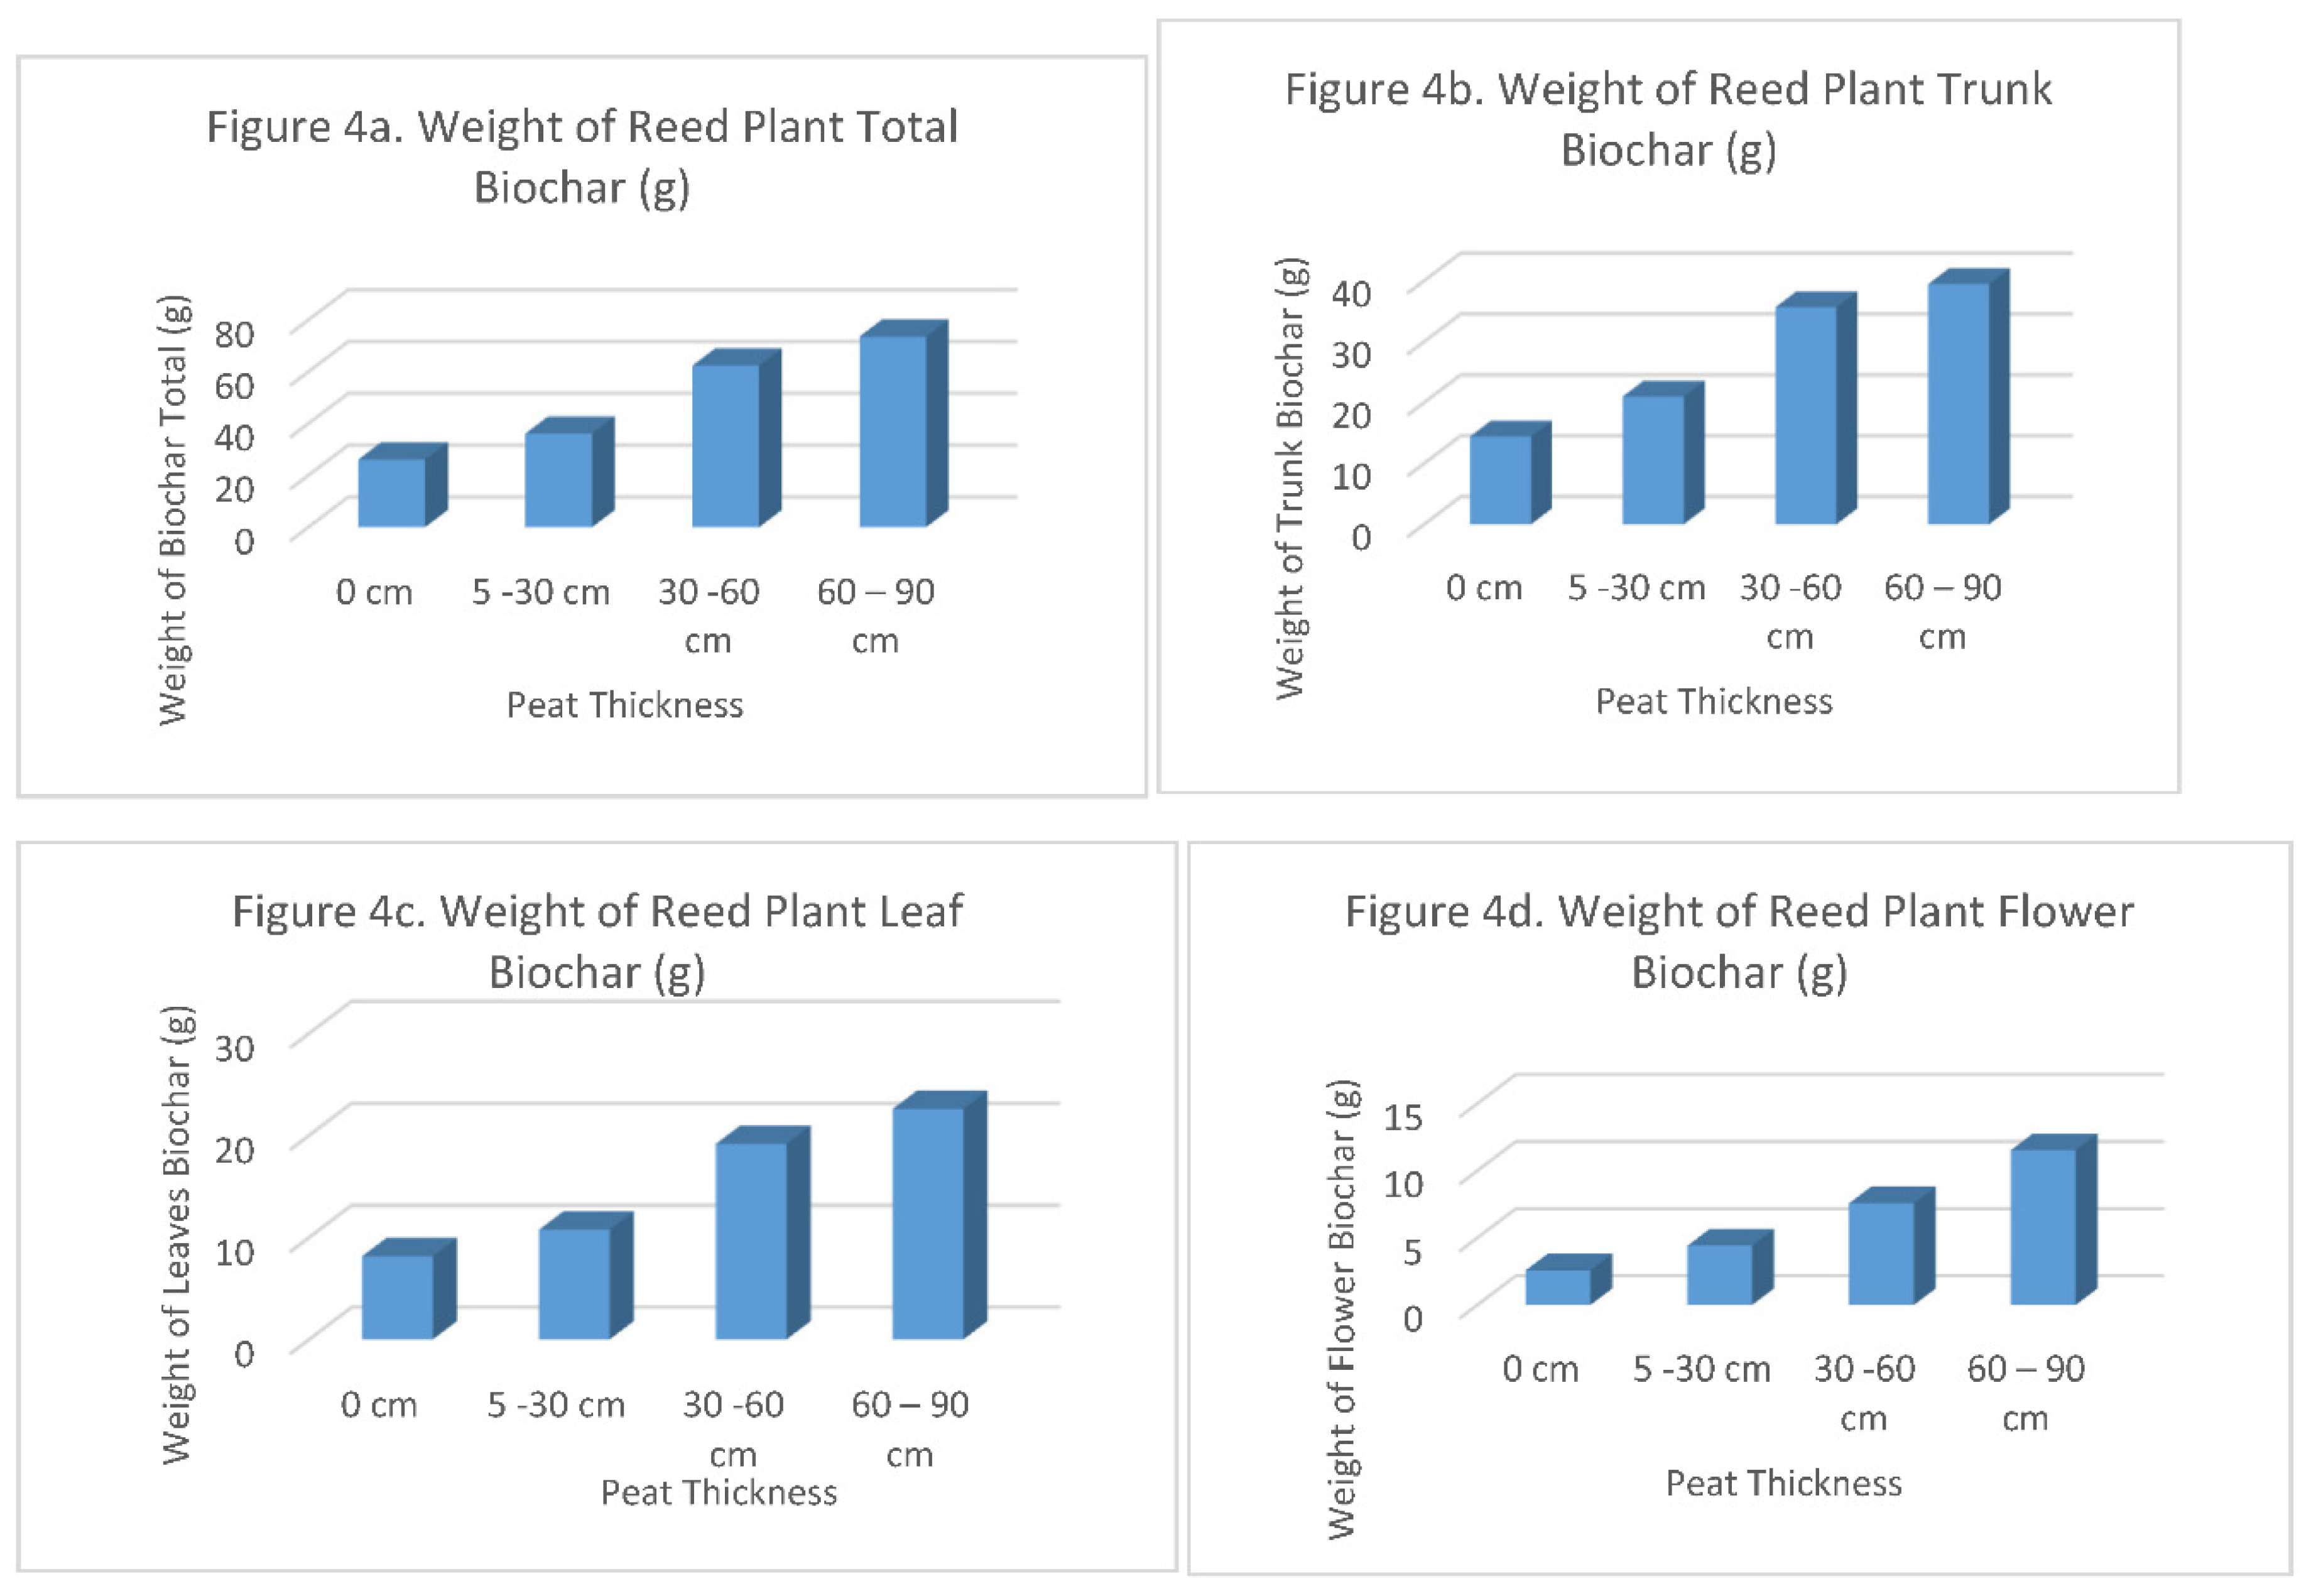
The reed plant biochar (Table 4) and (Figure 2) showed: The reed biochar total per plant (Wbt) at 0 cm peat thickness per plant is 26.16 grams, from 5 – 30 cm is 36.15 grams, from 30 – 60 cm is 62.37 grams, from 60 -90 cm is 73.57 grams; The reed biochar of plant trunk (Wbtr) at 0 cm peat thickness per plant is 14.41 grams, from 5 – 30 cm is 20.98 grams, from 30 – 60 cm is 35.64 grams, from 60 -90 cm is 39.44 grams. The reed biochar of plant leaves at the 0 cm peat thickness per plant is 8.16 grams, from 5 – 30 cm is 10.75 grams, 30 – 60 cm is 19.16 grams, form 60 – 90 cm is 22.59 grams. The reed biochar of plant flowers at 0 cm peat thickness per plant is 2.59 grams, from 5 - 30 cm is 4.42 gram, from 30 – 60 cm is 7.58 grams, from 60 – 90 cm is 11.54 grams.
Figure 4. (Figure 4a, Figure 4b, Figure 4c, Figure 4d) Weight of Plant, Trunk, Leaf, Flower Biochar.
Preprints 106493 g005
Statistical analysis with ANOVA the investigated indicators were all significantly diferent at the α = 0.05, the p-value of indicators had less than 0.001.
In general
The weight indicators increase with peat thickness such as weight of the reed biochar of plant total (Wbt), weight of the reed biochar the reed trunk (Wbtr), the leaf biochar of reed plant (Wbl), the flower biochar of reed plant (Wbf); these indicators increase with peat thickness. The results showed (Table 4), (Figure 2), (Figure 4), a plant biochar from 6.16 – 73.57 grams, a plant trunk biochar from 14.41 – 39.44 grams, a plant leaf biochar from 8.16 – 22.59 grams and a plant flower biochar 2.59 – 11.54 grams.
This results show (Table 4) the effctiveness of biochar is as follows: A dry plant/a plant biochar (a dry plant weight give a plant biochar) from 123.34/26.16 – 358.58/73.57 grams, a dry plant trunk/a trunk biochar from 79.55/14.41 – 217.78/39.44 grams, a dry plant leaves/a plant leaf biochar from 33.78/8.16 – 122.16/22.59 grams, a dry plant flowers/a plant flower biochar from 4.4/2.59 – 19.64/11.54 grams.
The results of biocharyeild from dry plants are as follows: Biochar made a total dry plant from 16.62 – 20.52%, made a dry plant trunk from 18 – 18.11%, made a dry plant leaves from 18.49 – 24.16%, made a dry plant flowers from 58.76 – 58.86%, this results, the stem and the leaves is very imfortance are from 18 – 24%.
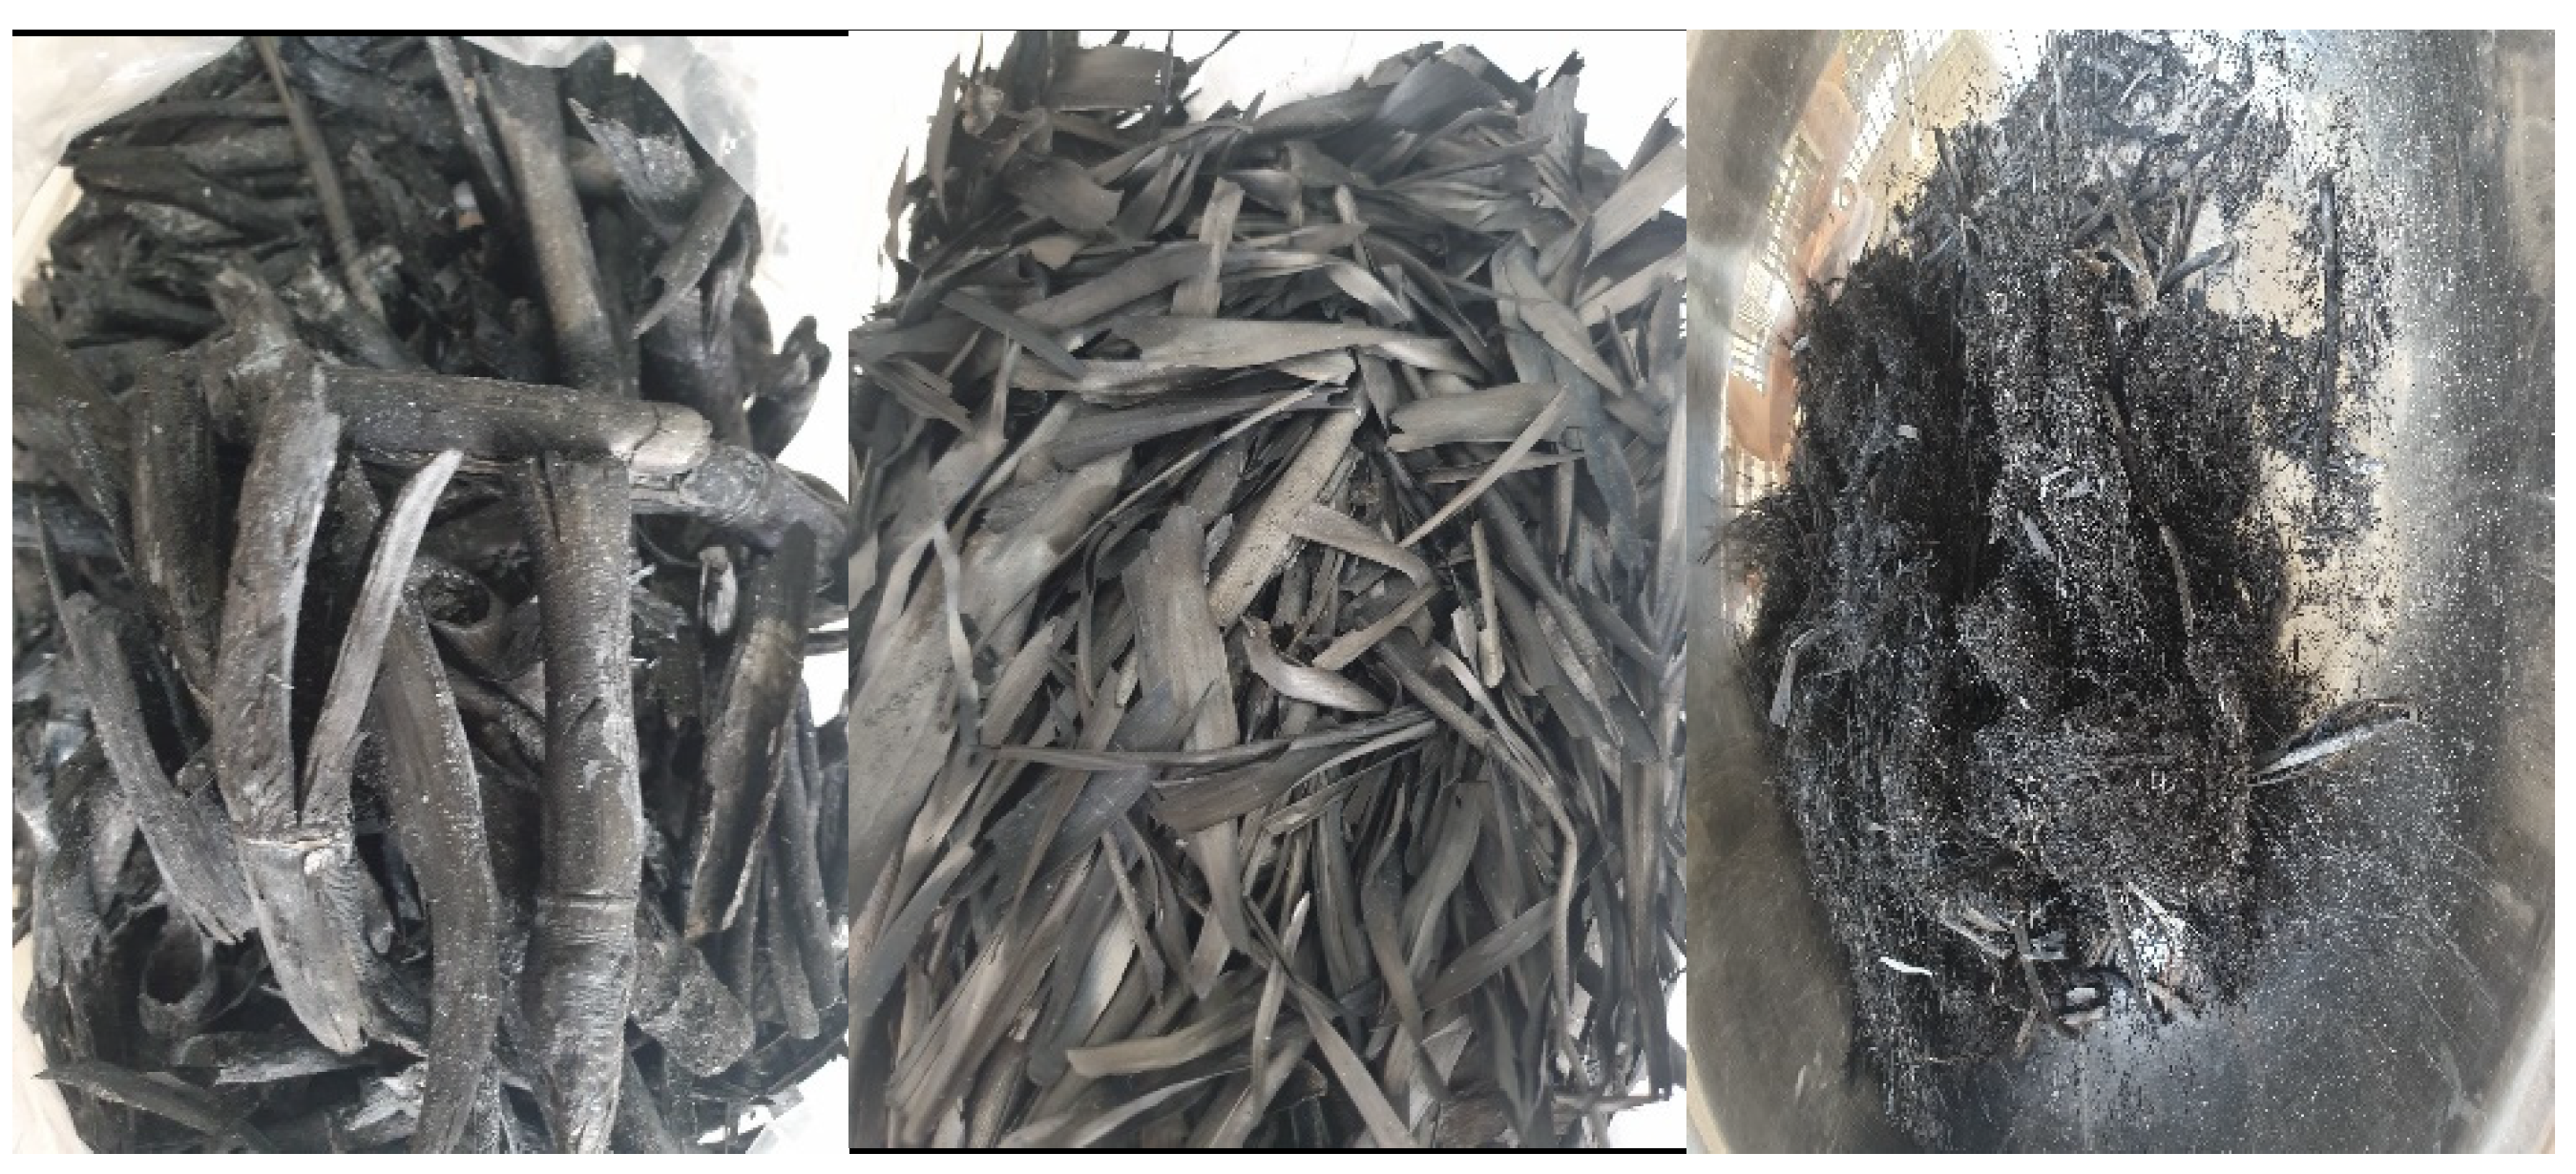
Figure 2. Reed biochar of trunk, leaves and flowers.
Preprints 106493 g006

3.3. Characteristic of Peat Soil Thickness in U Minh Thuong

  • Comments:
Analysis of biochar chemical indicators in U Minh Thuong (Table 5) showed: The indicators such as humic acid increase with peat thickness from 0 cm to 90 cm, from 6.06 – 18.85%; SO42- from 0.082 mg/100g to 0.036 mg/100g; P2O5 from 0.119% to 0.063 %; NH4+ from 17.4 mg/100g to 13.9 mg/100g; pH from 4.1 to 4.47; nitrogen total from 0.17 to 0.72%; K2O from 0.12 – 0.5 %; Fe2+ from 0.82 mg/100g to 3.58 mg/100g.
Statistical analysis with ANOVA the investigated indicators were all significantly different at the α = 0.05, the p-value of indicators had less than 0.001.
Chemical indicators that increase as peat thickness are humic acid, total nitrogen, potassium and Fe2+; Chemical indicators that decrease as peat thickness increase are SO42-, P2O5, NH4+

3.4. Relationship between Peat Soil Chemical Indicators with Growth and Biomass of Reed

  • Comments:
The relationship between humic acid with growth indicators (Table 6) showed: The height, diameter of trunk; indicators (including fresh, dry, biochar) of weight on reed plant total, weight of reed on plant trunk, weight of reed on plant leaves, weight of reed on plant flowers.
One class linear regression results showed the relationship of indicators with humic acid by R (from 0.79 to 0.96), N = 20, α < 0.0000, the relationship between them is very close. It is determined by corelation equation in (Table 6)
  • Comments:
The relationship between SO42- with growth indicators (Table 7) showed: The indicators the height, diameter of trunk; Indicators (including fresh, dry, biochar) of weight of reed on plant total, weight of reed on plant trunk, weight of reed on plant leaves, weight of reed on plant flowers.
One class linear regression results showed the relationship of indicators with SO42- by R (from 0.81 to 0.93), N = 20, α < 0.0000, the relationship between them is very close. It is determined by corelation equation in (Table 7)
  • Comments:
The relationship between P2O5 with growth indicators (Table 8) showed: The indicators the height, diameter of trunk; Indicators (including fresh, dry, biochar) of weight of reed on plant total, weight of reed on plant trunk, weight of reed on plant leaves, weight of reed on plant flowers.
One class linear regression results showed the relationship of indicators with P2O5 by R (from 0.87 to 0.96), N = 20, α < 0.0000, the relationship between them is very close. It is determined by corelation equation in (Table 8)
  • Comments:
The relationship between NH4+ with growth indicators (Table 9) showed: The indicators the height, diameter of trunk; Indicators (including fresh, dry, biochar) of weight of reed on plant total, weight of reed on plant trunk, weight of reed on plant leaves, weight of reed on plant flowers.
One class linear regression results showed the relationship of indicators with NH4+ by R (from 0.85 to 0.98), N = 20, α < 0.0000, the relationship between them is very close. It is determined by corelation equation in (Table 9)
  • Comments:
The relationship between NH4+ with growth indicators (Table 10) showed: The indicators the height, diameter of trunk; Indicators (including fresh, dry, biochar) of weight of reed on plant total, weight of reed on plant trunk, weight of reed on plant leaves, weight of reed on plant flowers.
One class linear regression results showed the relationship of indicators with NH4+ by R (from 0.32 to 0.65), N = 20, α < 0.0000, the relationship between them is from little to moderate corelation. It is determined by corelation equation in (Table 10)
  • Comments:
The relationship between Nitrogen total with growth indicators (Table 11) showed: The indicators the height, diameter of trunk; Indicators (including fresh, dry, biochar) of weight of reed on plant total, weight of reed on plant trunk, weight of reed on plant leaves, weight of reed on plant flowers.
One class linear regression results showed the relationship of indicators with Nitrogen total by R (from 0.88 to 0.99), N = 20, α < 0.0000, the relationship between them is very close. It is determined by corelation equation in (Table 11)
  • Comments:
The relationship between K2O with growth indicators (Table 12) showed: The indicators the height, diameter of trunk; Indicators (including fresh, dry, biochar) of weight of reed on plant total, weight of reed on plant trunk, weight of reed on plant leaves, weight of reed on plant flowers.
One class linear regression results showed the relationship of indicators with K2O by R (from 0.87 to 0.99), N = 20, α < 0.0000, the relationship between them is very close. It is determined by corelation equation in (Table 12)
  • Comments:
The relationship between Fe2+ with growth indicators (Table 13) showed: The indicators the height, diameter of trunk; Indicators (including fresh, dry, biochar) of weight of reed on plant total, weight of reed on plant trunk, weight of reed on plant leaves, weight of reed on plant flowers.
One class linear regression results showed the relationship of indicators with Fe2+ by R (from 0.85 to 0.98), N = 20, α < 0.0000, the relationship between them is very close. It is determined by corelation equation in (Table 13)

3.3. Compare the Chemical Indicators of Peat and Biochar in U Minh Thuong National Park

  • Comments:
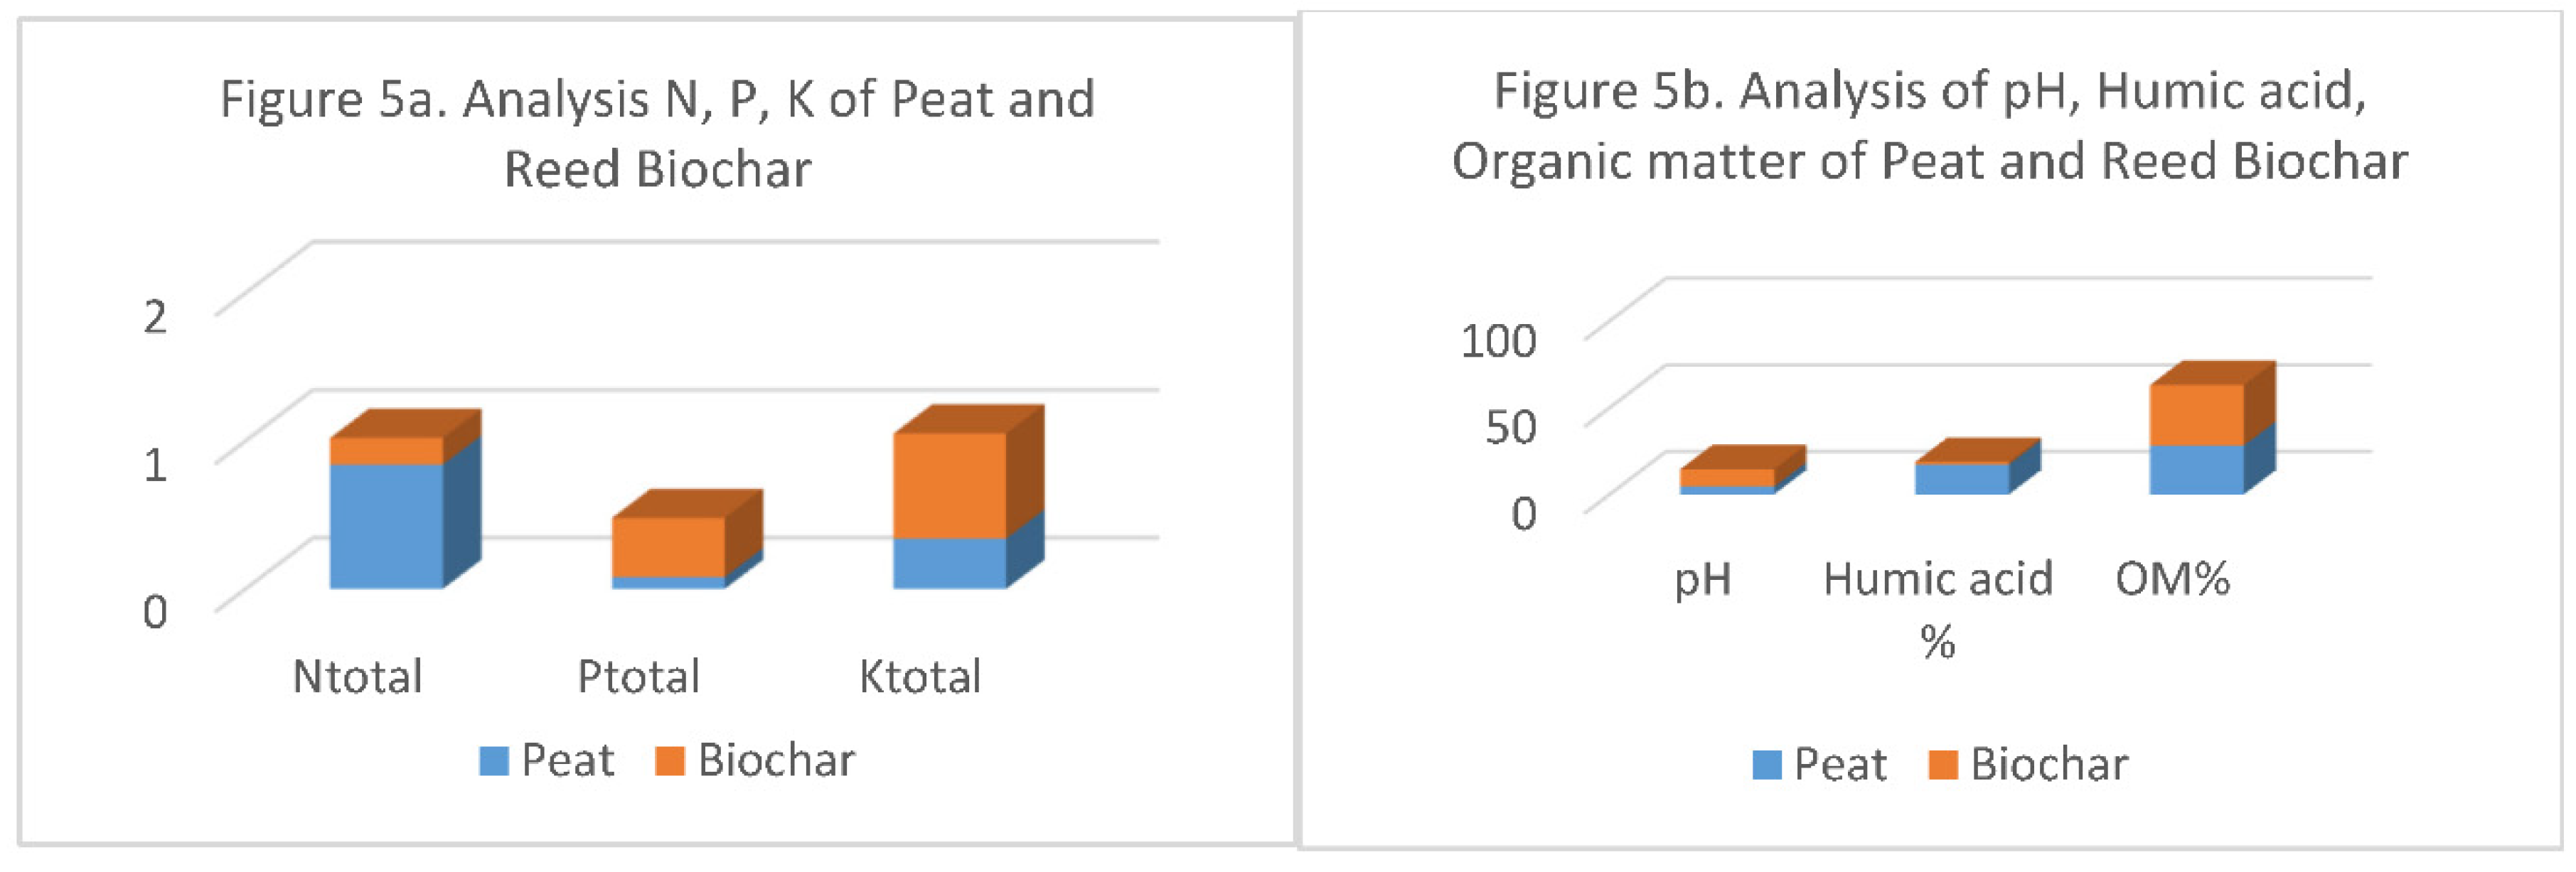
Analysis of chemical indicators of peat and biochar in U Minh Thuong national park (Table 14) (Figure 5) showed: pH of peat is 4.33 and biochar is 10.10; Humic acid of peat is 17.27% and biochar 1.30%; Nitrogen of peat is 0.48% and biochar 0.18%; Phosphorus of peat is 0.08% and biochar is 0.40%; Potassium of peat is 0.34% and biochar is 0.71%, OM% organic matter of peat is 28.12% and biochar 34.
Figure 5. (Figure 5a, Figure 5b) Compare N (%), P (%), K (%), pH, Humic acid (%), OM (%) of Peat and Reed Biochar.
Preprints 106493 g007
Statistical analysis at a significance level of 0.05 means the above indicators are less than 0.001
pH of peat is 4.33 shows high aciddity, biochar 10.10 shows high alkalinity; Humic acid of peat 17.27% and biochar 1.30% bigger than many times; Nitrogen of peat is 0.48% and biochar is 0.40% smaller; K2O% Potassium of peat is 0.34% smaller biochar 0.71%; OM% organic matter of peat is 28.12% samller biochar 34.82%. These results showed if combining peat and biochar in creating bio-organic fertilizer is effctive.

3.5. Compare the Chemical Indicators of Biochar between the U Minh Thuong Region and the Kien Luong of Long Xuyen Quadrangle in the Mekong Delta

  • Comments:
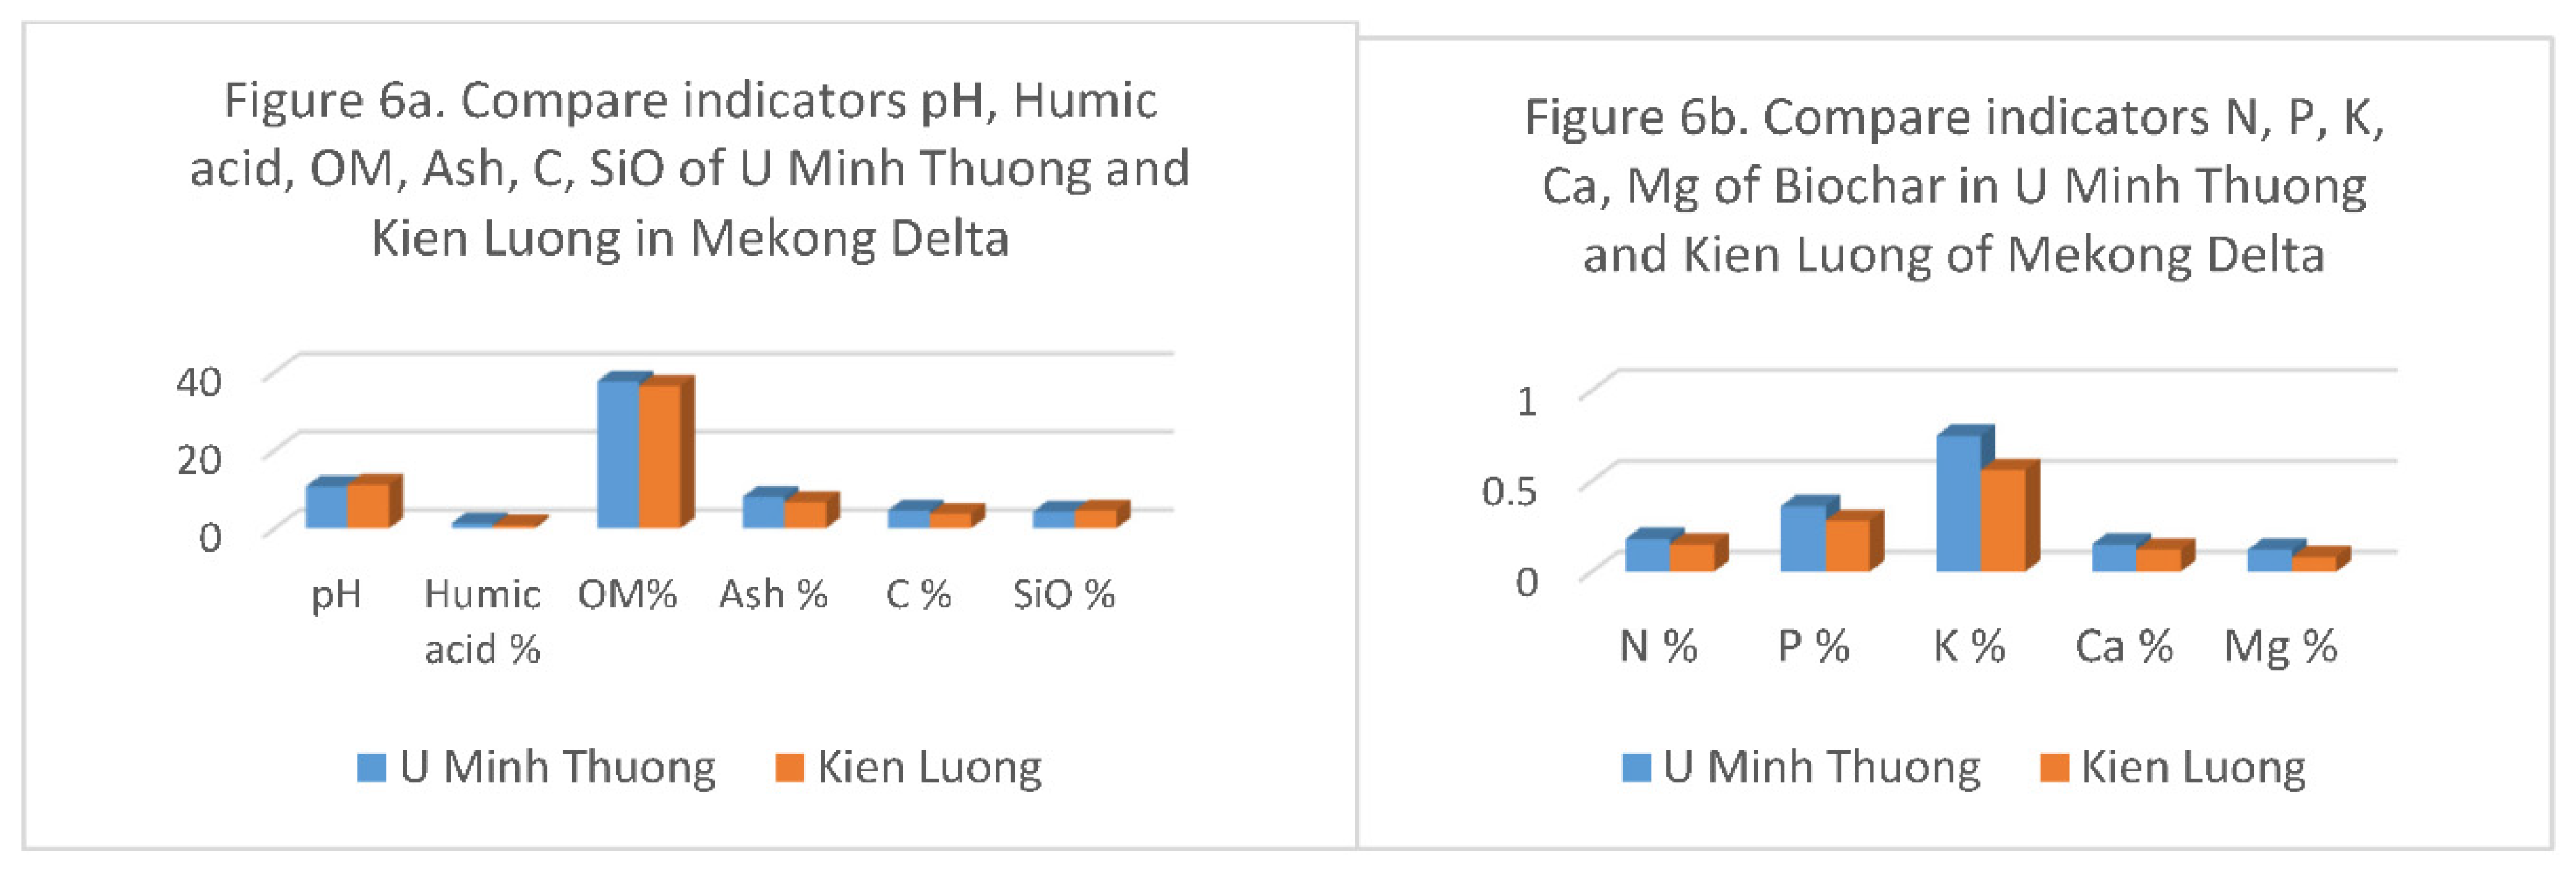
Analyzing the chemical composition of two areas of Long Xuyen Quadrangle in the Mekong Delta gave the following results (Table 15) (Figure 6): pH of UMT is 10.78 and KL is 11.21; Humic acid of UMT is 1.32%, KL is 0.82%; OM% of UMT is 37.65% and KL is 36.51%; Ash of UMT is 8.09% and KL is 6.79%; C% of UMT is 4.63% and KL is 3.97%; Nitrogen total of UMT is 0.18% and KL is 0.15%; Phosphorus of UMT is 0.36% and KL is 0.28%; Potassium of UMT is 0.75% and KL is 0.56%; Ca% of UMT is 0.15% and KL is 0.12%; Mg% of UMT is 0.12% and KL is 0.08%; SiO% of UMT is 4.83% and KL is 4.65%.
Figure 6. (Figure 6a, Figure 6b) Compare of biochar chemical indicators in U Minh Thuong and Kien Luong.
Preprints 106493 g008
Statistical analysis of average samples of 2 regions, all indicators are less than 0.05; in wich the SiO is bigger than 0.05.
Compare the indicators UMT and KL are Humic acid, OM%, Ash%, C%, Nitrogen%, Phosphorus%, Potassium%, Ca%, Mg% of these indicators are UMT greater than KL; the SiO% indicators is the difference is not meaningful; and pH indicators UMT is smaller KL.
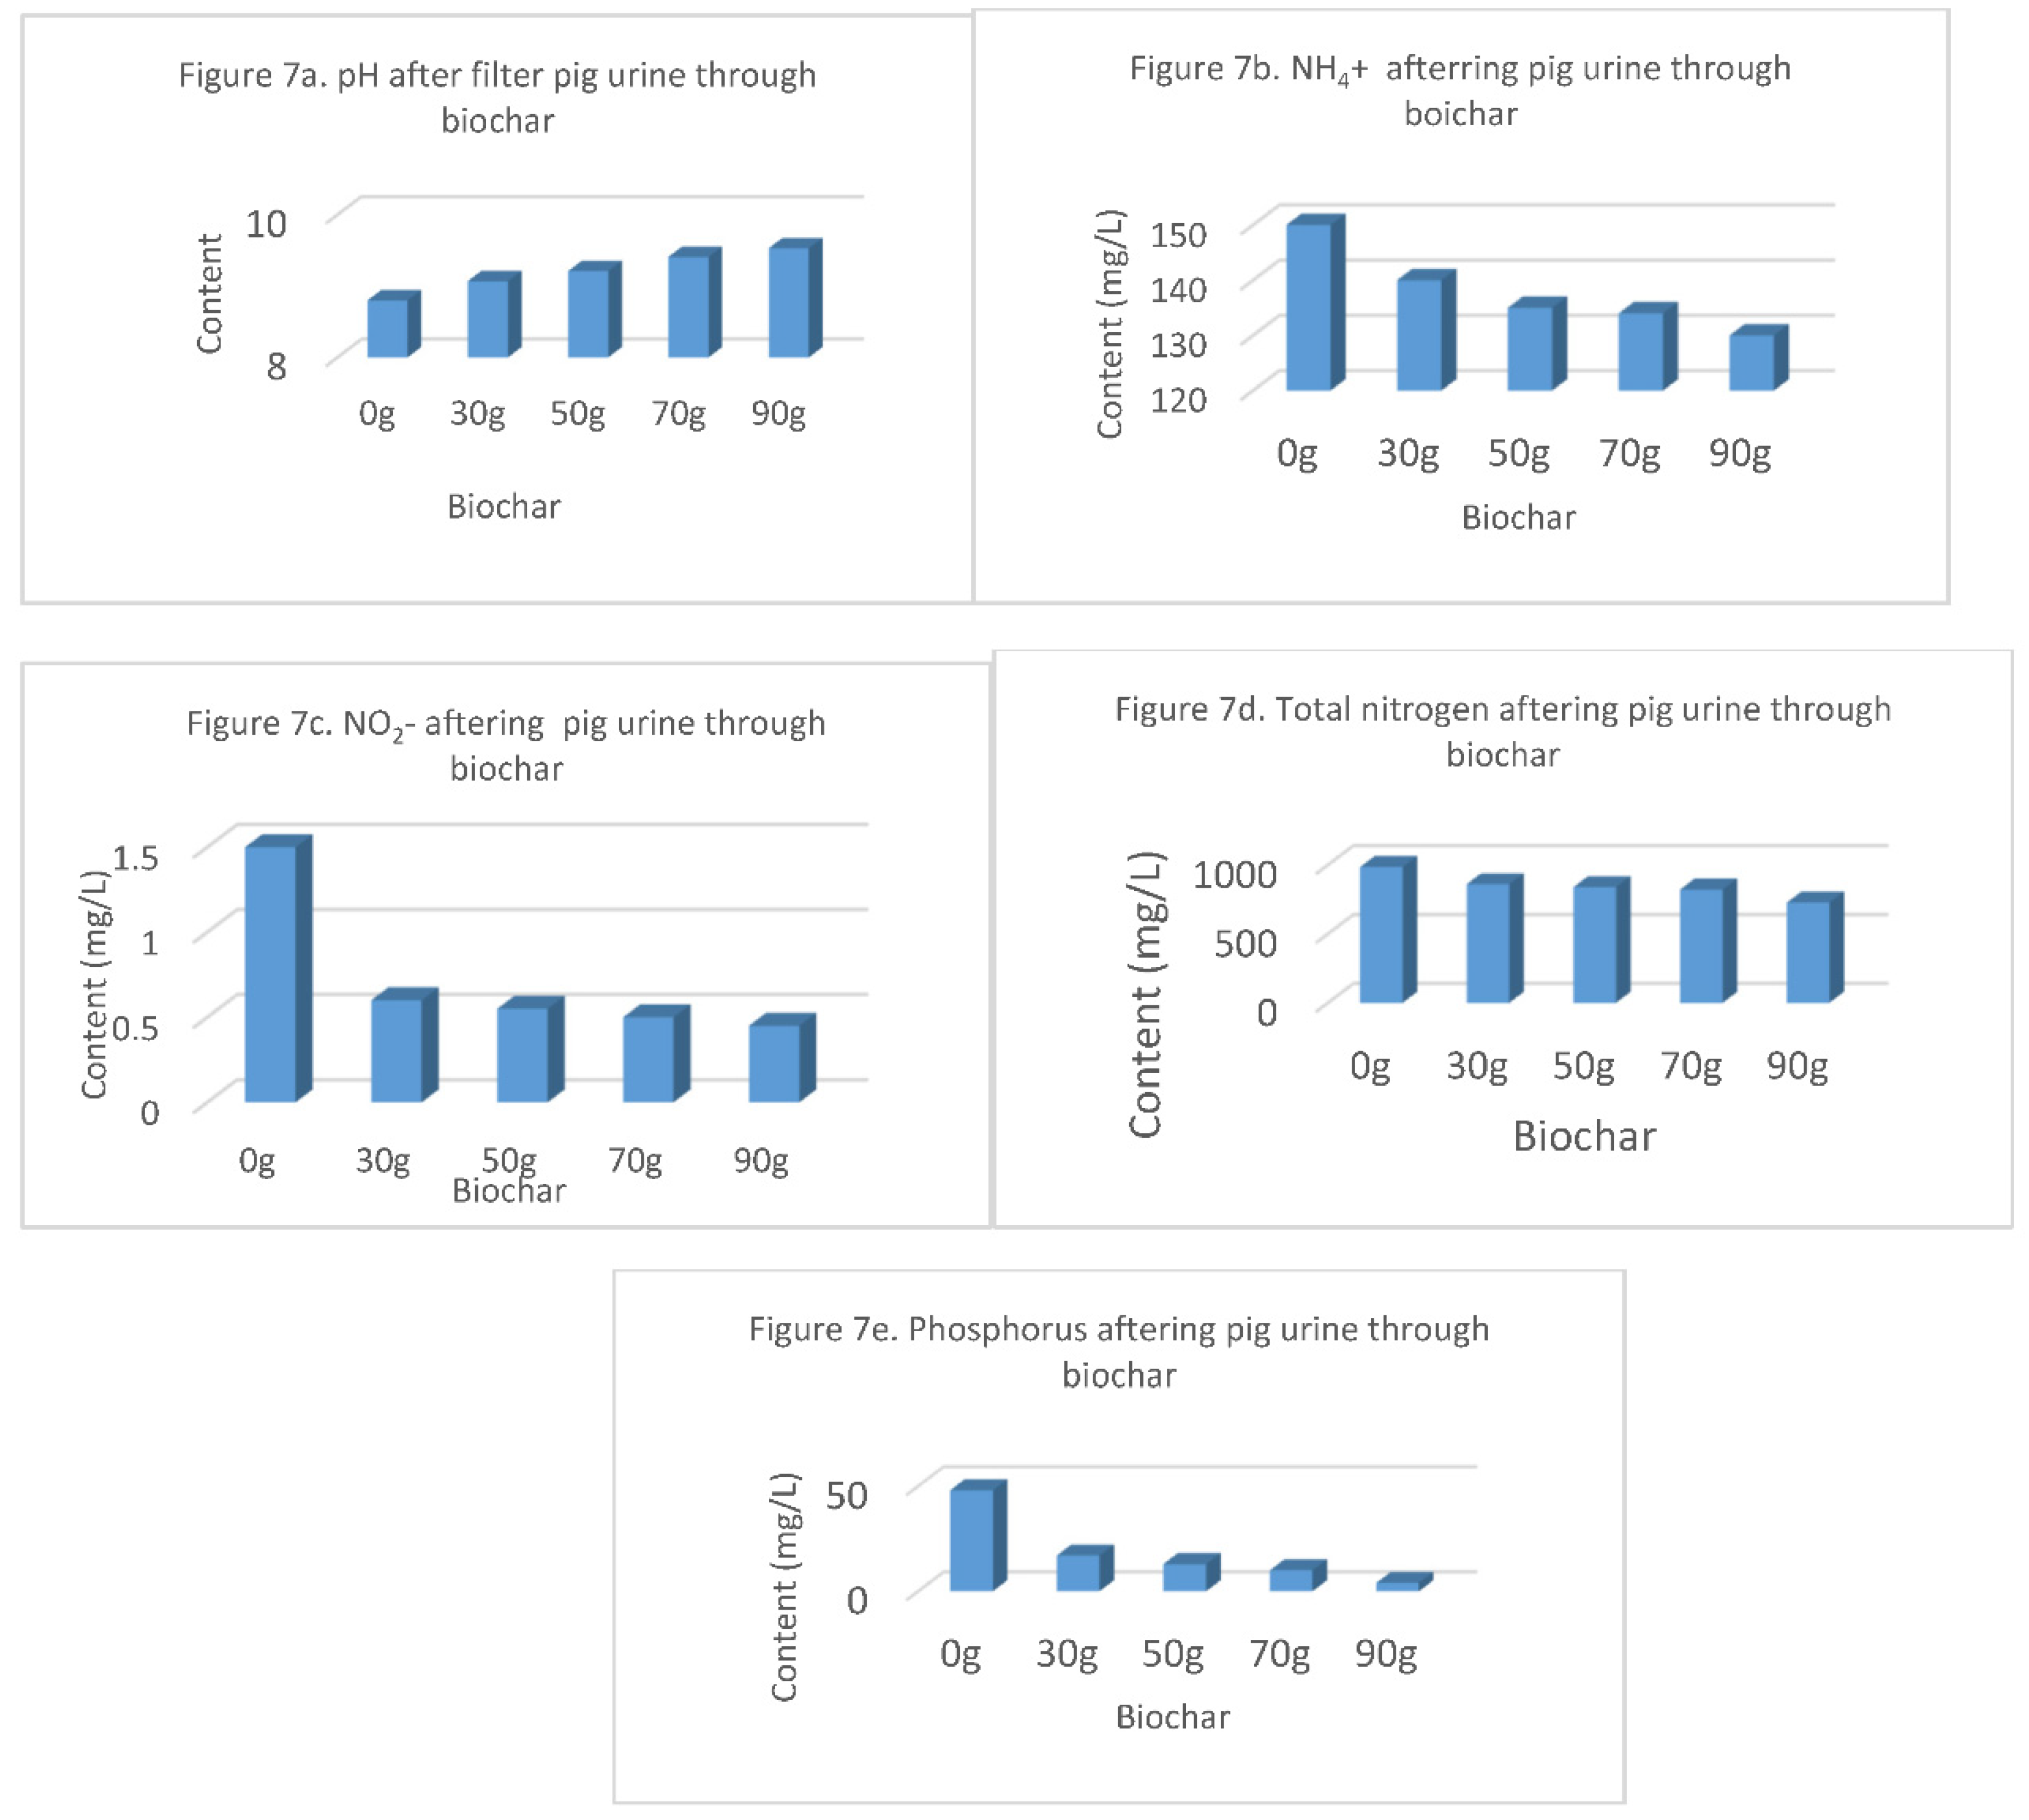
Figure 7. Content pH, NH4+, NO2-, Total nitrogen, Phosphorus aftering pig urine through biochar.
Preprints 106493 g009
  • Comments:
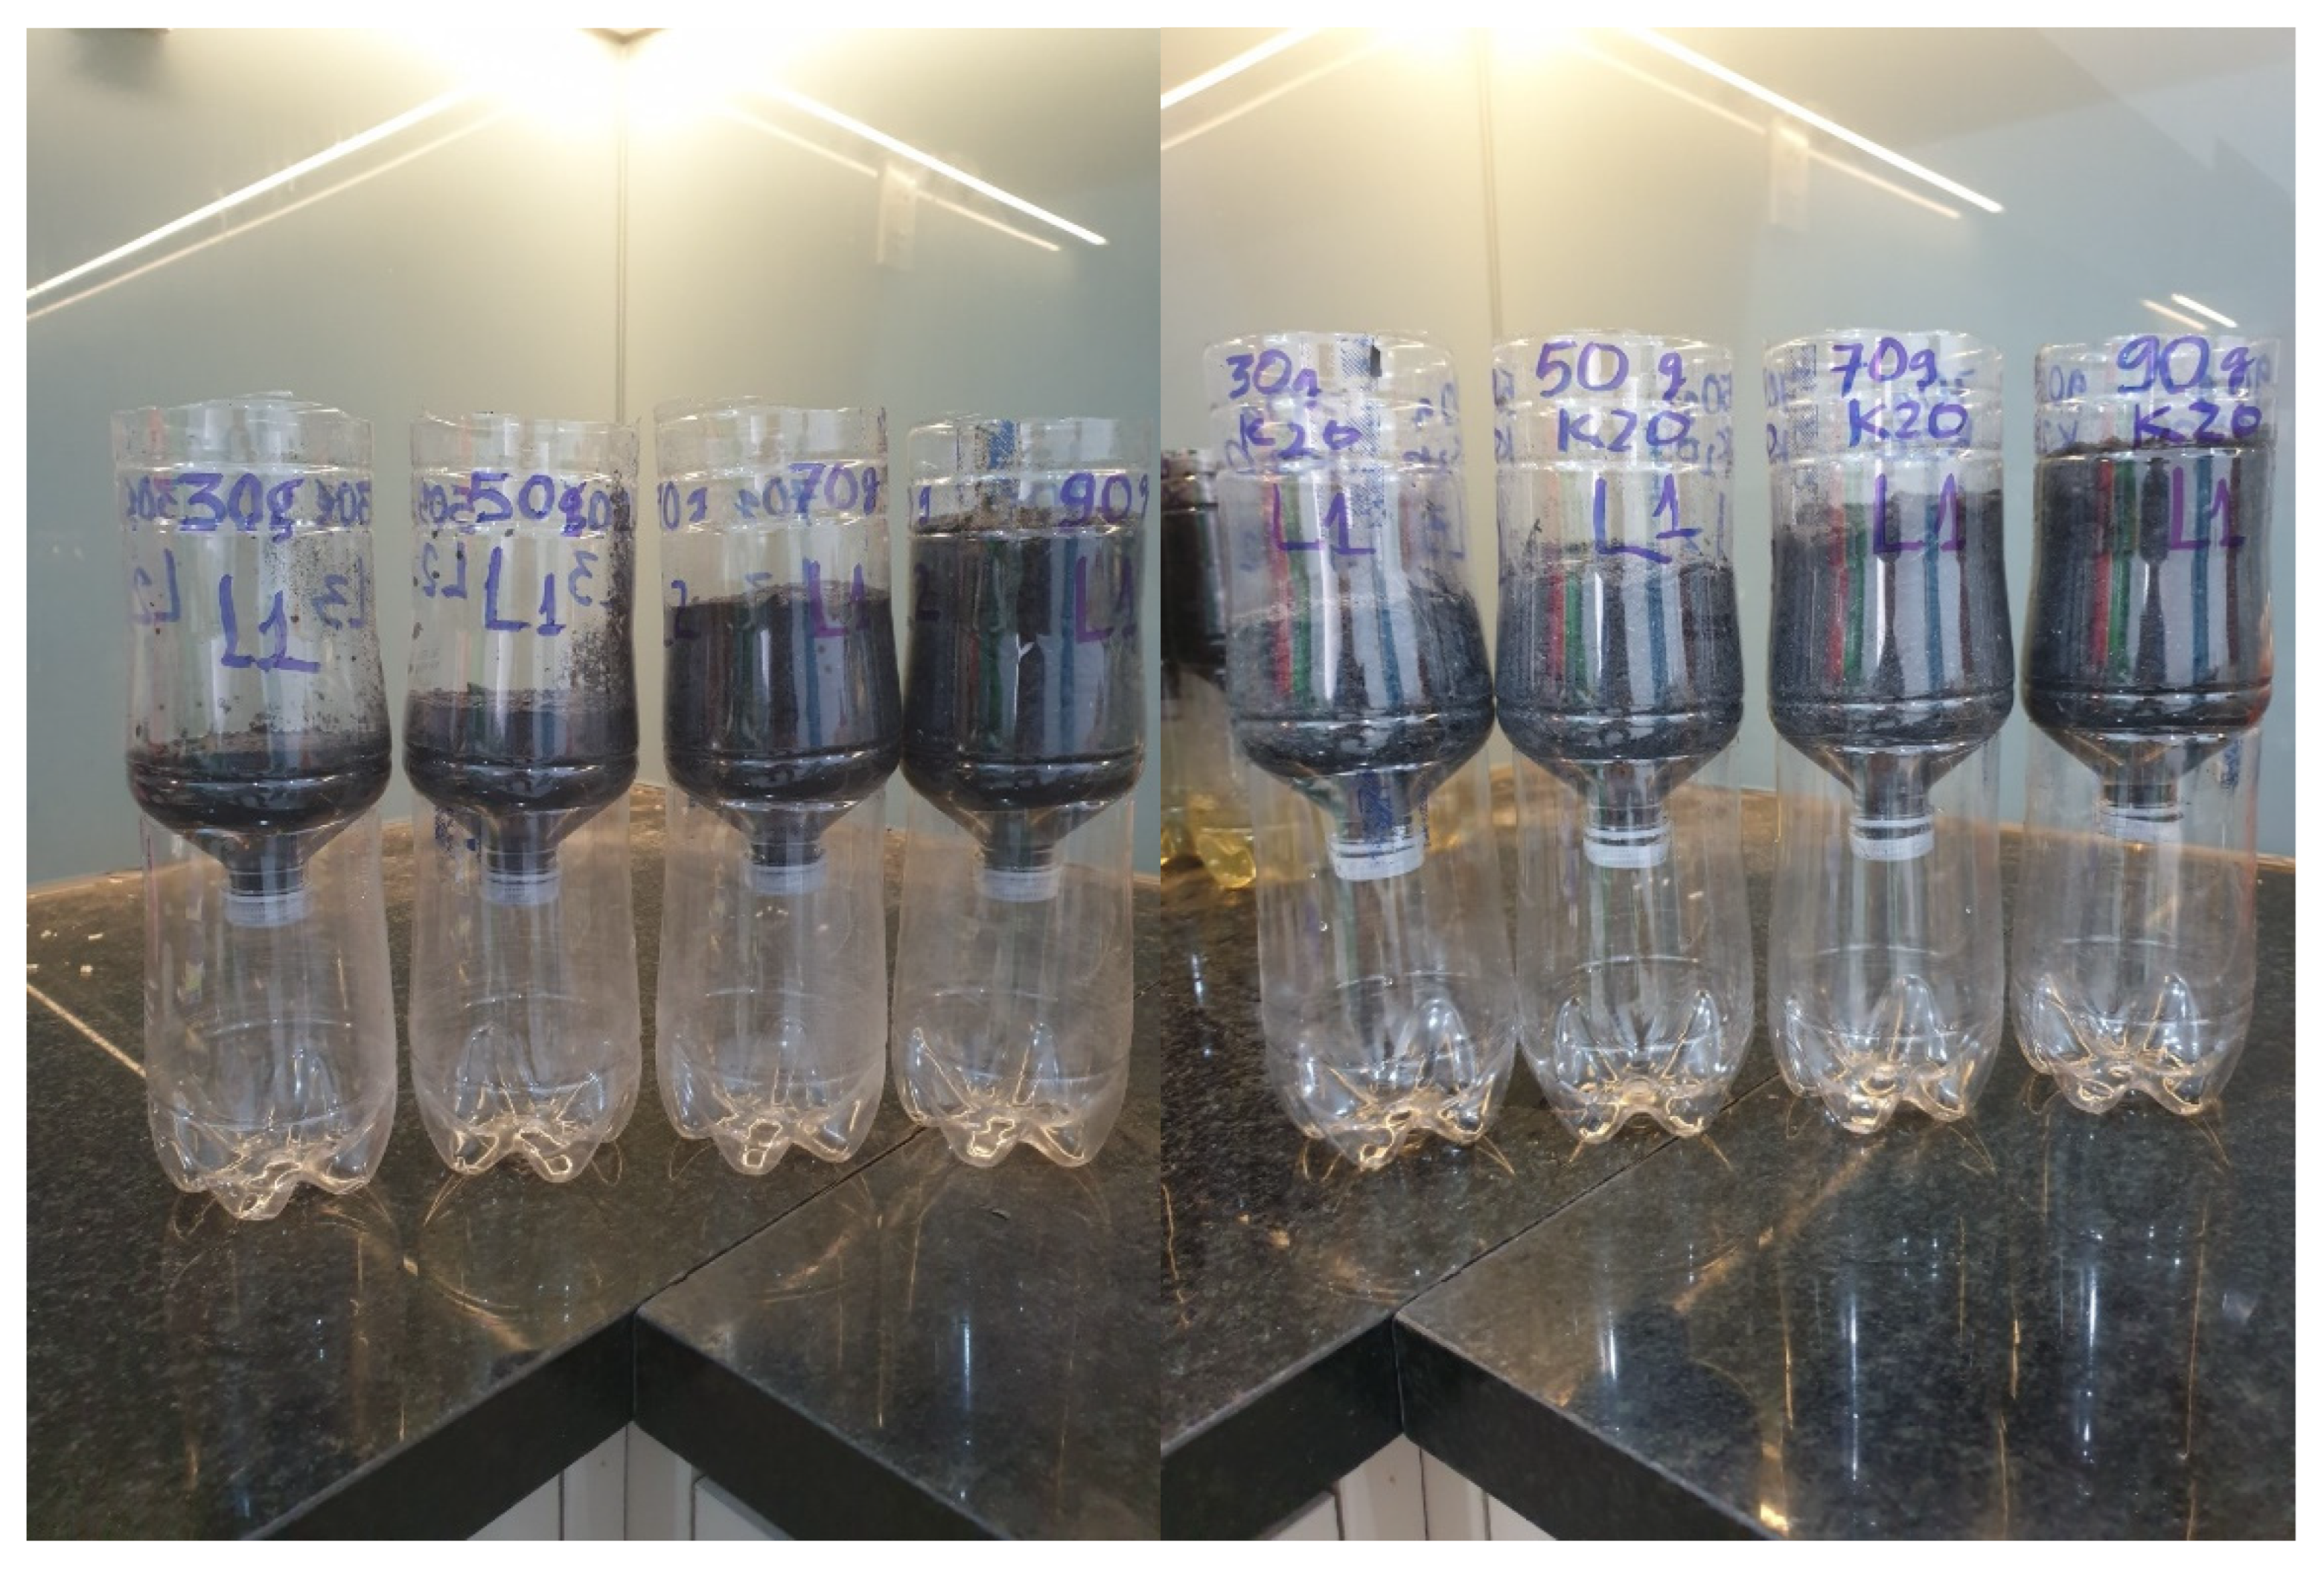
When giving 1000 ml of urine taken direstly from pig water to pass through reed biochar with (Pi1 = 30 grams, Pi2 = 50 grams, Pi3 = 70 grams, Pi4 = 90 grams) showed (Table 16):
In 30 gram biochar pH the water higher when biochar higher from 8.8 as 30 grams is 9.07, 50 grams is 9.21, 70 grams is 9.41, 90 grams is 9.53. This increase is due to the high alklinity of biochar (about pH = 10 - 11). Amonium beginning is 150 miligrams per litter, through 30 grams biochar remaining is 140 miligrams, through 50 gram biochar remaining is 135 miligrams, through 70 grams remaining is 134 miligrams, through 90 grams is remining is 130 miligrams. Nitrate (NO2- (mg/L) begin 1.5 miligrams/liter, passed 30 grams biochar remaining is 0.5 miligrams, passed 50 grams biochar remaining 0.55 miligrams, passed 70 grams biochar remaining is 0.45 miligrams. Total nitrogen begin is 984 mg/L, on 30 grams biochar is 860 miligram, on 50 grams is 838 miligrams, on 70 grams biochar is 821 miligrams, on 90 grams is 726 miligrams. Phosphoruss begin is 48 miligrams, on 30 grams biochar is 17 miligrams, on 50 grams is 13 miligrams, on 70 grams is 10 miligrams, on 90 grams is 4 miligrams per liter. In other study [21] reed biochar can removal of ammonium from water, so it can reduce green house. In study [24] low cót and easy rice husk modification to efficiently enhance ammonium and nitrate adsorption that can help to use reed biochar for agriculture.
Statistical analysis at a significance level of 0.05 means the above indicators are less than 0.001
The results show that if the amount of biochar increases, the ability to retain more chemical indicators of livestock wastewater such as amonium, nitric, nitrogen and phosphorus increases.
Figure. Adsorption filter for pig feed water and inorganic fertilizer.
Preprints 106493 g010
Figure. Adsorption filter for pig feed water and inorganic fertilizer.
  • Comments:
In (Table 17) showed 30 grams of reed biochar can retain 10 miligrams of amonium, in 50 grams is 15 miligrams, in 70 grams is 16 miligrams and in 90 gram is 20 miligrams of amonium. Nitrate in 30 grams is 0.9 miligrams, in 50 grams biochar is 0.95 miligrams, in 70 grams is 1 miligrams and in 90 grams biochar is 1.5 miligrams. Total nitrogen, in 30 grams biochar is 124 miligrams, in 50 grams biochar is 146 miligrams, in 70 grams biochar is 163 miligrams, in 90 grams biochar is 258 miligrams.
Figure 8. (Figure 8a, Figure 8b) Phosphorus and nitrogen water filtered through biochar.
Preprints 106493 g011
Comments
Mix 1000 mililiter of water with 10 grams phosphorus 16% (Table 18), (Figure 8a) begin is 448 miligrams, in 30 grams biochar is 443 miligrams, in 50 grams is 441 miligrams, in 70 grams is 438 miligrams and in 90 grams biochar is 432 miligrams. Thus, when phosphorus water passes through biochar more phosphorus be lost and remaining.
N0: Mix 1000 mililiters of water with 10 grams of 46% nitrogen
N1: Water mixed with nitrogen flitered through 30 grams of reed biochar
N2: Water mixed with nitrogen flitered through 50 grams of reed biochar
N3: Water mixed with nitrogen flitered through 70 grams of reed biochar
N4: Water mixed with nitrogen flitered through 90 grams of reed biochar
  • Comments:
As above, mixed 1000 mililiters of water with 10 grams nitrogen 46% (Table 18), (Figure 8b), begin no biochar is 556 miligrams, in 30 grams biochar is 549 miligrams, in 50 grams is 543 miligrams, in 70 grams is 424 miligrams and in 90 grams biochar is 364 miligrams. Thus, when nitrogen water passes through more nitrogen it be lost and remaining.
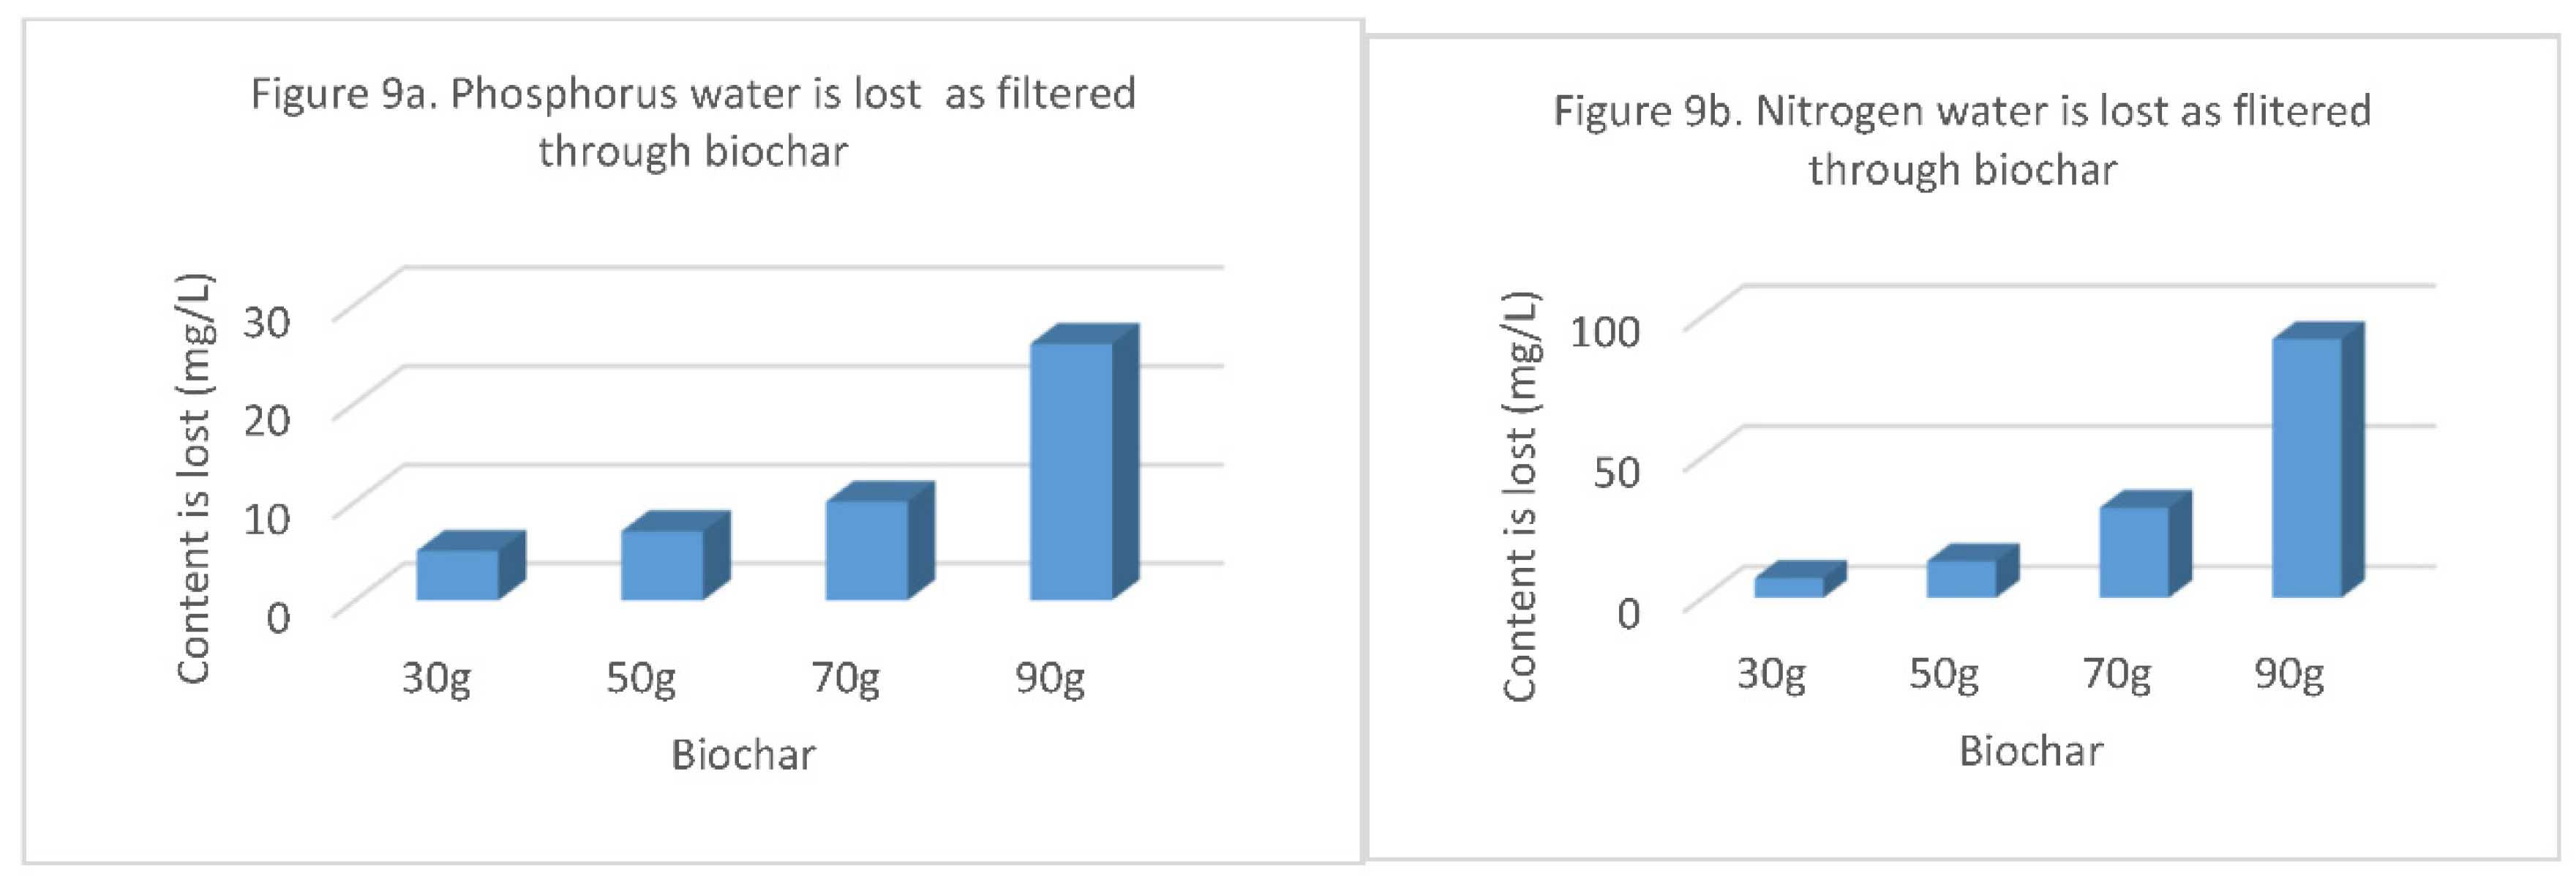
Figure 9. (Figure 9a, Figure 9b) Phosphorus and Nitrogen water is lost as filtered through biochar.
Preprints 106493 g012
Comments:
Phosphorus water as filtered through reed biochar is retained as follows (Table 19), (Figure (9a): In 30 grams is 5 miligrams, in 50 grams biochar is 7 miligrams, in 70 grams biochar is 10 miligrams, in 90 grams biochar is 26 miligrams phosphorus remaining. The study effectiveness of reed biochar in mitigating phosphorus dynamics in paddy soil [22] it can use biochar like fertilizer in crops.
N0 – N1: Content of nitrogen lost after flitering through 30 grams of reed biochar
N0 – N2: Content of nitrogen lost after flitering through 50 grams of reed biochar
N0 – N3: Content of nitrogen lost after flitering through 70 grams of reed biochar
N0 – N4: Content of nitrogen lost after flitering through 90 grams of reed biochar
  • Comments:
Nitrogen water as filtered through reed biochar is retained and remaining as follow (Table 19), Figure 9b): in 30 grams is 7 miligrams of nitrogen, in 50 grams of reed biochar is 13 miligrams, in 70 grams of reed biochar is 32 miligrams, in 90 grams of reed biochar is 92 miligrams nitrogen remaining. Adsorption of ammonium on biochar prepared from gaint reed [23] it can use reed biochar in this experiment fro fertilizer rice crops

3.6. Comments and Discussions

-
The reed growth and biomass : The reed grows every year at he beginning of the rainy season and when the reed flowers are ripe at the end of the dry season. The amount of growth and biomass is very high [19] , so it is an abundant source of renewable raw materials. In the U Minh Thuong National Park investigated fresh growth indicators are height from 3.39 to 4.47 meters; the reed base diameter mearsured from 1.8 to 3.17 centimeters; the density of plants counted from 49 to 87 plants per square meter; the average volume is from 0.04 to 0.10 cubic meter per square meter; the average weight is from 15.46 to 20.54 kilograms per square meter. With such amount of fresh biomass, it will have promising potential for useful biomass usage.
-
Harvestting mature reeds (flowers are completely ripe) in March 2024, separate into stems, leaves and flowers; then weight them into separate of sampling results to different peat thickness. The results showed that the peat thickness from 0 – 90 cm as follows: Total weight from 127.34 to 358.58 grams per plant; the reed trunk weight from 79.55 to 217.78 grams per plant; the leaf weight from 33.78 to 122.16 grams; the flower weight from 4.4 to 19.64 grams per plant. The dry biomass composition of reeds by weight as a source of raw materials for future biochar production.
-
Investigate biochar on each plant by controlled burning of part at the biochar formation stage and then cutting oxygen to get reed biochar gave the following results: Biochar weight per plant from 26.16 to 73.57 gram, The trunk biochar of the plant from 14.41 to 39.44 grams, the weigh of leaf biochar per plant from 8.16 to 22.59 grams, The weigh of flower biochar from 2.59 to 11.54 grams. Knowing the biochar on each reed plants helps us to evaluate exploitation on the potential for reed biochar, in investigate the density on different peat thickness help us evaluated the amount of biochar available that can be exploited per unit area and also make a basis planning of biochar exploitation for agriculture and environment.
-
Researching the chemical properties to peat thickness (Table 15) helps us understand the chemical composition of peat from 0 cm to 90 cm the folowing chemical properties: The indicators decreased are P2O5 from 0.119 decreased 0.063, the sulfuric acid from 0.082 decreased 0.036 mg/100g; Amonium (NH4+) from 17.40 decreased 13.80mg/100g. Indicators increase with peat thickness such as: Humic acid from 6.06% to 18.85%, total nitrogen from 0.17% to 0.72%, potassium (K2O) from 0.12% to 0.050%, Iron (Fe2+) from 0.82% to 3.85%. The chemical properties of peat soil are related to the growth and biomass of the reeds distributed on it. This research helps to understand the peat soil factors in the reed vegetation in which they grow.
-
Comparing the chemical indicators of biochar of U Minh Thuong National Park and Kien Luong (Long Xuyen Quadrangle of Mekong Delta): Indicators are higher than Kien luong are Humic acid 1.32% (UMT) and 0.82% (KL); organic matter OM% is 37.65% (UMT) and 36.51% (KL); Ash is 8.09% and 6.79% (KL); C% is 4.63% (UMT) and 3.79 (KL); ; Nitrogen N% is 0.18 (UMT) and 0.15% (KL); phosphorus P% is 0.36% and 0.28 (KL); potassium K% is 0.75% (UMT) and 0.56% (KL); Ca% is 0.15% (UMT) and 0.12 (KL); Mg% is 0.12% (UMT) and 0.08 (KL). The chemical indicators that U Minh Thuong National Park is lower than Kien Luong are pH is 10.87 (UMT) and 11.21 (KL); SiO% is 4.38% (UMT) and 4.65(KL).
-
The relationship between peat soil chemical indicators and reed growth and biomass indicators includes: Humic acid is corelated with growth and biomass indicators (by corelation equations and coefficient correlation R ), humic acid with R from 0.81 to 0.96; SO42- from 0.81 to 0.93; P2O5 from 0.87 to 0.96; NH4+ from 0.32 to 0.63; total nitrogen from 0.87 to 0.99; potassium K2O from 0.87 to 0.99; Fe2+ from 0.85 to 0.98. All peat chemical indicators are closely related to R from 0.8 to 0.99. The pH indicators alone has a weak correlation from 0.32 to 0.63.
-
Reed biochar has the ability to retain chemical elements of wastewater discharged from pig farm. In study reed plant (Phragmites autralis) and ít biochar were tested treatment wastwater, biochar improved wastwater quality to the medium quality grade [18]. The elements it retains in the form of adsorption are ammonium and nitric, total nitrogen, and phosphorus. Two elements capable of reducing environmental emission are ammonium and nitric. Biochar of reed as soil improvement is when using biochar in agriculture [20]. Meanwhile, two elements that can potentially contribute to agriculture through organic biofertilizers are nitrogen and phosphorus.
-
Biochar also has the ability to adsorb inorganic minerals such as phosphorus and nitrogen, which are two main components of inorganic fertilizers; in study biochar from giant reed (Arundo donax L.) at 300 – 6000C it can release of N, P and K and adsorption of N and P [17], so when using reed biochar in agriculture, it helps promote fertilizer efficiency and avoid losses due to evaporation and leaching waste fertilizer on plants, because biochar has the ability to retain it for plants to absorption.

4. Conclusions

-
The growth and biomass on reed plants in U Minh Thuong National Park is very high, it is an annual renewable material source, the average reserve is from 0.04 – 0.1 cubic metters and the average weight is 15.46 kilograms to 20.54 kilograms per square meter.
-
The dry weight of a reed plant from 127.34 grams to 358.58 grams, the weight of a plant trunk from 79.55 to 217.78 grams, the weight of a leaf plant from 33.78 to 112.16 grams, the weight of a flower plant from 4.4 to 19.64 gram.
-
Biochar made from dry reed plants gives the following results: The weight of a plant biochar from 26.16 to 73.57 grams, the weight of a plant trunk biochar from 14.41 to 39.44 grams, the weight of a plant leaf biochar biochar from 8.16 to 22.59 grams, the weight of a plant flower biochar from 2.59 to 11.54 grams.
-
Chemical composition analysis according to peat thickness where reed species are distributed shows that as peat thickness increases, chemical indicators also increase and decrease in two directions; the decrease indicators are P2O5, SO42-, NH4+ and the increase indicators with peat thicknes are humic acid, pH, Nitrogen total, K2O, Fe2+.
-
Compare the chemical components of peat and biochar in U Minh Thuong National Park shows that biochar has lower indicators such as humic acid %, nitrogen total%, but there are also higher such as phosphorus P2O5%, potassium K2O% and orgarnic matter OM%.
-
Compare biochar in U Minh Thuong and Kien Luong of Mekong Delta show that 9/11 indicators are higher that humic acid, organic matter OM%, Ash%, C%, N%, P%, K%, Ca%, Mg%, these indicators are very necessary for bio-organic fertilizer, there are 2 indicators that are not much lower as pH, SiO%.
-
Reed biochar has the ability to retain chemical indicators of wastewater from pig farm in pig urine, the substances it is able are ammonium, nitrate, nitrogen, phosphorus; it help to prevent environmental emission and provide nutrients for plants. At the same, it has the ability adsorb two inorganic minerals, nitrogen and phosphorus to help use inorganic biofertilizers effectively

Author Contributions

Luom T.T conceptulization, methoddology, validation, formal analysis, investigation, data curation, writing – origional, draft preparation, writing – review and editing, visalization, supervision, project administration, funding acquisition. Quang T. L investigation, data curation, formal analysis. Ngoc T.H.Đ investigation, formal analysis

Funding

This research received no external funding.

Institutional Review Board Statement

This study does not involve humans or animals.

Informed Consent Statement

All studies only study plant and soil. It is not related to human only help community and government to develop economic.

Data Availability Statement

These database are by ourself. Thus we using to study and for our article, published in MDPI can share by authors group, MDPI journal.

Acknowledgment

We would like to thank Ministry of Education and Training of Vietnam to help the project and thank you very much the Leader and Staff of U Minh Thuong National Park. We also thank the Editors of Publishing House help us to posting the article.

Conflicts of Interest

The authors declare no conflict of interest.

References

  1. Bao, H. Statistics in Forestry. Apply Software Stagraphics Centurion and MS; Tay Nguyen University: Buon Ma Thuot, Vietnam, 2009.
  2. Bao, H. Statistical analysis in experimental forestry research – Forest resource management – environment. 2015.
  3. De Vos, B.; Lettens, S.; Muys, B.; Deckers, J.A., 2007. Walkley–Black analysis of forest soil organic carbon: Recovery, limitations and uncertainty. Soil Use Manag. 2007, 23, 221–229. [CrossRef]
  4. Dam Xuan Van. Research on the distribution, growth and development of (Phragmites autralis) on ore mining land in Thai Nguyen province. 2007.
  5. Mai Van Trinh, ctv. Research on biochar production from rice straw and rice husk to improve soil fertility, crop productivity and reduce greenhouse emissions. 2013.
  6. Nguyen Ngoc Nong, et. al, Land Evaluation Curiculum. University of Agroforestry in Ho Chi Minh City. https://mysite.tufa.edu.vn.
  7. Nguyen Hong Son, et al. Research on the posibility of using boichar to replace manure and inorganic fertilizers in rice production. 2015.
  8. Shila Khajavi – Shojaei, et al. Study of Amonium and Nitrate Adsorption Kimeties and Isotherm by Common reed (Phagmites australis) biochar from Aqueous Sotution (in Persian). 2019.
  9. UMTNP, 2022. Investigation Report on Peatland of U Minh Thương National Park 2022; UMTNP: Kuantan, Malaysia, 2022.
  10. Vietnam Nature Conservation Center,. 2004 U Minh Thuong National Park. In Information Book on Existing and Proposed Protected Areas in Vietnam; Vietnam Nature Conservation Center: Hanoi, Vietnam, 2004.
  11. Kystian Obolewski, et al. Chemical omposition of Reed Phragmites autralis (Cav.) Trin. Ex. Steud. Verus Density and Structure of Periphyton in Various Aquatic Ecostems. J. Elementol. 2007, 12(1): 63-79.
  12. Cristian Dragos Obreja, et al. Detction of Reed Using CNN Method and Analysis of the Dry Reed (Phragmites autralis) for a Sútaianable Lake Area. 24 June 2023. Eurpean Juornal of Plant Pathology (Plant methods 19, Articlae Number: 61 (2023).
  13. Nguyen Dang Nghia, 2014. The role of Biochar in efective biochar production and application. Department and Technology. Ho Chi Minh City. 2014.
  14. Changhao Wu, et al. Reed biochar improved the soil funtioning and bacterial interactions: A bagging experiment using the plantation forest soil (Fraxinus chinensis) in the Xiong’an new area, China. Journal of Ceaner Production, volume 410, 15 July 2023, 137316. [CrossRef]
  15. Yarong Qi, et al, 2023. Preparation of Reed Biochar and Study on Its Phosphorus Adsorption Characteristics. Journal of Environmental Engineering, Volume 149, Isue 8, . [CrossRef]
  16. Yaqi Zhao, et al. 2017. Biochar dirived from gaint reed (Arundo donax L.) with different treatment: characterization and ammonium adsorption potential. Environmental Science and Polltion Research, Volume 24, 2017, pp 25889 – 25898.
  17. Zheng H, et al.2012. Characteristics and nutrient values of biochars produced from gaint at different temperatures. Bioresource Technology. [CrossRef]
  18. Amany A. Asaad, et al. 2022. Reclamation of wastewater in wetlands using reed plants and biochar. ReseachGate. [CrossRef]
  19. Attila I. Engloner, 2009. Structure, Growth Dynamics and Biomass of Reed (Phragmites autralis) – a Review. Hungarian Academy of Sciences. December 2009. Flora 204(5) 331-346. [CrossRef]
  20. Axel Karlsson, Pinthira Fagerstrom, 2021. Blue Growth: Applications and properties of biochar made out of reed. Examensarbete Inom Teknik, Grundniva, 15 HP. Stockholm, Serige 2021.
  21. Ming Zang, et al. 2022. Enhanced removal of ammonium from water using sulfonated reed waste biochar-A lab-scale investigation. Environmental Pollution. Volume 292, Part B, 1 January 2022, 118412. [CrossRef]
  22. Yizhe Wang, et al. 2022. The effctiveness of reed biochar in mitigating phosphorus loses and enhangcing microbially driven phosphorus dynamics in paddy soil. Journal of Environmental Management 314(1-2): 115087. [CrossRef]
  23. Jie Hou, et al. 2016. Adsorption of ammonium on biochar prepared from giant reed. Environmental Science and Pollution Research 23(19). [CrossRef]
  24. Lada Mathurasa · Seelawut Damrongsiri. 2018. Low cost and easy rice husk modification to efficiently enhance ammonium and nitrate adsorption. International Journal of Recycling of Organic Waste Agriculture. [CrossRef]
Figure 1. Reed plants and reed biochars.
Preprints 106493 g001
Table 1. The height and diameter of trunk at ground.
No. Peat thickness Height (H) Diameter (D0.0) Density (N/m2) Volume (Ym3) Weight (kg)
1 0 cm 3.39 1.8 87 0.04 15.46
2 5 -30 cm 4.17 1.9 62 0.04 14.96
3 30 -60 cm 4.48 2.99 56 0.09 21.90
4 60 – 90 cm 4.74 3.17 49 0.10 20.58
α=0.05 <0.001 <0.001 <0.001 <0.001 <0.001
Table 2. Fresh reed plant biomass.
No. Peat thickness Wft (g) Wftr (g) Wfl (g) Wff (g)
1 0 cm 176 95 74 6.8
2 5 -30 cm 242 138 95 9.31
3 30 -60 cm 391 234 152 14.87
4 60 – 90 cm 423 237 187 21.44
α=0.05 <0.0001 <0.0001 <0.0001 <0.0001
Wft: Weight of total fresh reed plant. Wftr: Weight of fresh reed plant trunk. Wfl: Weight of fresh reed plant leaves. Wff: Weight of fresh reed plant flowers.
Table 3. Dry reed plant biomass.
No. Peat thickness Wdt (g) Wdtr (g) Wdl (g) Wdf (g)
1 0 cm 127.34 79.55 33.78 4.4
2 5 -30 cm 181.01 121.84 57.64 7.53
3 30 -60 cm 312.42 196.78 102.73 12.91
4 60 – 90 cm 358.58 217.78 122.16 19.64
α=0.05 <0.0001 <0.0001 <0.0001 <0.0001
Wdt: Weight of total dry reed plant. Wdtr: Weight of dry reed plant trunk. Wdl: Weight of dry reed plant leaves. Wdf: Weight of dry reed plant flowers.
Table 4. Reed plant biochar.
No. Peat thickness Wbt (g) Wbtr (g) Wbl (g) Wbf (g)
1 0 cm 26.16 14.41 8.16 2.59
2 5 -30 cm 36.15 20.98 10.75 4.42
3 30 -60 cm 62.37 35.64 19.16 7.58
4 60 – 90 cm 73.57 39.44 22.59 11.54
α=0.05 <0.0001 <0.0001 <0.0001 <0.0001
Wbt: Weight of total reed plant. Wbtr: Weight of biochar on reed plant trunk. Wbl: Weight of biochar reed plant leaves. Wbf: Weight of biochar reed plant flowers.
Table 5. Characteristic of peat soil thickness in U Minh Thuong.
No. Peat thickness Humic acid (%) SO42-(mg/100g) P2O5 (%) NH4+ (mg/100g) pH Nt (%) K2O (%) Fe2+ (mg/100g)
1 0 cm 6.06 0.082 0.119 17.40 4.32 0.17 0.12 0.82
2 5 -30 cm 15.29 0.073 0.104 16.84 4.47 0.30 0.22 1.41
3 30 -60 cm 17.67 0.060 0.080 15.89 4.42 0.42 0.30 2.13
4 60 – 90 cm 18.85 0.036 0.063 13.90 4.10 0.72 0.50 3.85
α=0.05 <0.001 <0.001 <0.001 <0.001 <0.001 <0.001 <0.001 <0.001
Table 6. Relationship between humic acid with growth indicators.
No. Chemical Indicator Growth Indicators Statitiscal Parameters
1 Humic acid H (m) R = 0.96; α <0.0000, N = 20; Ahu = -25.0923 + 9.4272 H
2 Humic acid Do R = 0.86; α < 0.0000, N = 20; Ahu- = -1.2765 + 6.3863 Do
3 Humic acid Wft R = 0.86; α < 0.0000, N = 20; Ahu = 1.7538 + 0.0413 Wft
4 Humic acid Wftr R = 0.89; α < 0.0000, N = 20; Ahu = 1.2273 + 0.0765 Wftr
5 Humic acid Wfl R = 0.78; α < 0.0000, N = 20; Ahu = 3.6079 + 0.0869 Wfl
6 Humic acid Wff R = 0.81; α < 0.0000; N = 20; Ahu = 5.0635 + 0.7177 Wfl
7 Humic acid Wdt R = 0.86; α < 0.0000; N = 20; Ahu = 3.2047 + 0.0460 Wdt
8 Humic acid Wdtr R = 0.89; α < 0.0000; N = 20; Ahu = 2.1218 + 0.0802 Wdtr
9 Humic acid Wfl R = 0.81`; α < 0.0000; N = 20; Ahu = 4.3482 + 0.1241 Wdl
10 Humic acid Wff R = 0.83; α < 0.0000; N = 20; Ahu = 6.5198 + 0.7148 Wdf
11 Humic acid Wbt R = 0.83; α < 0.0000; N = 20; Ahu = 3.5388 + 0.2216 Wbt
12 Humic acid Wbtr R = 0.88; α < 0.0000; N = 20; Ahu = 2.589 + 0.4313 Wbtr
13 Humic acid Wbl R = 0.88; α < 0.0000; N = 20; Ahu = 4.1995 + 0.6771 Wbl
14 Humic acid Wbf R = 0.79; α < 0.0000; N = 20; Ahu = 4.8915 + 0.6417 Wbf
Table 7. Relationship between SO42- with Growth indicators.
No. Chemical Indicator Growth Indicators Statitiscal Parameters
1 SO42- H (m) R = 0.85; α <0.0000, N = 20; SO42- = 0.1839 - 0.0288 H
2 SO42- Do R = 0.84; α < 0.0000, N = 20; SO42-- = 0.1207 – 0.0234 Do
3 SO42- Wft R = 0.84; α < 0.0000, N = 20; SO42- = 0.1060 - 0.0001 Wft
4 SO42- Wftr R = 0.86; α < 0.0000, N = 20; SO42- = 0.1069 - 0.00025 Wftr
5 SO42- Wfl R = 0.81; α < 0.0000, N = 20; SO42- = 0.0997 - 0.00029 Wfl
6 SO42- Wff R = 0.81; α < 0.0000; N = 20; SO42- = 0.1002 - 0.0028 Wfl
7 SO42- Wdt R = 0.90; α < 0.0000; N = 20; SO42- = 0.1034 - 0.00016 Wdt
8 SO42- Wdtr R = 0.89; α < 0.0000; N = 20; SO42- = 0.1052 - 0.00027 Wdtr
9 SO42- Wfl R = 0.89; α < 0.0000; N = 20; SO42- = 0.1011 - 0.0005 Wdl
10 SO42- Wff R = 0.93; α < 0.0000; N = 20; SO42- = 0.0938 - 0.0028 Wdf
11 SO42- - Wbt R = 0.90; α < 0.0000; N = 20; SO42- = 0.1026 - 0.0008 Wbt
12 SO42- Wbtr R = 0.90; α < 0.0000; N = 20; SO42- = 0.1044 - 0.0015 Wbtr
13 SO42 Wbl R = 0.89; α < 0.0000; N = 20; SO42- = 0.1015 - 0.0025 Wbl
14 SO42 Wbf R = 0.92; α < 0.0000; N = 20; SO42- = 0.1015 - 0.0005 Wbf
Table 8. Relationship between P2O5 with Growth indicators.
No. Chemical Indicator Growth Indicators Statitiscal Parameters
1 P2O5 H (m) R = 0.91; α <0.0000, N = 20; P2O5 = 0.2525 - 0.0385 H
2 P2O5 Do R = 0.91; α < 0.0000, N = 20; P2O5- = 0.1694 – 0.0318 Do
3 P2O5 Wft R = 0.91; α < 0.0000, N = 20; P2O5 = 0.1488 - 0.00019 Wft
4 P2O5 Wftr R = 0.94; α < 0.0000, N = 20; P2O5 = 0.1504 - 0.00034 Wftr
5 P2O5 Wfl R = 0.87; α < 0.0000, N = 20; P2O5 = 0.1402 - 0.00039 Wfl
6 P2O5 Wff R = 0.95; α < 0.0000; N = 20; P2O5 = 0.1386 - 0.00363 Wfl
7 P2O5 Wdt R = 0.94; α < 0.0000; N = 20; P2O5 = 0.1441 - 0.00022 Wdt
8 P2O5 Wdtr R = 0.95; α < 0.0000; N = 20; P2O5 = 0.1473 - 0.00037 Wdtr
9 P2O5- Wfl R = 0.91; α < 0.0000; N = 20; P2O5 = 0.1398 - 0.0006 Wdl
10 P2O5- Wff R = 0.91; α < 0.0000; N = 20; P2O5 = 0.1429 - 0.00105 Wdf
11 P2O5- Wbt R = 0.95; α < 0.0000; N = 20; P2O5 = 0.1429 - 0.00105 Wbt
12 P2O5 Wbtr R = 0.95; α < 0.0000; N = 20; P2O5 = 0.1462 - 0.002 Wbtr
13 P2O5 Wbl R = 0.91; α < 0.0000; N = 20; P2O5 = 0.1405 - 0.0033 Wbl
14 P2O5 Wbf R = 0.96; α < 0.0000; N = 20; P2O5- = 0.1305 - 0.0032 Wbf
Table 9. Relationship between NH4+ with Growth indicators.
No. Chemical Indicator Growth Indicators Statitiscal Parameters
1 NH4+ H (m) R = 0.85; α <0.0000, N = 20; NH4+ = 25.3725 – 2.2317 H
2 NH4+ Do R = 0.88; α < 0.0000, N = 20; NH4+ = 20.6937 – 1.9005 Do
3 NH4+ Wft R = 0.87; α < 0.0000, N = 20; NH4+ = 19.4490 - 0.01117 Wft
4 NH4+ Wftr R = 0.88; α < 0.0000, N = 20; NH4+ = 19.4605 - 0.0199 Wftr
5 NH4+ Wfl R = 0.87; α < 0.0000, N = 20; NH4+ = 19.0636 - 0.0240 Wfl
6 NH4+ Wff R = 0.98; α < 0.0000; N = 20; NH4+ = 19.0564 - 0.2326 Wfl
7 NH4+ Wdt R = 0.92; α < 0.0000; N = 20; NH4+ = 19.2101 - 0.0131 Wdt
8 NH4+ Wdtr R = 0.89; α < 0.0000; N = 20; NH4+ = 19.3007 - 0.0214 Wdtr
9 NH4+ - Wfl R = 0.91; α < 0.0000; N = 20; NH4+ =19.0568 - 0.03737 Wdl
10 NH4+ - Wff R = 0.98; α < 0.0000; N = 20; NH4+ = 18.5243 - 0.2262 Wdf
11 NH4+ - Wbt R = 0.93; α < 0.0000; N = 20; NH4+ = 19.1576 - 0.0639 Wbt
12 NH4+ Wbtr R = 0.90; α < 0.0000; N = 20; NH4+ = 19.2385 - 0.1177 Wbtr
13 NH4+ Wbl R = 0.92; α < 0.0000; N = 20; NH4+ = 19.0871 - 0.0210 Wbl
14 NH4+ Wbf R = 0.98; α < 0.0000; N = 20; NH4+ = 18.5240 - 0.3852 Wbf
Table 10. Relationship between pH with Growth indicators.
No. Chemical Indicator Growth Indicators Statitiscal Parameters
1 pH H (m) R = 0.32; α <0.0000, N = 20; pH = 4.7248 – 0.0938 H
2 pH Do R = 0.49; α < 0.0000, N = 20; pH = 4.6234 – 0.1186 Do
3 pH Wft R = 0.43; α < 0.0000, N = 20; pH = 4.5213 - 0.0003 Wft
4 pH Wftr R = 0.39; α < 0.0000, N = 20; pH = 4.5037 - 0.001 Wftr
5 pH Wfl R = 0.53; α < 0.0000, N = 20; pH = 4.5383 - 0.00163 Wfl
6 pH Wff R = 0.65; α < 0.0000; N = 20; pH = 4.5567 - 0.0172 Wfl
7 pH Wdt R = 0.49; α < 0.0000; N = 20; pH = 4.5241 - 0.00079 Wdt
8 pH Wdtr R = 0.42; α < 0.0000; N = 20; pH = 4.5061 - 0.00114 Wdtr
9 pH Wfl R = 0.55`; α < 0.0000; N = 20;pH = 4.5364 - 0.0025 Wdl
10 pH- Wff R = 0.63; α < 0.0000; N = 20;pH = 4.5132 - 0.0164 Wdf
11 pH- Wbt R = 0.51; α < 0.0000; N = 20; pH = 4.5260 - 0.0039 Wbt
12 pH Wbtr R = 0.44; α < 0.0000; N = 20; pH = 4.5104 - 0.065 Wbtr
13 pH Wbl R = 0.54; α < 0.0000; N = 20; pH = 4.5365 - 0.01355 Wbl
14 pH Wbf R = 0.63; α < 0.0000; N = 20; pH = 4.5132 - 0.0279 Wbf
Table 11. Relationship between Ni total with Growth indicators.
No. Chemical Indicator Growth Indicators Statitiscal Parameters
1 Ni total H (m) R = 0.88;, α <0.0000, N = 20; Ni total = - 1.1306 + 0.3648 H
2 Ni total Do R = 0.88; α < 0.0000, N = 20; Ni total = - 0.3165 + 0.2925 Do
3 Ni total Wft R = 0.88; α < 0.0000, N = 20; Ni total = - 0.1347 - 0.00175 Wft
4 Ni total Wftr R = 0.89; α < 0.0000, N = 20; Ni total = - 0.1435 - 0.00315 Wftr
5 Ni total Wfl R = 0.87; α < 0.0000, N = 20; Ni total = - 0.0652 + 0.0037 Wfl
6 Ni total Wff R = 0.98; α < 0.0000; N = 20; Ni total = - 0.0717 + 0.0362 Wfl
7 Ni total Wdt R = 0.92; α < 0.0000; N = 20; Ni total = - 0.1043 + 0.00206 Wdt
8 Ni total Wdtr R = 0.91; α < 0.0000; N = 20; Ni total = - 0.1241 + 0.0034 Wdtr
9 Ni total Wfl R = 0.91`; α < 0.0000; N = 20; Ni total = - 0.07607 + 0.00585 Wdl
10 Ni total - Wff R = 0.99; α < 0.0000; N = 20; Ni total = 0.0085 + 0.0354 Wdf
11 Ni total - Wbt R = 0.93; α < 0.0000; N = 20; Ni total = - 0.0958 + 0.01008 Wbt
12 Ni total Wbtr R = 0.91; α < 0.0000; N = 20; Ni total = - 0.1128 + 0.0186 Wbtr
13 Ni total Wbl R = 0.91; α < 0.0000; N = 20; Ni total = - 0.0815 + 0.0318 Wbl
14 Ni total Wbf R = 0.99; α < 0.0000; N = 20; Ni total = 0.0121 + 0.0599 Wbf
Table 12. Relationship between K2O with Growth indicators.
No. Chemical Indicator Growth Indicators Statitiscal Parameters
1 K2O H (m) R = 0.89;, α <0.0000, N = 20; K2O = - 0.7632 + 0.2499 H
2 K2O Do R = 0.87; α < 0.0000, N = 20; K2O = - 0.1960 + 0.1966 Do
3 K2O Wft R = 0.88; α < 0.0000, N = 20; K2O = - 0.0745 - 0.0012 Wft
4 K2O Wftr R = 0.89; α < 0.0000, N = 20; K2O = - 0.0829 + 0.0021 Wftr
5 K2O Wfl R = 0.87; α < 0.0000, N = 20; K2O = - 0.0281 + 0.0025 Wfl
6 K2O Wff R = 0.98; α < 0.0000; N = 20; K2O = - 0.0324 + 0.0244 Wfl
7 K2O Wdt R = 0.92; α < 0.0000; N = 20; K2O = - 0.0550 + 0.0014 Wdt
8 K2O Wdtr R = 0.91; α < 0.0000; N = 20; K2O = - 0.0702 + 0.0023 Wdtr
9 K2O Wfl R = 0.91`; α < 0.0000; N = 20; K2O = - 0.0347 + 0.0039 Wdl
10 K2O - Wff R = 0.98; α < 0.0000; N = 20; K2O = 0.0214 + 0.0239 Wdf
11 K2O - Wbt R = 0.93; α < 0.0000; N = 20; K2O = - 0.0492 + 0.0068 Wbt
12 K2O Wbtr R = 0.91; α < 0.0000; N = 20; K2O = - 0.0616 + 0.0126 Wbtr
13 K2O Wbl R = 0.91; α < 0.0000; N = 20; K2O = - 0.0383 + 0.0214 Wbl
14 K2O Wbf R = 0.99; α < 0.0000; N = 20; K2O = 0.0195 + 0.0409 Wbf
Table 13. Relationship between Fe2+ with Growth indicators.
No. Chemical Indicator Growth Indicators Statitiscal Parameters
1 Fe2+ H (m) R = 0.85;, α <0.0000, N = 20; Fe2+ = - 6.0954 + 1.9374 H
2 Fe2+ Do(cm) R = 0.87; α < 0.0000, N = 20; Fe2+ = - 1.8575 + 1.5877 Do
3 Fe2+ Wft R = 0.87; α < 0.0000, N = 20; Fe2+= - 0.8567 - 0.0094 Wft
4 Fe2+ Wftr R = 0.87; α < 0.0000, N = 20; Fe2+= - 0.8890 + 0.0169 Wftr
5 Fe2+ Wfl R = 0.87; α < 0.0000, N = 20; Fe2+= - 0.5021 + 0.0201 Wfl
6 Fe2+ Wff R = 0.98; α < 0.0000; N = 20; Fe2+= - 0.5351 + 0.1970 Wfl
7 Fe2+ Wdt R = 0.92; α < 0.0000; N = 20; Fe2+= - 0.6938 + 0.0112 Wdt
8 Fe2+ Wdtr R = 0.91; α < 0.0000; N = 20; Fe2+= - 0.7891 + 0.0184 Wdtr
9 Fe2+ Wfl R = 0.91`; α < 0.0000; N = 20; Fe2+= - 0.0588 + 0.0317 Wdl
10 Fe2+ - Wff R = 0.98; α < 0.0000; N = 20; Fe2+= 0.0953 + 0.1924 Wdf
11 Fe2+ - Wbt R = 0.93; α < 0.0000; N = 20; Fe2+= - 0.6499 + 0.0545 Wbt
12 Fe2+ Wbtr R = 0.90; α < 0.0000; N = 20; Fe2+= - 0.7341 + 0.1005 Wbtr
13 Fe2+ Wbl R = 0.91; α < 0.0000; N = 20; Fe2+= - 0.5776 + 0.1724 Wbl
14 Fe2+ Wbf R = 0.98; α < 0.0000; N = 20; Fe2+ = 0.0799 + 0.3260 Wbf
Table 14. Compare the chemical indicators of peat and biochar in U Minh Thuong National Park.
No. Material type pH Humic acid % Nitrogen total % P2O5% K2O% OM%
1 Peat 4.33 17.27 0.48 0.08 0.34 28.12
2 Biochar 10.10 1.30 0.18 0.40 0.71 34.82
α=0.05 <0.001 <0.001 <0.001 <0.001 <0.001 <0.001
Table 15. Comparison of biochar chemical indicators in U Minh Thuong and Kien Luong.
No. Sites pH Humic acid OM% Ash % C% N% P% K% Ca% Mg% SiO%
1 UMT 10.78 1.32 37.65 8.09 4.63 0.18 0.36 0.75 0.15 0.12 4.38
2 KL 11.21 0.82 36.51 6.79 3.79 0.15 0.28 0.56 0.12 0.08 4.65
α=0.05 <0.001 <0.001 <0.001 <0.001 <0.001 <0.001 <0.001 <0.001 <0.001 <0.001 <0.001
UMT: U Minh Thuong National Park. KL: Kien Lương of Long Xuyen Quadrangle of Mekong Delta.
Table 16. Chemical indicators of Pig urine aftre filtering through reed biochar.
No. Material type pH NH4+ (mg/L) NO3- (mg/L) Total nitrogen (mg/L) Phosphorus (mg/L)
1 Pig urine (Pi0) 8.8 150 1.5 984 48
2 Pig urine (Pi1) 9.07 140 0.6 860 17
3 Pig urine (Pi2) 9.21 135 0.55 838 13
4 Pig urine (Pi3) 9.41 134 0.5 821 10
5 Pig urine (Pi4) 9.53 130 0.45 726 4
α=0.05 <0.001 <0.001 <0.001 <0.001 <0.001
Pi0: Pig urine without filtring reed biochar. Pi1: Pig urine when filtered 1000 mililiters with 30 grams biochar. Pi2: Pig urine when filtered 1000 mililiters with 50 grams biochar. Pi3: Pig urine when filtered 1000 mililiters with 70 grams biochar. Pi4: Pig urine when filtered 1000 mililiters with 90 grams biochar.
Table 17. Content of chemical indicators of pig urine lost after filtering through reed biochar.
No. Material type NH4+ (mg/L) NO2- (mg/L Total nitrogen (mg/L) Phosphorus
(mg /L)
1 (Pi0) – (Pi1) 10 0.9 124 31
2 (Pi0) - (Pi2) 15 0.95 146 35
3 (Pi0) – (Pi3) 16 0.1 163 38
4 (Pi0) - (Pi4) 20 0.15 258 44
Pi0 – Pi1: Content of pig urine water indicators lost after flitering through 30 grams biochar. Pi0 – Pi2: Content of pig urine water indicators lost after flitering through 50 grams biochar. Pi0 – Pi3: Content of pig urine water indicators lost after flitering through 70 grams biochar. Pi0 – Pi4: Content of pig urine water indicators lost after flitering through 90 grams biochar.
Table 18. Remaining chemical indicators of phosphorus and nitrogen dissolved water after filtering through reed biochar.
No. Material type Phosphorus (mg/L) No. Material type Nitrogen (mg/L)
1 P0 448 1 N0 556
2 P1 443 2 N1 549
3 P2 441 3 N2 543
4 P3 438 4 N3 424
5 P4 432 5 N4 364
α=0.05 <0.001 α=0.05 <0.001
P0: Mix 1000 mililiters of water with 10 grams of 16 % phosphorus. P1: Water mixed with nitrogen flitered through 30 grams of reed biochar. P2: Water mixed with nitrogen flitered through 50 grams of reed biochar. P3: Water mixed with nitrogen flitered through 70 grams of reed biochar. P4: Water mixed with nitrogen flitered through 90 grams of reed biochar.
Table 19. Content of chemical indicators lost of nitrogen dissolved water after filtering through reed biochar.
No. Material type Phosphorus (mg/L) No. Material type Nitrogen (mg/L)
1 P0 – P1 5 1 N0 – N1 7
2 P0 – P2 7 2 N0 – N2 13
3 P0 – P3 10 3 N0 – N3 32
4 P0 – P4 26 4 N0 – N4 92
P0 – P1:Content of phosphorus lost after flitering through 30 grams of reed biochar. P0 – P2: Content of phosphorus lost after flitering through 50 grams of reed biochar. P0 – P3: Content of phosphorus lost after flitering through 70 grams of reed biochar. P0 – P4: Content of phosphorus lost after flitering through 90 grams of reed biochar.
Disclaimer/Publisher’s Note: The statements, opinions and data contained in all publications are solely those of the individual author(s) and contributor(s) and not of MDPI and/or the editor(s). MDPI and/or the editor(s) disclaim responsibility for any injury to people or property resulting from any ideas, methods, instructions or products referred to in the content.
Copyright: This open access article is published under a Creative Commons CC BY 4.0 license, which permit the free download, distribution, and reuse, provided that the author and preprint are cited in any reuse.
Prerpints.org logo

Preprints.org is a free preprint server supported by MDPI in Basel, Switzerland.

Subscribe

© 2024 MDPI (Basel, Switzerland) unless otherwise stated