1. Introduction
Optical coherence tomography (OCT) has changed our perception and understanding of many health issues, most notably in the field of ophthalmology. It has revolutionized the way in which vitreoretinal diseases are assessed and studied. Recently, new technological improvements in OCT have emerged with greater accuracy to detect changes in the different layers of the vitreoretinal interface, the inner retina, the pigment epithelium and the choroid, sharp near-histopathological images of anatomical cavities of the macula. OCT usefulness in clinical practice is becoming increasingly relevant. [
1,
2,
3,
4]. Frequently, the general population undergoes eye examinations to get eyeglasses. The eye exam with fundus photography by the optometrist is limited, because FP don´t show all of possible posterior pole alterations. In Spain, the optometrist can´t use mydriatic drops, it triggers that FP at optometrist practice reflects problems, such as miosis. Furthermore, non- mydriatic FP is associated with some limitations, such as, opacity of corneal or of ocular media [
5].
We aimed to evaluate the accuracy of an optometrist eye examination, that combines both FP and OCT for pole posterior diagnosis among the population and determine differences in the judgment accuracy between ophthalmologists (gold standard) and optometrist.
To get an early detection of pathologies or retinal alterations such as diabetic retinopathy, glaucoma or macular holes, is important that the optometrist, who is visited by the patient more frequently, has optimal criteria and instruments to carry out quality population screenings.
Therefore, determining how much information OCT provides on patients with apparently normal FP results is great value, as it would allow optometrists to identify abnormalities during routine examinations and refer them for further assessment by an ophthalmologist.
We followed the Standards for Reporting of Diagnostic Accuracy (STARD) guidelines to conduct this comparative study. Specifically, we developed a set of standard reports on the accuracy of FP/OCT diagnostic tests. The FP and OCT tests used in this study are procedures designed to detect and assess the condition of the posterior pole in greater detail. Understanding the accuracy of these tests is a critical part of clinical decision making so that we can appreciate any errors that a test may have and how often such errors are likely to occur. However, designing a study to evaluate the performance of these tests presents several challenges, not least the need to have a reference standard as the tests are subject to human interpretation. Therefore, in designing this study we considered common biases, how to avoid them, what statistical assessments to use, and how to report relevant results [
6,
7,
8].
2. Materials and Methods
This is a prospective, observational, comparative study of diagnostic capability. The study adhered to the principles of the Declaration of Helsinki and was approved by the Ethics Committee of the European University of Madrid. These principles were followed during all stages of the study. Approval Code: CIPI/22.220. Approval Date: Jul -29- 2022.
2.1. Description of the Patients
The study population consisted of people who came to the optometry’s clinic for various reasons over a period of four months, between July 2022 and October 2022. The inclusion criteria being only age, which had to be between 40 and 90 years of age, regardless of gender or other characteristics. Anyone entering the optometry clinic was offered the opportunity to enter the study. The recruitment center was a Spanish optometric clinic. Because of the inclusion criteria and the participant recruitment plan, the sample was defined as a consecutive series of participants between 40 and 90 years of age.
2.2. Test Procedure
Participating subjects were given a verbal and written explanation of the purpose of the study and the methods to be used. Written informed consent was obtained from all participants.
To evaluate the accuracy of adult eye examinations, detailed comprehensive eye examinations (corrected visual acuity and refraction, FP, macula OCT and optic nerve OCT was conducted. The diagnostic accuracy assessment included components such as the background information and images in a conventional optometry clinic. The examinations were performed by an optometrist external to this study to avoid bias.
The proposed methodology can be divided into three main steps. An assessment step, an analysis step, and a diagnostic precision calculation step. At assessment step, the two groups of evaluators (ophthalmologist and optometrist) evaluated and classified the posterior poles of the patients according to the information given in each stage (FP and FP+OCT). At analysis step, the classifications made by each group were compared and at the last step, all the information obtained was compiled and calculations were made.
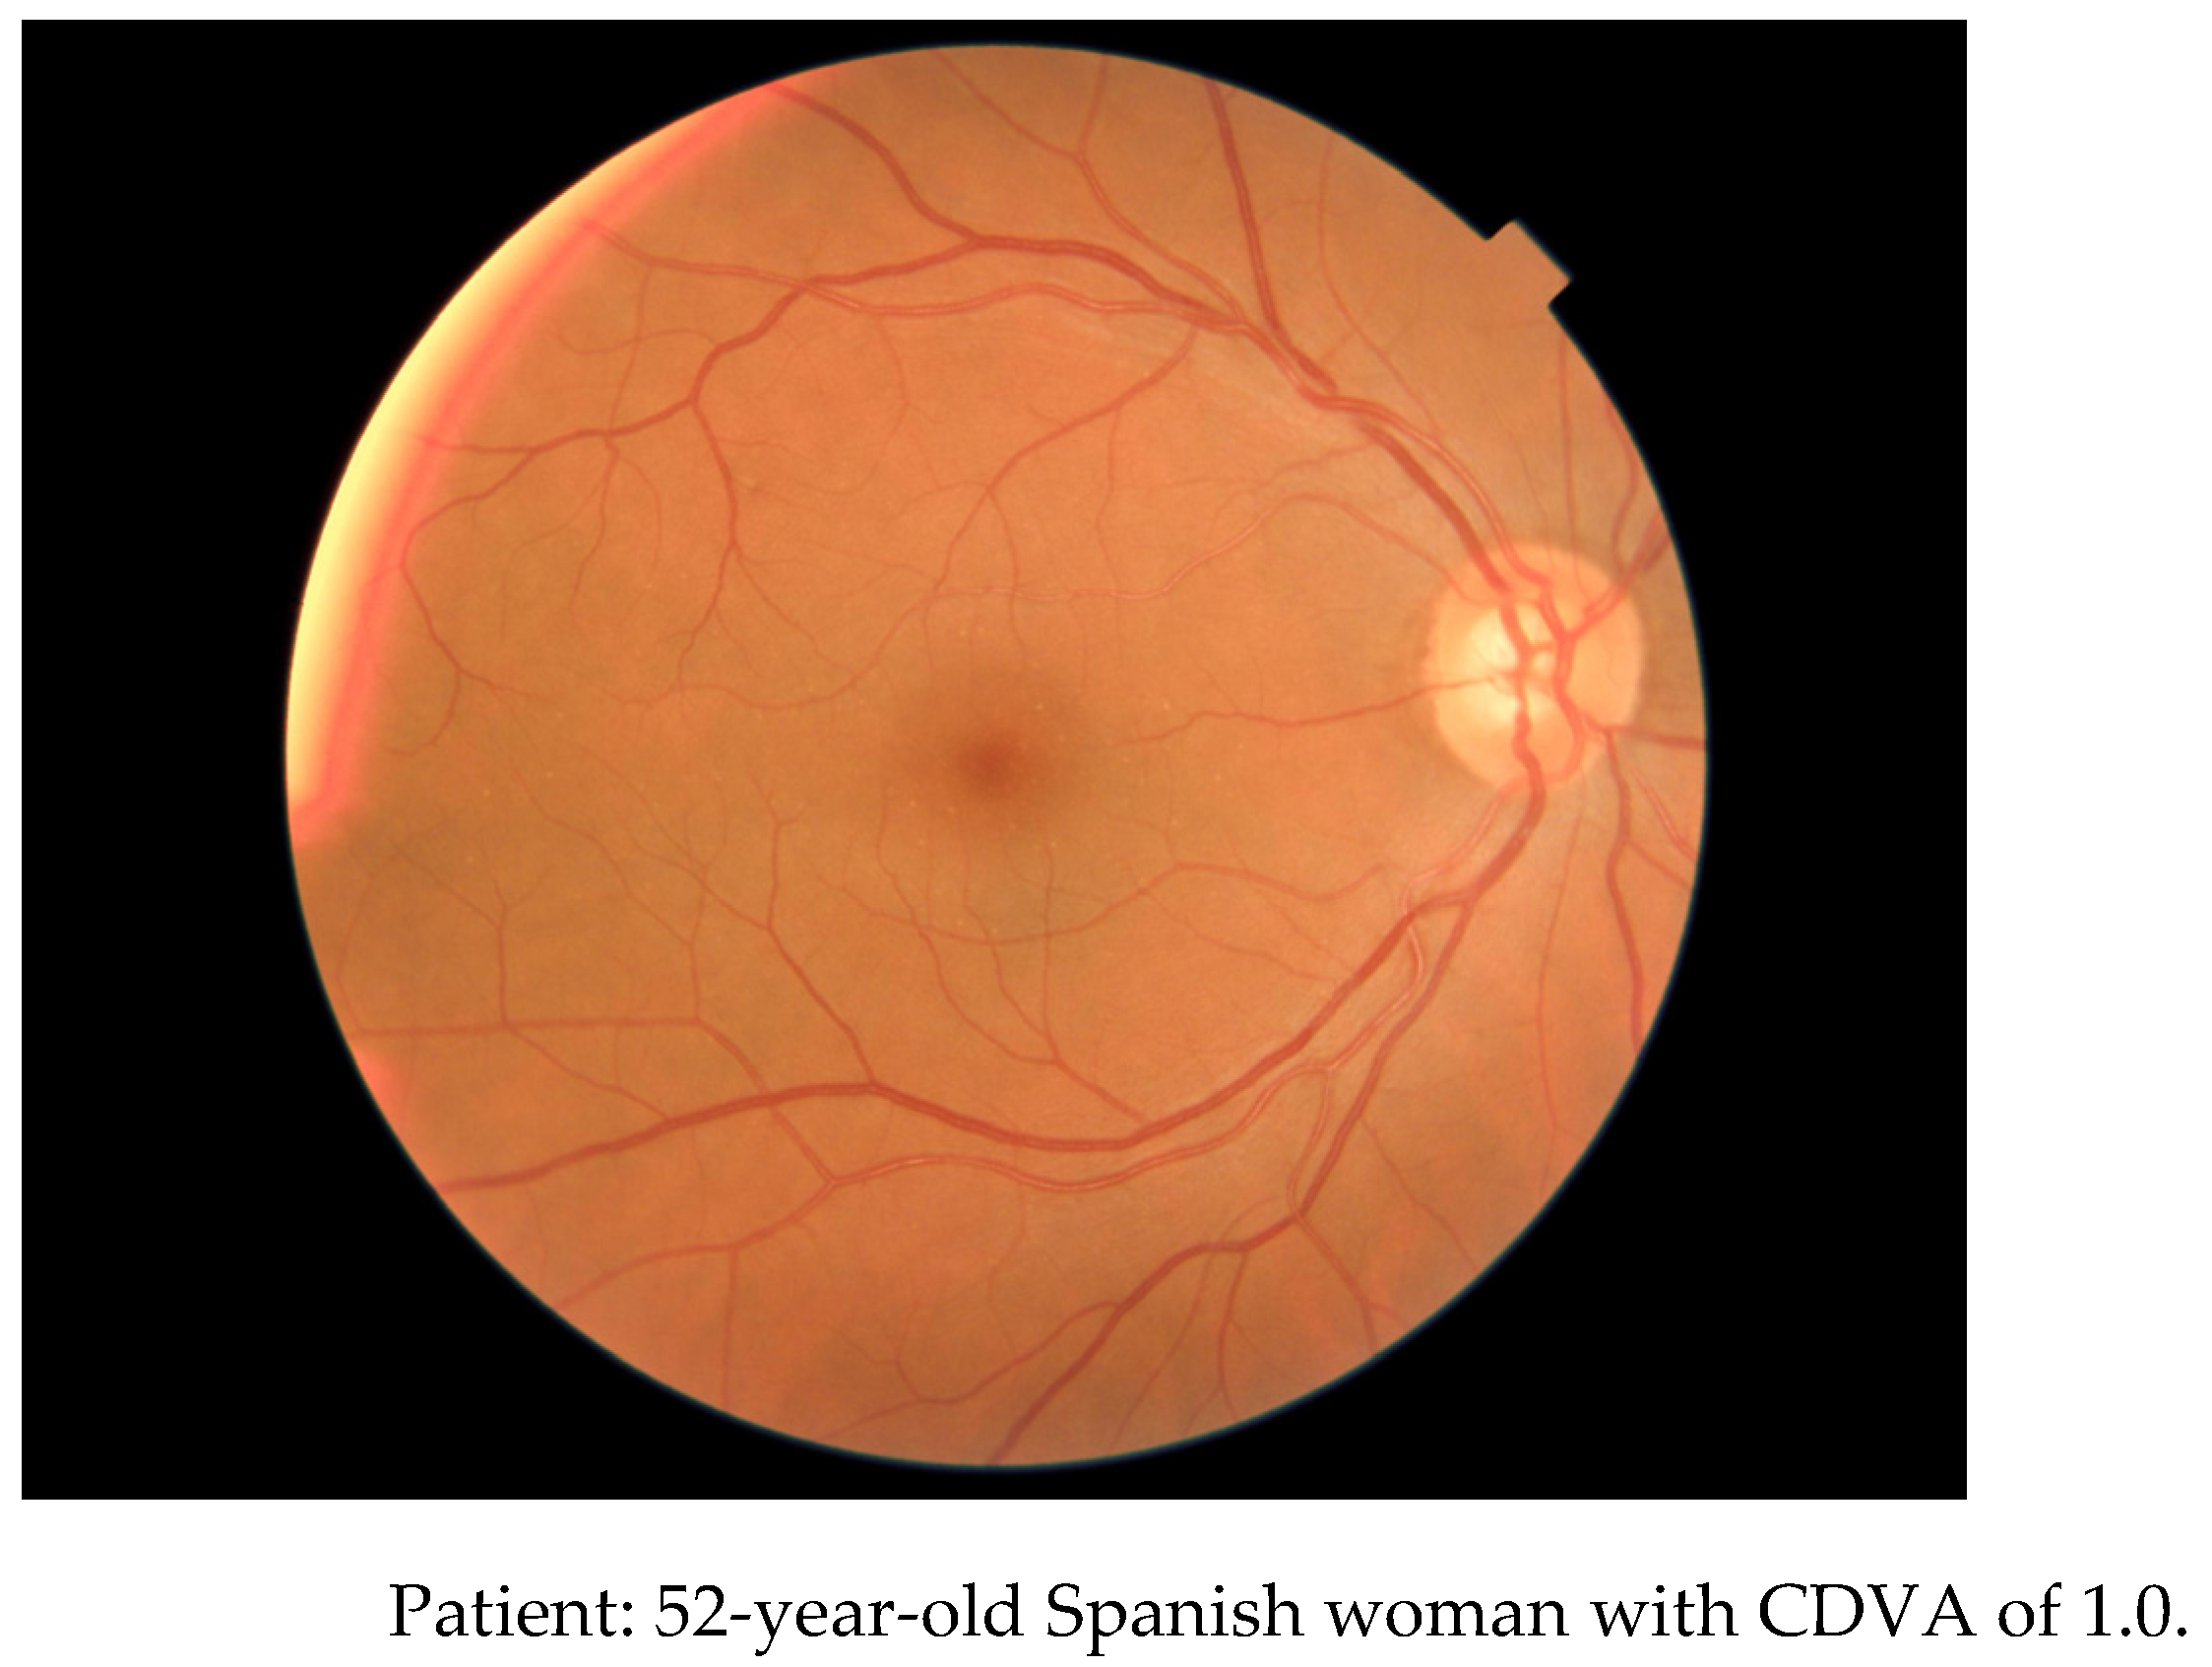
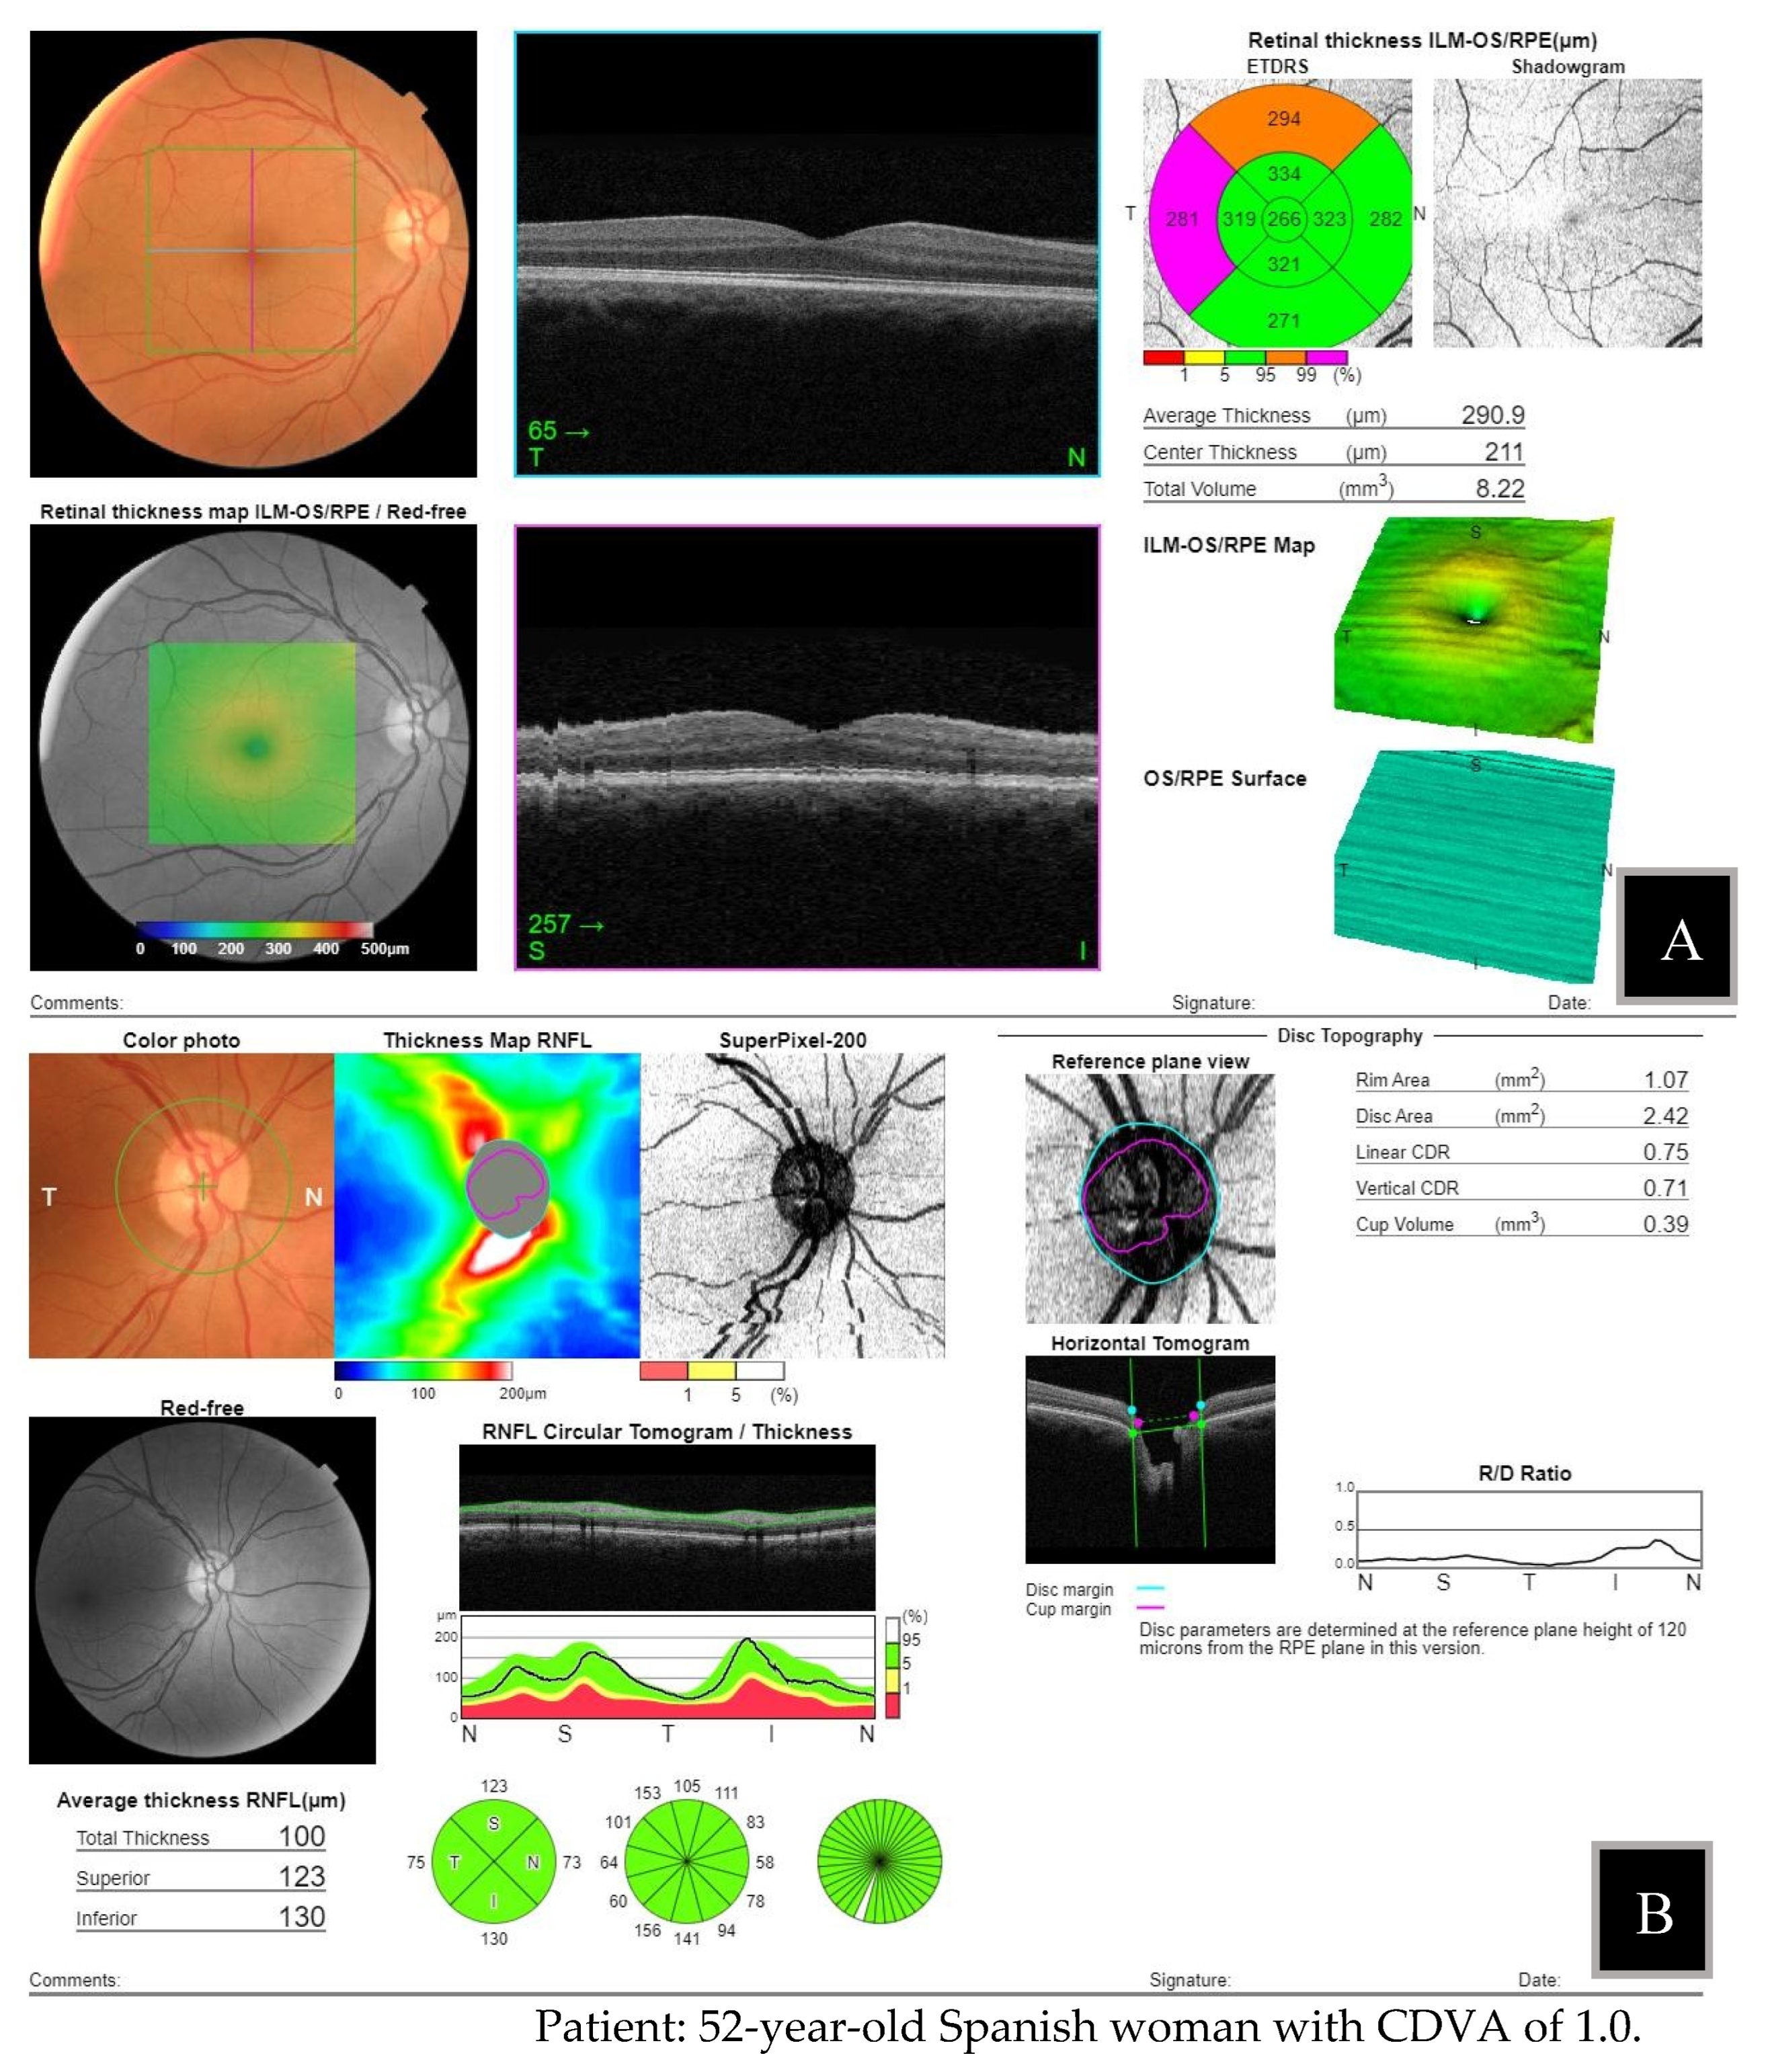
An optometrist external to the analysis performed the tests on each patient, after encrypting the information from the examinations performed. They were sent to the groups of examiners, (optometrists and ophthalmologists) in two different files: one with the patient's information, visual acuity and FP, and another with this information plus the reports obtained by macula 3D OCT and optic nerve 3D OCT. [
Figure 1 and
Figure 2], show an example of the information sent to examiners at stage I and II for each eye to assess.
The information gathered in these examinations, the best corrected distance visual acuity (CDVA, and the stored digital images (FP non-mydriatic imaging and report of macula 3D OCT and optic disc 3D OCT), were independently graded by two research groups. Both independently graded the posterior pole of each eye based on the masked information provided in each assessment stage. They followed pre-established criteria to ensure the consistency of the analysis methods.
Assessment stages:
- -
Stage I: based on conventional eye examination and FP.
- -
Stage II: based on conventional eye examination, FP and OCT.
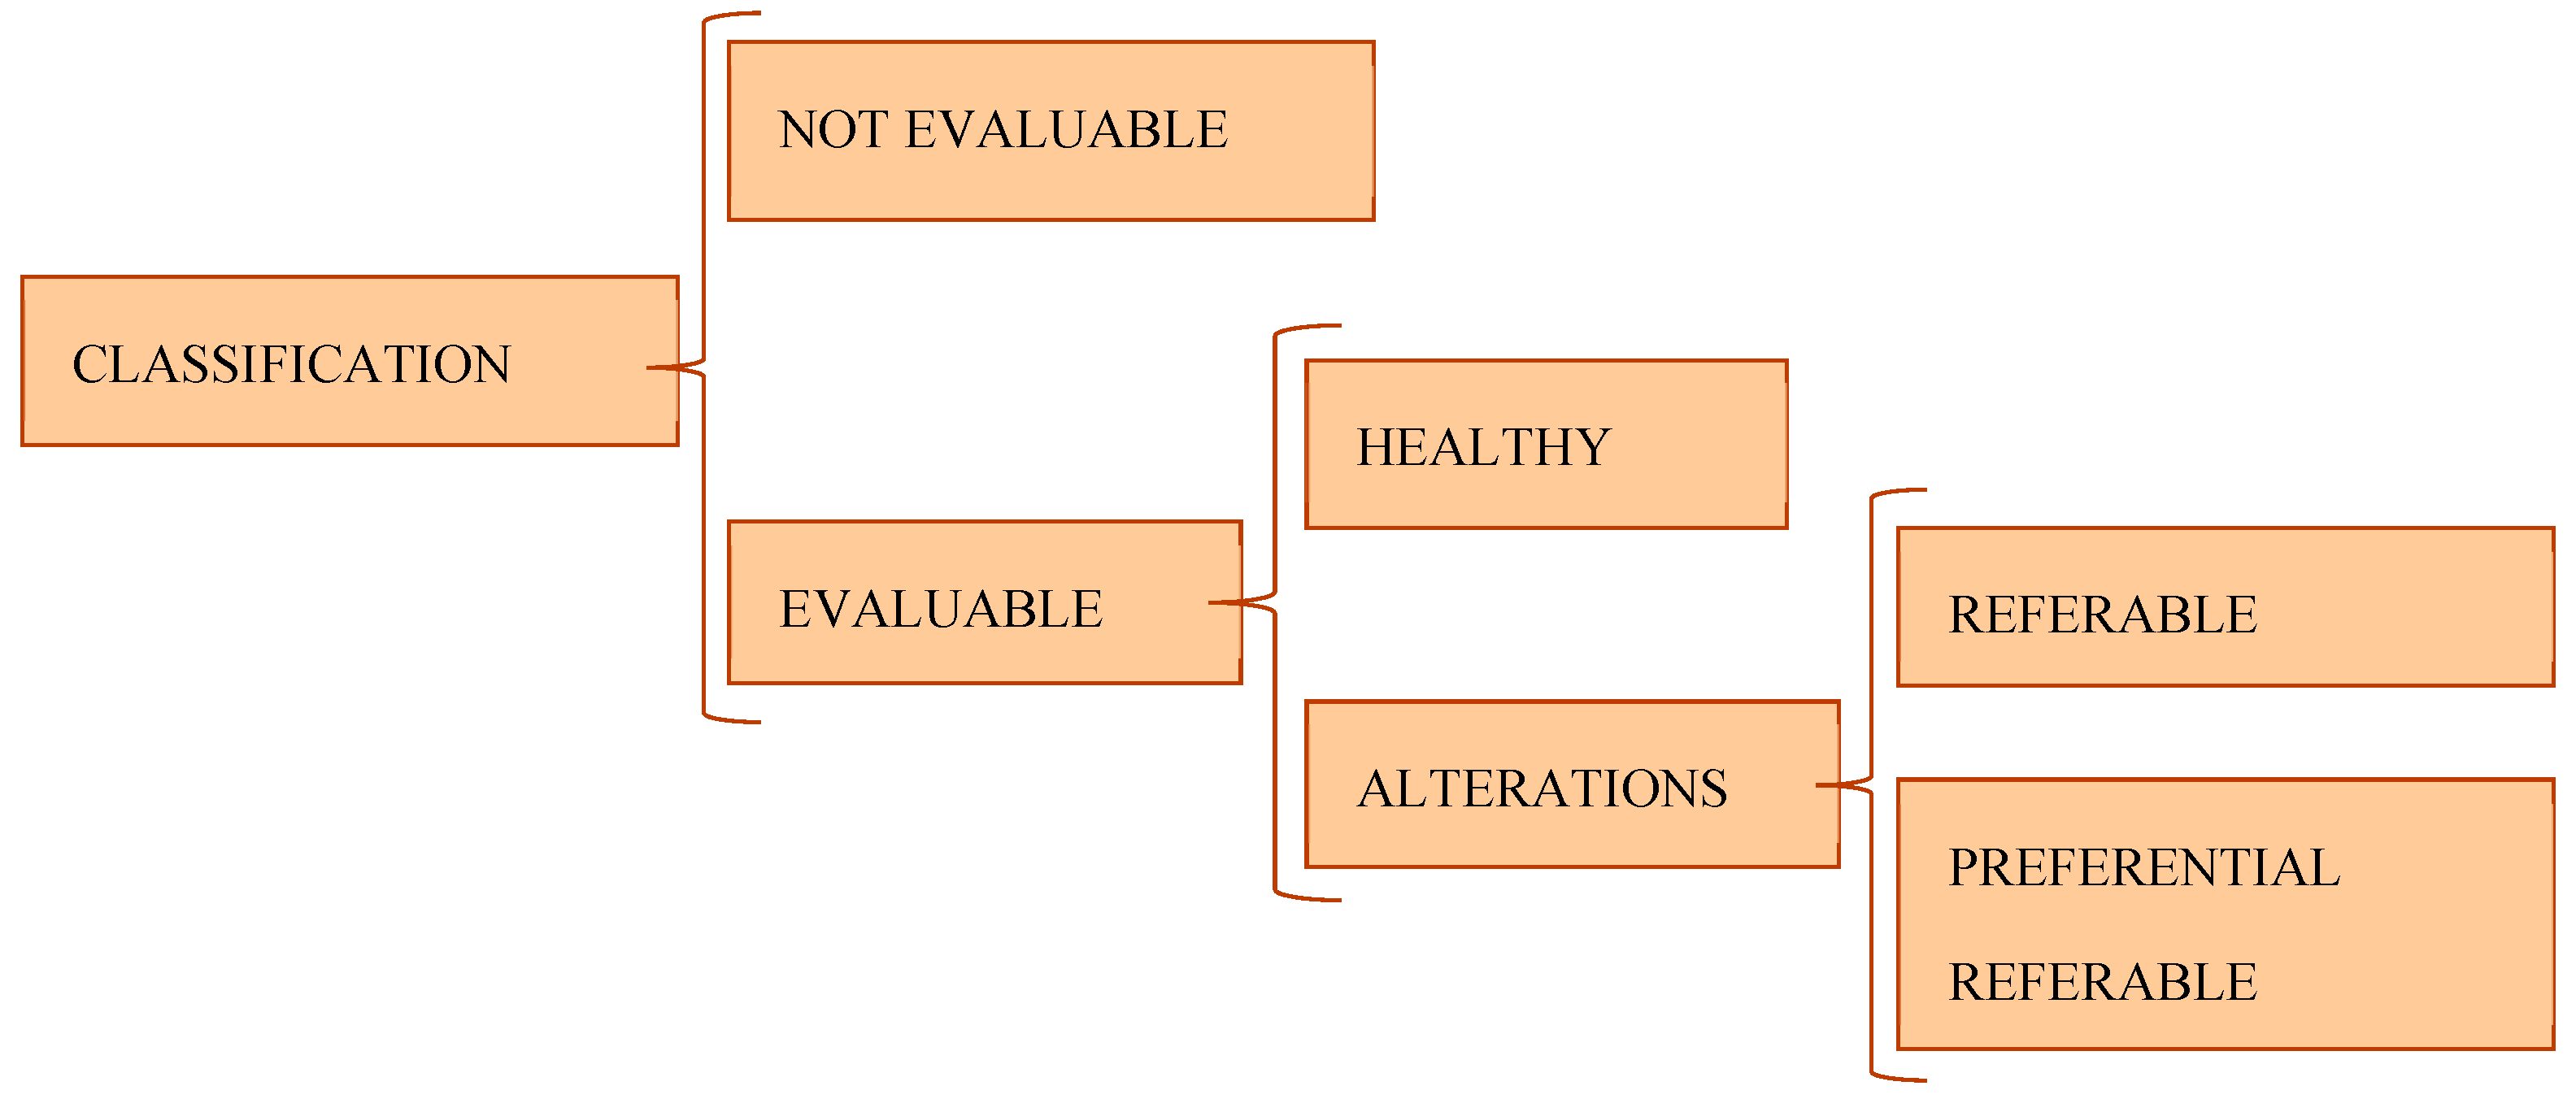
The eye fundus´ classifications were made following established criteria previously between the group of ophthalmologist and optometrist. They were classified into:
- (a)
Not evaluable: images with insufficient quality to categorize the state of the fundus of the eye.
- (b)
Evaluable: images with sufficient quality to categorize the state of the eye fundus. The evaluable cases could be healthy or have abnormalities. The eyes with abnormalities were classified in two scenarios depending on the severity of the alteration: referable or preferential referable [
Figure 3].
I. Healthy: includes cases that have a normal appearance, which rule out any pathological alteration in its characteristics different from those associated with age.
II. Referable: includes cases with physiognomic characteristics that lead to an alteration that must be valued as minor or major measured by an ophthalmologist without a specific period of time. They include those that present an abnormal appearance that modifies the retinal morphology and structure that show deterioration in health ocular of the posterior pole.
III. Preferential referable: includes cases with characteristics that entail any alteration that must be evaluated by an ophthalmologist in a short period of time.
2.3. Instrumentation
A Nidek ARK-510ª automated refractometer/keratometer and Snellen chart were used for the conventional eye examination. Subsequently, a Topcon Maestro2 was used for FP, macula OCT and optic nerve OCT. The 3D macula option was used for the OCT with a scan area of 6 mm x 6 mm. A report was generated for each eye which includes the retinal thickness map and reference database. The 3D optic disc OCT combines disc topography, FP, and retinal nerve fiber layer (RNFL) thickness measurements.
3. Results
3.1. Sample
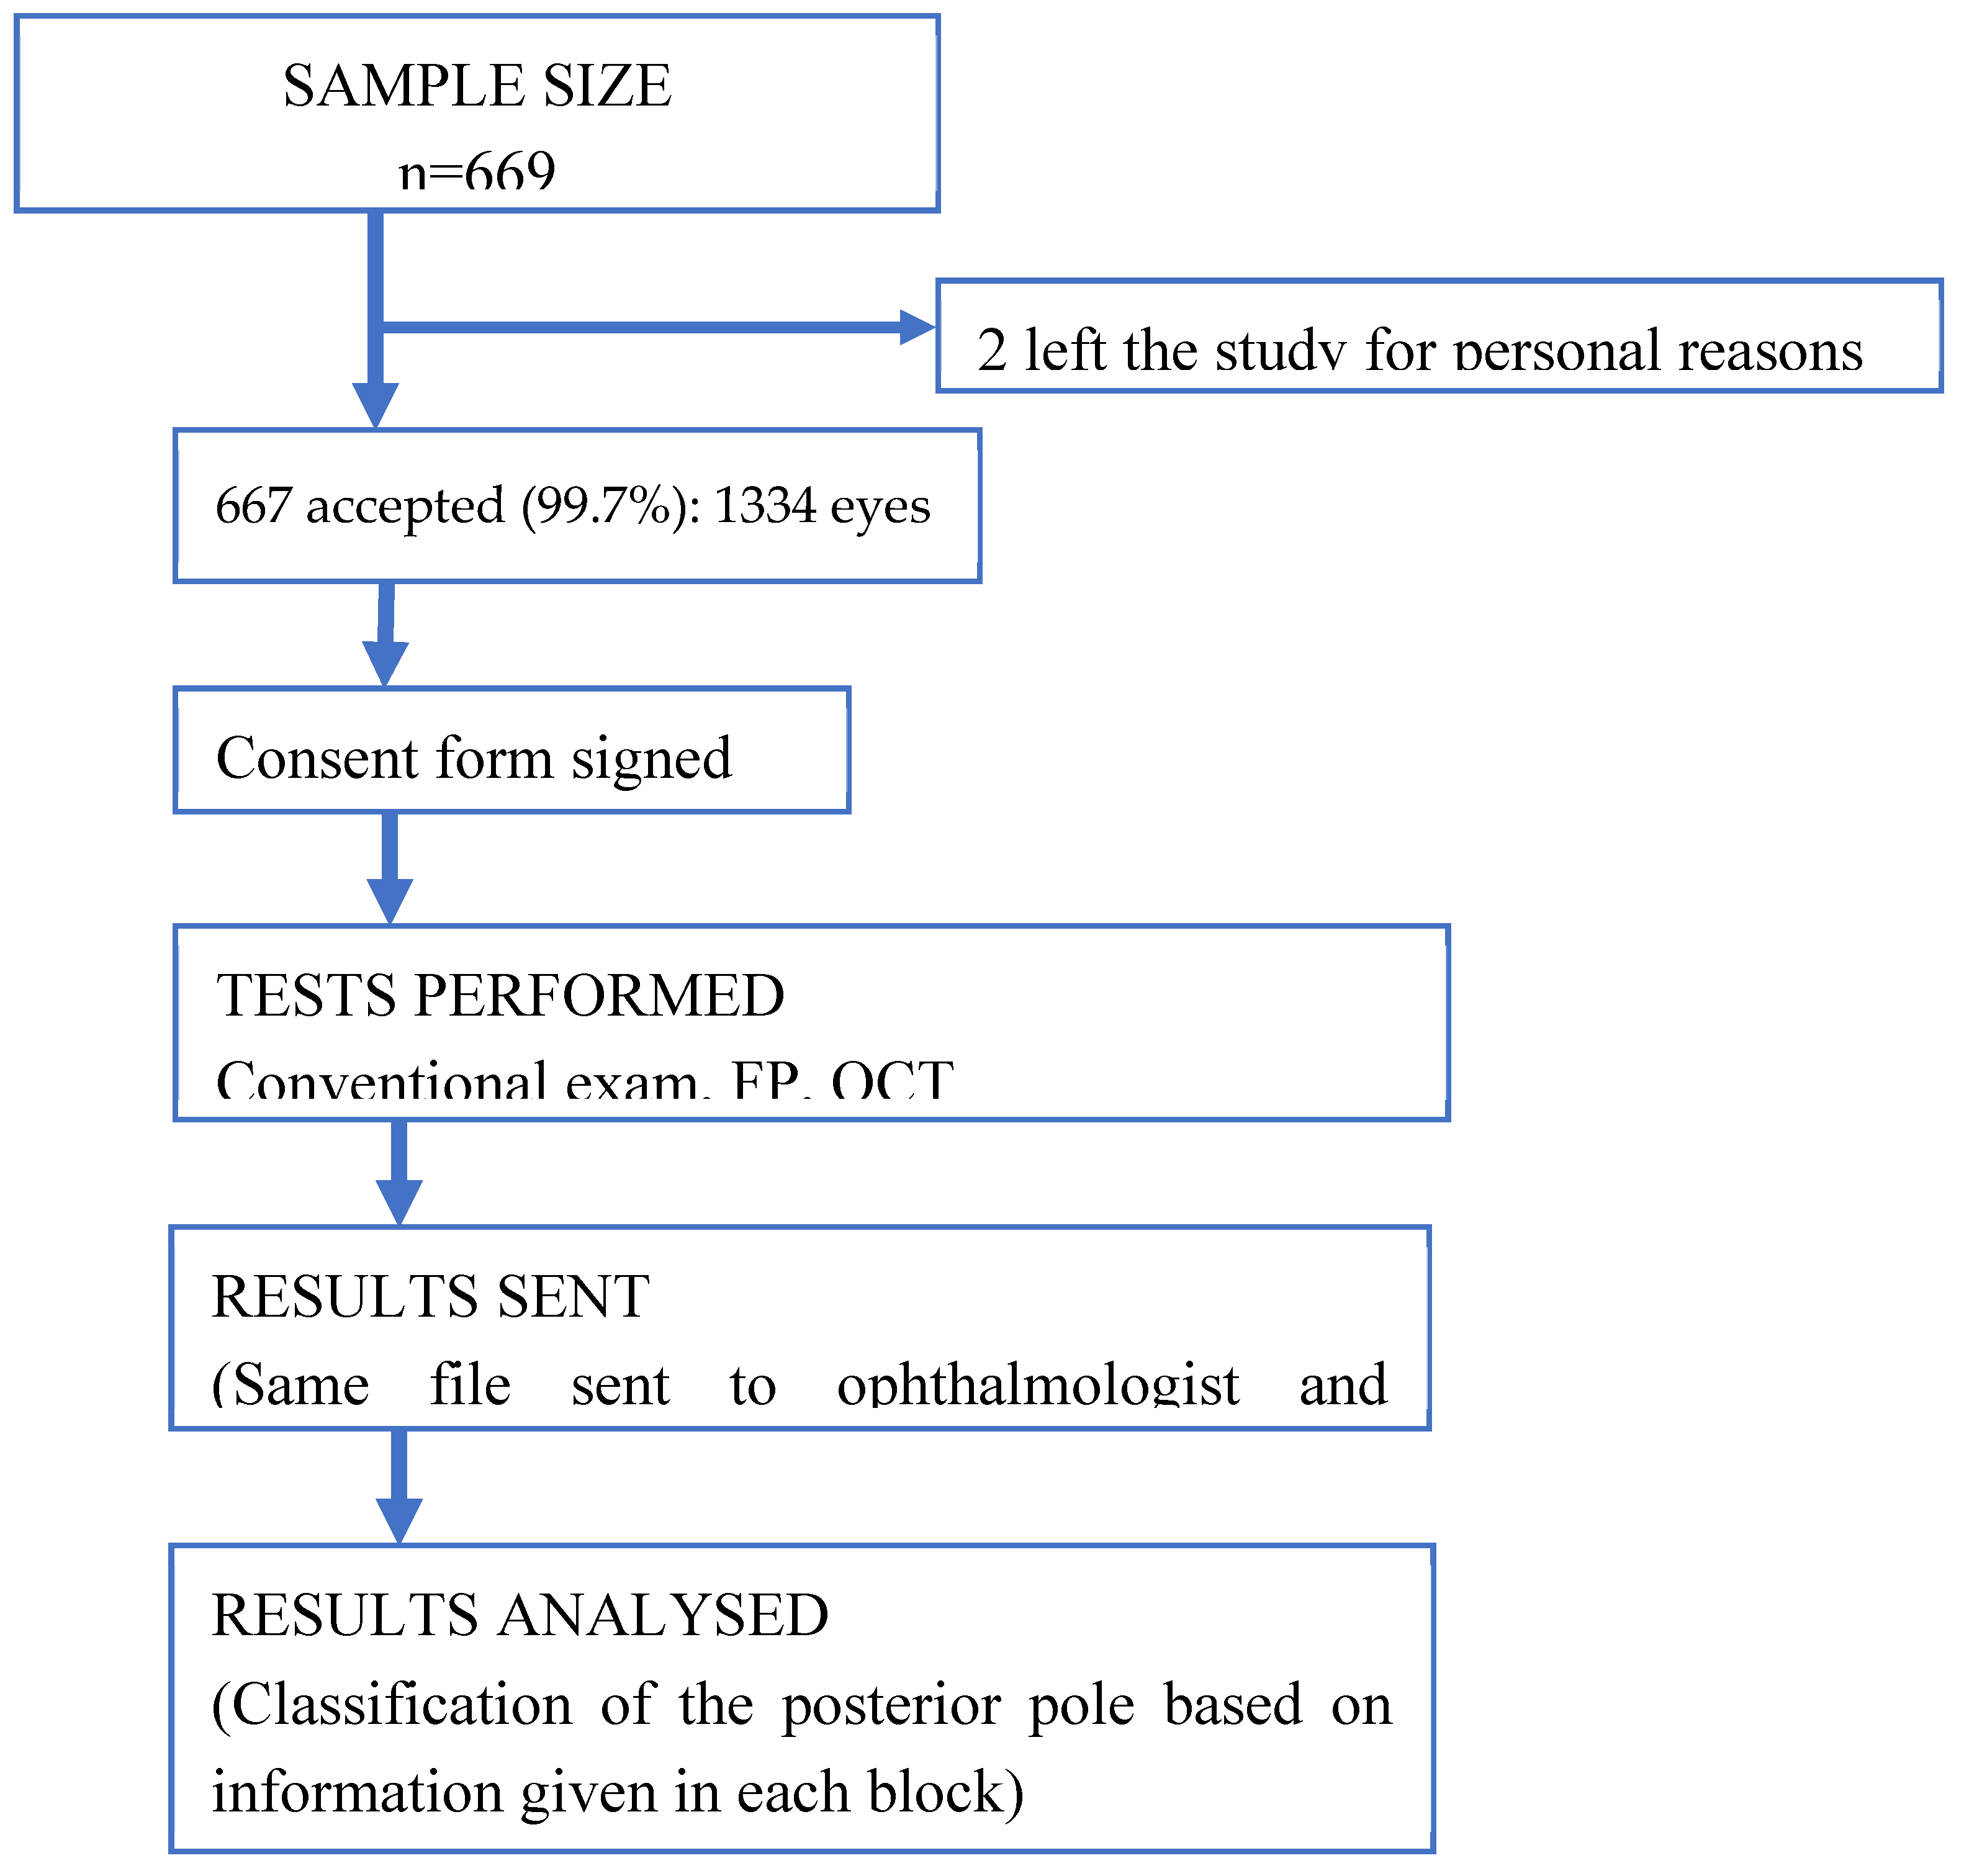
After a period of 14 months of analysis and evaluation of the eye funds by the two research groups independently, it was obtained a total of 1334 eyes assessment were included in this study, 68.5% of which were female. The mean age of the participants was 60 ± 18 years (interquartile range of 40-90 years). The (CDVA) was 0.89 and the median was 1, meaning that 50% of the records had a CDVA of 1. Two people were excluded because they did not want to participate in the study for personal reasons. [
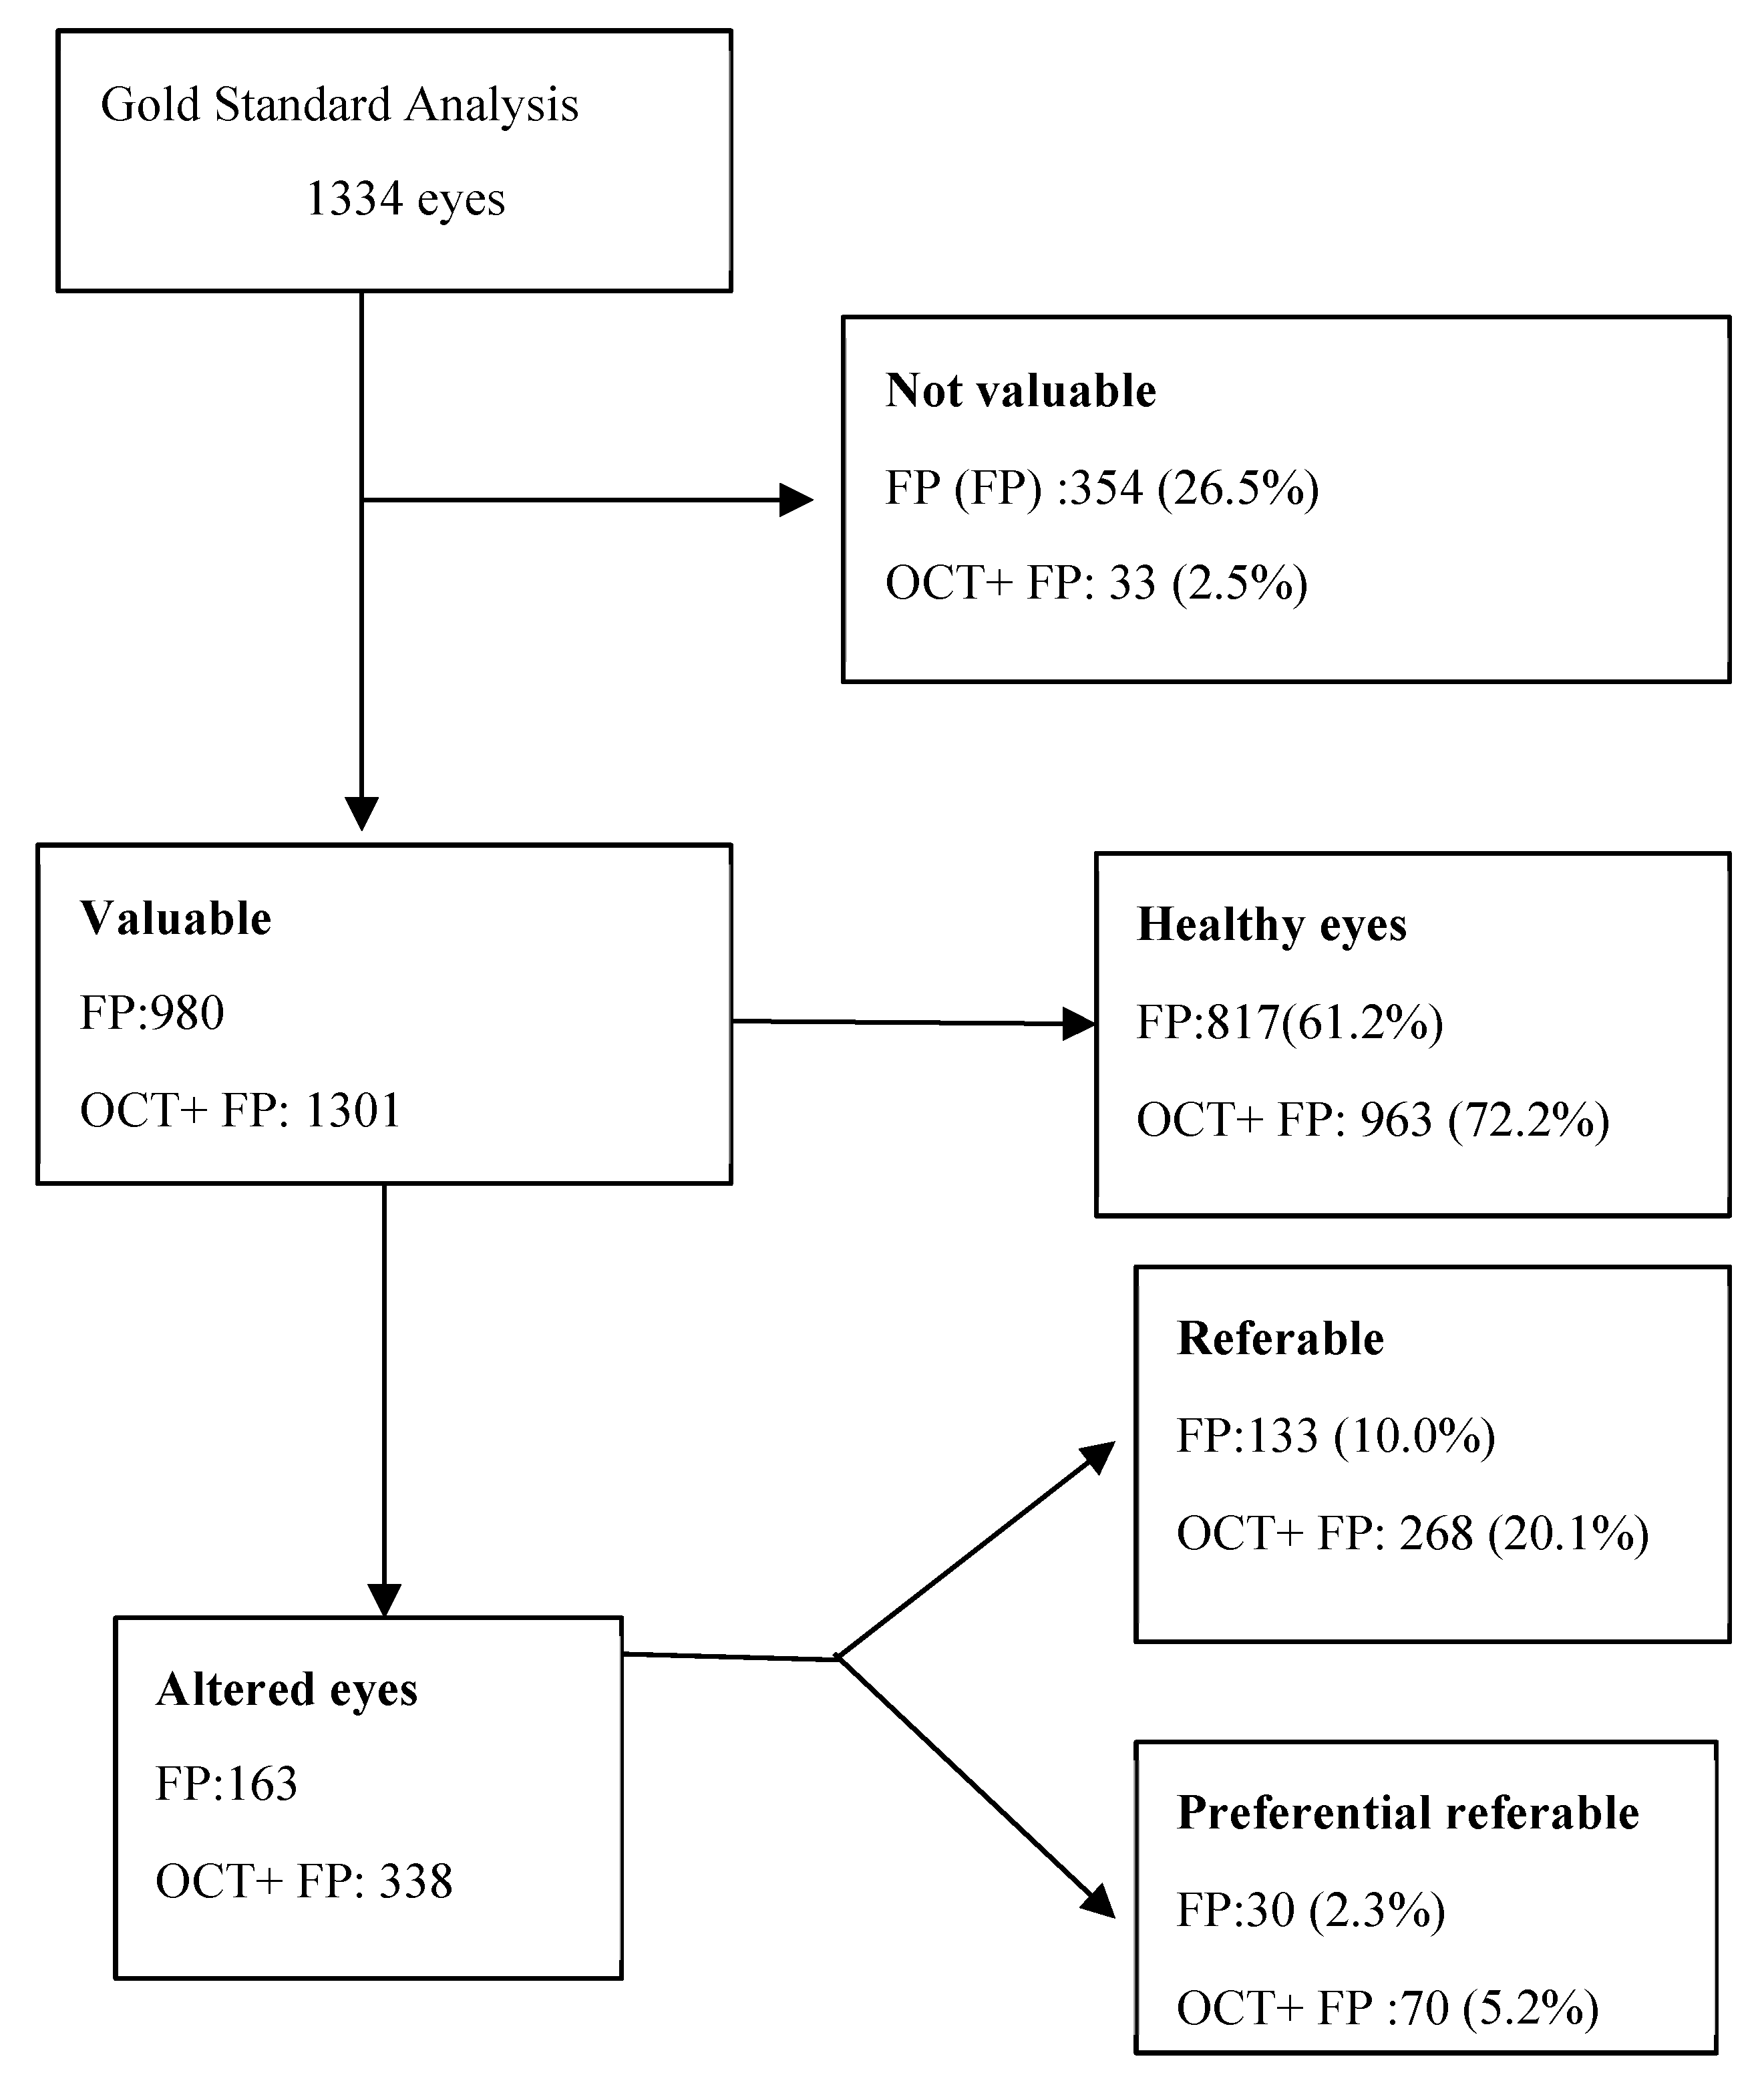
Figure 4].
With the purpose of simulating the daily practice of the optometrist who has the FP and the one who has the OCT. The following assessments were made. In the first stage, each research group reviewed and classified the posterior pole of each eye, based on the information given, based on the conventional eye examination together with the FP images. In this stage of the 1334 eyes, 974 could be evaluated. In the second stage, the research groups classified the status of the posterior pole based on the information given in the previous stage together with the reports provided by 3D macula OCT and 3D optic nerve OCT. In this stage of the 1334 eyes, 1278 could be evaluated.
[Appendix A (1)]. Results of first stage (FP) by ophthalmologist were: 354 non-valuable eyes and 980 valuable eyes, of which 817 healthy eyes and 163 altered eyes, 133 referable eyes and 30 preferential referable eyes. By optometrist: 141 non-valuable eyes and 1193 valuable eyes, of which 694 healthy and 499 altered eyes, 484 referable eyes and 15 preferential referable eyes. Results of second stage (FP + OCT) were according to the ophthalmologist: 33 non-valuable eyes and 1301 valuable eyes, of which 963 healthy eyes and 338 altered eyes, 268 referable eyes and 70 preferential referable eyes. According to the optometrist: 24 non-valuable and 1310 valuable eyes, of which 719 healthy eyes and 594 altered eyes, divided into 548 referable eyes and 43 preferential referable eyes.
The results obtained by the ophthalmologists are summarised in [
Table 1]. They show that a 24% of the sample could be evaluated by adding OCT to the FP examination. OCT provided evaluable images in almost all examined eyes (97.5%), compared to FP (73.5%). [
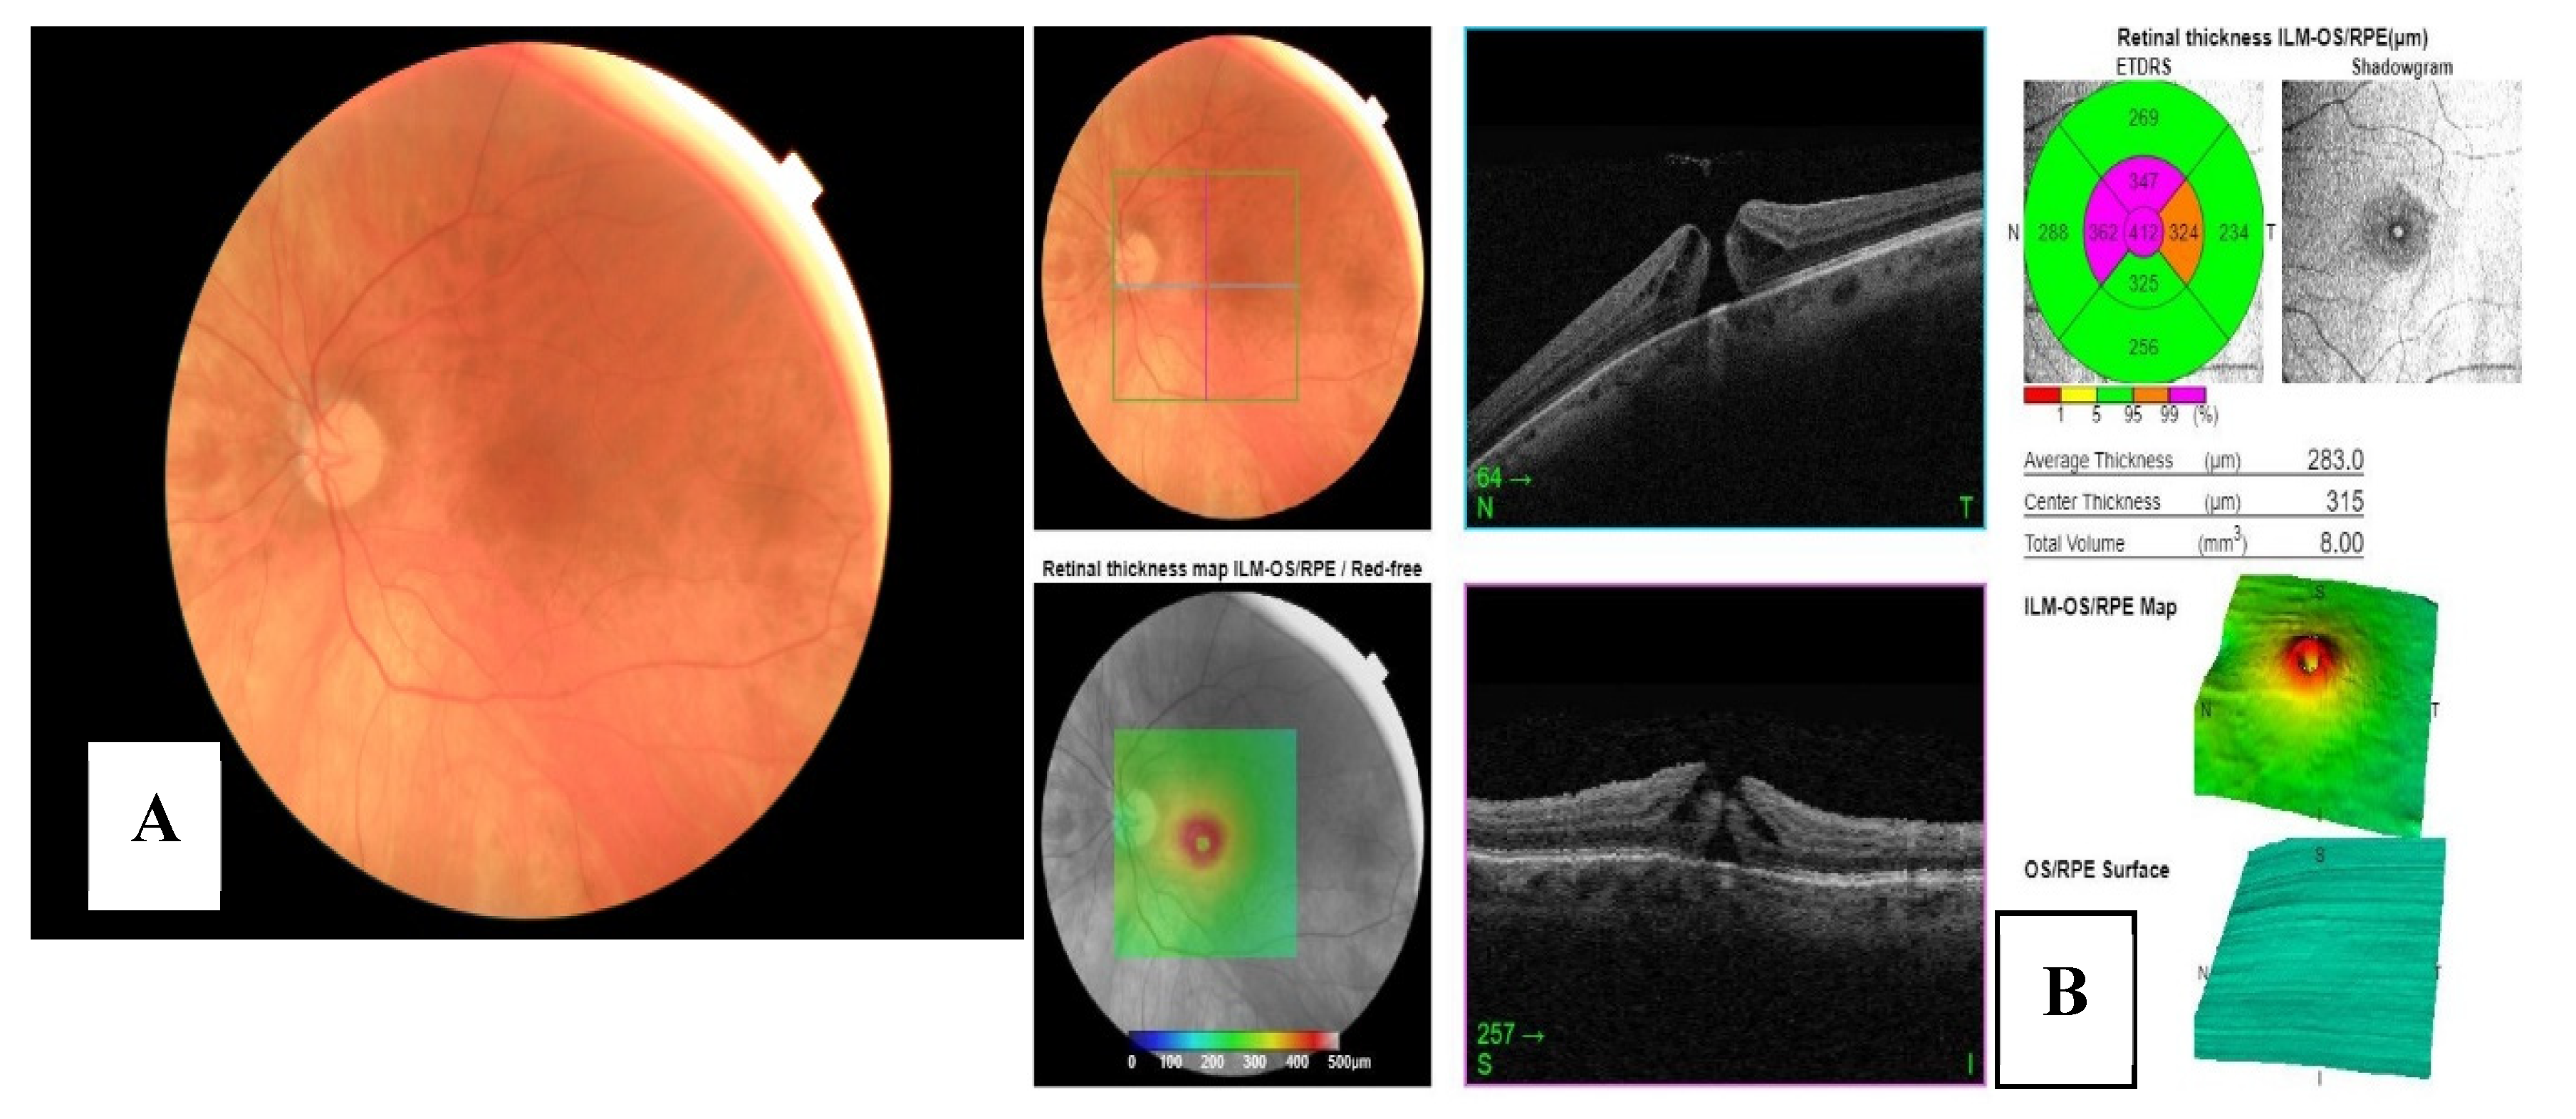
Figure 5] is an example posterior pole alteration not visible by FP.
When analysing the results by gold standard assessment, it observed that 13% of the sample, not assessable using FP, had alterations and an additional 2.9% of cases had abnormalities requiring urgent referral. The results in [
Table 1], display 40 eyes with severe retinal alterations were not referred as quickly as they needed due to not having OCT for their assessment.
3.2. Diagnostic Accuracy Values and Interobserver Agreement between Ophthalmologists and Optometrist
To calculate the diagnostic precision of both instruments, FP vs OCT, confusion matrix, 2x2 were created.
[Appendix A (2)]. The reference values, true positives and true negatives, were defined as cases diagnosed by the ophthalmologist’s investigation group, who was gold standard in this study. To perform the calculations of predictive values (sensibility, specificity…) and Kappa coefficient, the following were used: the confusion matrix 2x2, with contingence tables. [
Table 2 and
Table 3].
For statistical analysis, the sample was divided into posterior poles without abnormalities(healthy) and posterior poles with abnormalities (including those that are referable and urgently referable). Not evaluable cases are excluded [
9,
10,
11]. The sample was reduced from 1334 to 974 in the FP-based assessment and from 1334 to 1287 in the OCT and FP-based assessment due to poor image quality caused by opacity of corneal or of opacity ocular media media, miotic pupils, or lack of patient cooperation.
A series of statistical measures were calculated to provide safe and reliable results to ensure optometrists can provide high quality and valid assessments in their daily practice. As a result, the methods can be used to confirm the presence or absence of posterior pole abnormalities [
12,
13,
14]. [
Table 4] shows the calculated values of sensitivity, specificity, positive and negative predictive values, likelihood ratios, and kappa coefficient [
15,
16,
17,
18,
19,
20,
21,
22].
Analysing the results, it is observed that when comparing the assessment of the optometrist with that of the ophthalmologist (gold standard). Based on retinography, sensitivity is markedly higher than specificity, 0.981 CI: (0.97 - 0.99) versus 0.378 CI: (0.33 - 0.43). The same is true of sensitivity and specificity in OCT, although with a not so marked difference 0.956, CI: (0.94 - 0.97) versus 0.527, CI: (0.49 - 0.57). This is a consequence of an increase in false positives assessed by the optometrist, that is, the optometrist tends to consider more altered cases when the ophthalmologist does not consider it. The high sensitivity values compared to the relatively low specificity values, is supported by the likelihood ratio values. After performing the contrast to see if there were differences between the results obtained in FP and FP together with OCT, it affirmed that there are statistically significant differences since the p-value obtained was 0.01.
According to the classification of Landis and Koch when comparing optometrist and ophthalmologist evaluations in each block, we found that there was fair, 0.39, CI: (0.34 - 0.45) agreement between evaluations based on FP, which increased to moderate, 0.5 CI: (0.46 - 0.55) when OCT was added. Therefore, it can be deduced that the degree of agreement, beyond chance, between the optometrist and the ophthalmologist is greater when attaching the OCT to the FP for the evaluation of the patient's posterior pole.
4. Discussion
According to de World Health Organization, Globally, at least 2.2 billion people have a vision impairment or blindness, of whom at least 1 billion have a vision impairment that could have been prevented or has yet to be addressed [
23]. “Eye conditions and vision impairment are widespread, and far too often they still go untreated,” says Dr Tedros Adhanom Ghebreyesus, WHO Director-General.
Furthermore, the fact that 80% of cases of visual impairment are preventable shows that there is a lot of room for improvement. This figure is likely to be even higher in the future, given the ageing population and the increase in chronic diseases. The number of newly registered people with maculopathies in the Spanish National Organization of the Blind increased by 14% in 2022 compared to the total number of registered people, and it increased by 5.9% for those with glaucoma [
24,
25,
26,
27].
The aim of this study was to quantify the value that OCT adds to conventional eye examinations. This would allow us to determine the clinical relevance of OCT in identifying posterior pole abnormalities and refer patients with posterior pole abnormalities to an ophthalmologist based on a well-founded and evidenced criterion [
28,
29,
30,
31]. The research of this study has focused on two aspects: to know the value that OCT adds to FP in optometric practice and to assess what proportion of alterations are visible in OCT and not in FP.
So far, there have been published articles on OCT versus FP comparisons in different aspects such as to improve glaucoma screening [
32], or in the screening of age-related macular degeneration [
33], their findings demonstrated substantial differences in the diagnostic accuracy between screenings using FP accompanied by the OTC and FP alone.
Throughout this research, we have verified the validity of OCT as an addition to FP by calculating diagnostic accuracy values when comparing the use of these tests (
p-value: 0.01). In optometry clinic, retinal assessments based on FP and OCT are similar in terms of sensitivity, and however, FP combined with OCT are more specific that FP alone. These results are similar to article published by Tomoyuki Watanabe at al. [
32]
, where it evaluates the accuracy of glaucoma screening using FP combined with OCT and determine the agreement between ophthalmologists and ophthalmology residents. Ophthalmologists had the same sensitivity as ophthalmology residents in glaucoma screening. The kappa coefficient also reflects that the proportion of better-than-chance agreement compared to the maximum possible agreement is higher when OCT is used in addition to FP.
This would contribute to optometrists being as they would be able to provide quality assessments with sufficient criteria to refer posterior pole abnormalities to an ophthalmologist appropriately. It is relevant in Spain, where optometrists do not diagnose but are responsible for detecting any abnormalities that should be referred to an ophthalmologist. If we review bibliography on screening studies carried out in Spain, the coverage of diabetic retinopathy screening so far it is 32.4% (95% CI: 30.8-34.0%) [
34]. This coverage is far from the recommendation of the portfolio of standardized services according to the which all diabetic patients should have a biennial examination of the eye fundus.
Although the investment required to acquire OCT equipment is high, the prices are becoming more and more affordable. Optometrists are the first point of contact for patients suffering from visual impairment, which would help in the early detection of pathologies of the posterior pole. Therefore, the price does not diminish the significance of the findings, as they highlight the importance of complementing FP with OCT in optometry clinics.
Nowadays, artificial intelligence has shown great promise in detecting pathologies in the posterior pole, as shown in the article clinically applicable deep learning for diagnosis and referral in retinal disease [
35]. Medical imaging is expanding globally at an unprecedented rate. It is resulting in an ever-increasing amount of data that it requires human experience with criteria to interpret them. In the currently, there is a relative shortage of professionals trained to perform diagnosis of this magnitude [
36]. If you review the bibliography, you can find that algorithms are being generated to identify retinal pathologies based on OCT images, in data-limited situations such as the article by Karri SP at al. [
37], in which he explains these algorithms for detection diabetic macular edema and dry AMD. In a promising future, artificial intelligence may speed up patient screening. But in the meantime, a good assessment of the posterior pole by optometrists in opticians could include greater screening of patients and earlier referral to the ophthalmologist. According to the doctor Sarraf, a
clinical professor of ophthalmology in the Retinal Disorders and Ophthalmic Genetics Division at Jules Stein Eye Institute at University of California [
38], the advances in imaging and the experience of a skilled clinician is still essential in fundus examination and unlike the exam, no machine can give a sense of comfortable and gratification to the patient.
OCT imaging appears to improve the power of screening compared to FP alone. More complete studies should be carried out with a greater number and diversity of patients to evaluate the option of performing screening using FP with OCT to check the conclusions obtained here.
After careful analysis of the results, the limitations of this study have been observed. At this investigation we must bear in mind that the high sensitivity values compared to the specificity values obtained in FP and OCT. We can clarify it, as the optometrist tends to over refer, that is, to consider more altered posterior poles than the ophthalmologist considers. Therefore, it is important to generate a detailed and standardized guide with all possible alterations of the posterior pole, in order to know according to the ophthalmologist's criteria which cases should be referred and with what degree of preference. In addition, more studies with more researchers are needed for a more contrasted analysis.
5. Conclusions
Our study shows that for optometrists, the use of OCT add to FP non-mydriatic imaging provides a true, reliable assessment that has a higher degree of agreement with assessments done by ophthalmologists. Optometrists, as the first point of contact for the patient, would therefore have a more-informed assessment criterion for referral to an ophthalmologist, but they need a detailed and standardized guide to get a higher degree of agreement to the ophthalmologist's assessment criteria.
The addition of OCT to screening modality with FP, could avoid that 1 in 10 eyes with visible abnormalities on OCT images were not identified by the ophthalmologists when the assessment is based on FP alone. This highlights the need for further research and data collection on this issue to confirm whether OCT should be included as part of an outpatient screening program, with the aim of detecting all patients with posterior pole abnormalities. And thus reduce 80% of the cases of visual impairment that are currently preventable.
6. Patents
This section is not mandatory but may be added if there are patents resulting from the work reported in this manuscript.
Author Contributions
Conceptualization: MB and AS; methodology, MB and AS.; software CM and AS; validation, MM, AP and AS; formal analysis MM, CM, AS.; investigation, MM, RR and A S; resources: MM, MB and AS; data curation, CM and AS; writing—original draft preparation A S; writing—review and editing, MM, CM and AS; visualization MM, RR, MB, CM and AS.; supervision, MM and CM.; project administration, MM, CM and AS.; not funding acquisition. All authors have read and agreed to the published version of the manuscript.
Funding
This research received no external funding.
Institutional Review Board Statement
The study adhered to the principles of the Declaration of Helsinki and was approved by the Ethics Committee of the European University of Madrid. All participants agreed to participate by giving their written consent. Ethic Committee Name: The Ethics Committee of European University of Madrid. Approval Code: CIPI/22.220. Approval Date: Jul -29- 2022.
Informed Consent Statement
Informed consent was obtained from all subjects involved in the study. Written informed consent has been obtained from the patient(s) to publish this paper.
Conflicts of Interest
The authors declare no conflicts of interest.
Appendix A
- 2.
Confusion Matrix.
| |
ACTUAL VALUES |
| PREDICTED VALUES |
|
Altered eyes (gold standard) |
Healthy eyes (gold standard) |
|
Altered eyes (optometrist ) |
A= True positives (TP) |
B = False positives (FP) |
|
Healthy eyes ( optometrist ) |
C = False negative (FN) |
D=True negatives (TN) |
Appendix B
- (A).
Figure 1. Information sent in stage I: patient information, CDVA, and f FP non-mydriatic image.
- (B).
Figure 2. Information sent in stage II: patient information, CDVA, FP non-mydriatic image and OCT report 3D of macula (A) and optic disc (B).
- (C).
Figure 3. Cases´s classification.
- (D).
Figure 4. Prototypical flow diagram of a diagnostic accuracy study.
- (E).
Table 1. Table on the distribution of disease severity by ophthalmologists.
- (F).
Figure 5. FP non-mydriatic imaging. B: report by OCT 3D macula.
- (G).
Table 2. Confusion matrix used to define optometrist performance. Comparison based on FP.
- (H).
Table 3. Confusion matrix used to define optometrist performance. Comparison based on FP and OCT.
- (I).
Table 4. Summary of Diagnostic Accuracy Results.References
References
- Keeler, C.R. Evolution of the British ophthalmoscope. Doc Ophthalmol 94, 139–150 (1997). [CrossRef]
- Kniestedt C, Stamper RL. Visual acuity and its measurement. North America: Ophtalmol Clin N Am. 2003:16:155-170.
- Swanson EA, Izatt JA, Hee MR, Huang D, Lin CP, Schuman JS, Puliafito CA, Fujimoto JG. In vivo retinal imaging by optical coherence tomography. Opt Lett. 1993 Nov 1;18(21):1864-6. [CrossRef] [PubMed]
- De Fauw, J., Ledsam, J.R., Romera-Paredes, B. et al. Clinically applicable deep learning for diagnosis and referral in retinal disease. Nat Med 24, 1342–1350 (2018). [CrossRef]
- Guido Ripandelli, Andrea. Coppé, Antonella Capaldo & Mario Stirpe (1998) OpticaCoherence Tomography, Seminars in Ophthalmology, 13:4, 199-202. [CrossRef]
- Jennifer A. Bulle. Studies of Medical Tests Design and Analytical considerations. MSPMID: 32658645. [CrossRef]
- Viknesh Sounderajah , Hutan Ashrafian , Robert M Golub et al. Developing a reporting guideline for artificial intelligence-centred diagnostic test accuracy studies: the STARD-AI protocol. BMJ Open. 2021 jun 28;11(6): e047709. [CrossRef]
- Patrick M Bossuyt , Johannes B Reitsma, David E Bruns et al. Towards complete and accurate reporting of studies of diagnostic accuracy: the STARD initiative.
- BMJ 2003 Jan 4;326(7379):41-4. [CrossRef]
- Simon D, Boring JR III. Sensitivity, Specificity, and Predictive Value. In: Walker HK, Hall WD, Hurst JW, editors. Clinical Methods: The History, Physical, and Laboratory Examinations. 3rd ed. Boston: Butterworths; 1990. Chapter 6. [PubMed]
- Parikh R, Mathai A, Parikh S, Chandra Sekhar G, Thomas R. Understanding and using sensitivity, specificity and predictive values. Indian J Ophthalmol. 2008 Jan-Feb;56(1):45-50. [CrossRef] [PubMed] [PubMed Central]
- Frérot M, Lefebvre A, Aho S, Callier P, Astruc K, Aho Glélé LS. What is epidemiology? Changing definitions of epidemiology 1978-2017. PLoS One. 2018 Dec 10;13(12):e0208442. [CrossRef] [PubMed] [PubMed Central]
- Umemneku Chikere CM, Wilson K, Graziadio S, Vale L, Allen AJ. Diagnostic test evaluation methodology: A systematic review of methods employed to evaluate diagnostic tests in the absence of gold standard - An update. PLoS One. 2019 Oct 11;14(10):e0223832. [CrossRef] [PubMed] [PubMed Central]
- Franco F, Di Napoli A. An Introduction to the Evaluation of a Diagnostic Test: Sensitivity, Specificity, Predictive Value. Giornale di Tecniche Nefrologiche e Dialitiche. 2016;28(1):53-55. [CrossRef]
- Sørensen HT. Clinical Epidemiology - a fast new way to publish important research. Clin Epidemiol. 2009 Aug 9;1:17-8. [CrossRef] [PubMed] [PubMed Central]
- Polnaszek B, Gilmore-Bykovskyi A, Hovanes M, Roiland R, Ferguson P, Brown R, Kind AJ. Overcoming the Challenges of Unstructured Data in Multisite, Electronic Medical Record-based Abstraction. Med Care. 2016 Oct;54(10):e65-72. [CrossRef] [PubMed] [PubMed Central]
- Cerdal L, Jaime y Villarroel del P, Luis. Evaluación de la concordancia inter-observador en investigación pediátrica: Coeficiente de Kappa. Rev. chil. pediatr. [online]. 2008, vol.79, n.1 [citado 2024-01-17], pp.54-58. ISSN 0370-4106. [CrossRef]
- Eisenberg DM, Kaptchuk TJ, Post DE, Hrbek AL, O'Connor BB, Osypiuk K, Wayne PM, Buring JE, Levy DB. Establishing an Integrative Medicine Program Within an Academic Health Center: Essential Considerations. Acad Med. 2016 Sep;91(9):1223-30. [CrossRef] [PubMed] [PubMed Central]
- Muchuchuti S, Viriri S. Retinal Disease Detection Using Deep Learning Techniques: A Comprehensive Review. J Imaging. 2023 Apr 18;9(4):84. [CrossRef] [PubMed] [PubMed Central]
- Ørskov M, Vorum H, Larsen TB, Skjøth F. Evaluation of Risk Scores as Predictive Tools for Stroke in Patients with Retinal Artery Occlusion: A Danish Nationwide Cohort Study. TH Open. 2022 Nov 30;6(4):e429-e436. [CrossRef] [PubMed] [PubMed Central]
- Abraira V, Pérez de Vargas A. Generalization of the kappa coefficient for ordinal categorical data, multiple observers and incomplete designs. Qüestiió (1999); 23: 561-571.
- Feinstein AR, Cicchetti DV. High agreement but low kappa: I. The problems of two paradoxes. J Clin Epidemiol. (1990); 43: 543-549.
- Ehrlinger L, Wöß W. A Survey of Data Quality Measurement and Monitoring Tools. Front Big Data. 2022 Mar 31;5:850611. [CrossRef] [PubMed] [PubMed Central]
- World report on vision. Geneva: World Health Organization; 2019. Licence: CC BY-NC-SA 3.0 IGO.
- Cesareo M, Ciuffoletti E, Martucci A, Sebastiani J, Sorge RP, Lamantea E, Garavaglia B, Ricci F, Cusumano A, Nucci C, Brancati F. Assessment of the retinal posterior pole in dominant optic atrophy by spectral-domain optical coherence tomography and microperimetry. PLoS One. 2017 Mar 30;12(3):e0174560. [CrossRef] [PubMed] [PubMed Central]
- International Agency for the Prevention of Blindness (IAPB). Informe (2010). Vision 2020: The right to sight. World Health Organization (WHO) and International Agency for Blindness Prevention (IAPB). Action Plan (2006-2011).
- Marques AP, Ramke J, Cairns J, Butt T, Zhang JH, Muirhead D, Jones I, Tong BAMA, Swenor BK, Faal H, Bourne RRA, Frick KD, Burton MJ. Global economic productivity losses from vision impairment and blindness. EClinicalMedicine. 2021 Apr 26;35:100852. [33]. Registro de Afiliados a la ONCE (2022). Organización Nacional de Ciegos Españoles. [CrossRef] [PubMed] [PubMed Central]
- Marques AP, Ramke J, Cairns J, Butt T, Zhang JH, Jones I, Jovic M, Nandakumar A, Faal H, Taylor H, Bastawrous A, Braithwaite T, Resnikoff S, Khaw PT, Bourne R, Gordon I, Frick K, Burton MJ. La economía de la discapacidad visual y sus principales causas: una revisión sistemática. EClinicalMedicine. 22 de marzo de 2022;46:101354. [CrossRef] [PubMed] [PubMed Central]
- Portal Web del Instituto Nacional de Estadística (INE), 2022.
- Li S, Ye E, Huang J, Wang J, Zhao Y, Niu D, Yue S, Huang X, Liu J, Hou X, Wu J. Global, regional, and national years lived with disability due to blindness and vision loss from 1990 to 2019: Findings from the Global Burden of Disease Study 2019. Front Public Health. 2022 Oct 28;10:1033495. [CrossRef] [PubMed] [PubMed Central]
- Zhou C, Li S, Ye L, Chen C, Liu S, Yang H, Zhuang P, Liu Z, Jiang H, Han J, Jiang Y, Zhou L, Zhou X, Xiao J, Zhang C, Wen L, Lan C, Wang Y, Sun T, Jiang L, Xie P, Chen F, Liang G, Fu D, Zhang T, Shi X, Song Z, Liu X, Li S, Li P, Xu X, Wei Q, Wang W, Huang X, De Z, Deng A, Ding L, Pan X, Wen H, Zhang Z, Lv H, Zhang J, Tian X, Deng Z, Wang H, Wang F, Wang Y, Zhao H, Fang Y, Wu Y, Wu Y, Shen N, Li B, Li X, Dai H, Zhao N, Sun X, Zheng Z, Liu K, Xu X. Visual impairment and blindness caused by retinal diseases: A nationwide register-based study. J Glob Health. 2023 Nov 3;13:04126. [CrossRef] [PubMed] [PubMed Central]
- Watanabe T, Hiratsuka Y, Kita Y, Tamura H, Kawasaki R, Yokoyama T, Kawashima M, Nakano T, Yamada M. Combining Optical Coherence Tomography and Fundus Photography to Improve Glaucoma Screening. Diagnostics (Basel). 2022 Apr 27;12(5):1100. [CrossRef] [PubMed] [PubMed Central]
- Midena E, Frizziero L, Torresin T, Boscolo Todaro P, Miglionico G, Pilotto E. Optical coherence tomography and color fundus photography in the screening of age-related macular degeneration: A comparative, population-based study. PLoS One. 2020 Aug 14;15(8):e0237352. [CrossRef] [PubMed] [PubMed Central]
- Lidia Clara Rodríguez García, Alfredo Gómez de Cádiz Villarreal, Javier Pérez Rivas, Juan José Muñoz González, Gabriela García Álvarez, María Teresa Alonso Salazar. Implantación del cribado de retinopatía diabética mediante retinografía digital en atención primaria. Atención primaria Vol. 45. Num. 3. pages 149-156 (marzo 2013). [CrossRef]
- De Fauw J, Ledsam JR, Romera-Paredes B, Nikolov S, Tomasev N, Blackwell S, Askham H, Glorot X, O'Donoghue B, Visentin D, van den Driessche G, Lakshminarayanan B, Meyer C, Mackinder F, Bouton S, Ayoub K, Chopra R, King D, Karthikesalingam A, Hughes CO, Raine R, Hughes J, Sim DA, Egan C, Tufail A, Montgomery H, Hassabis D, Rees G, Back T, Khaw PT, Suleyman M, Cornebise J, Keane PA, Ronneberger O. Clinically applicable deep learning for diagnosis and referral in retinal disease. Nat Med. 2018 Sep;24(9):1342-1350. [CrossRef] [PubMed]
- OECD. Computed tomography exams. 2017. [CrossRef]
- Karri SP, Chakraborty D, Chatterjee J. Transfer learning based classification of optical coherence tomography images with diabetic macular edema and dry age-related macular degeneration. Biomed Opt Express. 2017. Jan 4;8(2):579-592. [CrossRef] [PubMed] [PubMed Central]
- Miriam Karmel, Contributing Writer,Interviewing Jay S. Duker, MD, K. Bailey Freund, MD, and David Sarraf, MD. Retinal Imaging: Choosing the Right Method. EyeNet Magazine. July 2014. Retinal Imaging: Choosing the Right Method - American Academy of Ophthalmology (aao.org).
|
Disclaimer/Publisher’s Note: The statements, opinions and data contained in all publications are solely those of the individual author(s) and contributor(s) and not of MDPI and/or the editor(s). MDPI and/or the editor(s) disclaim responsibility for any injury to people or property resulting from any ideas, methods, instructions or products referred to in the content. |
© 2024 by the authors. Licensee MDPI, Basel, Switzerland. This article is an open access article distributed under the terms and conditions of the Creative Commons Attribution (CC BY) license (http://creativecommons.org/licenses/by/4.0/).
