Submitted:
15 May 2024
Posted:
15 May 2024
You are already at the latest version
Abstract
Keywords:
1. Introduction
2. Material and Methods
2.1. Root Mean Square Deviation RMSD
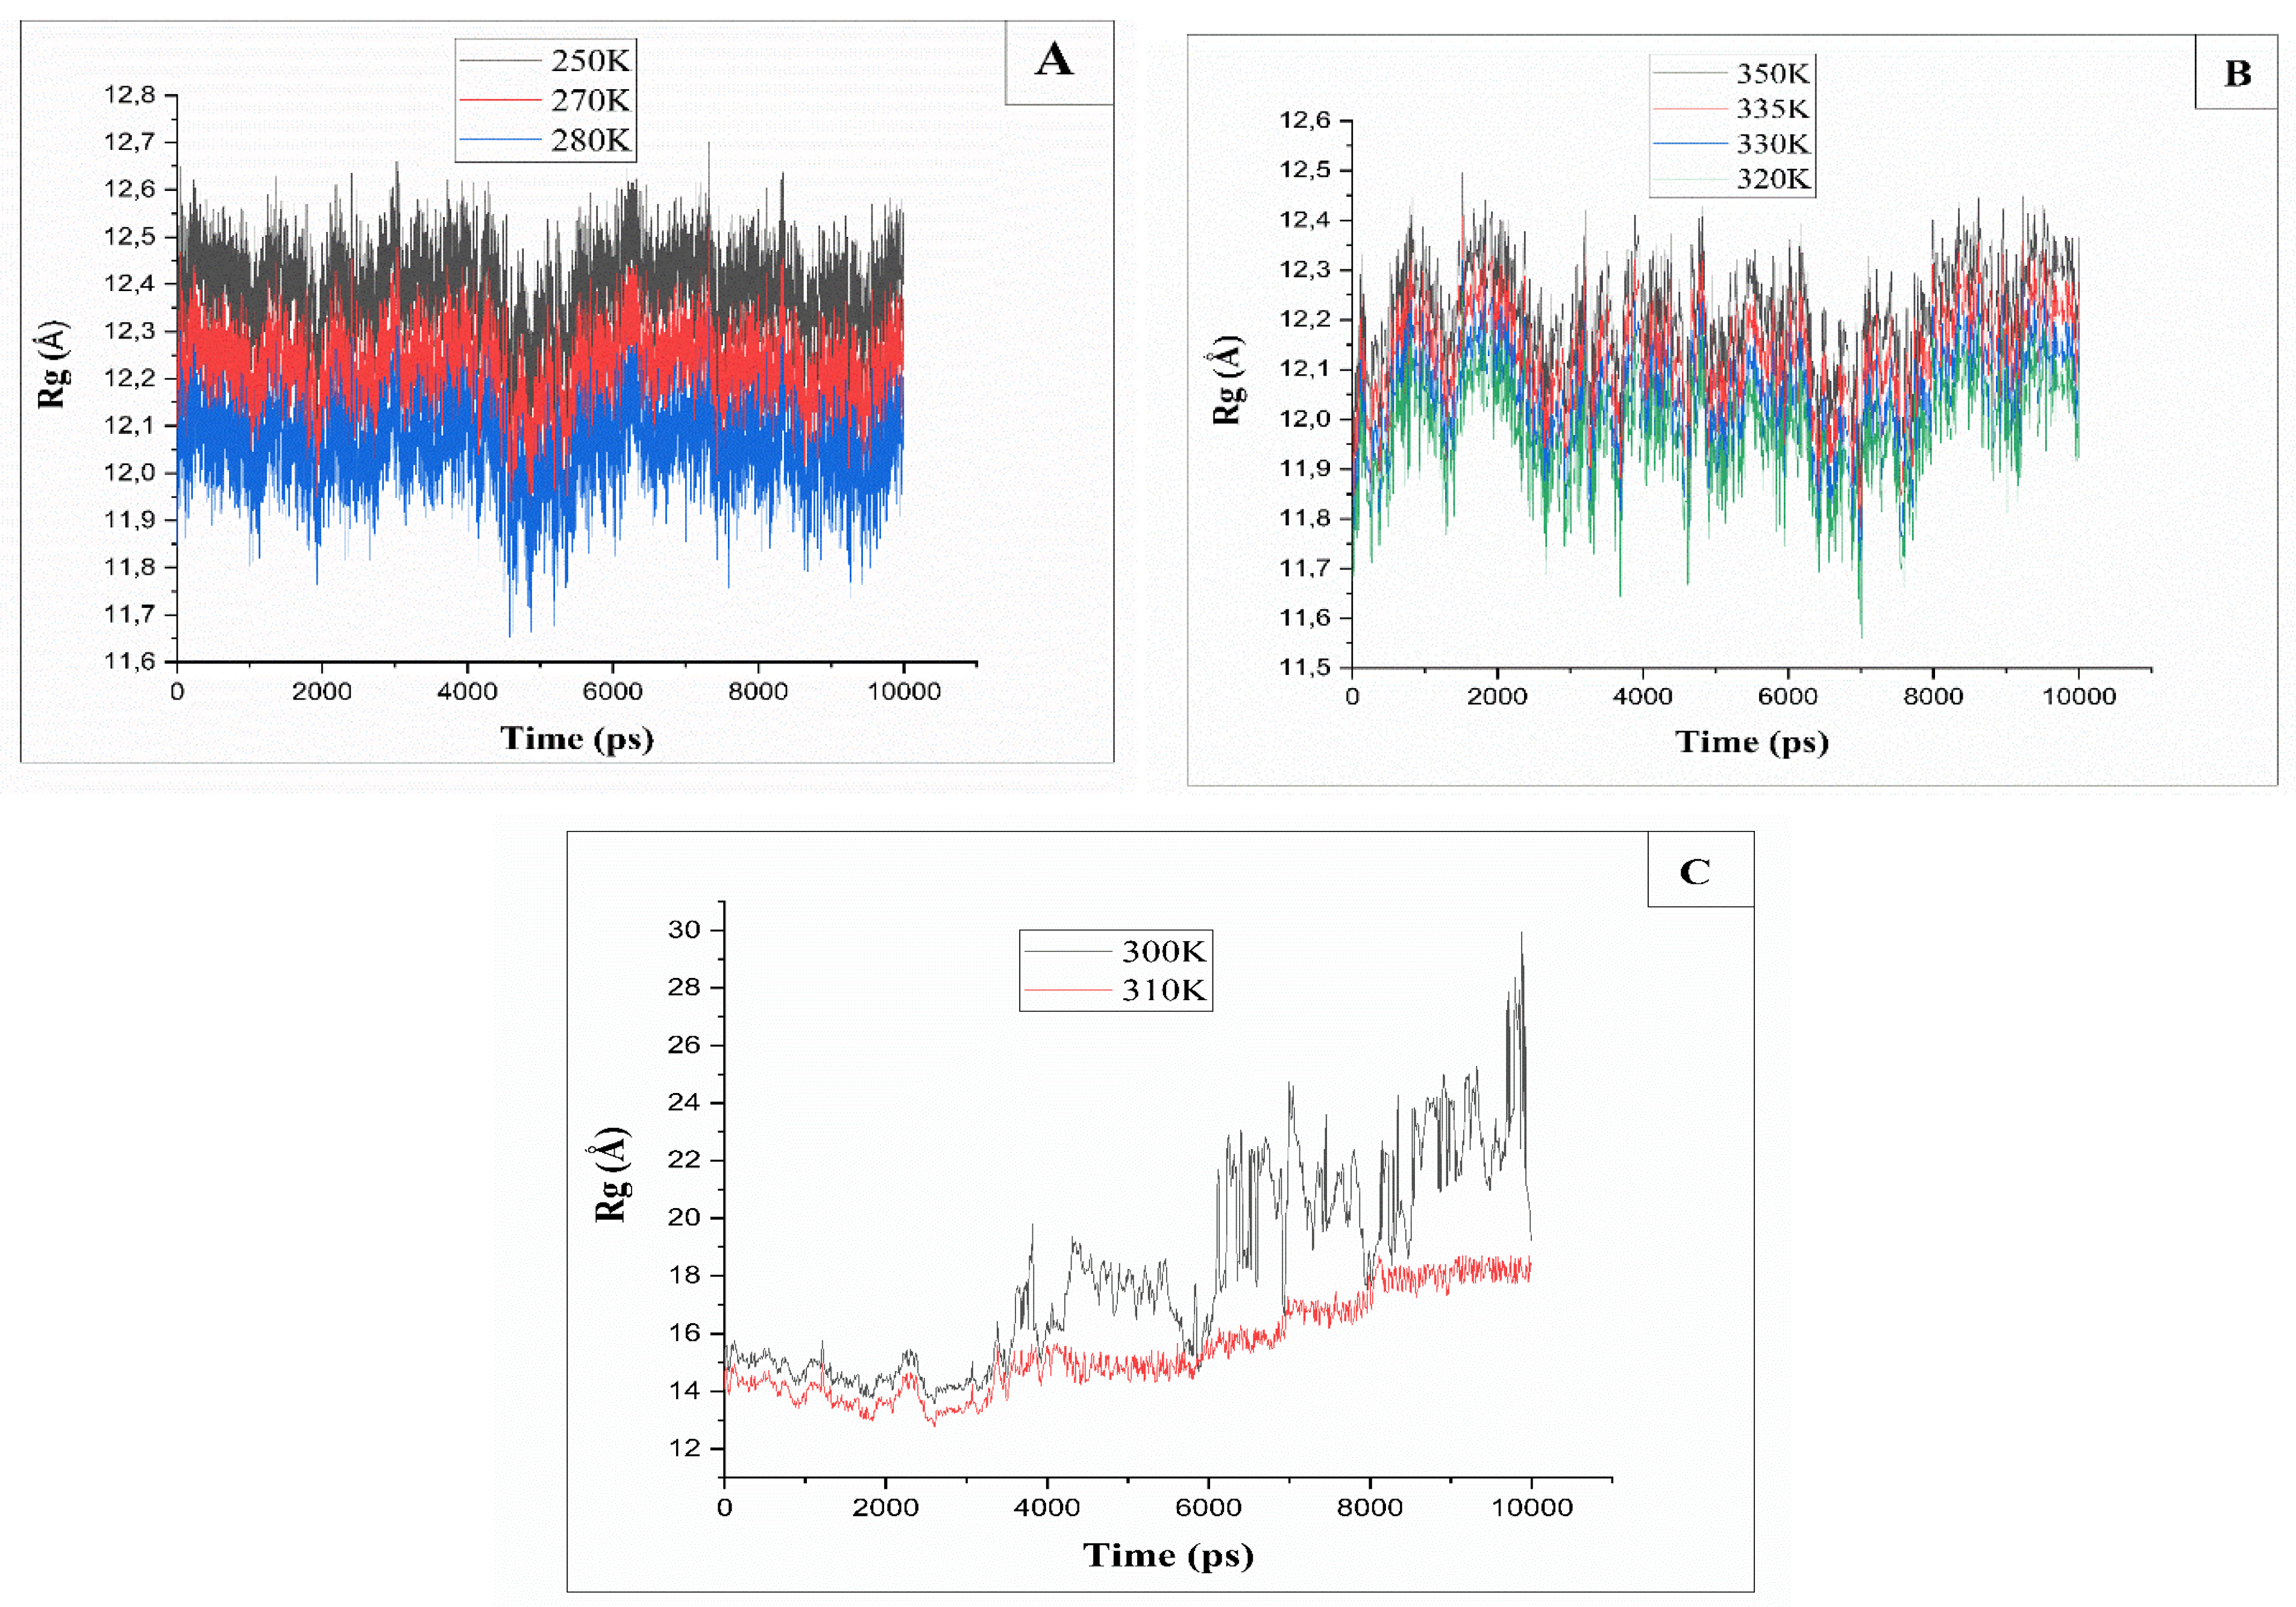
2.2. Radius of Gyration Rg
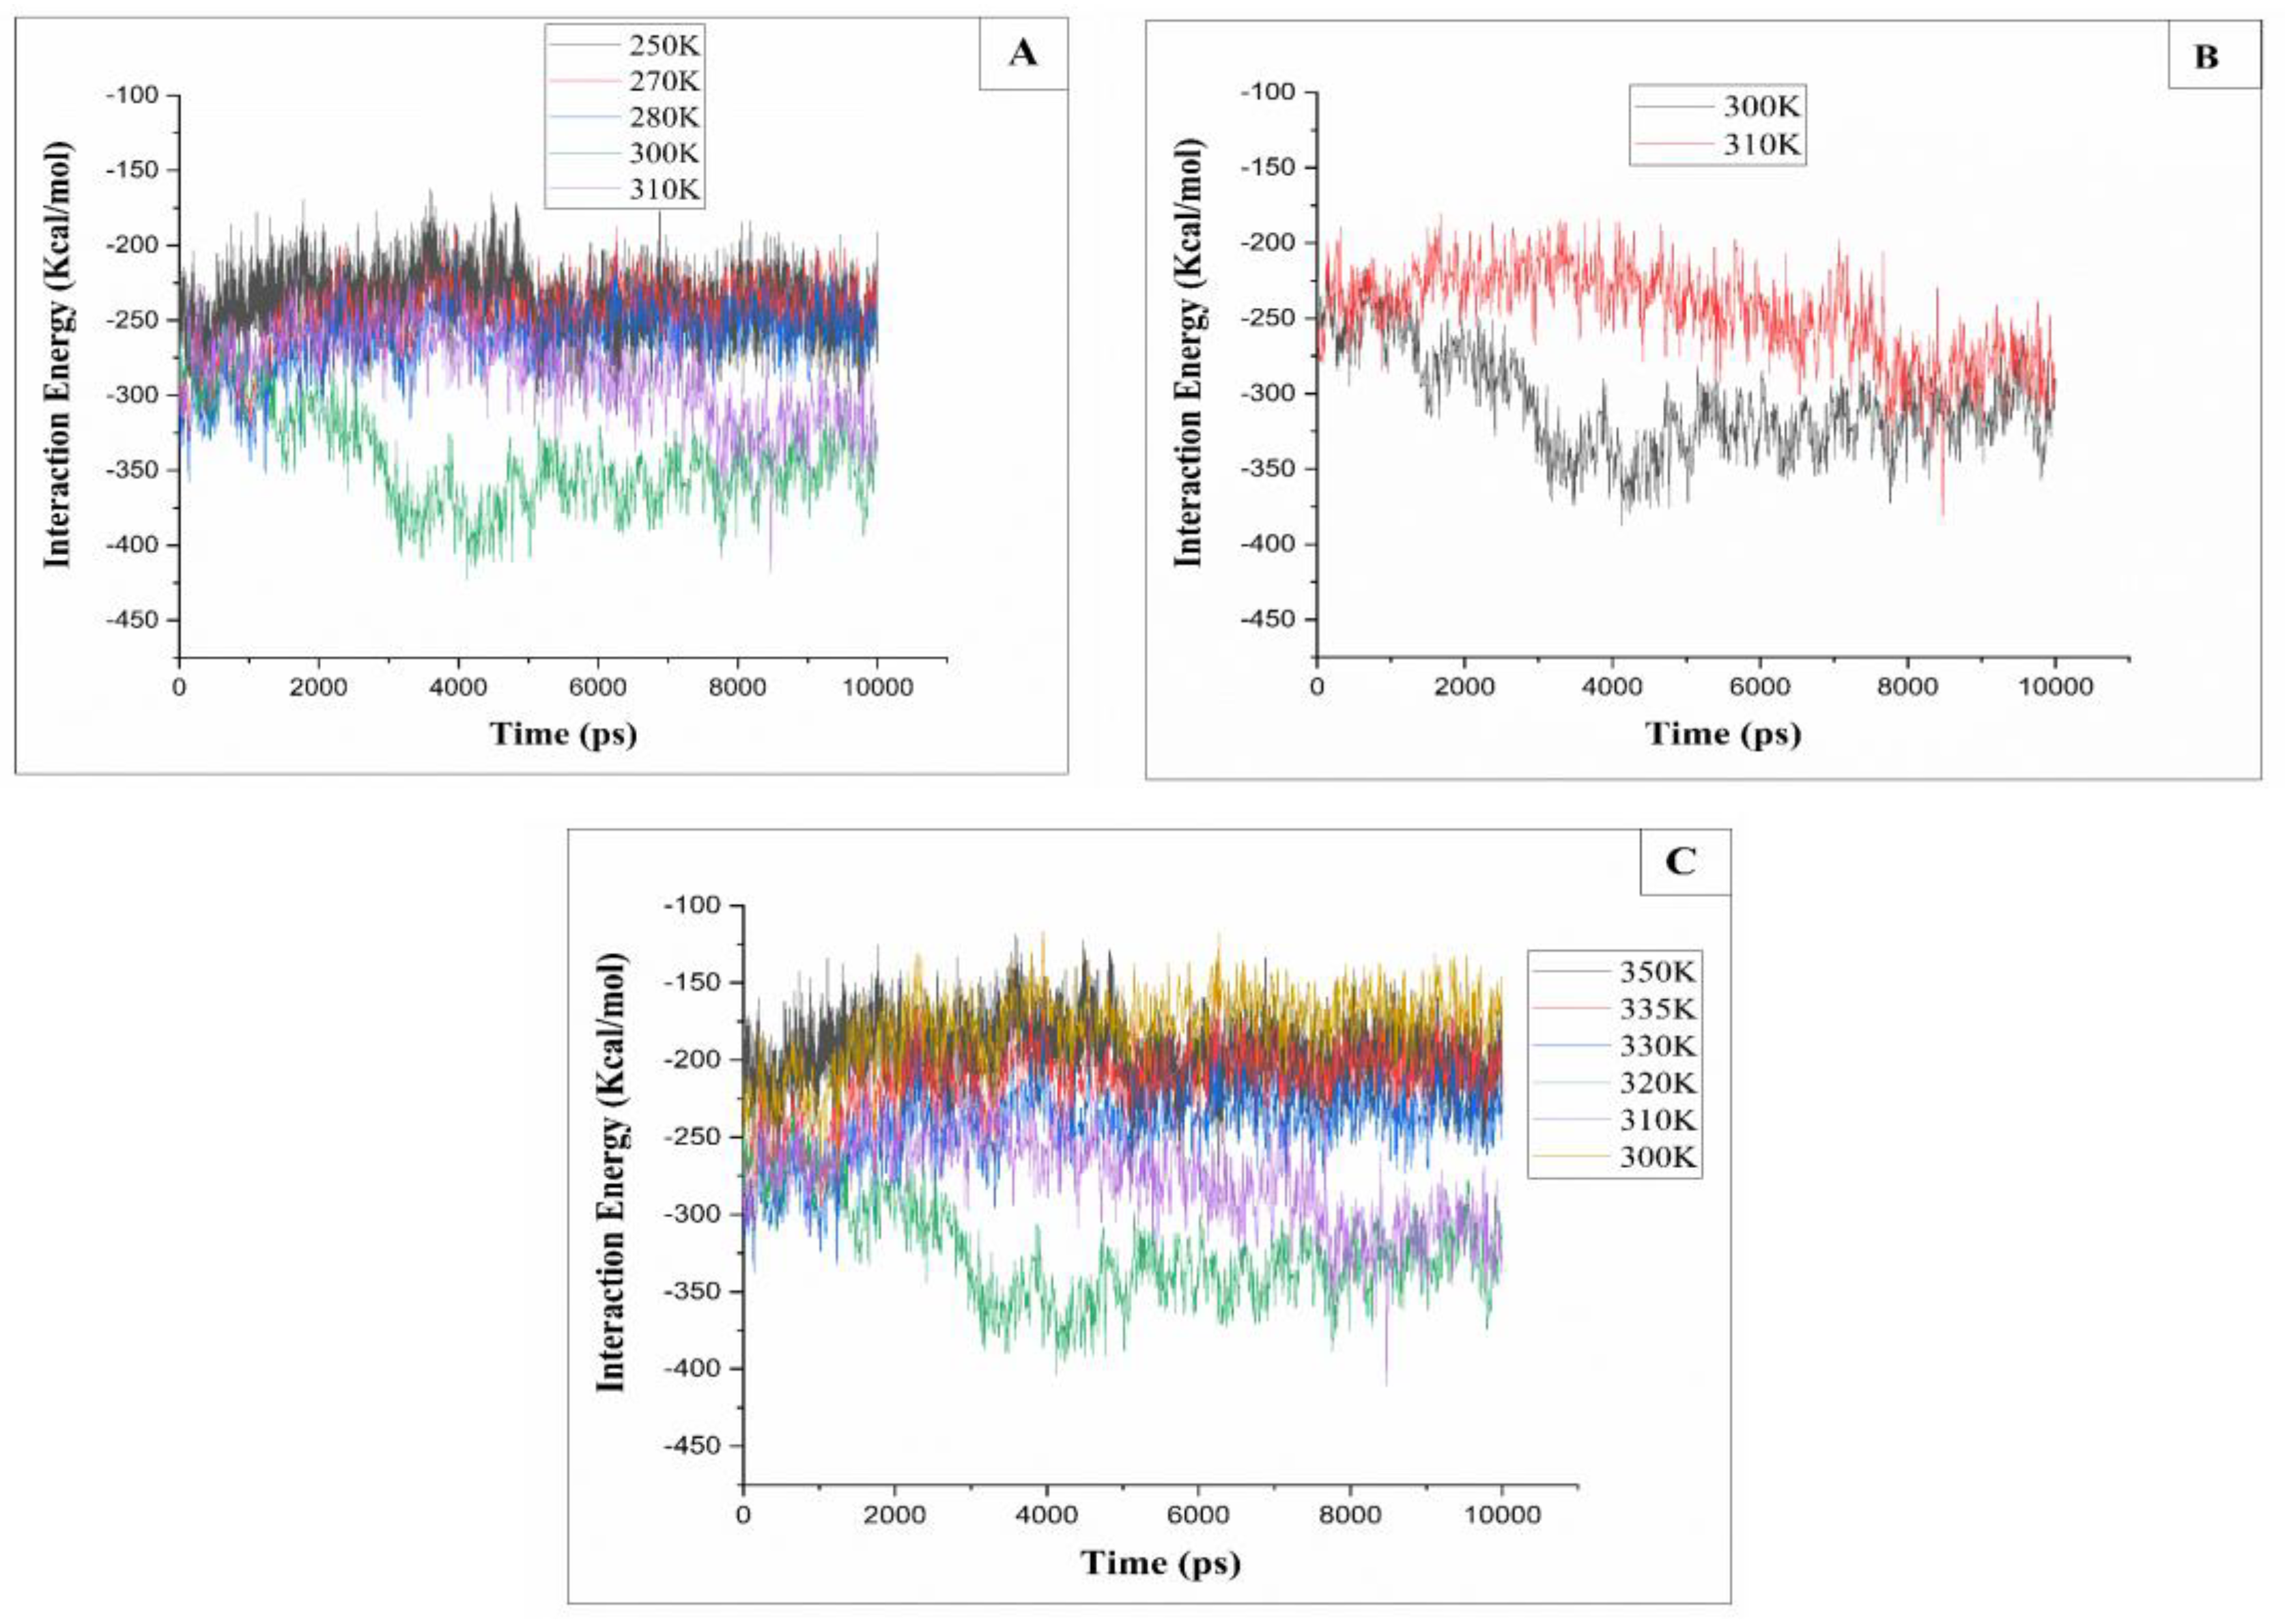
2.3. Interaction Energy
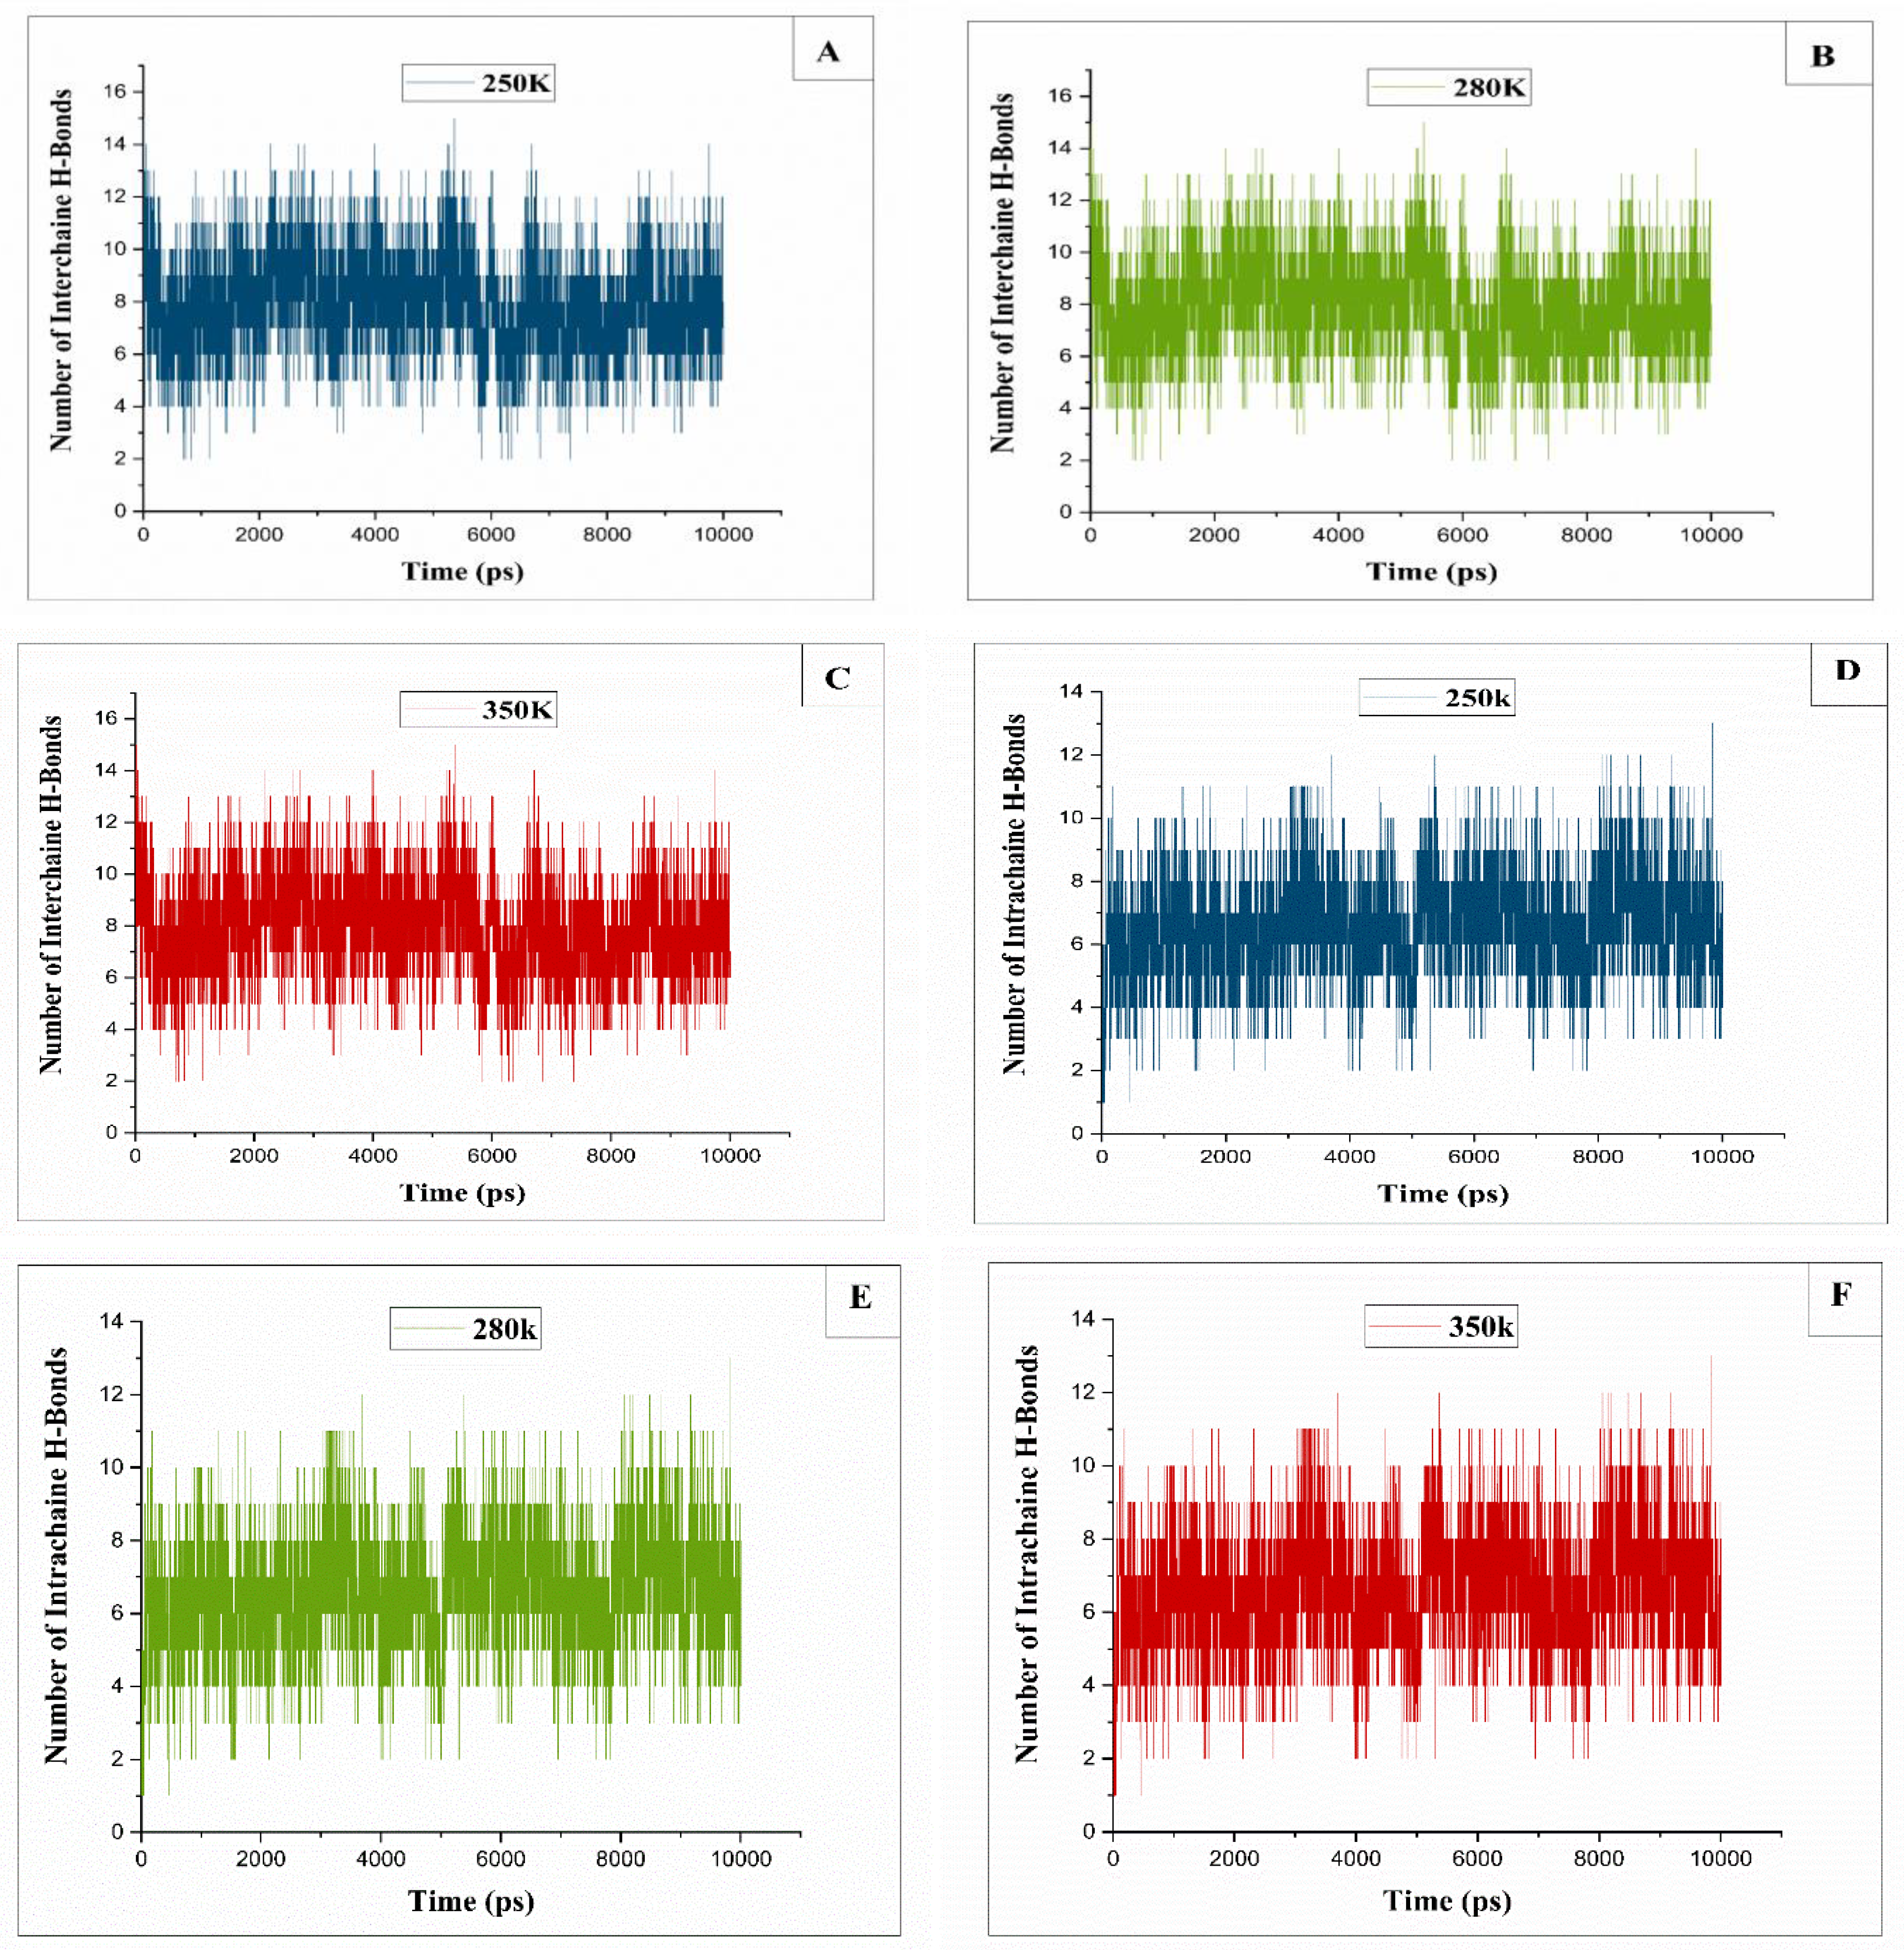
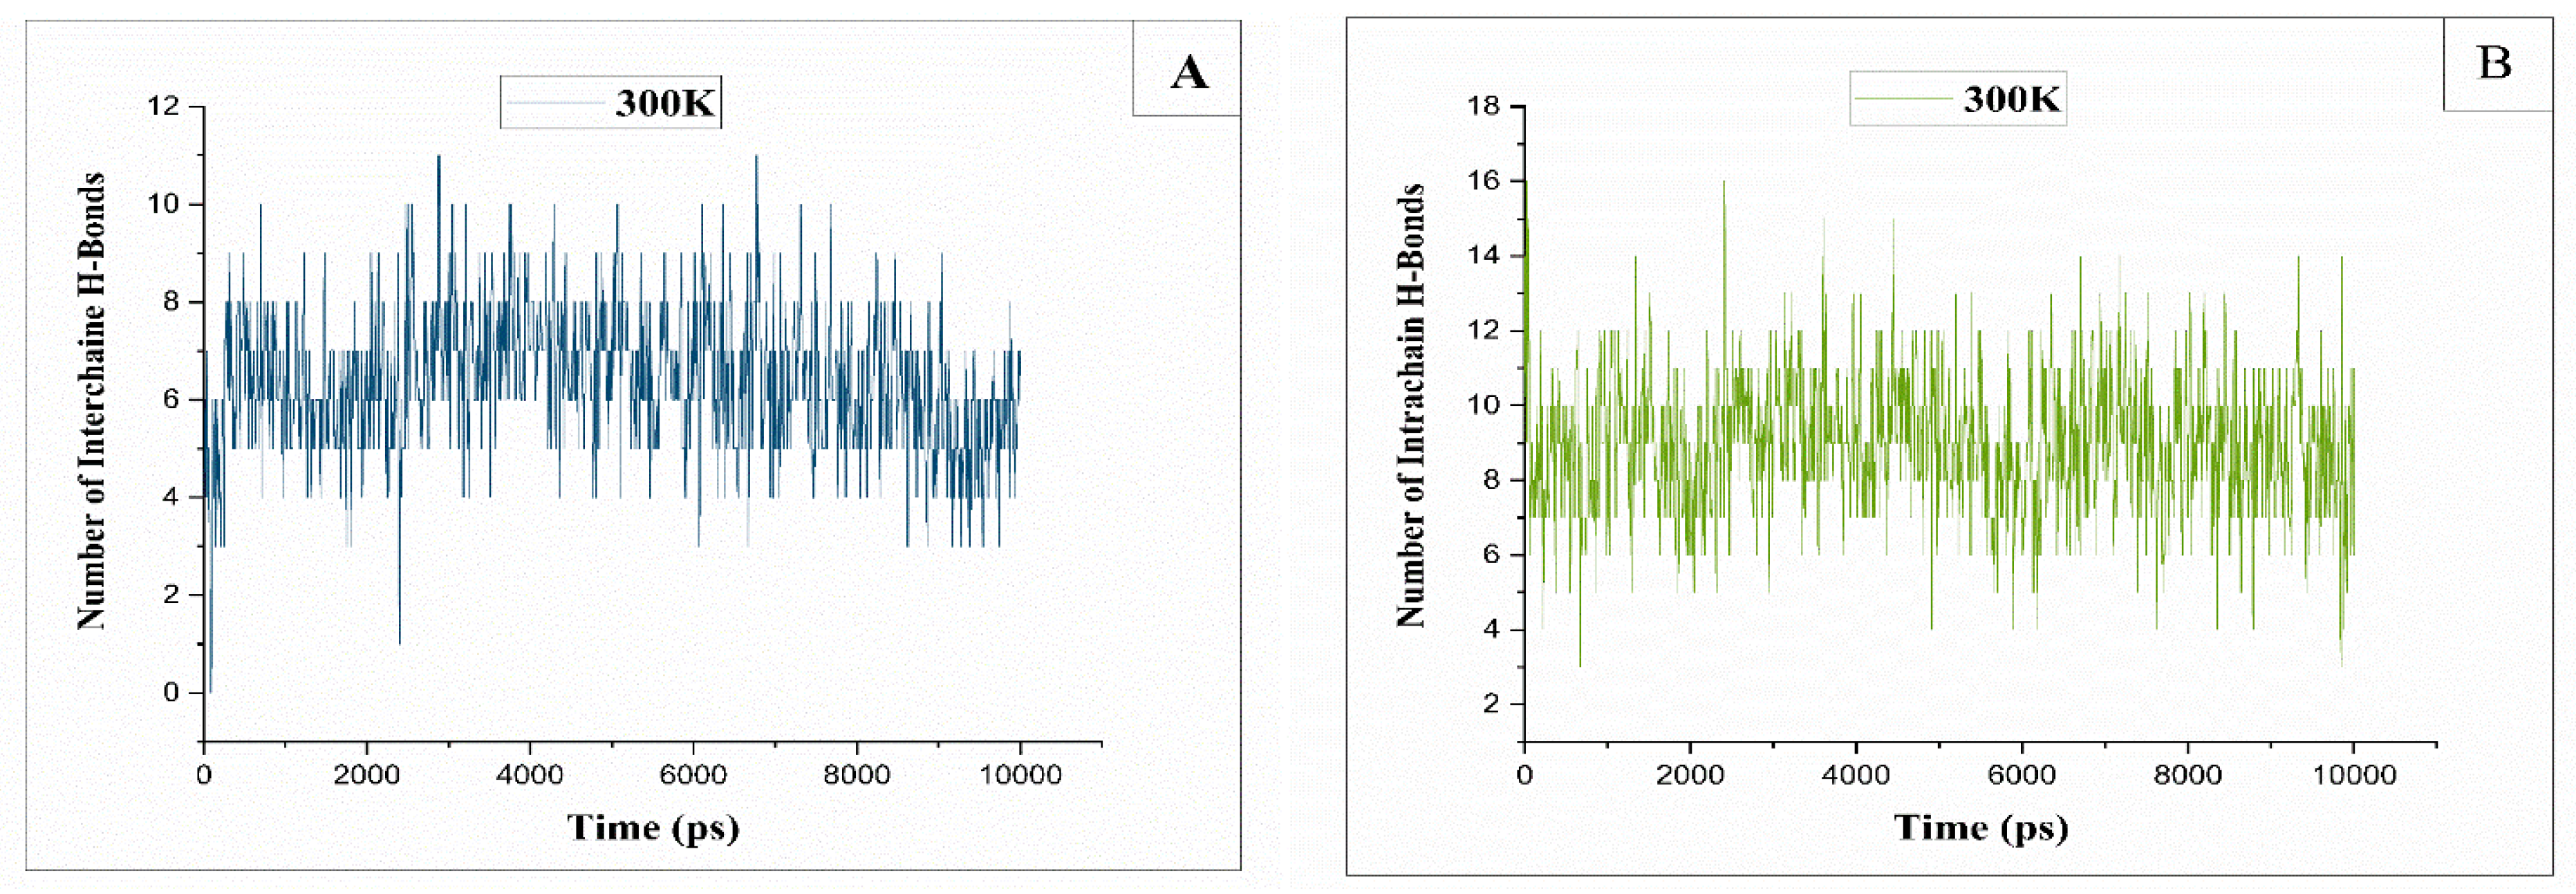
2.4. Hydrogen Bonds
3. Conclusions
Author Contributions
Acknowledgments
Conflicts of Interest
References
- Gericke, M., Fardim, P., & Heinze, T. (2012). Ionic liquids - Promising but challenging solvents for homogeneous derivatization of cellulose. In Molecules (Vol. 17, Issue 6, pp. 7458–7502). [CrossRef]
- Pinkert, A., Marsh, K. N., & Pang, S. (2010). Reflections on the solubility of cellulose. Industrial and Engineering Chemistry Research, 49(22), 11121–11130. [CrossRef]
- Venkatarajan, S., & Athijayamani, A. (2020). An overview on natural cellulose fiber reinforced polymer composites. Materials Today: Proceedings, 37(Part 2), 3620–3624. [CrossRef]
- Bergenstråhle, M., Wohlert, J., Himmel, M. E., & Brady, J. W. (2010). Simulation studies of the insolubility of cellulose. Carbohydrate Research, 345(14), 2060–2066. [CrossRef]
- Heinze, T. (2015). Cellulose: Structure and properties. Advances in Polymer Science, 271, 1–52. [CrossRef]
- Fu, L. H., Qi, C., Ma, M. G., & Wan, P. (2019). Multifunctional cellulose-based hydrogels for biomedical applications. In Journal of Materials Chemistry B (Vol. 7, Issue 10, pp. 1541–1562). Royal Society of Chemistry. [CrossRef]
- Seddiqi, H., Oliaei, E., Honarkar, H., Jin, J., Geonzon, L. C., Bacabac, R. G., & Klein-Nulend, J. (2021). Cellulose and its derivatives: towards biomedical applications. In Cellulose (Vol. 28, Issue 4, pp. 1893–1931). Springer Science and Business Media B.V. [CrossRef]
- Ruel, K., Nishiyama, Y., & Joseleau, J. P. (2012). Crystalline and amorphous cellulose in the secondary walls of Arabidopsis. Plant Science, 193–194, 48–61. [CrossRef]
- Liu, R., Yu, H., & Huang, Y. (n.d.). Structure and morphology of cellulose in wheat straw. [CrossRef]
- Poletto, M., Pistor, V., & J., A. (2013). Structural Characteristics and Thermal Properties of Native Cellulose. In Cellulose - Fundamental Aspects. InTech. [CrossRef]
- Bochek, A. M. (2003). Effect of Hydrogen Bonding on Cellulose Solubility in Aqueous and Nonaqueous Solvents.In Nauka/Interperiodica] Russian Journal of Applied Chemistry (Vol. 76, Issue 11). [CrossRef]
- Lindman, B., Karlström, G., & Stigsson, L. (2010). On the mechanism of dissolution of cellulose. Journal ofMolecular Liquids, 156(1), 76–81. [CrossRef]
- Medronho, B., & Lindman, B. (2014). Competing forces during cellulose dissolution: From solvents to mechanisms.In Current Opinion in Colloid and Interface Science (Vol. 19, Issue 1, pp. 32–40). Elsevier Ltd. [CrossRef]
- Väisänen, S., Ajdary, R., Altgen, M., Nieminen, K., Kesari, K. K., Ruokolainen, J., Rojas, O. J., & Vuorinen, T. (2021). Cellulose dissolution in aqueous NaOH–ZnO: cellulose reactivity and the role of ZnO. Cellulose, 28(3), 1267–1281. [CrossRef]
- Lindman, B., & Karlström, G. (2009). Nonionic polymers and surfactants: Temperature anomalies revisited. In Comptes Rendus Chimie (Vol. 12, Issues 1–2, pp. 121–128). [CrossRef]
- Medronho, B., Romano, A., Miguel, M. G., Stigsson, L., & Lindman, B. (2012). Rationalizing cellulose (in)solubility: Reviewing basic physicochemical aspects and role of hydrophobic interactions. Cellulose, 19(3), 581–587. [CrossRef]
- Biermann, O., Hädicke, E., Koltzenburg, S., Müller-Plathe, F., Müller-Plathe, F., Biermann, Dipl.-C. O., Hädicke, E., & Koltzenburg, S. (2001). Hydrophilicity and Lipophilicity of Cellulose Crystal Surfaces. In Angew.Chem. Int. Ed (Vol. 40, Issue 20). [CrossRef]
- Miyamoto, H., Umemura, M., Aoyagi, T., Yamane, C., Ueda, K., & Takahashi, K. (2009). Structural reorganization of molecular sheets derived from cellulose II by molecular dynamics simulations. Carbohydrate Research, 344(9), 1085–1094. [CrossRef]
- Yamane, C., Aoyagi, T., Ago, M., Sato, K., Okajima, K., & Takahashi, T. (2006). Two different surface properties of regenerated cellulose due to structural anisotropy. Polymer Journal, 38(8), 819–826. [CrossRef]
- Wohlert, M., Benselfelt, T., Wågberg, L., Furó, I., Berglund, L. A., & Wohlert, J. (2022). Cellulose and the role of hydrogen bonds: not in charge of everything. In Cellulose (Vol. 29, Issue 1). Springer Science and Business Media B.V. [CrossRef]
- Nishiyama, Y., Johnson, G. P., French, A. D., Forsyth, V. T., & Langan, P. (2008). Neutron crystallography, molecular dynamics, and quantum mechanics studies of the nature of hydrogen bonding in cellulose Iβ. Biomacromolecules, 9(11), 3133–3140. [CrossRef]
- Yano, S., & Hatakeyama, H. (1976). Effect of Hydrogen Bond Formation on Dynamic Mechanical Properties of Amorphous Cellulose (Vol. 20). [CrossRef]
- Thomas Heinze, A. K. (2005). Solvents Applied in the Field of Cellulose Chemistry - A Mini Review. Polímeros: Ciência e Tecnologia, . 15, 84–90. [CrossRef]
- Thomas Heinze, A. K. (2005). Solvents Applied in the Field of Cellulose Chemistry - A Mini Review. Polímeros: Ciência e Tecnologia, . 15, 84–90. [CrossRef]
- Ghasemi, M., Tsianou, M., & Alexandridis, P. (2017). Assessment of solvents for cellulose dissolution. Bioresource Technology, 228, 330–338. [CrossRef]
- Dawsey, T. R., & McCormick, C. L. (1990). The lithium chloride/dimethylacetamide solvent for cellulose: A literature review. Journal of Macromolecular Science, Part C, 30(3–4), 405–440. [CrossRef]
- Mohd, N., Draman, S. F. S., Salleh, M. S. N., & Yusof, N. B. (2017). Dissolution of cellulose in ionic liquid: A review. AIP Conference Proceedings, 1809. [CrossRef]
- Leipner, H., Fischer, S., Brendler, E., & Voigt, W. (2000). Structural changes of cellulose dissolved in molten salt hydrates. In Macromol. Chem. Phys (Vol. 201). [CrossRef]
- Liebert, T. (2010). Cellulose solvents-remarkable history, bright future. ACS Symposium Series, 1033, 3–54. [CrossRef]
- Kihlman, M., Medronho, B. F., Romano, A. L., Germgård, U., & Lindman, B. (2013). Cellulose dissolution in an alkali based solvent: Influence of additives and pretreatments. Journal of the Brazilian Chemical Society, 24(2), 295–303. [CrossRef]
- Yang, Y. J., Shin, J. M., Kang, T. H., Kimura, S., Wada, M., & Kim, U. J. (2014). Cellulose dissolution in aqueous lithium bromide solutions. Cellulose, 21(3), 1175–1181. [CrossRef]
- Zhang, S., Li, F. X., Yu, J. yong, & Hsieh, Y. Lo. (2010). Dissolution behaviour and solubility of cellulose in NaOH complex solution. Carbohydrate Polymers, 81(3), 668–674. [CrossRef]
- Wang, S., Lu, A., & Zhang, L. (2016). Recent advances in regenerated cellulose materials. In Progress in Polymer Science (Vol. 53, pp. 169–206). Elsevier Ltd. [CrossRef]
- Klufers, P., Mayer, P., & Schuhmacher, J. (1995). Coordination Equilibria in Transition Metal Based Cellulose Solvents” 1. Modifying the Polysaccharide Hydrogen Bond System: Classes of Cellulose Solvents. In Akzo AG, Obernburg and Wuppertal.-Part (Vol. 99). Huthig & Wepf Verlag.
- Achwal, W. B., & Gupta, A. B. (1968). Studies in a modified cadoxen solvent. In Die Angewandte Makromolekulare Chemie (Vol. 2). [CrossRef]
- Bourassi, L., Challioui, A., Merzouki, M., Abidi, R., Bouammali, B., Elfarh, L., & Amin Bouammali, M. (2022). A molecular dynamics (MD) simulation of the solubility behaviours of cellulose in aqueous cuprammonium hydroxide solution. Materials Today: Proceedings. [CrossRef]
- Sayyed, A. J., Deshmukh, N. A., & Pinjari, D. V. (2019). A critical review of manufacturing processes used in regenerated cellulosic fibres: viscose, cellulose acetate, cuprammonium, LiCl/DMAc, ionic liquids, and NMMO based lyocell. In Cellulose (Vol. 26, Issue 5, pp. 2913–2940). Springer Netherlands. [CrossRef]
- Eckelt, J., Knopf, A., Röder, T., Weber, H. K., Sixta, H., & Wolf, B. A. (2011). Viscosity-molecular weight relationship for cellulose solutions in either NMMO monohydrate or cuen. Journal of Applied Polymer Science, 119(2), 670–676. [CrossRef]
- Cai, L., Liu, Y., & Liang, H. (2012). Impact of hydrogen bonding on inclusion layer of urea to cellulose: Study of molecular dynamics simulation. Polymer, 53(5), 1124–1130. [CrossRef]
- Bregado, J. L., Tavares, F. W., Secchi, A. R., & Segtovich, I. S. V. (2021). Molecular dynamics of dissolution of a 36-chain cellulose Iβ microfibril at different temperatures above the critical pressure of water. Journal of Molecular Liquids, 336. [CrossRef]
- Parthasarathi, R., Balamurugan, K., Shi, J., Subramanian, V., Simmons, B. A., & Singh, S. (2015). Theoretical Insights into the Role of Water in the Dissolution of Cellulose Using IL/Water Mixed Solvent Systems. Journal of Physical Chemistry B, 119(45), 14339–14349. [CrossRef]
- Dias, Y. J., Kolbasov, A., Sinha-Ray, S., Pourdeyhimi, B., & Yarin, A. L. (2020). Theoretical and experimental study of dissolution mechanism of cellulose. Journal of Molecular Liquids, 312. [CrossRef]
- Parthasarathi, R., Balamurugan, K., Shi, J., Subramanian, V., Simmons, B. A., & Singh, S. (2015). Theoretical Insights into the Role of Water in the Dissolution of Cellulose Using IL/Water Mixed Solvent Systems. Journal of Physical Chemistry B, 119(45), 14339–14349. [CrossRef]
- Comput. Chem. 33 (2012) 1338–1346. [CrossRef]
- Kevin J. Bowers. (2006). Scalable Algorithms for Molecular Dynamics Simulations on Commodity Clusters. [CrossRef]
- Sánchez-Badillo, J. A., Gallo, M., Rutiaga-Quiñones, J. G., & López-Albarrán, P. (2021). Solvent behavior of an ionic liquid set around a cellulose Iβ crystallite model through molecular dynamics simulations. Cellulose, 28(11), 6767–6795. [CrossRef]
- Manna, B., & Ghosh, A. (2019). Dissolution of cellulose in ionic liquid and water mixtures as revealed by molecular dynamics simulations. Journal of Biomolecular Structure and Dynamics, 37(15), 3987–4005. [CrossRef]
- Li, W., Huang, S., Xu, D., Zhao, Y., Zhang, Y., & Zhang, L. (2017). Molecular dynamics simulations of the characteristics of sodium carboxymethyl cellulose with different degrees of substitution in a salt solution. Cellulose, 24(9), 3619–3633. [CrossRef]
- Roe, D. R., & Cheatham, T. E. (2013). PTRAJ and CPPTRAJ: Software for processing and analysis of molecular dynamics trajectory data. Journal of Chemical Theory and Computation, 9(7), 3084–3095. [CrossRef]
- Meziane, H.; Laita, M.; Azzaoui, K.; Boulouiz, A.; Neffa, M.; Sabbahi, R.; Nandiyanto, ABD.; EL Idrissi, A.; Abidi, N.; Siaj, M.; Touzani, R. (2024) Nanofibers from cellulosic materials: A comprehensive review about preparation, characterization and applications. Moroccan J. Chemistry. 12(1) 305-343. [CrossRef]
- El Yousfi R., Brahmi M., Dalli M., Achalhi N.3, Azougagh O., Tahani A., Touzani R., El Idrissi A. (2023). Recent Advances in Nanoparticle Development for Drug Delivery: A Comprehensive Review of Polycaprolactone-Based Multi-Arm Architectures. Polymers. 15(8)1835. [CrossRef]
- Benahmed A., Azzaoui K., El Idrissi A., Belkheir H., Said Hassane SO., Touzani R., Rhazi L. (2022) Cellulose Acetate-g-Polycaprolactone Copolymerization Using Diisocyanate Intermediates and the Effect of Polymer Chain Length on Surface, Thermal, and Antibacterial Properties. Molecules. 27(4)1408. [CrossRef]




Disclaimer/Publisher’s Note: The statements, opinions and data contained in all publications are solely those of the individual author(s) and contributor(s) and not of MDPI and/or the editor(s). MDPI and/or the editor(s) disclaim responsibility for any injury to people or property resulting from any ideas, methods, instructions or products referred to in the content. |
© 2024 by the authors. Licensee MDPI, Basel, Switzerland. This article is an open access article distributed under the terms and conditions of the Creative Commons Attribution (CC BY) license (http://creativecommons.org/licenses/by/4.0/).


