Submitted:
15 May 2024
Posted:
16 May 2024
You are already at the latest version
Abstract
Keywords:
1. Introduction
- Firstly, while prior validation studies of the BSRN predominantly utilized data predating 2022, our investigation focuses on a more recent timeframe, utilizing data spanning from 2023 to 2024. This temporal shift ensures that our analyses remain relevant and reflective of current conditions, including the potential impacts of climate change on solar radiation patterns.
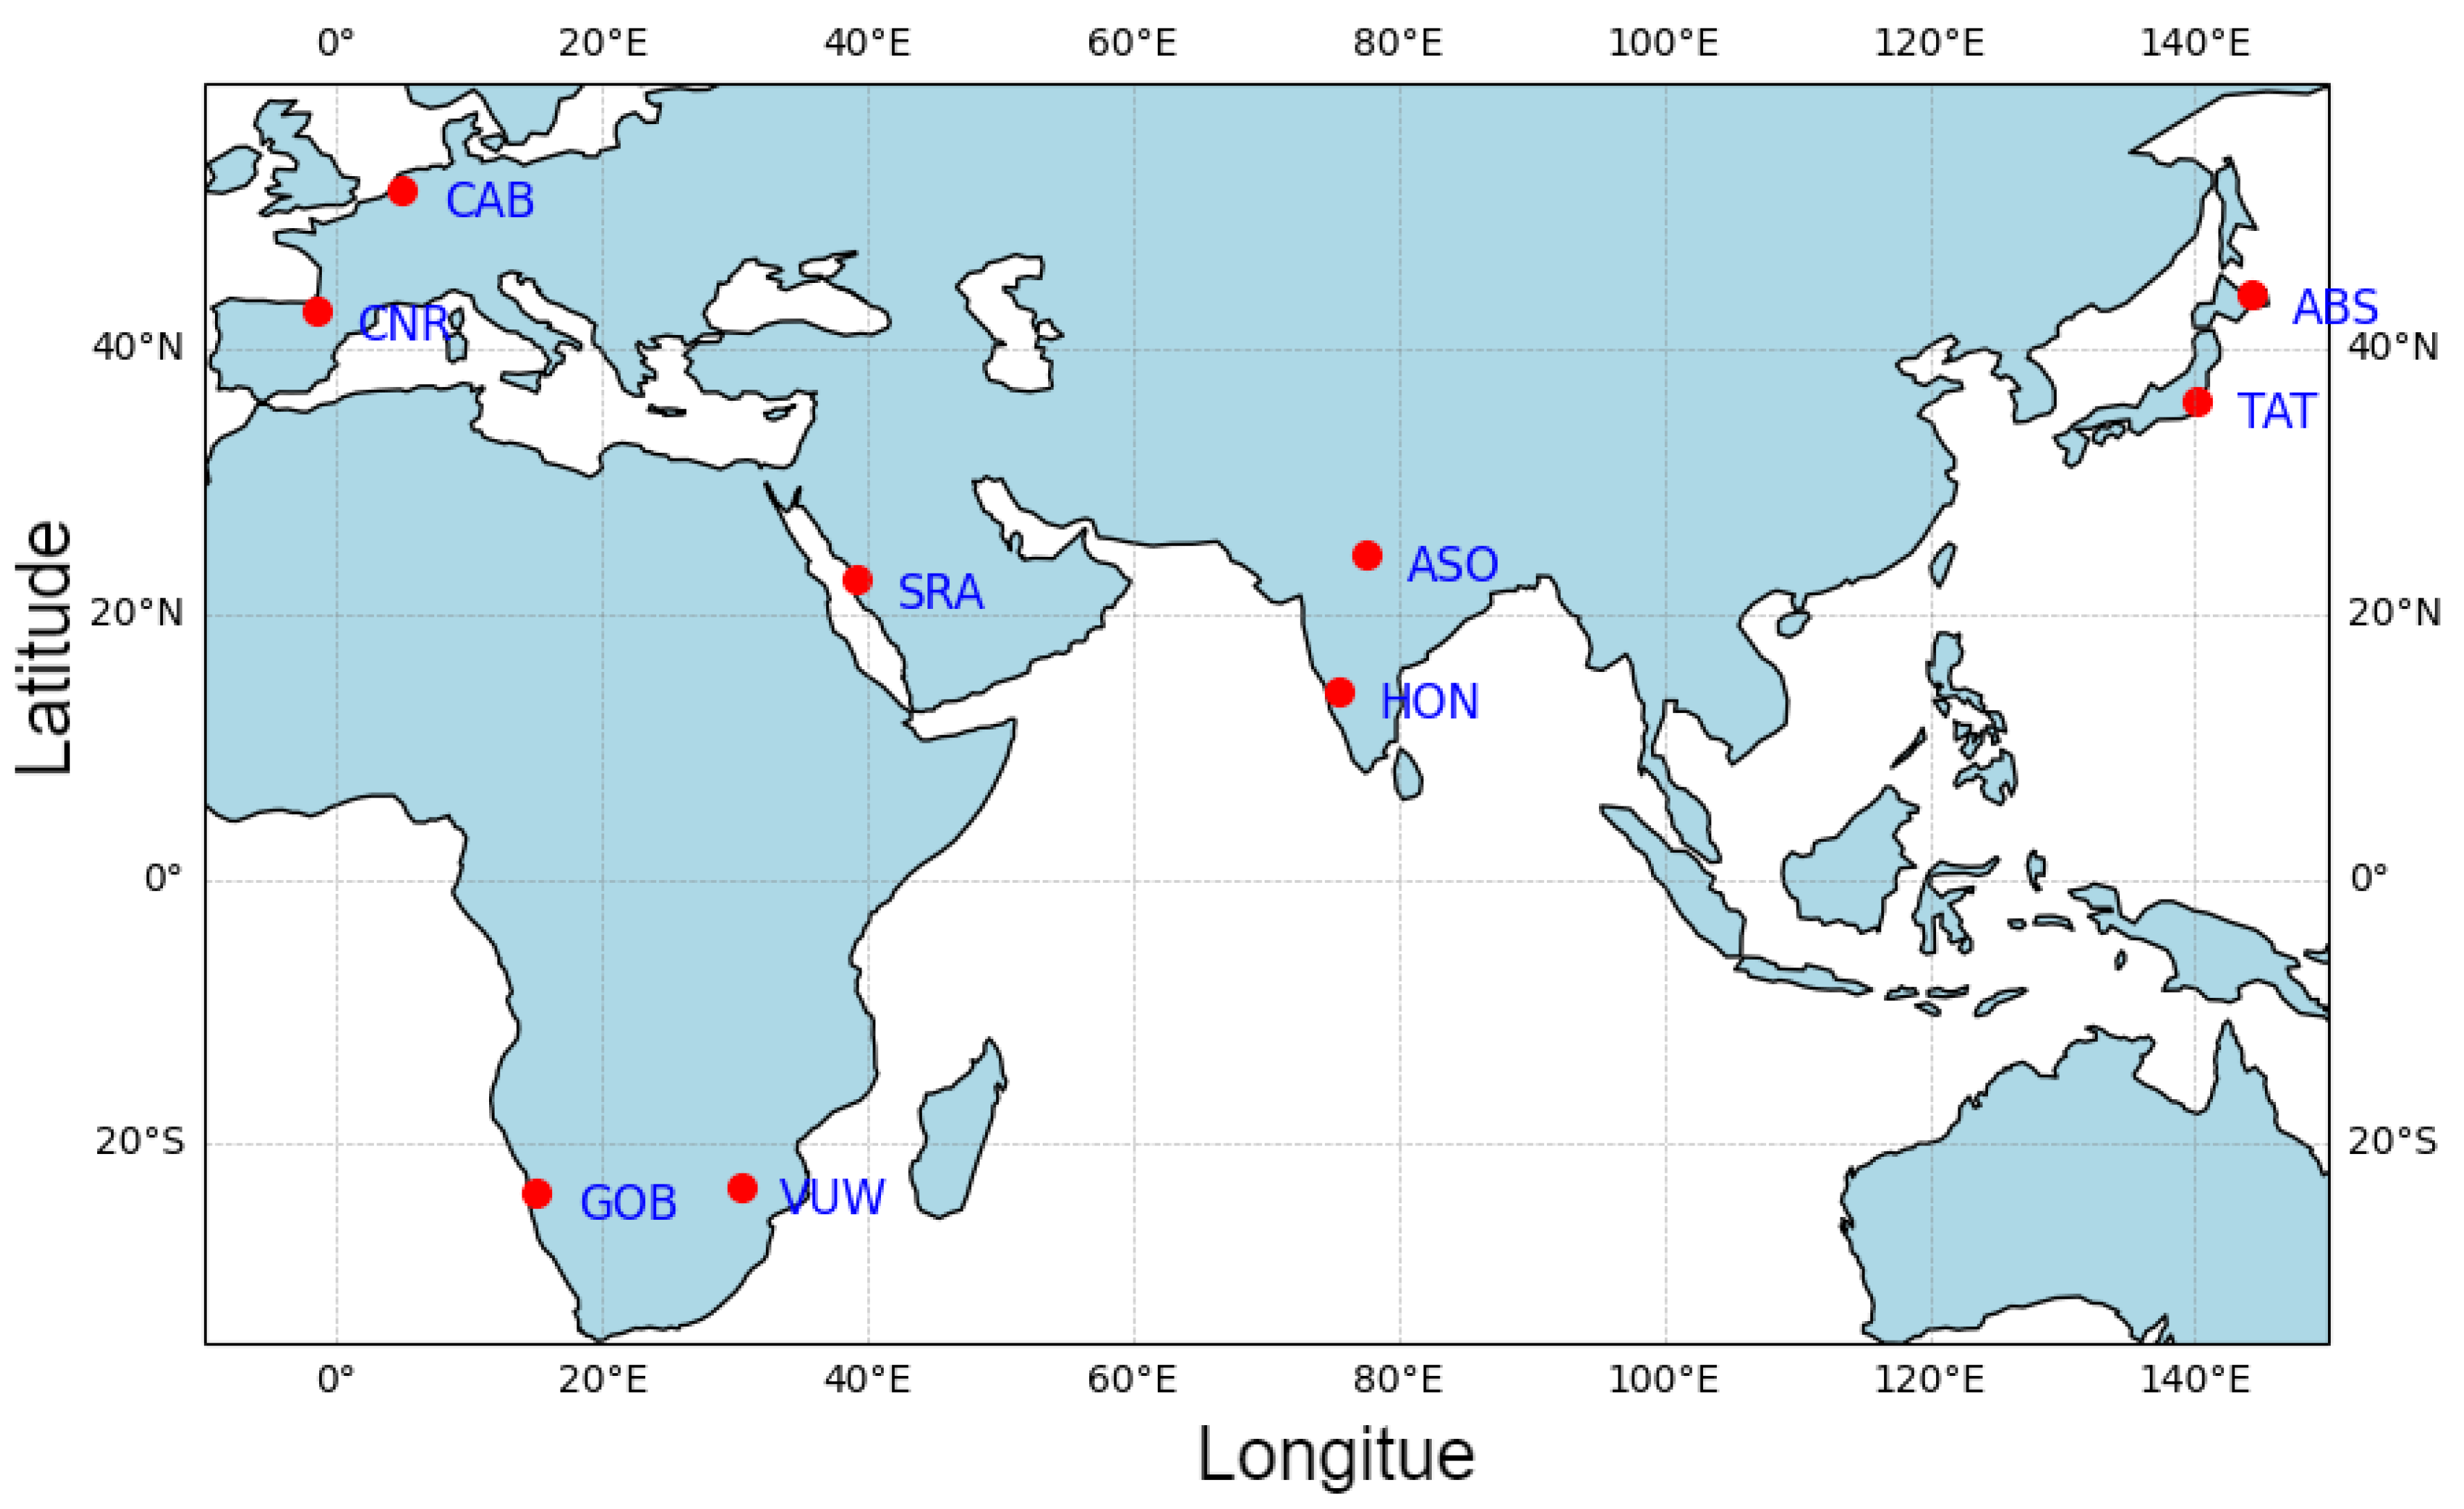
- Secondly, unlike previous studies which often relied solely on either Himawari-8 or MSG datasets for validation purposes, our study pioneers the simultaneous integration of both datasets. The Himawari-8 data was used to study the locations in Japan, while MSG data was used for the sites in EU, Africa, Middle East, and South Asian region.
- Lastly, a key objective of our study is the development of a comprehensive and robust methodology for determining albedo parameters specific to Heliosat-2. By refining these parameters, we anticipate significant advancements in remote sensing techniques for more accurate and reliable estimation of solar radiation.
2. Materials and Methods
2.1. Study Area and Data Sets Used
2.2. Methodology
2.2.1. Heliosat-2
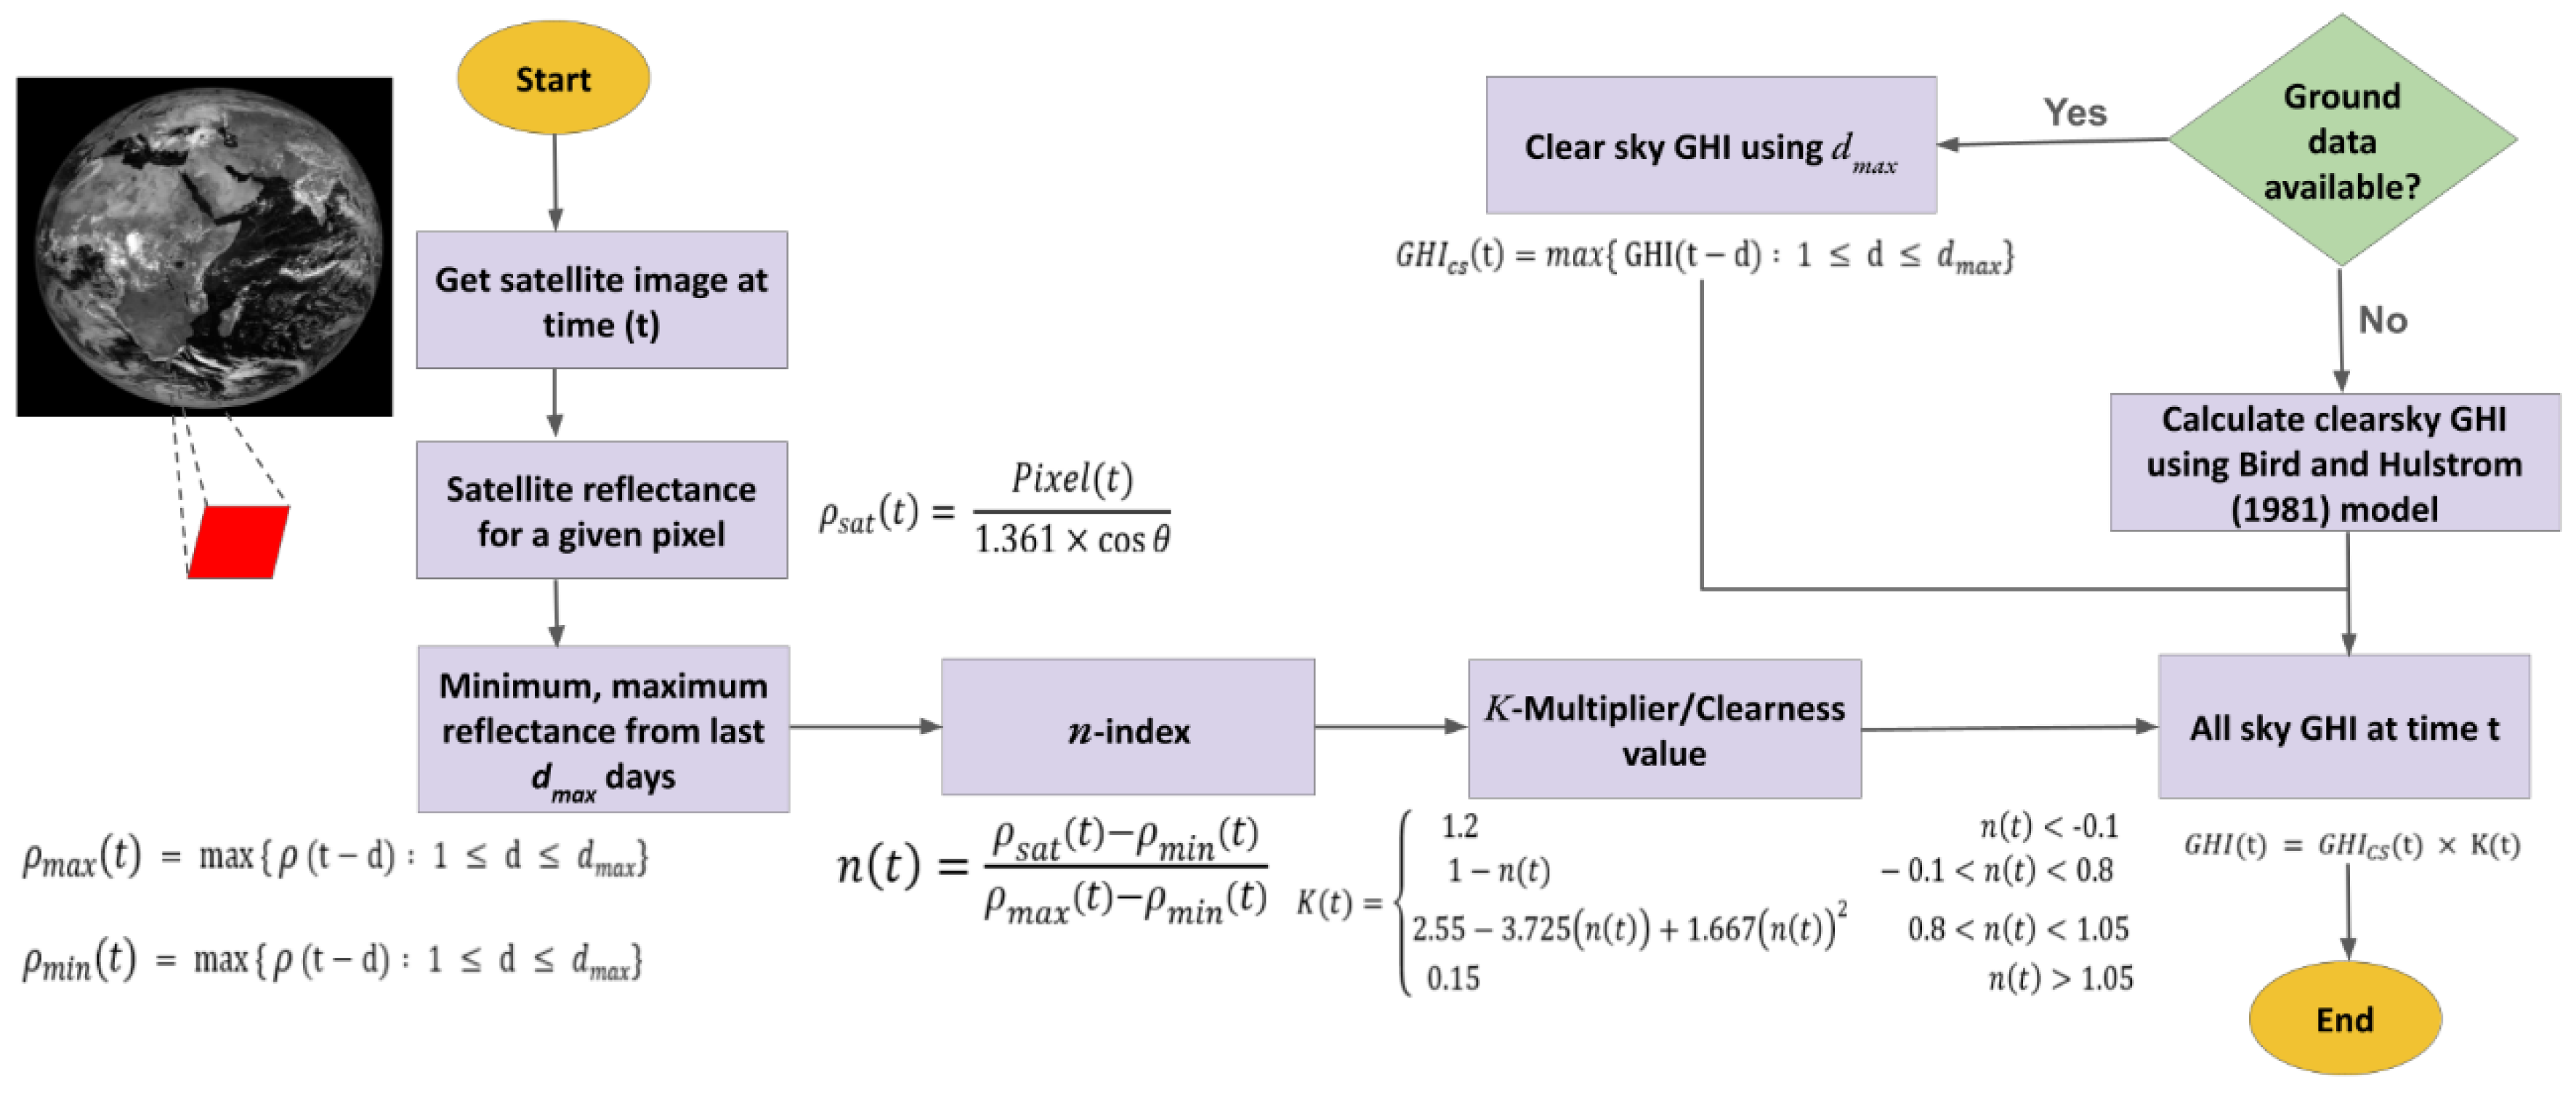
- Step 1: Generate Clear Sky Global Horizontal Irradiance ():
- Step 2: Calculate Satellite Reflectance Value:
- Step 3: Calculate Minimum and Maximum Satellite Reflectance Values:
- Step 4: Calculate Cloudiness Index (-index):
- Step 5. Calculate-Multiplier or Clearness Value:
- Step 6. Calculate GHI:
2.2.2. Comparison Metrics
3. Results
3.1. Validation of Mean Diurnal Radiation
3.2. Validation of Diurnal Radiation
3.2.1. Validation under Daily Clear Sky Condition
3.2.2. Validation under Daily Cloudy Sky Condition
3.3. Validation of Diurnal Solar Radiation in Different Months
3.4. Validation of Diurnal Solar Radiation in Different Season
4. Discussion
4.1. Estimation Bias Based on Weather: Cloudy vs. Clear
4.2. Comparison of GHI Studies
4.3. Performance Analysis of Heliosat-2 Estimates across Satellites
5. Conclusions
Author Contributions
Funding
Data Availability Statement
Acknowledgments
Conflicts of Interest
References
- Habte, A.; Sengupta, M.; Lopez, A. Evaluation of the National Solar Radiation Database (NSRDB): 1998-2015; No. NREL/TP-5D00-67722; National Renewable Energy Lab (NREL): Golden, CO, USA, 2017.
- Zhang, J.; Zhao, L.; Deng, S.; Xu, W.; Zhang, Y. A Critical Review of the Models Used to Estimate Solar Radiation. Renew. Sustain. Energy Rev. 2017, 70, 314–329. [Google Scholar] [CrossRef]
- Sen, Z. Solar Energy Fundamentals and Modeling Techniques: Atmosphere, Environment, Climate Change, and Renewable Energy; Springer Science & Business Media: 2008. [CrossRef]
- Sengupta, M.; Habte, A.; Wilbert, S.; Gueymard, C.; Remund, J. Best Practices Handbook for the Collection and Use of Solar Resource Data for Solar Energy Applications; No. NREL/TP-5D00-77635; National Renewable Energy Lab (NREL): Golden, CO, USA, 2021.
- Driemel, A.; Augustine, J.; Behrens, K.; Colle, S.; Cox, C.; Cuevas-Agulló, E.; Denn, F. M.; Duprat, T.; Fukuda, M.; Grobe, H.; Haeffelin, M.; Hodges, G.; Hyett, N.; Ijima, O.; Kallis, A.; Knap, W.; Kustov, V.; Long, C. N.; Longenecker, D.; Lupi, A.; Maturilli, M.; Mimouni, M.; Ntsangwane, L.; Ogihara, H.; Olano, X.; Olefs, M.; Omori, M.; Passamani, L.; Pereira, E. B.; Schmithüsen, H.; Schumacher, S.; Sieger, R.; Tamlyn, J.; Vogt, R.; Vuilleumier, L.; Xia, X.; Ohmura, A.; König-Langlo, G. Baseline Surface Radiation Network (BSRN): Structure and Data Description (1992–2017). Earth Syst. Sci. Data 2018, 10, 1491–1501. [Google Scholar] [CrossRef]
- Hatzianastassiou, N.; Ioannidis, E.; Korras-Carraca, M.B.; Gavrouzou, M.; Papadimas, C.D.; Matsoukas, C.; Benas, N.; Fotiadi, A.; Wild, M.; Vardavas, I. Global Dimming and Brightening Features during the First Decade of the 21st Century. Atmosphere 2020, 11, 308. [Google Scholar] [CrossRef]
- Stamatis, M.; Hatzianastassiou, N.; Korras-Carraca, M.B.; Matsoukas, C.; Wild, M.; Vardavas, I. Interdecadal Changes of the MERRA-2 Incoming Surface Solar Radiation (SSR) and Evaluation against GEBA & BSRN Stations. Appl. Sci. 2022, 12, 10176. [Google Scholar] [CrossRef]
- Schreck, S.; Schroedter-Homscheidt, M.; Klein, M.; Cao, K.K. Satellite Image-Based Generation of High Frequency Solar Radiation Time Series for the Assessment of Solar Energy Systems. Meteorologische Zeitschrift 2020. [CrossRef]
- Balsamo, G.; Agusti-Parareda, A.; Albergel, C.; Arduini, G.; Beljaars, A.; Bidlot, J.; Blyth, E.; Bousserez, N.; Boussetta, S.; Brown, A.; Buizza, R. Satellite and In Situ Observations for Advancing Global Earth Surface Modelling: A Review. Remote Sens. 2018, 10, 2038. [Google Scholar] [CrossRef]
- Valipour, M.; Dietrich, J. Developing Ensemble Mean Models of Satellite Remote Sensing, Climate Reanalysis, and Land Surface Models. Theor. Appl. Climatol. 2022, 150, 909–926. [Google Scholar] [CrossRef]
- Prasad, A. A.; Kay, M. Prediction of Solar Power Using Near-Real Time Satellite Data. Energies 2021, 14, 5865. [Google Scholar] [CrossRef]
- Baatz, R.; Hendricks Franssen, H.J.; Euskirchen, E.; Sihi, D.; Dietze, M.; Ciavatta, S.; Fennel, K.; Beck, H.; De Lannoy, G.; Pauwels, V.R.N.; Raiho, A. Reanalysis in Earth System Science: Toward Terrestrial Ecosystem Reanalysis. Rev. Geophys. 2021, 59, e2020RG000715. [Google Scholar] [CrossRef]
- Huang, G.; Li, Z.; Li, X.; Liang, S.; Yang, K.; Wang, D.; Zhang, Y. Estimating Surface Solar Irradiance from Satellites: Past, Present, and Future Perspectives. Remote Sens. Environ. 2019, 233, 111371. [Google Scholar] [CrossRef]
- Cano, D.; Monget, J.M.; Albuisson, M.; Guillard, H.; Regas, N.; Wald, L. A Method for the Determination of the Global Solar Radiation from Meteorological Satellite Data. Solar Energy 1986, 37, 31–39. [Google Scholar] [CrossRef]
- Rigollier, C.; Lefèvre, M.; Wald, L. The Method Heliosat-2 for Deriving Shortwave Solar Radiation from Satellite Images. Solar Energy 2004, 77, 159–169. [Google Scholar] [CrossRef]
- Yang, L.; Gao, X.; Hua, J.; Wu, P.; Li, Z.; Jia, D. Very Short-Term Surface Solar Irradiance Forecasting Based on FengYun-4 Geostationary Satellite. Sensors 2020, 20, 2606. [Google Scholar] [CrossRef]
- Thaker, J.; Höller, R.; Kapasi, M. Short-Term Solar Irradiance Prediction with a Hybrid Ensemble Model Using METEOSAT Satellite Images. Energies 2024, 17, 329. [Google Scholar] [CrossRef]
- El Alani, O.; Ghennioui, H.; Abraim, M.; Ghennioui, A.; Blanc, P.; Saint-Drenan, Y.M.; Naimi, Z. Solar Energy Resource Assessment Using GHI and DNI Satellite Data for Moroccan Climate. In Proceedings of the International Conference on Advanced Technologies for Humanity, November 2021; Springer International Publishing: Cham, 275-285. [CrossRef]
- Verma, P.; Patil, S. A Machine Learning Approach and Methodology for Solar Radiation Assessment Using Multispectral Satellite Images. Ann. Data Sci. 2023, 10, 907–932. [Google Scholar] [CrossRef]
- Huang, C.; Shi, H.; Yang, D.; Gao, L.; Zhang, P.; Fu, D.; Chen, Q.; Yuan, Y.; Liu, M.; Hu, B.; Lin, K. Retrieval of Sub-Kilometer Resolution Solar Irradiance from Fengyun-4A Satellite Using a Region-Adapted Heliosat-2 Method. Solar Energy 2023, 264, 112038. [Google Scholar] [CrossRef]
- Vuilleumier, L.; Meyer, A.; Stöckli, R.; Wilbert, S.; Zarzalejo, L.F. Accuracy of satellite-derived solar direct irradiance in Southern Spain and Switzerland. *Int. J. Remote Sens. 2020, 41, 8808–8838. [Google Scholar]
- Polo, J.; Zarzalejo, L.F.; Cony, M.; Navarro, A.A.; Marchante, R.; Martin, L.; Romero, M. Solar Radiation Estimations over India Using Meteosat Satellite Images. Solar Energy 2011, 85, 2395–2406. [Google Scholar] [CrossRef]
- Masoom, A.; Kosmopoulos, P.; Bansal, A.; Kazadzis, S. Solar Energy Estimations in India Using Remote Sensing Technologies and Validation with Sun Photometers in Urban Areas. Remote Sens. 2020, 12, 254. [Google Scholar] [CrossRef]
- Ameen, B.; Balzter, H.; Jarvis, C.; Wey, E.; Thomas, C.; Marchand, M. Validation of Hourly Global Horizontal Irradiance for Two Satellite-Derived Datasets in Northeast Iraq. Remote Sens. 2018, 10, 1651. [Google Scholar] [CrossRef]
- Sarr, A.; Kebe, C.M.F.; Ndiaye, A. Validation of Helioclim-3 irradiance with ground observations in Senegal using four typical climatic zones. Materials Today: Proceedings. 2022, 51, 1888–1895. [Google Scholar]
- Syu, M.R.; Lee, P.H.; Leou, T.M.; Shen, Y. Solar Irradiance and Pan Evaporation Estimation from Meteorological Satellite Data. Terrestrial, Atmospheric & Oceanic Sciences 2016, 27. [Google Scholar]
- Bechet, J.; Albarelo, T.; Macaire, J.; Salloum, M.; Zermani, S.; Primerose, A.; Linguet, L. Updated GOES-13 Heliosat-2 Method for Global Horizontal Irradiation in the Americas. Remote Sens. 2022, 14, 224. [Google Scholar] [CrossRef]
- Brooks, M.J.; Du Clou, S.; Van Niekerk, W.L.; Gauché, P.; Leonard, C.; Mouzouris, M.J.; Meyer, R.; Van der Westhuizen, N.; Van Dyk, E.E.; Vorster, F.J. SAURAN: A New Resource for Solar Radiometric Data in Southern Africa. J. Energy Southern Africa 2015, 26, 2–10. [Google Scholar] [CrossRef]
- Knap, Wouter. Basic and other measurements of radiation at station Cabauw (2005-02 et seq) [dataset publication series]. Koninklijk Nederlands Meteorologisch Instituut, De Bilt, PANGAEA, 2022. [CrossRef]
- Olano, Xabier. Basic measurements of radiation at station Cener (2009-07 et seq) [dataset publication series]. National Renewable Energy Centre, PANGAEA, 2021. [CrossRef]
- Ohtake, Jun. Basic measurements of radiation at station Abashiri (2021-04) [dataset]. Japan Meteorological Agency, Tokyo, PANGAEA. 2021. [CrossRef]
- Ijima, Osamu. Basic and other measurements of radiation at station Tateno (2020-12) [dataset]. Aerological Observatory, Japan Meteorological Agency, PANGAEA. 2021. [CrossRef]
- Vogt, R. Basic and Other Measurements of Radiation at Station Gobabeb (2013-09). [Online]. 2013. [CrossRef]
- Long, C.N.; Shi, Y. The QCRad value added product: Surface radiation measurement quality control testing, including climatology configurable limits. Atmospheric Radiation Measurement Program Technical Report, 2006. [CrossRef]
- Ouiqary, A.E.; Kheddioui, E.; Smiej, M.F. Evaluation of the Global Horizontal Irradiation (GHI) on the Ground from the Images of the Second Generation European Meteorological Satellites MSG. Journal of Computer and Communications 2023, 11, 1–11. [Google Scholar] [CrossRef]
- Bird, R.E.; Hulstrom, R.L. Simplified clear sky model for direct and diffuse insolation on horizontal surfaces. Solar Energy Research Institute (SERI), Golden, CO, United States, 1981. (No. SERI/TR-642-761).
- Annear, R.L.; Wells, S.A. A comparison of five models for estimating clear-sky solar radiation. Water Resources Research 2007, 43. [Google Scholar] [CrossRef]
- Cros, S.; Badosa, J.; Szantaï, A.; Haeffelin, M. Reliability predictors for solar irradiance satellite-based forecast. Energies 2020, 13, 5566. [Google Scholar] [CrossRef]
- Jia, D.; Hua, J.; Wang, L.; Guo, Y.; Guo, H.; Wu, P.; Liu, M.; Yang, L. Estimations of global horizontal irradiance and direct normal irradiance by using Fengyun-4A satellite data in northern China. Remote Sensing 2021, 13, 790. [Google Scholar] [CrossRef]
- Oumbe, A.; Blanc, P.; Ranchin, T.; Homscheidt, M.S.; Wald, L. A new method for estimating solar energy resource. In Proceedings of the 33rd International Symposium on Remote Sensing of Environment (ISRSE 33), Joint Research Center, May 2009, paper-773.
- Qu, Z.; Oumbe, A.; Blanc, P.; Espinar, B.; Gesell, G.; Gschwind, B.; Klüser, L.; Lefèvre, M.; Saboret, L.; Schroedter-Homscheidt, M.; Wald, L. Fast radiative transfer parameterisation for assessing the surface solar irradiance: The Heliosat-4 method. Meteorologische Zeitschrift 2017, 26, 33–57. [Google Scholar] [CrossRef]
- Mouhamet, D.; Tommy, A.; Primerose, A.; Laurent, L. Improving the Heliosat-2 method for surface solar irradiation estimation under cloudy sky areas. Solar Energy 2018, 169, 565–576. [Google Scholar] [CrossRef]
- Papachristopoulou, K.; Fountoulakis, I.; Bais, A.F.; Psiloglou, B.E.; Papadimitriou, N.; Raptis, I.P.; Kazantzidis, A.; Kontoes, C.; Hatzaki, M.; Kazadzis, S. Effects of clouds and aerosols on downwelling surface solar irradiance nowcasting and short-term forecasting. Atmospheric Measurement Techniques 2024, 17, 1851–1877. [Google Scholar] [CrossRef]
- Li, J.; Tang, W.; Qi, J.; Yan, Z. Mapping high-resolution surface shortwave radiation over East Asia with the new generation geostationary meteorological satellite Himawari-8. International Journal of Digital Earth 2023, 16, 323–336. [Google Scholar] [CrossRef]
- Yu, Y.; Shi, J.; Wang, T.; Letu, H.; Yuan, P.; Zhou, W.; Hu, L. Evaluation of the Himawari-8 shortwave downward radiation (SWDR) product and its comparison with the CERES-SYN, MERRA-2, and ERA-interim datasets. IEEE Journal of Selected Topics in Applied Earth Observations and Remote Sensing 2018, 12, 519–532. [Google Scholar] [CrossRef]
- Urraca, R.; Huld, T.; Gracia-Amillo, A.; Martinez-de-Pison, F.J.; Kaspar, F.; Sanz-Garcia, A. Evaluation of global horizontal irradiance estimates from ERA5 and COSMO-REA6 reanalyses using ground and satellite-based data. Solar Energy 2018, 164, 339–354. [Google Scholar] [CrossRef]
- Fountoulakis, I.; Kosmopoulos, P.; Papachristopoulou, K.; Raptis, I.P.; Mamouri, R.E.; Nisantzi, A.; Gkikas, A.; Witthuhn, J.; Bley, S.; Moustaka, A.; Buehl, J. Effects of Aerosols and Clouds on the Levels of Surface Solar Radiation and Solar Energy in Cyprus. Remote Sens. 2021, 13, 2319. [Google Scholar]
| Station Name | Short Names | Lat (° N/S) |
Lon (° E/W) |
Country (Region) |
Ground Data Source | Satellite Data source | Analysis Period | Reference |
| Cabauw | CAB | 51.96 | 4.92 | Netherlands (European Union) |
BSRN | MSG-1 and 2 | 01/2022 - 02/2024 | [29] |
| Cener | CNR | 42.81 | -1.60 | Spain (European Union) |
BSRN | MSG-1 and 2 | 01/2022 - 01/2024 | [30] |
| Abashiri | ABS | 44.01 | 144.27 | Japan (East Asia) |
BSRN | Himawari-8 | 01/2023 - 10/2023 | [31] |
| Tateno | TAT | 36.05 | 140.12 | Japan (East Asia) |
BSRN | Himawari-8 | 01/2023 - 02/2024 | [32] |
| Gobabeb | GOB | −23.56 | 15.04 | Namibia (Africa) |
BSRN | MSG-1 and 2 | 01/2022 - 12/2023 | [33] |
| USAid Venda | VUW | −23.13 | 30.42 | South Africa (Africa) |
SAURON | MSG-1 and 2 | 01/2022 - 12/2023 | [28] |
| South Jeddah | SRA | 22.58 | 39.16 | Saudi Arabia (Middle East) |
Ground SCADA | MSG-1 and 2 | 08/2023 - 01/2024 03/2024 - 04/2024 |
- |
| Ashok Nagar | ASO | 24.52 | 77.62 | India (South Asia) |
Ground SCADA | MSG-1 and 2 | 01/2023 – 10/2023 | - |
| Honnali | HON | 14.20 | 75.56 | India (South Asia) |
Ground SCADA | MSG-1 and 2 | 01/2023 – 10/2023 | - |
| Site | NCloudy | NClear | Total Days | % NCloudy | % NClear |
|---|---|---|---|---|---|
| CAB | 167 | 596 | 763 | 21.89 | 78.12 |
| CNR | 136 | 624 | 760 | 17.89 | 82.11 |
| ABS | 132 | 140 | 272 | 48.53 | 51.47 |
| TAT | 143 | 252 | 395 | 36.20 | 63.80 |
| GOB | 88 | 642 | 730 | 12.05 | 87.95 |
| VUW | 240 | 490 | 730 | 32.88 | 67.12 |
| SRA | 55 | 150 | 205 | 26.83 | 73.17 |
| ASO | 74 | 229 | 303 | 24.42 | 75.58 |
| HON | 82 | 220 | 302 | 27.15 | 72.85 |
| Region Wise (Sum) | |||||
| Parts of Europe | 303 | 1220 | 1523 | 19.9 | 81.1 |
| Parts of East Asia | 275 | 392 | 667 | 41.23 | 58.77 |
| Part of Africa | 328 | 1132 | 1460 | 22.47 | 77.53 |
| Part of Middle East | 55 | 150 | 205 | 26.83 | 73.17 |
| Parts of South Asia | 156 | 449 | 605 | 25.8 | 74.2 |
Disclaimer/Publisher’s Note: The statements, opinions and data contained in all publications are solely those of the individual author(s) and contributor(s) and not of MDPI and/or the editor(s). MDPI and/or the editor(s) disclaim responsibility for any injury to people or property resulting from any ideas, methods, instructions or products referred to in the content. |
© 2024 by the authors. Licensee MDPI, Basel, Switzerland. This article is an open access article distributed under the terms and conditions of the Creative Commons Attribution (CC BY) license (http://creativecommons.org/licenses/by/4.0/).


