1. Introduction
The study described in this paper focuses on the use of Heavy Liquid Metals (HLMs) as spallation target material in particle accelerators. This choice is motivated by the potential increase in power of the accelerators, which determines greater heat generation to be managed by the beam intercepting devices. In particular, this article proposes a study on an alternative design for the Beam Dump Facility (BDF) using a liquid lead target at C. Flowing liquid metals are very attractive as they can provide a far larger thermal capacity and, therefore, guarantee a comfortable safety margin in operation. The assessment of their performance, especially in high-turbulent regimes, is still challenging with well-established CFD commercial codes due to their unique physical characteristics.
1.1. The Beam Dump Facility
The Beam Dump Facility (BDF) is a proposed facility foreseen to be located in the North Area of the Super Proton Synchrotron (SPS) at CERN [
1], developed to serve experiments associated with the search of feebly interacting particles. The facility would enable searches for very weakly interacting particles predicted by various physics models, as well as extensive tau neutrino searches. The current BDF design has been primarily driven by the requirements of the Search for Hidden Particles Experiment (SHiP) [
2,
3]: the target shall safely absorb the full 400 GeV/c SPS primary beam every
, and it is required to maximize the production of charm mesons and to maximize the re-absorption of pions and kaons. This implies a high-Z material with a short nuclear interaction length. The main challenge comes from the requirement to withstand the high deposited power: up to 355 kW on average and up to
MW over the 1 s beam pulse.
The BDF proposed target baseline consists of cylindrical blocks of a titanium–zirconium-doped molybdenum alloy (TZM), followed by sections of pure tungsten, enclosed in tantalum-tungsten alloy cladding to prevent corrosion from the high velocity cooling water. The thickness of each block and the location of each cooling slot were optimized to ensure uniform energy deposition and sufficient energy extraction [
4]. In order to demonstrate the capability to sustain the thermo-mechanical stresses, a prototype target was built and tested successfully with a beam in the North Area target area during 2018 [
5,
6].
The current baseline is capable of handling safely the full beam power deposition if the beam is diluted: the dilution technique consists of magnetically deflecting the beam upstream to move the spot location over the pulse time. This is necessary to avoid premature failure by cracking of the target core or cladding due to excessive energy density in the refractory metals composing the target core.
The current design is optimized to maximize the physics reach with the baseline beam parameters. However, additional operational flexibility would be obtained if the energy density values were to be relaxed and no radiation damage concerns were to be introduced.
1.2. HLM Alternative Target
In this paper, an alternative to the baseline design is evaluated, with the intention of adopting HLM technologies developed in the framework of advanced nuclear technology research. The possibilities offered by proton-driven HLM targets are quite unique and very interesting in order to overcome some of the operational challenges encountered in solid target/dump assemblies: the use of HLM (pure lead or lead-bismuth eutectic) has the potential advantages of increased power and power density handling capability, reduced degradation and loss of functionality over time due to thermo-mechanical stresses and radiation damage. Also, in the case of circulating systems, it offers the opportunity to displace the cooling system far from the target area.
The geometry considered for the preliminary investigations on the target is driven by the interaction volume simulated in FLUKA, consisting of a cylindrical volume of 2000 mm in length and a diameter of 150 mm. To this, inlet and outlet sections 76 mm in diameter are added radially at both ends, as shown in
Figure 1.
The paper reports on the analyses made to determine the mass flow rate necessary to guarantee the management of the thermal power through the use of the commercial code ANSYS CFX [
7]. Further thermo-hydraulic analysis are conducted using ANSYS FLUENT, to confirm the thermal results obtained in terms of peak temperatures, thus advancing towards a concept design with tentative hydraulics parameters.
2. Liquid Metals and Source Modeling
This section explores the mathematical model of turbulent heat transfer and the numerical implementation of the simulated data related to the heat source generated by the proton beam.
2.1. Turbulent Heat Transfer in Liquid Metals
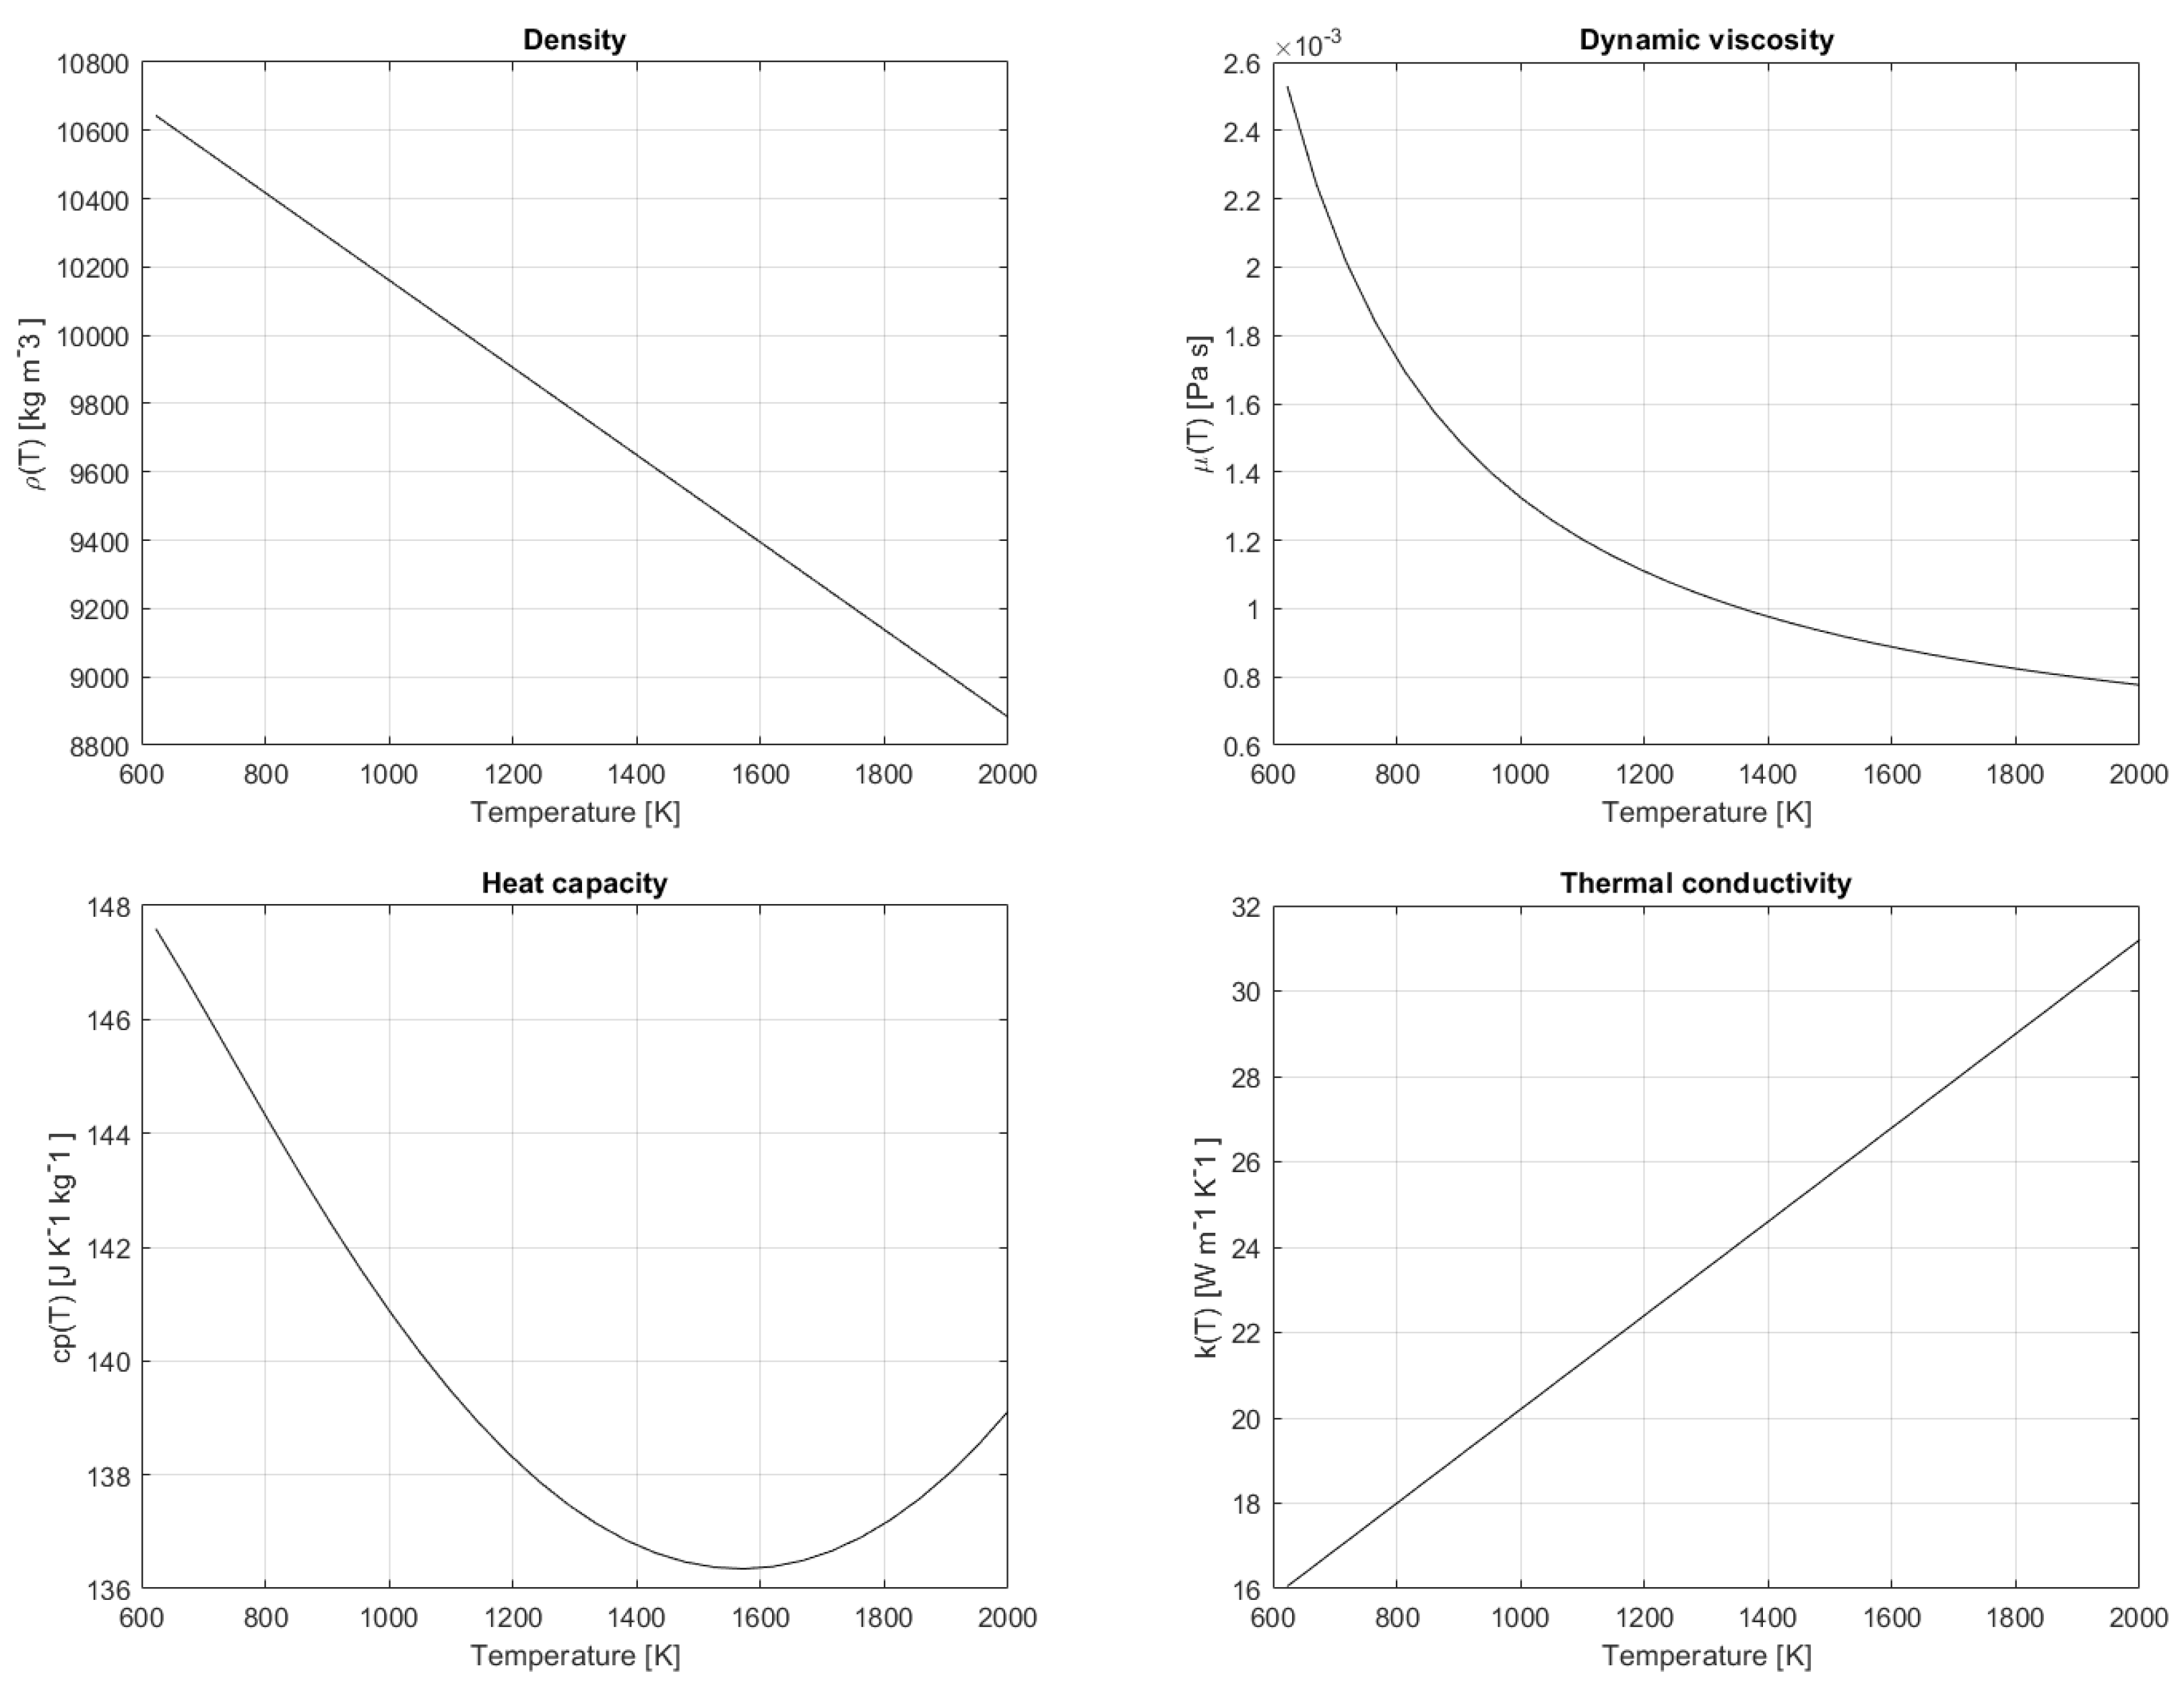
Liquid metals are well known for their thermal properties that enhance heat transfer and are considered key fluids for new energy applications. The thermophysical properties of liquid lead as a function of temperature, taken from the Handbook [
8] are characterized by high thermal conductivity
k and low viscosity
. In this paper we assume
for the density
, molecular viscosity
, heat conductivity
k and specific heat
, respectively Their trend as a function of temperature
T, according to the formulas in the Handbook, is shown in
Figure 2. Lead has a boiling point of 2021 K and a melting point of 600 K [
8].
The accuracy required for the thermal management of a circulating-HLM target raises the problem of CFD models for low Prandtl numbers. In fact, when dealing with liquid metals, the thermal diffusivity dominates the momentum diffusivity, leading to a Prandtl number in the range
–
. This problem is common in many industrial and research applications, such as nuclear reactors with fast spectrum and MHD (Magneto-Hydro-Dynamics) energy conversion facilities, where the high thermal conductance and heat capacity are relevant to remove a high quantity of heat. When trying to reproduce turbulent heat flows in liquid metals, standard models implemented in commercial codes such as Fluent and CFX are generally not accurate enough to reproduce the heat transfer in such regimes. The turbulent Prandtl number
is defined as the ratio between the diffusivity
and the turbulent viscosity
, and it is commonly assumed to be constant: this is not the case for these fluids [
9,
10]. Commercial codes are, in fact, calibrated on fluids such as water and air where the hypothesis of similarity between the dynamics of thermal and viscous turbulence holds and the calculation of turbulent diffusivity is simply deduced by taking
and therefore
. A more sophisticated model is required to reproduce the heat exchange when dealing with liquid metals with low Prandtl numbers. The development of such a model requires an extensive set of experimental data that covers all the regimes of interest for the experiment at hand. It must be taken into account that these experiments are very expensive and require measuring instruments specifically developed to manage these types of fluids. When it is possible to perform CFD studies utilizing DNS (Direct Numerical Simulations), the correct heat transfer coefficients can be calculated directly with the simulation. However, even these are limited to small spatial domains and simple geometries since the computational cost of DNS is very high, even on modern parallel architectures. In fact, only a handful of geometries have been successfully explored with DNS using low Prandtl numbers. Various models have been developed in recent years based on RANS (Reynolds Averaged Navier-Stokes) models for different fluids. In particular, recent interest in turbulence models for heat transfer has increased since two of the main designs for fourth-generation nuclear reactors utilize liquid metals (sodium and lead, respectively) to support the development of effective and tailored computational tools for these new reactors [
11,
12].
Many strategies have been explored to tackle the modeling of the turbulent heat exchange in liquid metals. A simple model can be obtained by specifying the turbulent Prandtl number
as a function of geometry and other dimensionless quantities such as the distance to the wall or the viscosity ratio [
9,
10,
13]. The problem with this approach is that this function depends on the case under consideration and the specific geometry. In particular, this solution can be used in a narrow set of specific geometries such as the cylindrical one relevant to the experiment that is the topic of this paper. A big advantage of this approach is that it is very simple to implement, and it does not significantly affect the system of partial differential equations to be solved. This is crucial when using commercial codes that leave a reduced set of options to the user to manipulate the mathematical model. Experimental evidence measuring integral heat transfer can be used to determine such functions that must be explored for a comprehensive set of Reynolds and Péclet numbers. For this purpose, experiments, not yet fully available, are necessary with advanced measurement techniques to estimate the basic mechanism of turbulent heat exchange that provides the heat and velocity flows to the walls, together with the fluctuations of the thermal and velocity fields. Furthermore, additional experiments are needed to define the thermal wall functions for liquid metals valid in the nonlinear region above
.
Heat transfer in liquid metals with low Prandtl numbers is characterized by a high contribution of molecular conduction compared to conventional heat transfer with high Prandtl numbers for conventional fluids such as water, where the inertial contribution and convective exchange have a significant role. The temperature drop in liquid metals is, therefore, limited within the laminar substrates. Empirical models, based on global heat exchange and tailored to the experiment geometry, show great accuracy when applied within the limits where they were obtained. On the other hand, they perform poorly when they are adapted to different regimes and/or geometries. Theoretical models are more complex to develop, often do not perform to the same level of accuracy of the empirical models but they lead to a significant and deeper understanding of the heat transmission mechanism. Among the empirical models, we can mention the Aoki model, the Dwyer model and the Reynolds model, which we report below [
12]
All these models give comparable results in cylindrical geometries with diameters of 10 mm at
C with velocities in the range from
to
, which gives values for the Péclet number ranging from 140 to 2800. In these models, the value of
is assumed constant.
Numerous DNS simulations in flat channel geometry have been performed to study the spatial behavior of the value of the turbulent Prandtl number. These calculations show that the near-wall value is close to unity regardless of the Prandtl and Reynolds number if the Prandtl number is greater than
[
13]. For small values of Prandtl, such as the range
characteristic of liquid metals, the value of
tends to 2 at the wall. The value increases moving away from the wall and reaches its maximum value at a distance of
. The turbulent Prandtl number ranges from 1 to 3, which also agrees with the correlations reported above.
When using the CFX code, starting from the results of these correlations in [
12], the following expression for the value of the turbulent Prandtl number is recommended
where
b is calculated by the following formula
With the values defined above, the Kirillov correlation [
14]
is reproduced quite well with the liquid metal LBE for low values, while for high values, it comes close to that of Stromquist [
15]
The correlation proposed in [
12] is therefore
where
b is defined by (
6). To avoid singular values, the (
5) can be used for Péclet values greater than 1000 and a constant value of the turbulent Prandtl number equal to 4 for Péclet values less than 1000.
2.2. Modeling of the Thermal Source
The dynamic and thermal analysis of the target device is carried out with two Ansys commercial codes: CFX and Fluent [
7,
16]. The two codes are used in parallel in order to confirm the feasibility of the project and to benchmark the two software to one other. The computational domain is made of three ducts, a middle one that is
long and
in diameter, and two smaller
ducts for the inlet and the outlet, transverse to the central duct. Liquid lead entering at
is used as the target.
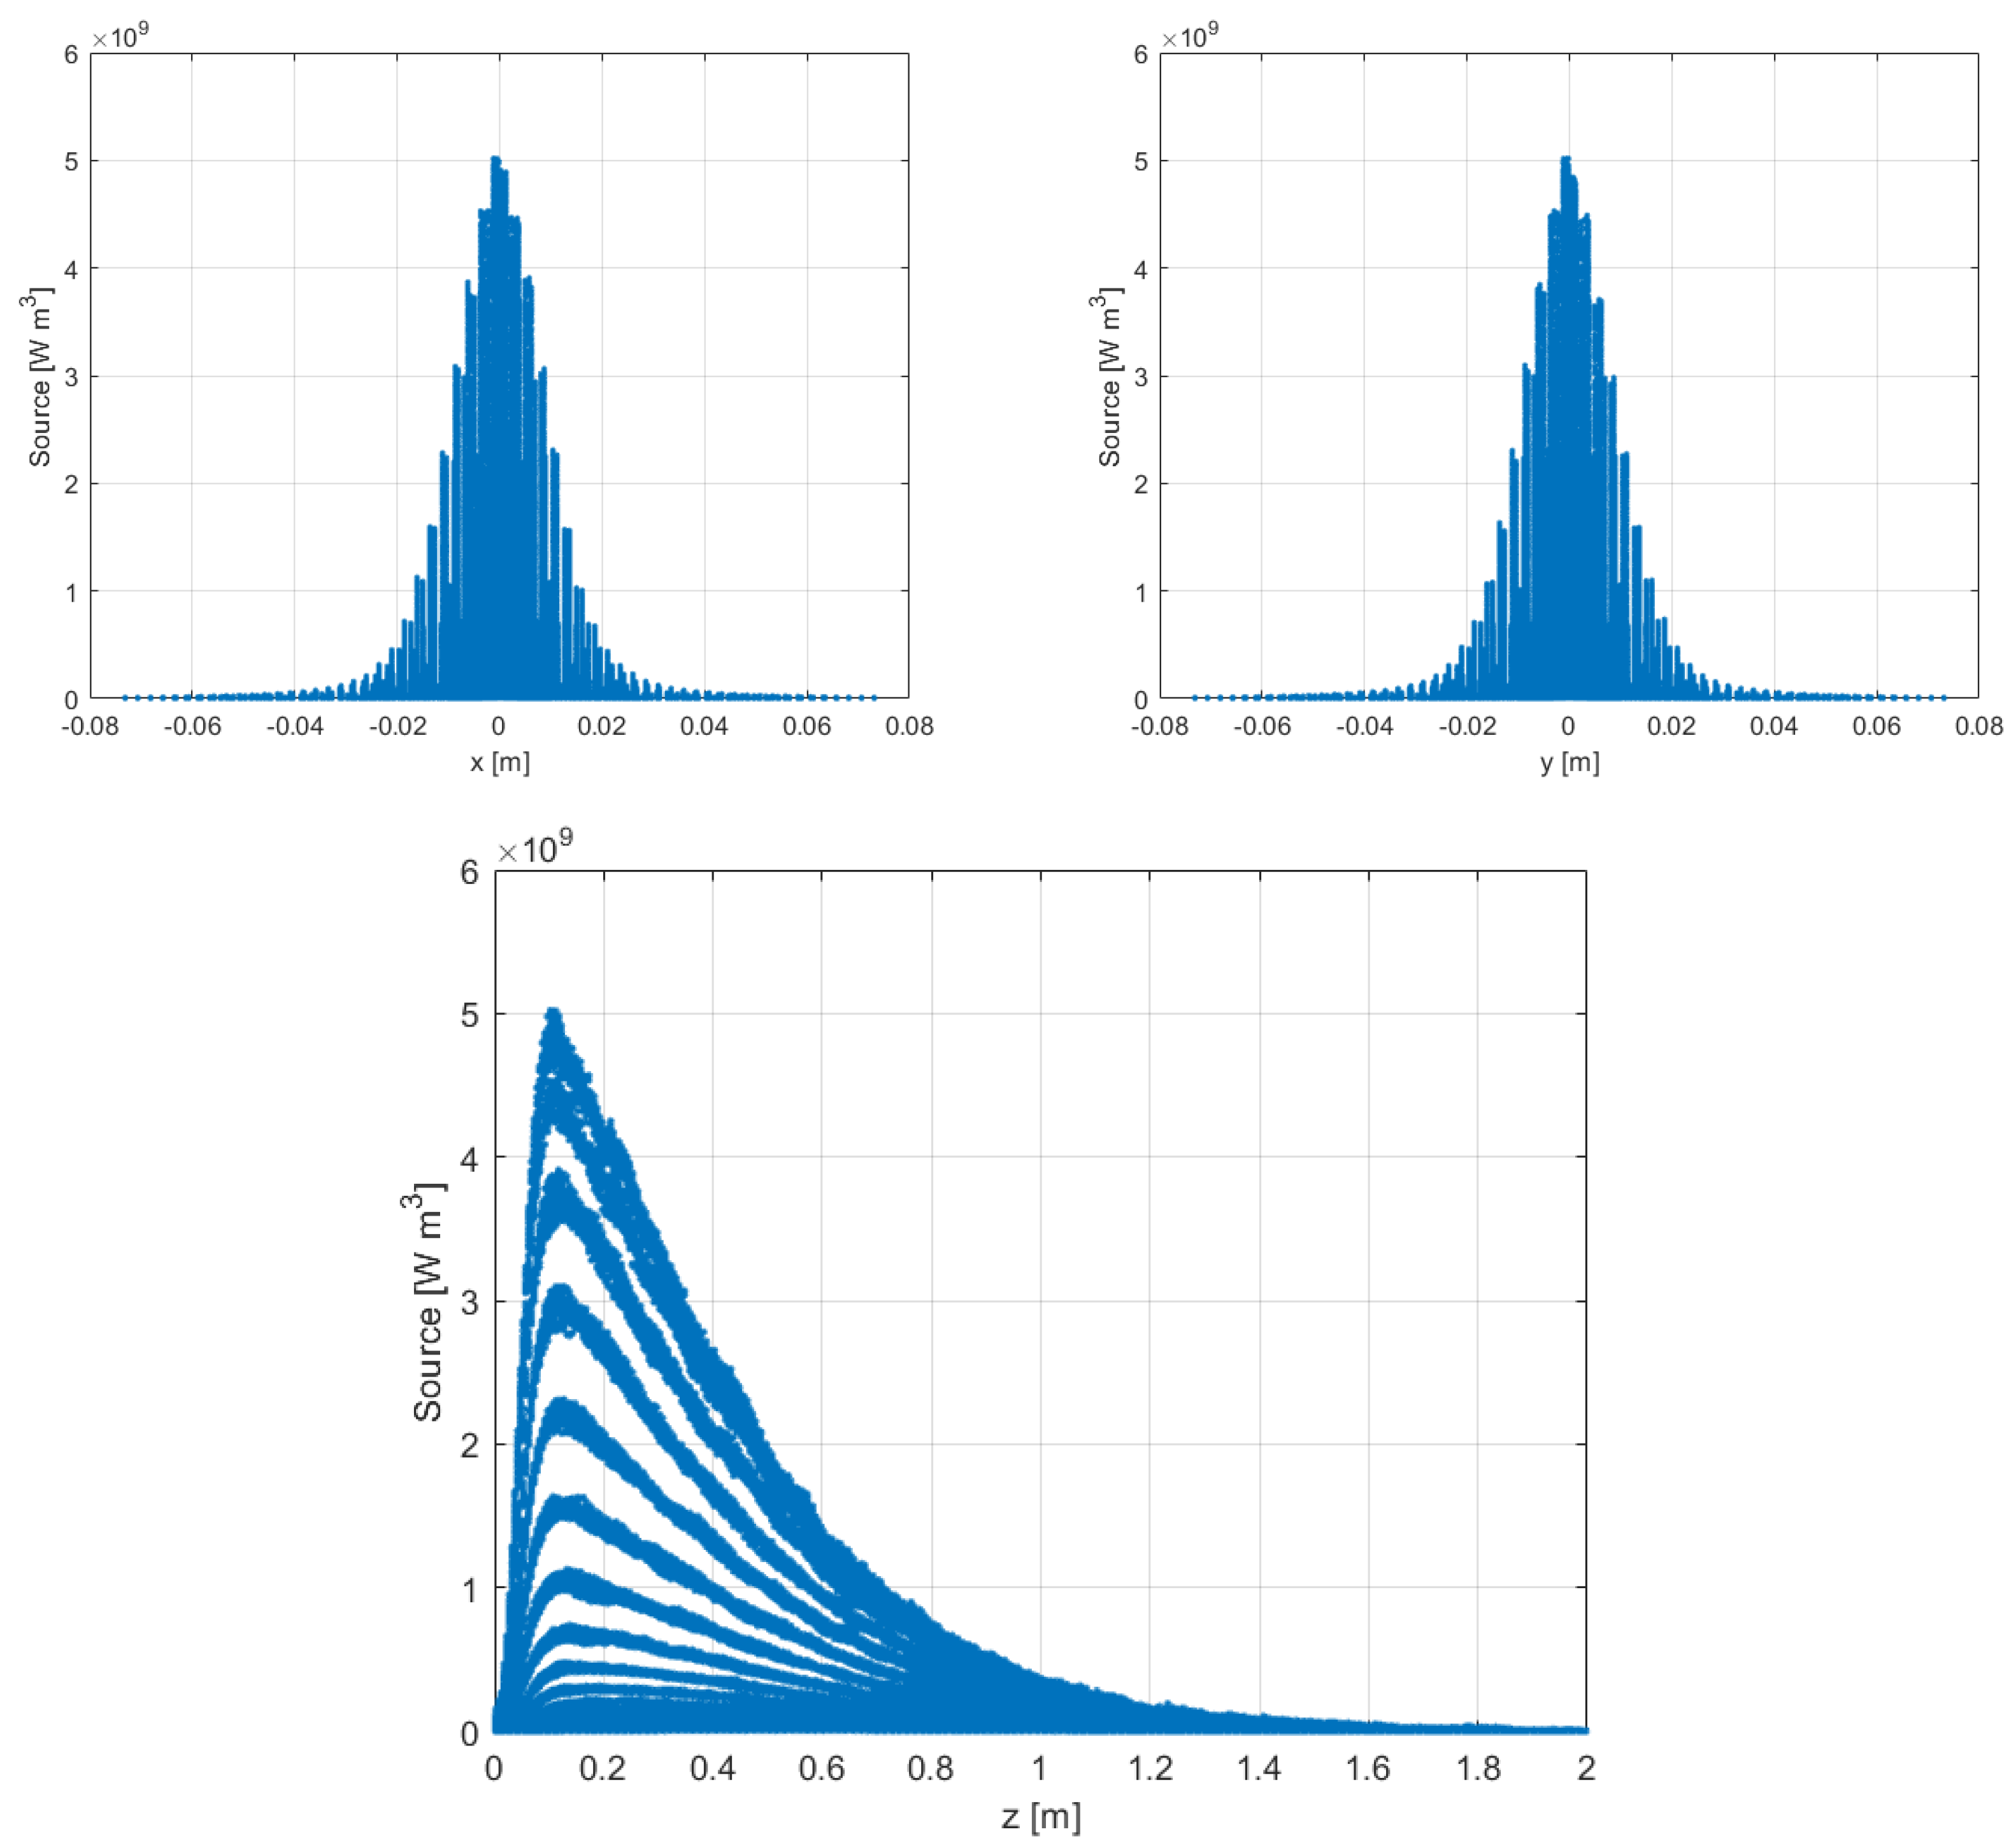
The interaction of the proton beam with the target/dumper generates, from a thermo-hydraulic point of view, a thermal source per unit of volume, which must be disposed of by the fluid that generates a consequent increase in temperature. The size of the thermal source is provided by the experiment through a map indited on the coordinates
and power density. The beam is axisymmetric and peaks along the z-axis. The source, which fills the entire volume of the middle conduit, is represented in
Figure 3, while
Table 1 summarizes the variation of the source data within the domain. The values reported in the
Table 1 indicate the minimum (Min), maximum (Max), and average (Ave) power density of the source; the quantities
,
indicate the variation of spatial coordinates in cylindrical coordinates, where
is the increment over the
z coordinates.
The thermal source visualized in
Figure 3 shows that its value significantly differs from zero only in a narrow cylinder close to the axis located in the left half of the domain. This small volume can reasonably be assumed to be a coaxial cylinder inside the central duct, with one meter length and two centimeters diameter. Inside this volume, the thermal source has values exceeding
. We developed a strategy to model this thermal source on the underlying mesh based on finding the closest known value to each of the computational mesh centroids. The algorithm considers a plane
with a fixed
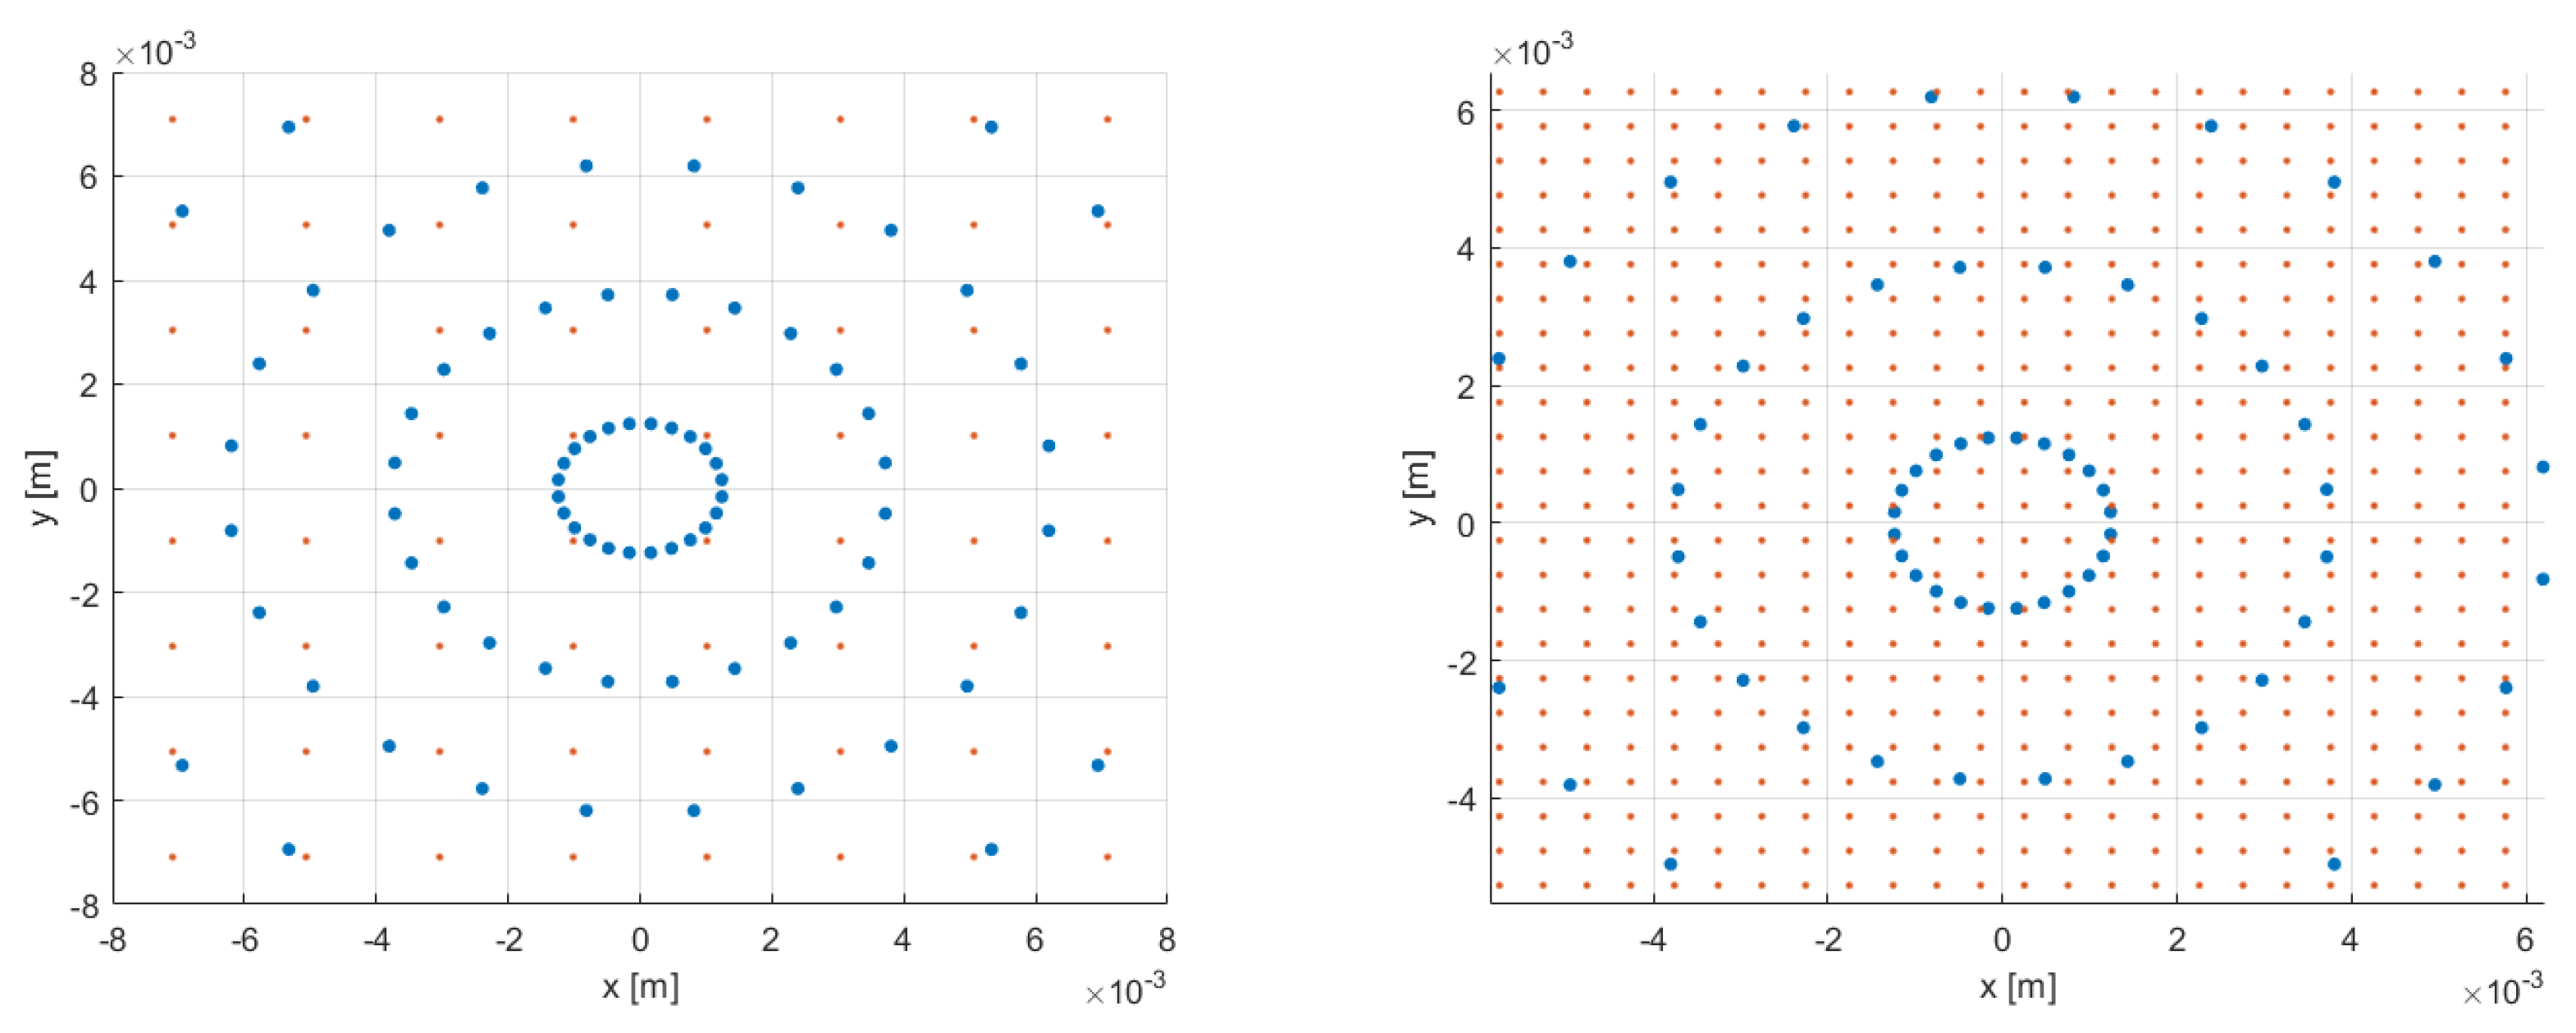
z, assuming a constant pitch mesh. The two graphs presented in
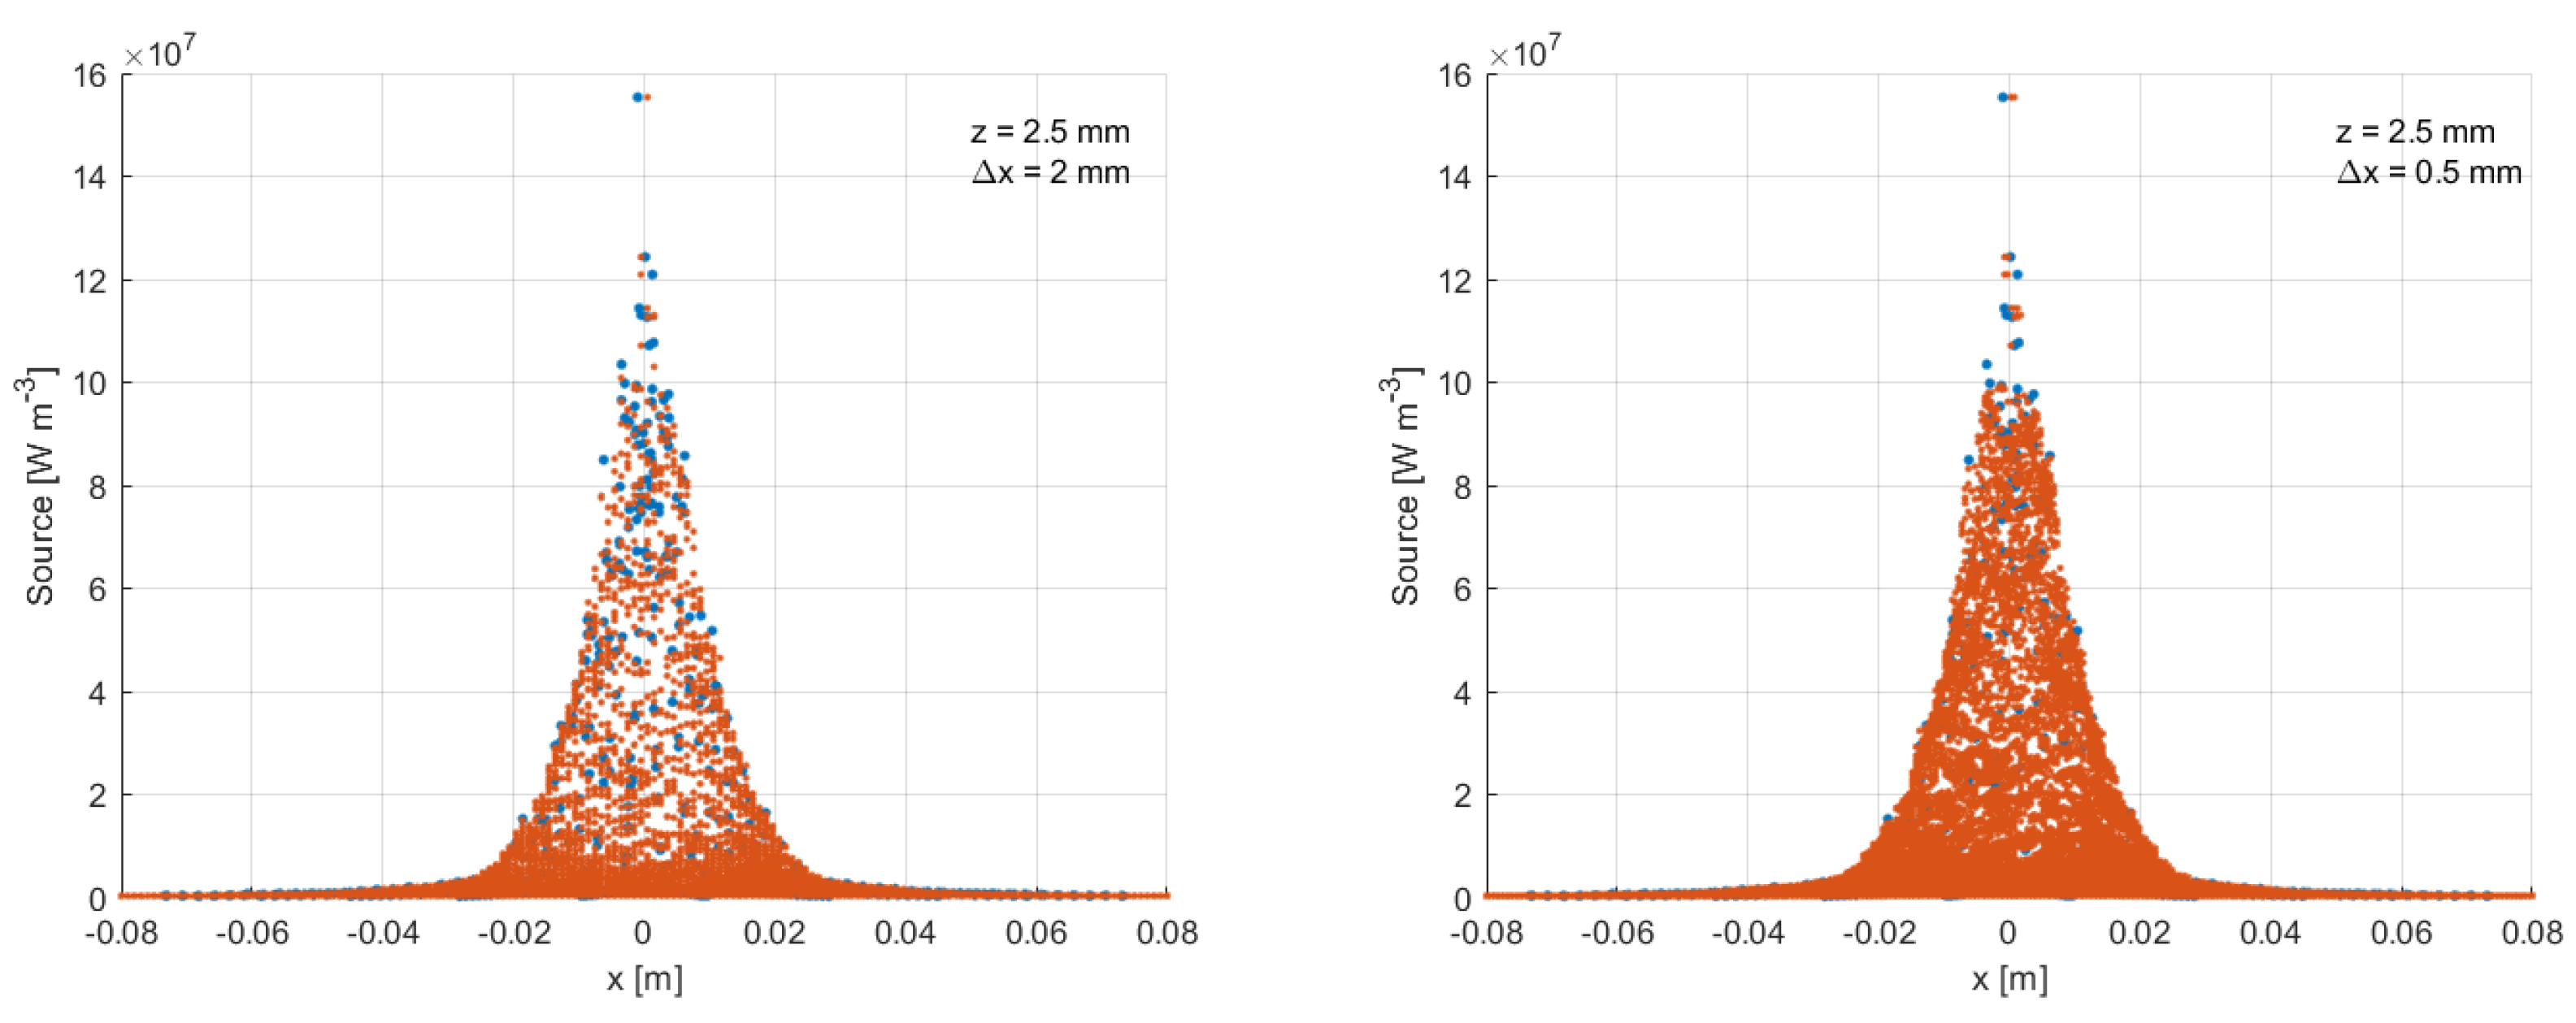
Figure 4 overlay the mesh points (in red) on the thermal map points (in blue). Two analyses with different mesh sizes were conducted to understand the importance of the discretization of the source term: a mesh with a pitch of 2 mm (on the left) and a finer one with a pitch of 0.5 mm (on the right). We observe that the source has a higher density of points around the origin, leading to a complex interpolation in that region. In fact, in this area, either the source points are greater than the number of interpolating points (the node-centroids of the mesh, as in
Figure 4 (right)), or the interpolating points are poorly distributed with respect to the thermal map of the source (
Figure 4 (left)).
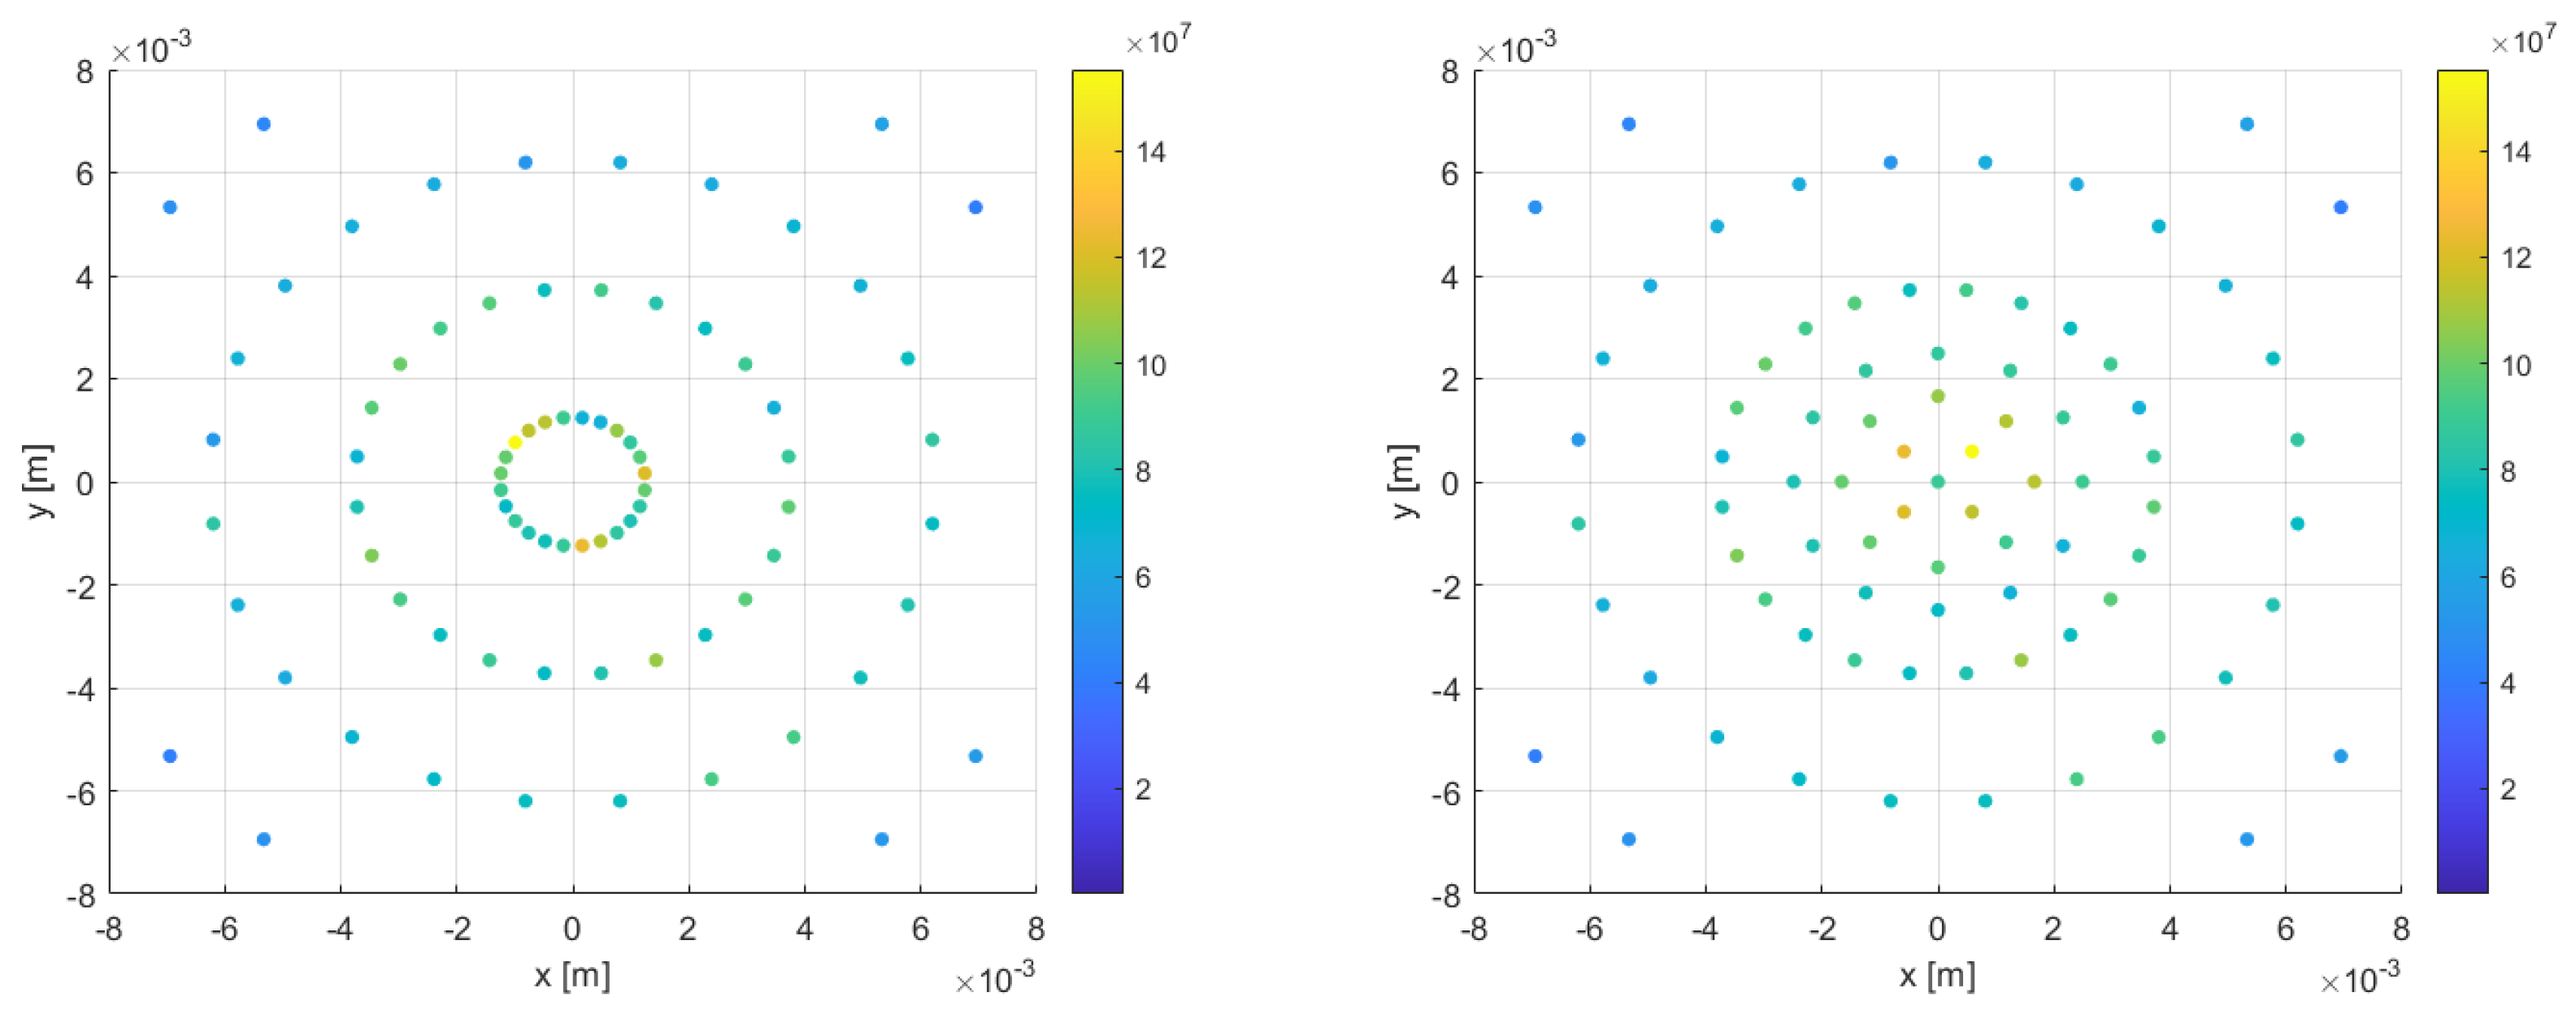
In order to improve the discretization of the source on the CFD mesh, an algorithm has been implemented in C++, which redistributes the source to the center of the cylindrical duct. The algorithm redefines the coordinates of the source points that are distant from the duct axis by a value between 2.5 and 4 mm (
) so that the points corresponding to a larger thermal source are better distributed near the axis. The coordinates
of the new points were obtained through a transformation into polar coordinates. In doing so, three new distinct circles were defined starting from the point of origin, trying to spatially redistribute the points uniformly.
Figure 5 shows the source distribution before and after applying the algorithm just discussed. In order to keep the peak of the source within the first 2.5 mm (see
Figure 3), it is decided to interpolate the thermal source on the centroid based on the coordinates of the closest point of the original source instead of averaging it with the inverse of the distance according to the appropriate function.
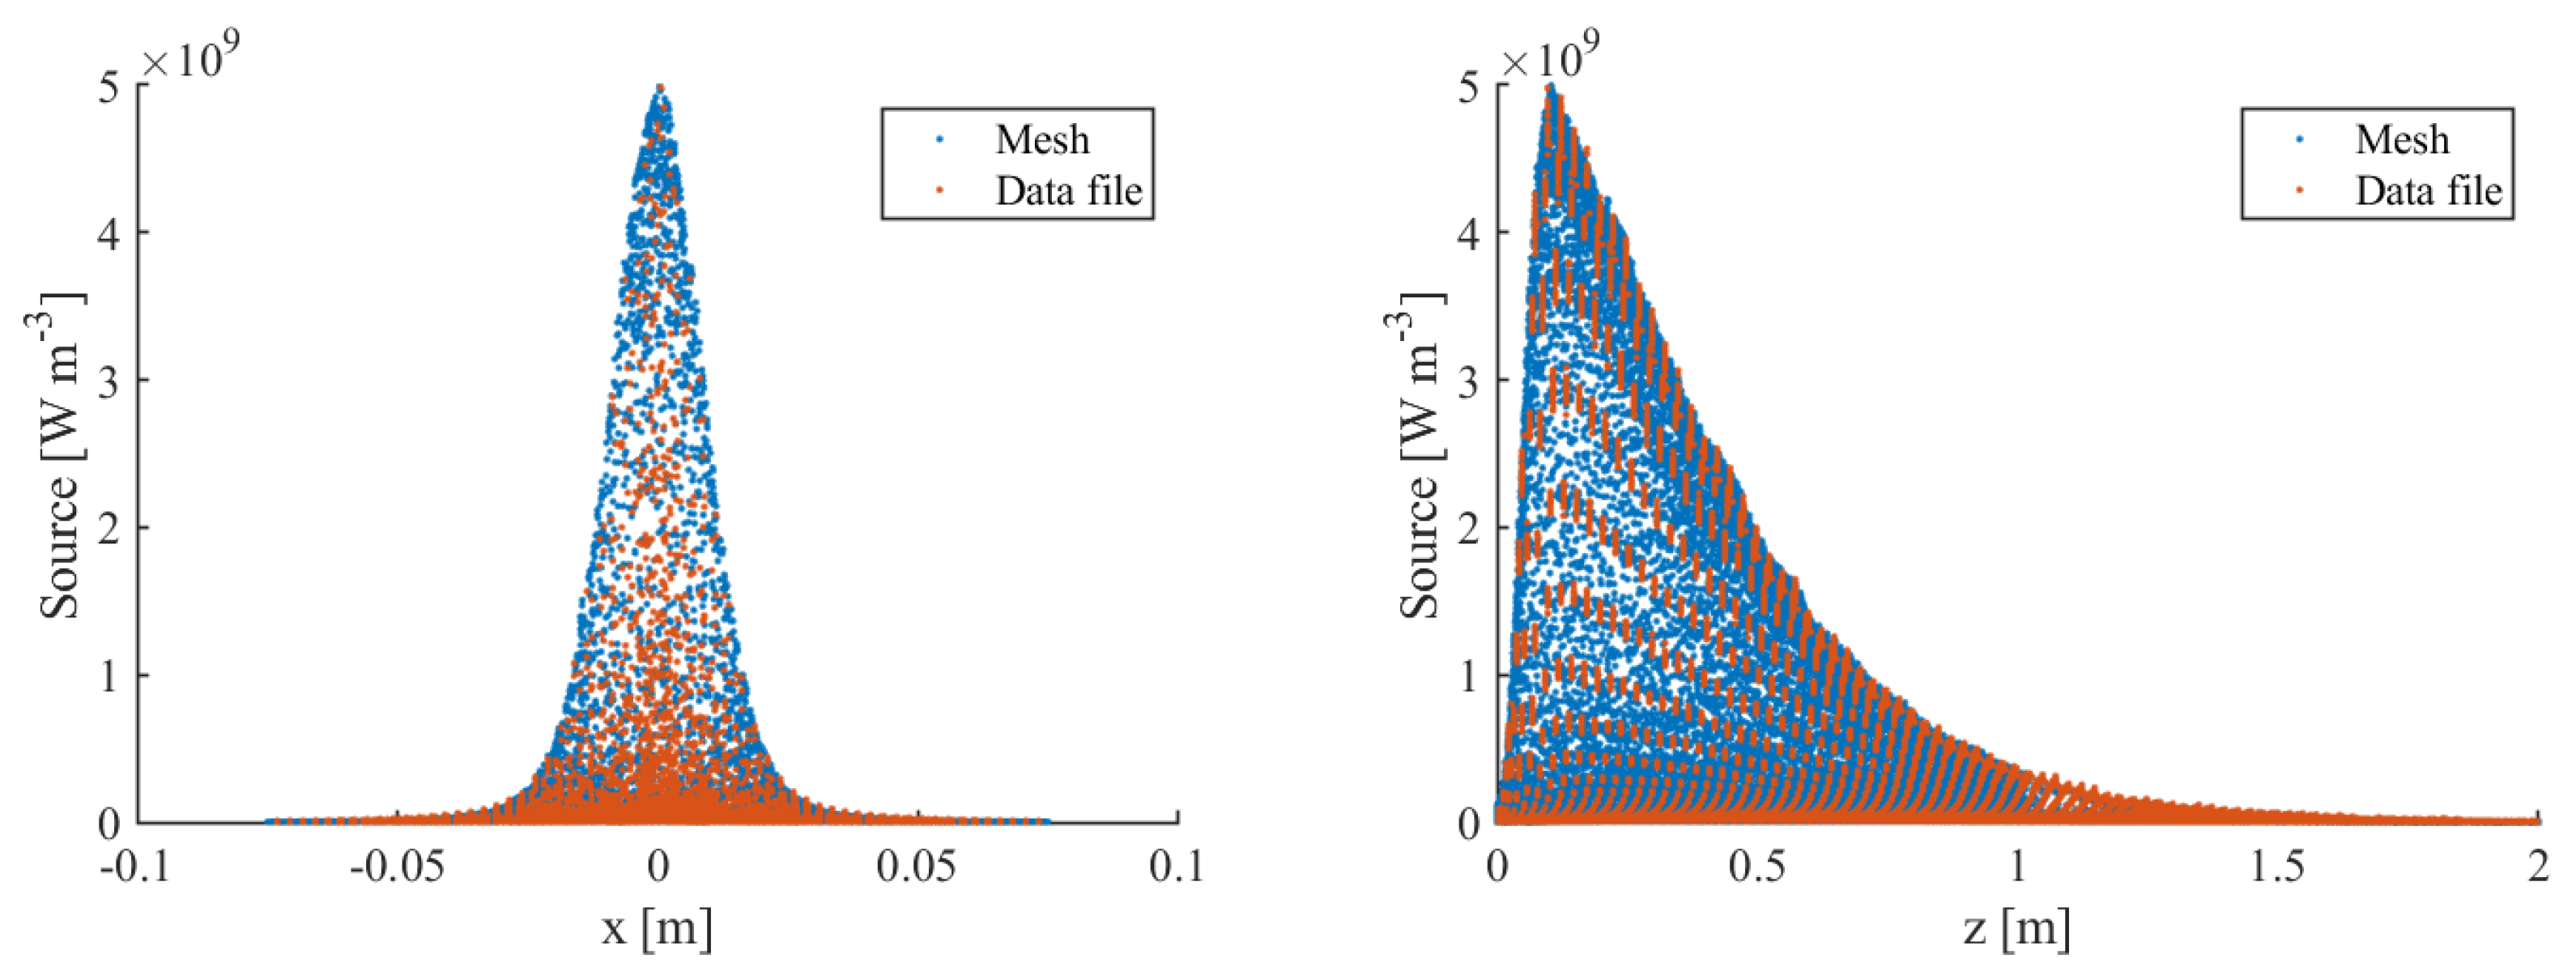
The thermal source obtained with our interpolation strategy is displayed in
Figure 6, where we can see that the thermal source in both meshes is well interpolated. In the 0.5 mm mesh (on the right), there is a notable density of source points that are well-approximated along the entire
x interval. In the 2 mm mesh (on the left), however, these points are slightly coarser, which leads to a poor approximation near the axis that implies a larger drop in overall thermal input.
Starting from these considerations, a polyhedral mesh was used for the CFD simulations in Fluent, with a
cell size of 8 mm. In particular, after trying different configurations, it was decided to implement the heat map on the mesh through two Body of Influence (BOI). These are regions within the volume of interest that can be defined by the user and are used to modify the dimensions of the mesh in the area on which they are defined. They are, therefore, useful for modeling effects such as obstacles, for example, or heat sources in our specific case. We chose to size them as two cylinders coaxial to the central duct, both one meter long: the first with a 20 mm diameter and 2 mm refinement, the other with a 10 mm diameter and a 1 mm refinement. The two graphs in
Figure 7 show the resulting thermal source implemented in Fluent using the UDF on the mesh discussed above.
3. Simulation Setup for the CFD Codes
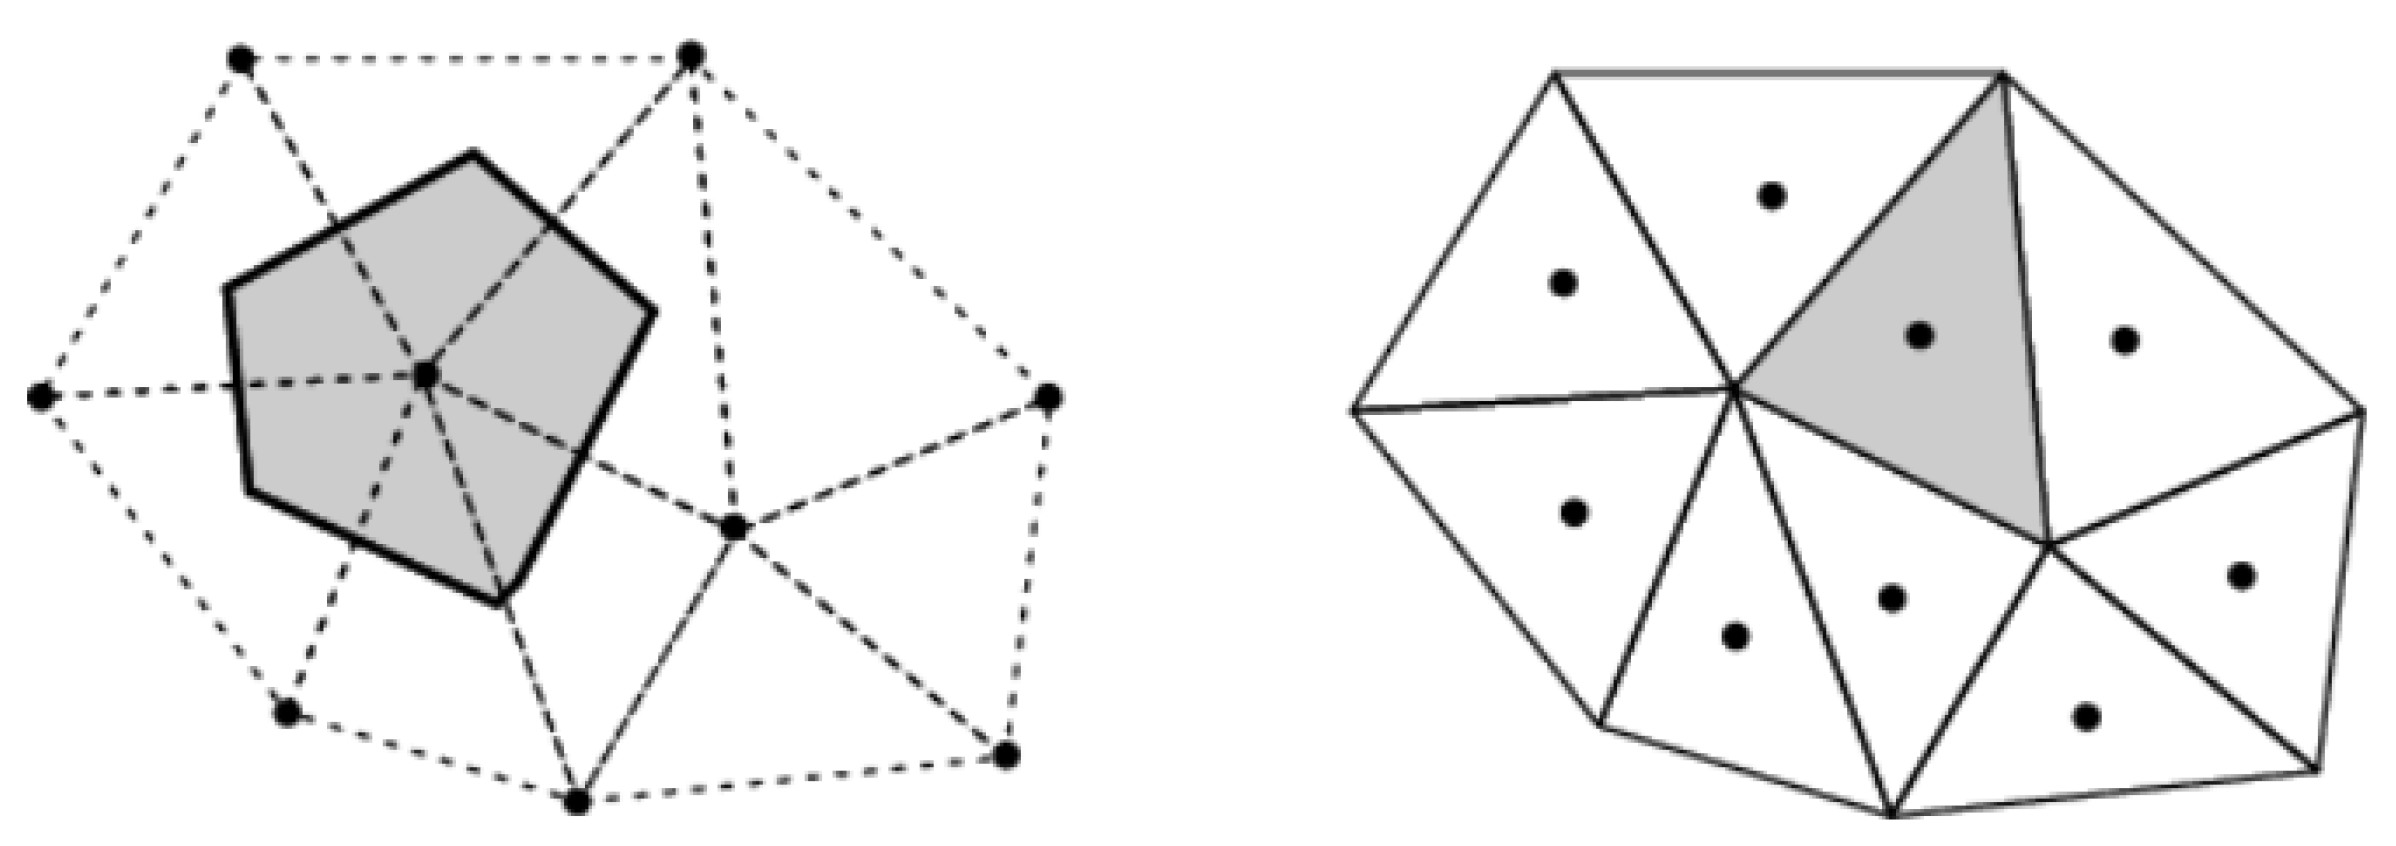
The CFX and Fluent solvers were used and compared to check which is more suitable for performing the simulation of the BDF facility. The two codes adopt both the finite volume method; that is, they evaluate the quantities of interest (velocity, density, pressure, and temperature) in small control volumes defined by the computational mesh through the calculation of the fluxes of these quantities [
7]. The main difference between the two solvers lies in the definition of the single control volume: CFX implements the vertex-centered method (VCM), while Fluent uses the cell-centered method (CCM).
In the first, the variables are associated to the mesh nodes, and the control volume is defined by the middle lines passing through each face of the grid cells. Conversely, in the cell-centered method, the variables are stored in the centroids of the computational cells defined in the mesh, and the control volume is defined by the triangulation of the mesh itself. Both schemes have advantages and disadvantages in terms of accuracy and computational cost. The CCM has generally fewer unknown flows but more degrees of freedom. This makes it more computationally expensive, using approximately double the memory and resources compared to VCM. On the other hand, it is less sensitive to mesh quality, in particular to the non-orthogonality and skewness of the discretization. Both solvers have different choices with different spatial discretization schemes: first-order upwind difference, second-order central difference, high-resolution scheme in CFX and first-order upwind, second-order upwind, second-order central differencing in Fluent.
Figure 8.
Vertex-centered method (VCM) on the left and cell-centered method (CCM) on the right. The gray area illustrates the control volume for the two setups.
Figure 8.
Vertex-centered method (VCM) on the left and cell-centered method (CCM) on the right. The gray area illustrates the control volume for the two setups.
The implementation of the thermal source is done differently for each of the two software. CFX allows the implementation of the source via a more user-friendly graphical interface. The implementation of the thermal source in CFX is, in fact, done by defining a volume within the domain in which the thermal source will be interpolated, using a function containing the heat map data.
The heat source for the
k-th centroid is given by
where
is the distance between the
k-th centroid and the
i-th point of the heat source,
the value of the heat source at
k-th point,
n the number of heat source points and
N is the number of the mesh centroids.
and
are the
j-th component of the
k-th centroid and of the
i-th point of the thermal source, respectively. The value
is the heat source expressed in
which is inserted into the energy balance equation. In our case, given the viscosity of lead, the heat-generating contribution due to viscous effects can be neglected. In both solvers, the source is interpolated for each cell centroid in the computational domain via (
10). This value is then averaged on the inverse distance between the three thermal sources closest to the centroid in exam. This interpolation scheme is directly available in CFX and it was ported to Fluent.
3.1. Simulation Setup with the CFX Solver
The CFD simulations performed with the CFX software use the SST turbulence model. The boundary condition at the inlet is an imposed mass flow rate for the velocity and a fixed temperature, while at the outlet, the pressure is fixed, and the temperature gradient is set to zero. All other boundaries are modeled as adiabatic walls, so we impose a no-slip condition for the velocity and no heat flux for the temperature. The computational domain is an unstructured mesh of million nodes with a on all the walls. The time step for the transient is set to . The lead inlet temperature is C. The analysis of the thermal transient is done by solving only the energy equation with imposed motion obtained from a previous isothermal simulation. In CFX, three classes of simulations are performed with different mass flow rates: 185 kg/s (A), kg/s (B), and kg/s (C), respectively. All cases have the same mesh and the same boundary conditions; the only variation is the mass flow rate at the inlet. Thermal power is implemented by an interpolation function using standard tools in CFX from an appropriate window selector. The heat source implementation in CFX using this approach has an error of compared to the average steady-state power integrated directly from FLUKA results. The maximum temperature, reached at the end of the thermal deposition, is C (case A) and C (case C), while the maximum wall temperatures are C (case A) and C (case C). Given the temperature values reached, the target flow rate value is kg/s. With this flow rate value, a CFD analysis is performed spanning two subsequent beams in order to analyze the dependence of the temperature profile on the frequency of the beams, i.e. to understand what influence the residual heat can impose on the next heat cycle. This analysis shows an increase in peak temperature between two successive beams of only C, so the thermal conductivity of the lead is able to almost entirely remove the heat of a single beam before a new one delivers its heat payload.
3.2. Simulation Setup with the Fluent Software
From the point of view of the implemented models, Fluent presents more complex physical and numerical models. In this way, it is possible to simulate almost all fields of physics, such as magnetohydrodynamics, acoustics, radiative heat exchange, combustion and motion in porous materials. The solution of new physical models in Fluent is also possible thanks to the implementation of UDFs. In conclusion, the strengths of CFX are numerical stability and ease of use, while those of Fluent lie in the variety of physical-mathematical models that can be used together with the possibility of new implementations.
The setup of the simulations in Fluent follows the CFX setup as closely as possible to minimize the differences and properly assess and compare the quality of the results. Therefore, the turbulence model selected is the same, the
SST model. The boundary conditions are a fixed mass flow rate at the inlet for the velocity, pressure outlet, and no-slip condition on all walls. The temperature is fixed at the inlet and adiabatic conditions are used on all other boundaries. The mesh is a polyhedral unstructured mesh of
million nodes with a
. The time step for the transient is
. The mesh size was selected as explained in Sub
Section 2.2. The mesh has an inflation layer (a layer of cells very close to the wall, whose dimensions grow further away from it) of
millimeters.
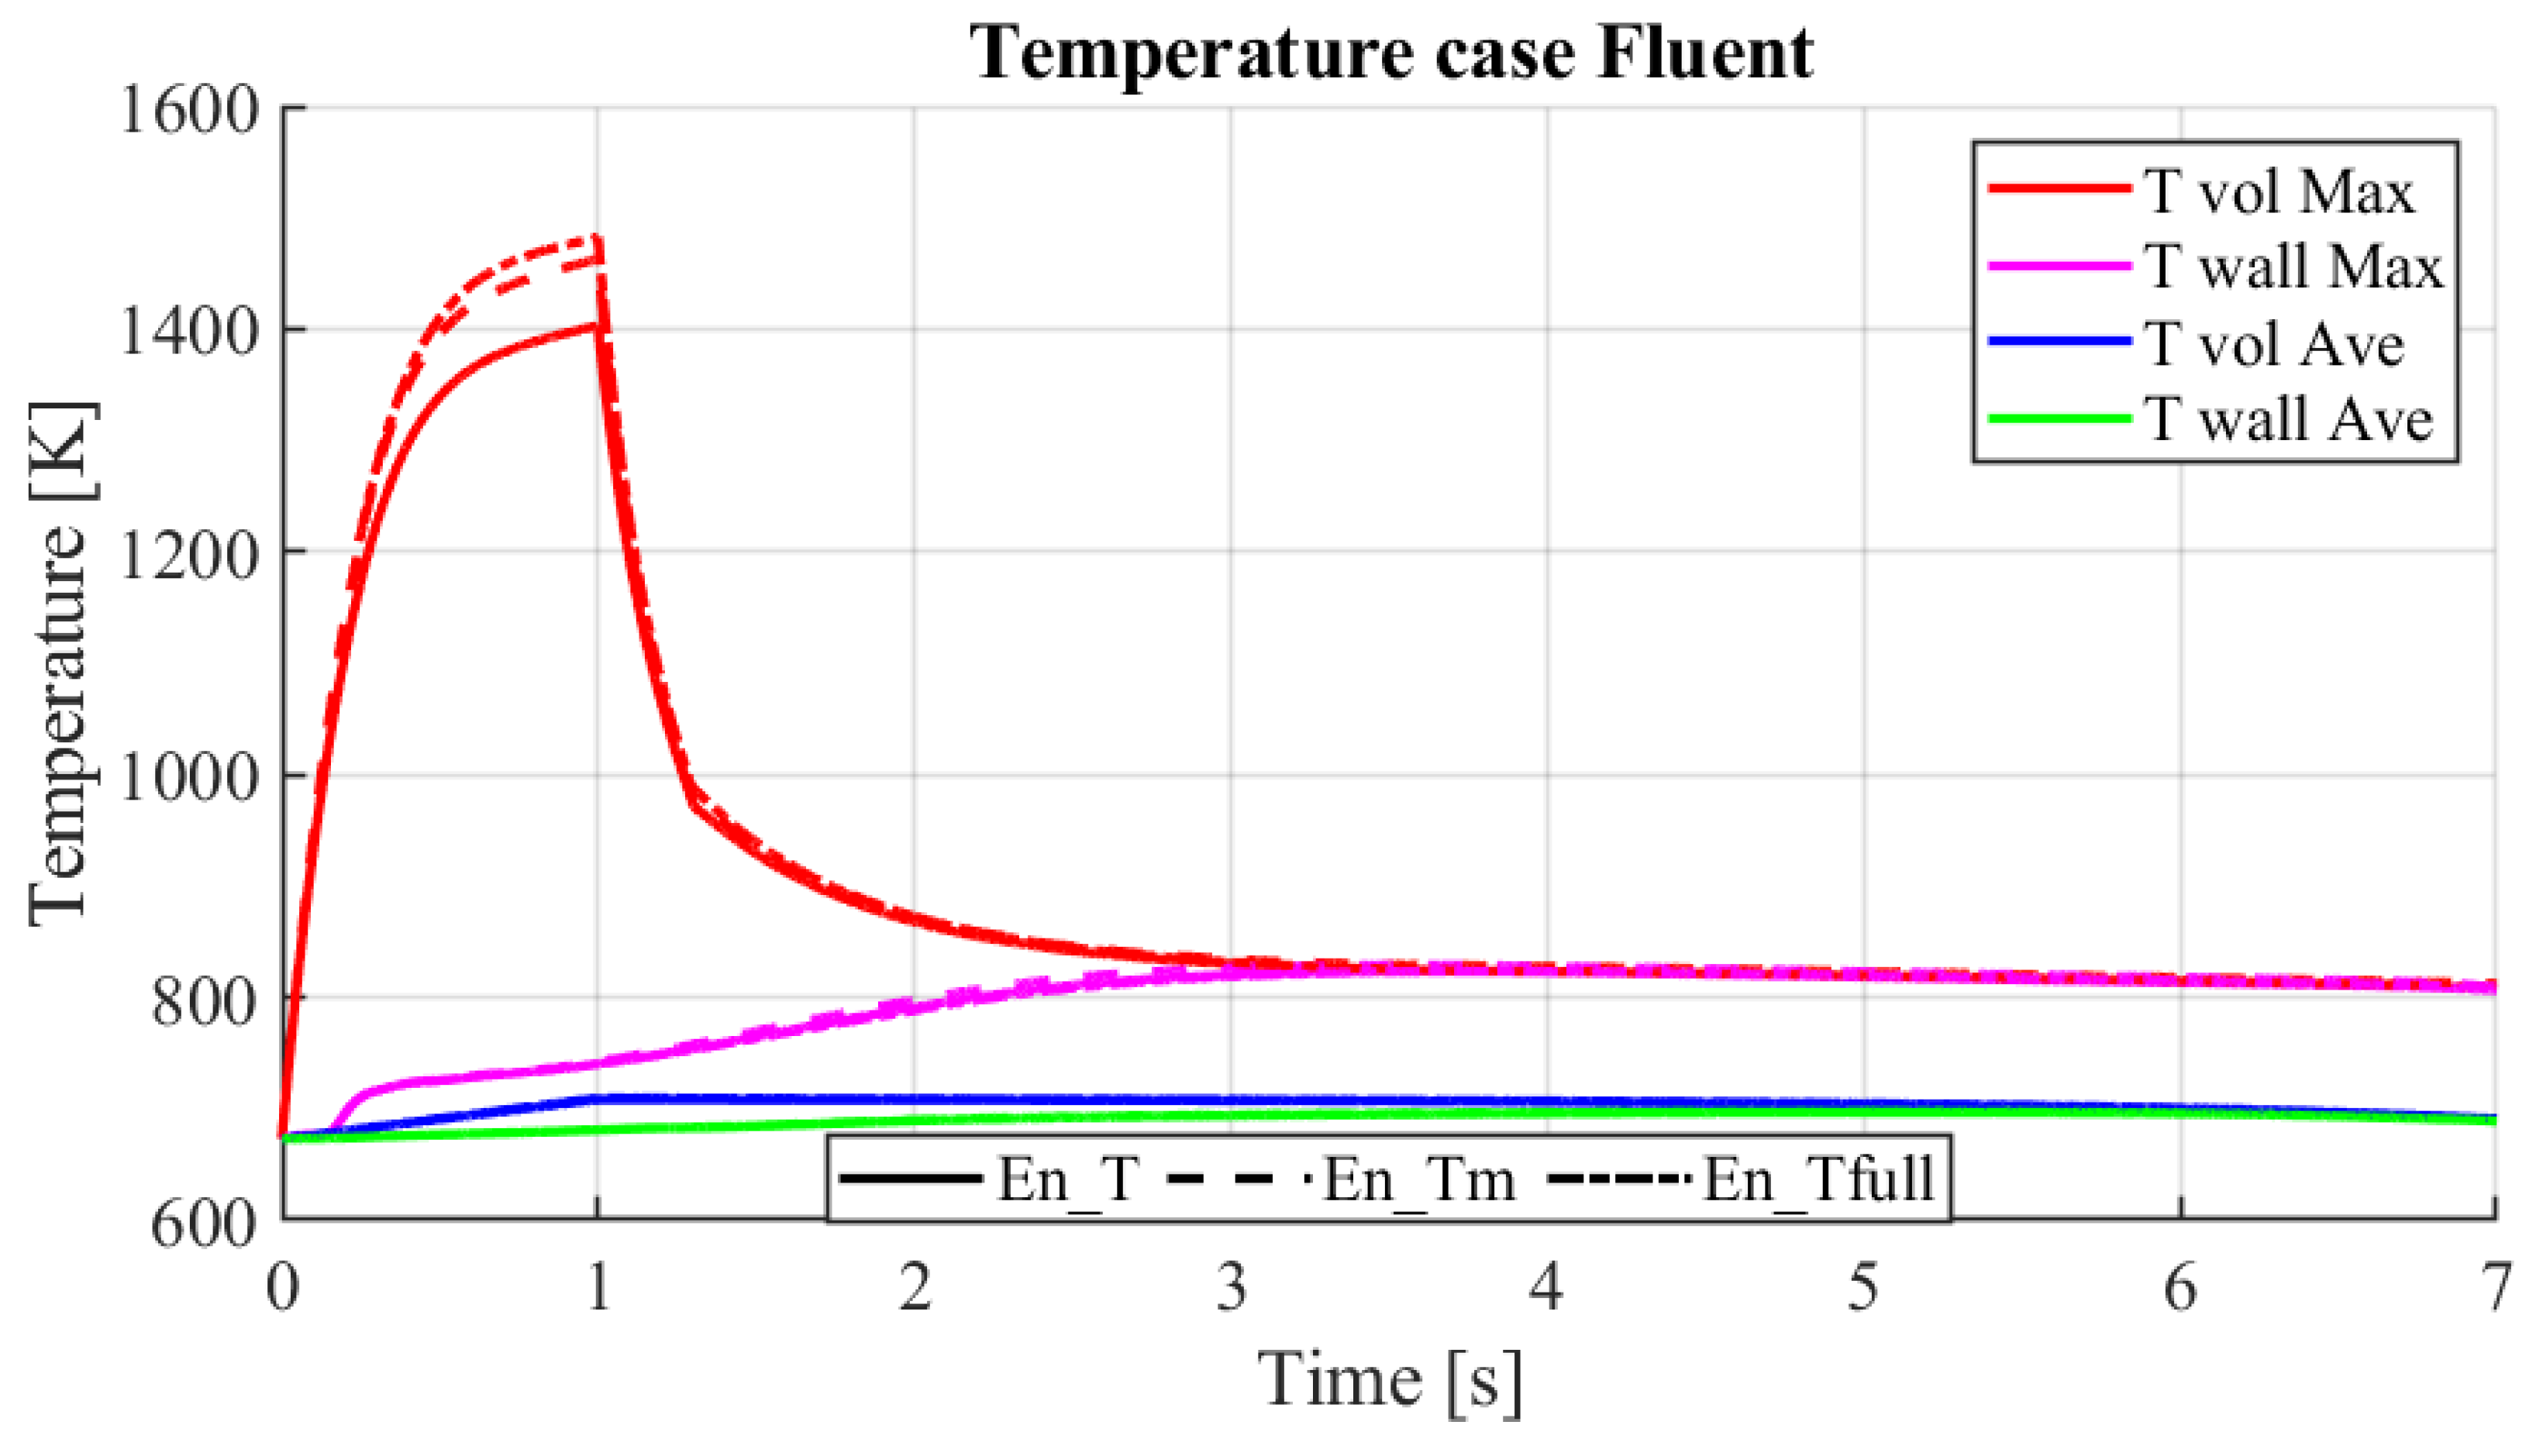
The study of the thermal transient is carried out with different subsequent simulations aimed at analyzing the problem at increasing levels of complexity and computational cost. The classes of simulations carried out can be grouped into three cases: case 1, labeled by En_T, where only the energy equation with imposed motion is solved; case 2, by En_Tm, where only the energy equation with variable physical properties is solved; and case 3, by En_full, where the complete simulation with variable properties, equation of motion, and energy are solved.
The thermal source due to the proton beam is time-dependent and has characteristics summarized in
Table 2. To verify the effects of the interpolation of the heat map on the mesh, a stationary simulation of the
En_T type was conducted. In this case, only the energy equation was solved with constant physical properties for the lead and with an imposed velocity field. This simulation results in an average deposited power of
, against the
provided by CERN, with an error of
, and a temperature at the outlet of
. The heat map implementation is calibrated with this error of
, the same one present in CFX simulations.
3.3. Heat Source Setup
The implementation of the thermal source is done differently for each of the two software. Fluent necessarily requires the use of User-Defined Functions (UDFs), written in C or C++. These allow the manipulation and implementation of equations and solution models directly in the Fluent solver loop. CFX supports some form of user-defined functions written in Fortran. UDFs are scripts in C++ or C which, taking advantage of Fluent’s native MACROS, allow you to solve scalar equations (User Define Scalar, UDS), define properties of materials, sources, execute commands during the solver wheels or implement new boundary conditions. For the simulations shown in this paper, two C scripts were developed. The first, property.c, is used to add the physical properties of lead as a function of the temperature, while the second, source.c, implements the heat source.
The
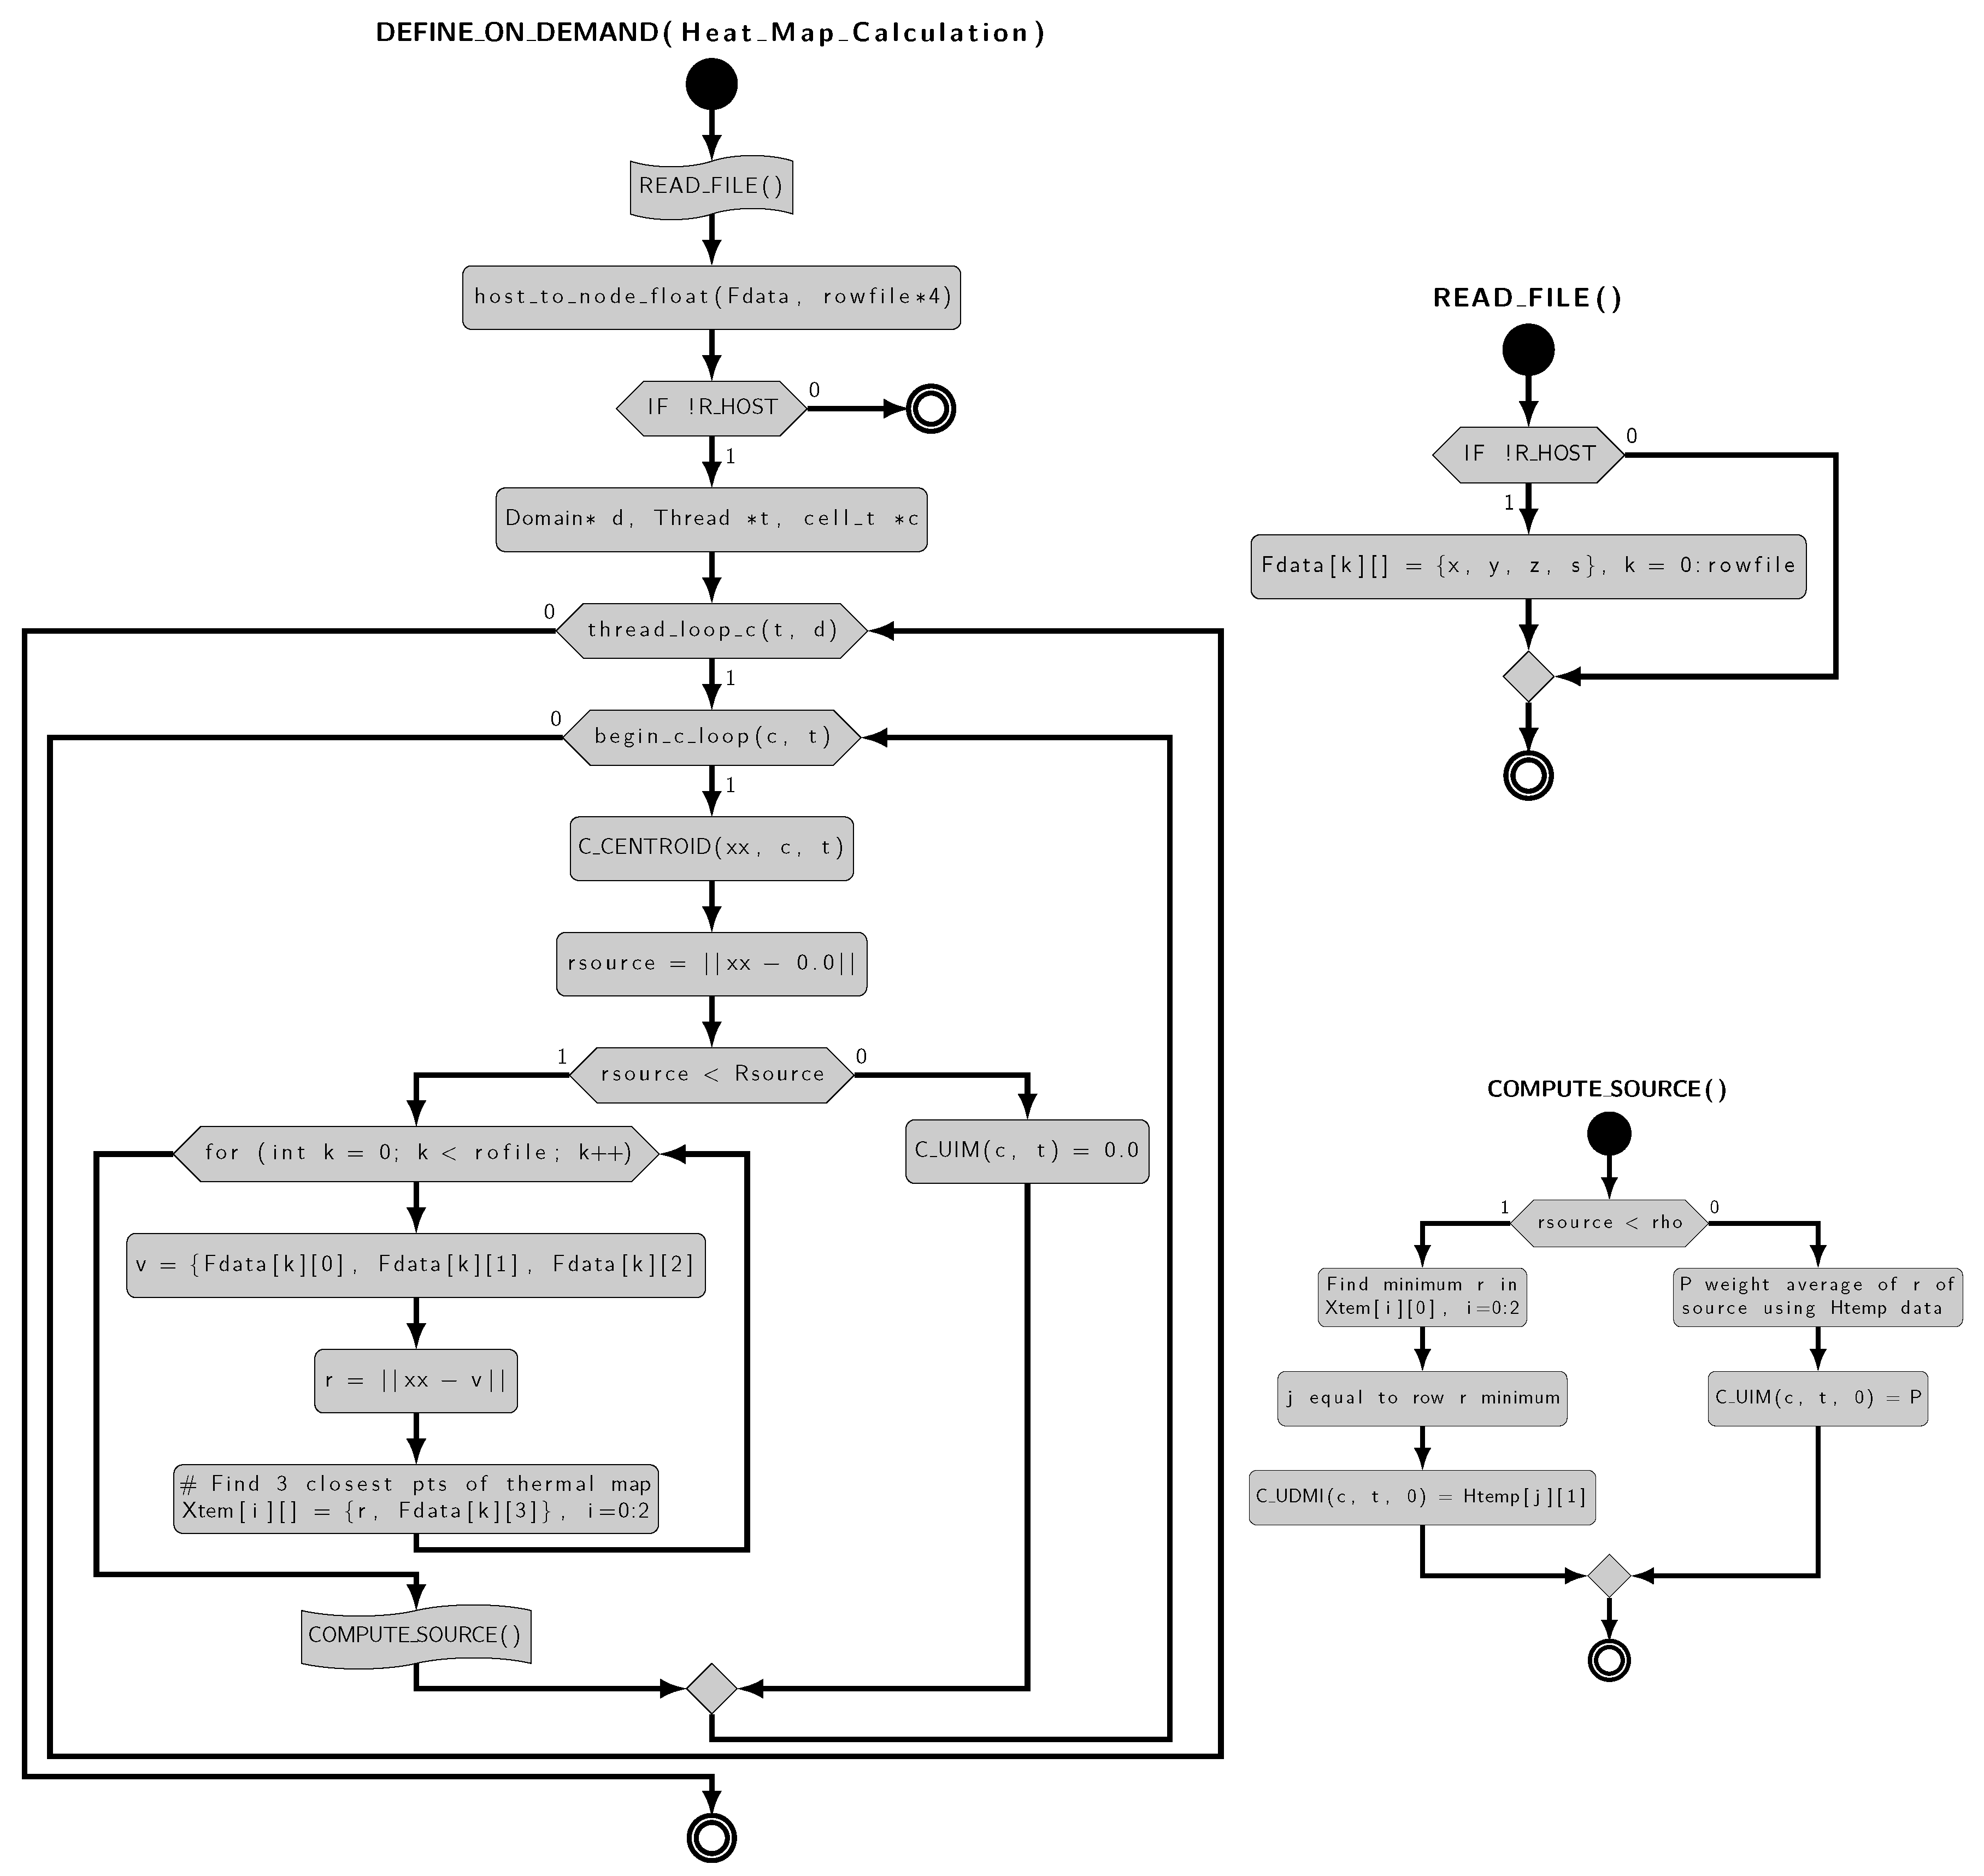
source.c script approximates the heatmap provided by CERN in the fluid domain. The script contains two macros,
DEFINE ON_DEMAND,
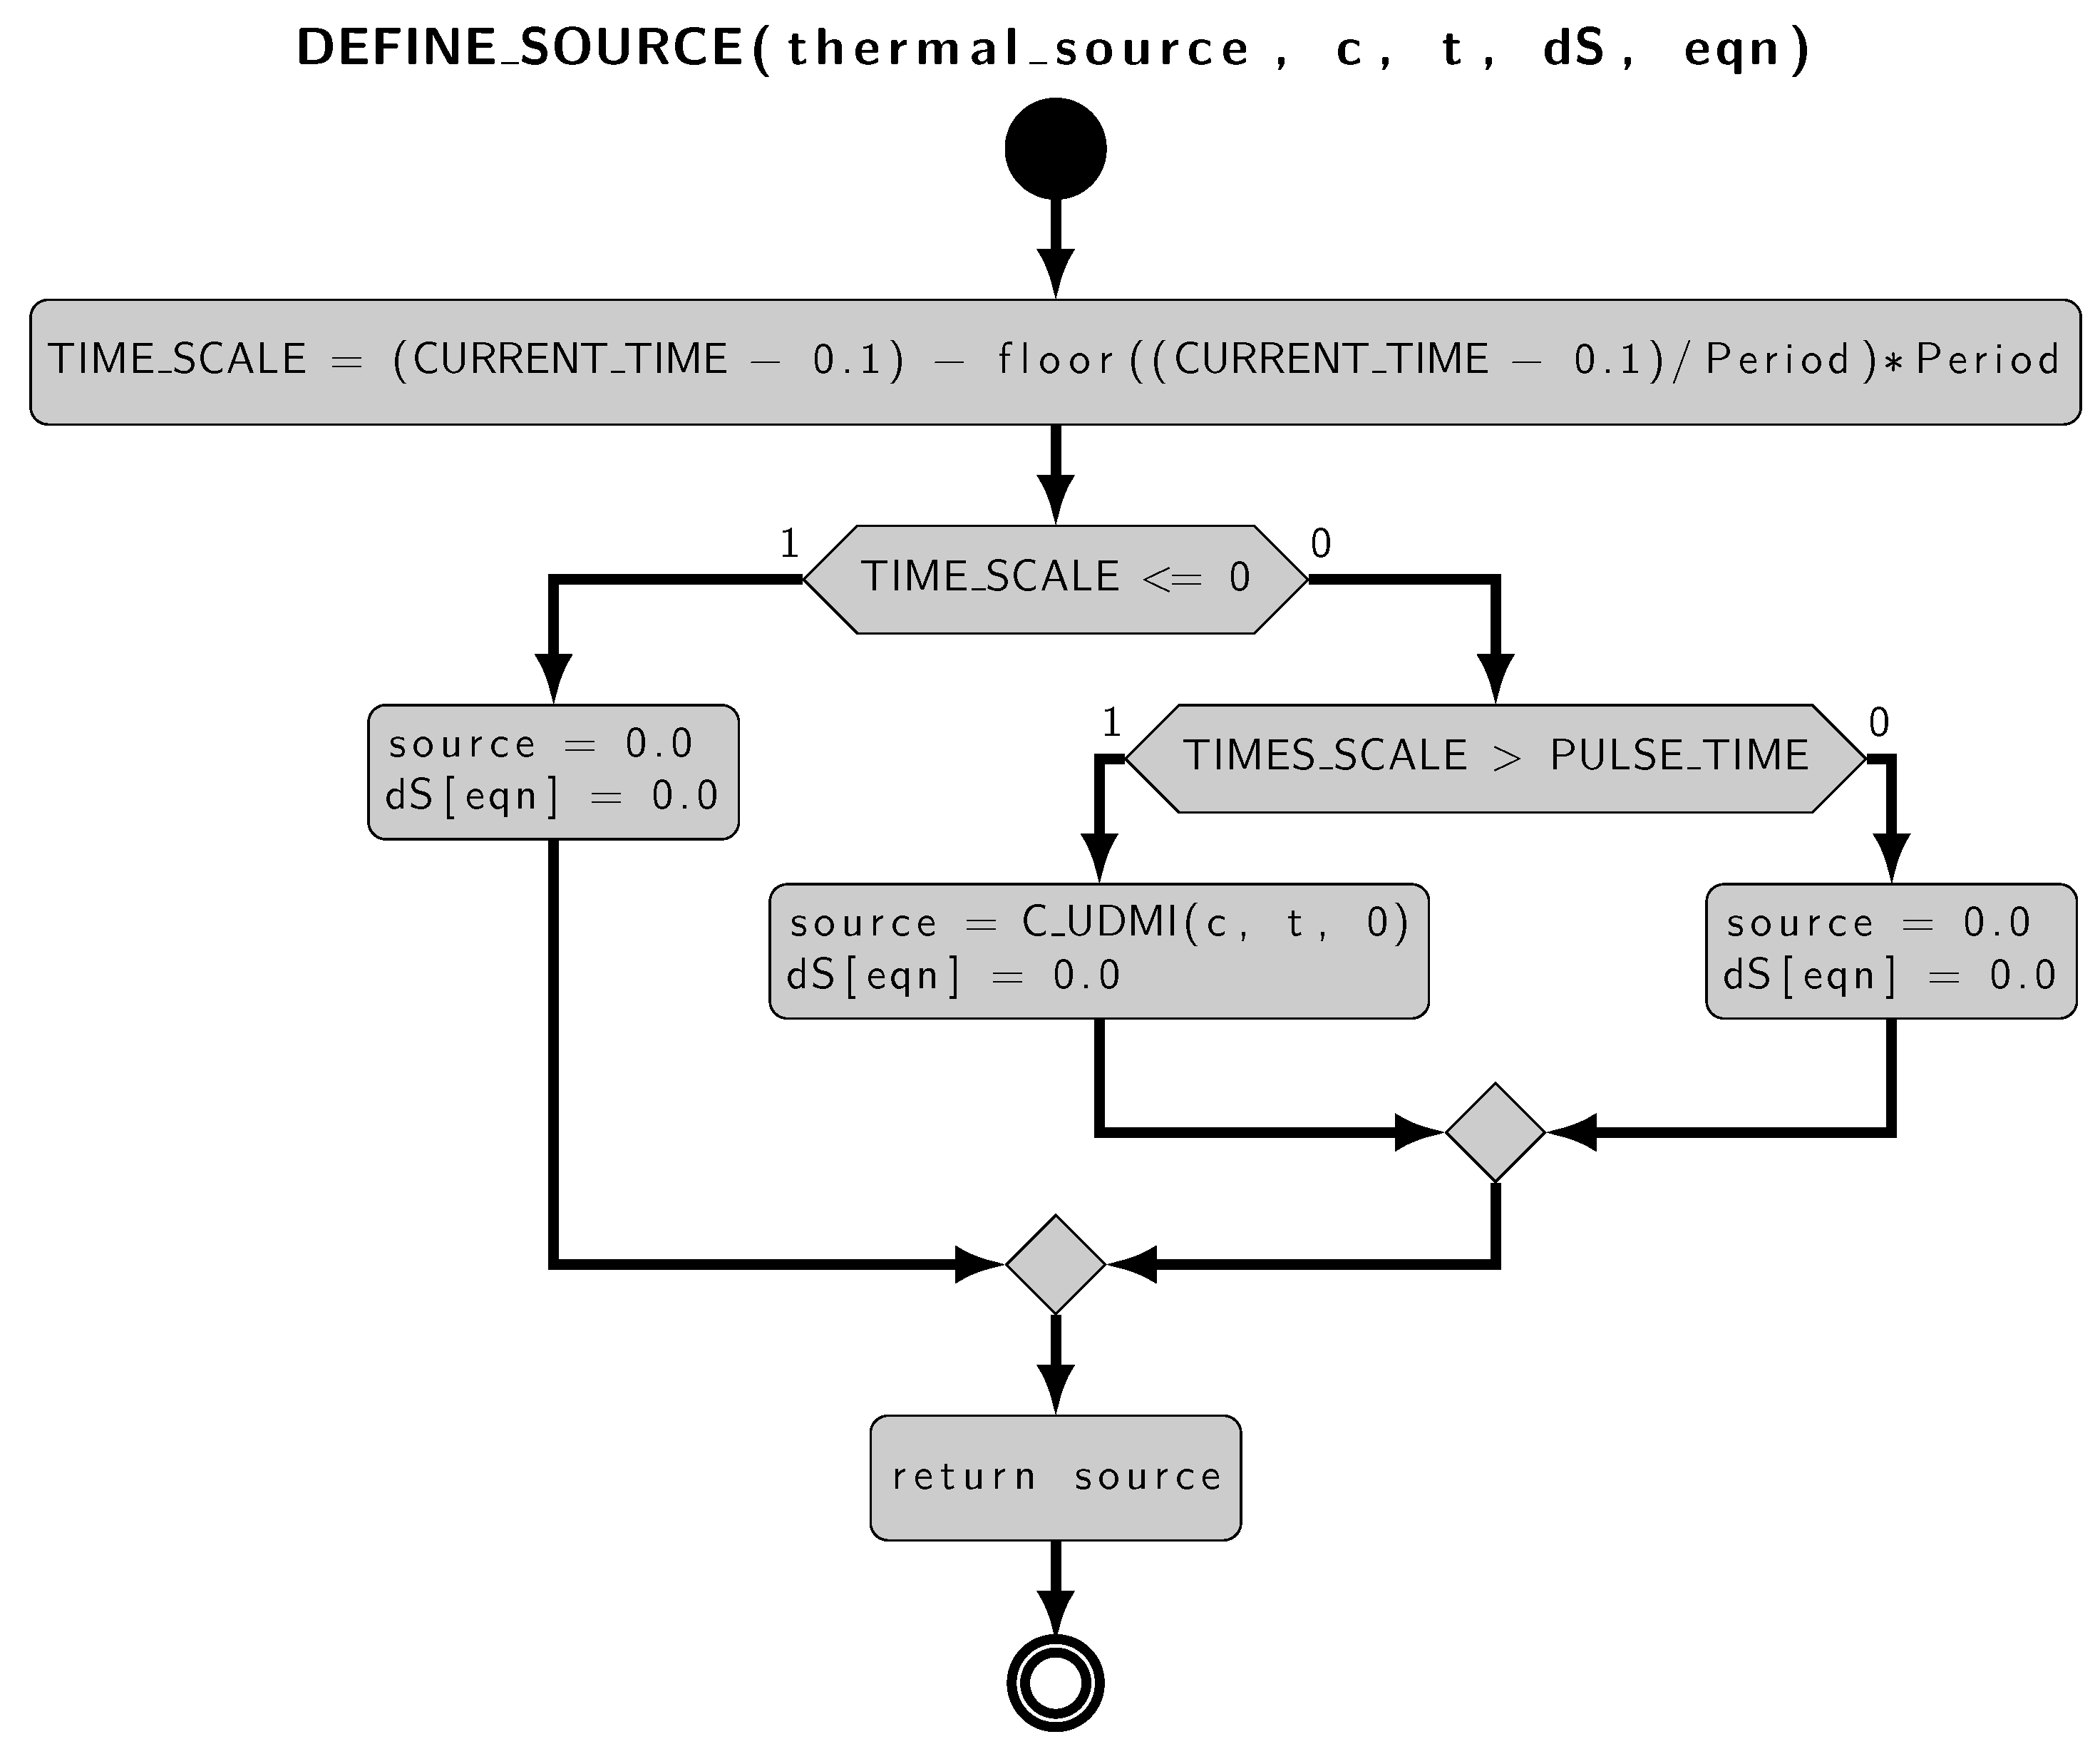
DEFINE SOURCE, shown in
Figure 9 and
Figure 10, respectively. The macros can handle various types of data in addition to native C data structures, which are useful for mesh manipulation. The first calculates the value of the volumetric heat source for each centroid of the mesh and stores this value in a User Defined Memory (UDM) structure. UDMs allow you to associate variables of interest to a group of mesh centroids, in our case the thermal source. The second macro adds the source term to the equation at runtime. The
source.c code is parallelized using native Fluent structures and commands to allow code execution in parallel.
4. Numerical Results
Before analyzing the thermal transient, the isothermal motion is simulated in steady conditions. This allows us to have a flow field solution with which to initialize the transient. Fluent’s polyhedral unstructured mesh, defined above, results in
nodes and
elements. Furthermore, the mesh has an inflation layer (a layer of cells very close to the wall, whose dimensions grow further away from it) of
millimeters. The initial configurations of the simulations, the same for the two CFX and Fluent software, are shown in
Table 3.
In Fluent, the simulation converges with residuals less than for the velocities in x,y,z and residuals of for the continuity and turbulent quantities. The mass-imbalance between inlet and outlet is less than , the pressure drops are 8539 Pa and the maximum is equal to 1. In CFX, better convergence results are obtained, lower for all quantities than , while the pressure drops are 7509 Pa with the maximum is equal to one. The plots and contours of the most relevant quantities of interest are shown in the next section, where the comparison between CFX and Fluent is presented.
4.1. Fluent Case En_T
Figure 11 shows the temperature profiles on the wall and in the channel, indicating the maximum and average temperature in the three solution cases. The values relating to these quantities are also reported in
Table 4. The most evident differences are, relating to the maximum temperature in the fluid, between the
En_T case, with fixed physical properties, and the cases with physical properties changing with temperature,
En_Tm and
En_Tfull. The difference in the wall temperature
in the three cases is small, while the thermal delta for the TvolMax between the
En_T and
En_Tfull cases is
C. In conclusion, the transient analysis with
En_T is sound from the engineering point of view since the temperature profiles are very similar and numerically advantageous by only solving for the energy equation. The analysis conducted shows that the maximum temperature, lower than the boiling point of
C, and the maximum wall temperature are acceptable for the configuration and design proposed here.
4.2. CFX-Fluent Comparison
Now, we discuss the comparison between the two solvers CFX and Fluent. We compare the solution of the isothermal motion and the thermal transient with constant properties with the energy equation alone (
En_T). The comparison is made with two different meshes since Fluent shows convergence problems with the CFX structured mesh. In
Table 5, the characteristics of the two meshes are reported. The solver settings are the same for both codes as defined in
Table 3.
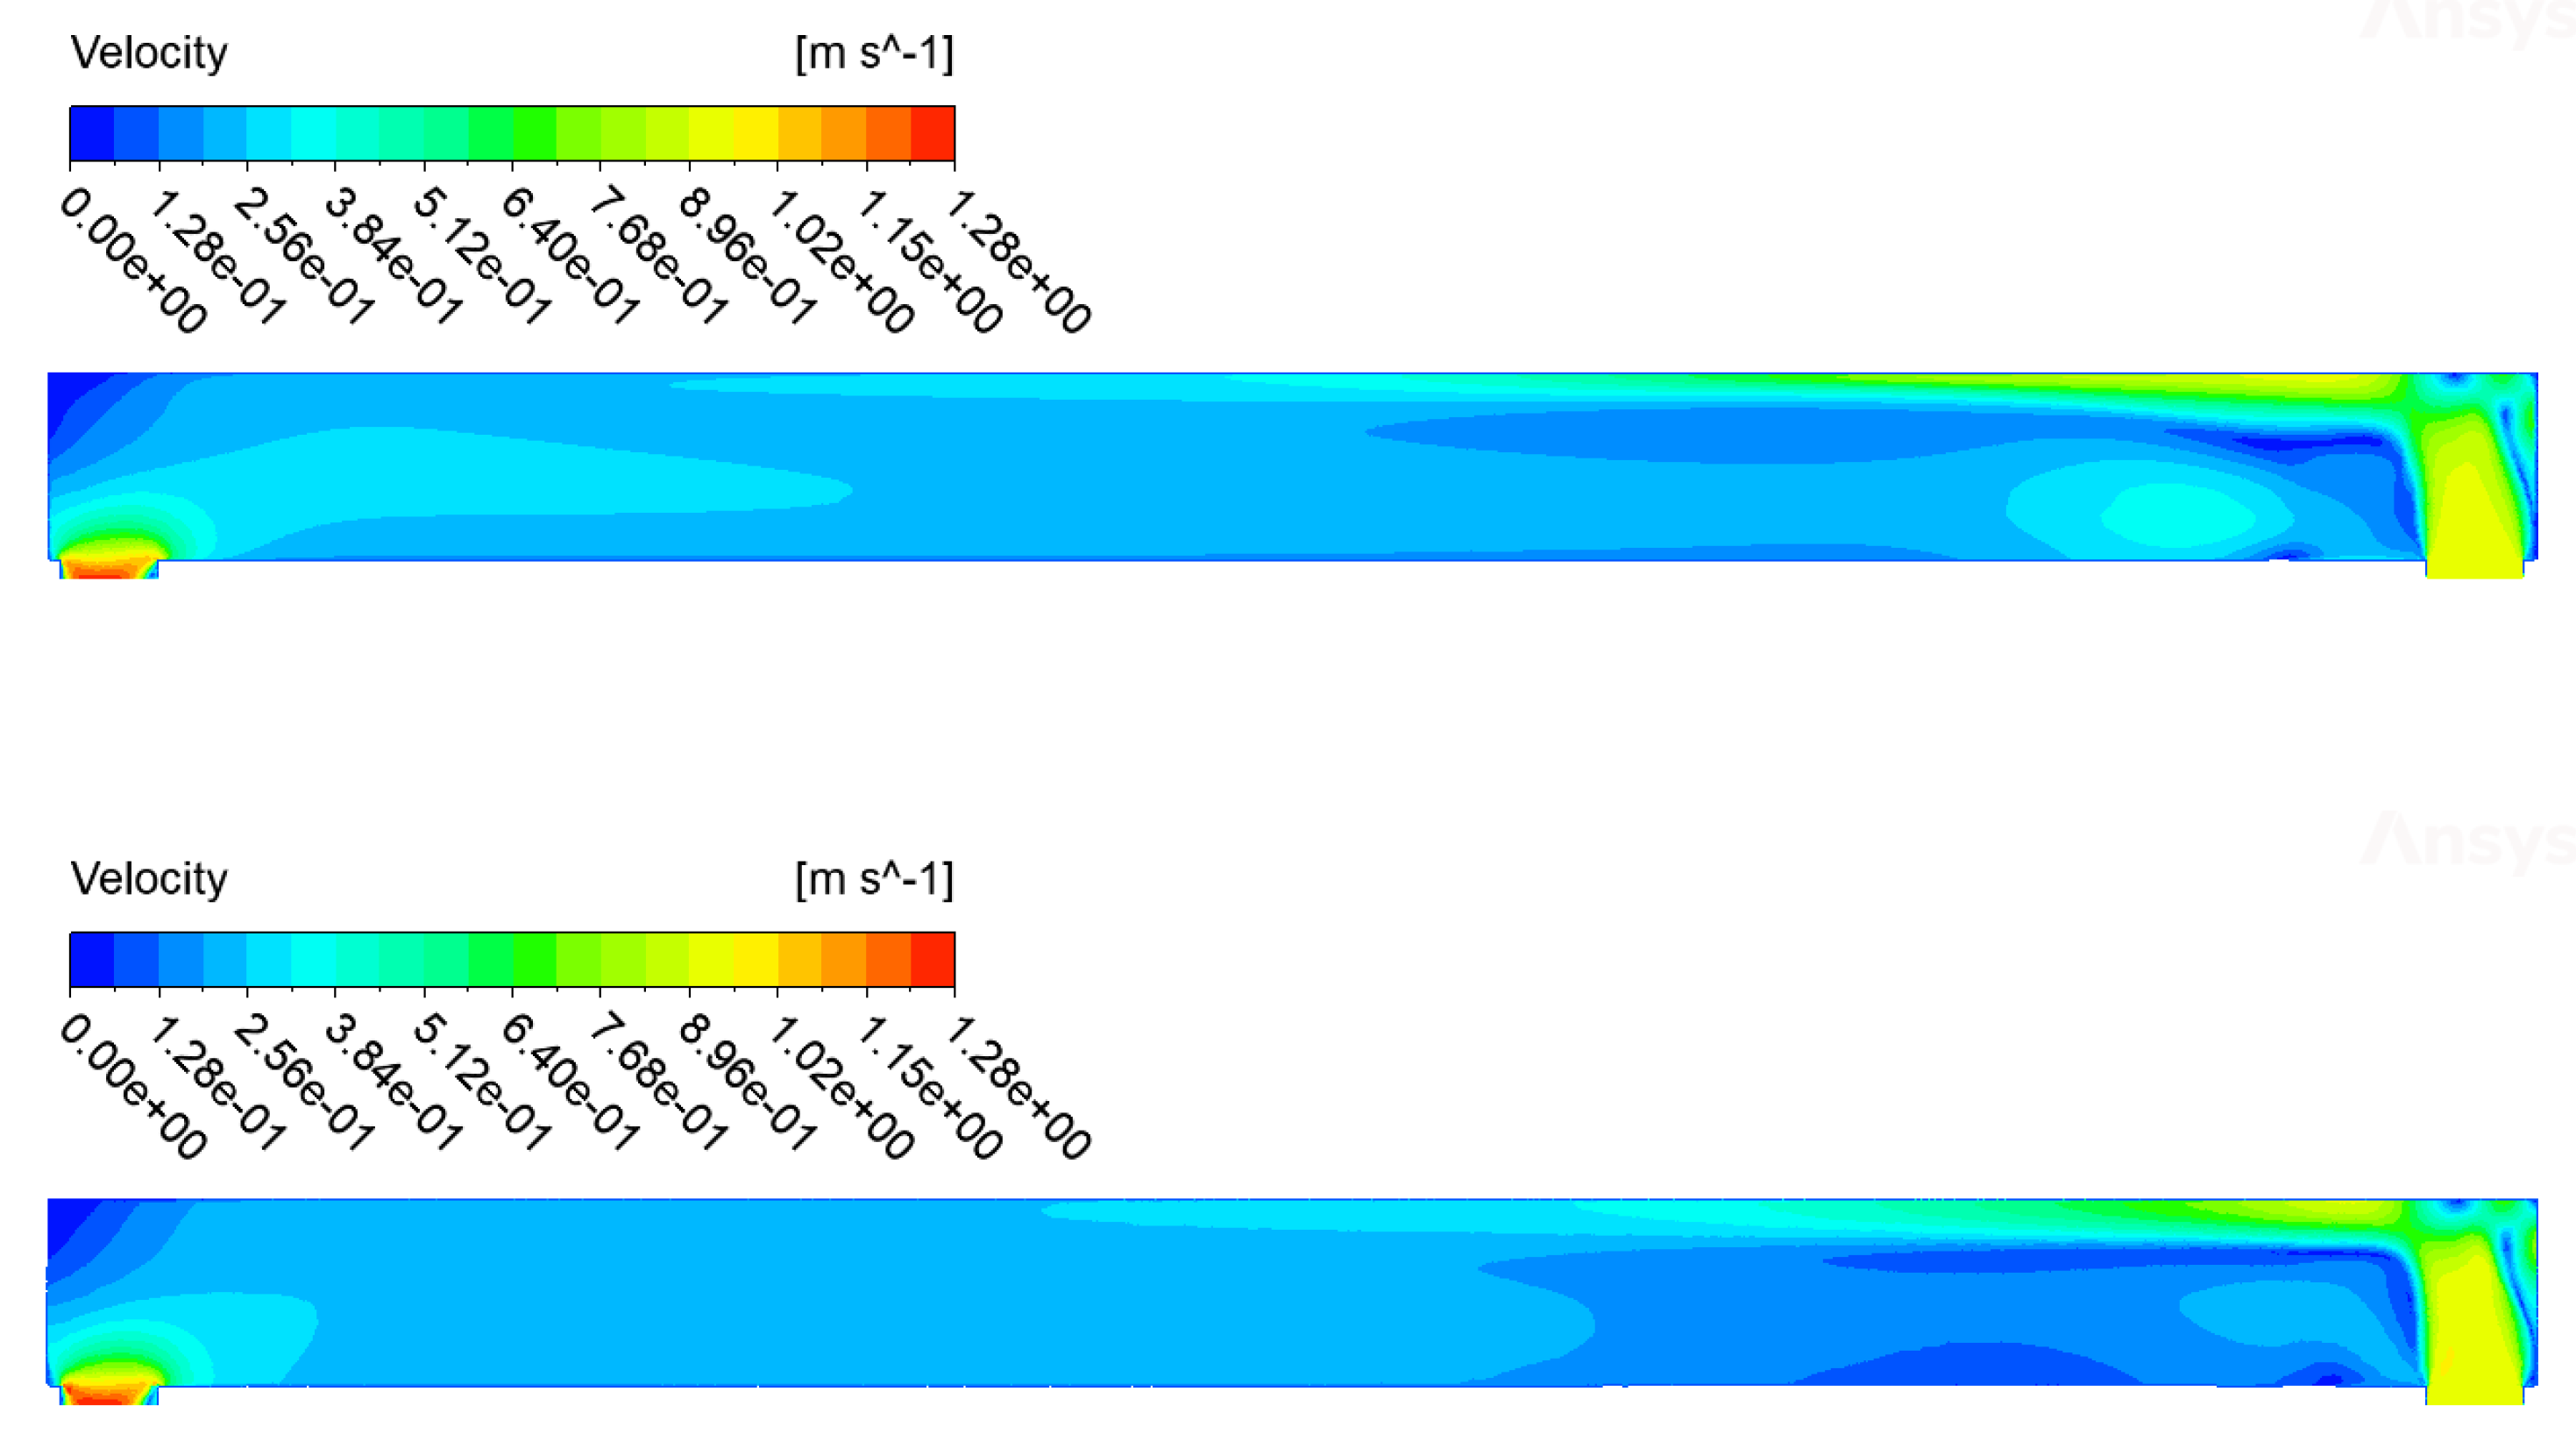
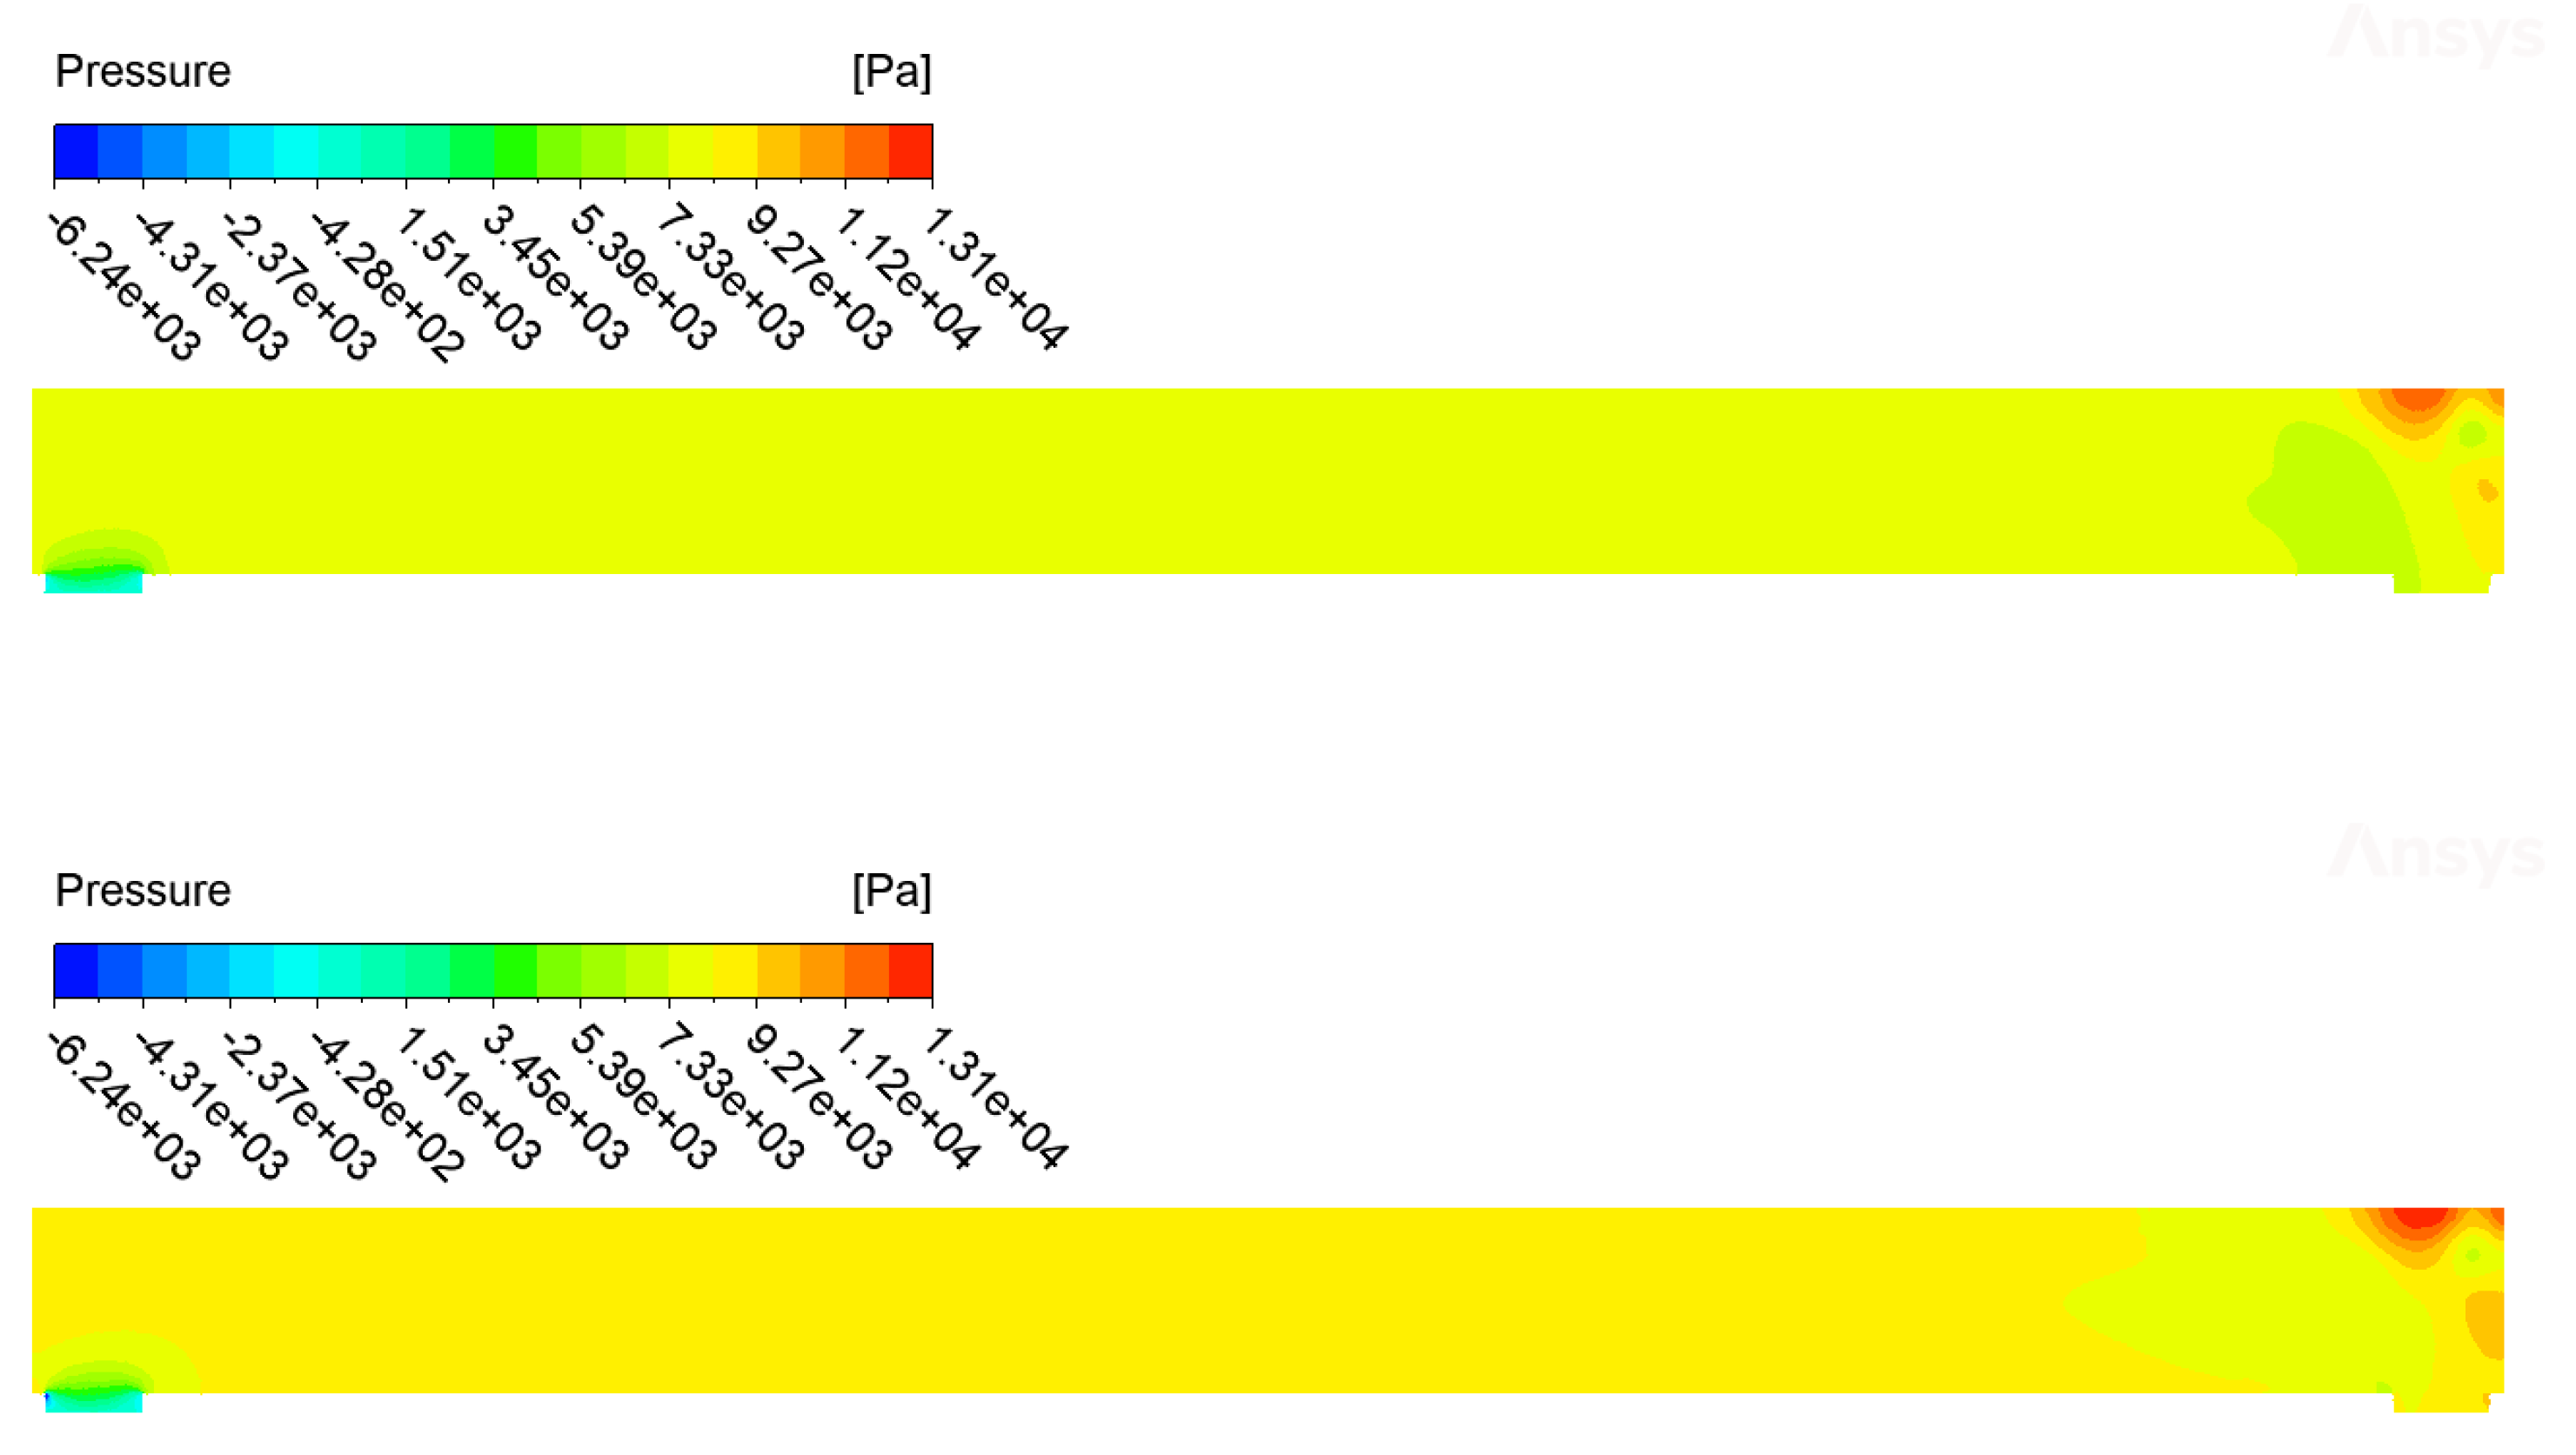
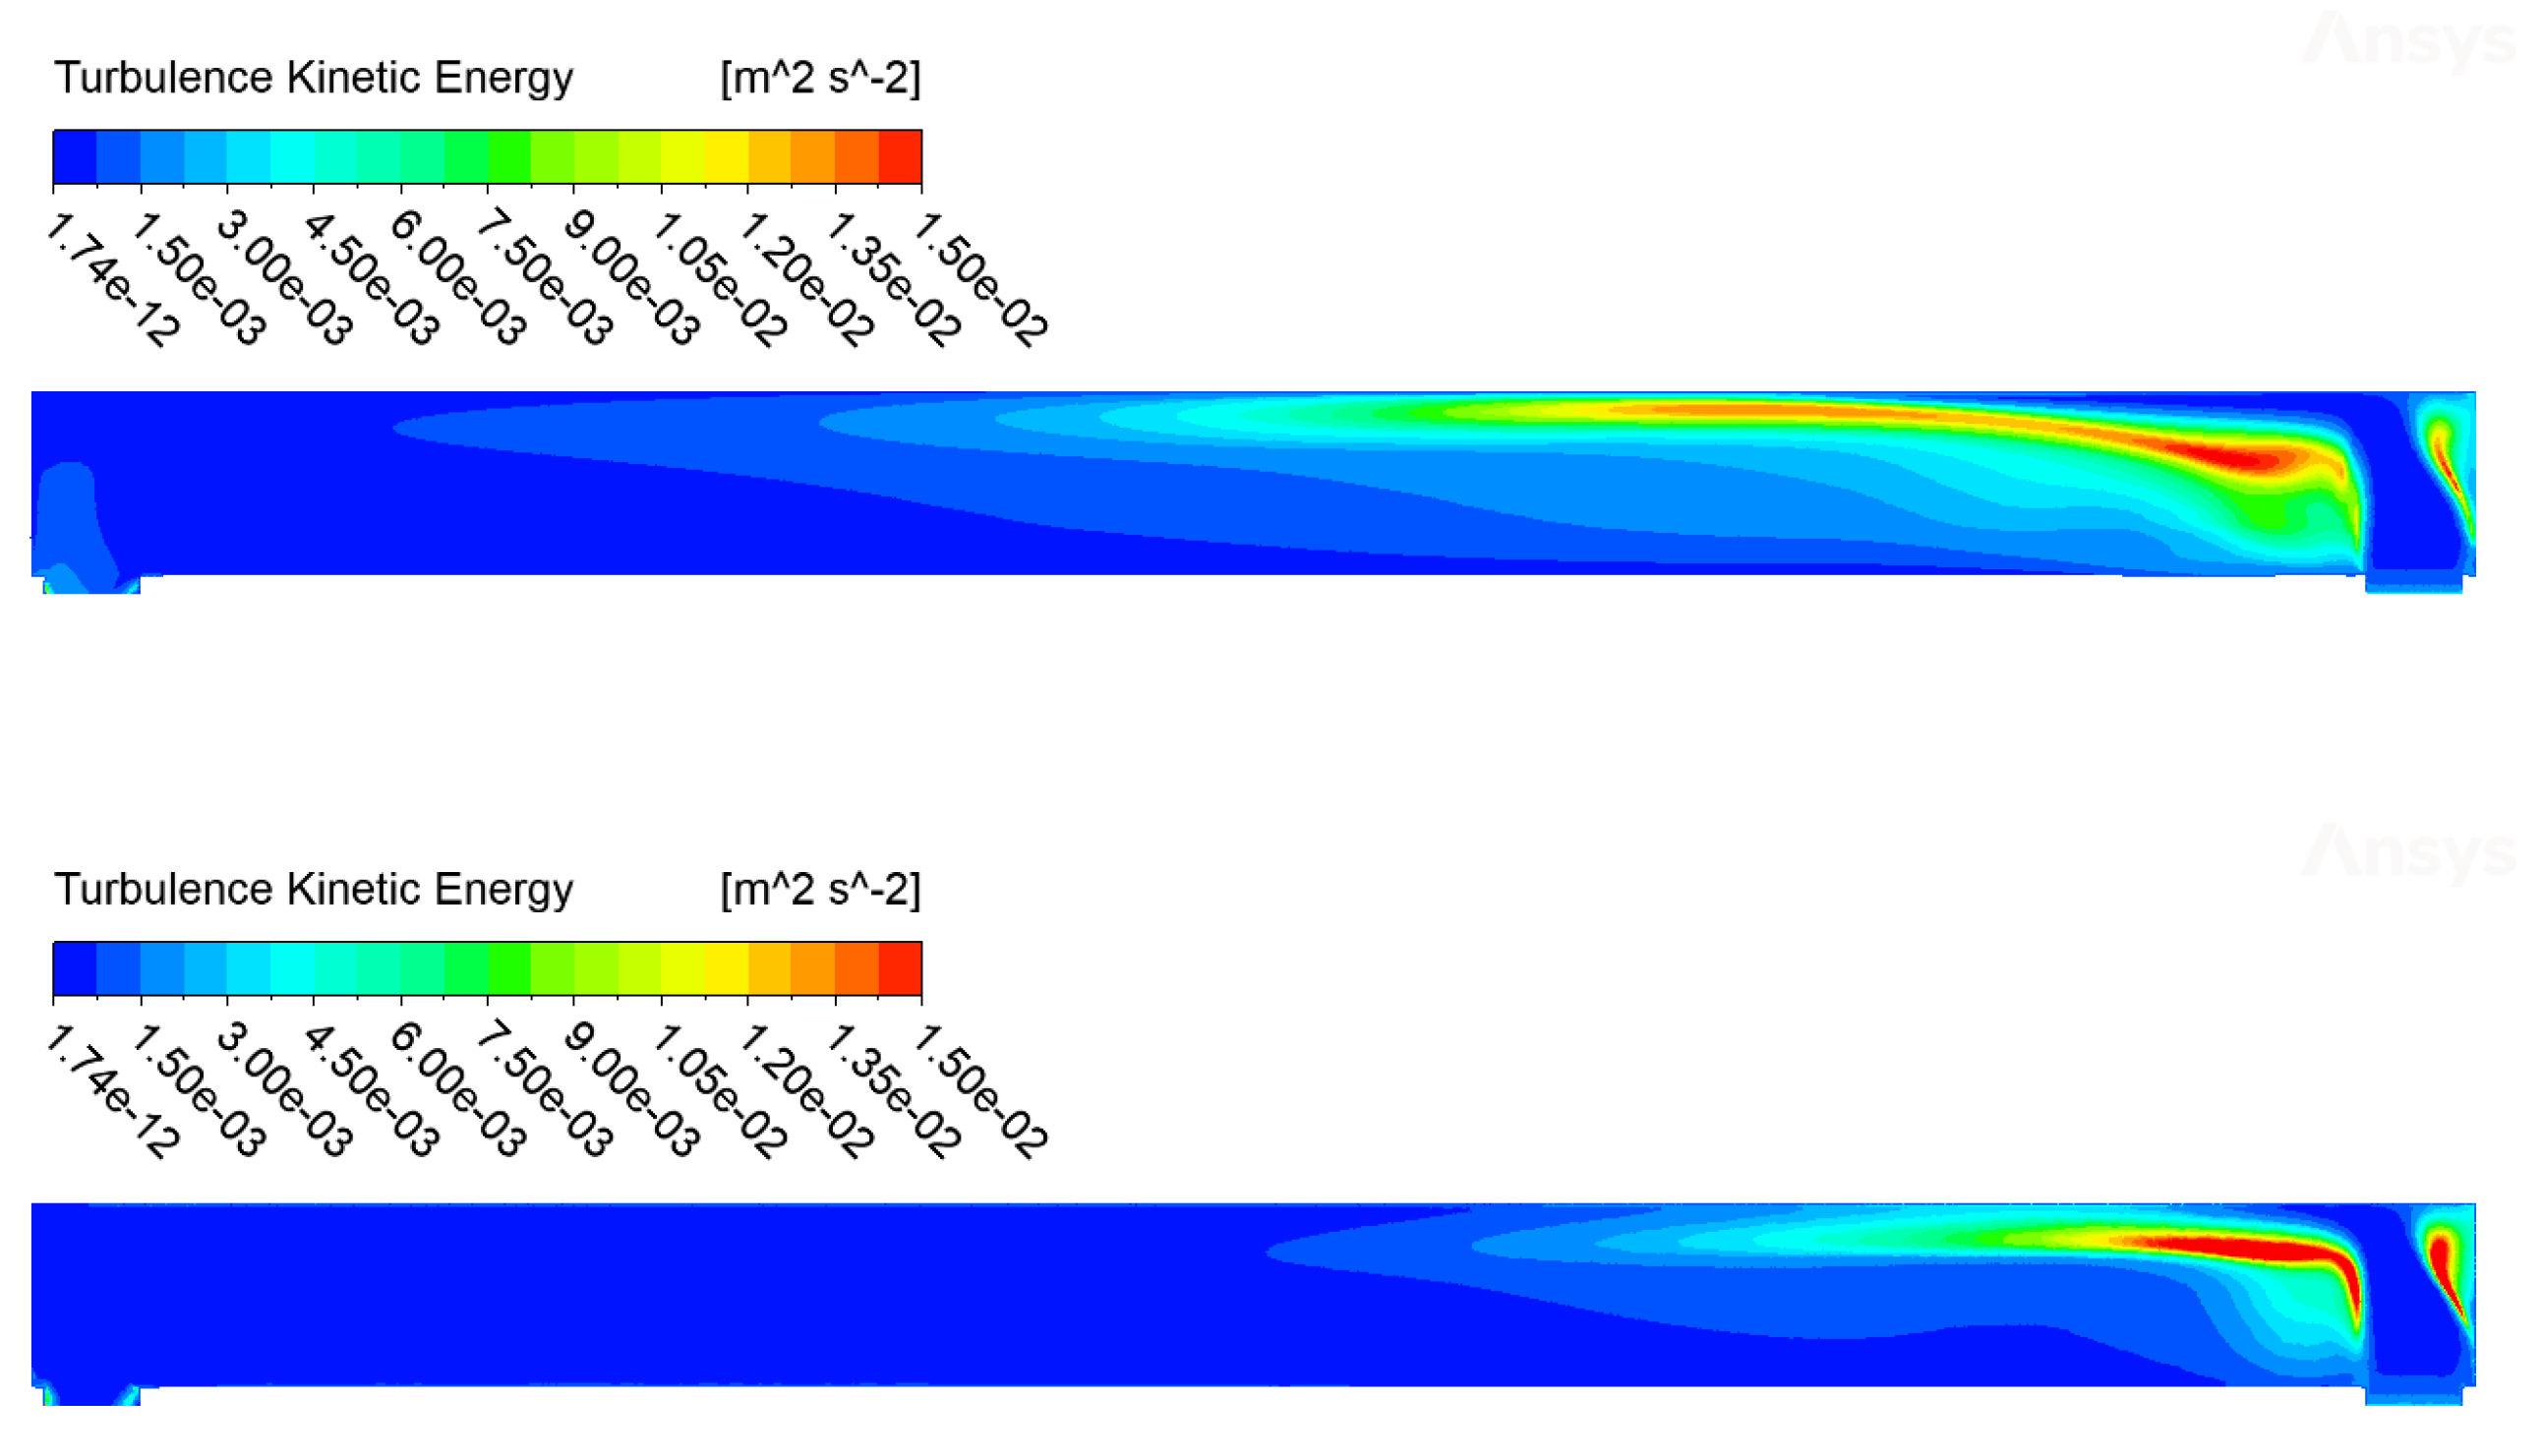
The comparison carried out for the isothermal case shows small differences in the variables of interest, mainly velocity, pressure and turbulent kinetic energy fields. These differences are visible in the contours of the
Figure 12,
Figure 13 and
Figure 14 and in the profiles shown in
Figure 15. From these emerge differences concentrated above all at the inlet of the canal, in the area relating to the right transverse duct.
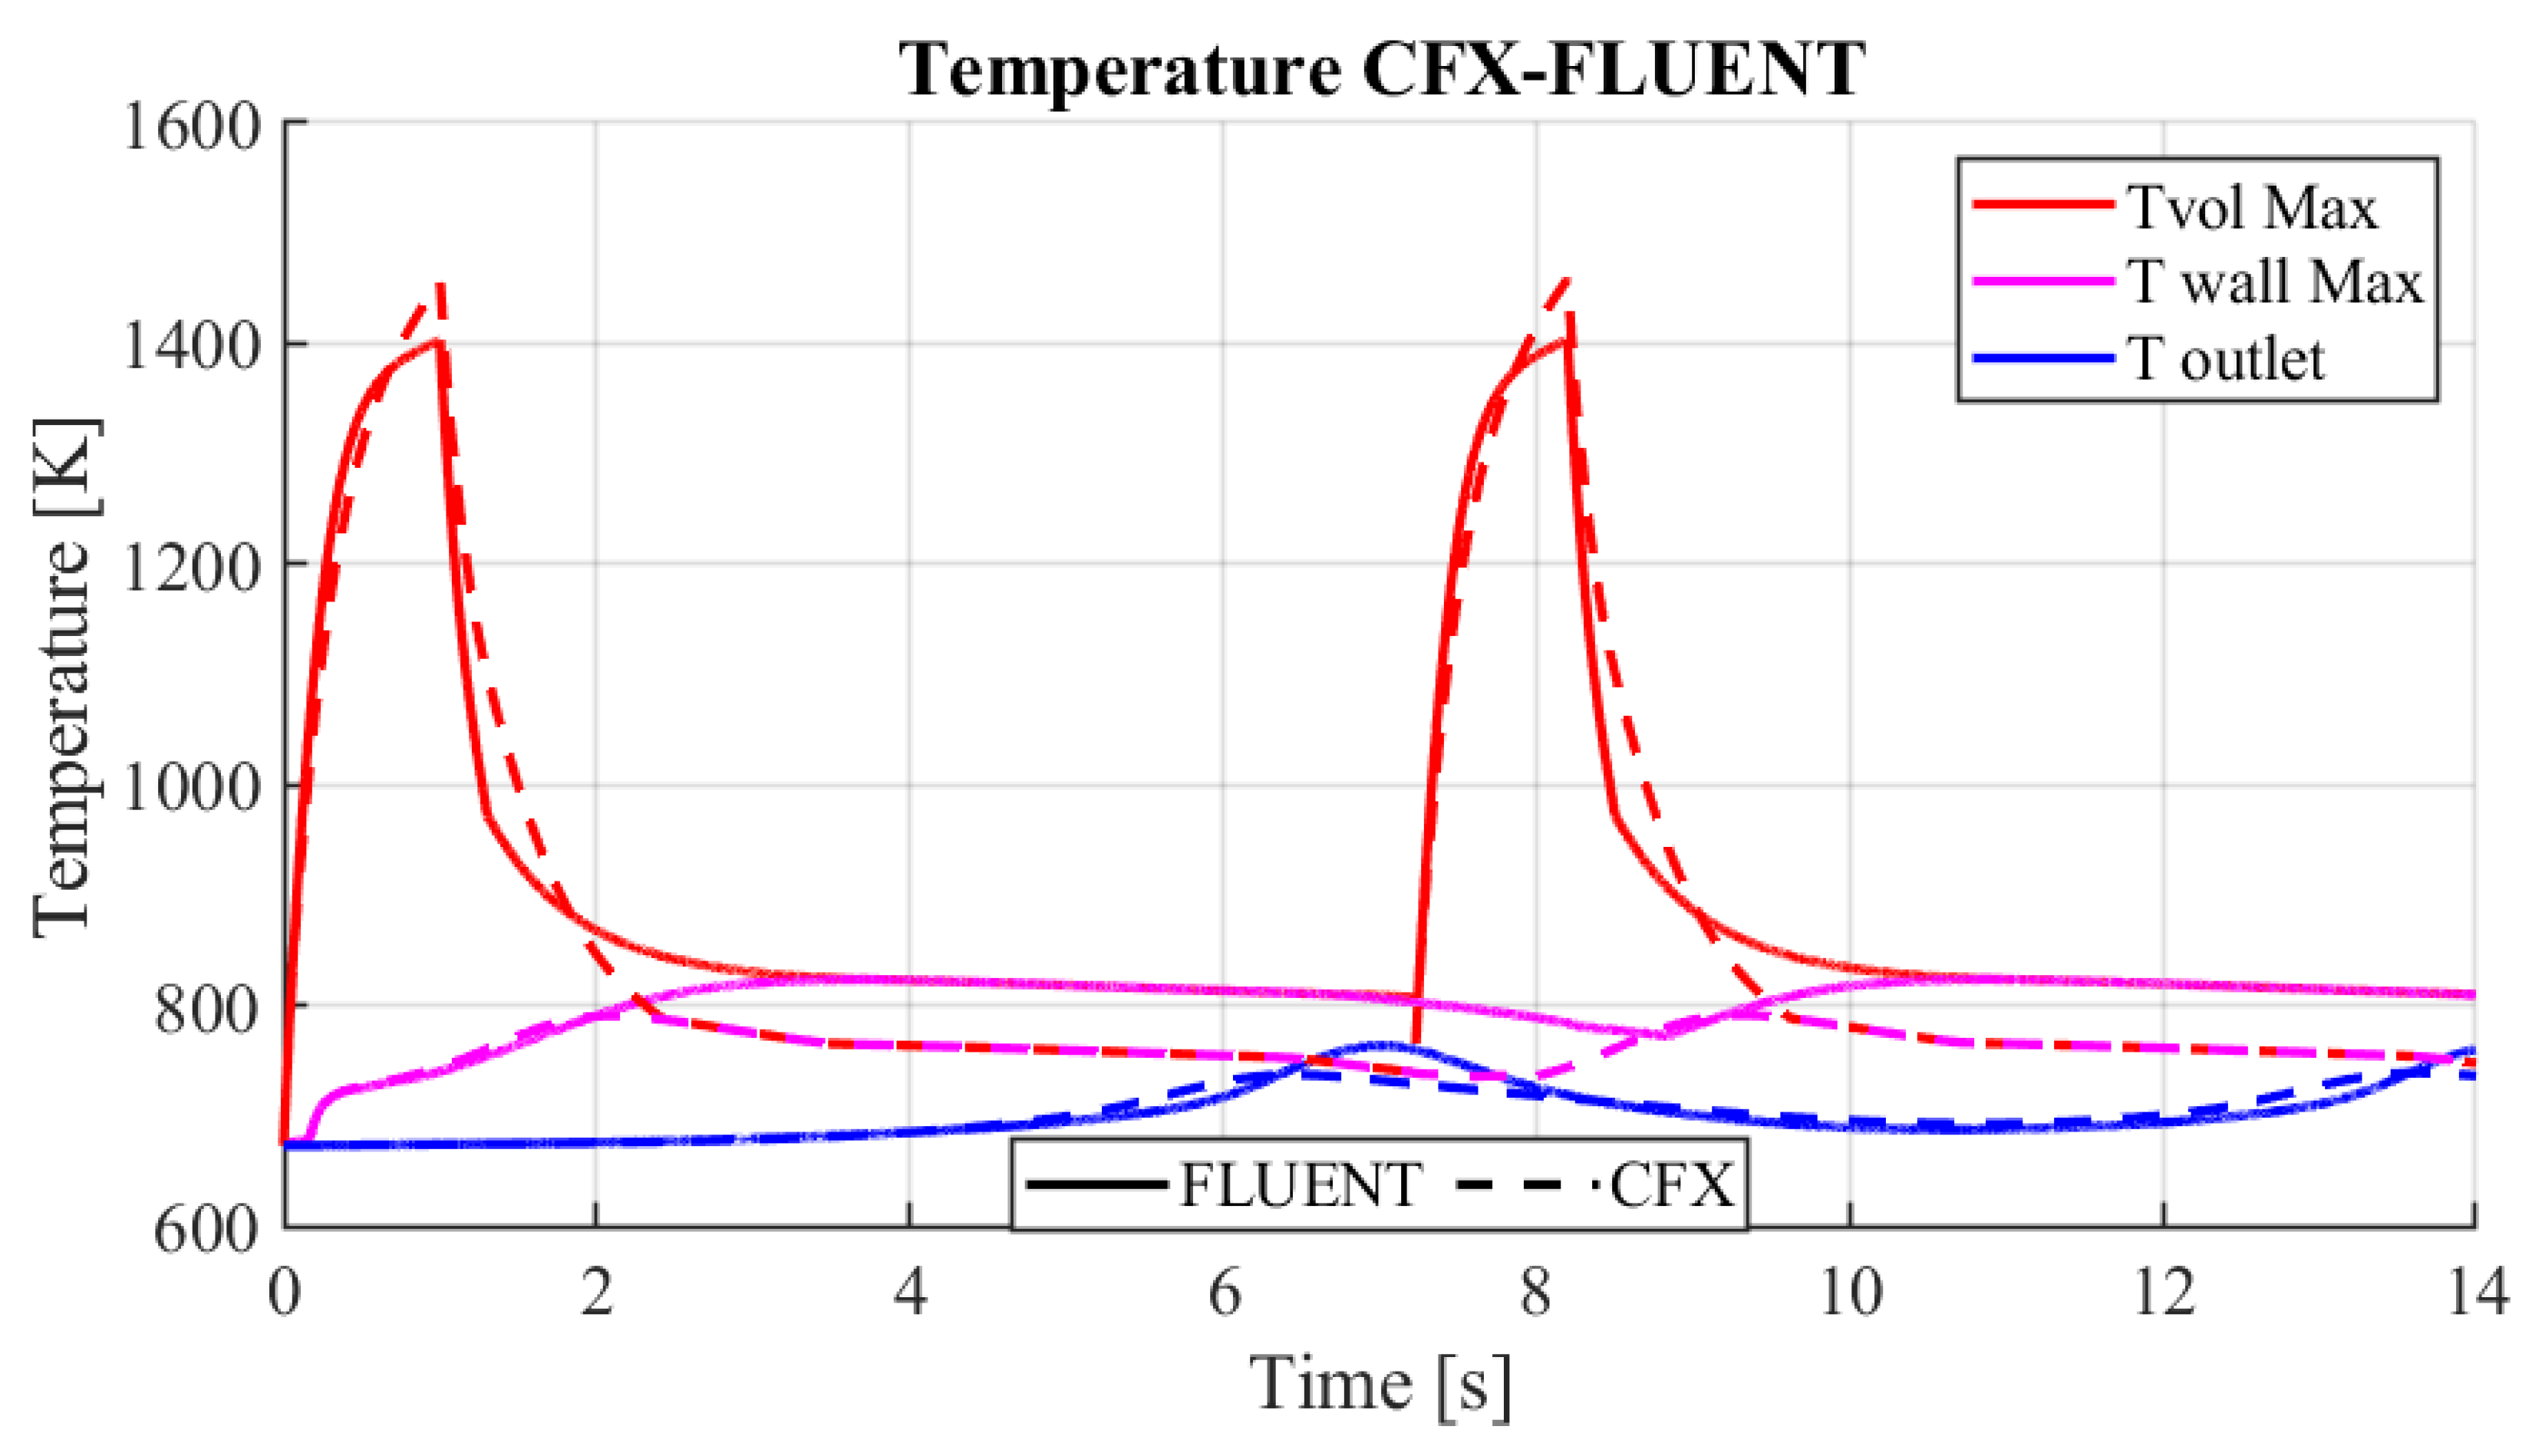
Figure 16 shows the differences in temperature behavior in CFX and Fluent, with imposed motion, constant physical properties and only the energy equation solved. The two simulations show the results for two pulses. For both pulses, the temperature profile and peaks are almost identical. The first impulse, therefore, has an almost zero effect on the thermo-hydraulics of the subsequent one. This is also evidenced by the peak temperature at the outlet, which is reached before the second pulse. The temperature profiles obtained from the two simulations are similar, with the greatest differences concerning the maximum temperatures on the wall and inside the channel. These peak differences between the two cases for TvolMax and TwallMax are
C and
C respectively, due to the different solutions of the flow field. These differences can be considered acceptable since they are one order of magnitude lower than the temperatures reached.
In the case of our interest, the experience of using CFX and Fluent highlights that both codes are valid and produce comparable results that are in agreement with experimental results when a modified turbulent Prandtl number is used.
5. Conclusions
The simulation of an experiment in the presence of liquid metals raises the problem of CFD models for low Prandtl numbers. In fact, when dealing with liquid metals, the thermal diffusivity dominates the momentum diffusivity, leading to a Prandtl number in the range 0.001–0.03. With these premises, the use of commercial codes, commonly tuned for water and air simulation, is not recommended because the CFD results may not be reliable, especially for the estimation of the turbulent heat exchange. For the specific setup analysed in this paper, the circular geometry allows us to use empirical correlations obtained by experiments and DNS simulations performed with different liquid metals. By taking account of these correlations, we have simulated this experiment with the purpose of advancing toward the conceptual design of the facility.
The thermo-hydraulic analysis carried out confirms, in principle, the feasibility of using a liquid lead target for the BDF. The analyses performed with CFX and Fluent, with a flow rate of kg/s, show a maximum peak temperature of 1482 K (Fluent, case En_Tfull)–1436 K (CFX) from the heat generated by the deposition of the proton beam. This is degrees lower than the boiling point of lead, a sufficient safety margin that avoids any possibility of local vaporization and flashing phenomena. The maximum temperature value at the wall obtained in the two cases is equal to 823 K (Fluent)–793 K (CFX). The analysis also highlights the independence of the temperature profiles from the subsequent depositions of the proton beam.
Further work will investigate the effect of the inlet geometry on the temperature field, the containment and beam windows’ structural integrity, along with engineering and integration aspects.
Conflicts of Interest
The authors declare no conflicts of interest.
References
- Calviani, M.; Goddard, B.; Jacobsson, R.; Lamont, M. (Eds.) SPS Beam Dump Facility: Comprehensive Design Study; CERN: Geneva, Switzerland, 2020. [Google Scholar] [CrossRef]
- Alekhin, S.; Altmannshofer, W.; Asaka, T.; Batell, B.; Bezrukov, F.; Bondarenko, K.; Boyarsky, A.; Choi, K.Y.; Corral, C.; Craig, N.; et al. A facility to Search for Hidden Particles at the CERN SPS: the SHiP physics case. Reports on Progress in Physics 2016, 79, 124201. [Google Scholar] [CrossRef] [PubMed]
- Ahdida, C.; Akmete, A.; Albanese, R.; Alt, J.; Alexandrov, A.; Anokhina, A.; Aoki, S.; Arduini, G.; Atkin, E.; Azorskiy, N.; et al. The SHiP experiment at the proposed CERN SPS Beam Dump Facility. The European Physical Journal C 2022, 82, 486. [Google Scholar] [CrossRef]
- Lopez Sola, E.; Calviani, M.; Avigni, P.; Battistin, M.; Busom Descarrega, J.; Canhoto Espadanal, J.; Fraser, M.A.; Gilardoni, S.; Goddard, B.; Grenier, D.; et al. Design of a high power production target for the beam dump facility at CERN. Phys. Rev. Accel. Beams 2019, 22, 113001. [Google Scholar] [CrossRef]
- Franqueira Ximenes, R.; Aberle, O.; Ahdida, C.; Avigni, P.; Battistin, M.; Bianchi, L.; Buonocore, L.R.; Burger, S.; Busom Descarrega, J.; Calviani, M.; et al. CERN BDF Prototype Target Operation, Removal and Autopsy Steps. CERN BDF PROTOTYPE TARGET OPERATION, REMOVAL AND AUTOPSY STEPS. JACoW IPAC 2021, 2021, 3559–3562. [Google Scholar] [CrossRef]
- Lopez Sola, E.; Calviani, M.; Aberle, O.; Ahdida, C.; Avigni, P.; Battistin, M.; Bianchi, L.; Burger, S.; Busom Descarrega, J.; Canhoto Espadanal, J.; et al. Beam impact tests of a prototype target for the beam dump facility at CERN: Experimental setup and preliminary analysis of the online results. Phys. Rev. Accel. Beams 2019, 22, 123001. [Google Scholar] [CrossRef]
- ANSYS. ANSYS Fluent - CFD Software, 2016.
- OECD.; Agency, N.E. Handbook on Lead-bismuth Eutectic Alloy and Lead Properties, Materials Compatibility, Thermalhydraulics and Technologies; Nuclear Energy Agency, 2015; p. 950. [CrossRef]
- Da Vià, R.; Manservisi, S. Numerical simulation of forced and mixed convection turbulent liquid sodium flow over a vertical backward facing step with a four parameter turbulence model. International Journal of Heat and Mass Transfer 2019, 135, 591–603. [Google Scholar] [CrossRef]
- Barbi, G.; Giovacchini, V.; Manservisi, S. A New Anisotropic Four-Parameter Turbulence Model for Low Prandtl Number Fluids. Fluids 2021, 7, 6. [Google Scholar] [CrossRef]
- Alemberti, A.; Smirnov, V.; Smith, C.F.; Takahashi, M. Overview of lead-cooled fast reactor activities. Progress in Nuclear Energy 2014, 77, 300–307. [Google Scholar] [CrossRef]
- Cheng, X.; Tak, N.i. Investigation on turbulent heat transfer to lead–bismuth eutectic flows in circular tubes for nuclear applications. Nuclear Engineering and Design 2006, 236, 385–393. [Google Scholar] [CrossRef]
- Kawamura, H.; Ohsaka, K.; Abe, H.; Yamamoto, K. DNS of turbulent heat transfer in channel flow with low to medium-high Prandtl number fluid. International Journal of Heat and Fluid Flow 1998, 19, 482–491. [Google Scholar] [CrossRef]
- Kirillov, P.; Ushakov, P. Heat transfer to liquid metals: specific features, methods of investigation, and main relationships. Thermal engineering 2001, 48, 50–59. [Google Scholar]
- Stromquist, W.K. Effect of wetting on heat transfer characteristics of liquid metals (thesis). Technical report, Tennessee Univ., 1953.
- ANSYS. CFX-Solver Theory guide - Release ll, 2006.
Figure 1.
The Beam Dump Facility (BDF) geometry.
Figure 1.
The Beam Dump Facility (BDF) geometry.
Figure 2.
Thermophysical properties of liquid lead as a function of temperature
T as shown in (
1).
Figure 2.
Thermophysical properties of liquid lead as a function of temperature
T as shown in (
1).
Figure 3.
Beam heat source as a function of the x, y, z coordinates.
Figure 3.
Beam heat source as a function of the x, y, z coordinates.
Figure 4.
Comparison between mesh and heat source on the x-y plane. The mesh points are in red and the heat map points are in blue.
Figure 4.
Comparison between mesh and heat source on the x-y plane. The mesh points are in red and the heat map points are in blue.
Figure 5.
Comparison of the heat source distribution with (right) and without the algorithm distribution (left).
Figure 5.
Comparison of the heat source distribution with (right) and without the algorithm distribution (left).
Figure 6.
Comparison of the CERN heat source and the model heat source on the z plane (left) and x plane (right) – low mesh resolution.
Figure 6.
Comparison of the CERN heat source and the model heat source on the z plane (left) and x plane (right) – low mesh resolution.
Figure 7.
Comparison of the CERN heat source and the model heat source on the z plane (left) and x plane (right) – high mesh resolution.
Figure 7.
Comparison of the CERN heat source and the model heat source on the z plane (left) and x plane (right) – high mesh resolution.
Figure 9.
Flow chart of the DEFINE SOURCE UDF.
Figure 9.
Flow chart of the DEFINE SOURCE UDF.
Figure 10.
Flow chart of the DEFINE ON_DEMAND UDF.
Figure 10.
Flow chart of the DEFINE ON_DEMAND UDF.
Figure 11.
Comparison of average and maximal temperature profiles on the wall and on the axis.
Figure 11.
Comparison of average and maximal temperature profiles on the wall and on the axis.
Figure 12.
Comparison of velocity () contours between CFX (on top) and Fluent (on the bottom).
Figure 12.
Comparison of velocity () contours between CFX (on top) and Fluent (on the bottom).
Figure 13.
Comparison of pressure (p) contours between CFX (on top) and Fluent (on the bottom).
Figure 13.
Comparison of pressure (p) contours between CFX (on top) and Fluent (on the bottom).
Figure 14.
Comparison of turbulent kinetic energy (k) contours between CFX (on top) and Fluent (on the bottom).
Figure 14.
Comparison of turbulent kinetic energy (k) contours between CFX (on top) and Fluent (on the bottom).
Figure 15.
Comparison between Fluent and CFX of the velocity profile v, turbulent kinetic energy k and pressure p along the axis (top to bottom, respectively).
Figure 15.
Comparison between Fluent and CFX of the velocity profile v, turbulent kinetic energy k and pressure p along the axis (top to bottom, respectively).
Figure 16.
Comparison of Fluent and CFX temperature profiles across two beam pulses.
Figure 16.
Comparison of Fluent and CFX temperature profiles across two beam pulses.
Table 1.
Main features of the heat map in Cartesian and cylindrical coordinates.
Table 1.
Main features of the heat map in Cartesian and cylindrical coordinates.
| |
x
|
y
|
z
|
s
|
|
|
| Min |
|
|
|
|
|
- |
| Max |
|
|
2 |
|
|
- |
| Ave |
- |
- |
- |
|
- |
- |
|
- |
- |
|
- |
|
15° |
Table 2.
Heat map features.
Table 2.
Heat map features.
| Quantity |
Value |
Unit of Measure |
| Pulse power |
|
W |
| Pulse energy |
|
J |
| Average power |
|
W |
| Pulse length |
1 |
s |
| Pulse frequency |
|
Hz |
Table 3.
Simulation setup.
Table 3.
Simulation setup.
| Setup |
Pressure-Based |
Steady state |
SST |
| Methods |
Coupled |
First Order Upwind |
PTE RF |
| BC |
Massflow-inlet |
Pressure-outlet |
Adiabatic-wall |
Table 4.
Summary table of the maximum temperature and average in the deposition period.
Table 4.
Summary table of the maximum temperature and average in the deposition period.
| Case |
[K] |
[K] |
| En_T |
1403 |
823 |
| En_Tm |
1463 |
829 |
| En_full |
1482 |
823 |
Table 5.
Comparison of the main features of the mesh in Fluent and CFX.
Table 5.
Comparison of the main features of the mesh in Fluent and CFX.
| |
Fluent |
CFX |
|
| Type |
Unstructured |
Structured |
|
| Max. size |
8 |
9 |
mm |
| Nodes |
|
|
- |
| Elements |
|
|
- |
|
Disclaimer/Publisher’s Note: The statements, opinions and data contained in all publications are solely those of the individual author(s) and contributor(s) and not of MDPI and/or the editor(s). MDPI and/or the editor(s) disclaim responsibility for any injury to people or property resulting from any ideas, methods, instructions or products referred to in the content. |
© 2024 by the authors. Licensee MDPI, Basel, Switzerland. This article is an open access article distributed under the terms and conditions of the Creative Commons Attribution (CC BY) license (http://creativecommons.org/licenses/by/4.0/).
