
Submitted:
16 May 2024
Posted:
16 May 2024
You are already at the latest version
Abstract
Athlete’s heart is characterised by structural, functional, and electrical remodelling. During an exercise session, the heart increases the use of oxygen, which is associated with decreased vascular resistance in the lungs’ circulation. Left ventricular hypertrophy is an echocardiographic modification especially met in endurance athlete’s heart. Moreover, left atrial dilatation represents another important characteristic of endurance athletes. Electrical modulation in the athletic heart induces neurological modifications leading to sinus arrhythmia, bradycardia, early repolarisation, and first-grade atrioventricular (AV) blocks. Athletes' nutritional status involves the assimilation of macronutrients such as proteins, carbohydrates, and fats. Depending on the duration of physical exercise, ATP can be obtained in aerobic or anaerobic conditions. This systematic review aims to find correlations between different evaluative methods of cardiac adaptation and present the metabolism in performance athletes.
Keywords:
athlete’s heart
; electrical remodelling
; ventricular hypertrophy
; left atrial dilation
; endurance athletes
1. Physiological Modifications in Athlete’s Heart
The correlation between exercise and heart remodelling gives birth to the athlete’s heart, which is characterised by structural, functional, and electrical remodelling; the intensity of exercise plays an important role in the remodelling limits [1,2]. Athletes detain specific heart characteristics regarding structural and physiological changes. The heart increases the use of oxygen (VO2) and its output during an exercise session. These changes are associated with a lower vascular resistance compared to the untrained heart, especially in the lungs’ circulation. These reasons presented as the increased perfusion alongside vasodilatation explain the increase in right ventricle afterload and pulmonary artery pressure [3].
Echocardiographic modifications in an athlete’s heart include left ventricular hypertrophy, considered concentric in strength athletes and eccentric in endurance athletes. Through echocardiography, we can observe a reversible alteration in the structure of the heart, more precisely, an increase in the left ventricular mural thickness by 15-20% alongside an increase in the left ventricular size by 10-15% [4,5].
Another important element in athletic cardiac remodelling is left atrial dilation, mainly in endurance athletes. An increase in the atrial size of more than 50mm in men and 46mm in women is explained by the increased flow associated with the left ventricle's increased size. The ventricular alteration explains the supraventricular arrhythmic tendencies in this population. [6].
The left atrium pressure increases during exercise, leading to a charge in the pulmonary circulation, which increases the right ventricular filling. This leads to a dilated right ventricle [3]. The athletic heart also adapts functionally, which is observed by a higher capability during exercise to increase the stroke volume [7]. Especially in endurance exercise, we observe an improved left ventricle diastolic chamber distensibility and compliance [6].
Electrical modulation in the athletic heart comes hand in hand with the cardiac autonomic nervous system conditioning, including the withdrawal of sympathetic impulses and increased vagal tone. These neurological modifications lead to sinus arrhythmia, bradycardia, early repolarisation, and first-grade AV blocks. The ECG traces can be classified as follows: training-related changes (bradycardia, bundle branch blocks, AV blocks, QRS modifications correspondent to left ventricular hypertrophy) and changes unrelated to exercise (terminal phase alterations, ST depression, abnormal Q wave). All the modifications listed above should correlate with the patient's demographic characteristics [8].
This systematic review aims to find possible correlations between different evaluative methods of cardiac adaptation in performance athletes. In this regard, we have 3778 performance athletes split between 17 original studies published in the last ten years
2. Materials and Methods
2.1. Inclusion/Exclusion Criteria
Our eligibility criteria were:
- 1)
- Studies that have been published in the last ten years in peer-reviewed journals;
- 2)
- We only took into consideration the adult cohorts in studies
- 3)
- Mandatory mention of left ventricular parameters
- 4)
- Mandatory mention of ultrasonography parameters
Our search strategy was centered around the concepts of cardiac adaptation and athletes, using the following keywords: “myocardial adaptation”, “athlete”, “sport”, and “cardiac remodelling”. We had four independent reviewers search through the following databases: Pubmed, ResearchGate, Oalib, Base, Google Scholar, and ScienceDirect. The Interventional studies involving animals or humans, and other studies that search were conducted from 05.01.2024 to 20.03.2024 and found 2451 initial records from which we were left with 17 original studies (Figure 1). Clinical trial databases and grey literature were not included in the search protocol.
Our data was collected using Microsoft Excel 2023 V16 independently by four researchers, followed by cross-examination and verification among them, with any problems being brought up and solved via group decision.
Another important mention is that this review follows the PRISMA guidelines but was not registered in any database beforehand.
The main focus of our study was related to the type of sport, the ventricular mass, left ventricular volumes, left atrial volumes, and their respective indexes to the body surface area alongside the strain measurements of the left ventricles. We have also collected all the echocardiographic parameters measured by the 17 studies that were found to be statistically significant(p<0.05).
2.2. Risk of Bias
The tool used when assessing the risk of bias was the Robins-E tool [9] due to the non-randomized nature of the studies analyzed in this systematic review. The choice for the tool was collectively made when taking into consideration the seven parameters (bias due to confounding, measurement of exposure, selection of the participants, post-exposure interventions, missing data, measurement of the outcome, and selection of the reported result) it evaluates as being the most probable to find any relevant source of bias (Figure 2). The traffic light plot used to show the assessment was made using the ROBVIS tool. Four reviewers independently assessed the risk of bias, with one of them formulating the results using the ROBINS-E tool, and all discrepancies were discussed among the team and solved accordingly. None of the authors of the studies included in the analysis have declared any conflicts of interest, and none of the 17 studies were financed by a pharmaceutical or biotechnological company.
3. Results
3.1. Electrocardiographic Modifications
ECG modifications appear in athletes due to the adaptive cardiac remodelling that happens as a response to chronic exposure to physical exercise. The benefit of this screening method is that it’s widely available and cheap. Still, one of the big disadvantages is that the ECG gives us little information compared to other imaging techniques (unlike echocardiography or cardiac magnetic resonance - CMR)[27,28].
Out of the 17 original studies that were eligible for this review, four studies showed relevant data regarding ECG findings[12,14,16,17]. Two studies reported that male athletes met the diagnostic criteria for LVH more frequently[14,17]; one recorded RVH as less common than LVH[17]. One study showed that the duration of the PR interval increases with age but remains within normal limits[16]. Finocchiaro et al.[14] found that 4% of the participants presented a left-axis deviation, and 33% of the male athletes they studied had a QRS duration >100ms. In three of these studies, T wave inversion was recorded[12,14,17], and two of these studies showed that the female athletes had a T wave inversion in the anterior precordial leads more frequently than the male athletes, who usually had T wave inversion in the inferior leads[16,17]. In all studies, neither female nor male athletes presented depressed ST segments.
According to Drezner et al. 2017 [29], when it comes to athletes, there are normal ECG findings, borderline ECG findings (not necessarily pathological, but the presence of 2 or more borderline findings may suggest a pathological process), and abnormal ECG findings. Among the normal ECG findings in athletes, we mention increased QRS voltage, incomplete right bundle branch block, early repolarisation, first-degree atrioventricular block, and sinus bradycardia, all of which were present in the five studies. Borderline ECG findings, like left axis deviation, were rarely present. Abnormal ECG findings, from which we mention T wave inversion in the anterior and inferior leads, were present in some studies [29].
3.2. Imagistic Findings
CMR (cardiac magnetic resonance) is a non-invasive imaging technique designed to assess cardiovascular morphology, function, perfusion, and flow quantification [30]. CMR is considered the best method of evaluating the contractile function of the heart, with many well-known advantages, like excellent soft-tissue contrast, the use of a magnetic field and radio waves instead of ionising radiation, and a high spatial resolution being just a few of them. Like any imaging method, CMR presents a set of disadvantages, from which we take note of the high cost of the procedure, making it not nearly as accessible as other imaging techniques (like echocardiography) [31,32].
Out of the 17 eligible studies for this review, only one used CMR (cardiac magnetic resonance). The study compared CMR findings in both males and females, as well as differences between types of sport. Overall, all participants had a normal LVEF. Male athletes had higher LV and RV volumes compared to female athletes. Male athletes had lower LVEDV/LVM and RVEDV/RVM ratios (created specifically to measure the relation between ventricular hypertrophy and ventricular dilatation), suggesting a more noticeable hypertrophy. Male athletes had a higher RVEDV/LVEDV ratio compared to female athletes. Participants who practice endurance sports showed a lower LVEDV/LVM ratio than the rest of the groups [18].
3.3. Differences Between the Type of Sport and Echocardiographic Findings
Sports can be divided into two big categories: dynamic (isotonic) sports, with changes in muscle length and a small intramuscular force, and static (isometric) sports, with little to no change in muscle length but with a large intramuscular force [33]. Exercise can also be classified by the type of muscle metabolism in aerobic and anaerobic exercise. Usually, high-intensity static exercise is characterized by an anaerobic metabolism, while high-intensity dynamic exercise is characterized by an aerobic metabolism. Sports with a high dynamic demand are called endurance sports, and sports with a high static demand are called strength sports. Dynamic exercise will lead to greater oxygen consumption, higher systolic blood pressure, an increase in stroke volume, and a decrease in peripheral resistance. In contrast, static exercise won’t present any changes in stroke volume but will present an increase in oxygen consumption. Usually, athletes participating in high-intensity dynamic sports will have eccentric hypertrophy, and athletes training in high-intensity static sports will have a concentric type of ventricular hypertrophy [33].
In the 17 studies that have been selected, there were evaluated athletes from 3 categories of sports: endurance sports, mixed sports, and strength sports. From the studies we identified, endurance sports (swimming, triathlons, long-distance running, etc) were the most commonly practised among athletes. All studies showed that the resting heart rate for athletes who practised endurance sports was lower than their peers who practised strength-oriented sports, and only one study evaluated the systolic blood pressure, which was higher in the second group. Several studies proved that in endurance sports, the LV wall thickness and the LV mass are greater than in strength sports.
3.4. Racial Differences
Research showed an important difference in the heart’s electrical function between races, more precisely between Caucasian and Black Athletes. The difference was evidentiated using electrocardiography (ECG) [7]. One ECG parameter that stood out as an important modification between the two races was the T wave inversion (TWI). This phenomenon appeared more frequently in the african population, which was between 2.6% and 22.8% in black athletes, compared to 0% to 5% in Caucasian athletes [34-40]. T wave inversion occurred in multiple leads depending on the studies investigated, ranging from anterior (V2) to inferior (DII, aVF) and lateral (V5, V6, DI, aVL), all showing a higher prevalence in the African group compared to the caucasian one [40]. Moreover, ST elevation was also a parameter more frequently present in Africans than in Caucasians. Ranging from 11% to 85% in Africans compared to 1% to 61% in Caucasians, being more present in the lateral and anterior leads [34-36,40-42]. Other ECG alterations were more readily found in the african population than the Caucasians, such as early repolarisation [40,43-46] and left ventricular hypertrophy[34-37,40].
4. Where Adaptation Ends and Pathology Begins
Athlete’s heart is a physiological cardiac adaptation characterised by cardiac hypertrophy, with normal cardiac morphology and a normal or enhanced cardiac function. Pathological cardiac hypertrophy is characterised by cardiac dysfunction that can progress toward heart failure, cellular death, and interstitial fibrosis [48,49]. Cardiac hypertrophy can be classified according to the geometry of the heart into eccentric and concentric hypertrophy, which can be either pathological or physiological. Concentric cardiac hypertrophy is characterized by increased cardiac mass and wall thickness, rarely with chamber volume changes. In contrast, eccentric cardiac hypertrophy is characterized by increased cardiac mass and chamber volumes, usually with normal wall thickness [48].
Even though the athlete’s heart is an adaptive response to prolonged exercise, without pathological implications, there have been recorded some cases of sudden cardiac death (SCD) or sudden cardiac arrest (SCA), with an incidence of 21.7 per 1 million per year [50,51]. Many of the athletes under the age of 35 who suffered from SCD or SCA had an underlying congenital cardiac condition, the most common being hypertrophic cardiomyopathy (HCM) [51]. Therefore, this calls for a careful examination of athletes, starting from a simple ECG and looking into other imaging modalities depending on the presence of any abnormal findings. The first investigation should be a 12-lead ECG alongside a detailed personal and family history. If the ECG shows two or more abnormal ECG findings (T wave inversion, ST depression, pathological Q waves, complete left bundle branch block, third-degree atrioventricular block, etc.) [5], the next investigation should be a full standard echocardiography because even though ECG can sometimes detect an underlying pathology that might lead to SCD/SCA, it has a low sensitivity and specificity for this [29,30].
5. Brief Discussion on Doping and Effects of Anabolic Drugs and How They May Alter the Athlete’s Heart
Doping refers to the use of certain substances to increase the athlete's performance, and it is a widespread problem in sports nowadays. The World Anti-Doping Agency (WADA) was founded as a way to reduce the use of banned substances, also called performance-enhancing drugs, in sports, as they would give the athlete unfair advantages during competitions and impose great health risks, especially cardiovascular risks. Even if these drugs have been strictly regulated over the years when it comes to performance athletes, it doesn’t mean that they aren’t still used by some performance athletes or by people practising casual sports [52].
To help athletes stay up to date with the banned substances, WADA created a list that's updated yearly, including what substances or methods are prohibited and when. The Prohibited List [53] comprises three big categories: substances and methods prohibited at all times, substances and methods banned only in competition, and substances and methods prohibited in certain sports. In the first category are included:
- 1)
- anabolic agents (anabolic androgenic steroids and other anabolic agents),
- 2)
- peptide factors, growth factors, and related substances (erythropoietin and agents affecting erythropoiesis, testosterone stimulating peptides, etc.),
- 3)
- beta-2 agonists (salbutamol, salmeterol, vilanterol, etc. but with some exceptions),
- 4)
- diuretics and masking agents, 5. hormone and metabolic modulators (anti-estrogenic substances, aromatase inhibitors, etc.),
- 5)
- gene and cell doping
- 6)
- manipulation of blood and blood components.
In competition, the following substances are prohibited: 1. stimulants (amfetamine, cocaine, etc), 2. narcotics (morphine, methadone, tramadol, etc.), 3. cannabinoids, 4. glucocorticoids, and 5. beta-blockers [53]. Anabolic androgenic steroids (AAS) are commonly used in sports to increase skeletal muscle mass, therefore boosting the athlete’s performance [54]. AAS use has been associated with cardiovascular effects like hypertension, arrhythmias, pathological cardiac hypertrophy (concentric), cardiac fibrosis, dyslipidemia, and sudden cardiac death [55]. According to Hassan et al., 2009 in some cases of SCD/SCA, myocardial infarction occurs without any signs of atherosclerosis or thrombosis, which might mean that AAS can induce coronary vasospasm and cardiac arrhythmias, depending on the individual [54]. Another form of doping is represented by blood doping, which is defined as using substances or certain methods to increase oxygen delivery to muscles to achieve better athletic performance. Ways of blood doping include blood transfusions, administration of erythropoietin (rhEpo) or other erythropoiesis-stimulating agents (ESAs), and gene manipulation [56]. The main problem with this kind of doping is the rise of red blood cell (RBC) numbers, leading to a higher Hct and hyperviscosity syndrome [55,56]. RhEpo has no significant direct effects on the heart, but it seems like high blood pressure and thrombus formation are to blame for the negative effects of blood doping.
Exercise-induced cardiac remodelling seems to manifest slightly differently in female athletes than in male athletes. Recent research has shown that sex has an impact on cardiac adaptation to exercise, Finocchiaro et al. found in a study with more than 1000 highly trained athletes that the Sokolov-Lyon(SL) criteria for LVH were present in 14% of females in comparison to 42% of males, in addition, females had less left axis deviation [14], anterior T wave inversion (TWI) is more common in female [57], these interesting ECG findings highlight the need for further sex-based interpretation. Pelliccia et al. in one of the biggest studies on female athletes showed that females were rarely to have significant LV cavity enlargement (LVEDD >54mm) and LV wall thickness >12 mm [58]. Females develop eccentric hypertrophy more frequently than males [14].
6. Conclusions
The athlete’s heart has a wide array of modifications resulting from many factors, such as race, gender, type of sport, and, in some cases, even subtypes of the same sport.
In terms of electrical changes, the most prevalent ones are seen amongst the African population vs. the Caucasian one, with the former having a higher frequency of inverted T waves and ST changes. The other notable changes are the “borderline” or “grey area” ones in which certain parameters such as PR duration or QRS duration are elongated but not to a clearly diagnosable value.
In terms of structural changes, the one that responds the most to all the factors that surmise the athlete’s heart is the indexed left ventricular mass that differs between non-athletes and athletes and between types of sport and gender. Other relevant parameters, such as Left Ventricular Wall Thickness and Ventricular Chamber Diameters are predominantly seen in certain situations, such as wall thickness appearing more often in endurance athletes and ventricular chamber diameters changing almost exclusively in males.
7. Limitations
The primary limitations our systematic review has encountered are related to the type of studies included and the number of patients in said studies. Given the nature of the subject we reviewed, a prospective study would be highly impractical, as evidenced by the lack of such studies in the literature. Another significant limitation is the number of athletes included, which is once again constrained by the nature of the researched subject, as there is only a limited number of elite athletes in a country at any given time.
Author Contributions
C.-F.C.; O.M.; F.K.; software, C.-G.U.; C.-F.C.; O.M.; F.K.; validation, S.S.; D.M.; S.B.; M.G.; C.S.; formal analysis, C.-G.U.; C.-F.C.; O.M.; F.K.; I.I-S.-S.; investigation, C.-G.U.; C.-F.C.; O.M.; F.K.; D.M.; S.S.; resources, S.N.; C.S.; S.D.; data curation, M.G.; S.B.; S.D.; M.J.; writing—original draft preparation, C.-G.U.; O.M.; F.K.; D.M.; S.N.; writing—review and editing, S.B.; M.G.; I.-I.S-S.; S.S.; visualization, D.M.; S.D.; C.S.; M.G.; S.S.; supervision, S.S.; D.M.; M.J.; project administration, S.S.; D.M; M.J. All authors have read and agreed to the published version of the manuscript.
Funding
The publication of this paper was supported by the University of Medicine and Pharmacy Carol Davila, through the institutional program Publish not Perish.
Institutional Review Board Statement
Not applicable.
Conflicts of Interest
The authors declare no conflicts of interest.
References
- La Gerche, A.; Wasfy, M.M.; Brosnan, M.J.; Claessen, G.; Fatkin, D.; Heidbuchel, H.; Baggish, A.L.; Kovacic, J.C. The athlete’s heart—challenges and controversies: JACC focus seminar 4/4. Journal of the American College of Cardiology 2022, 80, 1346–1362. [Google Scholar] [CrossRef]
- Bernheim, A.; Zuber, M.; Knechtle, B.; Linka, A.; Faeh-Gunz, A.; De Pasquale, G.; Seifert, B.; Pfyffer, M.; Naegeli, B.; Jost, C.A. Structural and functional cardiac alterations in Ironman athletes: New insights into athlete's heart remodeling. International journal of cardiology 2013, 164, 251–253. [Google Scholar] [CrossRef] [PubMed]
- Palmisano, A.; Darvizeh, F.; Cundari, G.; Rovere, G.; Ferrandino, G.; Nicoletti, V.; Cilia, F.; De Vizio, S.; Palumbo, R.; Esposito, A. Advanced cardiac imaging in athlete’s heart: Unravelling the grey zone between physiologic adaptation and pathology. La radiologia medica 2021, 1–14. [Google Scholar] [CrossRef]
- Ribeiro, I.; Botanico, J. Physiologic left ventricular cavity dilatation in elite athletes. Annals of Internal Medicine 1999, 131, 546. [Google Scholar] [CrossRef] [PubMed]
- Pelliccia, A.; Maron, B.J.; Spataro, A.; Proschan, M.A.; Spirito, P. The upper limit of physiologic cardiac hypertrophy in highly trained elite athletes. New England Journal of Medicine 1991, 324, 295–301. [Google Scholar] [CrossRef]
- Mont, L.; Sambola, A.; Brugada, J.; Vacca, M.; Marrugat, J.; Elosua, R.; Pare, C.; Azqueta, M.; Sanz, G. Long-lasting sport practice and lone atrial fibrillation. European heart journal 2002, 23, 477–482. [Google Scholar] [CrossRef]
- Levine, B.D.; Lane, L.D.; Buckey, J.C.; Friedman, D.B.; Blomqvist, C.G. Left ventricular pressure-volume and Frank-Starling relations in endurance athletes. Implications for orthostatic tolerance and exercise performance. Circulation 1991, 84, 1016–1023. [Google Scholar] [CrossRef] [PubMed]
- Corrado, D.; Pelliccia, A.; Heidbuchel, H.; Sharma, S.; Link, M.; Basso, C.; Biffi, A.; Buja, G.; Delise, P.; Gussac, I. Recommendations for interpretation of 12-lead electrocardiogram in the athlete. European heart journal 2010, 31, 243–259. [Google Scholar] [CrossRef]
- ROBINS-E Development Group (Higgins J, M.R., Rooney A, Taylor K, Thayer K, Silva R, Lemeris C, Akl A, Arroyave W, Bateson T, Berkman N, Demers P, Forastiere F, Glenn B, Hróbjartsson A, Kirrane E, LaKind J, Luben T, Lunn R, McAleenan A, McGuinness L, Meerpohl J, Mehta S, Nachman R, Obbagy J, O'Connor A, Radke E, Savović J, Schubauer-Berigan M, Schwingl P, Schunemann H, Shea B, Steenland K, Stewart T, Straif K, Tilling K, Verbeek V, Vermeulen R, Viswanathan M, Zahm S, Sterne J). Risk Of Bias In Non-randomized Studies - of Exposure (ROBINS-E). Launch version. Available online: https://www.riskofbias.info/welcome/robins-e-tool.
- Eun, L.Y.; Chae, H.W. Assessment of myocardial function in elite athlete’s heart at rest-2D speckle tracking echocardiography in Korean elite soccer players. Scientific Reports 2016, 6, 39772. [Google Scholar] [CrossRef]
- Cooke, S.; Samuel, T.J.; Cooper, S.M.; Stöhr, E.J. Adaptation of myocardial twist in the remodelled athlete's heart is not related to cardiac output. Experimental Physiology 2018, 103, 1456–1468. [Google Scholar] [CrossRef]
- Major, Z.; Csajági, E.; Kneffel, Z.; Kováts, T.; Szauder, I.; Sidó, Z.; Pavlik, G. Comparison of left and right ventricular adaptation in endurance-trained male athletes. Acta Physiologica Hungarica 2015, 102, 23–33. [Google Scholar] [CrossRef]
- Miranda, D.P.; Dos Santos, M.J.; Salemi, V.M.C.; de Oliveira, E.P.C.; Verberne, H.J.; da Rocha, E.T. Differential effects of variation in athletes training on myocardial morphophysiological adaptation in men: Focus on 123I-MIBG assessed myocardial sympathetic activity. Journal of Nuclear Cardiology 2014, 21, 570–577. [Google Scholar] [CrossRef]
- Finocchiaro, G.; Dhutia, H.; D’Silva, A.; Malhotra, A.; Steriotis, A.; Millar, L.; Prakash, K.; Narain, R.; Papadakis, M.; Sharma, R. Effect of sex and sporting discipline on LV adaptation to exercise. JACC: Cardiovascular Imaging 2017, 10, 965–972. [Google Scholar] [CrossRef] [PubMed]
- Giraldeau, G.; Kobayashi, Y.; Finocchiaro, G.; Wheeler, M.; Perez, M.; Kuznetsova, T.; Lord, R.; George, K.P.; Oxborough, D.; Schnittger, I. Gender differences in ventricular remodeling and function in college athletes, insights from lean body mass scaling and deformation imaging. The American journal of cardiology 2015, 116, 1610–1616. [Google Scholar] [CrossRef]
- Agrebi, B.; Tkatchuk, V.; Hlila, N.; Mouelhi, E.; Belhani, A. Impact of specific training and competition on myocardial structure and function in different age ranges of male handball players. PLoS One 2015, 10, e0143609. [Google Scholar] [CrossRef] [PubMed]
- D’Ascenzi, F.; Biella, F.; Lemme, E.; Maestrini, V.; Di Giacinto, B.; Pelliccia, A. Female athlete’s heart: sex effects on electrical and structural remodeling. Circulation: Cardiovascular Imaging 2020, 13, e011587. [Google Scholar] [CrossRef]
- Csecs, I.; Czimbalmos, C.; Toth, A.; Dohy, Z.; Suhai, I.F.; Szabo, L.; Kovacs, A.; Lakatos, B.; Sydo, N.; Kheirkhahan, M. The impact of sex, age and training on biventricular cardiac adaptation in healthy adult and adolescent athletes: cardiac magnetic resonance imaging study. European Journal of Preventive Cardiology 2020, 27, 540–549. [Google Scholar] [CrossRef]
- Forsythe, L.; MacIver, D.H.; Johnson, C.; George, K.; Somauroo, J.; Papadakis, M.; Brown, B.; Qasem, M.; Oxborough, D. The relationship between left ventricular structure and function in the elite rugby football league athlete as determined by conventional echocardiography and myocardial strain imaging. International journal of cardiology 2018, 261, 211–217. [Google Scholar] [CrossRef] [PubMed]
- Lakatos, B.K.; Molnár, A.Á.; Kiss, O.; Sydó, N.; Tokodi, M.; Solymossi, B.; Fábián, A.; Dohy, Z.; Vágó, H.; Babity, M. Relationship between cardiac remodeling and exercise capacity in elite athletes: incremental value of left atrial morphology and function assessed by three-dimensional echocardiography. Journal of the American Society of Echocardiography 2020, 33, 101–109.e101. [Google Scholar] [CrossRef]
- Lin, J.; Wang, F.; Weiner, R.B.; DeLuca, J.R.; Wasfy, M.M.; Berkstresser, B.; Lewis, G.D.; Hutter, A.M.; Picard, M.H.; Baggish, A.L. Blood pressure and LV remodeling among American-style football players. JACC: Cardiovascular Imaging 2016, 9, 1367–1376. [Google Scholar] [CrossRef]
- Hammami, N.; Frih, B.; Rahali, H.; Mkacher, W.; Rezgui, T.; Čular, D.; Bouassida, A. Effects of taekwondo style practice on cardiac remodeling and isokinetic thigh strength in elite women players. Science & sports 2021, 36, 479. e471–479. e479. [Google Scholar]
- Wasfy, M.M.; Weiner, R.B.; Wang, F.; Berkstresser, B.; Lewis, G.D.; DeLuca, J.R.; Hutter, A.M.; Picard, M.H.; Baggish, A.L. Endurance exercise-induced cardiac remodeling: not all sports are created equal. Journal of the American Society of Echocardiography 2015, 28, 1434–1440. [Google Scholar] [CrossRef] [PubMed]
- Weiner, R.B.; DeLuca, J.R.; Wang, F.; Lin, J.; Wasfy, M.M.; Berkstresser, B.; Stoehr, E.; Shave, R.; Lewis, G.D.; Hutter Jr, A.M. Exercise-induced left ventricular remodeling among competitive athletes: a phasic phenomenon. Circulation: Cardiovascular Imaging 2015, 8, e003651. [Google Scholar] [CrossRef] [PubMed]
- Roslan, A.; Stanislaus, R.; Sin, T.Y.; Aris, F.A.; Ashari, A.; Shaparudin, A.A.; Shah, W.F.W.R.; Beng, K.H.; Jhung, L.T.; Aktifanus, A.T.J. Echocardiography and strain analysis in Malaysian elite athletes versus young healthy adults. IJC Heart & Vasculature 2023, 47, 101242. [Google Scholar]
- Huang, K.-C.; Lin, C.-E.; Lin, L.-Y.; Hwang, J.-J.; Lin, L.-C. Data-driven clustering supports adaptive remodeling of athlete's hearts: An echocardiographic study from the Taipei Summer Universiade. Journal of the Formosan Medical Association 2022, 121, 1495–1505. [Google Scholar] [CrossRef]
- Lisman, K.A. Electrocardiographic evaluation in athletes and use of the Seattle criteria to improve specificity. Methodist DeBakey cardiovascular journal 2016, 12, 81. [Google Scholar] [CrossRef] [PubMed]
- Basu, J.; Malhotra, A. Interpreting the athlete’s ECG: current state and future perspectives. Current treatment options in cardiovascular medicine 2018, 20, 1–10. [Google Scholar] [CrossRef] [PubMed]
- Drezner, J.A.; Sharma, S.; Baggish, A.; Papadakis, M.; Wilson, M.G.; Prutkin, J.M.; La Gerche, A.; Ackerman, M.J.; Borjesson, M.; Salerno, J.C. International criteria for electrocardiographic interpretation in athletes: consensus statement. British journal of sports medicine 2017, 51, 704–731. [Google Scholar] [CrossRef]
- Tseng, W.-Y.I.; Su, M.-Y.M.; Tseng, Y.-H.E. Introduction to cardiovascular magnetic resonance: technical principles and clinical applications. Acta Cardiologica Sinica 2016, 32, 129. [Google Scholar]
- Lang, C.; Atalay, M.K. Cardiac magnetic resonance imaging and computed tomography: state of the art in clinical practice. Rhode Island Medical Journal 2014, 97, 28. [Google Scholar]
- Fogante, M.; Agliata, G.; Basile, M.C.; Compagnucci, P.; Volpato, G.; Falanga, U.; Stronati, G.; Guerra, F.; Vignale, D.; Esposito, A. Cardiac imaging in athlete’s heart: the role of the radiologist. Medicina 2021, 57, 455. [Google Scholar] [CrossRef] [PubMed]
- Mitchell, J.H.; Haskell, W.; Snell, P.; Van Camp, S.P. Task Force 8: classification of sports. Journal of the American College of Cardiology 2005, 45, 1364–1367. [Google Scholar] [CrossRef] [PubMed]
- Papadakis, M.; Carre, F.; Kervio, G.; Rawlins, J.; Panoulas, V.F.; Chandra, N.; Basavarajaiah, S.; Carby, L.; Fonseca, T.; Sharma, S. The prevalence, distribution, and clinical outcomes of electrocardiographic repolarization patterns in male athletes of African/Afro-Caribbean origin. European heart journal 2011, 32, 2304–2313. [Google Scholar] [CrossRef] [PubMed]
- Basavarajaiah, S.; Boraita, A.; Whyte, G.; Wilson, M.; Carby, L.; Shah, A.; Sharma, S. Ethnic differences in left ventricular remodeling in highly-trained athletes: relevance to differentiating physiologic left ventricular hypertrophy from hypertrophic cardiomyopathy. Journal of the American College of Cardiology 2008, 51, 2256–2262. [Google Scholar] [CrossRef] [PubMed]
- Kervio, G.; Pelliccia, A.; Nagashima, J.; Wilson, M.G.; Gauthier, J.; Murayama, M.; Uzan, L.; Ville, N.; Carré, F. Alterations in echocardiographic and electrocardiographic features in Japanese professional soccer players: comparison to African-Caucasian ethnicities. European journal of preventive cardiology 2013, 20, 880–888. [Google Scholar] [CrossRef] [PubMed]
- Magalski, A.; Maron, B.J.; Main, M.L.; McCoy, M.; Florez, A.; Reid, K.J.; Epps, H.W.; Bates, J.; Browne, J.E. Relation of race to electrocardiographic patterns in elite American football players. Journal of the American College of Cardiology 2008, 51, 2250–2255. [Google Scholar] [CrossRef] [PubMed]
- Magalski, A.; McCoy, M.; Zabel, M.; Magee, L.M.; Goeke, J.; Main, M.L.; Bunten, L.; Reid, K.J.; Ramza, B.M. Cardiovascular screening with electrocardiography and echocardiography in collegiate athletes. The American journal of medicine 2011, 124, 511–518. [Google Scholar] [CrossRef] [PubMed]
- Malhotra, A.; Dhutia, H.; Yeo, T.-J.; Finocchiaro, G.; Gati, S.; Bulleros, P.; Fanton, Z.; Papatheodorou, E.; Miles, C.; Keteepe-Arachi, T. Accuracy of the 2017 international recommendations for clinicians who interpret adolescent athletes’ ECGs: a cohort study of 11 168 British white and black soccer players. British journal of sports medicine 2020, 54, 739–745. [Google Scholar] [CrossRef] [PubMed]
- Davis, A.J.; Semsarian, C.; Orchard, J.W.; La Gerche, A.; Orchard, J.J. The impact of ethnicity on athlete ECG interpretation: a systematic review. Journal of Cardiovascular Development and Disease 2022, 9, 183. [Google Scholar] [CrossRef]
- Leo, T.; Uberoi, A.; Jain, N.A.; Garza, D.; Chowdhury, S.; Freeman, J.V.; Perez, M.; Ashley, E.; Froelicher, V. The impact of ST elevation on athletic screening. Clinical Journal of Sport Medicine 2011, 21, 433–440. [Google Scholar] [CrossRef]
- Malhotra, A.; Oxborough, D.; Rao, P.; Finocchiaro, G.; Dhutia, H.; Prasad, V.; Miller, C.; Keavney, B.; Papadakis, M.; Sharma, S. Defining the normal spectrum of electrocardiographic and left ventricular adaptations in mixed-race male adolescent soccer players. Circulation 2021, 143, 94–96. [Google Scholar] [CrossRef] [PubMed]
- Sheikh, N.; Papadakis, M.; Carre, F.; Kervio, G.; Panoulas, V.F.; Ghani, S.; Zaidi, A.; Gati, S.; Rawlins, J.; Wilson, M.G. Cardiac adaptation to exercise in adolescent athletes of African ethnicity: an emergent elite athletic population. British journal of sports medicine 2013, 47, 585–592. [Google Scholar] [CrossRef] [PubMed]
- Miragoli, M.; Goldoni, M.; Demola, P.; Paterlini, A.; Li Calzi, M.; Gioia, M.I.; Visioli, F.; Rossi, S.; Pela, G. Left ventricular geometry correlates with early repolarization pattern in adolescent athletes. Scandinavian journal of medicine & science in sports 2019, 29, 1727–1735. [Google Scholar]
- Noseworthy, P.A.; Weiner, R.; Kim, J.; Keelara, V.; Wang, F.; Berkstresser, B.; Wood, M.J.; Wang, T.J.; Picard, M.H.; Hutter Jr, A.M. Early repolarization pattern in competitive athletes: clinical correlates and the effects of exercise training. Circulation: Arrhythmia and Electrophysiology 2011, 4, 432–440. [Google Scholar] [CrossRef] [PubMed]
- Waase, M.P.; Mutharasan, R.K.; Whang, W.; DiTullio, M.R.; DiFiori, J.P.; Callahan, L.; Mancell, J.; Phelan, D.; Schwartz, A.; Homma, S. Electrocardiographic findings in national basketball association athletes. JAMA cardiology 2018, 3, 69–74. [Google Scholar] [CrossRef] [PubMed]
- Drezner, J.A.; Ackerman, M.J.; Anderson, J.; Ashley, E.; Asplund, C.A.; Baggish, A.L.; Börjesson, M.; Cannon, B.C.; Corrado, D.; DiFiori, J.P. Electrocardiographic interpretation in athletes: the ‘Seattle criteria’. British journal of sports medicine 2013, 47, 122–124. [Google Scholar] [CrossRef] [PubMed]
- Bernardo, B.C.; Weeks, K.L.; Pretorius, L.; McMullen, J.R. Molecular distinction between physiological and pathological cardiac hypertrophy: experimental findings and therapeutic strategies. Pharmacology & therapeutics 2010, 128, 191–227. [Google Scholar]
- Shimizu, I.; Minamino, T. Physiological and pathological cardiac hypertrophy. Journal of molecular and cellular cardiology 2016, 97, 245–262. [Google Scholar] [CrossRef] [PubMed]
- Marijon, E.; Uy-Evanado, A.; Reinier, K.; Teodorescu, C.; Narayanan, K.; Jouven, X.; Gunson, K.; Jui, J.; Chugh, S.S. Sudden cardiac arrest during sports activity in middle age. Circulation 2015, 131, 1384–1391. [Google Scholar] [CrossRef]
- Wasfy, M.M.; Hutter, A.M.; Weiner, R.B. Sudden cardiac death in athletes. Methodist DeBakey cardiovascular journal 2016, 12, 76. [Google Scholar] [CrossRef]
- Cadwallader, A.B.; Murray, B. Performance-enhancing drugs I: understanding the basics of testing for banned substances. International journal of sport nutrition and exercise metabolism 2015, 25, 396–404. [Google Scholar] [CrossRef] [PubMed]
- The List of Prohibited Substances and Methods (List) indicates what substances and methods are prohibited in sport and when. Available online: https://www.wada-ama.org/en/prohibited-list#search-anchor.
- Hassan, N.; Salem, M.; Sayed, M. Doping and effects of anabolic androgenic steroids on the heart: histological, ultrastructural, and echocardiographic assessment in strength athletes. Human & experimental toxicology 2009, 28, 273–283. [Google Scholar]
- La Gerche, A.; Brosnan, M.J. Cardiovascular effects of performance-enhancing drugs. Circulation 2017, 135, 89–99. [Google Scholar] [CrossRef] [PubMed]
- de Oliveira, C.D.R.; de Bairros, A.V.; Yonamine, M. Blood doping: risks to athletes’ health and strategies for detection. Substance Use & Misuse 2014, 49, 1168–1181. [Google Scholar]
- Malhotra, A.; Dhutia, H.; Gati, S.; Yeo, T.-J.; Dores, H.; Bastiaenen, R.; Narain, R.; Merghani, A.; Finocchiaro, G.; Sheikh, N. Anterior T-wave inversion in young white athletes and nonathletes: prevalence and significance. Journal of the American College of Cardiology 2017, 69, 1–9. [Google Scholar] [CrossRef]
- Pelliccia, A.; Maron, B.J.; Culasso, F.; Spataro, A.; Caselli, G. Athlete's heart in women: echocardiographic characterization of highly trained elite female athletes. Jama 1996, 276, 211–215. [Google Scholar] [CrossRef]
Figure 1.
PRISMA flow diagram of our systematic review.
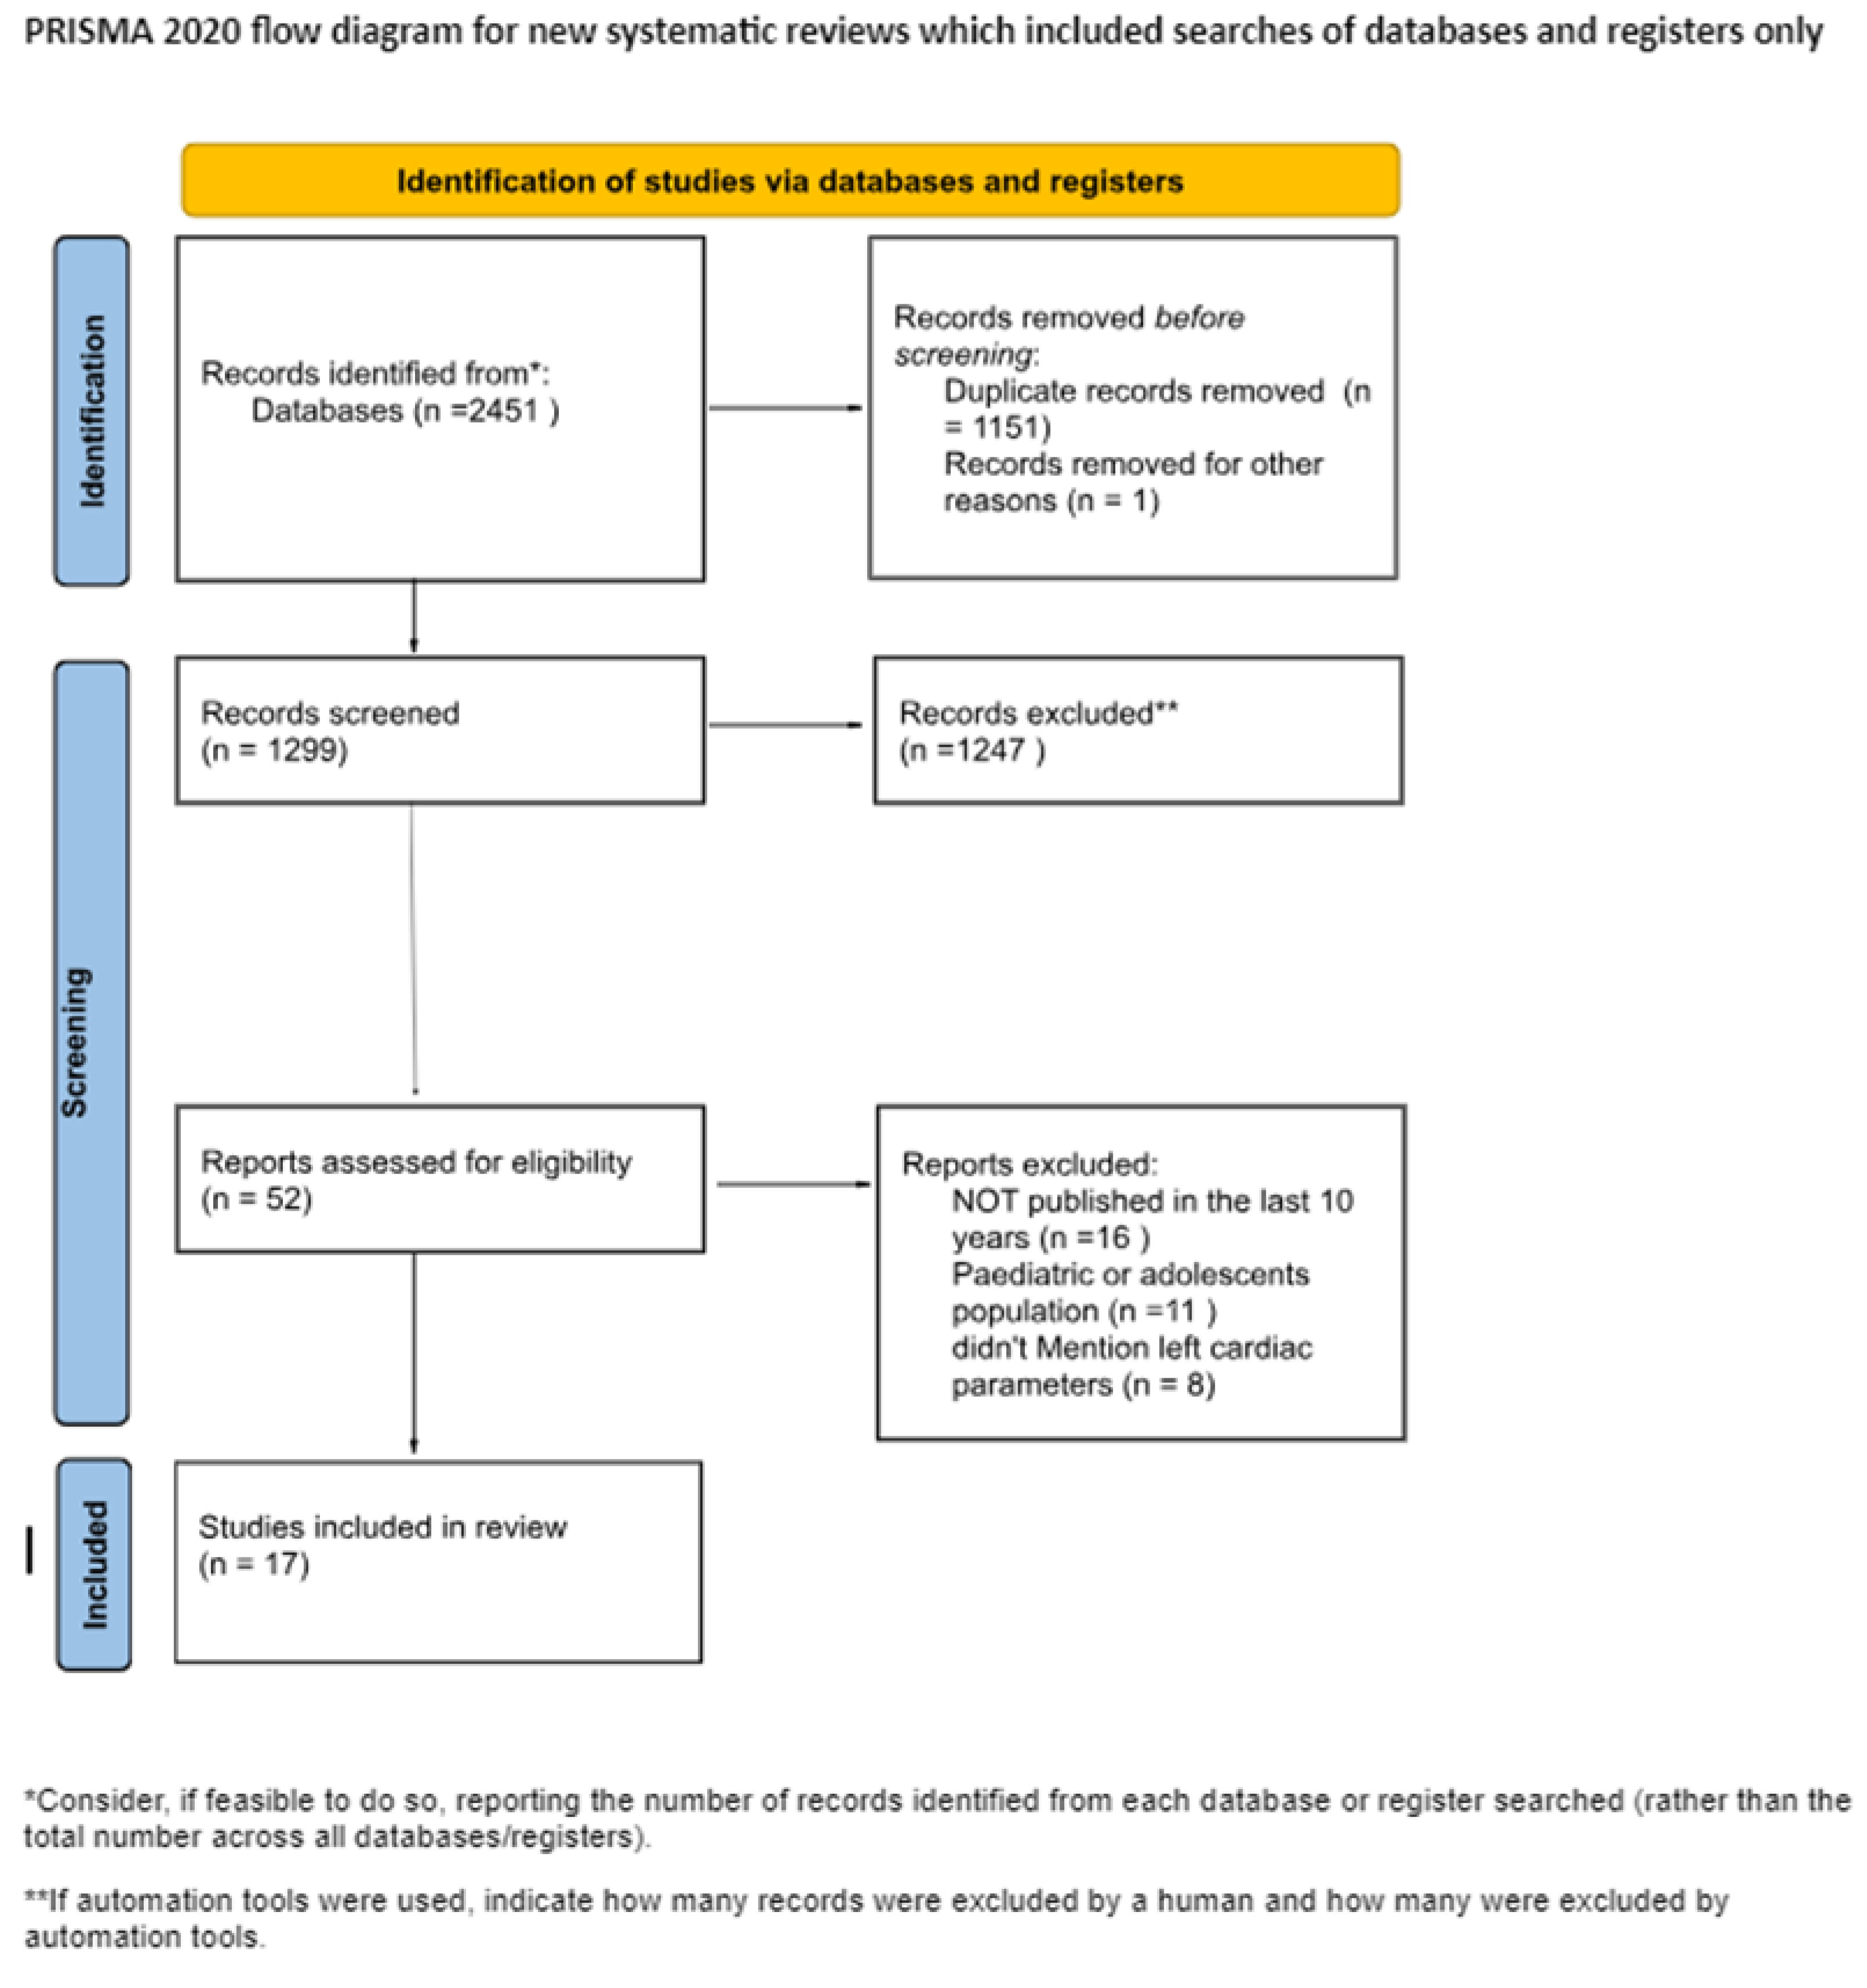
Figure 2.
Risk of bias domains.
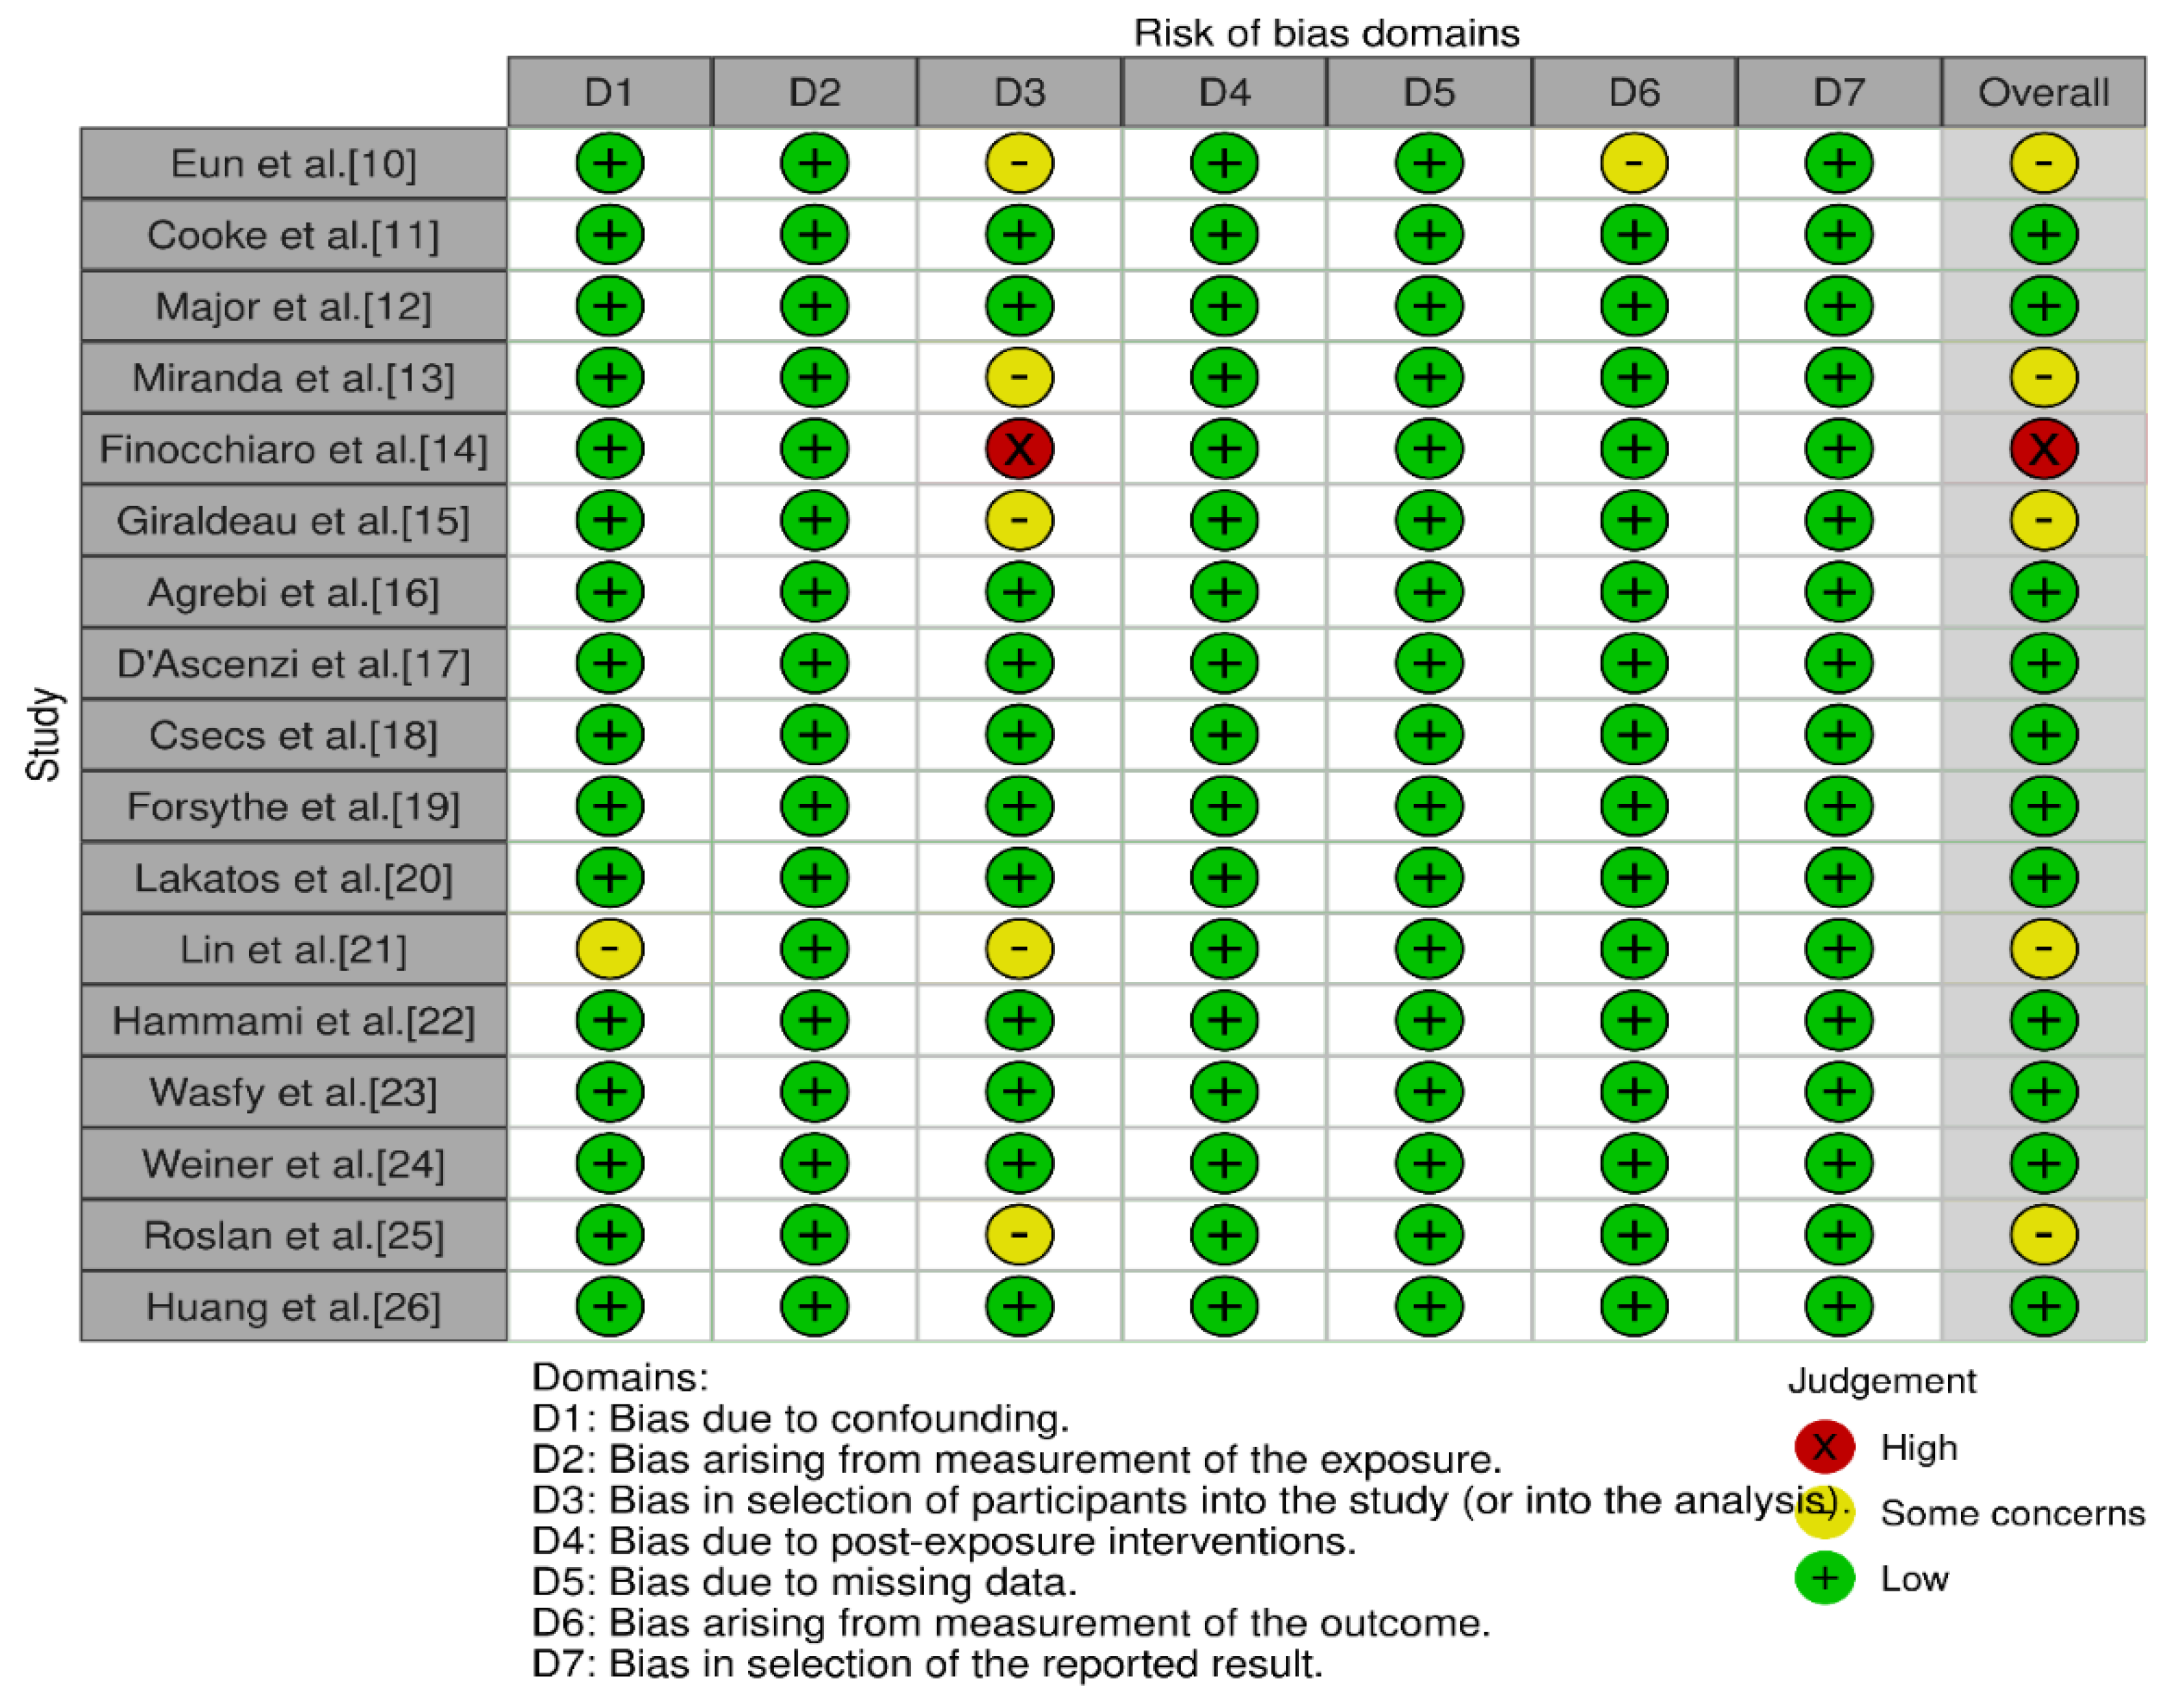

Table 1.
Female Elite Athlete Echographic Findings.
| Article | Patients | Type of sport / Intensity | LEFT VENTRICULAR MASS+ INDEX | VOLUMES | STRAIN | LEFT VENTRICULAR ECHO FINDINGS | RIGHT VENTRICULAR ECHO FINDINGS |
|---|---|---|---|---|---|---|---|
| Hammami et al., 2021 | 20 | STRENGTH | LVEF(%) (WD) 59,33 ± 7,23 (ITF) 63,06 ± 7,40 LVEDD (ml) (WD) 124,63 ± 32,70 (ITF) 117,76 ± 9,65 LVESD (ml) (WD) 51,55 ± 12,29 (ITF) 50,57 ± 10,26 IST (mm) (WD) 7,07 ± 0,62 (ITF) 8,19 ± 1,37 (p<0,05) PWIVS (mm) (WD) 6,85 ± 0,62 (ITF) 7,43 ± 0,74 |
RVEDD (mm) (WD) 48,94 ± 4,35 (ITF) 47,59 ± 2,86 RVESD (mm) (WD) 28,38 ± 3,39 (ITF) 30,00 ± 2,07 RVL (mm) (WD) 65,35 ± 8,51 (ITF) 64,37 ± 3,44 |
|||
| Finocchiaro et al., 2017 | 1,083 | ENDURANCE+ MIXED TYPE EXERCISE REGIMEN | LVM/BSA (g/m2) 83 ± 17 (p=0.001) | LVEDD (mm) 49 ± 4 (p<0.001) LVEDD/BSA (mm/m^2) 28.6 ± 2.7(p<0.001) IVs (mm) 8.7 ± 1.2 (p<0.001) PW (mm) 8.4 ± 1.2 (p<0.001) RWT: 0.35 ± 0.04 (p<0.001) RWT >0.42: 34 (8) (p=0.04) |
|||
| Giraldeau et al., 2015 | 315 | STRENGTH + MIXED TYPE EXERCISE REGIMEN | LVM (g)111 +/- 20 (0.001) LVM/BSA (g/m^2) 65 +/- 9(0.001) |
Stroke volume (ml) 75 +/- 12(0.001) LV end-diastolic volume absolute (ml) 142 +/- 23(0.001) LV end-diastolic volume indexed to BSA (ml/m2) 83 +/- 12(0.001) LV Mass-to-Volume ratio 0.79 +/- 0.09 (0.015) LV Mass-to-Volume ratio (Allometric correction) 0.24 +/- 0.03 (0.035) Left atrial volume absolute (ml) 47.5 +/- 11.7 (0.001) RA volume (ml) 41,2 +/- 10,9 (p<0,0001) RA volume indexed BSA (ml/m^2) 24,1 +/- 5,7 (p=0,02) |
2D GLS manual strain (%) (F) -21.6 +/- 1.9(0.02) ; LV GLS (%) (F) -22.0 +/- 1.9(0.02); Diastolic early SR (%/s) (F)1.81 +/- 0.40(<0.01); RV GLS (%) -24,9 +/- 2,6 (p=0,76) LA LS contraction (%) -11,2 +/- 4,4 (p=0,65) RA LS contraction (%) -13,2 +/- 5,3 (p=0,056) |
LVEF (%) (F) 66 +/- 4 (0.004); Interventricular sept thickness (mm) (F) 6,1 +/- 1,0 (0.001); Posterior wall thickness (mm) (F) 7,0 +/- 1,1(0.001) Left ventricular internal diameter (mm) (F) 47,1 +/- 4,2(0.001) |
RV area (cm^2) 22,8 +/- 3,5 (p<0,0001) RV dimensions basal (cm) 3,7 +/- 0,5 (p<0,0001) RV dimensions mid (cm) 2,9 +/- 0,5 (p<0,0001) RV longitudinal (cm) 8,2 +/- 0,7 (p<0,0001) |
| D'Ascenzi et al., 2020 | 720 | ENDURANCE+ STRENGTH+ MIXED TYPE | LVM(g) 143.9±31.4 (96–202) (0.0001) LVM index, g/m2 81.8±15.1 (60–111) (0.0001) |
LV ejection fraction, % 67±6 (57–77) (0.0001) LV end-diastolic diameter, mm (F) 48.8±3.3 (44–54) (0.0001) LV end-diastolic diameter index, mm/m2 28.6±2.4 (25–33) (0.0001) LV end-systolic diameter, mm 30.2±3.3 (25–36) (0.0001) LV end-systolic diameter index, mm/m2 17.7±1.9 (15–21) (0.0001) IVS, mm 8.7±0.8 (7–10) (0.0001) Posterior wall, mm 8.4±0.8 (7–10) (0.0001) RWT 0.35±0.03 (0.31–0.39) (0.0001) Left atrial diameter, mm 32.3±3.8 (26–38) (0.0001) |
RV basal diameter (mm) 35.1±4.8 (27–44) (p<0.0001) RV midcavity diameter (mm) 23.9±4.2 (18–31) (p<0.0001) RV longitudinal diameter, (mm) 79.4±9.3 (65–95) (p<0.0001) RV diastolic area (cm^2) 19.5±5.2 (13–27) (p<0.0001) RV systolic area (cm^2) 9.1±2.7 (5–14) (p<0.0001) |
||
| Roslan et al., 2023 | 100 | ENDURANCE+ MIXED TYPE EXERCISE REGIMEN | LVM index (g/m2) 71,57 +/- 28,21 (p<0.001) | LVEDV index (mls/m^2) 57,25 +/- 11,55 (p<0,001) LVESV index (mls/m^2) 24,03 +/- 7,55 (p<0,001) |
GLS (%) 21,91 +/- 2,54 (p=0,53) LArS (%) 48,07 +/- 10,06 (p=0,004) LAcS (%) 36,3 +/- 8,30 (p=0,232) RVGLS (%) 22,85 +/- 3,08 (p=0,34) |
IVSd (cm) 0,77 +/- 0,11 (p=0,11) PWTd (cm) 0,8 +/- 0,31 (p=0,035) LVIDd (cm) 4,56 +/- 0,32 (p=0,009) IVSs (cm) 1,07 +/-0,14 (p=0,943) PWTs (cm)1,25 +/- 0,17 (p=0,095) LVIDs (cm) 2,94 +/- 0,29 (p<0,001) RWT 0,35 +/- 0,13 (p=0,131) |
|
| Lakatos et al., 2020 | 138 | MIXED TYPE EXERCISE REGIMEN | LVM index (g/m^2) 88.9 ± 9.5 (p<0.001) | LVSVi (mL/m^2) 46.1 ± 5.9 (p<0.05) LVEDVi (mL/m^2) 79.7 ± 8.3 (p<0.001) LVESVi (mL/m^2) 33.6 ± 5.3 (p<0.001) |
LA GLS (%) 34.3 ± 7.8 (p<0.01) LV GLS (%) −19.4 ± 1.9 (p<0,001) LV GCS (%) −28.1 ± 3.4 (p<0.05) |
LVEF (%) 57.9 ± 4.7 (p<0.01) LVMi (g/m^2) 88.9 ± 9.5 (p<0.001) |
|
| Huang et al., 2022 | 598 | ENDURANCE+ STRENGTH+ MIXED TYPE | LVM index (g/m^2) 79.7±18.8 (p<0.001) | LV stroke volume index (mL/m^2) 39.3 ± 7.8 (p<0.001) LVEDV index (mL/m^2) 67.3 ± 12.1 (p<0.001) LVESV index (mL/m^2) 28.0 ± 6.3 (p<0.001) |
LVGLS (%) −23.7 ± 2.3 (p<0.001) LVGCS (%) −28.5 ± 4.1 (p=0.778) RVLS (%) -27,9 +/- 4,4 (p=0,358) |
LVEF (%) 58.5 ± 5.4 (p=0.06) IVSd (mm) 8.6 ± 1.3 (p<0.001) LVPWd (mm) 8.7 ± 1.3 (p<0.001) LVIDd index (mm/m^2) 27.9 ± 2.9 (p<0.001) LVIDs index (mm/m^2) 18.4 ± 2.5 (p<0.017) |
RVEDA index (cm^2/m^2) 11,3 +/- 1,9 (p<0,001) RVESA index (cm^2/m^2) 6,7 +/- 1,3 (p<0,001) |
Table 2.
Male Elite Athlete Echographic Findings.
| Article | Patients | Type of sport / Intensity | LEFT VENTRICULAR MASS+ INDEX | VOLUMES | STRAIN | LEFT VENTRICULAR ECHO FINDINGS | RIGHT VENTRICULAR ECHO FINDINGS |
|---|---|---|---|---|---|---|---|
| Eun et al., 2016 | 29 | MIXED TYPE EXERCISE REGIMEN | LVM (g) 216.7±21.9 (p=0,001) LVM index (g/height2) 110.2±9.4 (p=0,001) |
Stroke volume (mL) 89.3±15.4 (p=0,01) End-diastolic volume (mL/m2) 152.0±19.4 (p=0,001) End-systolic volume (mL/m2) 62.7±12.7 (p=0,001) |
Longitudinal strain: −17.6+/- 1.8 (p=ns) | Ejection Fraction (%) 62.3±4.2 (p=ns) Interventricular septal thickness (mm) 10.4±0.8 (p=0,01) Posterior wall thickness (mm) 10.6±0.7 (p=0,001) End-diastolic diameter (mm) 53.1±0.7 (p=0,001) End-systolic diameter (mm) 36.5±1.8 (p=0,001) Relative wall thickness 4.0±0.3 (p=ns) Cardiac index (L/m2) 2.5±0.6 (p=ns) End-systolic WS (mmHg) 240.9±32.6 (p=0,001) End-systolic MWS (g/cm2) 21.5±1.5 (p=ns) |
RV Systolic Area (m2) 14.9±3.7 (p=0,005) RV Diastolic Area (m2) 26.1±7.1 (p=0,002) |
| Cooke et al., 2018 | 11 | ENDURANCE | LVM(g) 181 +/- 27 (p= 0,001) LVM index 95 +/- 12 (p=0,001) |
Stroke volume(ml) 87±14 (p< 0,01) Stroke volume index(ml m−2) 46±9 (p<0,01) End-diastolic volume(ml) 148±20 (p<= 0,01) End-diastolic volume index(ml m−2) 78±12 (p<= 0,05) End-systolic volume(ml)61±16 (p=0,0001) End-systolic volume index(ml m−2) 32±8 (p=0,01) |
Peak twist(degrees) 13.4±6.6 (p=0,0001) Peak torsion(degrees cm−1) 1.5±0.8 (p=0,0001) LV shortening(Δcm) 1.9±0.5 (p=0,0001) Sphericity index 1.7±0.1 (p=0,0001) End-diastolic LV length(cm) 9.3±0.7 (p=0,0001) Cardiac output(L min−1) 4.3±0.8 (p=0,0001) Cardiac index(L min−1 m−2) 2.3±0.5 (p=0,0001) |
||
| Major et al., 2014 | 52 | ENDURANCE | LVM(g/m^3) 99,4 +/- 17,3 (p,0,001) | LV rel. Stroke Volume (ml/m^3) 36,6 +/- 8,9 (p<0,01) |
rel.LVLADd (mm/m) 63.8 ± 5.6 (p<0,05) |
rel.RVLADd (mm/m) 63.4 ± 6.3 (p<0,001) RVLA.Fr.Sh. (%) 25.9 ± 6.3 (p= NS) rel.RVSADd (mm/m) 27.3 ± 3.6 (p<0,001) RVSA.Fr.Sh. (%) 20.3 ± 8.4 (p= NS) RVAd (cm2 ) 28.0 ± 5.0 (p<0,001) RVFAC (%) 42.7 ± 6.8 (p= NS) |
|
| Miranda et al., 2014 | 40 | ENDURANCE+ STRENGTH | LVM index (g m^-2) (endurance) 79,25 +/- 20,75 (p=0,01) LVM index (g m^-2) (strength) 88,74 +/- 28,71 (p<0,01) |
Left ventricular ejection fraction (%) (endurance) 62,70 +/- 6,34 (p=0,628) Left ventricular ejection fraction (%) (strength) 61,35 +/- 4,69 (p=0,163) Septum thickness (mm) (endurance) 8,40 +/- 1,60 (p=0,041) Septum thickness (mm) (strength) 9,75 +/- 1,86 (p=0,01) Posterior wall thickness (mm) (endurance) 8,50 +/- 1,43 (p=0,01) Posterior wall thickness (mm) (strength) 10 +/- 2 (p=0,01) Left ventricular end diastolic dimension (mm) (endurance) 48,65 +/- 4,70 (p=0,055) Left ventricular end diastolic dimension (mm) (strength) 49,85 +/- 4,20 (p=0,01) Left ventricular end systolic dimension (mm) (endurance) 30,20 +/- 3,25 (p=0,042) Left ventricular end systolic dimension (mm) (strength) 31,25 +/- 3,66 (p=0,004) |
|||
| Forsythe et al., 2018 | 139 | MIXED TYPE EXERCISE REGIMEN | LVM (g) 191 ± 31 (p<0,001) LVM index (g/(m^2)^2.7) 38 ± 7 (p<0,001) LVM index (g/m2) 87 ± 13 (p<0,001) |
Stroke Volume (ml) 92 ± 16 (p<0,001) LVEDV (ml) 157 ± 25 (p<0,001) LVEDV (ml/(m^2)^1.5) 48 ± 7 (p<0,001) LVESV (ml) 65 ± 13 (p<0,001) LVESV (ml/(m^2)^1.5) 20 ± 4 (p<0,001) |
Mean Wall Thickness (mm) 9 ± 1 (p<0,001) Maximum wall thickness (mm) 10 ± 1 (p<0,001) LVIDd (mm) 56 ± 4 (p<0,001) LVIDd index (mm/(m^2)^0.5) 37±2 (p<0,001) LVIDs (mm) 38 ± 3 (p<0,001) LVIDs index (mm/(m2) 26 ± 2 (p=0,017) |
||
| Lin et al., 2016 | 87 | MIXED TYPE EXERCISE REGIMEN | LVM (g) (lineman) 265 ± 43 (p<0.001) LVM (g) (non-lineman) 217 ± 35 (p<0.001) LVM index (gm/m^2) (lineman) 109 ± 15 (p<0.001) LVM index (gm/m^2) (non-lineman) 101 ± 15 (p<0.001) |
PWT (mm) (lineman) 11.0 ± 1.2 (p<0.001) PWT (mm) (non lineman) 10.4 ± 1.1 (p=0,01) IVS thickness (mm) (lineman) 10.6 ± 1.2 (p<0.001) IVS thickness (mm) (non lineman) 9.8 ± 1.4 (p=0,004) Relative wall thickness (lineman) 0.40 ± 0.06 (p<0.001) |
|||
| Wasfy et al., 2014 | 71 | ENDURANCE | LVM (g) (runners) 159 +/- 20 LVM (g) (rowers) 209 +/- 26 (p<0,001) LVM index (g/m^2) (runners) 88 +/- 11 LVM index (g/m^2) (runners) 108 +/- 13 (p<0,001) |
Stroke volume (mL) (runners) 102 +/- 13 Stroke volume (mL) (rowers) 100 +/- 15 Stroke volume index (mL/m^2) (runners) 57 +/- 6 Stroke volume index (mL/m^2) (rowers) 52 +/- 8 (p<0,001) LVEDV (mL) (runners) 182 +- 21 LVEDV (mL) (rowers) 172 +- 25 (p<0,05) LVEDV index (mL/m2) (runners) 101 +- 10 LVEDV index (mL/m2) (rowers) 89 +/- 13 (p<0,001) |
Interventricular septum (mm) (runners) 7.7 +- 1 Interventricular septum (mm) (rowers) 9.4 +_ 1 (p<0,001) Posterior wall (mm) (runners) 8.4 +-1 Posterior wall (mm) (rowers) 9.7 +_1 (p<0,001) Wall thickness (average) (mm) (runners) 8.1 +- 1 Wall thickness (average) (mm) (rowers) 9.5 +-1 (p<0,001) Wall thickness/BSA (mm/m2) (runners) 4.5 +_ 1 Wall thickness/BSA (mm/m2) (rowers) 4.9 +- (p<0,001) Relative wall thickness (runners) 0.32 +_0.04 Relative wall thickness (rowers) 0.37 +_0.04 LVIDd (mm) (runners) 50.3 +/- 3 LVIDd (mm) (rowers) 52.4 +/- 3 (p<0,001) LVIDd/BSA (mm/m2) (runners) 27.9 +/- 2 LVIDd/BSA (mm/m2) (rowers) 27.1 +/- 2 (p<0,01) LVIDs (mm) (runners) 34.4 +/- 3 LVIDs (mm) (rowers) 35.5 +/- 2 (p<0,05) LVIDs/BSA (mm/m2) (runners)19.1 +/- 6,2 LVIDs/BSA (mm/m2) (rowers) 18.3 +/- 6,1 (p<0,001) |
RV basal diameter (mm) (runners) 45.1+- 6 RV basal diameter (mm) (rowers) 45.1 +- 4 RV diastolic area (cm2) (runners) 27.4+- 4 RV diastolic area (cm2) (rowers) 26.2 +-3 Diastolic area/BSA (cm2/m2) (runners) 14.7 +-3 Diastolic area/BSA (cm2/m2) (rowers) 13.5 +-2 RV systolic area (cm2) (runners) 15.7 +_3 RV systolic area (cm2) (rowers) 15.8 +_3 Systolic area/BSA (cm2/m2) (runners) 8.7 +_1 Systolic area/BSA (cm2/m2) (rowers) 8.1 +_2 p=NS |
|
| Weiner et al., 2015 | 12 | ENDURANCE | Stroke volume (mL) 138.1±20.4 (p<0.001) | LV longitudinal strain (%) −19.9±2.5 (p=0.04) |
Cardiac output (L/min) 7.0±1.1 (p=0.5) LV peak Sm (cm/s) 8.9±1.3 (p<0.001) |
||
| Finocchiaro et al., 2017 | 1,083 | ENDURANCE+ MIXED TYPE EXERCISE REGIMEN | LVM index (g/m2) 101+/-21 (p<0.001) |
LVEDD (mm) 54+/-5 (p<0.001) LVEDD/BSA (mm/m) 27.2+/-2.7 (p<0.001) LVEDD/BSA (mm/m) 27.2+/-2.7 (p<0.001) IVS (mm) 10.0+/-1.3 (p<0.001) Maximal LVWT >12 mm: 26 (40) (p<0.001) LVEDD (mm) 54+/-5 (p<0.001) IVS (mm) 10.0+/-1.3 (p<0.001) |
|||
| Giraldeau et al., 2015 | 315 | STRENGTH+ MIXED TYPE EXERCISE REGIMEN | LVM (g) 159 +/- 26 (p<0,001) LVM index (g/m^2) 77 +/- 10 (p<0,001) LVM index to LBM: 2,2 +/- 0,3 (p=0,63) |
Stroke volume (mL) 98 +/- 20 (p<0,001) LVEDV (ml) 193 +/- 33 (p<0,001) LVEDV index to BSA (ml/m^2) 94 +/- 1(p<0,001) LA volume (ml) 59,1 +/- 16,8 (p<0,001) LA volume index BSA: 28,6 +/- 7,5 (p= 0,54) LV mass to volume ration 0,83 +/- 0,11 (p=0,015) RA volume (mL) 56,1 +/- 15,3 (p<0,0001) RA volume index BSA 27,2 +/- 6,7 (p<0,02) |
LV global longitudinal strain (GLS) (%) -20,6 +/- 2,0 (p=0,02) LV systolic strain rate (%/s) -1,06 +/- 0,18 (p=0,67) LV diastolic early strain rate (%/s) 1,56 +/- 0,43 (p<0,01) RV global longitudinal strain (%) -24,7 +/- 2,6 (p=0,76) RV systolic strain rate (%/s) -1,5 +/- 0,3 (p=0,58) RV diastolic early strain rate (%/s) 1,78 +/- 0,60 (p=0,043) LA LG contraction(%) 10,8 +/- 3,8 (p=0,65) RA LG contraction (%) -15,2 +/- 4,2 (p=0,056) |
LVEF (%) 63 +/- 6 (p=0,0004) IVS (mm) 7.1 +/- 0.1 (p< 0.001) PW (mm) 8.2 +/- 1.5 (p< 0.001) LVID (mm) 52.2 +/- 4.1 (p< 0.001) |
RV area (cm^2) 29,7 +/- 3,9 (p<0,0001) RV dimensions basal (cm) 4,3 +/- 0,5 (p<0,0001) RV dimensions mid (cm) 3,6 +/- 0,5 (p<0,0001) RV longitudinal (cm) 9,1 +/- 0,9 (p<0,0001) |
| Agrebi et al., 2015 | 36 | MIXED TYPE EXERCISE REGIMEN | LVM (g) 238,73 +/- 29,57 LVM index (g/m^2) 119,66 +/- 12,67 |
LV end diastolic diameter (mm) 54,80 +/- 4,18 LV end systolic diameter (mm) 35,10 +/- 1,11 Posterior wall thickness (mm) 8,10 +/- 1,10 LV ejection time (msec) 279±38.14 |
RV diameter (mm) 18,65 +/- 4,74 | ||
| Roslan et al., 2023 | 100 | ENDURANCE+ MIXED TYPE EXERCISE REGIMEN | LVM index (g/m^2) 93,53 +/- 15,85 (p<0,001) | LVEDV index (mls/m^2) 67,36 +/- 14,75 (p<0,001) LVESV index (mls/m^2) 27,84 +/- 8,14 (p<0,001) |
GLS (%) 19,96 +/- 2,37 (p=0,16) LArS (%) 44,12 +/- 9,55 (p<0,001) LAcS (%) 32,53 +/- 6,45 (p=0,038) RVGLS (%) 21,04 +/- 2,77 (p=0,43) |
IVSd (cm) 0,95 +/- 0,12 (p=0,003) PWTd (cm) 0,91 +/- 0,11 (p<0,001) LVIDd (cm) 5,05 +/- 0,36 (p<0,001) IVSs (cm) 1,27 +/- 0,17 (p=0,473) PWTs (cm)1,42 +/- 0,16 (p=0,086) LVIDs (cm) 3,4 +/- 0,39 (p<0,001) RWT 0,36 +/-0,05 (p=0,705) |
|
| Huang et al., 2022 | 598 | ENDURANCE+ STRENGTH+ MIXED TYPE | LVM index (g/m^2) 97,4 +/- 21,0 (p<0,001) | LV stroke volume index (ml/m^2) 43,7 +/- 9,0 (p<0,001) LVEDV index (ml/m^2) 75,7 +/- 13,5 (p<0,001) LVESV index (mll/m^2) 32,0 +/- 6,6 (p<0,001) |
LVGLS (%) -22,4 +/- 2,2 (p<0,001) LVGCS (%) -28,4 +/- 4,5 (p=0,778) RVLS (%) -27,5 +/- 4,7 (p=0,358) |
IVSd (mm) 9,7 +/- 1,4 (p<0,001) LVPWd (mm) 9,9 +/- 1,5 (p<0,001) LVIDd index (mm/m^2) 26,9 +/- 2,6 (p;0,001) LVIDs index (mm/m^2) 16,7 +/- 1,7 (p<0,017) |
RVEDA index (cm^2/m^2) 12,9 +/- 2,4 (p<0,001) RVESA index (cm^2/m^2) 7,7 +/- 1,5 (p<0,001) |
Table 3.
Elite Athlete Echographic Findings Based on the Type of Sport.
| Title | Patients | Type of sport / Intensity | LEFT VENTRICULAR MASS+ INDEX | VOLUMES | STRAIN | LEFT VENTRICULAR ECHO FINDINGS | RIGHT VENTRICULAR ECHO FINDINGS |
|---|---|---|---|---|---|---|---|
| Eun et al., 2016 | 29 | MIXED TYPE EXERCISE REGIMEN | LV Mass (g) 216.7±21.9 (p=0,001) Mass index (g/height2) 110.2±9.4 (p=0,001) |
Stroke volume (mL) 89.3±15.4 (p=0,01) End-diastolic volume (mL/m2) 152.0±19.4 (p=0,001) End-systolic volume (mL/m2) 62.7±12.7 (p=0,001) |
Longitudinal strain: −17.6+1.8 (p=ns) | Ejection Fraction (%) 62.3±4.2 (p=ns) Interventricular septal thickness (mm) 10.4±0.8 (p=0,01) Posterior wall thickness (mm) 10.6±0.7 (p=0,001) End-diastolic diameter (mm) 53.1±0.7 (p=0,001) End-systolic diameter (mm) 36.5±1.8 (p=0,001) Relative wall thickness 4.0±0.3 (p=ns) Cardiac index (L/m2) 2.5±0.6 (p=ns) End-systolic WS (mmHg) 240.9±32.6 (p=0,001) End-systolic MWS (g/cm2) 21.5±1.5 (p=ns) |
RV Systolic Area (m2) 14.9±3.7 (p=0,005) RV Diastolic Area (m2) 26.1±7.1 (p=0,002) |
| Cooke et al., 2018 | 11 | ENDURANCE | LV mass (g) 181 +/- 27 (p= 0,001) LV mass index 95 +/- 12 (p=0,001) |
Stroke volume(ml) 87±14 (p< 0,01) Stroke volume index(ml m−2) 46±9 (p<0,01) End-diastolic volume(ml) 148±20 (p<= 0,01) End-diastolic volume index(ml m−2) 78±12 (p<= 0,05) End-systolic volume(ml)61±16 (p=0,0001) End-systolic volume index(ml m−2) 32±8 (p=0,01) |
Peak twist(degrees) 13.4±6.6 (p=0,0001) Peak torsion(degrees cm−1) 1.5±0.8 (p=0,0001) LV shortening(Δcm) 1.9±0.5 (p=0,0001) Sphericity index 1.7±0.1 (p=0,0001) End-diastolic LV length(cm) 9.3±0.7 (p=0,0001) Cardiac output(L min−1) 4.3±0.8 (p=0,0001) Cardiac index(L min−1 m−2) 2.3±0.5 (p=0,0001) |
||
| Major et al., 2014 | 52 | ENDURANACE | LV mass (g/m^3) 99,4 +/- 17,3 (p,0,001) | LV rel. Stroke Volume (ml/m^3) 36,6 +/- 8,9 (p<0,01) |
rel.LVLADd (mm/m) 63.8 ± 5.6 (p<0,05) |
rel.RVLADd (mm/m) 63.4 ± 6.3 (p<0,001) RVLA.Fr.Sh. (%) 25.9 ± 6.3 (p= NS) rel.RVSADd (mm/m) 27.3 ± 3.6 (p<0,001) RVSA.Fr.Sh. (%) 20.3 ± 8.4 (p= NS) RVAd (cm2 ) 28.0 ± 5.0 (p<0,001) RVFAC (%) 42.7 ± 6.8 (p= NS) |
|
| Miranda et al., 2014 | 40 | ENDURANCE+ STRENGTH | Left ventricular mass index (g m^-2) (endurance) 79,25 +/- 20,75 (p=0,01) Left ventricular mass index (g m^-2) (strength) 88,74 +/- 28,71 (p<0,01) |
Left ventricular ejection fraction (%) (endurance) 62,70 +/- 6,34 (p=0,628) Left ventricular ejection fraction (%) (strength) 61,35 +/- 4,69 (p=0,163) Septum thickness (mm) (endurance) 8,40 +/- 1,60 (p=0,041) Septum thickness (mm) (strength) 9,75 +/- 1,86 (p=0,01) Posterior wall thickness (mm) (endurance) 8,50 +/- 1,43 (p=0,01) Posterior wall thickness (mm) (strength) 10 +/- 2 (p=0,01) Left ventricular end diastolic dimension (mm) (endurance) 48,65 +/- 4,70 (p=0,055) Left ventricular end diastolic dimension (mm) (strength) 49,85 +/- 4,20 (p=0,01) Left ventricular end systolic dimension (mm) (endurance) 30,20 +/- 3,25 (p=0,042) Left ventricular end systolic dimension (mm) (strength) 31,25 +/- 3,66 (p=0,004) |
|||
| Agrebi et al., 2015 | 36 | MIXED TYPE EXERCISE REGIMEN | LV mass (g) 238,73 +/- 29,57 LV mass index (g/m^2) 119,66 +/- 12,67 |
LV end diastolic diameter (mm) 54,80 +/- 4,18 LV end systolic diameter (mm) 35,10 +/- 1,11 Posterior wall thickness (mm) 8,10 +/- 1,10 LV ejection time (msec) 279±38.14 |
RV diameter (mm) 18,65 +/- 4,74 | ||
| Forsythe et al., 2018 | 139 | MIXED TYPE EXERCISE REGIMEN | LV Mass (g) 191 ± 31 (p<0,001) LV Mass index (g/(m^2)^2.7) 38 ± 7 (p<0,001) LV mass index (g/m2) 87 ± 13 (p<0,001) |
Stroke Volume (ml) 92 ± 16 (p<0,001) LVEDV (ml) 157 ± 25 (p<0,001) LVEDV (ml/(m^2)^1.5) 48 ± 7 (p<0,001) LVESV (ml) 65 ± 13 (p<0,001) LVESV (ml/(m^2)^1.5) 20 ± 4 (p<0,001) |
Mean Wall Thickness (mm) 9 ± 1 (p<0,001) Maximum wall thickness (mm) 10 ± 1 (p<0,001) LVIDd (mm) 56 ± 4 (p<0,001) LVIDd index (mm/(m^2)^0.5) 37±2 (p<0,001) LVIDs (mm) 38 ± 3 (p<0,001) LVIDs index (mm/(m2) 26 ± 2 (p=0,017) |
||
| Lakatos et al., 2020 | 138 | MIXED TYPE EXERCISE REGIMEN | LV mass index (g/m2) 98.7 ± 15.6 (p<0.001) | Stroke volume index (mL/m2) 49.3 ± 7.8 (p<0.05) LVEDV index(mL/m2) 89.0 ± 13.1 (p<0.001) LVESV index (mL/m2) 39.7 ± 6.8 (p<0.001) RV Stroke volume index (ml/m2) 49.1 ± 6.6 (p<0.01) RVEDV index (ml/m2) 92.9 ± 13.7 (p<0.001) RVESVi index (ml/m2) 43.8 ± 9.0 (p<0.001) |
LV global longitudinal strain (%) −18.3 ± 1.8 (p<0.001) LV global contraction strain (%) −26.9 ± 2.4 (p<0.05) |
LVEF (%) 55.4 ± 3.5 (p<0.01) | RVEF (%) 53.1 ± 4.2 (p<0.001) |
| Lin et al., 2016 | 87 | MIXED TYPE EXERCISE REGIMEN | LV mass (g) (lineman) 265 ± 43 (p<0.001) LV mass (g) (non-lineman) 217 ± 35 (p<0.001) LV mass index (gm/m^2) (lineman) 109 ± 15 (p<0.001) LV mass index (gm/m^2) (non-lineman) 101 ± 15 (p<0.001) |
PWT (mm) (lineman) 11.0 ± 1.2 (p<0.001) PWT (mm) (non lineman) 10.4 ± 1.1 (p=0,01) IVS thickness (mm) (lineman) 10.6 ± 1.2 (p<0.001) IVS thickness (mm) (non lineman) 9.8 ± 1.4 (p=0,004) Relative wall thickness (lineman) 0.40 ± 0.06 (p<0.001) |
|||
| Hammami et al., 2021 | 20 | STRENGTH | LVEF(%) (WD) 59,33 ± 7,23 (ITF) 63,06 ± 7,40 LVEDD (ml) (WD) 124,63 ± 32,70 (ITF) 117,76 ± 9,65 LVESD (ml) (WD) 51,55 ± 12,29 (ITF) 50,57 ± 10,26 IST (mm) (WD) 7,07 ± 0,62 (ITF) 8,19 ± 1,37 (p<0,05) PWIVS (mm) (WD) 6,85 ± 0,62 (ITF) 7,43 ± 0,74 |
RVEDD (mm) (WD) 48,94 ± 4,35 (ITF) 47,59 ± 2,86 RVESD (mm) (WD) 28,38 ± 3,39 (ITF) 30,00 ± 2,07 RVL (mm) (WD) 65,35 ± 8,51 (ITF) 64,37 ± 3,44 |
|||
| Wasfy et al., 2014 | 71 | ENDURANCE | LV mass (g) (rowers) 209 +/- 26 (p<0,001) LV mass index (g/m^2) (runners) 88 +/- 11 LV mass index (g/m^2) (runners) 108 +/- 13 (p<0,001) |
Stroke volume (mL) (runners) 102 +/- 13 Stroke volume (mL) (rowers) 100 +/- 15 Stroke volume index (mL/m^2) (runners) 57 +/- 6 Stroke volume index (mL/m^2) (rowers) 52 +/- 8 (p<0,001) LV mass (g) (runners) 159 +/- 20 LVEDV (mL) (runners) 182 +- 21 LVEDV (mL) (rowers) 172 +- 25 (p<0,05) LVEDV index (mL/m2) (runners) 101 +- 10 LVEDV index (mL/m2) (rowers) 89 +/- 13 (p<0,001) |
Interventricular septum (mm) (runners) 7.7 +- 1 Interventricular septum (mm) (rowers) 9.4 +_ 1 (p<0,001) Posterior wall (mm) (runners) 8.4 +-1 Posterior wall (mm) (rowers) 9.7 +_1 (p<0,001) Wall thickness (average) (mm) (runners) 8.1 +- 1 Wall thickness (average) (mm) (rowers) 9.5 +-1 (p<0,001) Wall thickness/BSA (mm/m2) (runners) 4.5 +_ 1 Wall thickness/BSA (mm/m2) (rowers) 4.9 +- (p<0,001) Relative wall thickness (runners) 0.32 +_0.04 Relative wall thickness (rowers) 0.37 +_0.04 LVIDd (mm) (runners) 50.3 +/- 3 LVIDd (mm) (rowers) 52.4 +/- 3 (p<0,001) LVIDd/BSA (mm/m2) (runners) 27.9 +/- 2 LVIDd/BSA (mm/m2) (rowers) 27.1 +/- 2 (p<0,01) LVIDs (mm) (runners) 34.4 +/- 3 LVIDs (mm) (rowers) 35.5 +/- 2 (p<0,05) LVIDs/BSA (mm/m2) (runners)19.1 +/- 6,2 LVIDs/BSA (mm/m2) (rowers) 18.3 +/- 6,1 (p<0,001) |
RV basal diameter (mm) (runners) 45.1+- 6 RV basal diameter (mm) (rowers) 45.1 +- 4 RV diastolic area (cm2) (runners) 27.4+- 4 RV diastolic area (cm2) (rowers) 26.2 +-3 Diastolic area/BSA (cm2/m2) (runners) 14.7 +-3 Diastolic area/BSA (cm2/m2) (rowers) 13.5 +-2 RV systolic area (cm2) (runners) 15.7 +_3 RV systolic area (cm2) (rowers) 15.8 +_3 Systolic area/BSA (cm2/m2) (runners) 8.7 +_1 Systolic area/BSA (cm2/m2) (rowers) 8.1 +_2 p=NS |
|
| Weiner et al., 2015 | 12 | ENDURANCE | Stroke volume (mL) 138.1±20.4 (p<0.001) | LV longitudinal strain (%) −19.9±2.5 (p=0.04) | LV ejection fraction (%) 63.3±2.9 (p=0.23) Cardiac output (L/min) 7.0±1.1 (p=0.5) LV peak Sm (cm/s) 8.9±1.3 (p<0.001) |
Disclaimer/Publisher’s Note: The statements, opinions and data contained in all publications are solely those of the individual author(s) and contributor(s) and not of MDPI and/or the editor(s). MDPI and/or the editor(s) disclaim responsibility for any injury to people or property resulting from any ideas, methods, instructions or products referred to in the content. |
© 2024 by the authors. Licensee MDPI, Basel, Switzerland. This article is an open access article distributed under the terms and conditions of the Creative Commons Attribution (CC BY) license (http://creativecommons.org/licenses/by/4.0/).
Copyright: This open access article is published under a Creative Commons CC BY 4.0 license, which permit the free download, distribution, and reuse, provided that the author and preprint are cited in any reuse.


