Submitted:
16 May 2024
Posted:
16 May 2024
You are already at the latest version
Abstract
Keywords:
1. Introduction
2. Results and Discussion
2.1. Material Synthesis and Characterization
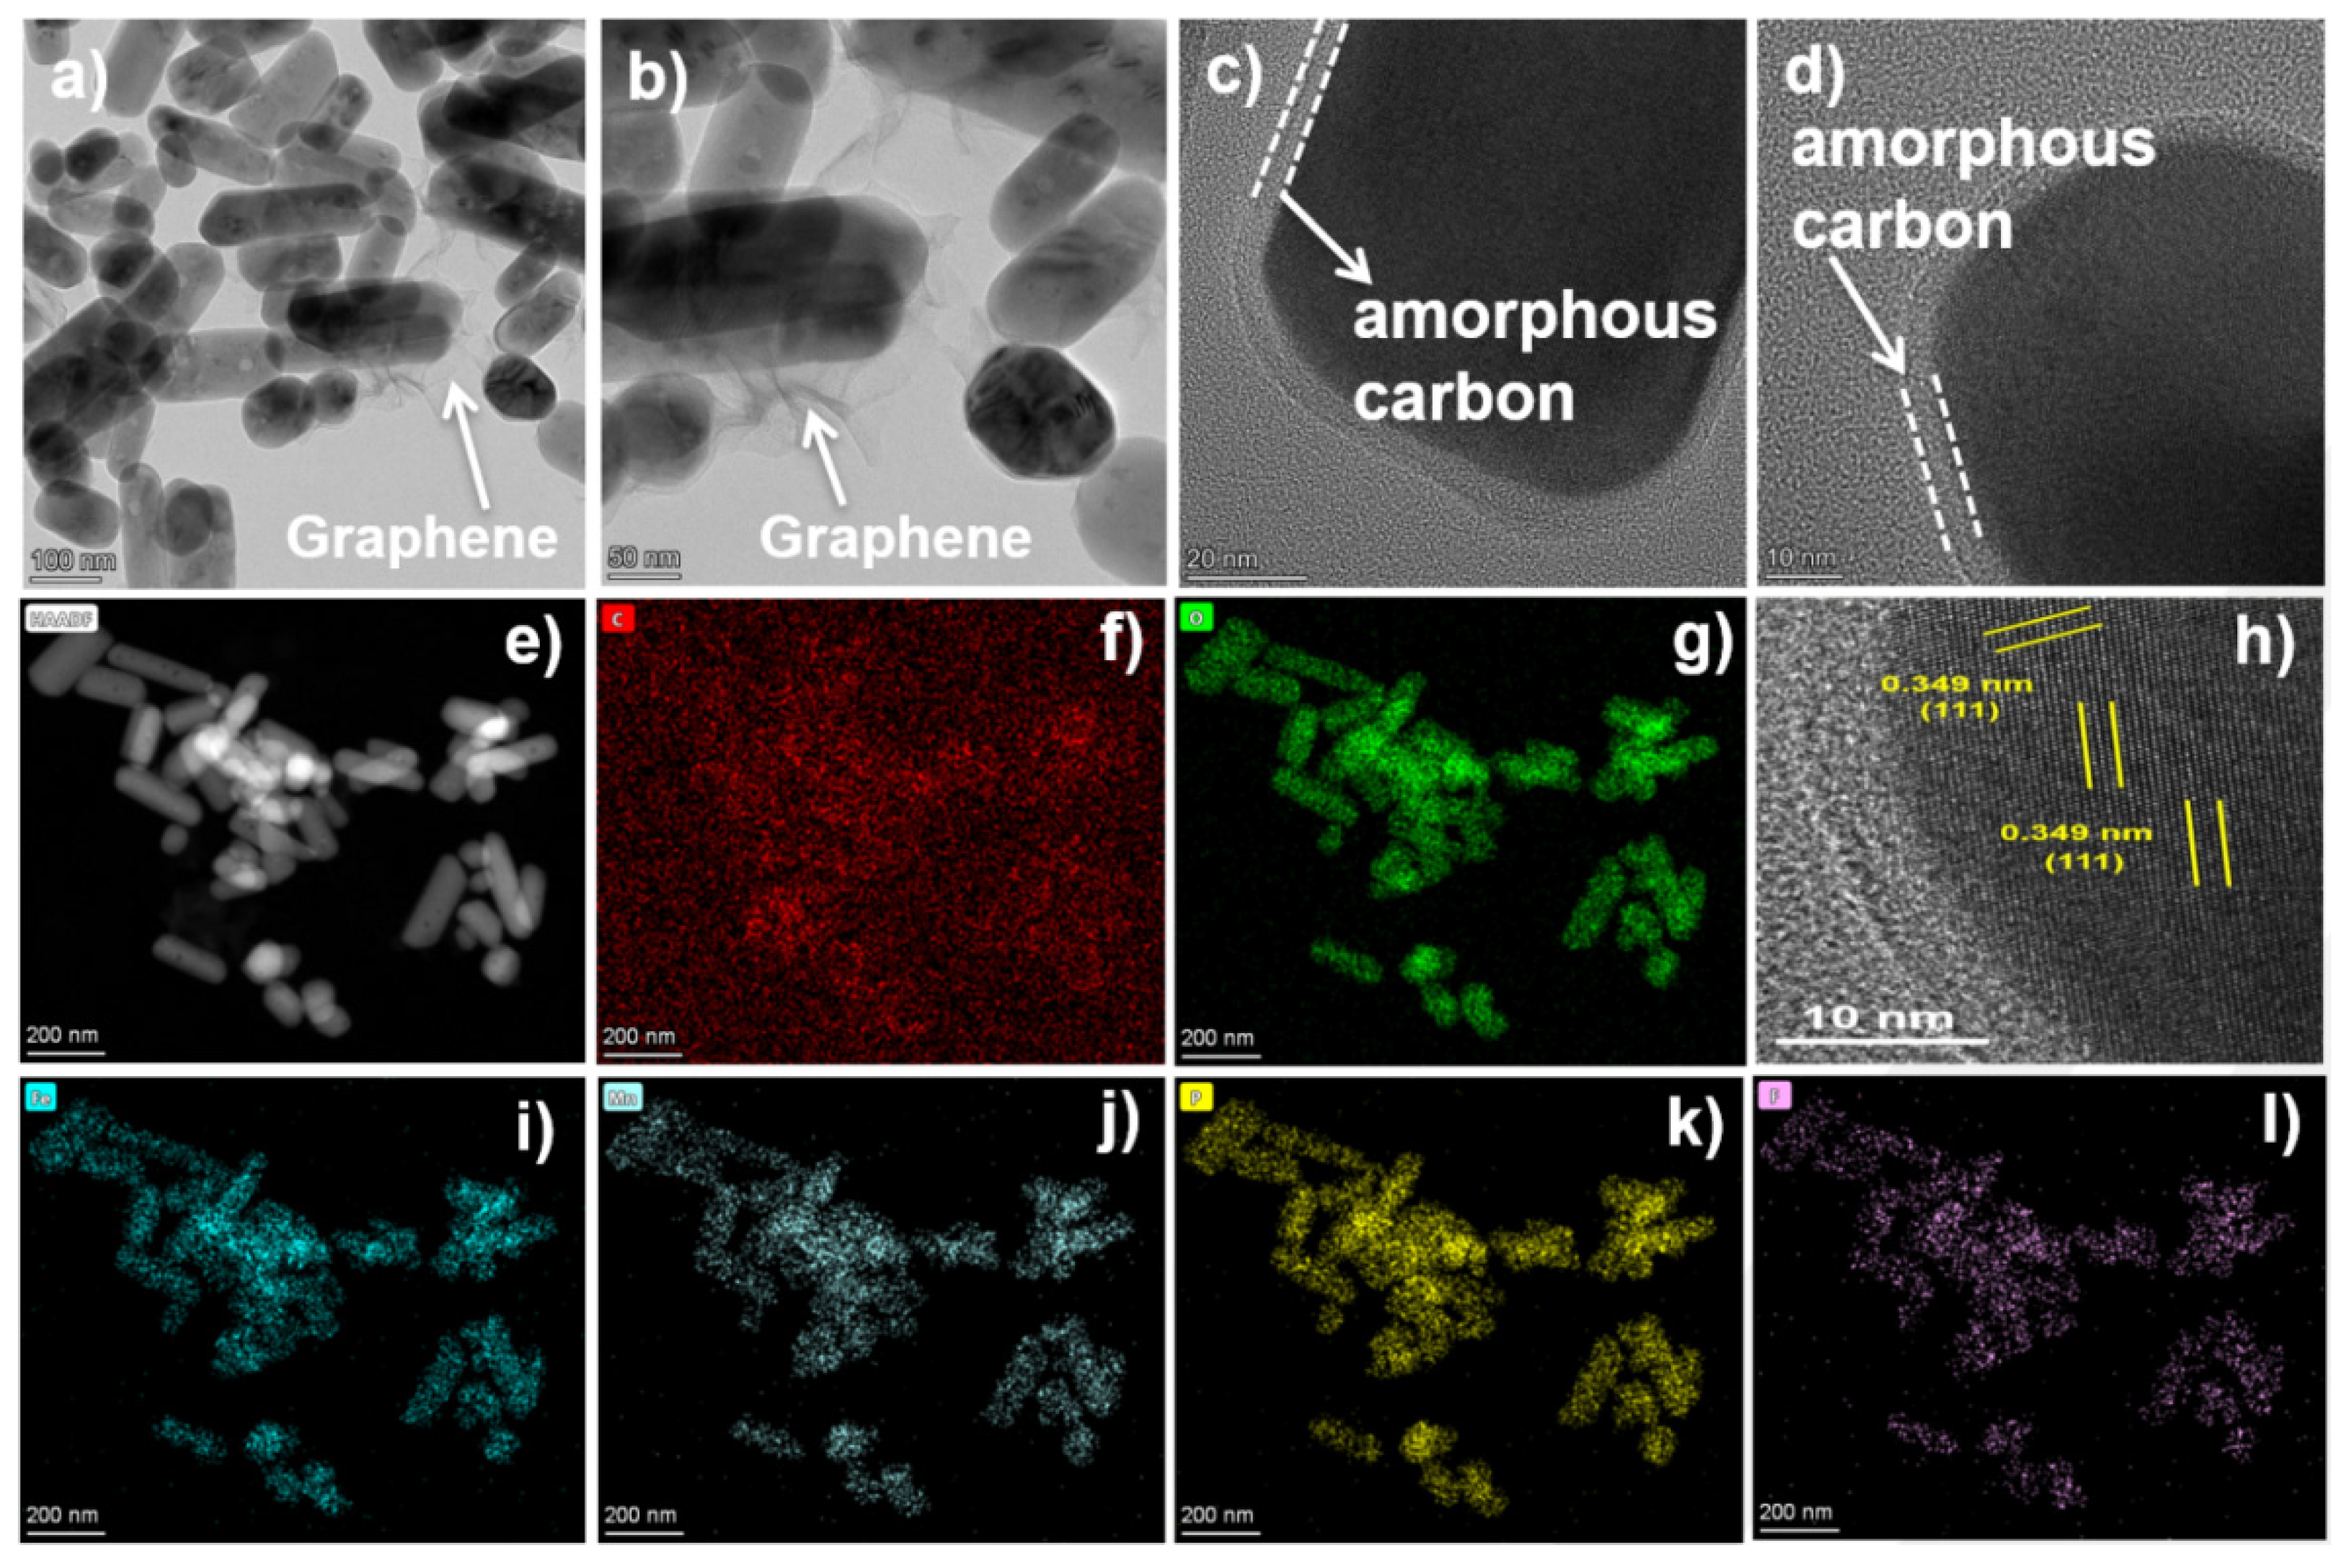
2.2. Electrochemical Performance and Analysis
2.3. Mechanism Analysis of the Electrocatalytic Activity Enhancement
3. Conclusions
4. Patents
Supplementary Materials
Author Contributions
Data Availability Statement
Acknowledgments
Conflicts of Interest
References
- Armand, M.; Tarascon, J.M. , Building better batteries. Nature 2008, 451, 652–657. [Google Scholar] [CrossRef]
- Li, F.; He, J.; Liu, J.; Wu, M.; Hou, Y.; Wang, H.; Qi, S.; Liu, Q.; Hu, J.; Ma, J. , Gradient Solid Electrolyte Interphase and Lithium-Ion Solvation Regulated by Bisfluoroacetamide for Stable Lithium Metal Batteries. Angewandte Chemie International Edition 2021, 60, 6600–6608. [Google Scholar] [CrossRef] [PubMed]
- Di Lecce, D.; Hassoun, J. , Lithium Transport Properties in LiMn1−αFeαPO4 Olivine Cathodes. The Journal of Physical Chemistry C 2015, 119, 20855–20863. [Google Scholar] [CrossRef]
- A. K. Padhi, K.S.N., J.B. Goodenough. Goodenough, Phospho-olivines as Positive-Electrode Materials for Rechargeable Lithium Batteries. Journal of The Electrochemical Society 1997, 144, 1188. [Google Scholar] [CrossRef]
- Guo, H.; Liu, R.; Li, W.; Gu, H.; Cao, J.; Gong, D.; Liang, G. , Site Selection of Niobium-Doped LiMn0.6Fe0.4PO4 and Effect on Electrochemical Properties. Journal of The Electrochemical Society 2023, 170, 030542. [Google Scholar] [CrossRef]
- Gao, C.; Zhou, J.; Liu, G.; Wang, L. , Synthesis of F-doped LiFePO4/C Cathode Materials for High Performance Lithium-ion Batteries using Co-Precipitation Method with Hydrofluoric Acid Source. Journal of Alloys and Compounds 2017, 727, 501–513. [Google Scholar] [CrossRef]
- Gangaraju, V.; Shastri, M.; Shetty, K.; Marilingaiah, N.R.; Anantharaju, K.S.; Shivaramu, P.D.; Rangappa, D. , In-situ Preparation of Silk-Cocoon Derived Carbon and LiFePO4 Nanocomposite as Cathode Material for Li-ion Battery. Ceramics International 2022, 48, 35657–35665. [Google Scholar] [CrossRef]
- Liu, Y.; Gu, J.; Zhang, J.; Wang, J.; Nie, N.; Fu, Y.; Li, W.; Yu, F. , Controllable Synthesis of Nano-Sized LiFePO4/C via a High Shear Mixer Facilitated Hydrothermal Method for High Rate Li-ion Batteries. Electrochimica Acta 2015, 173, 448–457. [Google Scholar] [CrossRef]
- Zhang, W.J. Structure and Performance of LiFePO4 Cathode Materials: A Review. Journal of Power Sources 2011, 196, 2962–2970. [Google Scholar] [CrossRef]
- Jiang, F.; Qu, K.; Wang, M.S.; Chen, J.C.; Liu, Y.; Xu, H.; Huang, Y.; Li, J.Y.; Gao, P.; Zheng, J.M.; Chen, M.Y.; Li, X. , Atomic Scale Insight into the Fundamental Mechanism of Mn Doped LiFePO4. Sustainable Energy & Fuels 2020, 4, 2741–2751. [Google Scholar]
- Luo, T.; Zeng, T.T.; Chen, S.L.; Li, R.; Fan, R.Z.; Chen, H.; Han, S.C.; Fan, C.L. , Structure, Performance, Morphology and Component Transformation Mechanism of LiMn0·8Fe0·2PO4/C Nanocrystal with Excellent Stability. Journal of Alloys and Compounds 2020, 834, 155143. [Google Scholar] [CrossRef]
- Oh, S.M.; Myung, S.T.; Park, J.B.; Scrosati, B.; Amine, K.; Sun, Y.K. , Double-Structured LiMn0.85Fe0.15PO4 Coordinated with LiFePO4 for Rechargeable Lithium Batteries. Angewandte Chemie International Edition 2012, 51, 1853–1856. [Google Scholar] [CrossRef] [PubMed]
- Yang, J.; Tan, R.; Li, D.; Ma, J.M.; Duan, X.C. , Ionic Liquid Assisted Electrospinning of Porous LiFe0.4Mn0.6PO4/CNFs as Free-Standing Cathodes with a Pseudocapacitive Contribution for High-Performance Lithium-Ion Batteries. Chemistry – A European Journal 2020, 26, 5341–5346. [Google Scholar] [CrossRef] [PubMed]
- Deng, Y.; Yang, C.; Zou, K.; Qin, X.; Zhao, Z.; Chen, G. , Recent Advances of Mn-Rich LiFe1-yMnyPO4 (0.5 ≤ y < 1.0) Cathode Materials for High Energy Density Lithium Ion Batteries. Advanced Energy Materials 2017, 7, 1601958. [Google Scholar]
- Xiong, J.W.; Wang, Y.Z.; Wang, Y.Y.; Zhang, J.X. , PVP-Assisted Solvothermal Synthesis of LiMn0.8Fe0.2PO4/C Nanorods as Cathode Material for Lithium Ion Batteries. Ceramics International 2016, 42, 9018–9024. [Google Scholar] [CrossRef]
- Peng, Z.D.; Zhang, B.C.; Hu, G.R.; Du, K.; Xie, X.M.; Wu, K.P.; Wu, J.H.; Gong, Y.F.; Shu, Y.M.; Cao, Y.B. , Green and Efficient Synthesis of Micro-Nano LiMn0.8Fe0.2PO4/C Composite with High-Rate Performance for Li-ion Battery. Electrochimica Acta 2021, 387, 138456. [Google Scholar] [CrossRef]
- Yang, S.C.; Zhou, C.C.; Wang, Q.; Chen, B.B.; Zhao, Y.; Guo, B.; Zhang, Z.J.; Gao, X.L.; Chowdhury, R.; Wang, H.Z.; Lai, C.; Brandon, N.P.; Wu, B.; Liu, X.H. , Highly Aligned Ultra-Thick Gel-Based Cathodes Unlocking Ultra-High Energy Density Batteries. Energy & Environmental Materials 2022, 5, 1332–1339. [Google Scholar]
- Wang, Y.; Niu, P.; Li, J.Z.; Wang, S.L.; Li, L. , Recent Progress of Phosphorus Composite Anodes for Sodium/Potassium Ion Batteries. Energy Storage Materials 2021, 34, 436–460. [Google Scholar] [CrossRef]
- Hu, H.; Li, H.; Lei, Y.; Liu, J.; Liu, X.; Wang, R.; Peng, J.; Wang, X. , Mg-doped LiMn0.8Fe0.2PO4/C Nano-Plate as a High-Performance Cathode Material for Lithium-ion Batteries. Journal of Energy Storage 2023, 73, 109006. [Google Scholar] [CrossRef]
- Wu, R.; Drozdov, I.K.; Eltinge, S.; Zahl, P.; Ismail-Beigi, S.; Bozovic, I.; Gozar, A. , Large-Area Single-Crystal Sheets of Borophene on Cu(111) Surfaces. Nature Nanotechnology 2019, 14, 44–49. [Google Scholar] [CrossRef]
- Karimzadeh, S.; Safaei, B.; Huang, W.; Jen, T.C. , Theoretical Investigation on Niobium Doped LiFePO4 Cathode Material for High Performance Lithium-ion Batteries. Journal of Energy Storage 2023, 67, 107572. [Google Scholar] [CrossRef]
- Sahoo, P.K.; Memaran, S.; Xin, Y.; Balicas, L.; Gutierrez, H.R. , One-pot growth of two-dimensional lateral heterostructures via sequential edge-epitaxy. Nature 2018, 553, 63–67. [Google Scholar] [CrossRef] [PubMed]
- Yang, L.; Deng, W.; Xu, W.; Tian, Y.; Wang, A.; Wang, B.; Zou, G.; Hou, H.; Deng, W.; Ji, X. , Olivine LiMnxFe1−xPO4 Cathode Materials for Lithium Ion Batteries: Restricted Factors of Rate Performances. Journal of Materials Chemistry A 2021, 9, 14214–14232. [Google Scholar] [CrossRef]
- Luo, C.; Jiang, Y.; Zhang, X.X.; Ouyang, C.Y.; Niu, X.B.; Wang, L.P. , Misfit Strains Inducing Voltage Decay in LiMnyFe1−yPO4/C. Journal of Energy Chemistry 2022, 68, 206–212. [Google Scholar] [CrossRef]
- Song, Y.; Liu, Y.; Ou, X. , Heat-Rate-Controlled Hydrothermal Crystallization of High-Performance LiMn0.7Fe0.3PO4 Cathode Material for Lithium-ion Batteries. Ceramics International 2020, 46, 5069–5076. [Google Scholar] [CrossRef]
- Hidalgo, J.; An, Y.; Yehorova, D.; Li, R.; Breternitz, J.; Perini, C.A.R.; Hoell, A.; Boix, P.P.; Schorr, S.; Kretchmer, J.S.; Correa-Baena, J.-P. , Solvent and A-Site Cation Control Preferred Crystallographic Orientation in Bromine-Based Perovskite Thin Films. Chemistry of Materials 2023, 35, 4181–4191. [Google Scholar] [CrossRef] [PubMed]
- Yan, X.; Sun, D.; Wang, Y.; Zhang, Z.; Yan, W.; Jiang, J.; Ma, F.; Liu, J.; Jin, Y.; Kanamura, K. , Enhanced Electrochemical Performance of LiMn0.75Fe0.25PO4 Nanoplates from Multiple Interface Modification by Using Fluorine-Doped Carbon Coating. ACS Sustainable Chemistry & Engineering 2017, 5, 4637–4644. [Google Scholar]
- Ming, L.; Zhang, B.; Cao, Y.; Zhang, J.F.; Wang, C.H.; Wang, X.W.; Li, H. , Effect of Nb and F Co-doping on Li1.2Mn0.54Ni0.13Co0.13O2 Cathode Material for High-Performance Lithium-Ion Batteries. Frontiers in Chemistry 2018, 6, 76. [Google Scholar] [CrossRef]
- Wang, X.; Feng, Z.; Huang, J.; Deng, W.; Li, X.; Zhang, H.; Wen, Z. , Graphene-Decorated Carbon-Coated LiFePO4 Nanospheres as a High-Performance Cathode Material for Lithium-Ion Batteries. Carbon 2018, 127, 149–157. [Google Scholar] [CrossRef]
- Ding, D.; Maeyoshi, Y.; Kubota, M.; Wakasugi, J.; Kanamura, K.; Abe, H. , Highly Improved Performances of LiMn0.7Fe0.3PO4 Cathode with in Situ Electrochemically Reduced Graphene Oxide. Journal of Alloys and Compounds 2019, 793, 627–634. [Google Scholar] [CrossRef]
- Ding, D.; Maeyoshi, Y.; Kubota, M.; Wakasugi, J.; Kanamura, K.; Abe, H. , Holey Reduced Graphene Oxide/Carbon Nanotube/LiMn0.7Fe0.3PO4 Composite Cathode for High-Performance Lithium Batteries. Journal of Power Sources 2020, 449, 227553. [Google Scholar] [CrossRef]
- Ma, F.; Zhang, X.; He, P.; Zhang, X.; Wang, P.; Zhou, H. , Synthesis of Hierarchical and Bridging Carbon-Coated LiMn0.9Fe0.1PO4 Nanostructure as Cathode Material with Improved Performance for Lithium Ion Battery. Journal of Power Sources 2017, 359, 408–414. [Google Scholar] [CrossRef]
- Wang, B.; Liu, A.; Abdulla, W.A.; Wang, D.; Zhao, X.S. , Desired Crystal oriented LiFePO4 Nanoplatelets in Situ Anchored on a Graphene Cross-Linked Conductive Network for Fast Lithium Storage. Nanoscale 2015, 7, 8819–8828. [Google Scholar] [CrossRef]
- Wei, H.L.; Tan, A.D.; Hu, S.Z.; Piao, J.H.; Fu, Z.Y. , Efficient Spinel Iron-Cobalt Oxide/Nitrogen-Doped Ordered Mesoporous Carbon Catalyst for Rechargeable Zinc-Air Batteries. Chinese Journal of Catalysis 2021, 42, 1451–1458. [Google Scholar] [CrossRef]
- Lv, X.Y.; Huang, Q.Y.; Wu, Z.; Su, J.; Long, Y.F.; Wen, Y.X. , Li0.995Nb0.005Mn0.85Fe0.15PO4/C as a High-Performance Cathode Material for Lithium-Ion Batteries. Journal of Solid State Electrochemistry 2017, 21, 1499–1507. [Google Scholar] [CrossRef]
- Zhang, K.; Lee, J.T.; Li, P.; Kang, B.; Kim, J.H.; Yi, G.-R.; Park, J.H. , Conformal Coating Strategy Comprising N-doped Carbon and Conventional Graphene for Achieving Ultrahigh Power and Cyclability of LiFePO4. Nano Letters 2015, 15, 6756–6763. [Google Scholar] [CrossRef] [PubMed]
- Xiao, P.; Cai, Y.Y.; Chen, X.P.; Sheng, Z.M.; Chang, C.K. , Improved Electrochemical Performance of LiFe0.4Mn0.6PO4/C with Cr3+ Doping. RSC Advances 2017, 7, 31558–31566. [Google Scholar] [CrossRef]
- Liu, Z.; Wang, K.; Li, Y.; Yuan, S.; Huang, G.; Li, X.; Li, N. , Activation Engineering on Metallic 1T-MoS2 by Constructing In-Plane Heterostructure for Efficient Hydrogen Generation. Applied Catalysis B: Environmental 2022, 300, 120696. [Google Scholar] [CrossRef]
- Ding, D.; Maeyoshi, Y.; Kubota, M.; Wakasugi, J.; Kanamura, K.; Abe, H. , A Facile Way To Synthesize Carbon-Coated LiMn0.7Fe0.3PO4/Reduced Graphene Oxide Sandwich-Structured Composite for Lithium-Ion Batteries. ACS Applied Energy Materials 2019, 2, 1727–1733. [Google Scholar] [CrossRef]
- Huang, Y.; Ding, R.; Ying, D.; Shi, W.; Huang, Y.; Tan, C.; Sun, X.; Gao, P.; Liu, E. , Engineering doping-vacancy double defects and insights into the conversion mechanisms of an Mn–O–F ultrafine nanowire anode for enhanced Li/Na-ion storage and hybrid capacitors. Nanoscale Advances 2019, 1, 4669–4678. [Google Scholar] [CrossRef]
- Qin, Q.; Deng, N.; Wang, L.; Zhang, L.; Jia, Y.; Dai, Z.; Liu, Y.; Kang, W.; Cheng, B. , Novel Flexible Mn-Based Carbon Nanofiber Films as Interlayers for Stable Lithium-Metal Battery. Chemical Engineering Journal 2019, 360, 900–911. [Google Scholar] [CrossRef]
- Zhang, K.; Cao, J.; Tian, S.; Guo, H.; Liu, R.; Ren, X.; Wen, L.; Liang, G. , The Prepared and Electrochemical Property of Mg-Doped LiMn0.6Fe0.4PO4/C as Cathode Materials for Lithium-Ion Batteries. Ionics 2021, 27, 4629–4637. [Google Scholar] [CrossRef]
- Kou, L.Q.; Chen, F.J.; Tao, F.; Dong, Y.; Chen, L. , High Rate Capability and Cycle Performance of Ce-Doped LiMnPO4/C via an Efficient Solvothermal Synthesis in Water/Diethylene Glycol System. Electrochimica Acta 2015, 173, 721–727. [Google Scholar] [CrossRef]
- Li, N.; Xu, Z.; Wang, P.; Zhang, Z.; Hong, B.; Li, J.; Lai, Y. , High-Rate Lithium-Sulfur Batteries Enabled via Vanadium Nitride Nanoparticle/3D Porous Graphene through Regulating the Polysulfides Transformation. Chemical Engineering Journal 2020, 398, 125432. [Google Scholar] [CrossRef]
- Sun, Z.H.; Wu, X.L.; Peng, Z.Q.; Wang, J.W.; Gan, S.; Zhang, Y.W.; Han, D.X.; Niu, L. , Compactly Coupled Nitrogen-Doped Carbon Nanosheets/Molybdenum Phosphide Nanocrystal Hollow Nanospheres as Polysulfide Reservoirs for High-Performance Lithium–Sulfur Chemistry. Small 2019, 15, 1902491. [Google Scholar] [CrossRef]

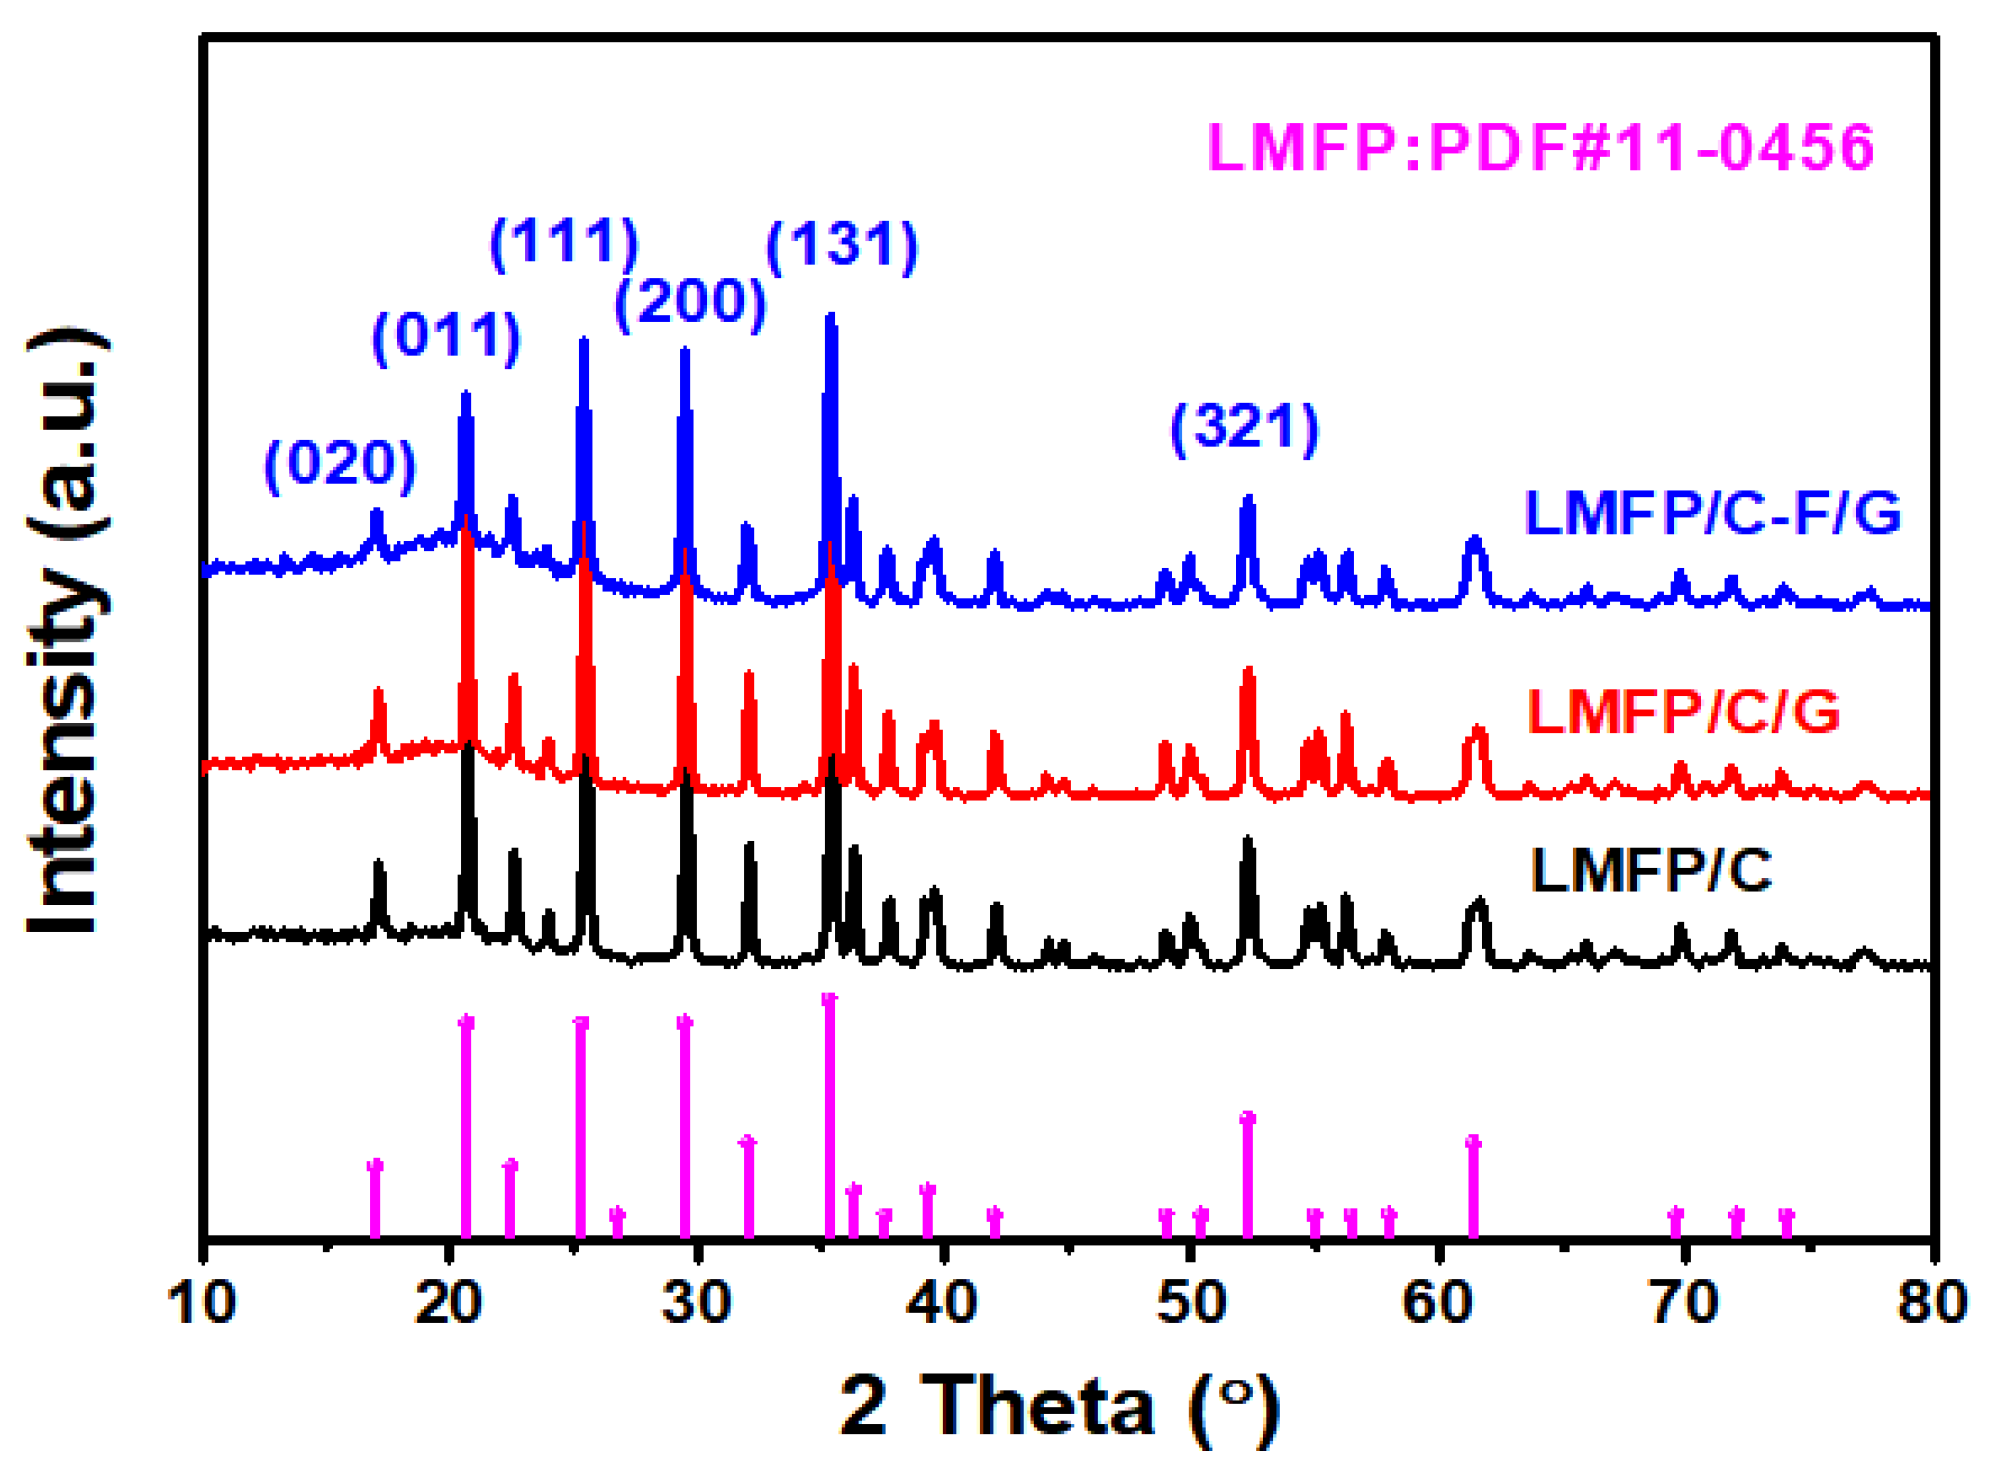
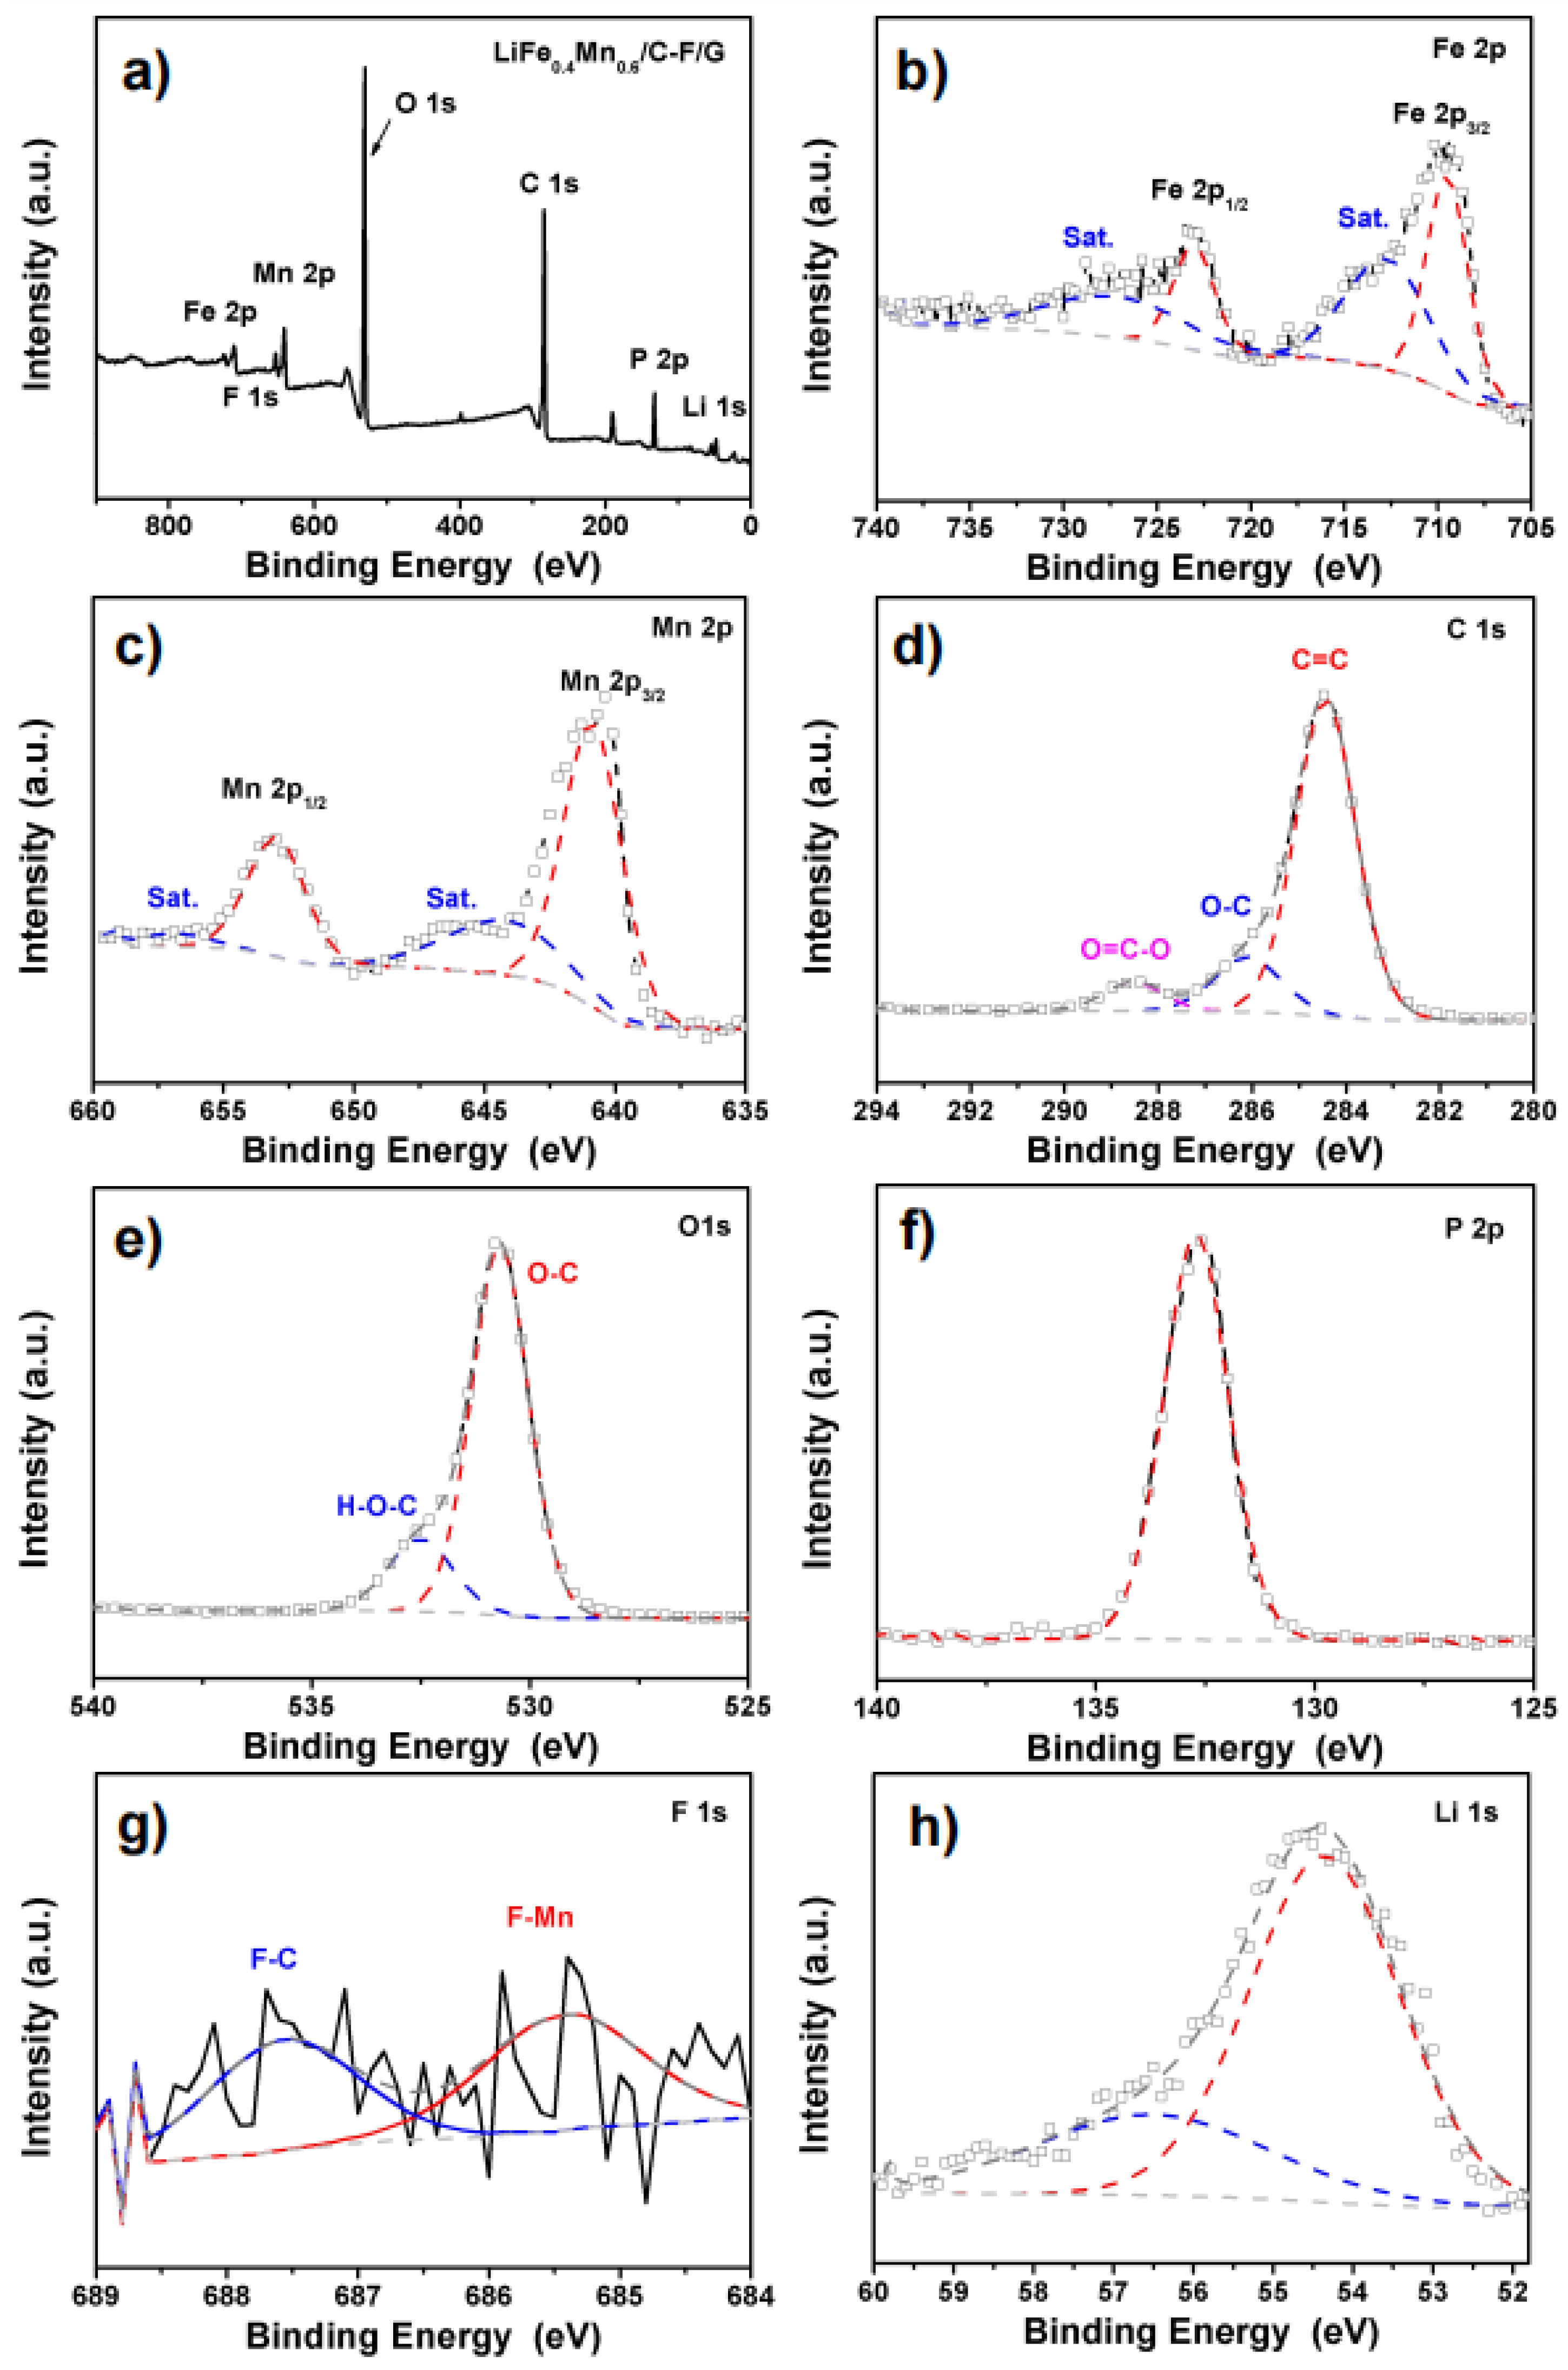
| Sample | C | O | F | Li | Fe | Mn | P | Fe:Mn |
|---|---|---|---|---|---|---|---|---|
| LMFP/C | 29.55 | 25.83 | -- | 33.92 | 1.53 | 2.42 | 6.75 | 4:6 |
| LMFP/C/G | 49.25 | 22.00 | -- | 50.88 | 1.02 | 1.60 | 4.19 | 4:6 |
| LMFP/C-F/G | 39.38 | 22.40 | 0.28 | 29.33 | 1.28 | 1.94 | 5.38 | 4:6 |
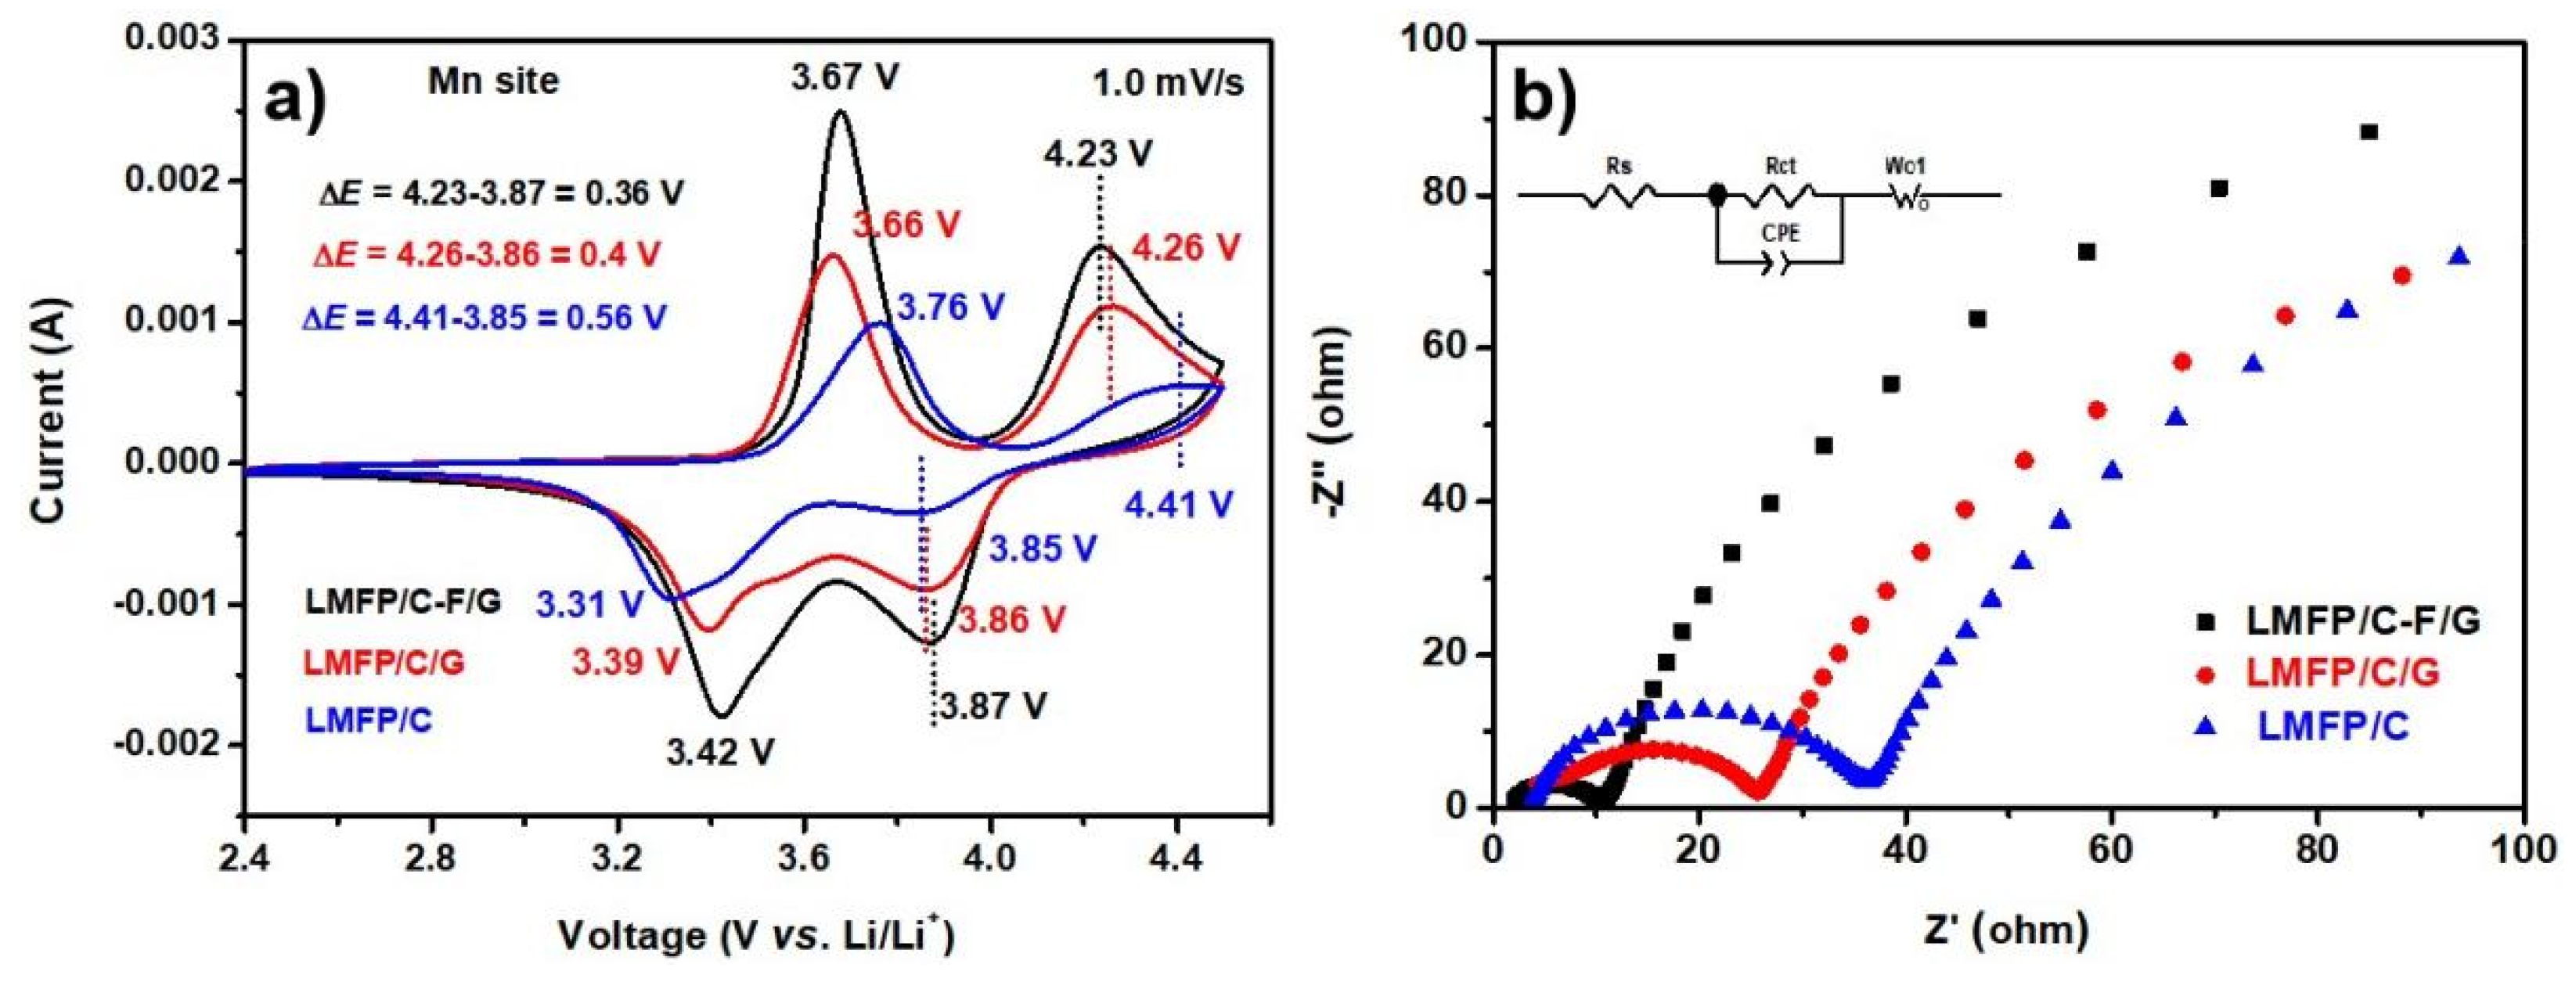
| Sample | Fe3+ | Fe2+ | Mn3+ | Mn2+ | ∆EFe | ∆EMn |
|---|---|---|---|---|---|---|
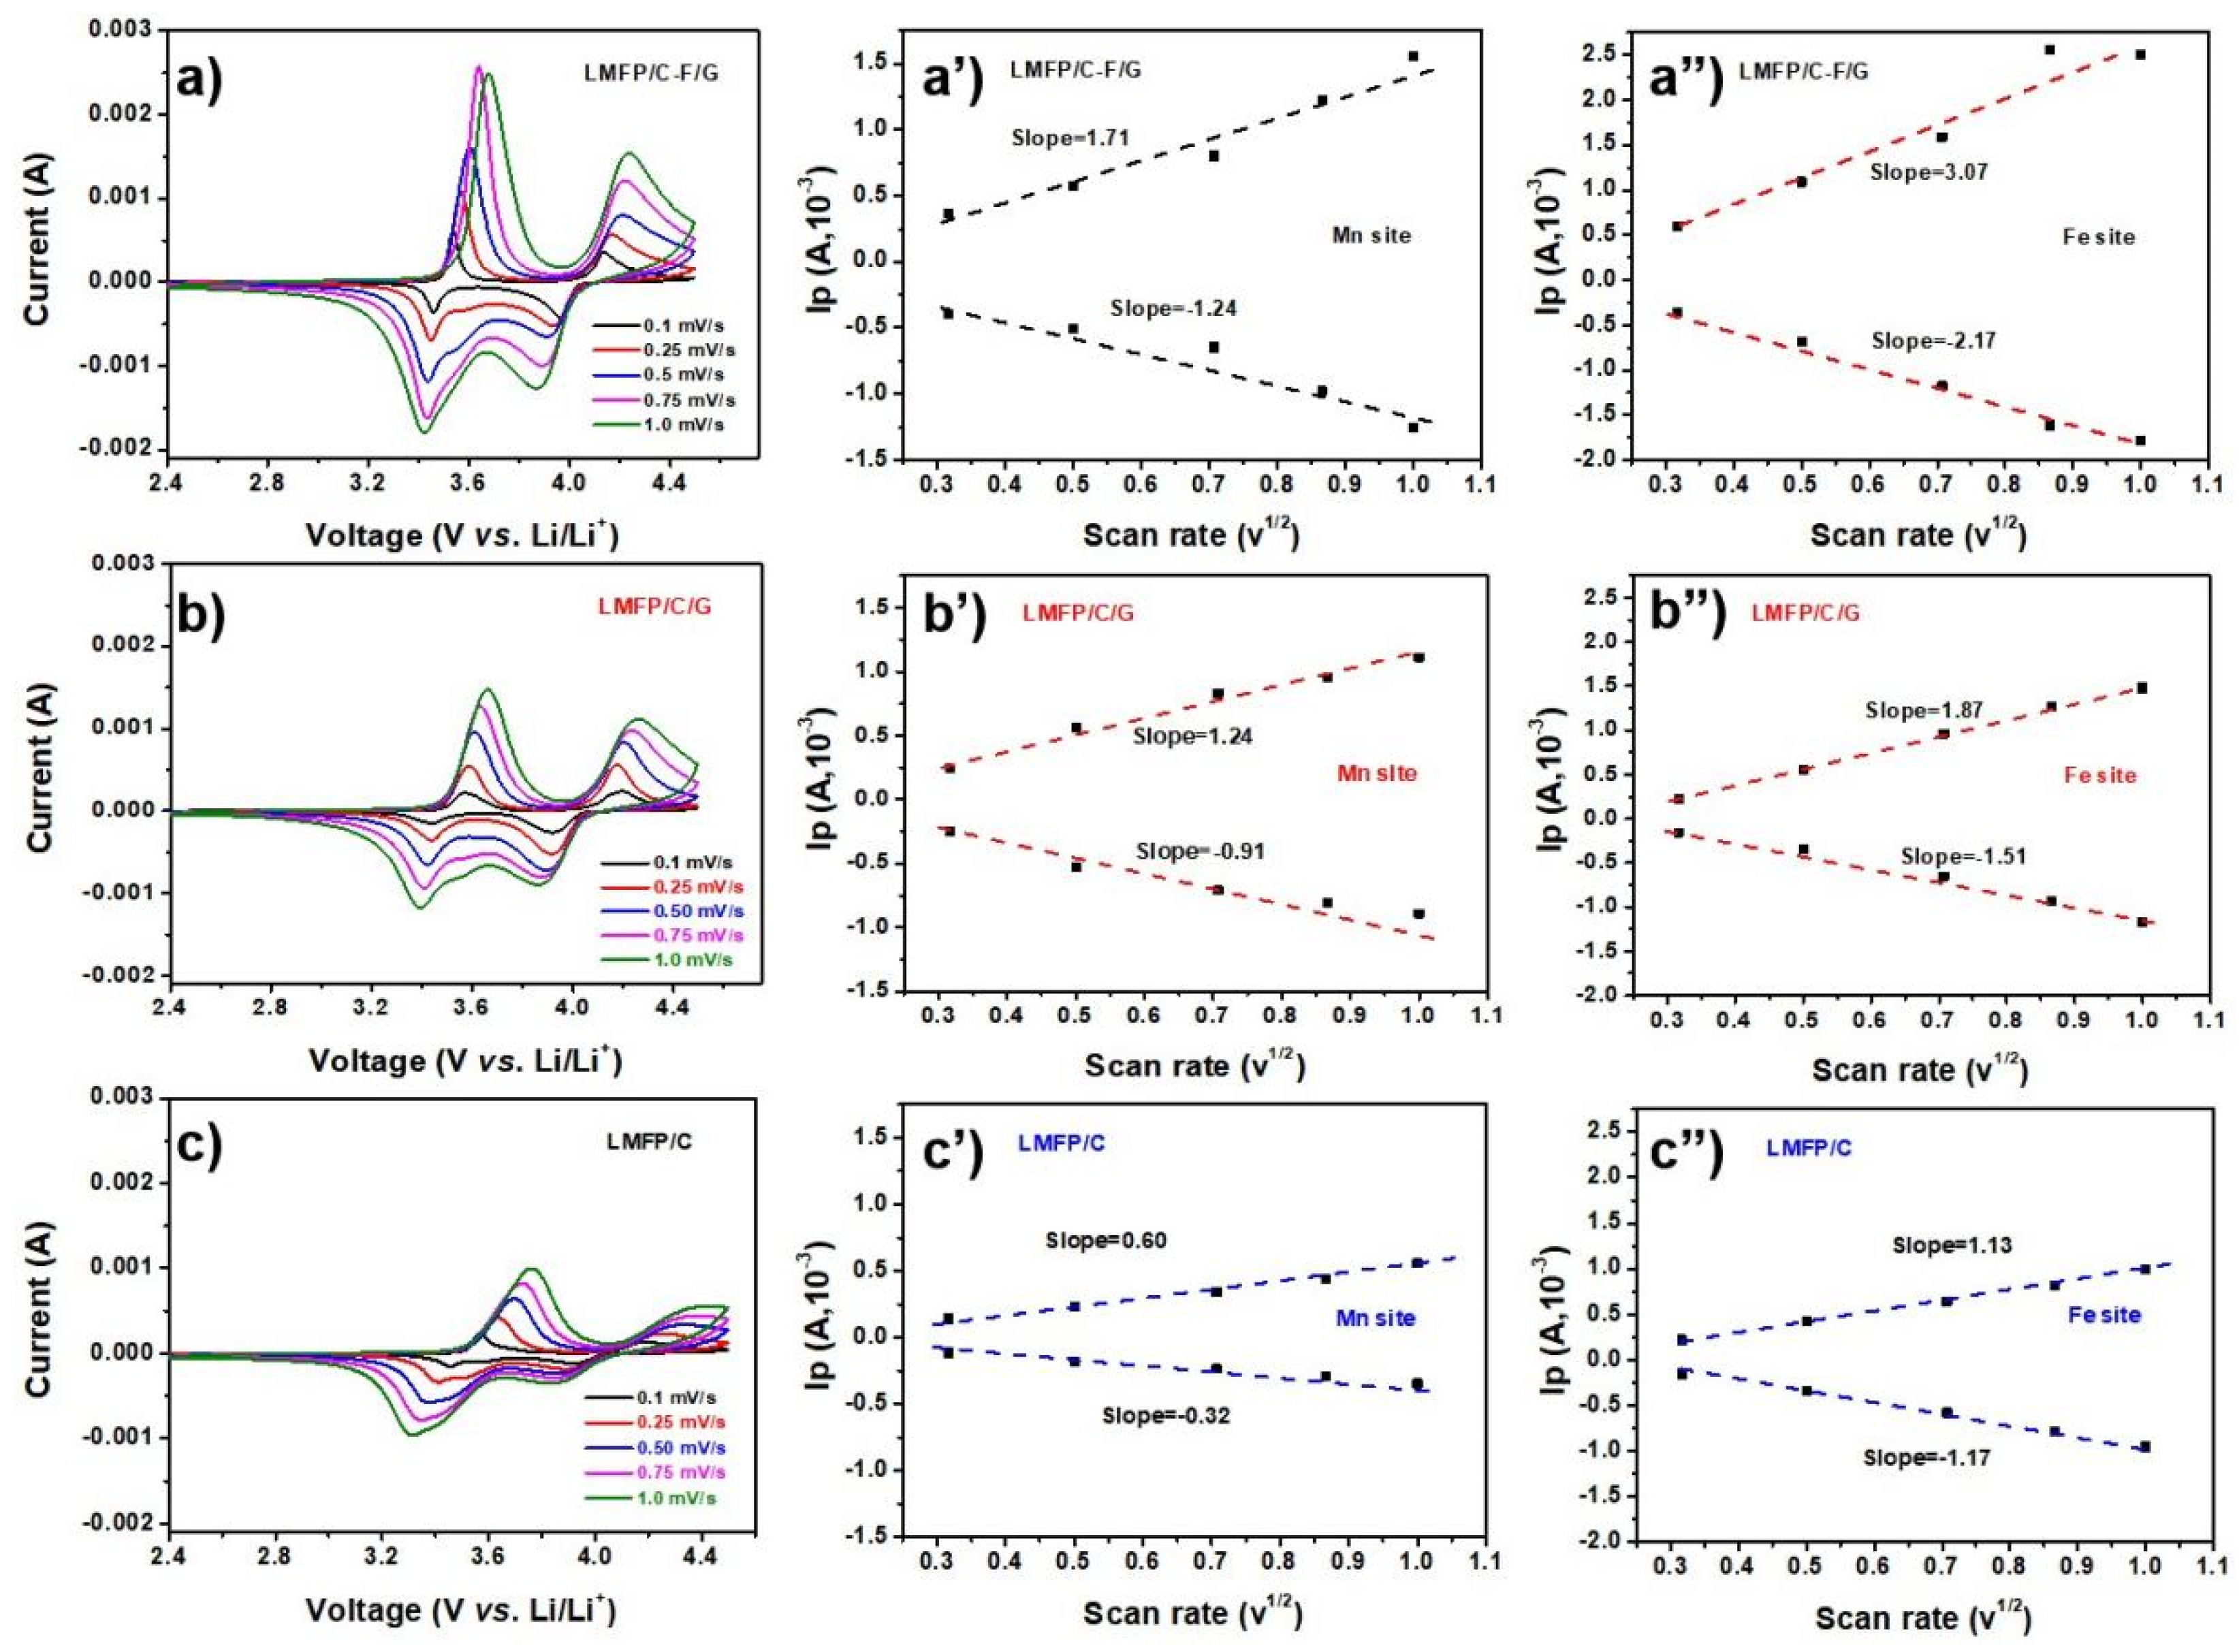
| LMFP/C | 3.76 | 3.31 | 4.41 | 3.85 | 0.45 | 0.56 |
| LMFP/C/G | 3.66 | 3.39 | 4.26 | 3.86 | 0.27 | 0.40 |
| LMFP/C-F/G | 3.67 | 3.42 | 4.23 | 3.87 | 0.25 | 0.36 |
Disclaimer/Publisher’s Note: The statements, opinions and data contained in all publications are solely those of the individual author(s) and contributor(s) and not of MDPI and/or the editor(s). MDPI and/or the editor(s) disclaim responsibility for any injury to people or property resulting from any ideas, methods, instructions or products referred to in the content. |
© 2024 by the authors. Licensee MDPI, Basel, Switzerland. This article is an open access article distributed under the terms and conditions of the Creative Commons Attribution (CC BY) license (http://creativecommons.org/licenses/by/4.0/).


