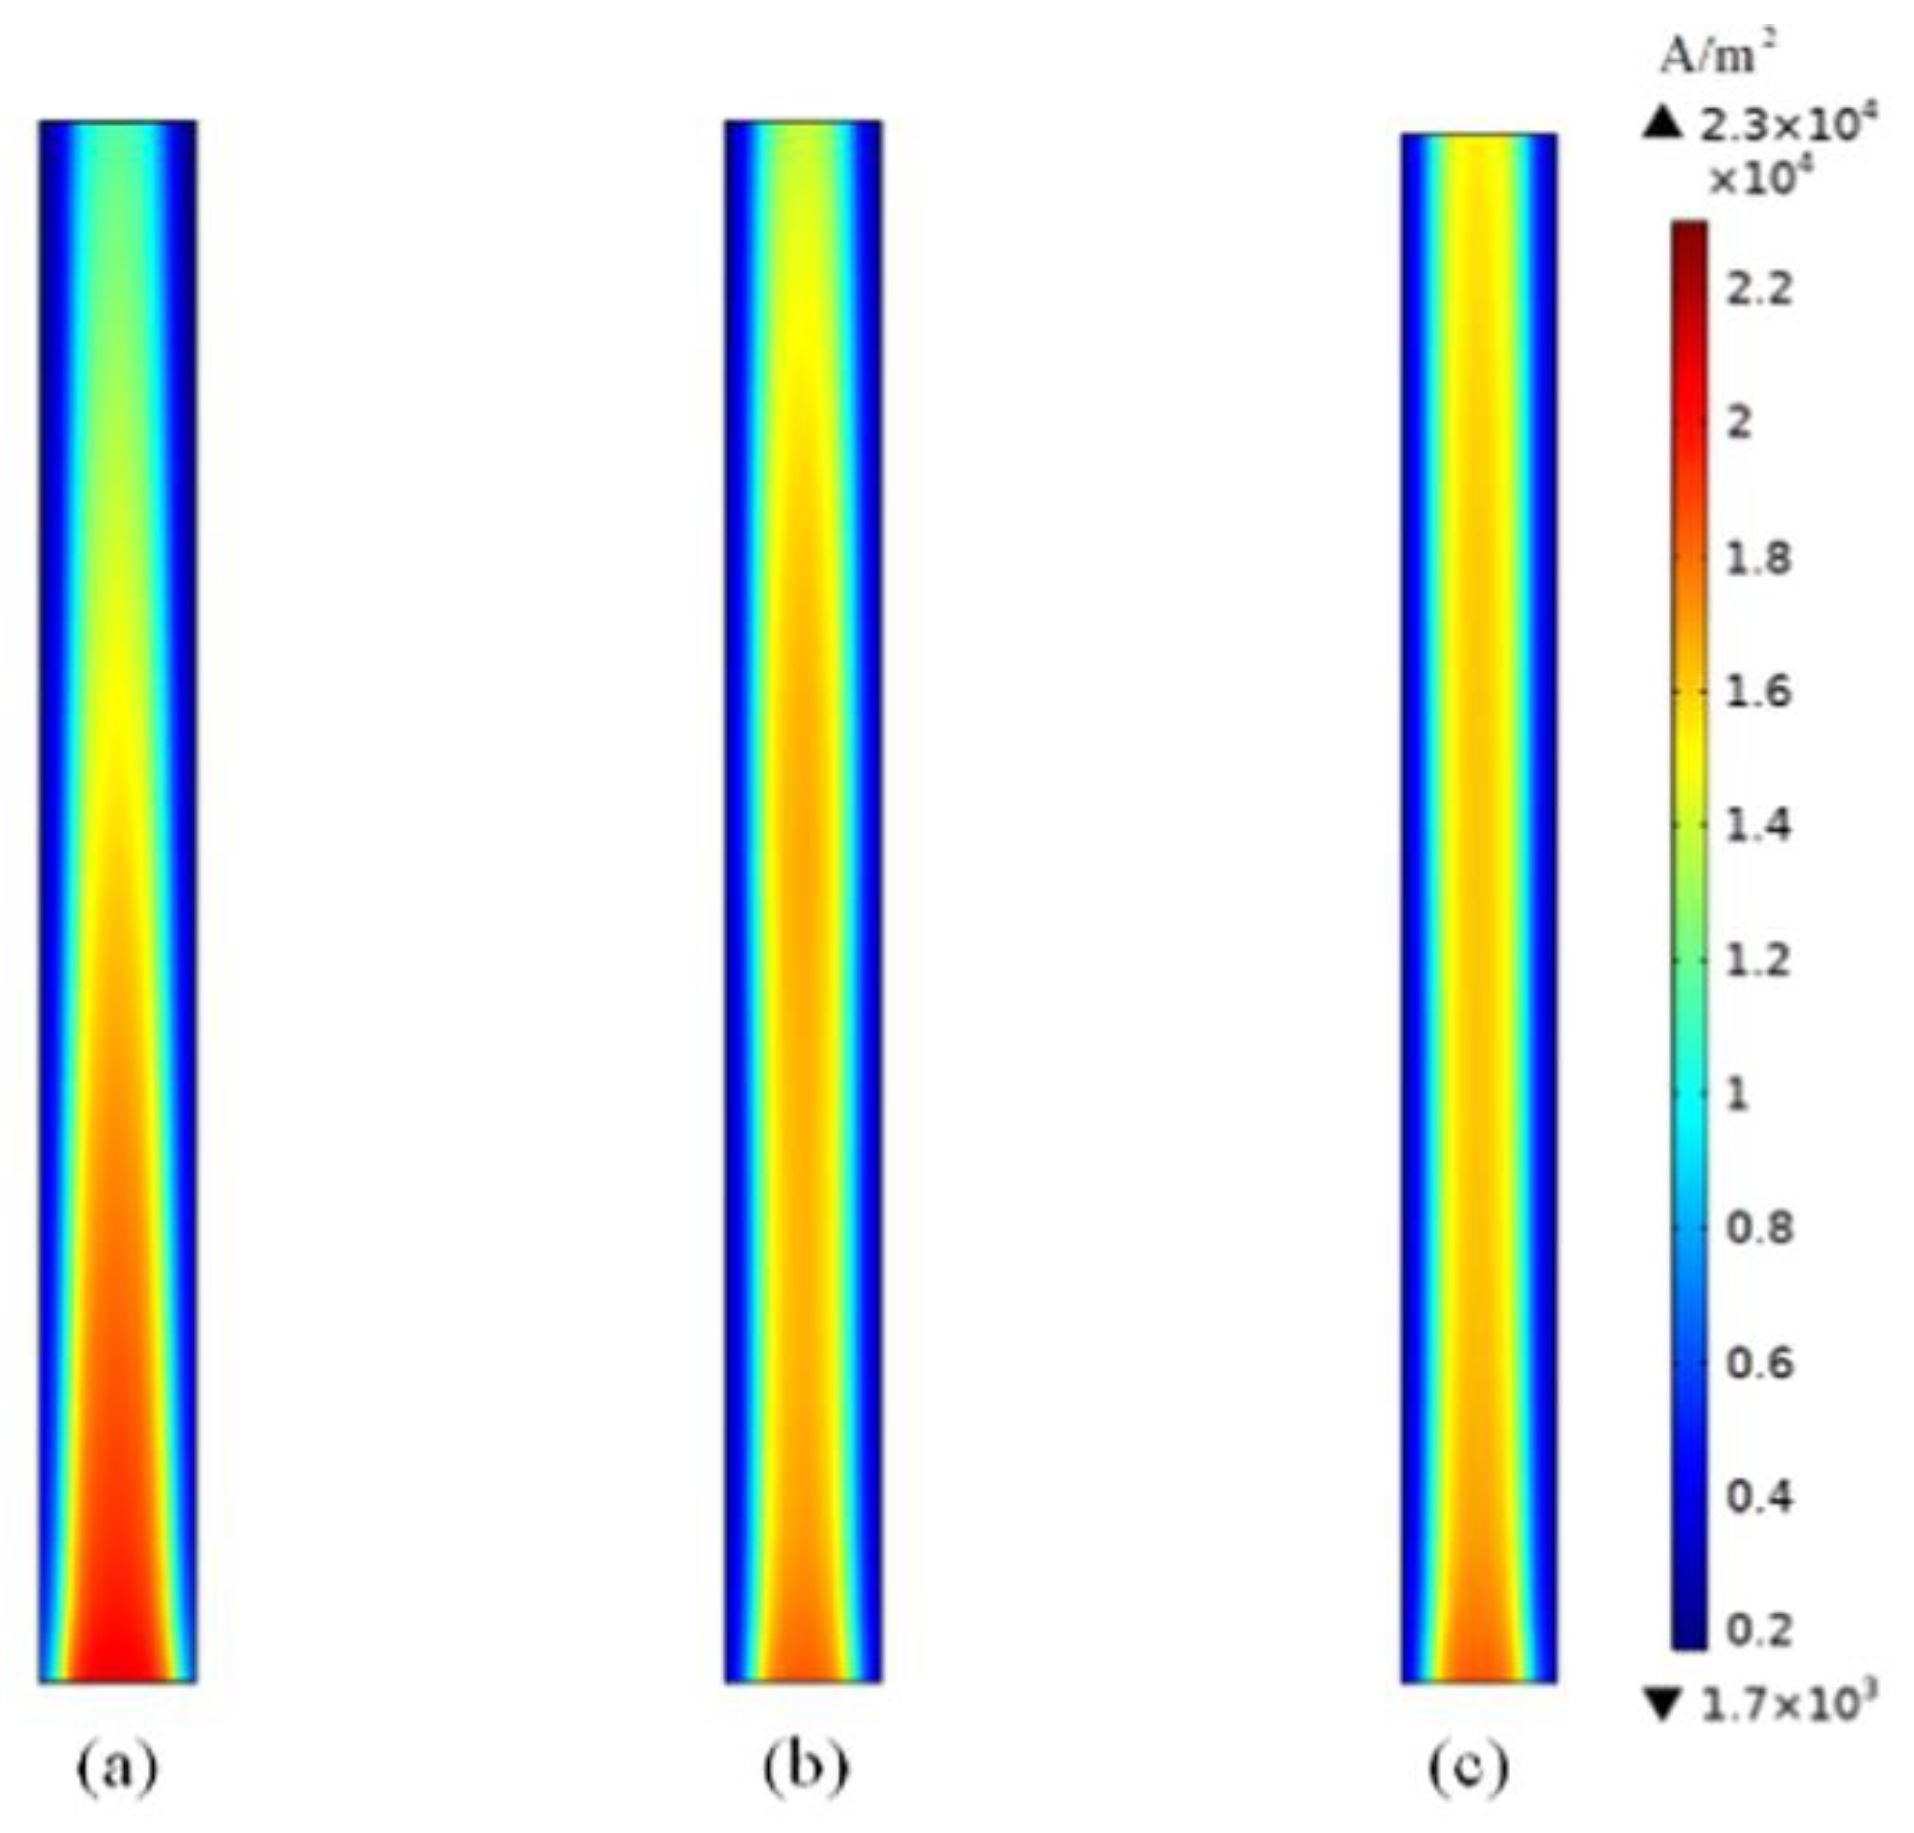
1. Introduction
In the beginning, it is important to define a Fuel Cell (FC). Gao et al. (2017) defined FC as it is an electrochemical device that converts chemical energy into Direct Current (DC) electricity. It looks like a photovoltaic (PV) system. Unlike batteries, FCs operate continuously as long as the gas reactants are supplied (Awin and Dukhan, 2019). FCs are becoming remarkable energy in the future due to zero-carbon dioxide (CO2) or low pollutant emissions at the point of use. Conventional fuels based on fossil fuel could be depleted while the FCs have an unlimited electricity generator as long as the hydrogen and oxygen are supplied. There are many types of FCs that can be classified or distinguished by the electrolyte into six categories. These types of FCs are Proton Exchange Membrane Fuel Cells (PEMFCs), Solid Oxide Fuel Cells (SOFCs), Alkaline Fuel Cells (AFCs), Molten Carbonate Fuel Cells (MCFCs), Direct Methanol Fuel Cells (DMFCs), and Phosphoric Acid Fuel Cells (PAFCs) (Raj et al., 2017). Also, more details of the listed six important FCs can be found in ref. (Fox and Roberts, 1962, Larminie et al., 2003, O'hayre et al., 2016). The core of FCs is that a single fuel cell consists of three basic elements that are the electrodes, the electrolyte, and the Bipolar Plates (BPP). We focus on the PEMFC as it is a new energy technology that plays a critical role in achieving market viability. The PEMFC has high power density, zero CO2 emissions, high conversion efficiency from chemical energy to electrical energy and compatibility to fit inside vehicles. However, the degradation, high cost and efficiency make the PEMFC challenging. But with uniform distribution of fuel in PEMFC, we can improve the performance and reduce the cost. The PEMFCs are donated by Proton Exchange Membranes (PEM). The PEMFCs are one of the most popular FCs. Because it has used a range of fuels from hydrogen to ethanol to biomass-derived materials. These all are used as fuel options that are either fed into the FCs directly or reformed to extract pure hydrogen. The PEMFC system is one of the most promising power sources for automotive and stationary applications (Kakati and Deka, 2007). Due to the advantages of PEMFCs that PEMFCs have high power density, modular shape, convenient fuel, long life span, and lower operating temperature and also attempts to allow PEMFCs to operate at an intermediate temperature between 100-140 ℃ to improve the performance by vaporising water and preventing bulking of channels, therefore, it is used in the transport sector. Not only these but as we stated the PEMFCs have several options of fuels that are varied from hydrogen to ethanol to biomass-derived materials (Spiegel, 2011), hence the PEMFCs could be the best option for compatibility to fit inside vehicles and eventually contribute to advancing and commercial the PEMFC to vehicles. PEMFCs are constructed of the anode and cathode that contain a catalyst layer (Membrane Electrode Assemblies (MEA)) between them that helps to speed the electrochemical procedures in a single PEM fuel cell. On the other hand, the multiple FCs are connected together to create a fuel cell stack that consists of a number of single PEM fuel cells where every single PEM fuel cell has a number of components that are listed as follows (Spiegel, 2011, O'hayre et al., 2016):
PEM,
catalyst layer (CL)and Gas Diffusion Layer (GDL),
Flow Field Plates (FFP)/ BPP,
gaskets
End plates.
There are several designs of flow plates such as serpentine, parallel, parallel serpentine, interdigitated, mesh (grid, super parallel) spiral-serpentine and so on. Besides these, there are types of design BPPs such as leaf designer or lung designer. Meanwhile, the membrane plate should remain hydrated to maintain proton conductivity. Also, the BPPs help to transport electrons which can be achieved by maximizing the contact region between the BPPs and GDL. The BPP material should have lower resistance than the materials of GDL. The better designing of BPPs is accomplished by minimising the pressure drop from the inlet to the outlet [
31,
32]. We need to drop the pressure to be lower. There are many designs of the BPPs and there are different configurations for BPPs. Every configuration has its advantages and disadvantages. The BPPs are designed to give an adequate amount of hydrogen and oxygen to GDL and catalyst surfaces while reducing the pressure drop. In some small-scale PEMFCs, the diffusion process is used instead of using the flow field plate to distribute hydrogen. However, the water blockage in the humidified anode and the hydrogen is not rate limiting, which reduces the effectiveness of PEM fuel cells. Therefore, any kind of channel such as serpentine, interdigital, paralleled and other types are used to overcome the above limitations. In a single serpentine flow field design, there may be some issues such as pressure losses due to the long flow path and the water could be accumulated during an extended period. Hence, high pressure is required to remove this accumulated water. Furthermore, the operation of PEM FCs at intermediate temperatures could prevent the blockage of water. However, in multiple serpentines of BPPs design, the pressure drop is limited, and this technique prevents stagnant area formations at the surface of the cathode. The rest advantages and disadvantages of parallel and interdigital can be found in ref. (Spiegel, 2007, Spiegel, 2011, Fuel Cell Store, 2017). Furthermore, according to Arvay et al. (2013), the single-channel design minimises the flooding in channels but it creates friction which requires more pressure to drive the gas from the inlet to the outlet channels. While parallel, serpentine, and hybrids do not have this issue which requires pressure. However, the key problem with the explanation is that hot spots and cold spots may have occurred in the parallel design of the BPPs which makes the parallel channel is the lowest overall performance for PEMFCs. The other type of design is the mesh flow field plate, which is a special case of paralleled design where parts are open between the parallel paths creating a grid (Catlin, 2010, Yu, 2016, Fuel Cell Store, 2017). The metal meshy or foaming has been presented as in ref. (Kumar and Reddy, 2003, Tang et al., 2010, Arvay et al., 2013). This option was selected for this paper. The last design is an interdigitated design that does not have a continuous pass. Recent studies by Kahraman and Coban (2020) used tree leaves that obey Murray’s law to achieve homogeneous gas distribution. S++ Simulation Services with a current scan of the board were used to determine the homogeneity of the current distribution. It scans the current at 10×10 = 100 small segments for 50 cm
2 MEAs. Sauermoser et al. (2020) showed that lung-shaped designs for BPPs and other design procedures could be a possible solution. The companies do not reveal the techniques for designing BPPs. Most companies are in competition and the cost is behind this issue. We found evidence that there is a structure for the leaf and lung that provided a good performance of PEMFCs (Kloess et al., 2009, Kahraman and Coban, 2020). However, it is still difficult to design or describe the procedure and dimension of the framework.We have tested the effect of 100, 75, 50 and 25 RH of PEMFCs in experimental work. We focus on MF as an alternative approach for channels or BBPs. The porosity of MF is a very important element. The porosity can be defined as the ratio of the pore volume to the total volume of materials (Zhang et al., 2023). Several studies focus on the porosity of GDL (Zhang et al., 2023, Rahimian et al., 2018, Huang et al., 2021). They show that GDL porosity can improve the performance of PEMFCs. One study by Liu et al found that gas diffusion becomes more uniform when the gradient of porosity distribution along the thickness direction is small (Liu et al., 2022). It was also reported by Zhang et al. (2023). The model of PEMFCs was developed in one dimension (1D) by several authors in ref. (Yang et al., 2021, Lim et al., 2020, Chu et al., 2003). The same results were reported by Chen et al. (2008). However, the three-dimensional (3D) model of PEMFCs was investigated by authors in ref. (Zhang et al., 2023, Zhang et al., 2016, Huang et al., 2021, Turkmen and Celik, 2018). However, all these studies focus on GDL. As far as I know and to the best of my knowledge there is no published paper so far on the MF of PEMFCs as alternative techniques for channels.
This paper considers the MF and its porosity of PEMFCs. The model of PEMFCs was first developed then the four cases to study the impact of the distribution of fuel or the reactant were investigated. Lastly, the porosity of MF was investigated. The optimisation of the porosity of MF was achieved in this research. At 0.6 value of porosity, the model of PEMFCs gave better performance which is considered the optimal value of porosity of metal foam. It is the most suitable porosity value for distribution for the metal foam. It can mitigate the challenge in PEMFCs.
3. System Configuration
The numerical model of PEMFCs using Ansys Fluent with an active small area was developed to study the impact of uniform distribution of fuel. Also, the effect of the porosity of MF on the performance of PEMFCs is an important parameter within the PEMFC structure. Because this will be responsible for the distribution of fuel or reactant inside the PEMFCs. The FC is an important technology, particularly the PEMFCs that can be used in versatile applications such as portable and stationary applications, space exploration missions, backup power units and power sources for automobiles (Giacoppo et al., 2019). The PEMFCs are the most popular type of FCs in current decay due to the advantages of the PEMFCs that work at low temperatures and high-power density. Also, the PEMFCs have a low startup time compared to SOFCs. Not only this but there is some evidence to integrate the SOFCs and PEMFCs to combine the advantages of both SOFCs and PEMFCs. The SOFCs accept diverse fuels (natural gas) while PEMFCs only accept hydrogen (Wu et al., 2019). We proposed a modelling system for PEMFCs based on the analysis and discussed several articles. This idea is very easy to implement, and we can use Ansys Fluent easily, where we can select inlet channels and outlet channels.
3.1. Configuration of the Model of PEMFCs and Scope
The problem is that the distribution of fuel/reactant is not even (uniform distribution), some areas that do not have H
2 or O
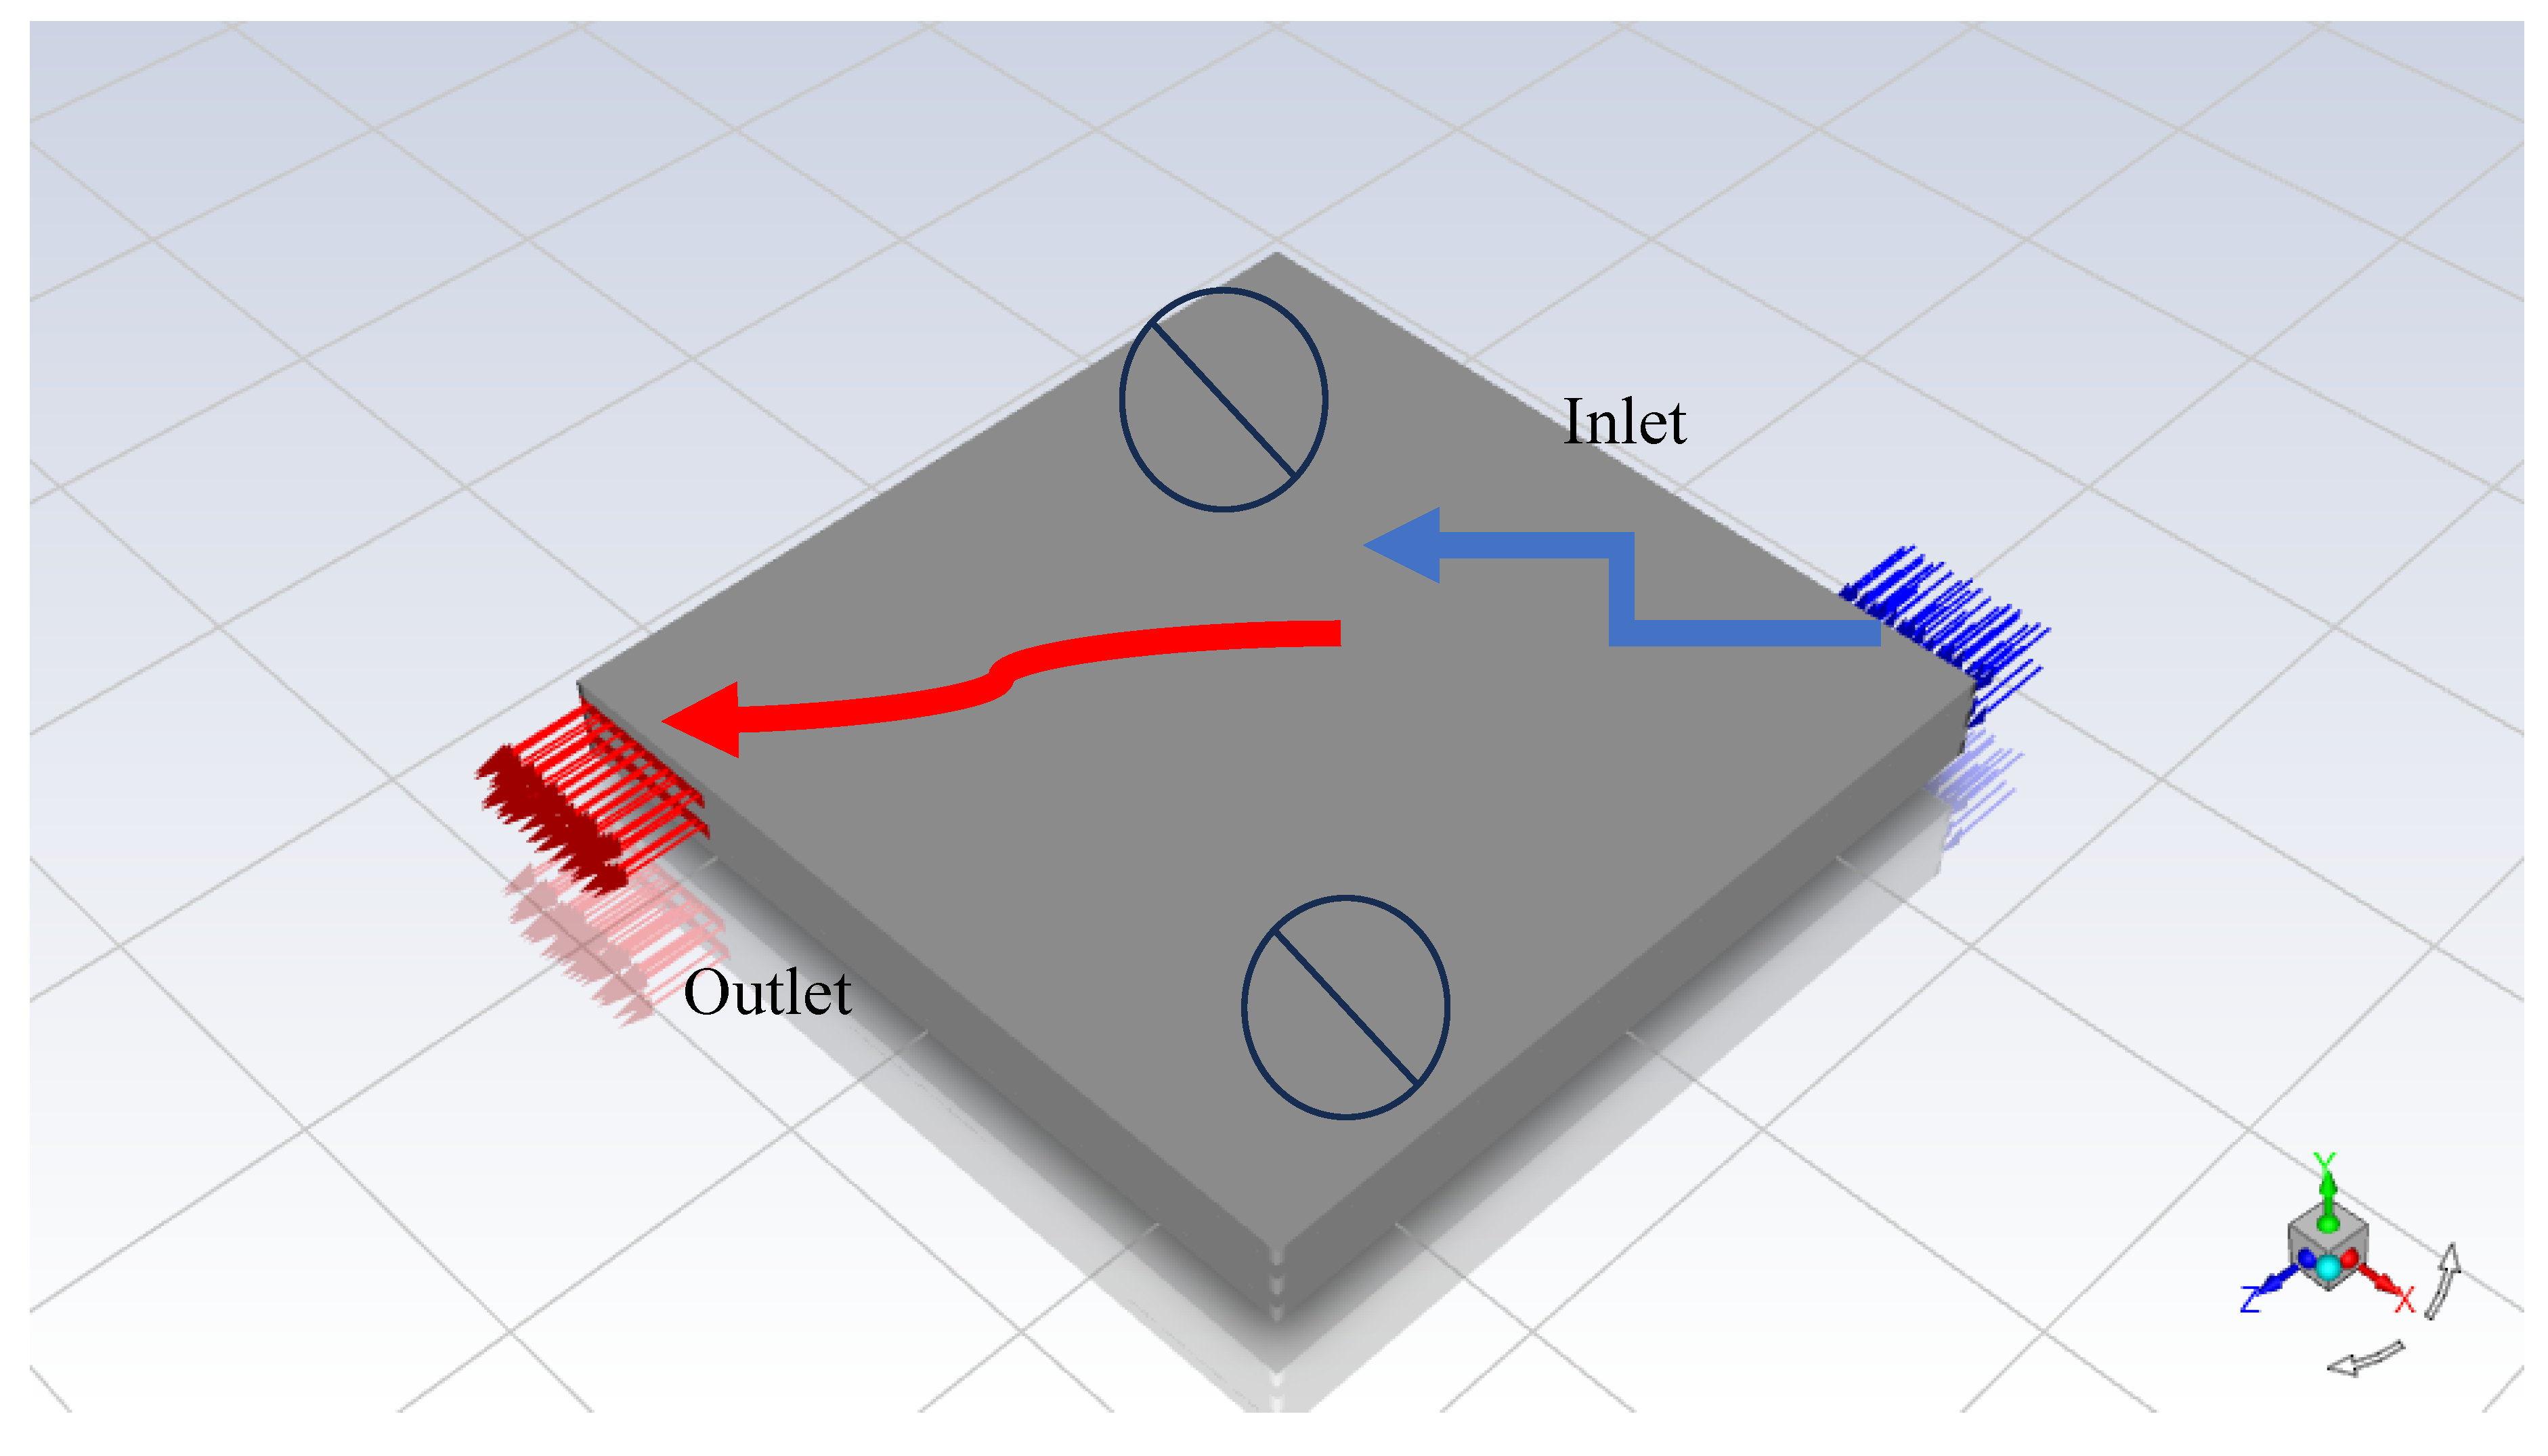
2 will be considered dead areas. Therefore, we proposed, a new strategy to test MF in Ansys Fluent as shown in
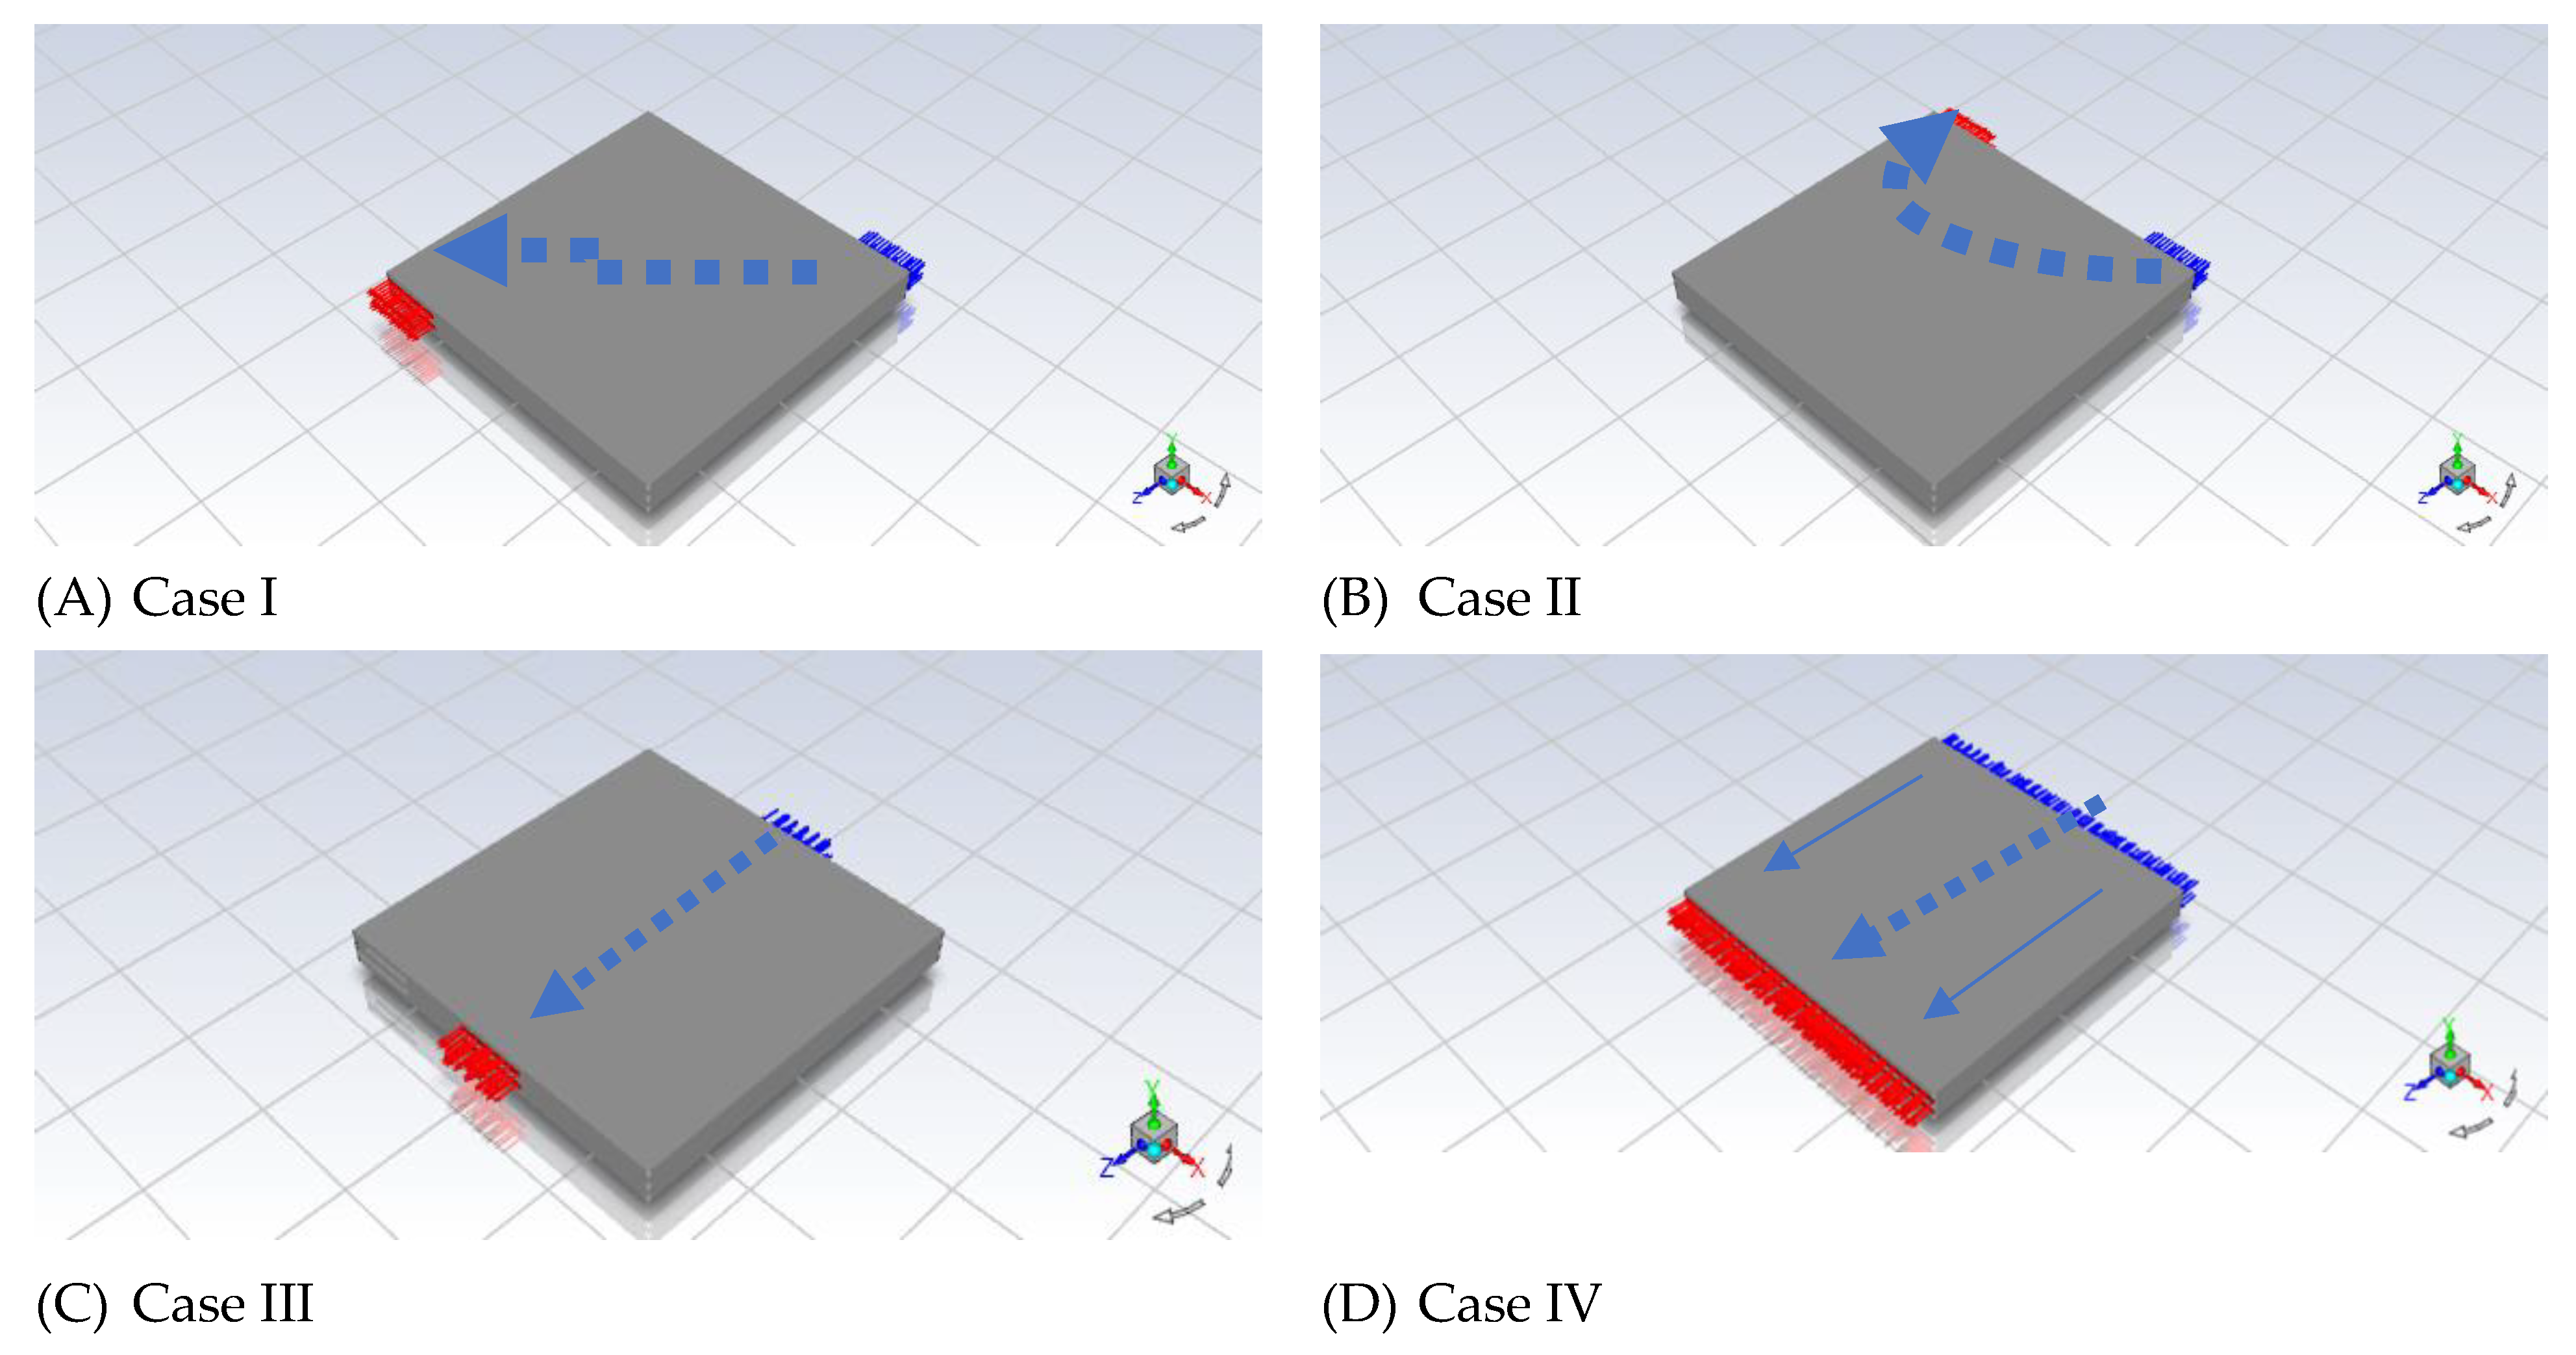
Figure 2. A new strategy to test MF in Ansys Simulation Software was developed. Then we created four cases to investigate the performance of modelling PEMFCs as demonstrated in
Figure 3.
We have to investigate the effect of different distributions of reactant flow. We came up with the idea to model PEMFCs. This model has five inlets and five outlets for the anode side and then five inlets and five outlets for the cathode sides as shown in
Figure 3 (D), Case IV. The inlets were set up to a thermal temperature of 80
353K for both of anode and cathode sides. However, the mass flow rate and species for anode inlets are different from cathode inlets. For the anode, inlets were selected at 0.6 [µ kg/s] but for the cathode, inlets were set up to 5.0 [µ kg/s]. The mass fractions for species for the anode side were set up as 0.8, 0.0, and 0.2 for hydrogen, oxygen and water respectively. Therefore, we expect the mass fraction of H
2 at the inlet in the contour will reach 0.8. While species for the cathode side were set up as 0.0, 0.2, and 0.1 for hydrogen, oxygen and water respectively. But for outlets on either the anode or cathode sides, for simplicity, the pressure outlets were selected to zero and the temperature was set to 80
353K for both the Anode and Cathode sides. Later for intemperate temperature investigations of PEMFCs, we can vary the temperature. There is another setting on the model, which is not mentioned in this paper, but it can be found in the model, which is under the request once this paper is published. To conclude, we create four cases to investigate the performance of modelling PEMFCs and the effect of different distributions of reactant flow as demonstrated in
Figure 3.
3.2. Investigation of the Different Configuration Models of PEMFCs in ANSYS Fluent
It is important to discuss the flow in fluid/liquid as the fluid is a substance that does not permanently resist distortion. So, any attempt to change the shape of a fluid mass will lead to sliding the layers of fluid over another layer until a new shape is attained. This will depend on the viscosity of the fluid and the rate of sliding (McCabe et al., 1993). Another property of the fluid is essential for fluid either incompressible or compressible. The density of the fluid can be incompressible when moderate changes in temperature and pressure have slightly occurred. But when the change in density is significant occurred, it is called compressible. Based on McCabe et al. (1993), liquids are generally considered to be incompressible while gases are considered compressible. The rate of mass (
) in steady flow entering the flow system equals leaving the system. The rate of mass is given by (McCabe et al., 1993):
Where are the densities and are donated to velocities and also are the cross-section area. To find the rate, we need to know how much flow of liquid per second or minute. The rate is terminology that is used in most research such as in computer science to know the data rates for example.
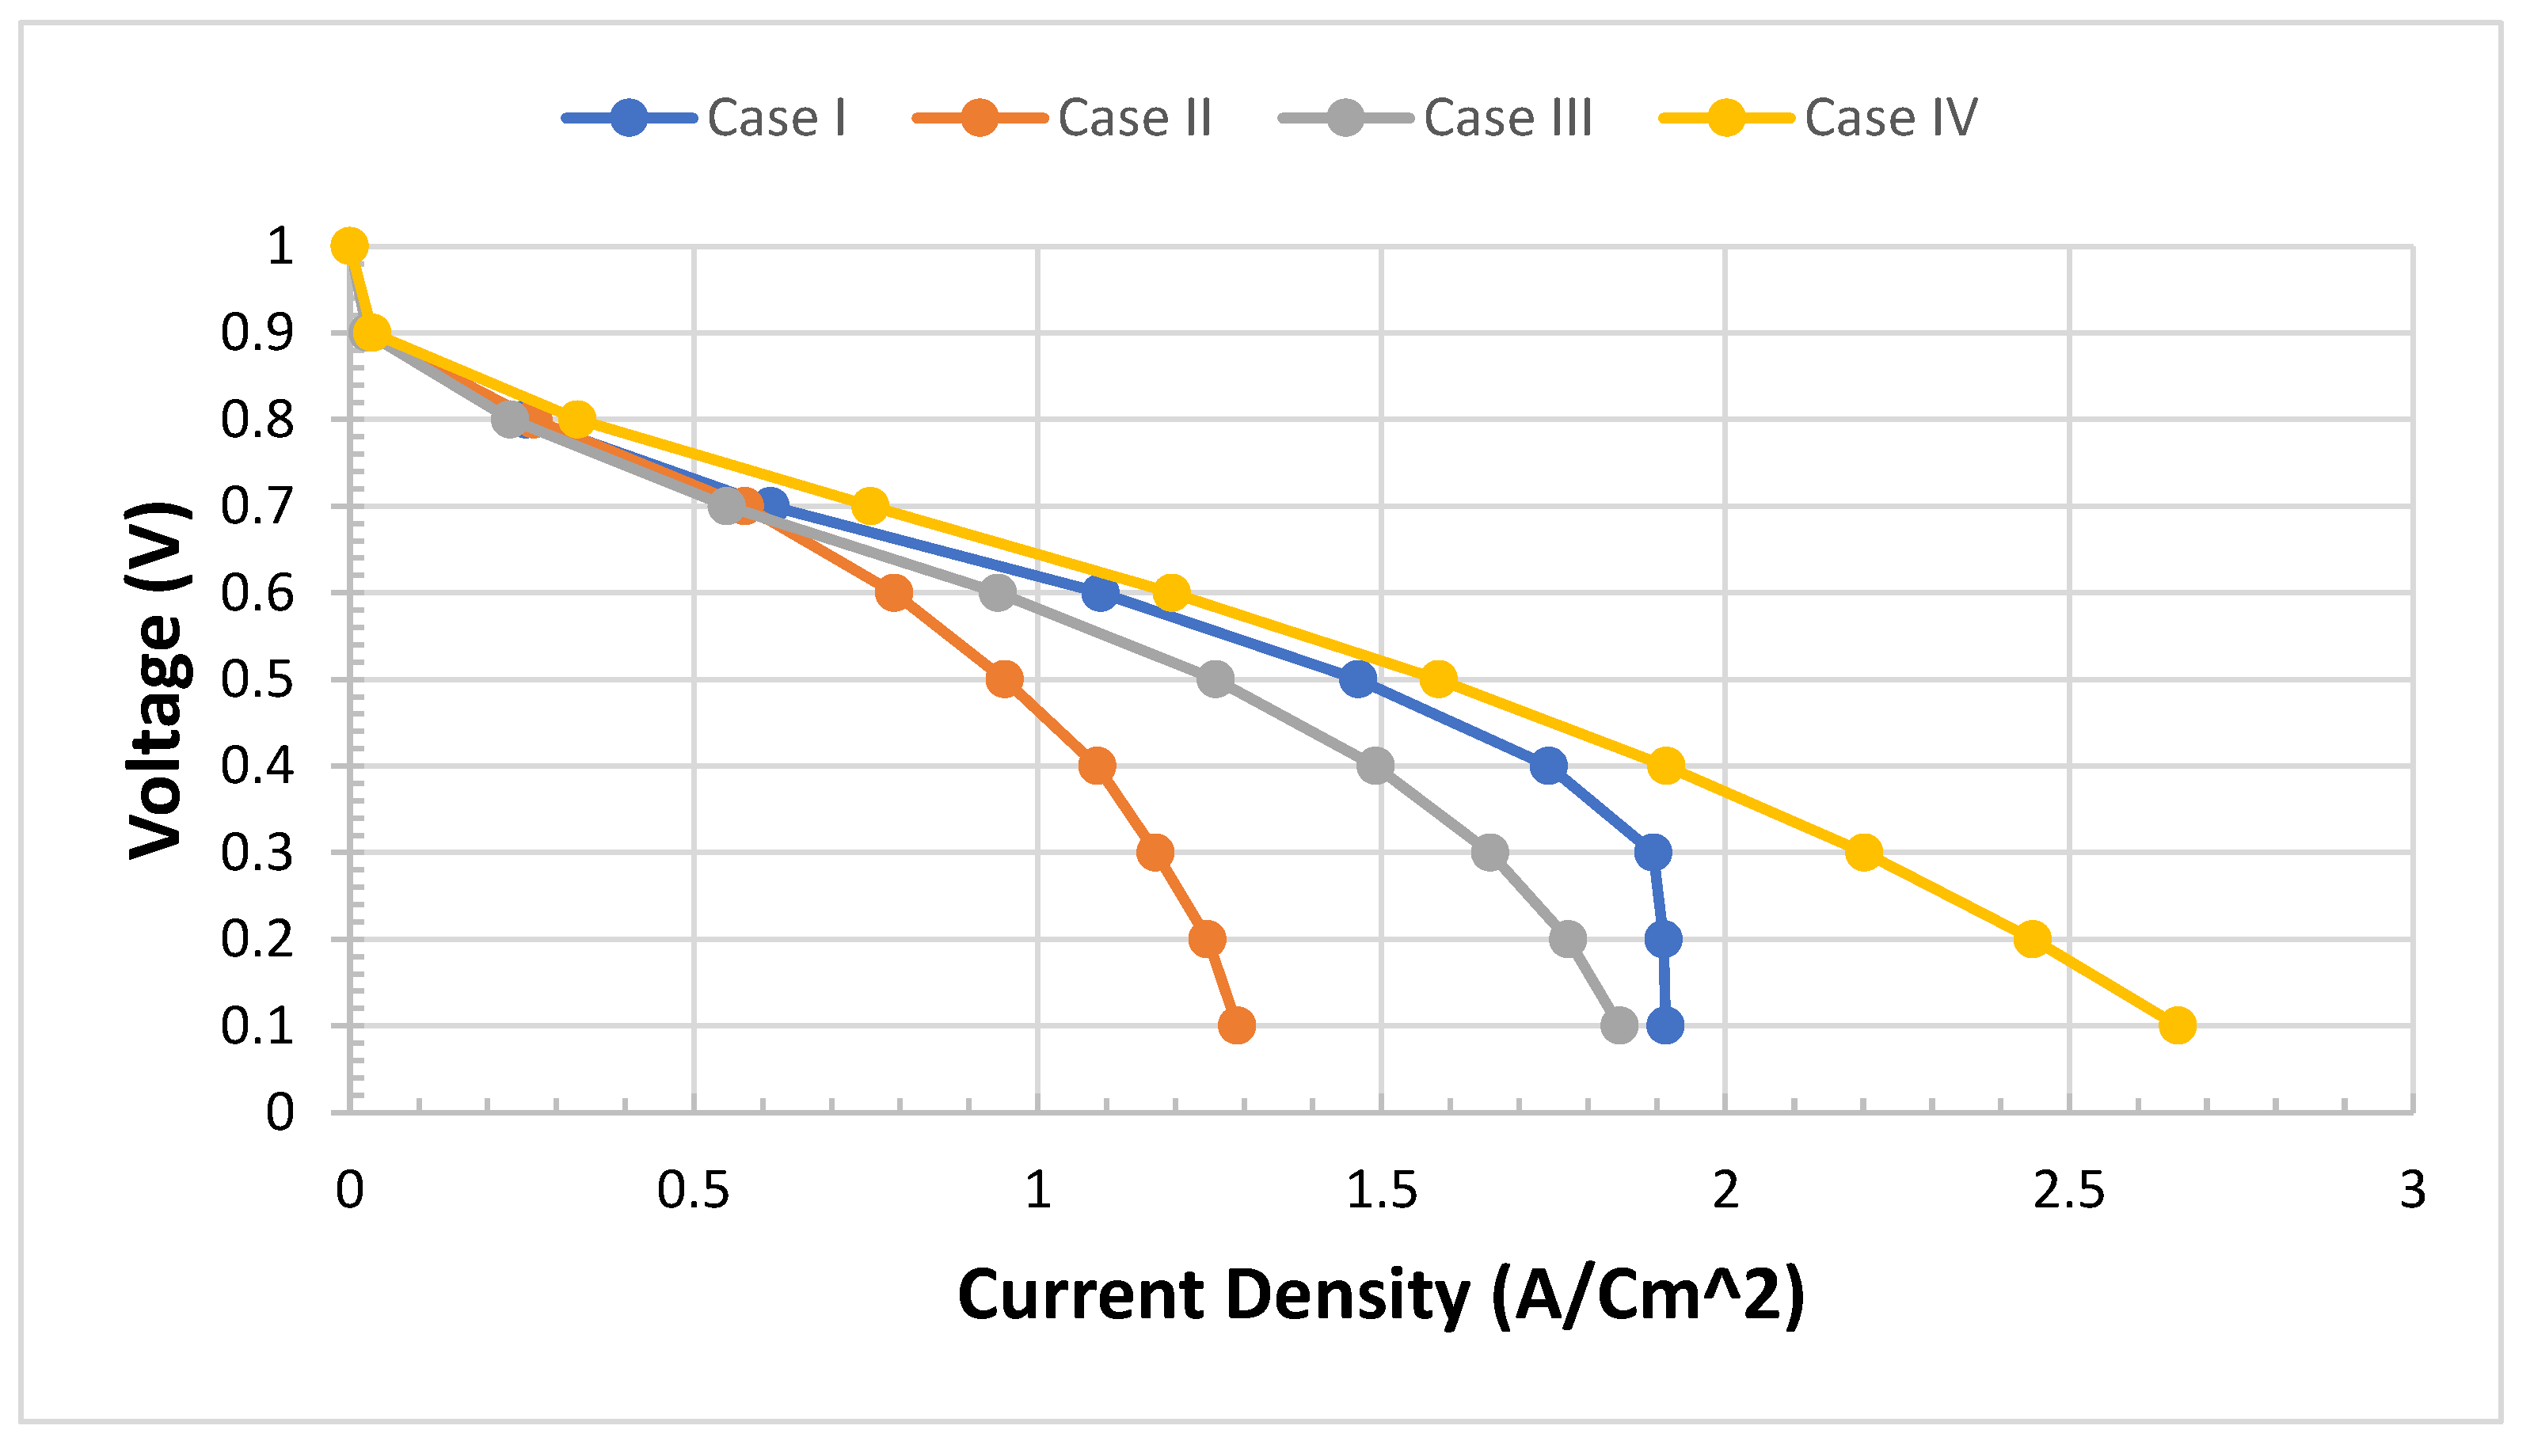
Our aim is to investigate the four cases of the configuration of PEMFCs and find the effective performance of four cases in terms of I-V and I-P curves. In the scope of this paper and based on acquired results, we will look at a mass fraction of different configurations. We will find out the mass fraction of MF of the middle plane and catalyst layer (CL) for the anode and cathode sides and compare them. To conclude up, the species of PEMFCs such as hydrogen, oxygen and water are investigated and presented in contour (3D) in this research Programme. This was achieved after we investigated the effect of different configurations of PEMFCs, and several tests were conducted. We found at 0.3 V there are huge and massive changes in the I-V and I-P polarization curves.
4. Results and Discussion
4.1. Effect of Different Configurations and Comparison between Four Cases
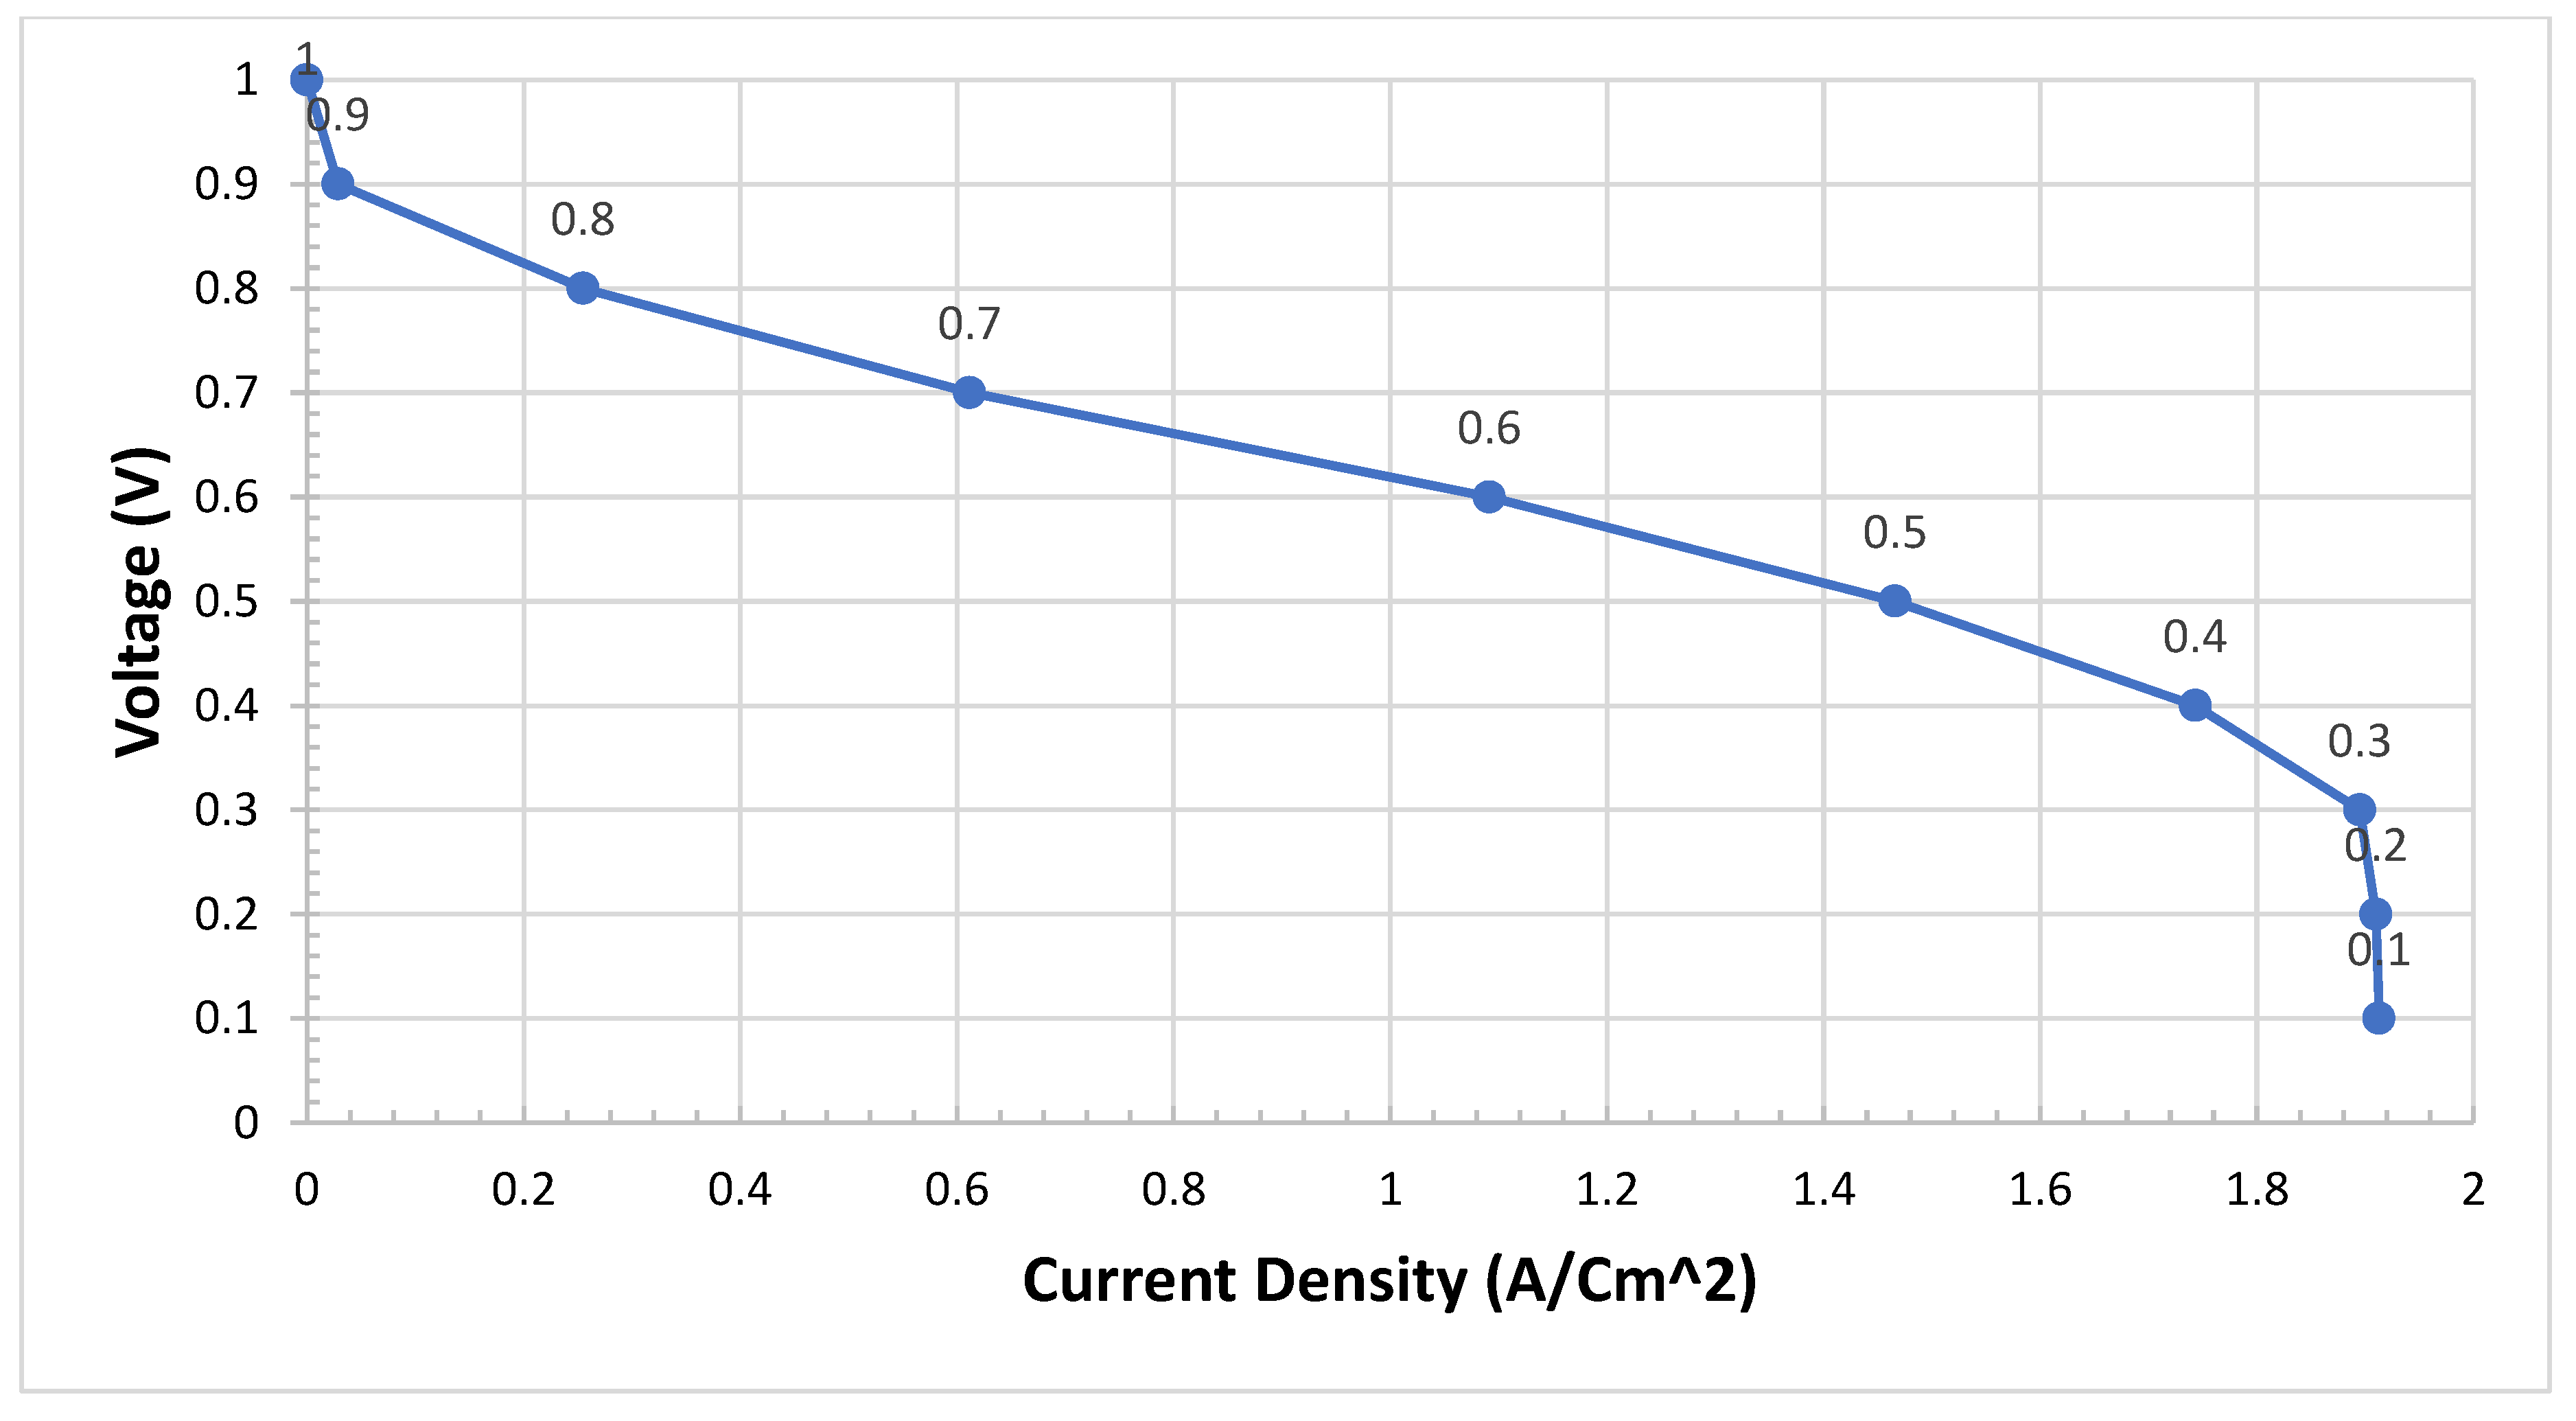
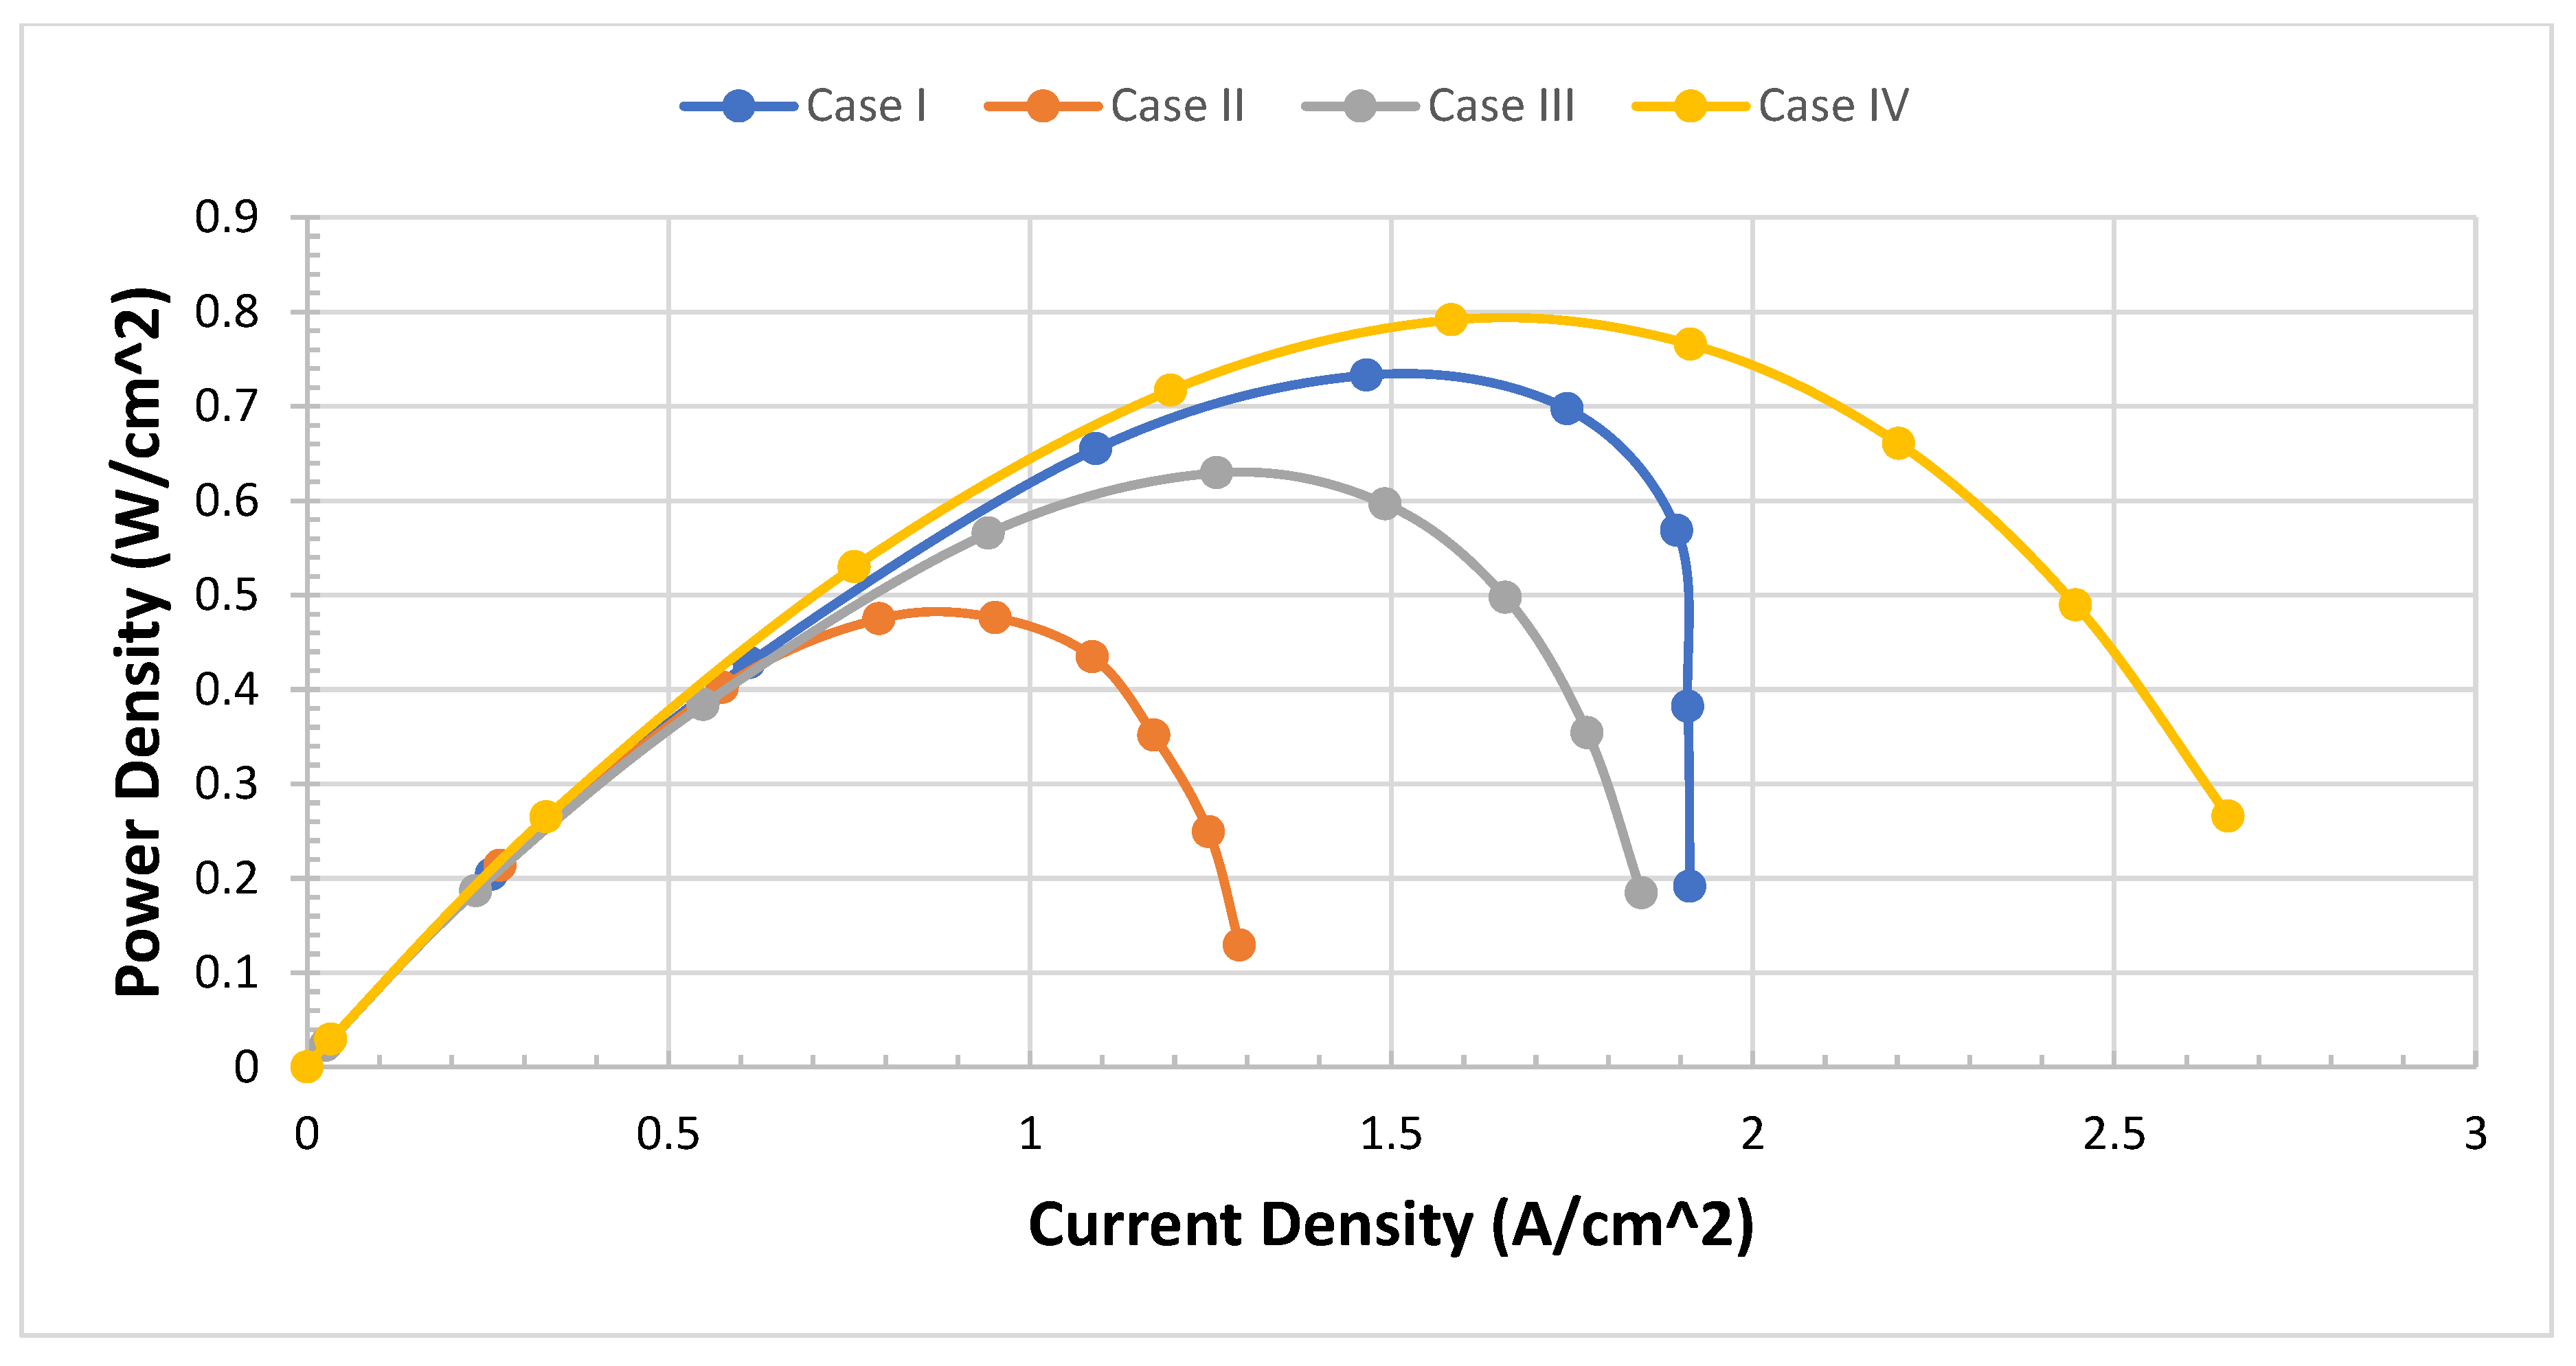
We need to validate the model and study the difference between four cases of configurations. The model of PEMFCs was validated by I-V and I-P curves as in the previous test four cases. We expect Case IV to be the best case of configuration. We can see from
Figure 6 that Case IV provides the best performance, particularly in the transport area of the I-V curve if we compare it with the worst case which is Case II.
Case IV can provide twice as much as Case II in terms of power density. This not only improves the performance in terms of I-V curves but also the curve of the I-P Curve is very smooth and realistic
Figure 7.
4.2. Comparison of Four Cases in Contour Diagram using ANSYS Fluent
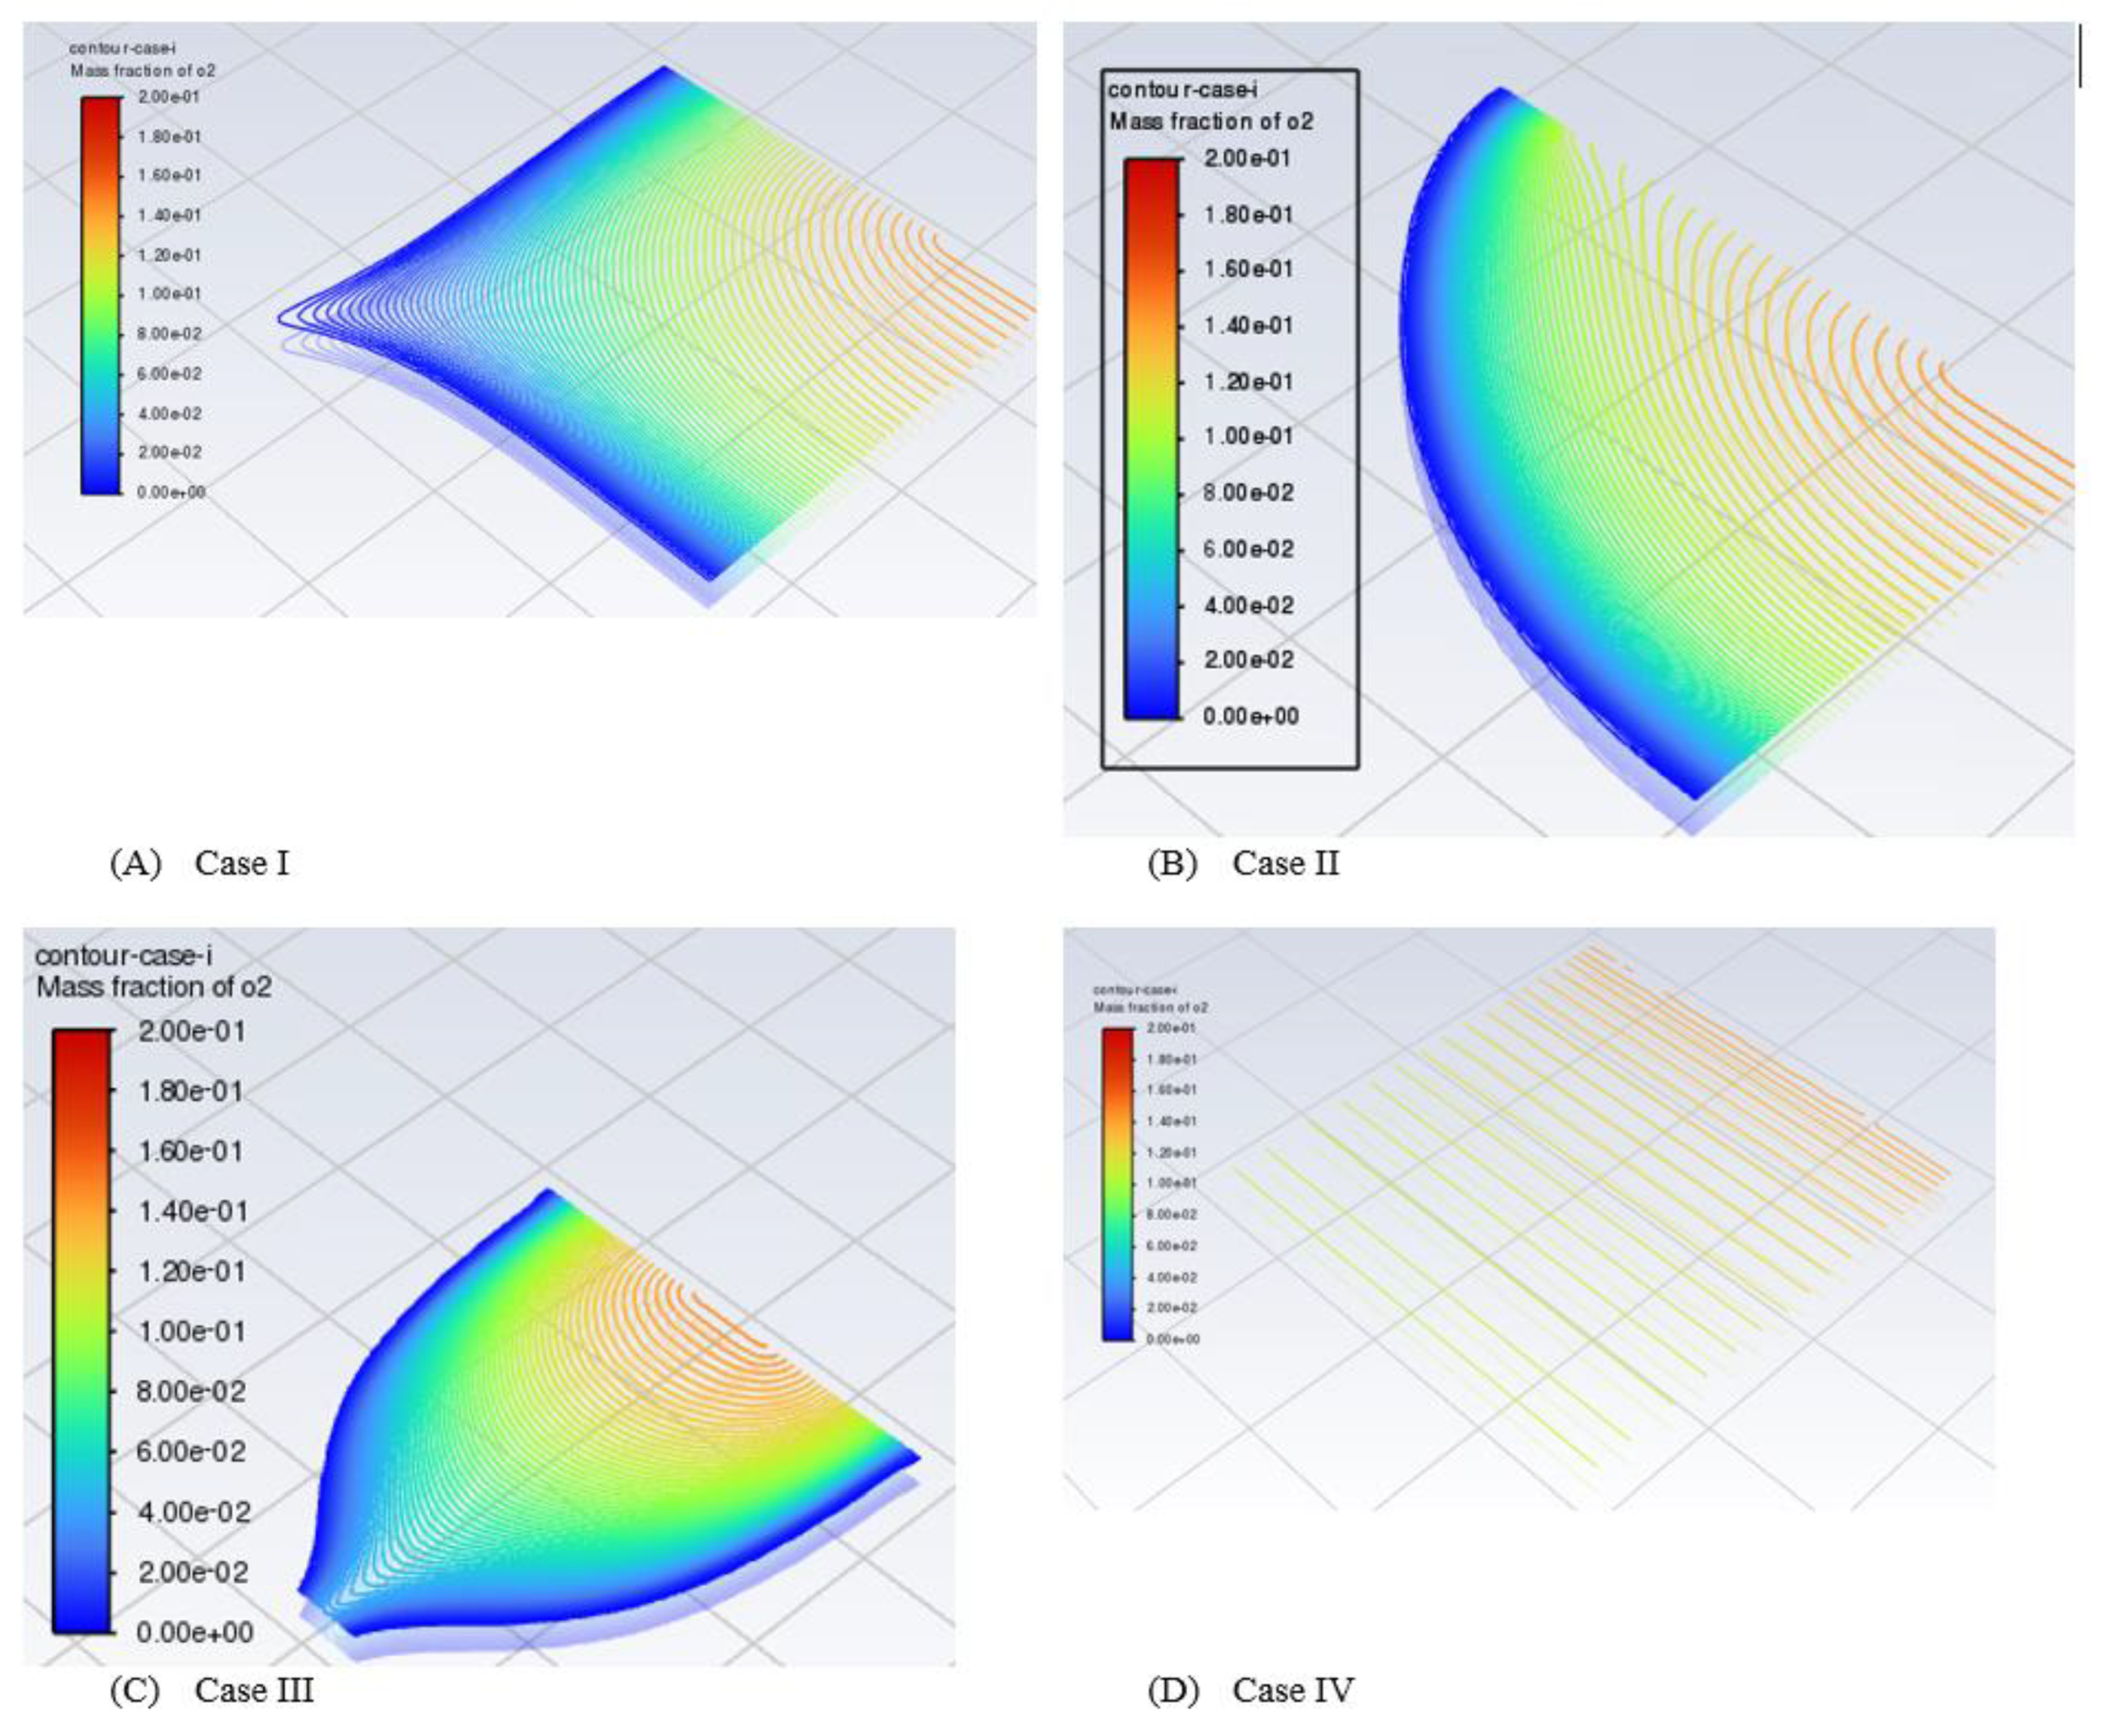
We focus on contour plots or diagrams in this section. The contour gives us to see inside the model of PEMFCs which is not easy to obtain in experimental works. A contour plot is defined as a graphical approach for depicting a three-dimensional (3D) surface by tracing constant z slices, known as contours, on a two-dimensional plane. A contour plot is an alternative to a three-dimensional surface plot. The contour plot can illustrate if the surface is symmetric or not (Courant et al., 1996, Groshong and Groshong, 2006, Gurikar, 2015, SENATECH, 2023). The contours provide an effective approach for representing graphs in different locations of the system by shaded areas, contour lines, or both. To create contours, we chose contours under the setting results after the model of PEMFCs completed the running cycle at a specific voltage (0.3 V). The name is given to Contour Case I, Case II, Case III, or Case IV to recognize between the cases of configurations. Then from the new surface, we select a plane surface name. Basically, we can select different views for contours such as point, line, plane, quadratic, ISO-surface, and ISO-clip. We only select plane surfaces for simplicity. In the method section, the ZX plane is selected, and a new surface name is given. Lastly, one important point is to select Y [mm], which determines the part we look for. In our model, we are looking for the middle MF of the cathode side, CL of the cathode side and also MF and CL for the anode side for all four configurations and we study the effect of fuel distribution.
- -
For the middle MF layer of the cathode side, the Y-Axis is selected at 0.75 mm.
- -
For the middle CL layer of the cathode side, the Y-Axis is selected at 1.2575 mm.
- -
For the middle CL layer of the anode side, the Y-Axis is selected at 1.3225 mm.
- -
For the middle MF layer of the anode side, the Y-Axis is selected at 1.83 mm.
Then Contours of species for mass fraction, molar fraction, molar concentration or enthalpy can be drawn for N2, O2, H2, and H2O. Only in this research, we selected mass fractions of O2, H2 and H2O. We can also study pressure, density, velocity, temperature, wall fluxes and other properties.
Anode side along with MF
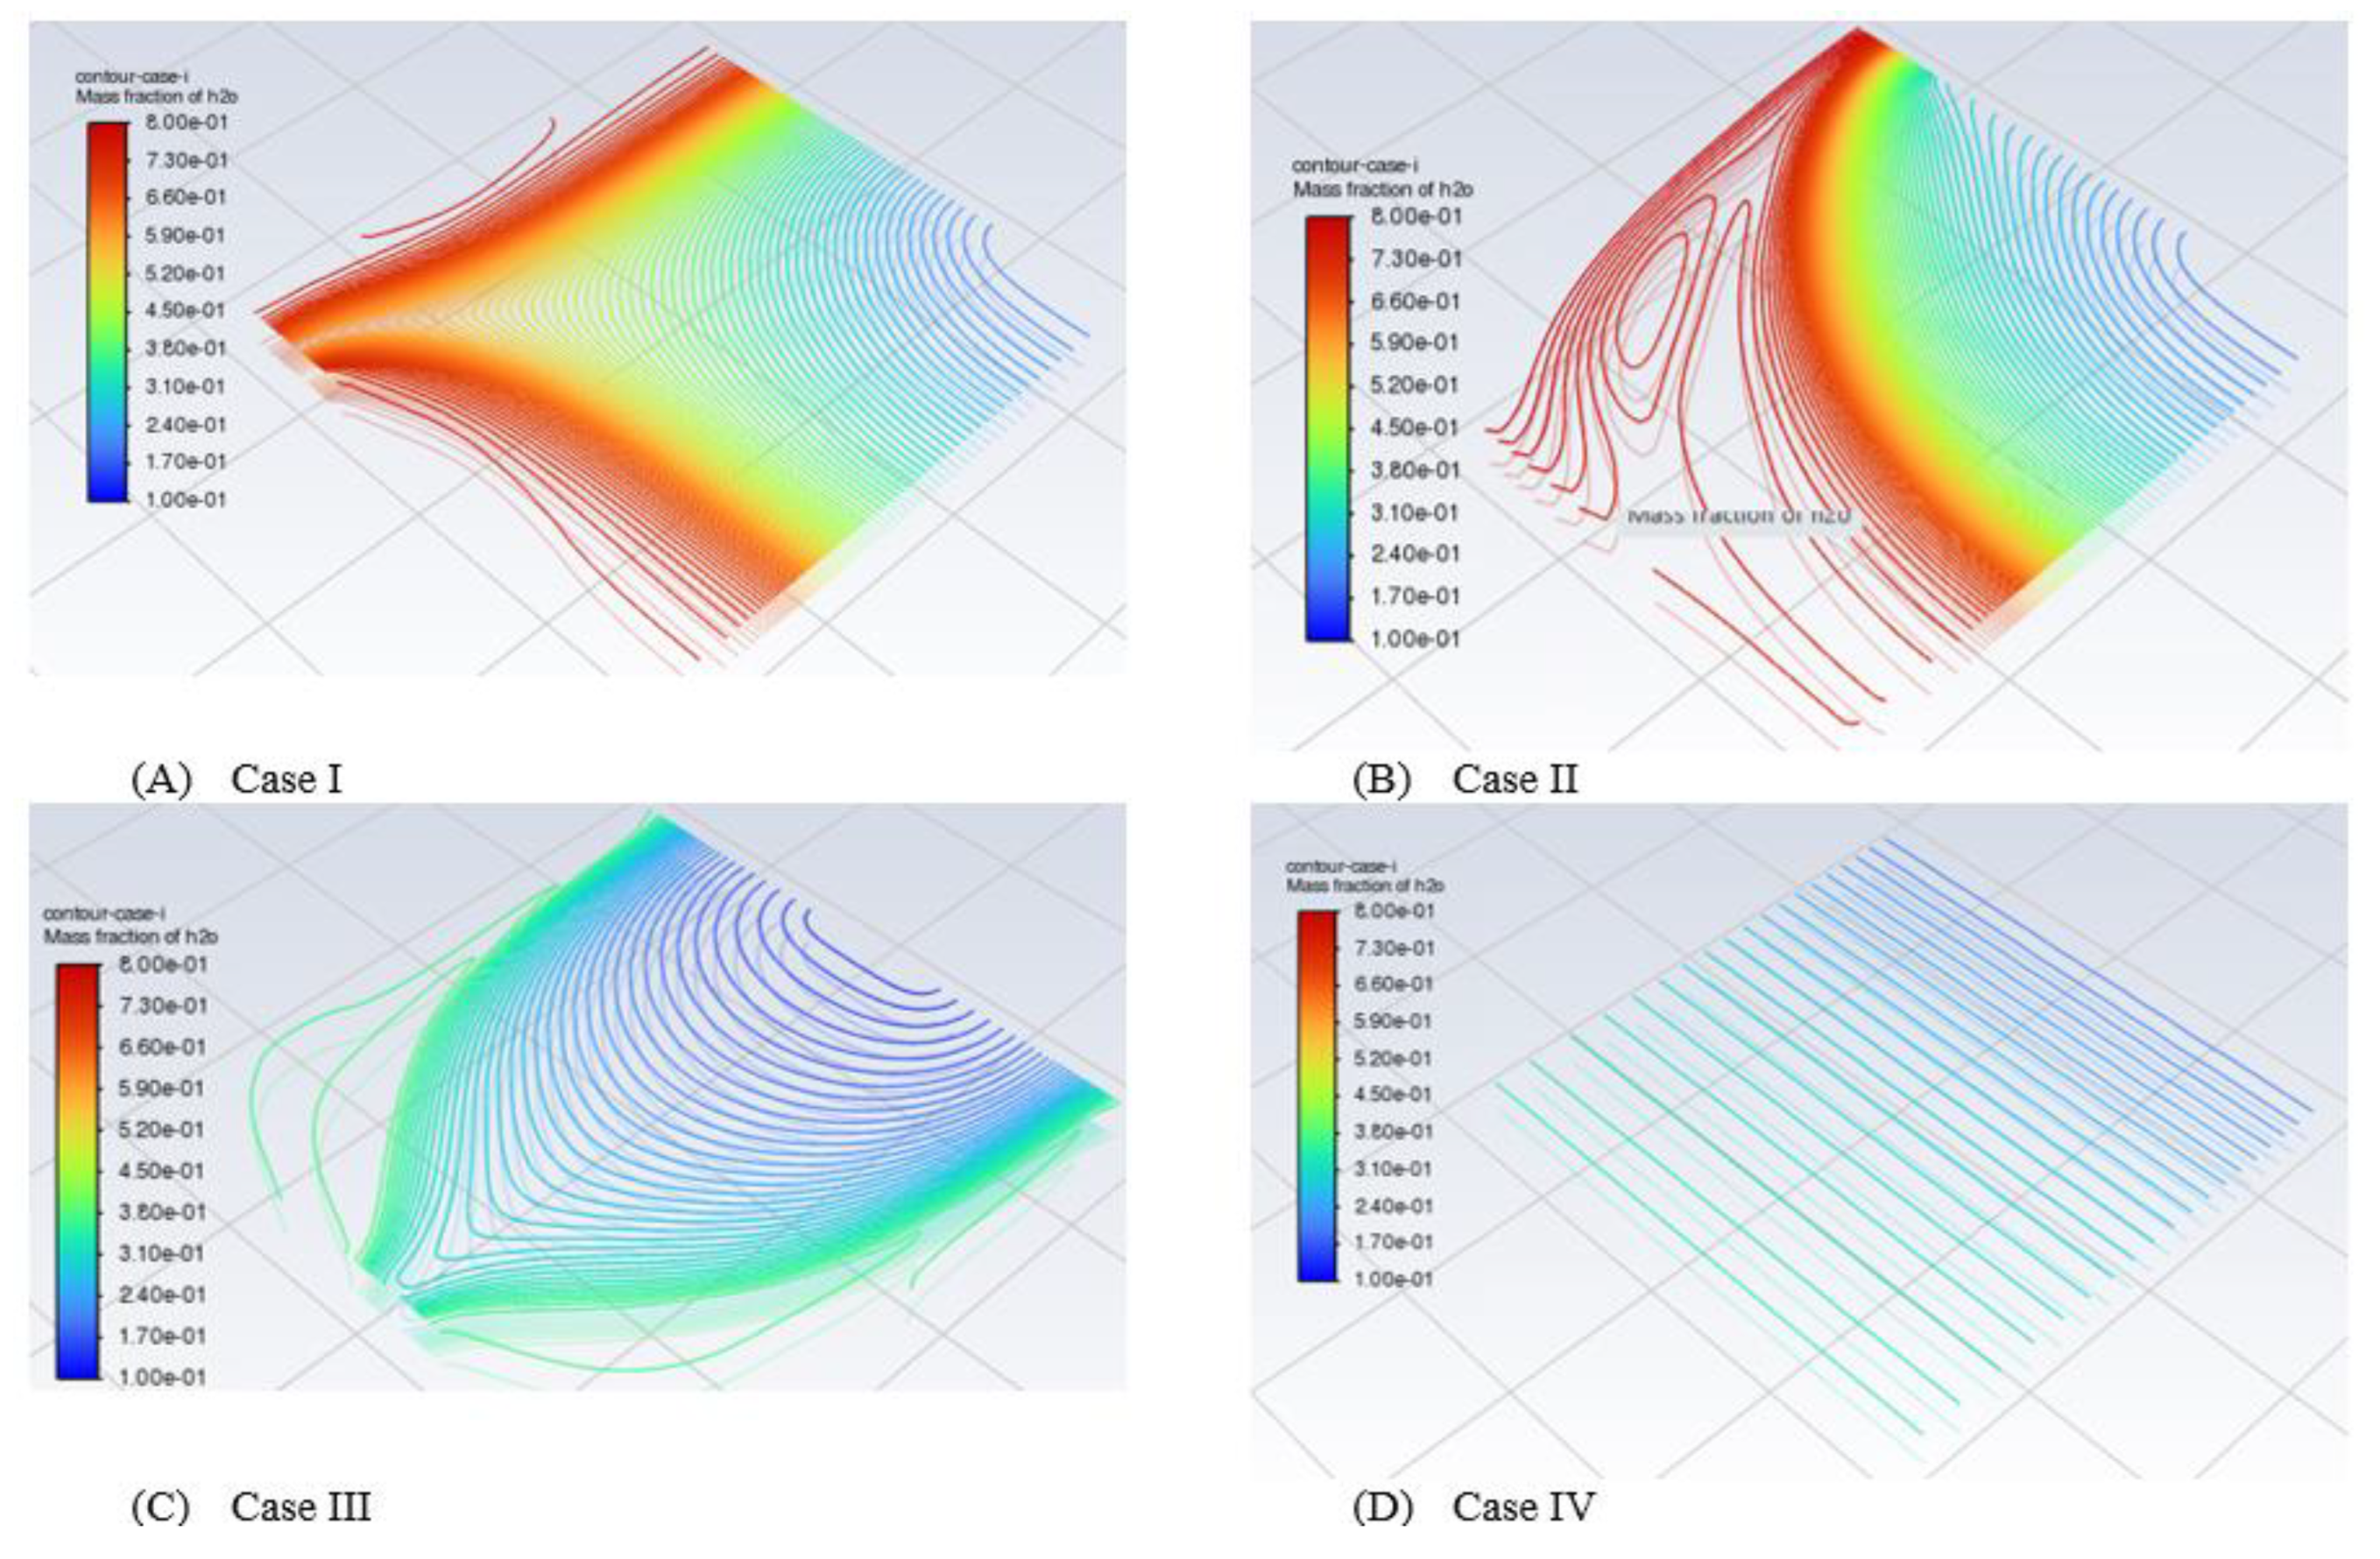
A mole fraction is defined as a concentration unit that relates the moles of a particular solute to the total moles of the solution. We have three essential elements that are solute, solvent and solution. The latter is a homogeneous mixture of both solute and solvent. We conduct the mass fraction of hydrogen and water in the designing model of PEMFCs.We changed the range of the best distribution case which is case IV. It was managed to see the mass fraction of hydrogen in the range between 0.65 to 0.80. This indicates that the distribution of hydrogen is brilliant and in a perfect way. It is impossible to see the mass fraction of hydrogen in this range with the other three cases. The other case ranges are varied from 0 to the maximum value of the mass fraction of hydrogen which is 0.8.
The problem is that we do not know the side of PEMFCs whether is from the side of the anode or cathode of metal foam while we carry out the diagram and analysis. However, we can confirm that this cathode side and hydrogen are very low in case IV. We should measure the oxygen or plot the contour of oxygen at the cathode side, not hydrogen. This is almost close to zero. The other problem is that when we run the model, we do not know the best range to represent the model. For example, the deformative contour can be clearly seen when it is out of the setting range and becomes an invisible region.
Cathode side along with MF
We focus on the side of the cathode of PEMFCs. We look at the mass fraction of oxygen and water of metal foam at the cathode side. We have looked at N2 at the cathode side as well. O2 and N2 are considered air gases, we set up the mass fraction of O2 to O2, so we expected the N2 to be around 0.8. We found the mass fraction of N2 as we expected.
Cathode side along with CL
Then we focus on the CL of the cathode side. We find the oxygen and water at the CL of the cathode side of PEMFCs as we expected based on the initial set-up. This presents the realistic results as we expect. We found that Case IV is the best case for the distribution of O2 at the cathode side.
Anode side along with CL
We focus on the CL of the anode side. We find the hydrogen and water at CL of the anode side. The mass fraction of H2 at case IV can be demonstrated in a small range between 0.6 and 0.789 to show the best distribution case of fuel.
Improvement of results
In order to improve overall results, we conduct general reviews and investigations many times. The molar fraction formula is given by (Nic et al., 2005, Zumdahl and Zumdahl, 2008, Zaborowska, 2023):
The mole fraction of oxygen in the air can be determined by dividing 160 mmHg by the pressure of the air which is 760 mmHg (Zaborowska, 2023):
The mole fraction is also called molar fraction or amount fraction and it is a dimensionless quantity (Maitra and Bagchi, 2008). We expect the mole fraction to be less than 1. We realise that there are some inconsistencies in results due to the voltage being selected at 0.3 V. It is difficult to compare and expect the results in advance. We ran the PEMFCs model on different laptops. This is to make sure that the obtained different results are not different which could be more sensible and realistic works. However, we found some limitations that led us to focus on further research to use explainable artificial intelligence (Ding et al., 2021, Legala et al., 2022, Zhao et al., 2021, Ding et al., 2022, Feng et al., 2022). This will be part of the next papers or future works.
It matches the configuration of PEMFCs, the oxygen water and hydrogen can be described easily as we expected and we had set up. We only demonstrated two cases as in
Figure 8 and
Figure 9 in this paper.
4.3. Post Results Analysis in ANSYS Simulation Software
We noticed that there were some problems when the contour of the mass fraction of O
2, H
2 and H
2O was not easy to understand. Therefore we developed the post results to the model of PEMFCs. The contour of the mass fraction of H
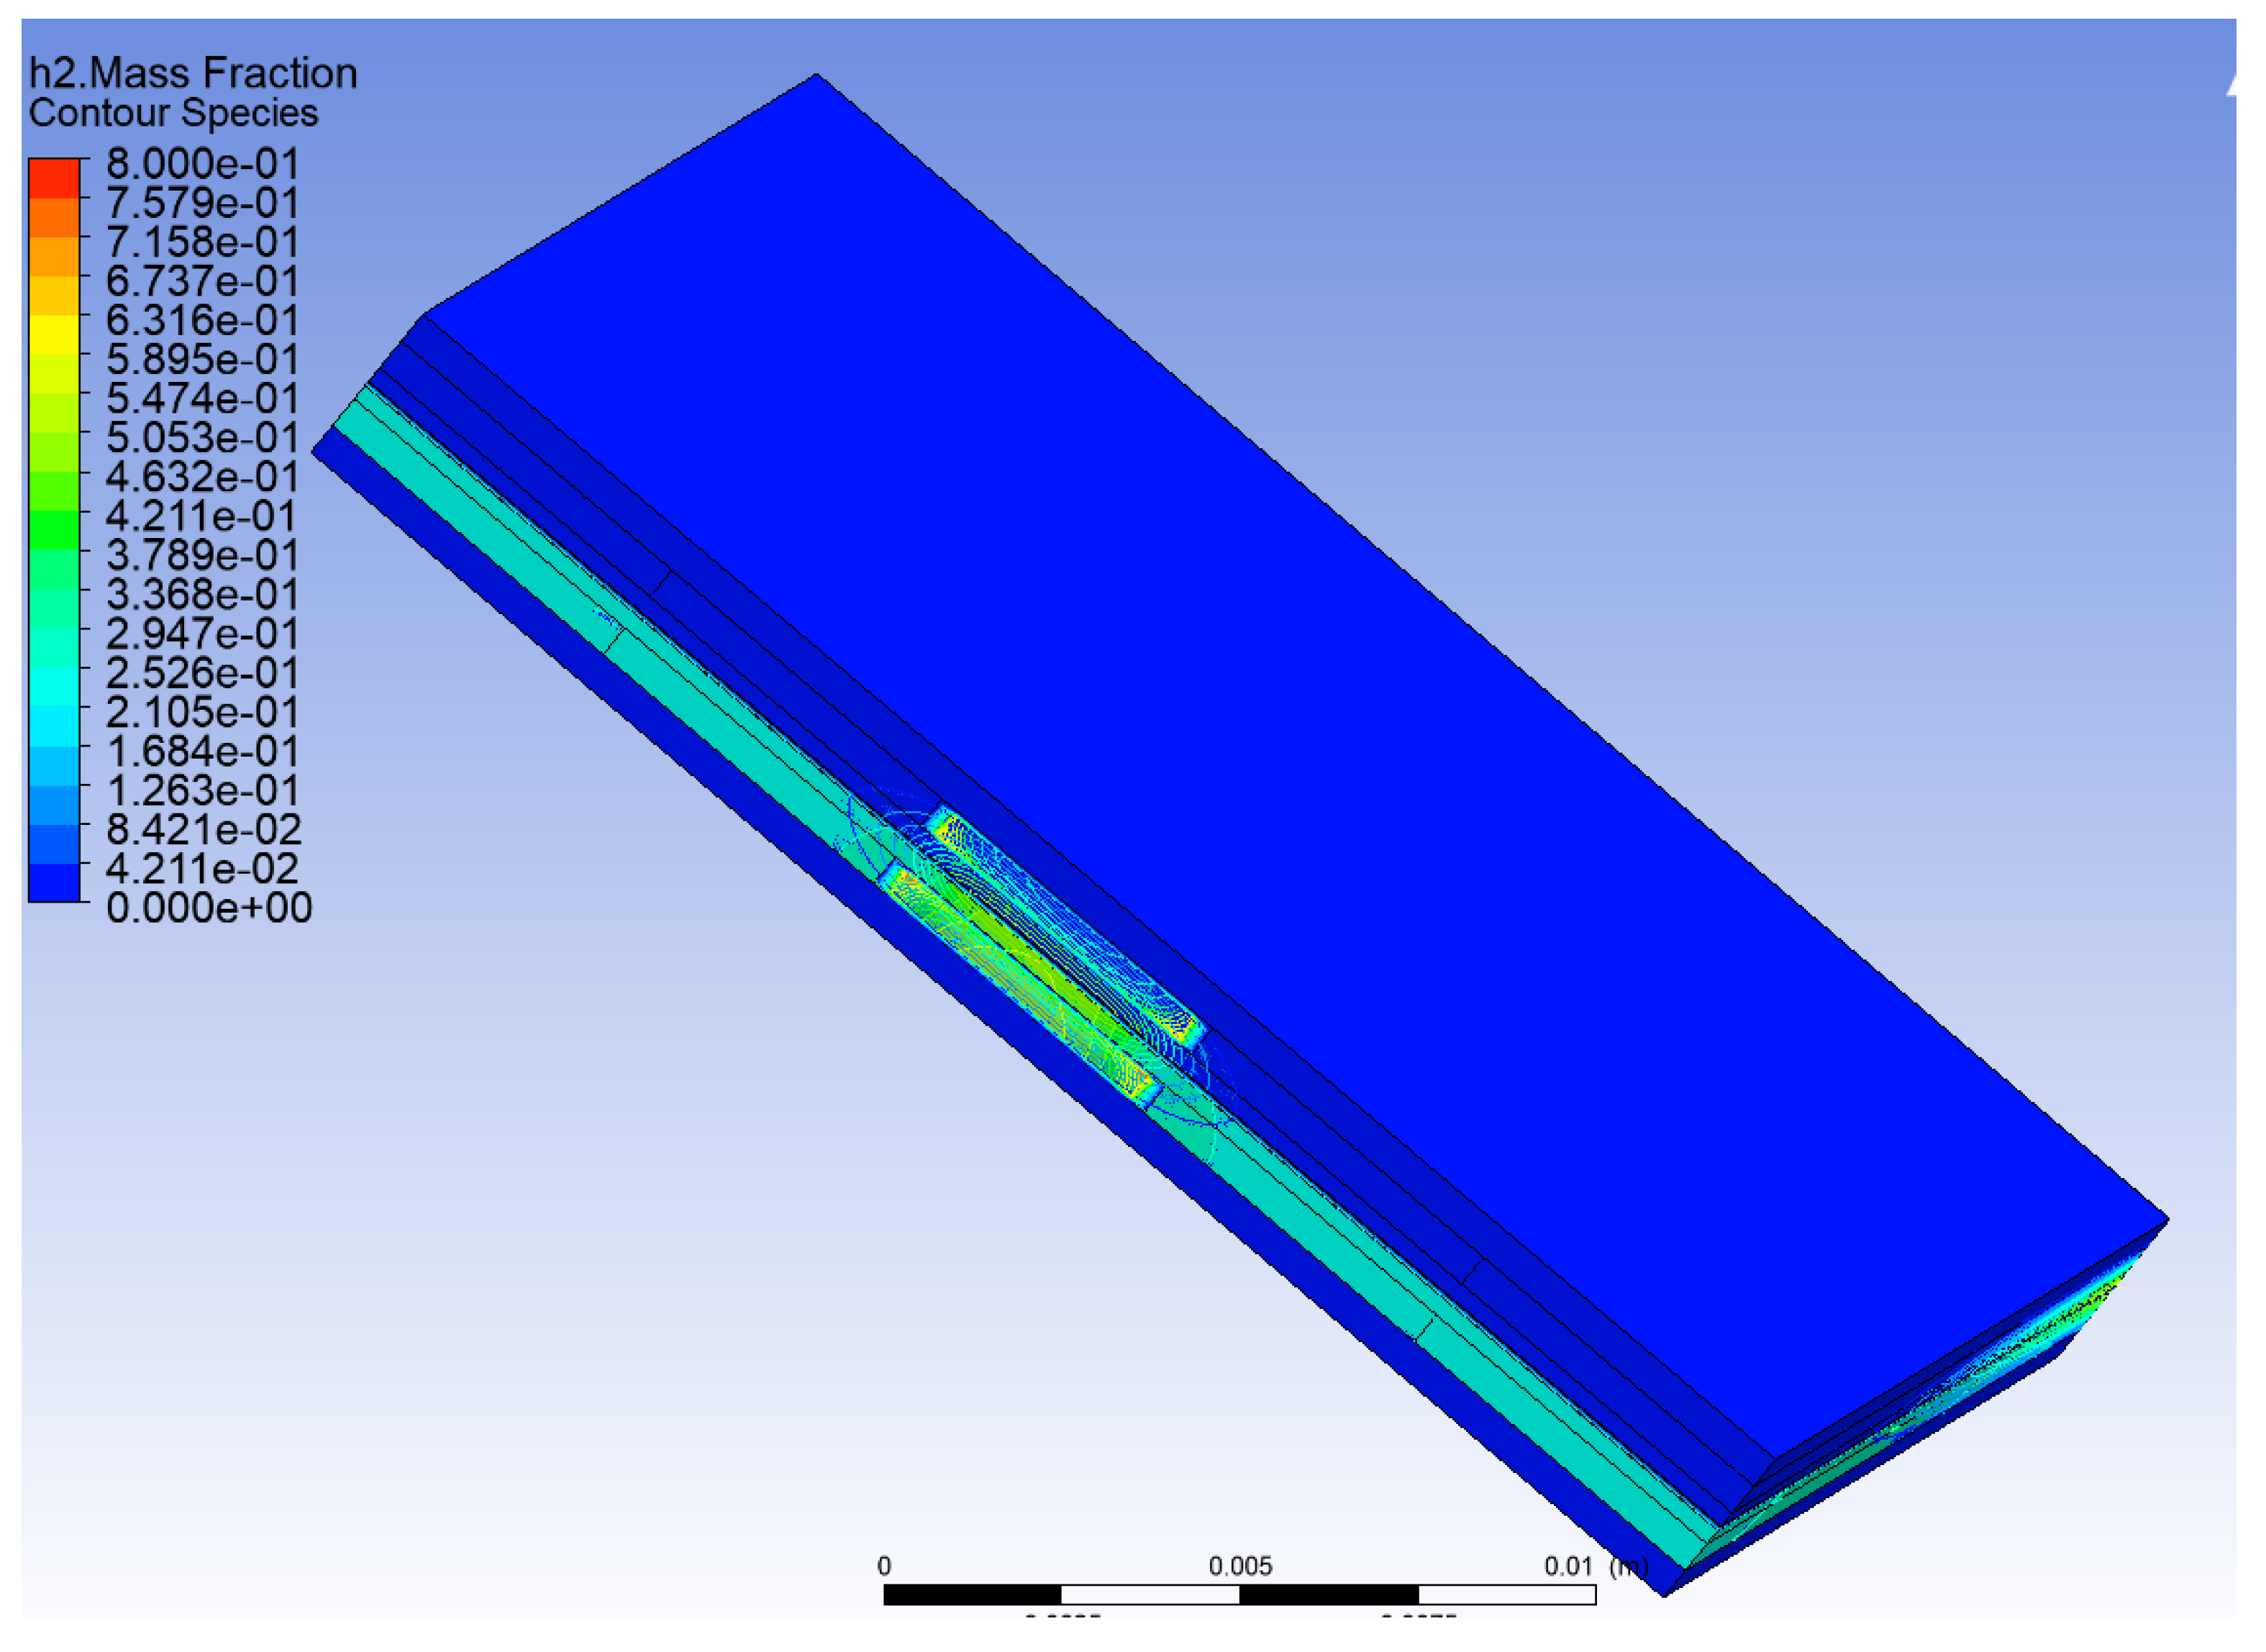
2 in total PEMFCs is shown in
Figure 10. This figure as we expect, the mass fraction of H
2 was set up to 0.8. We can confirm it in this paper, but fuel is varied after inlet in MF to reduce to up 0.42. Also, the porosity of MF, GDL and CL does not change. The GDL was set up to 0.9 while the CL was set up to 0.5. The porosity of MF was fixed at 0.9, in all the above tests. However, we purchase metal foam material and we use a mercury porosimetry machine to measure the porosity of MF. One sample was found 0.5 in the laboratory at the University of Birmingham. Therefore, the next test will be conducted to measure and investigate the impact of MF porosity and how to optimize it to give better performance in the modelling of PEMFCs.
There is fluctuation at the inlet of the anode side. But at the cathode side, there is no effect of hydrogen, and we can assume only the O2 at the cathode side. We have 21% of O2 in the atmosphere and the air is 78% and other gases are 1%.
4.4. Behavior of PEMFCs with Varying of Porosity of Metal Foam
Impact of variation of porosity
We have to investigate the impact of porosity in metal foam. As far as I know, no one has investigated the impact of the porosity of MF in PEMFCs. There is a little investigation about the porous layer and porosity of GDL as presented in ref (Carcadea et al., 2019). It is worth presenting these results here as shown in
Figure 11 to validate our works, but the design is completely different and the investigation that we carry out in different layers which is MF in the channel. We fixed the value of the porosity of GDL and CL to 0.9 and 0.5 respectively and did not change them.
In a previous investigation, we set up the porosity of MF at 0.9. Therefore, case I was selected to carry out the impact of the variation of porosity of MF. We measured the MF using a Mercury Porosimetry device. Mercury intrusion or Mercury Porosimetry is a powerful technique that allows us to determine the detail of the porosity of materials such as MF, battery plates, fuel cell catalysts or electrodes. One of the biggest benefits of this Mercury Porosimetry is that it can measure pore sizes in a wide range from a few nanometers to several hundreds of microns. This Mercury Porosimetry can determine several properties of material such as size distribution volume and surface area of the pores of the materials. We use Mercury Porosimetry to measure one sample of MF. It was found 0.5. Therefore, the porosity of MF varied to 0.9, then 0.8, 0.7, and 0.6 until 0.5. The results of modelling PEMFCs with variation in the porosity of MF can be listed in
Table 1.
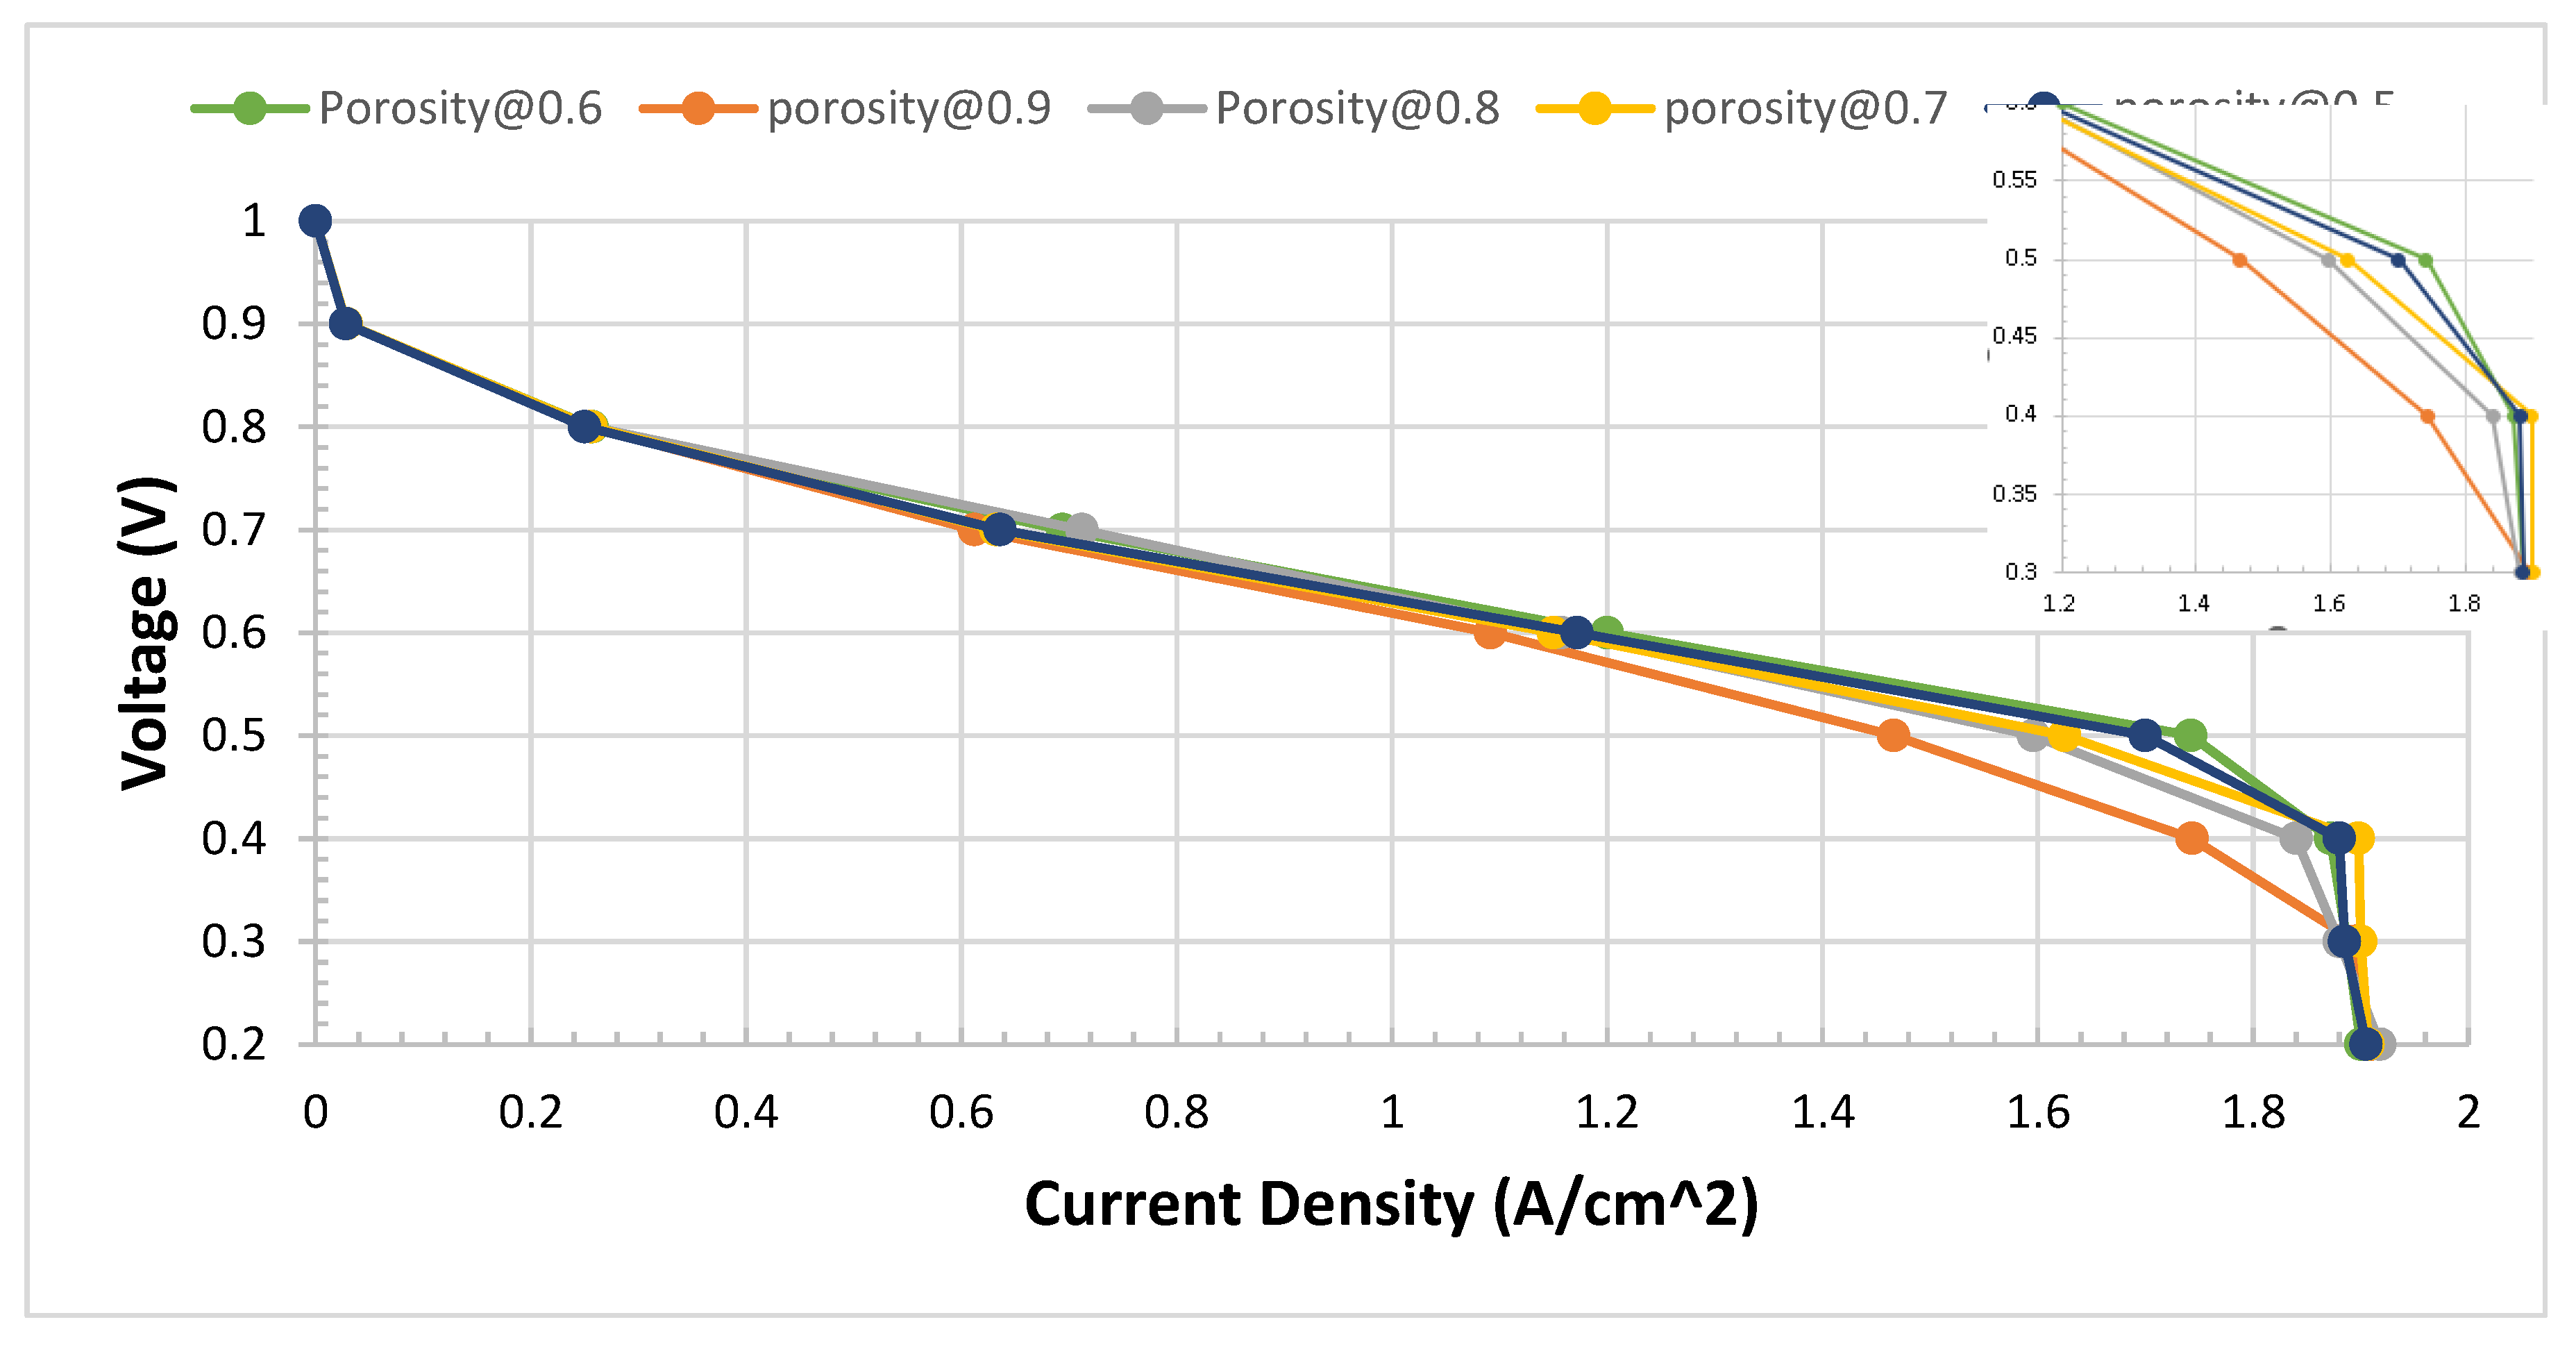
While the I-V curves for comparison can be demonstrated as shown in
Figure 12. We notice that at initial up to 0.6 V, there is no significant change. Also, below 0.2 V, the PEM fuel cell does not operate at the experimental works. Therefore, below 0.2 V, can be ignored. Also, at 1.0 V is open voltage, where the current is considered zero. To zoom out and see the difference between these tests,
Figure 12 shows the impact of the variety of porosity of metal foam. The variation occurs between 0.3 V to 0.6 V of the area of the I-V polarization curve. At 0.6 porosity, which is a high performance that can be observed.
Improvement of power density
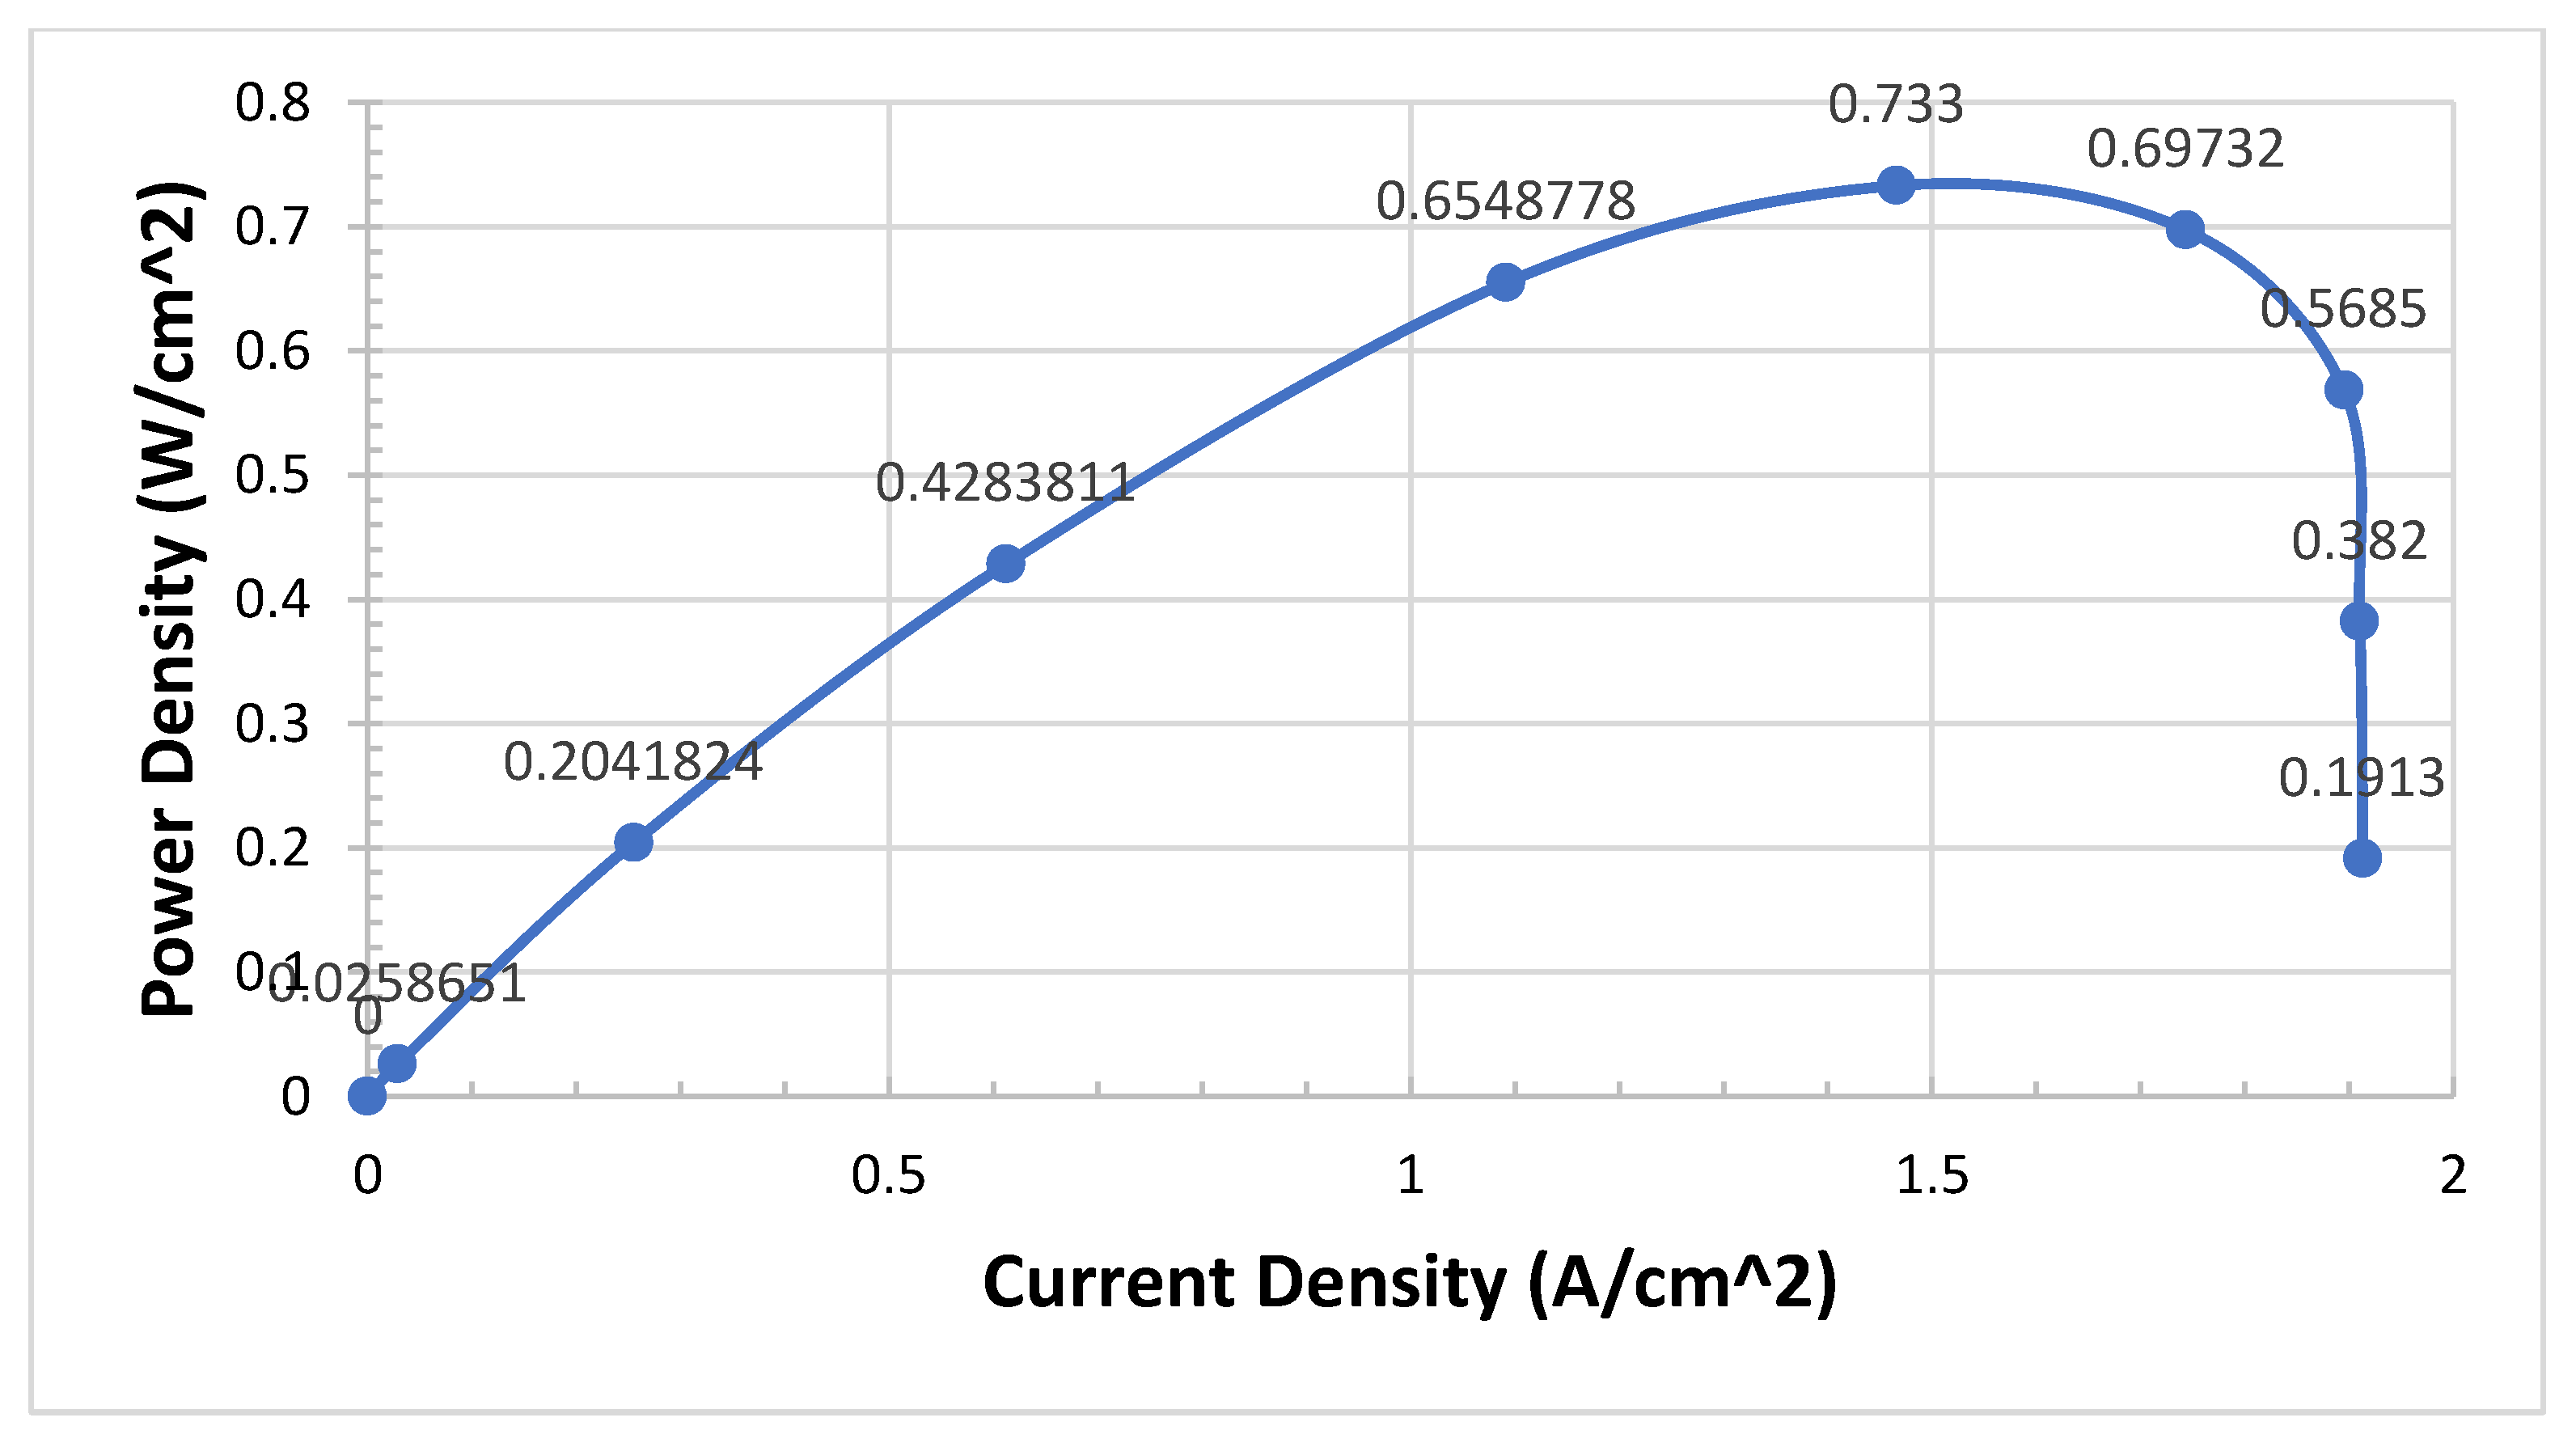
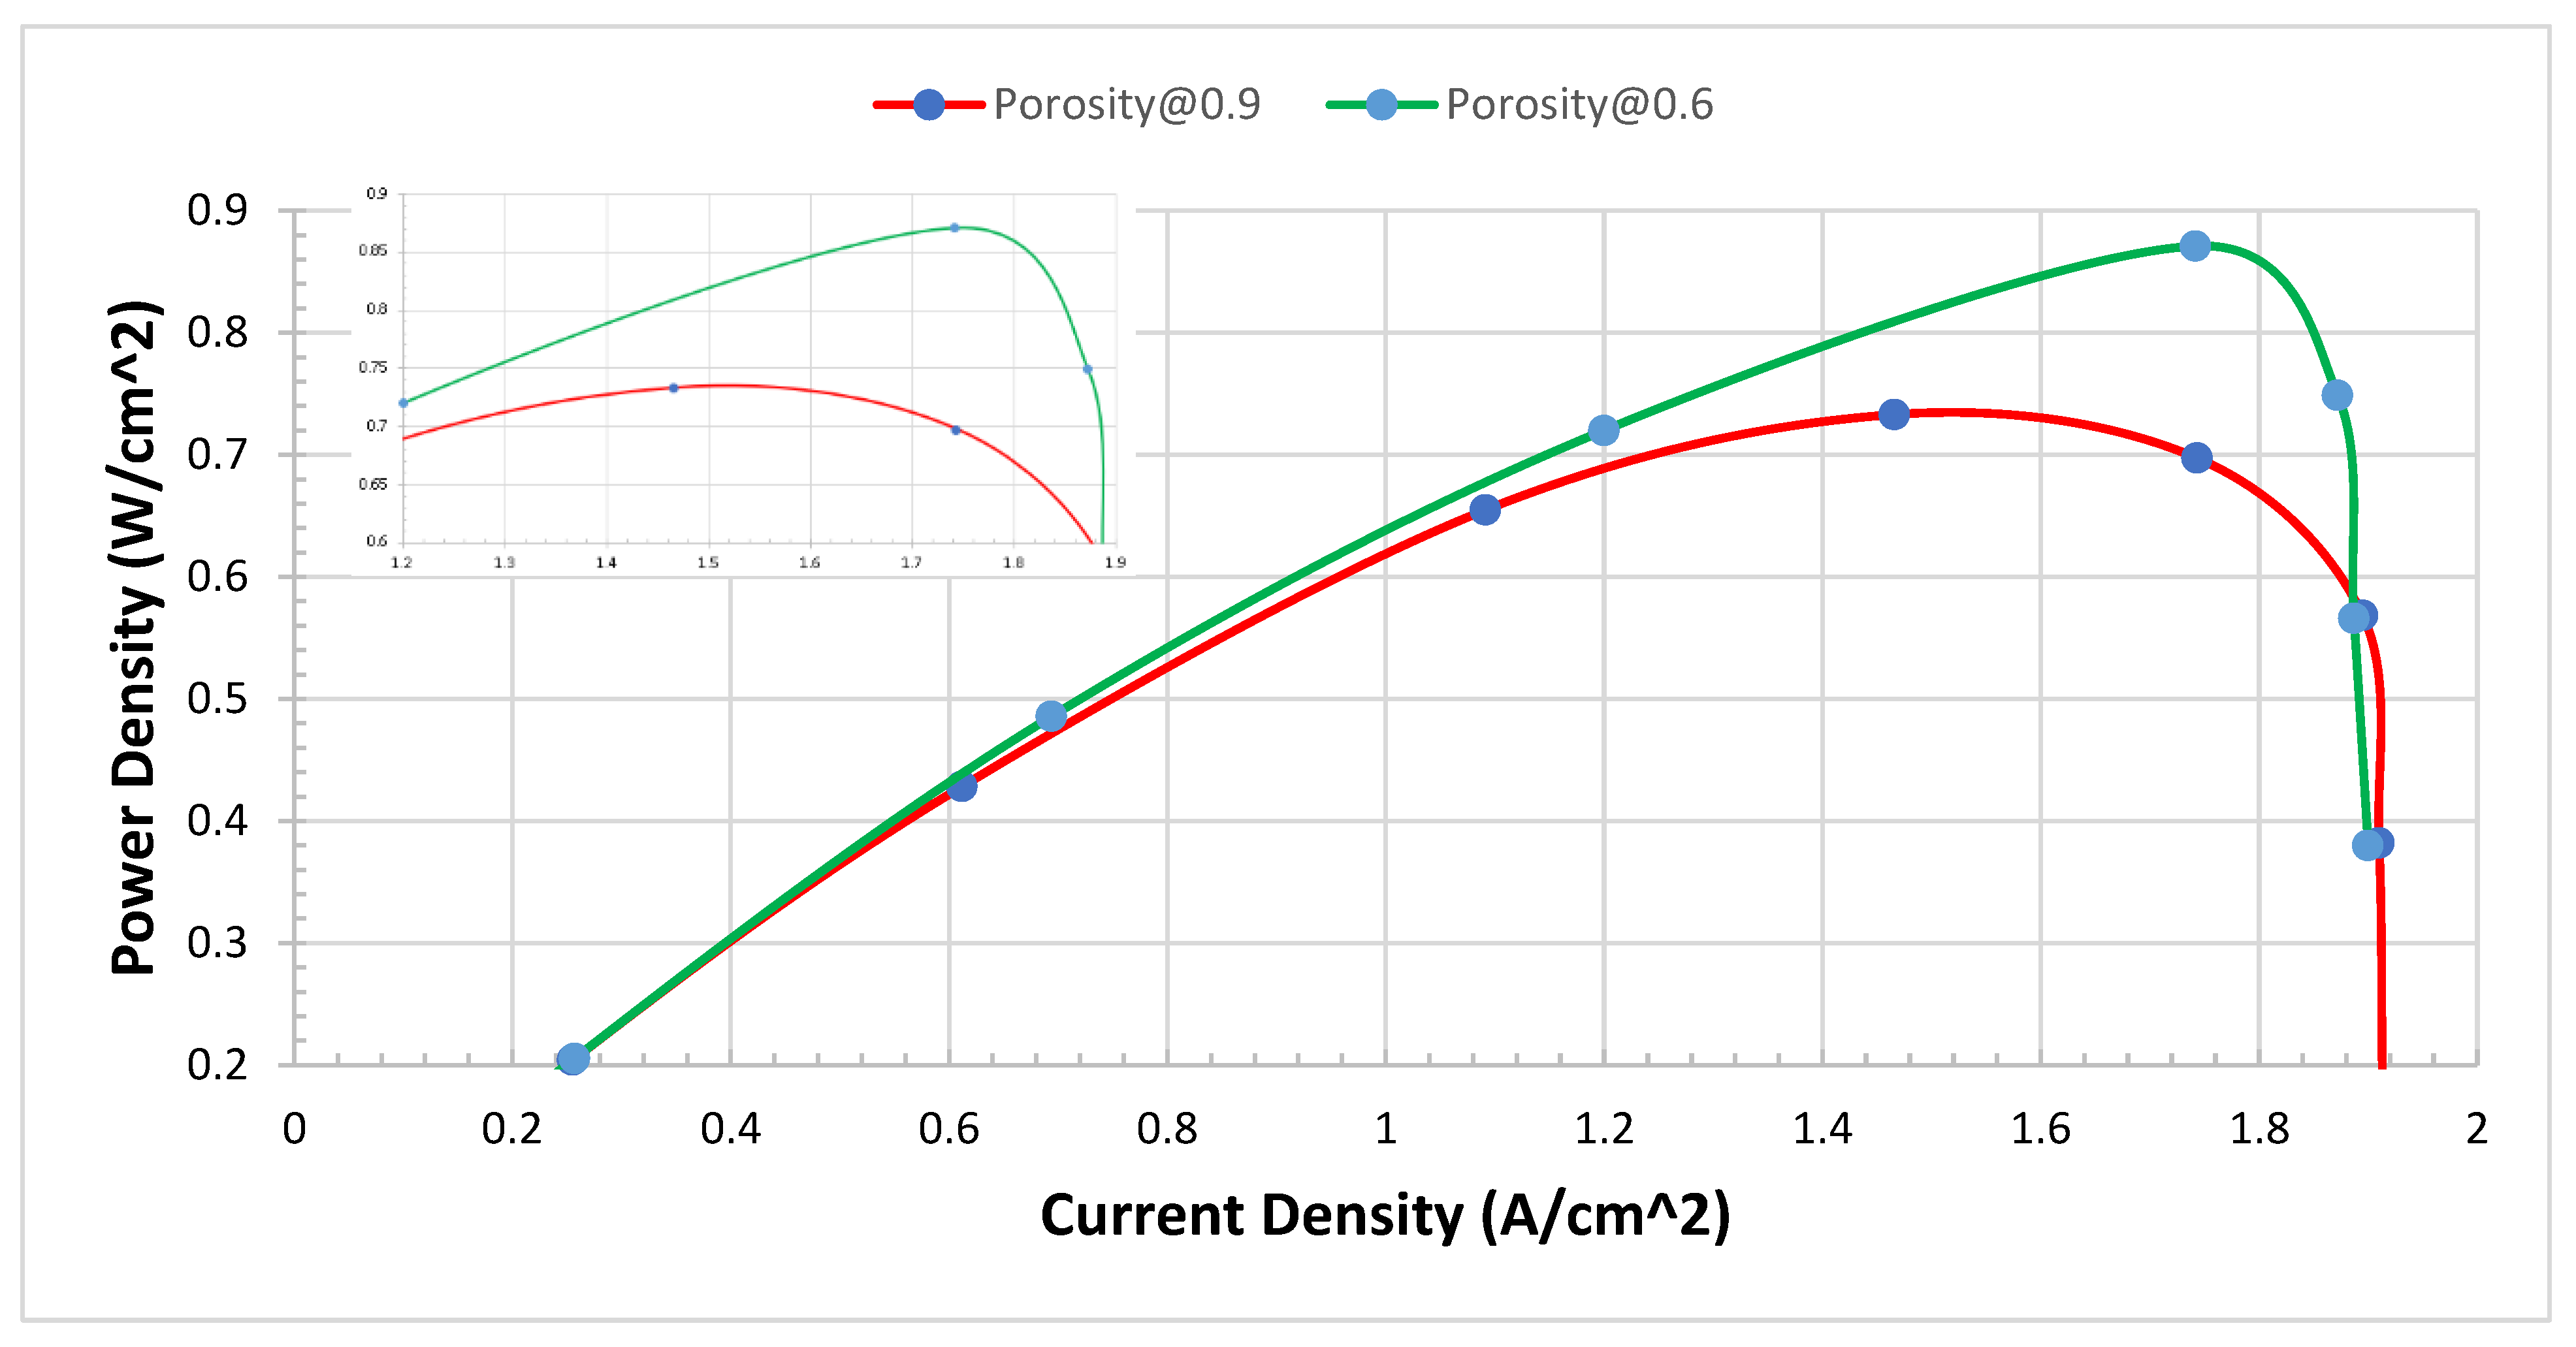
Further analysis and investigation were carried out to find the power density between 0.9 and 0.6 of porosity of metal foam. After we notice clear results, we plot the I-P curves to find out the improvement in power density. The I-P curves of 0.6 and 0.9 of porosity of metal foam of modelling of PEMFCs. Both the P-I curve, and V-I polarization curves show that there is a clear improvement are shown in
Figure 13. Further analysis was conducted to show a clear area of improvement in power density.
5. Conclusions
This paper presents a novel strategy to model the Proton Exchange Membrane Fuel Cell (PEMFC) in Ansys Fluent and discusses the outcomes. In this research, we create a well-validated comprehensive 3D model for PEMFCs in Ansys Fluent. Also, the effect of the porosity of Metal Foam (MF) was investigated. The performance of PEMFCs under the variations of porosity of MF was carried out in different tests. The porosity of the MF of PEMFCs at 0.6 was found to give better performance. It improved the power density of PEMFCs, which ultimately can contribute to the advancement and commercialise of PEMFC technology.
We have conducted several tests of the PEMFCs in the lab. The compression of MF, catalyst layer (CL), Gas Diffusion Layer (GDL), and membrane then the assembling of components of a single PEMFC were carried out for several tests in a couple of years. It is extensive work that is complementary between simulation and experimental works. But in simulation, we can focus on continuing to see what happens inside the PEMFCs. This facility is only available in simulations, and we cannot test in real time. In the lab, we can measure the I-V curve or I-P curves and other measurements such as Z impedance. But here in the model, we can see what happens inside the model of PEMFCs by using a contour graph. This model allows us to select the inlets and outlets. We have set up the H2 at anode 0.8 and in contour, we notice this. Also, O2 was set up to 0.2 at the cathode. The species are H2, O2, N2 and H2O. We work out the mass fraction in different locations of PEMFCs. The improvement of power density reached 50% compared to the worst case of configuration which is between Case IV and Case II. However, in future, we can test the porosity of GDL and CL.
References
- Fuel Cell Store, 2017. Flow-Field Design [Online]. https://www.fuelcellstore.com/blog-section/flow-field-design. [Accessed 27/06/2020].
- ARVAY, A., FRENCH, J., WANG, J.-C., PENG, X.-H. & KANNAN, A. M. Nature inspired flow field designs for proton exchange membrane fuel cell. International Journal of hydrogen energy 2013, 38, 3717–3726. [Google Scholar] [CrossRef]
- AWIN, Y. & DUKHAN, N. Experimental performance assessment of metal-foam flow fields for proton exchange membrane fuel cells. Applied Energy 2019, 252, 113458. [Google Scholar] [CrossRef]
- CARCADEA, E., VARLAM, M., ISMAIL, M., INGHAM, D. B., MARINOIU, A., RACEANU, M., JIANU, C., PATULARU, L. & ION-EBRASU, D. PEM fuel cell performance improvement through numerical optimization of the parameters of the porous layers. International Journal of Hydrogen Energy.
- CATLIN, G. 2010. PEM fuel cell modeling and optimization using a genetic algorithm. University of Delaware.
- CHEN, F., CHANG, M.-H. & HSIEH, P.-T. Two-phase transport in the cathode gas diffusion layer of PEM fuel cell with a gradient in porosity. International Journal of Hydrogen Energy 2008, 33, 2525–2529. [Google Scholar] [CrossRef]
- CHU, H.-S., YEH, C. & CHEN, F. Effects of porosity change of gas diffuser on performance of proton exchange membrane fuel cell. Journal of Power Sources 2003, 123, 1–9. [Google Scholar] [CrossRef]
- COURANT, R., ROBBINS, H. & STEWART, I. 1996. What is Mathematics?: An Elementary Approach to Ideas and Methods, Oxford University Press.
- CURTIS, C. & YANKOVSKY, A. 2011. Edexcel IGCSE Chemistry: Revision Guide, Pearson Education Limited.
- DING, R., YIN, W., CHENG, G., CHEN, Y., WANG, J., WANG, R., RUI, Z., LI, J. & LIU, J. Boosting the optimization of membrane electrode assembly in proton exchange membrane fuel cells guided by explainable artificial intelligence. Energy and AI 2021, 5, 100098. [Google Scholar] [CrossRef]
- DING, R., ZHANG, S., CHEN, Y., RUI, Z., HUA, K., WU, Y., LI, X., DUAN, X., WANG, X. & LI, J. Application of machine learning in optimizing proton exchange membrane fuel cells: a review. Energy and AI 2022, 9, 100170. [Google Scholar] [CrossRef]
- FENG, Z., HUANG, J., JIN, S., WANG, G. & CHEN, Y. Artificial intelligence-based multi-objective optimisation for proton exchange membrane fuel cell: A literature review. Journal of Power Sources 2022, 520, 230808. [Google Scholar] [CrossRef]
- FOX, H. W. & ROBERTS, R. 1962. Fuel Cells. IRE Transactions on Military Electronics, MIL-6, 46-57.
- GAO, F., RAJASHEKARA, K. & BUJA, G. Power electronics for extending lifetime and robustness of fuel cell systems. IEEE Transactions on Industrial Electronics 2017, 64, 6603–6606. [Google Scholar] [CrossRef]
- GIACOPPO, G., HOVLAND, S. & BARBERA, O. 2 kW Modular PEM fuel cell stack for space applications: Development and test for operation under relevant conditions. Applied Energy 2019, 242, 1683–1696. [Google Scholar] [CrossRef]
- GROSHONG, R. H. & GROSHONG, R. 2006. 3-D structural geology, Springer.
- GURIKAR, S. G. The Emergence of Physics as a Study and its Importance in Society-An Analysis. IJRAR-International Journal of Research and Analytical Reviews (IJRAR), 2015; 2, 344-351-344-351. [Google Scholar]
- HAMILTON, P. J. 2014. The development of PVD coatings for PEM fuel cell bipolar plates. University of Birmingham.
- HOROVITZ, K. L. & JOHNSON, V. A. 1959. Solid State Physics, Part A, Elsevier Science.
- HUANG, Z., CAI, G., LIU, W. & LIU, Z. Performance Optimization and Water Management of Polymer Electrolyte Membrane Fuel Cell with Two-Direction Graded Porosity Design of Cathode Gas Diffusion Layer. Journal of Energy Engineering, 2021, 147, 04021002. [Google Scholar] [CrossRef]
- JHA, V., HARIHARAN, R. & KRISHNAMURTHY, B. A 3 dimensional numerical model to study the effect of GDL porosity on high temperature PEM fuel cells. International Journal of Heat and Mass Transfer 2020, 161, 120311. [Google Scholar] [CrossRef]
- KAHRAMAN, H. & COBAN, A. Performance Improvement of a Single PEM Fuel Cell Using an Innovative Flow Field Design Methodology. Arabian Journal for Science and Engineering 2020, 1–10. [Google Scholar]
- KAKATI, B. K.; DEKA, D. Effect of resin matrix precursor on the properties of graphite composite bipolar plate for PEM fuel cell. Energy fuels, 2007, 21, 1681–1687. [Google Scholar] [CrossRef]
- KLOESS, J. P., WANG, X., LIU, J., SHI, Z. GUESSOUS, L. Investigation of bio-inspired flow channel designs for bipolar plates in proton exchange membrane fuel cells. Journal of Power Sources 2009, 188, 132–140. [Google Scholar] [CrossRef]
- KUMAR, A. & REDDY, R. G. Modeling of polymer electrolyte membrane fuel cell with metal foam in the flow-field of the bipolar/end plates. Journal of Power Sources 2003, 114, 54–62. [Google Scholar] [CrossRef]
- LARMINIE, J., DICKS, A. & MCDONALD, M. S. 2003. Fuel cell systems explained, J. Wiley Chichester, UK.
- LEGALA, A., ZHAO, J. & LI, X. Machine learning modeling for proton exchange membrane fuel cell performance. Energy and AI 2022, 10, 100183. [Google Scholar] [CrossRef]
- LIM, I. S., PARK, J. Y., KANG, D. G., CHOI, S. H., KANG, B. & KIM, M. S. Numerical study for in-plane gradient effects of cathode gas diffusion layer on PEMFC under low humidity condition. International Journal of Hydrogen Energy 2020, 45, 19745–19760. [Google Scholar] [CrossRef]
- LIU, Y., WU, S., QIN, Y., ZHANG, M., LIU, X., ZHANG, J. & YIN, Y. Mass transport and performance of proton exchange membrane fuel cell considering the influence of porosity distribution of gas diffusion layer. International Journal of Green Energy 2022, 19, 1503–1511. [Google Scholar] [CrossRef]
- MAITRA, A. & BAGCHI, S. Study of solute–solvent and solvent–solvent interactions in pure and mixed binary solvents. Journal of Molecular Liquids 2008, 137, 131–137. [Google Scholar] [CrossRef]
- MCCABE, W. L., SMITH, J. C. & HARRIOTT, P. 1993. Unit operations of chemical engineering, McGraw-hill New York.
- NIC, M., HOVORKA, L., JIRAT, J., KOSATA, B. & ZNAMENACEK, J. IUPAC. Compendium of Chemical Terminology 2nd ed.(the “Gold Book”). International Union of Pure and Applied Chemistry, v. Version, 2005, 2, 1281–1282. [Google Scholar]
- O'HAYRE, R., CHA, S.-W., COLELLA, W. & PRINZ, F. B. 2016. Fuel cell fundamentals, John Wiley & Sons.
- RAHIMIAN, P., BATTRELL, L., ANDERSON, R., ZHU, N., JOHNSON, E. & ZHANG, L. Investigation of time dependent water droplet dynamics on porous fuel cell material via synchrotron based X-ray imaging technique. Experimental Thermal and Fluid Science 2018, 97, 237–245. [Google Scholar] [CrossRef]
- RAJ, B., VAN DE VOORDE, M. & MAHAJAN, Y. 2017. Nanotechnology for Energy Sustainability, 3 Volume Set, Wiley.
- SAUERMOSER, M., KIZILOVA, N., POLLET, B. & KJELSTRUP, S. 2020. Flow field patterns for proton exchange membrane (PEM) fuel cells.
- SENATECH, N. 2023. Engineering Statistics Handbook [Online]. https://www.itl.nist.gov/div898/handbook/eda/section3/contour.htm#:~:text=A%20contour%20plot%20is%20a,where%20that%20z%20value%20occurs. [Accessed].
- SPIEGEL, C. 2007. Designing and building fuel cells, Citeseer.
- SPIEGEL, C. 2011. PEM fuel cell modeling and simulation using MATLAB, Elsevier.
- TANG, Y., YUAN, W., PAN, M. & WAN, Z. Feasibility study of porous copper fiber sintered felt: A novel porous flow field in proton exchange membrane fuel cells. International Journal of Hydrogen Energy 2010, 35, 9661–9677. [Google Scholar] [CrossRef]
- TURKMEN, A. C. & CELIK, C. The effect of different gas diffusion layer porosity on proton exchange membrane fuel cells. Fuel 2018, 222, 465–474. [Google Scholar] [CrossRef]
- WU, Z., NI, M., ZHU, P. & ZHANG, Z. Dynamic modeling of a NG-fueled SOFC-PEMFC hybrid system coupled with TSA process for fuel cell vehicle. Energy Procedia 2019, 158, 2215–2224. [Google Scholar] [CrossRef]
- YANG, P., WANG, Y., YANG, Y., YUAN, L. & JIN, Z. Effects of Gas Diffusion Layer Porosity Distribution on Proton Exchange Membrane Fuel Cell. Energy Technology 2021, 9, 2001012. [Google Scholar] [CrossRef]
- YU, L. C. 2016. Mathematical modelling of liquid fuel cells with applications in uncertainty analysis and system operation.
- ZABOROWSKA, Ł. 2023. Mole Fraction Calculator [Online]. https://www.omnicalculator.com/chemistry/mole-fraction. [Accessed 24/07/2023].
- ZHANG, J., XUAN, D., LIU, S. & CHEN, C. 2023. Influence and Optimization of Gas Diffusion Layer Porosity Distribution along the Flow Direction on the Performance of Proton Exchange Membrane Fuel Cells. ACS Omega.
- ZHANG, Y., VERMA, A. & PITCHUMANI, R. Optimum design of polymer electrolyte membrane fuel cell with graded porosity gas diffusion layer. International Journal of Hydrogen Energy 2016, 41, 8412–8426. [Google Scholar] [CrossRef]
- ZHAO, J., LI, X., SHUM, C. & MCPHEE, J. A review of physics-based and data-driven models for real-time control of polymer electrolyte membrane fuel cells. Energy and AI 2021, 6, 100114. [Google Scholar] [CrossRef]
- ZUMDAHL, S. S. & ZUMDAHL, S. A. 2008. Chemistry, Cengage Learning.
|
Disclaimer/Publisher’s Note: The statements, opinions and data contained in all publications are solely those of the individual author(s) and contributor(s) and not of MDPI and/or the editor(s). MDPI and/or the editor(s) disclaim responsibility for any injury to people or property resulting from any ideas, methods, instructions or products referred to in the content. |
© 2024 by the authors. Licensee MDPI, Basel, Switzerland. This article is an open access article distributed under the terms and conditions of the Creative Commons Attribution (CC BY) license (http://creativecommons.org/licenses/by/4.0/).
