Submitted:
10 July 2024
Posted:
11 July 2024
You are already at the latest version
Abstract
Keywords:
1. Introduction
2.Materials and Methods
3. Results and Discussion
3.1. Sturcture, Surface Morphology and Composition
3.2. THz Optical and Electrical Properties


 [100], where ωp = Nc e2τ/m* and τ are unscreened plasma frequency and scattering time of carriers in the material; Nc, e, and m* = 0.3 m0 [101] are free-electron concentration, electronic charge and effective mass of the electron, respectively, whereas m0
is the electron mass. The real part of the THz conductivity, Re{σ}, exhibits a maximum at zero (DC) frequency, and its value decreases with increasing frequency. For Im{σ} [55,56,57,58,59], it can only be positive and approaches
a maximum as the frequency approaches that of the inverse of the scattering rate.
We have found, however, that the THz conductivities of ITO films and nanostructures
exhibit non-Drude-like behavior, e.g., depressed values of DC conductivity and negative
values for Im{σ} [55,56,57,58,59]. Therefore, a more generalized conductivity model such as the Drude-Smith model [102], which considers the carrier localization effect, can be considered to describe THz
conductivity of the ITO material, In this model,
3.3. Annealing Effects on UV-VIS-NIR Optical Properties of ITO Films
4. Conclusions
Author Contributions
Funding
Institutional Review Board Statement
Informed Consent Statement
Data Availability Statement
Acknowledgments
Conflicts of Interest
References
- Ellmer, K. Past achievements and future challenges in the development of optically transparent electrodes. Nat. Photon. 2012, 6, 809–817. [Google Scholar] [CrossRef]
- Ginley, D.; Hosono, H.; Paine, D. Handbook of Transparent Conductors; Springer: New York, 2010. [Google Scholar]
- Chavan, G.T.; Kim, Y.; Khokhar, M.Q.; Hussain, S.Q.; Cho, E.-C.; Yi, J.; Ahmad, Z.; Rosaiah, P.; Jeon, C.-W. A Brief Review of Transparent Conducting Oxides (TCO): The Influence of Different Deposition Techniques on the Efficiency of Solar Cells. Nanomaterials 2023, 13, 1226. [Google Scholar] [CrossRef] [PubMed]
- Tripathi, M.N.; Bahramy, M.S.; Shida, K.; Sahara, R.; Mizuseki, H.; Kawazoe, Y. Optoelectronic and magnetic properties of Mn-doped indium tin oxide: A first-principles study. J. Appl. Phys. 2012, 112, 073105. [Google Scholar] [CrossRef]
- Hamberg, I.; Granqvist, C.G.; Berggren, K.F.; Sernelius, B.E.; Engström, L. Band-gap widening in heavily Sn-doped In2O3. Phys. Rev. B 1984, 30, 3240–3249. [Google Scholar] [CrossRef]
- Li, S.; Tian, M.; Gao, Q.; Wang, M.; Li, T.; Hu, Q.; Li, X.; Wu, Y. Nanometre-thin indium tin oxide for advanced high-performance electronics. Nat. Mater. 2019, 18, 1091–1097. [Google Scholar] [CrossRef] [PubMed]
- Yu, Z.; Perera, I.R.; Daeneke, T.; Makuta, S.; Tachibana, Y.; Jasieniak, J.J.; Mishra, A.; Bäuerle, P.; Spiccia, L.; Bach, U. Indium tin oxide as a semiconductor material in efficient p-type dye-sensitized solar cells. NPG Asia Mater. 2016, 8, e305. [Google Scholar] [CrossRef]
- Ma, Z.; Li, Z.; Liu, K.; Ye, C.; Sorger, V.J. Indium-tin-oxide for high-performance electro-optic modulation. Nanophotonics 2015, 4, 198–213. [Google Scholar] [CrossRef]
- Dhere, R.G.; Gessert, T.A.; Schilling, L.L.; Nelson, A.J.; Jones, K.M.; Aharoni, H.; Coutts, T.J. Electro-optical properties of thin indium tin oxide films: Limitations on performance. Solar Cells 1987, 21, 281–290. [Google Scholar] [CrossRef]
- Shi, K.; Haque, R.R.; Zhao, B.; Zhao, R.; Lu, Z. Broadband electro-optical modulator based on transparent conducting oxide. Opt. Lett. 2014, 39, 4978–4981. [Google Scholar] [CrossRef] [PubMed]
- Si, M.; Andler, J.; Lyu, X.; Niu, C.; Datta, S.; Agrawal, R.; Ye, P.D. Indium-Tin-Oxide Transistors with One Nanometer Thick Channel and Ferroelectric Gating. ACS Nano 2020, 14, 11542–11547. [Google Scholar] [CrossRef]
- Kim, H.; Gilmore, C.M.; Piqué, A.; Horwitz, J.S.; Mattoussi, H.; Murata, H.; Kafafi, J.H.; Chrisey, D.B. Electrical, optical, and structural properties of indium-tin-oxide thin films for organic light-emitting devices. J. Appl. Phys. 1999, 86, 6451–6461. [Google Scholar] [CrossRef]
- Lee, S.; Noh, J.H.; Bae, S.-T.; Cho, I.-S.; Kim, J.Y.; Shin, H.; Lee, J.-K.; Jung, H.S.; Hong, K.S. Indium-tin-oxide-based transparent conducting layers for highly efficient photovoltaic devices. J. Phys. Chem. 2009, C 113, 7443–7447. [Google Scholar] [CrossRef]
- Janarthanan, B.; Thirunavukkarasu, C.; Maruthamuthu, S.; Manthrammel, M.A.; Shkir, M.; Al Faify, S.; Selvakumar, M.; Reddy, V.R.M.; Park, C. Basic deposition methods of thin films. J. Mol. Struct. 2021, 1241, 130606. [Google Scholar] [CrossRef]
- Laux, S.; Kaiser, N.; Zöller, A.; Götzelmann, R.; Lauth, H.; Bernitzki, H. Room-temperature deposition of indium tin oxide thin films with plasma ion-assisted evaporation. Thin Solid Films 1998, 335, 1–5. [Google Scholar] [CrossRef]
- Park, S.K.; Jeong, I.H.; Kim, W.K.; Kwak, M.G. Deposition of indium-tin-oxide films on polymer substrates for application in plastic-based flat panel displays. Thin Solid Films 2001, 397, 49–55. [Google Scholar] [CrossRef]
- Stadler, A. Transparent Conducting Oxides—An Up-To-Date Overview. Materials 2012, 5, 661–683. [Google Scholar] [CrossRef] [PubMed]
- Alam, M.J.; Cameron, D.C. Optical and electrical properties of transparent conductive ITO thin films deposited by sol–gel process. Thin solid films 2000, 377, 455–459. [Google Scholar] [CrossRef]
- Senthilkumar, V.; Vickraman, P.; Jayachandran, M.; Sanjeeviraja, C. Structural and optical properties of indium tin oxide (ITO) thin films with different compositions prepared by electron beam evaporation. Vacuum 2010, 84, 864–869. [Google Scholar] [CrossRef]
- Robb, A.J.; Duca, Z.A.; White, N.; Woodell, P.; Ward, P.A. Influence of oxygen on the optical and electrical properties of magnetron-sputtered indium tin oxide thin films at ambient temperature. Thin Solid Films 2024, 788, 140152. [Google Scholar] [CrossRef]
- Alabdan, H.I.; Alsahli, F.M.; Bhandari, S.; Mallick, T. Monolithic Use of Inert Gas for Highly Transparent and Conductive Indium Tin Oxide Thin Films. Nanomaterials 2024, 14, 565. [Google Scholar] [CrossRef]
- Jung, J.; Guo, R. Optimized sputtering parameters for ITO thin films of high conductivity and transparency. Advances and applications in electroceramics II: Ceramic transactions 2012, 235, 43–53. [Google Scholar]
- Li, M.; Mo, C.; Chen, J.; Ji, P.; Tan, H.; Zhang, X.; CUI, M.; ZHUGE, L.; WU, X.; Huang, T. Effects of power on ion behaviors in radio-frequency magnetron sputtering of indium tin oxide (ITO). Plasma Sci. Technol. 2024, 26, 075506. [Google Scholar] [CrossRef]
- Huang, T.; Mo, C.; Cui, M.; Li, M.; Ji, P.; Tan, H.; Zhang, X.; Zhuge, L.; Wu, X. Ion behavior impact on ITO thin film fabrication via DC magnetron sputtering with external anode. Vacuum 2024, 221, 112848. [Google Scholar] [CrossRef]
- Zhang, X.; Zhang, G.; Yan, Y. Effects of Doping Ratio and Thickness of Indium Tin Oxide Thin Films Prepared by Magnetron Sputtering at Room Temperature. Coatings 2023, 13, 2016. [Google Scholar] [CrossRef]
- Balasubramanian, N.; and Subrahmanyam, A. Electrical and optical properties of reactively evaporated indium tin oxide (ITO) films-dependence on substrate temperature and tin concentration. J. Phys. D: Appl. Phys. 1989, 22, 206. [Google Scholar] [CrossRef]
- Nisha, M.; Anusha, S.; Antony, A.; Manoj, R.; Jayaraj, M.K. Effect of substrate temperature on the growth of ITO thin films. Appl. Surf. Sci. 2005, 252, 1430–1435. [Google Scholar] [CrossRef]
- Meng, L.-J.; dos Santos, M.P. Properties of indium tin oxide films prepared by RF reactive magnetron sputtering at different substrate temperature. Thin Solid Films 1998, 322, 56–62. [Google Scholar] [CrossRef]
- Kurdesau, F.; Khripunov, G.; Cunha, A.F.; Kaelin, M.; Tiwari, A.N. Comparative study of ITO layers deposited by DC and RF magnetron sputtering at room temperature. J. Non-Cryst. Solids 2015, 352, 1466–1470. [Google Scholar] [CrossRef]
- Yang, S.; Zhong, J.; Sun, B.; Zeng, X.; Luo, W.; Zhao, X.; Shu, Y.; Chen, J.; He, J. Influence of base pressure on property of sputtering deposited ITO film. J. Mater. Sci. Mater. Electron. 2019, 30, 13005–13012. [Google Scholar] [CrossRef]
- Meng, L.J.; Dos Santos, M.P. Properties of indium tin oxide (ITO) films prepared by rf reactive magnetron sputtering at different pressures. Thin solid films. 1997, 303, 151–155. [Google Scholar] [CrossRef]
- Liu, Z.; Liang, J.; Zhou, H.; Sun, H.; Lu, W.; Wang, B.; Li, Q.; Zhao, X.; Wang, D.; Xu, J. Effect of nitrogen partial pressure on the piezoresistivity of magnetron sputtered ITO thin films at high temperatures. Applied Surface Science, 2023, 608, 55292. [Google Scholar] [CrossRef]
- Guileen, C.; Herrero, J. Structure, optical and electrical properties of indium tin oxide thin films prepared by sputtering at room temperature and annealed in air or nitrogen. J. Appl. Phys. 2007, 101, 073514–073521. [Google Scholar] [CrossRef]
- Hamouda, F.; Herth, E.; David, C.; Bayle, F.; Plante, M.P.; Martin, A.; Aassime, A. Electrical and optical properties of sputtered ultra-thin indium tin oxide films using xenon/argon gas. J. Mater. Sci. Mater. Electron. 2019, 30, 8508–8514. [Google Scholar] [CrossRef]
- Janarthanan, B.; Thirunavukkarasu, C.; Maruthamuthu, S.; Manthrammel, M.A.; Shkir, M.; Al Faify, S.; Selvakumar, M.; Reddy, V.R.M.; Park, C. Basic deposition methods of thin films. J. Mol. Struct. 2021, 1241, 130606. [Google Scholar] [CrossRef]
- Baptista, A.; Silva, F.; Porteiro, J.; Míguez, J.; Pinto, G. Sputtering physical vapour deposition (PVD) coatings: A critical review on process improvement and market trend demands. Coatings 2018, 8, 402. [Google Scholar] [CrossRef]
- Donercark, E.; Guler, S.; Ciftpinar, E.H.; Kabacelik, I.; Koc, M.; Ercelebi, A.C.; Turan, R. Impact of oxygen partial pressure during Indium Tin Oxide sputtering on the performance of silicon heterojunction solar cells. Mater. Sci. Eng. B. 2022, 281, 115750. [Google Scholar] [CrossRef]
- Ahmed, N.M.; Sabah, F.A.; Abdulgafour, H.I.; Alsadig, A.; Sulieman, A.; Alkhoaryef, M. The effect of post annealing temperature on grain size of indium-tin-oxide for optical and electrical properties improvement. Results Phys. 2019, 13, 102159. [Google Scholar] [CrossRef]
- Seong, S.; Jung YCh Lee, T.; Park, I.-S.; Ahn, J. Enhanced uniformity in electrical and optical properties of ITO thin films using a wide thermal annealing system. Mater. Sci. Semicond. Proc. 2018, 79, 14–19. [Google Scholar] [CrossRef]
- Kaźmierczak-Bałata, A.; Bodzenta, J.; Dehbashi, M.; Mayandi, J.; Venkatachalapathy, V. Influence of Post Processing on Thermal Conductivity of ITO Thin Films. Materials 2023, 16, 362. [Google Scholar] [CrossRef]
- Shubitidze, T.; Britton, W.A.; Negro, L.D. Enhanced Nonlinearity of Epsilon-Near-Zero Indium Tin Oxide Nanolayers with Tamm Plasmon-Polariton States. Adv. Optical Mater. 2024, 12, 2301669. [Google Scholar] [CrossRef]
- Kim, T.; Chae, M.; Lee, D.; Kim, H.D. Enhanced optical and electrical properties of indium tin oxide for solar cell applications via post-microwave treatment. Optical Materials 2024, 149, 115093. [Google Scholar] [CrossRef]
- Park, J.-H.; Seok, H.-J.; Jung, S.H.; Cho, H.K.; Kim, H.-K. Rapid Thermal Annealing Effect of Transparent ITO Source and Drain Electrode for Transparent Thin Film Transistors. Ceram. Int. 2021, 47, 3149–3158. [Google Scholar] [CrossRef]
- Minami, T. Transparent conducting oxide semiconductors for transparent electrodes. Semicond. Sci. Technol. 2005, 20, S35. [Google Scholar] [CrossRef]
- Li, J.; Jiang, L.; Li, X.; Luo, J.; Liu, J.; Wang, M.; Yan, Y. Different Crystallization Behavior of Amorphous ITO Film by Rapid Infrared Annealing and Conventional Furnace Annealing Technology. Materials 2023, 16, 3803. [Google Scholar] [CrossRef]
- Chen, M.F.; Lin, K.M.; Ho, Y.S. Laser annealing process of ITO thin films using beam shaping technology. Optics and Lasers in Engineering 2012, 50, 491–495. [Google Scholar] [CrossRef]
- Kim, J.H.; Jeon, K.A.; Kim, G.H.; Lee, S.Y. Electrical, structural, and optical properties of ITO thin films prepared at room temperature by pulsed laser deposition. Appl. Surf. Sci. 2006, 252, 4834–4837. [Google Scholar] [CrossRef]
- Prepelita, P.; Stavarache, I.; Craciun, D.; Garoi, F.; Negrila, C.; Sbarcea, B.G.; Craciun, V. Rapid thermal annealing for high-quality ITO thin films deposited by radio-frequency magnetron sputtering. Beilstein J. Nanotechnol. 2019, 10, 1511–1522. [Google Scholar] [CrossRef]
- Song, S.; Yang, T.; Liu, J.; Xin, Y.; Li, Y.; Han, S. Rapid thermal annealing of ITO films. Appl. Surf. Sci. 2011, 257, 7061–7064. [Google Scholar] [CrossRef]
- Park, C.-Y.; Jeon, S.-P.; Park, J.B.; Park, H.-B.; Kim, D.-H.; Yang, S.H.; Kim, G.; Jo, J.-W.; Oh, M.S.; Kim, M.; et al. High-performance ITO/a-IGZO heterostructure TFTs enabled by thickness-dependent carrier concentration and band alignment manipulation. Ceram. Int. 2023, 49, 5905–5914. [Google Scholar] [CrossRef]
- Maniyara, R.A.; Graham, C.; Paulillo, B.; Bi, Y.; Chen, Y.; Herranz, G.; Baker, D.E.; Mazumder, P.; Konstantatos, G.; Pruneri, V. Highly transparent and conductive ITO substrates for near infrared applications. APL Mater. 2021, 9, 021121. [Google Scholar] [CrossRef]
- Yun, J.H.; Kim, J.; Park, Y.C. Transparent Conductor-Si pillars heterojunction photodetector. J. Appl. Phys. 2014, 116, 064904. [Google Scholar] [CrossRef]
- Hamberg, I.; Granqvist, C.G. Evaporated Sn-doped In2O3 films: Basic optical properties and applications to energy-efficient windows. Journal of Applied Physics, 1986, 60, R123–R160. [Google Scholar] [CrossRef]
- Uprety, P.; Junda, M.M.; Salmon, H.; Podraza, N.J. Understanding near infrared absorption in tin doped indium oxide thin films. Journal of Physics D: Applied Physics. 2018, 51, 295302. [Google Scholar] [CrossRef]
- Chen, C.-W.; Lin, Y.-C.; Chang, C.-H.; Yu, P.; Shieh, J.-M.; Pan, C.-L. Frequency-dependent complex conductivities and dielectric responses of indium tin oxide thin films from the visible to the far-infrared. IEEE J. Quantum Electron. 2010, 46, 1746–1754. [Google Scholar] [CrossRef]
- Yang, C.S.; Chang, C.H.; Lin, M.H.; Yu, P.; Wada, O.; Pan, C.L. THz conductivities of indium-tin-oxide nanowhiskers as a graded-refractive-index structure. Optics Express 2012, 20, A441–A451. [Google Scholar] [CrossRef] [PubMed]
- Yang, C.S.; Chang, C.M.; Chen, P.H.; Yu, P.; Pan, C.L. Broadband terahertz conductivity and optical transmission of indium-tin-oxide (ITO) nanomaterials. Opt. Express 2013, 21, 16670–16682. [Google Scholar] [CrossRef] [PubMed]
- Yang, C.-S.; Lin, M.-H.; Chang, C.-H.; Yu, P.; Shieh, J.-M.; Shen, C.-H.; Wada, O.; Pan, C.-L. Non-Drude behavior in indium-tin-oxide nanowhiskers and thin films investigated by transmission and reflection THz time-domain spectroscopy. IEEE J. Quantum Electron. 2013, 49, 677–690. [Google Scholar] [CrossRef]
- Pan, C.-L.; Yang, C.-S.; Pan, R.-P.; Yu, P.; Lin, G.-R. Nanostructured Indium Tin Oxides and other Transparent Conducting Oxides: Characteristics and Applications in the THz Frequency Range. In Terahertz Spectroscopy—A Cutting Edge Technology; Chapter 14; Uddin, J., Ed.; InTech Open: London, UK, 2017; pp. 267–286. [Google Scholar]
- Wang, T.; Zalkovskij, M.; Iwaszczuk, K.; Lavrinenko, A.V.; Naik, G.V.; Kim, J.; Boltasseva, A.; Jepsen, P.U. Ultrabroadband terahertz conductivity of highly doped ZnO and ITO. Opt. Mater. Express 2015, 5, 566–575. [Google Scholar] [CrossRef]
- LaForge, J.M.; Cocker, T.L.; Beaudry, A.L.; Cui, K.; Tucker, R.T.; Taschuk, M.T.; Hegmann, F.A.; Brett, M.J. Conductivity control of as-grown branched indium tin oxide nanowire networks. Nanotechnology 2014, 25, 035701. [Google Scholar] [CrossRef] [PubMed]
- Bauer, T.; Kolb, J.; Löffler, T.; Mohler, E.; Roskos, H.; Pernisz, U. Indium–tin–oxide-coated glass as dichroic mirror for far-infrared electromagnetic radiation. J. Appl. Phys. 2002, 92, 2210–2212. [Google Scholar] [CrossRef]
- Jewell, S.A.; Hendry, E.; Isaac, T.H.; Sambles, J.R. Tuneable Fabry–Perot etalon for terahertz radiation. New Journal of Physics 2008, 10, p033012. [Google Scholar] [CrossRef]
- Tsubouchi, M.; Kumada, T. Development of high efficiency etalons with an optical shutter for terahertz laser pulses. Opt. Express 2012, 20, 28500–28506. [Google Scholar] [CrossRef] [PubMed]
- Yang, C.-S.; Tang, T.-T.; Pan, R.-P.; Yu, P.; Pan, C.-L. Liquid crystal terahertz phase shifters with functional indium-tin-oxide nanostructure for biasing and alignment. Appl. Phys. Lett. 2014, 104, 141106. [Google Scholar] [CrossRef]
- Yang, C.S.; Tang, T.T.; Chen, P.H.; Pan, R.P.; Yu, P.; Pan, C.L. Voltage-controlled liquid-crystal terahertz phase shifter with indium–tin–oxide nanowhiskers as transparent electrodes. Opt. Lett. 2014, 39, 2511–2513. [Google Scholar] [CrossRef] [PubMed]
- Yang, C.S.; Kuo, C.; Chen, P.H.; Wu, W.T.; Pan, R.P.; Yu, P.; Pan, C.L. High-Transmittance 2π Electrically Tunable Terahertz Phase Shifter with CMOS-Compatible Driving Voltage Enabled by Liquid Crystals. Appl. Sci. 2019, 9, 271. [Google Scholar] [CrossRef]
- Sahoo, A.K.; Yang, C.-S.; Wada, O.; Pan, C.-L. Twisted nematic liquid crystal based terahertz phase shifter with crossed indium tin oxide finger type electrodes. IEEE Trans. Terahertz Sci. Technol. 2019, 9, 399–408. [Google Scholar] [CrossRef]
- Yang, J.; Cao, H.; Fang, H.; Lai, W.; Shi, G.; Deng, G.; Yin, Z.; Cai, F.; Li, Y. Reflectance-tunable terahertz polarization reflector using indium tin oxide. Optics Communications 2020, 460, 25149. [Google Scholar] [CrossRef]
- Shi, Z.; Song, L.; Zhang, T. Terahertz reflection and visible light transmission of ITO films affected by annealing temperature and applied in metamaterial absorber. Vacuum 2018, 149, 12–18. [Google Scholar] [CrossRef]
- Liu, Z.; Huang, C.-Y.; Liu, H.; Zhang, X.; Lee, C. Resonance enhancement of terahertz metamaterials by liquid crystals/indium tin oxide interfaces. Opt. Express 2013, 21, 6519–6525. [Google Scholar] [CrossRef]
- Bai, X.; Mei, Z.; Zhang, J.; Xu, W.; Lin, W.; Niu, T. An Ultra-wideband, Wide-angle And Transparent Microwave Absorber Using Indium Tin Oxide Conductive Films. IEEE Antennas and Wireless Propagation Letters 2024, 23, 1543–1547. [Google Scholar] [CrossRef]
- Sahoo, A.K.; Kang, S.-Y.; Yu, P.; Pan, C.-L. Enhanced Optically–Excited THz Wave Emission by GaAs Coated with a Rough ITO Thin Film. Coatings 2023, 13, 461. [Google Scholar] [CrossRef]
- Lu, Y.; Zhang, X.; Xu, Q.; Jia, W.; Feng, X.; Chen, X.; Gu, Y.; Yang, Y.; Zhang, W.; Han, J. Two-Color-Driven Controllable Terahertz Generation in ITO Thin Film. ACS Photonics 2024, 11, 293–300. [Google Scholar] [CrossRef]
- Sahoo, A.K.; Mai, C.-M.; Pan, C.-L. Enhancement of Indium tin oxide nano-scale films for terahertz device applications treated by rapid thermal annealing. In Proceedings of the 2020 45th International Conference on Infrared, Millimeter, and Terahertz Waves (IRMMW-THz), Buffalo, NY, USA, 8–13 November 2020. [Google Scholar]
- Tsai, T.R.; Chen, C.Y.; Pan, C.L.; Pan, R.P.; Zhang, X.C. Terahertz time-domain spectroscopy studies of the optical constants of the nematic liquid crystal 5CB. Appl. Opt. 2003, 42, 2372–2376. [Google Scholar] [CrossRef] [PubMed]
- Liu, T.A.; Tani, M.; Pan, C.-L. THz radiation emission properties of multi energy arsenic-ion-implanted GaAs and semi-insulating GaAs based photoconductive antennas. J. Appl. Phys. 2003, 93, 2996–3001. [Google Scholar] [CrossRef]
- Franz, G.; Lange, B.; Sotier, S. Characterization of sputtered indium tin oxide layers as transparent contact material. Journal of Vacuum Science & Technology A: Vacuum, Surfaces, and Films 2001, 19, 2514–2521. [Google Scholar]
- Yüzüak, G.D.; Coşkun, D. The effect of annealing on the structural, electrical, optical and electrochromic properties of indium-tin-oxide films deposited by RF magnetron sputtering technique. Optik 2017, 142, 320–326. [Google Scholar] [CrossRef]
- Chauhan, R.N.; Tiwari, N. Preparation of optically transparent and conducting radio-frequency sputtered indium tin oxide ultrathin films. Thin Solid Film. 2021, 717, 138471. [Google Scholar] [CrossRef]
- Stroescu, H.; Anastasescu, M.; Preda, S.; Nicolescu, M.; Stoica, M.; Stefan, N.; Kampylafka, V.; Aperathitis, E.; Modreanu, M.; Zaharescu, M.; et al. Influence of thermal treatment in N2 atmosphere on chemical, microstructural and optical properties of indium tin oxide and nitrogen doped indium tin oxide rf-sputtered thin films. Thin Solid Films 2013, 541, 121–126. [Google Scholar] [CrossRef]
- Reddy, V.R.; Reddy, M.S.; Rao, P.K. Effect of rapid thermal annealing on deep level defects in the Si-doped GaN. Microelectron. Eng. 2010, 87, 117–121. [Google Scholar] [CrossRef]
- Li, Q.; Mao, W.; Zhou, Y.; Yang, C.; Liu, Y.; He, C. Defects evolution and their impacts on conductivity of indium tin oxide thin films upon thermal treatment. J. Appl. Phys. 2015, 118, 025304. [Google Scholar] [CrossRef]
- Zhang, S.; Wang, T.; Lin, S.; Zhang, Y.; Tesfamichael, T.; Bell, J.; Wang, H. Effect of different thermo-treatment at relatively low temperatures on the properties of indium-tin-oxide thin films. Thin Solid Films 2017, 636, 702–709. [Google Scholar] [CrossRef]
- Mergel, D.; Qiao, Z. Correlation of lattice distortion with optical and electrical properties of In 2 O 3: Sn films. Journal of applied physics 2004, 95, 5608–5615. [Google Scholar] [CrossRef]
- Kamei, M.; Shigesato, Y.; Takaki, S. Origin of characteristic grain-subgrain structure of tin-doped indium oxide films. Thin Solid Films 1995, 259, 38–45. [Google Scholar] [CrossRef]
- Brintlinger, T.; Chen, Y.F.; Dürkop, T.; Cobas, E.; Fuhrer, M.S.; Barry, J.D.; Melngailis, J. Rapid imaging of nanotubes on insulating substrates. Appl. Phys. Lett. 2002, 81, 2454–2456. [Google Scholar] [CrossRef]
- Schmidt, R.; Brinkman, A.W. Preparation and characterization of NiMn2O4 films. Int. J. Inorg. Mater. 2001, 3, 1215–1217. [Google Scholar] [CrossRef]
- Thirumoorthi, M.; Prakash, J.T.J. Structure, optical and electrical properties of indium tin oxide ultra-thin films prepared by jet nebulizer spray pyrolysis technique. Asian Ceram. Soc. 2016, 4, 124–132. [Google Scholar] [CrossRef]
- Seki, S.; Sawada, Y.; Ogawa, M.; Yamamoto, M.; Kagota, Y.; Shida, A.; Ide, M. Highly conducting indium-tin-oxide transparent films prepared by dip-coating with an indium carboxylate salt. Surf. Coatings Technol. 2003, 169–170, 525–527. [Google Scholar] [CrossRef]
- Yang, C.-S.; Kuo, C.; Tang, C.-C.; Chen, J.C.; Pan, R.-P.; Pan, C.-L. Liquid-Crystal Terahertz Quarter-Wave Plate Using Chemical-Vapor-Deposited Graphene Electrodes. IEEE Photonics J. 2015, 7, 2200808. [Google Scholar] [CrossRef]
- Sahoo, A.K.; Au, W.C.; Hong, Y.C.; Pan, C.L.; Zhai, D.; Hérault, E.; Garet, F.; Coutaz, J.L. Dopant profiling of ion-implanted GaAs by terahertz time-domain spectroscopy. Journal of Applied Physics 2023, 133, 125705. [Google Scholar] [CrossRef]
- Pan, C.; Hsieh, C.; Pan, R.; Tanaka, M.; Miyamaru, F.; Tani, M.; Hangyo, M. Control of enhanced THz transmission through metallic hole arrays using nematic liquid crystal. Opt. Express 2005, 13, 3921–3930. [Google Scholar] [CrossRef]
- Li, J.; Li, J. Dielectric properties of silicon in terahertz wave region. Microwave and optical technology letters. 2008, 50, 1143–1146. [Google Scholar] [CrossRef]
- Dai, J.; Zhang, J.; Zhang, W.; Grischkowsky, D. Terahertz time-domain spectroscopy characterization of the far-infrared absorption and index of refraction of high-resistivity, float-zone silicon. J. Opt. Soc. Am. B 2004. 21, 1379–1386. [CrossRef]
- Labbe-Lavigne, S.; Barret, S.; Garet, F.; Duvillaret, L.; and Coutaz, J.L. Far-infrared dielectric constant of porous silicon layers measured by terahertz time-domain spectroscopy. Journal of Applied Physics 1998. 83, 6007–6010. [CrossRef]
- Neshat, M.; Armitage, N.P. Developments in THz Range Ellipsometry. J Infrared Milli Terahz Waves 2013, 34, 682–708. [Google Scholar] [CrossRef]
- Han, L.; Ding, H.F.; Huang, T.Y.; Wu, X.; Chen, B.; Ren, K.; Fu, S. Broadband optical reflection modulator in indium-tin-oxide-filled hybrid plasmonic waveguide with High modulation depth. Plasmonics 2018, 13, 1309–1314. [Google Scholar] [CrossRef]
- Khaleque, A.; Hattori, H.T. Plasmonic electro-absorption modulator and polarization selector. Journal of Modern Optics 2017, 64, 1164–1174. [Google Scholar] [CrossRef]
- Born, M.; Wolf, E. Principles of optics: Electromagnetic theory of propagation, interference and diffraction of light, 7th ed.; Cambridge University Press: New York, 1999. [Google Scholar]
- Clanget, R. Ionized impurity scattering in degenerate In2O3. Applied physics 1973, 2, 247–256. [Google Scholar] [CrossRef]
- Smith, N. Classical generalization of the Drude formula for the optical conductivity. Phys. Rev. B 2001, 64, 155106. [Google Scholar] [CrossRef]
- Cocker, T.L.; Baillie, D.; Buruma, M.; Titova, L.V.; Sydora, R.D.; Marsiglio, F.; Hegmann, F.A. Microscopic origin of the Drude-Smith model. Phys. Rev. B 2017, 96, 205439. [Google Scholar] [CrossRef]
- Němec, H.; Kužel, P.; Sundström, V. Far-infrared response of free charge carriers localized in semiconductor nanoparticles. Phys. Rev. B 2009, 79, 115309. [Google Scholar] [CrossRef]
- Conwell, E.; Weisskopf, V.F. Theory of impurity scattering in semiconductors. Physical review 1950, 77, 388. [Google Scholar] [CrossRef]
- Hamberg, I.; Granqvist, C.G. Evaporated Sn-doped In2O3 films: Basic optical properties and applications to energy-efficient windows. Journal of Applied Physics 1986, 60, R123–R160. [Google Scholar] [CrossRef]
- Fujiwara, H.; Kondo, M. Effects of carrier concentration on the dielectric function of ZnO: Ga and In 2 O 3: Sn studied by spectroscopic ellipsometry: Analysis of free-carrier and band-edge absorption. Physical Review B—Condensed Matter and Materials Physics 2005, 71, 075109. [Google Scholar] [CrossRef]
- Blair, S.F.J.; Male, J.S.; Cavill, S.A.; Reardon, C.P.; Krauss, T.F. Photonic Characterisation of Indium Tin Oxide as a Function of Deposition Conditions. Nanomaterials 2023, 13, 1990. [Google Scholar] [CrossRef] [PubMed]
- Brown, E.R.; Zhang, W.D.; Chen, H.; Mearini, G.T. THz Behavior of Indium-Tin-Oxide Films on p-Si Substrates. Appl. Phys. Lett. 2015, 107, 091102. [Google Scholar] [CrossRef]
- Valla, A.; Carroy, P.; Ozanne, F.; Muñoz, D. Understanding the role of mobility of ITO films for silicon heterojunction solar cell applications. Solar energy materials and solar cells. 2016, 157, 874–880. [Google Scholar] [CrossRef]
- Parida, B.; Gil, Y.; Kim, H. Highly Transparent Conducting Indium Tin Oxide Thin Films Prepared by Radio Frequency Magnetron Sputtering and Thermal Annealing. J. Nanosci. Nanotechnol. 2018, 19, 1455–1462. [Google Scholar] [CrossRef] [PubMed]
- Yuan, G.; Xu, Z.; Zhang, F.; Wang, Y. Influence to Photoelectric Properties of ITO Thin Film by Sputtering Condition and RTA Processing. Chinese Journal of Materials Research 2007, 21, 282. [Google Scholar]
- Sun, K.; Yang, C.; Zhang, D.; Jin, D.; Wei, Y.; Yuan, H. Effects of ambient high-temperature annealing on microstructure, elemental composition, optical and electrical properties of indium tin oxide films. Mater. Sci. Eng. B 2022, 276, 115534. [Google Scholar] [CrossRef]
- Ederth, J.; Johnsson, P.; Niklasson, G.A.; Hoel, A.; Hultåker, A.; Heszler, P.; Granqvist, C.G.; van Doorn, A.R.; Jongerius, M.J.; Burgard, D. Electrical and optical properties of thin films consisting of tin-doped indium oxide nanoparticles. Phys. Rev. B 2003, 68, 155410. [Google Scholar] [CrossRef]
- Silveira, F.E.M.; Kurcbart, S.M. Hagen-rubens relation beyond far-infrared region. Eur. Phys. Lett 2010, 90, 44004. [Google Scholar] [CrossRef]
- Naftaly, M.; Dudley, R. Terahertz Reflectivities of Metal-Coated Mirrors. Appl. Opt. 2011, 50, 3201. [Google Scholar] [CrossRef] [PubMed]
- Ramadan, R.; Abdel-Hady, K.; Manso-Silván, M.; Torres-Costa, V.; Martín-Palma, R.J.J. Microwave plasma and rapid thermal processing of indium-tin oxide thin films for enhancing their performance as transparent electrodes. J. Photonics Energy 2019, 9, 034001. [Google Scholar] [CrossRef]
- Khusayfan, N.M.; El-Nahass, M.M. Study of Structure and Electro-Optical Characteristics of Indium Tin Oxide Thin Films. Adv. Condens. Matter Phys. 2013, 2013, 408182. [Google Scholar] [CrossRef]
- Her, S.-C.; Chang, C.-F. Fabrication and Characterization of Indium Tin Oxide Films. J. Appl. Biomater. Funct. Mater. 2017, 15, 170–175. [Google Scholar] [CrossRef]
- Parsianpour, E.; Raoufi, D.; Roostaei, M.; Sohrabi, B.; Samavat, F. Characterization and structural property of indium tin oxide thin films. Adv. Mater. Phys. Chem. 2017, 7, 42–57. [Google Scholar] [CrossRef]
- Frank, G.; Kauer, E.; Kostlin, H. Transparent heat-reflecting coatings based on highly doped semiconductors. Thin Solid Films 1981, 77, 107–118. [Google Scholar] [CrossRef]
- Swanepoel, R. Determination of the thickness and optical constants of amorphous silicon. Journal of Physics E: Scientific Instruments 1983, 16, p1214. [Google Scholar] [CrossRef]
- Hacini, A.; Ali, A.H.; Adnan, N.N. Optimization of ITO thin film properties as a function of deposition time using the swanepoel method. Opt. Mater. 2021, 120, 111411. [Google Scholar] [CrossRef]
- Kumar, J.K.; Raju, R.C.N.; Subrahmanyam, A. Thickness dependent physical and photocatalytic properties of ITO thin films prepared by reactive DC magnetron sputtering. Appl. Surf. Sci. 2011, 257, 3075–3080. [Google Scholar] [CrossRef]
- Dolgonos, A.; Mason, T.O.; Poeppelmeier, K.R. Direct optical band gap measurement in polycrystalline semiconductors: A critical look at the Tauc method. J. Solid State Chem. 2016, 240, 43–48. [Google Scholar] [CrossRef]
- Burstein, E.; Davisson, J.; Bell, E.; Turnre, W.; Lipson, H. Infrared photoconductivity due to neutral impurities in germanium. Phys. Rev. 1954, 93, 65–68. [Google Scholar] [CrossRef]
- Moss, T. The interpretation of the properties of Indium antimonide. Proc. Phys. Soc. B 1954, 67, 775–782. [Google Scholar] [CrossRef]
- Roth, A.P.; Webb, J.B.; Williams, D.F. Band-gap narrowing in heavily defect-doped ZnO. Physical Review B 1982, 25, 7836. [Google Scholar] [CrossRef]
- Abd-Elnaiem, A.M.; Hakamy, A. Influence of annealing temperature on structural, electrical, and optical properties of 80 nm thick indium-doped tin oxide on borofloat glass. Journal of Materials Science: Materials in Electronics 2022, 33, 23293–23305. [Google Scholar] [CrossRef]
- Park, J.H.; Buurma, C.; Sivananthan, S.; Kodama, R.; Gao, W.; Gessert, T.A. The effect of post-annealing on Indium Tin Oxide thin films by magnetron sputtering method. Appl. Surf. Sci. 2014, 307, 388–392. [Google Scholar] [CrossRef]
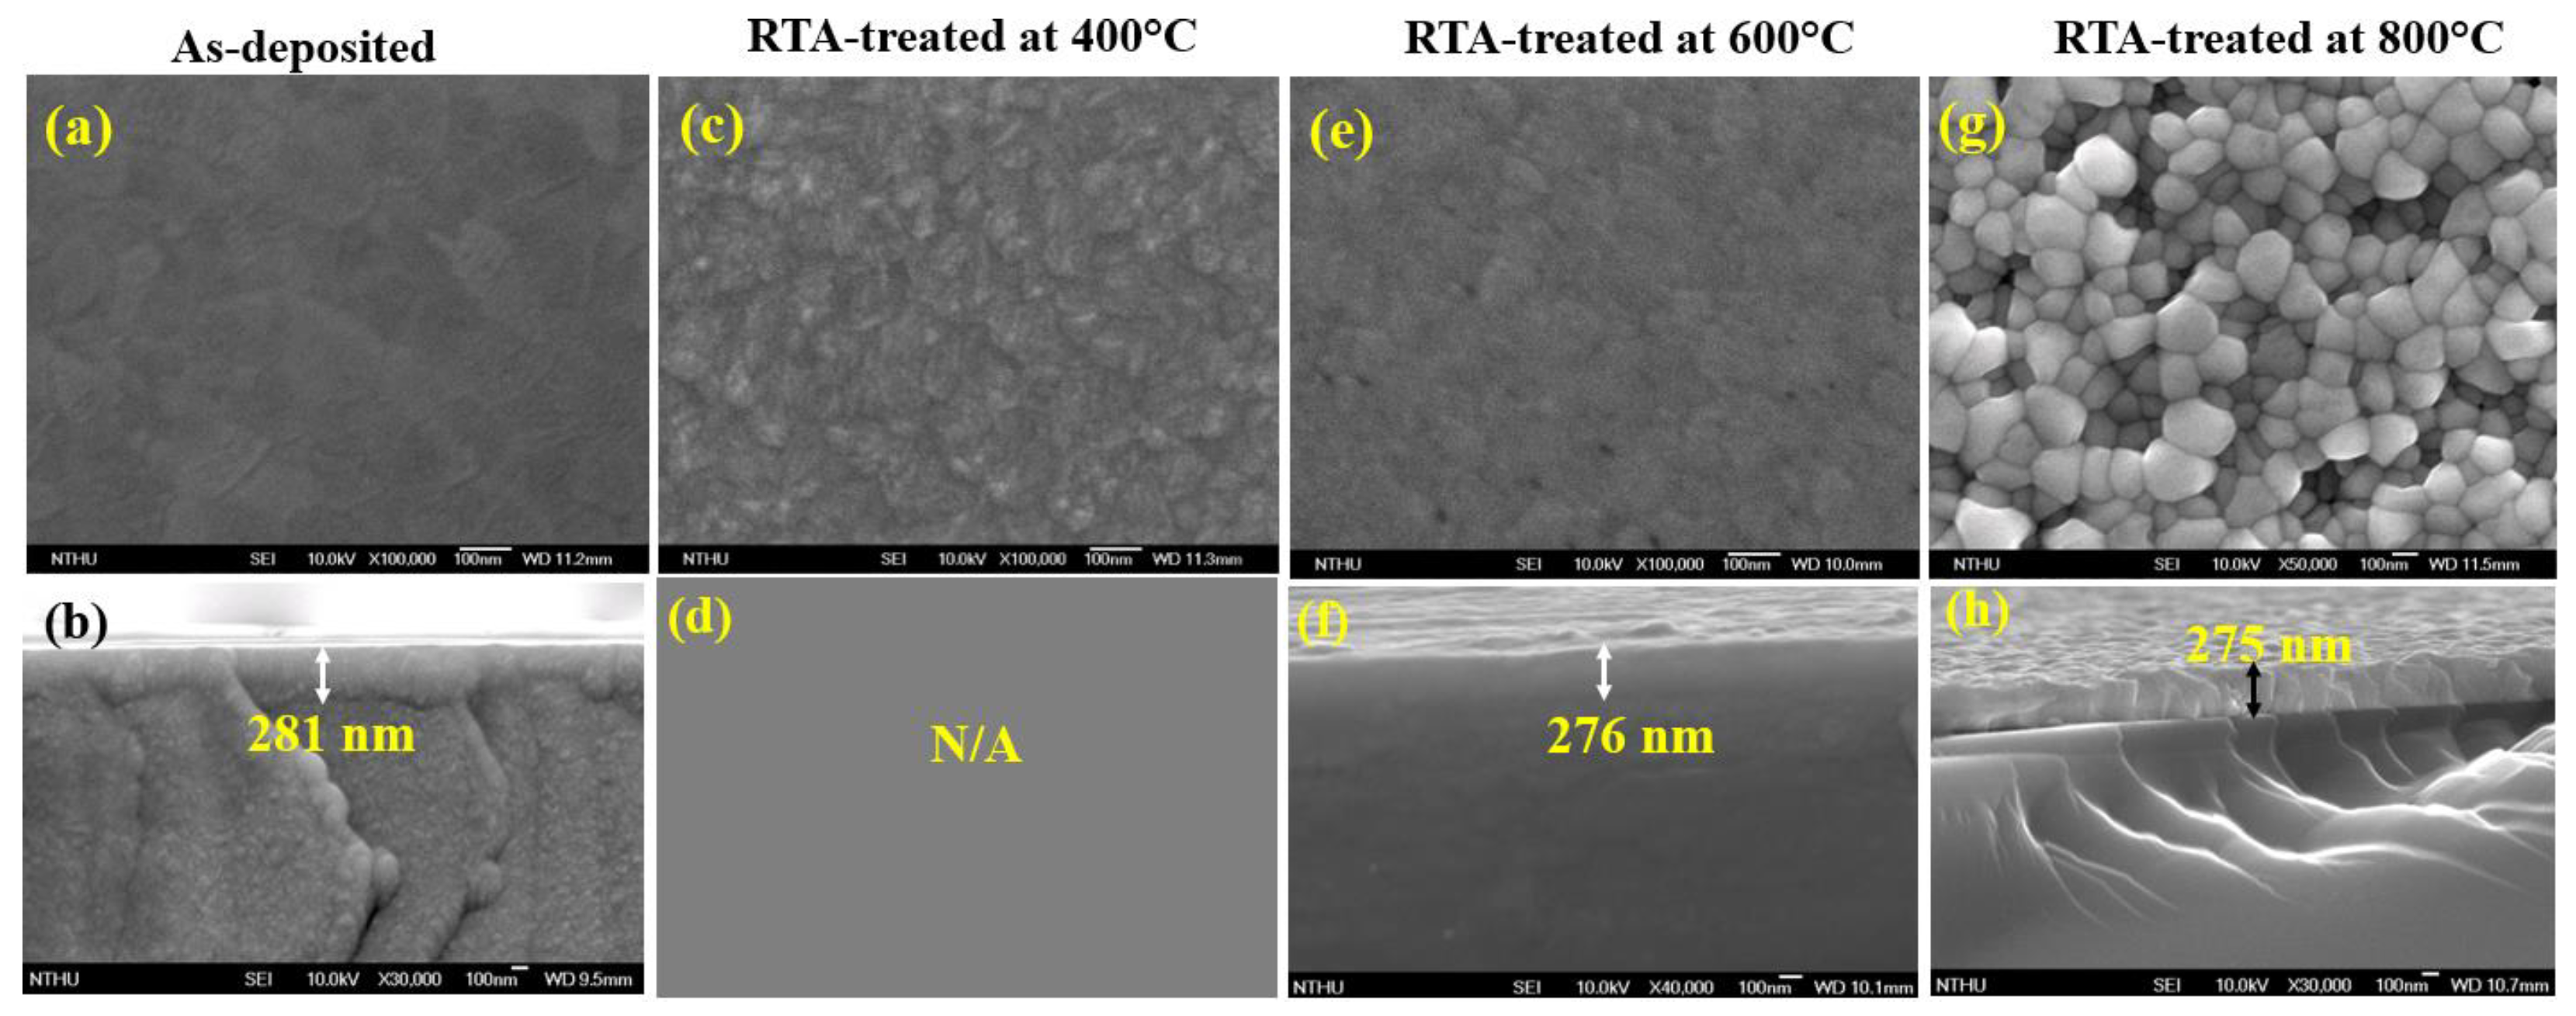
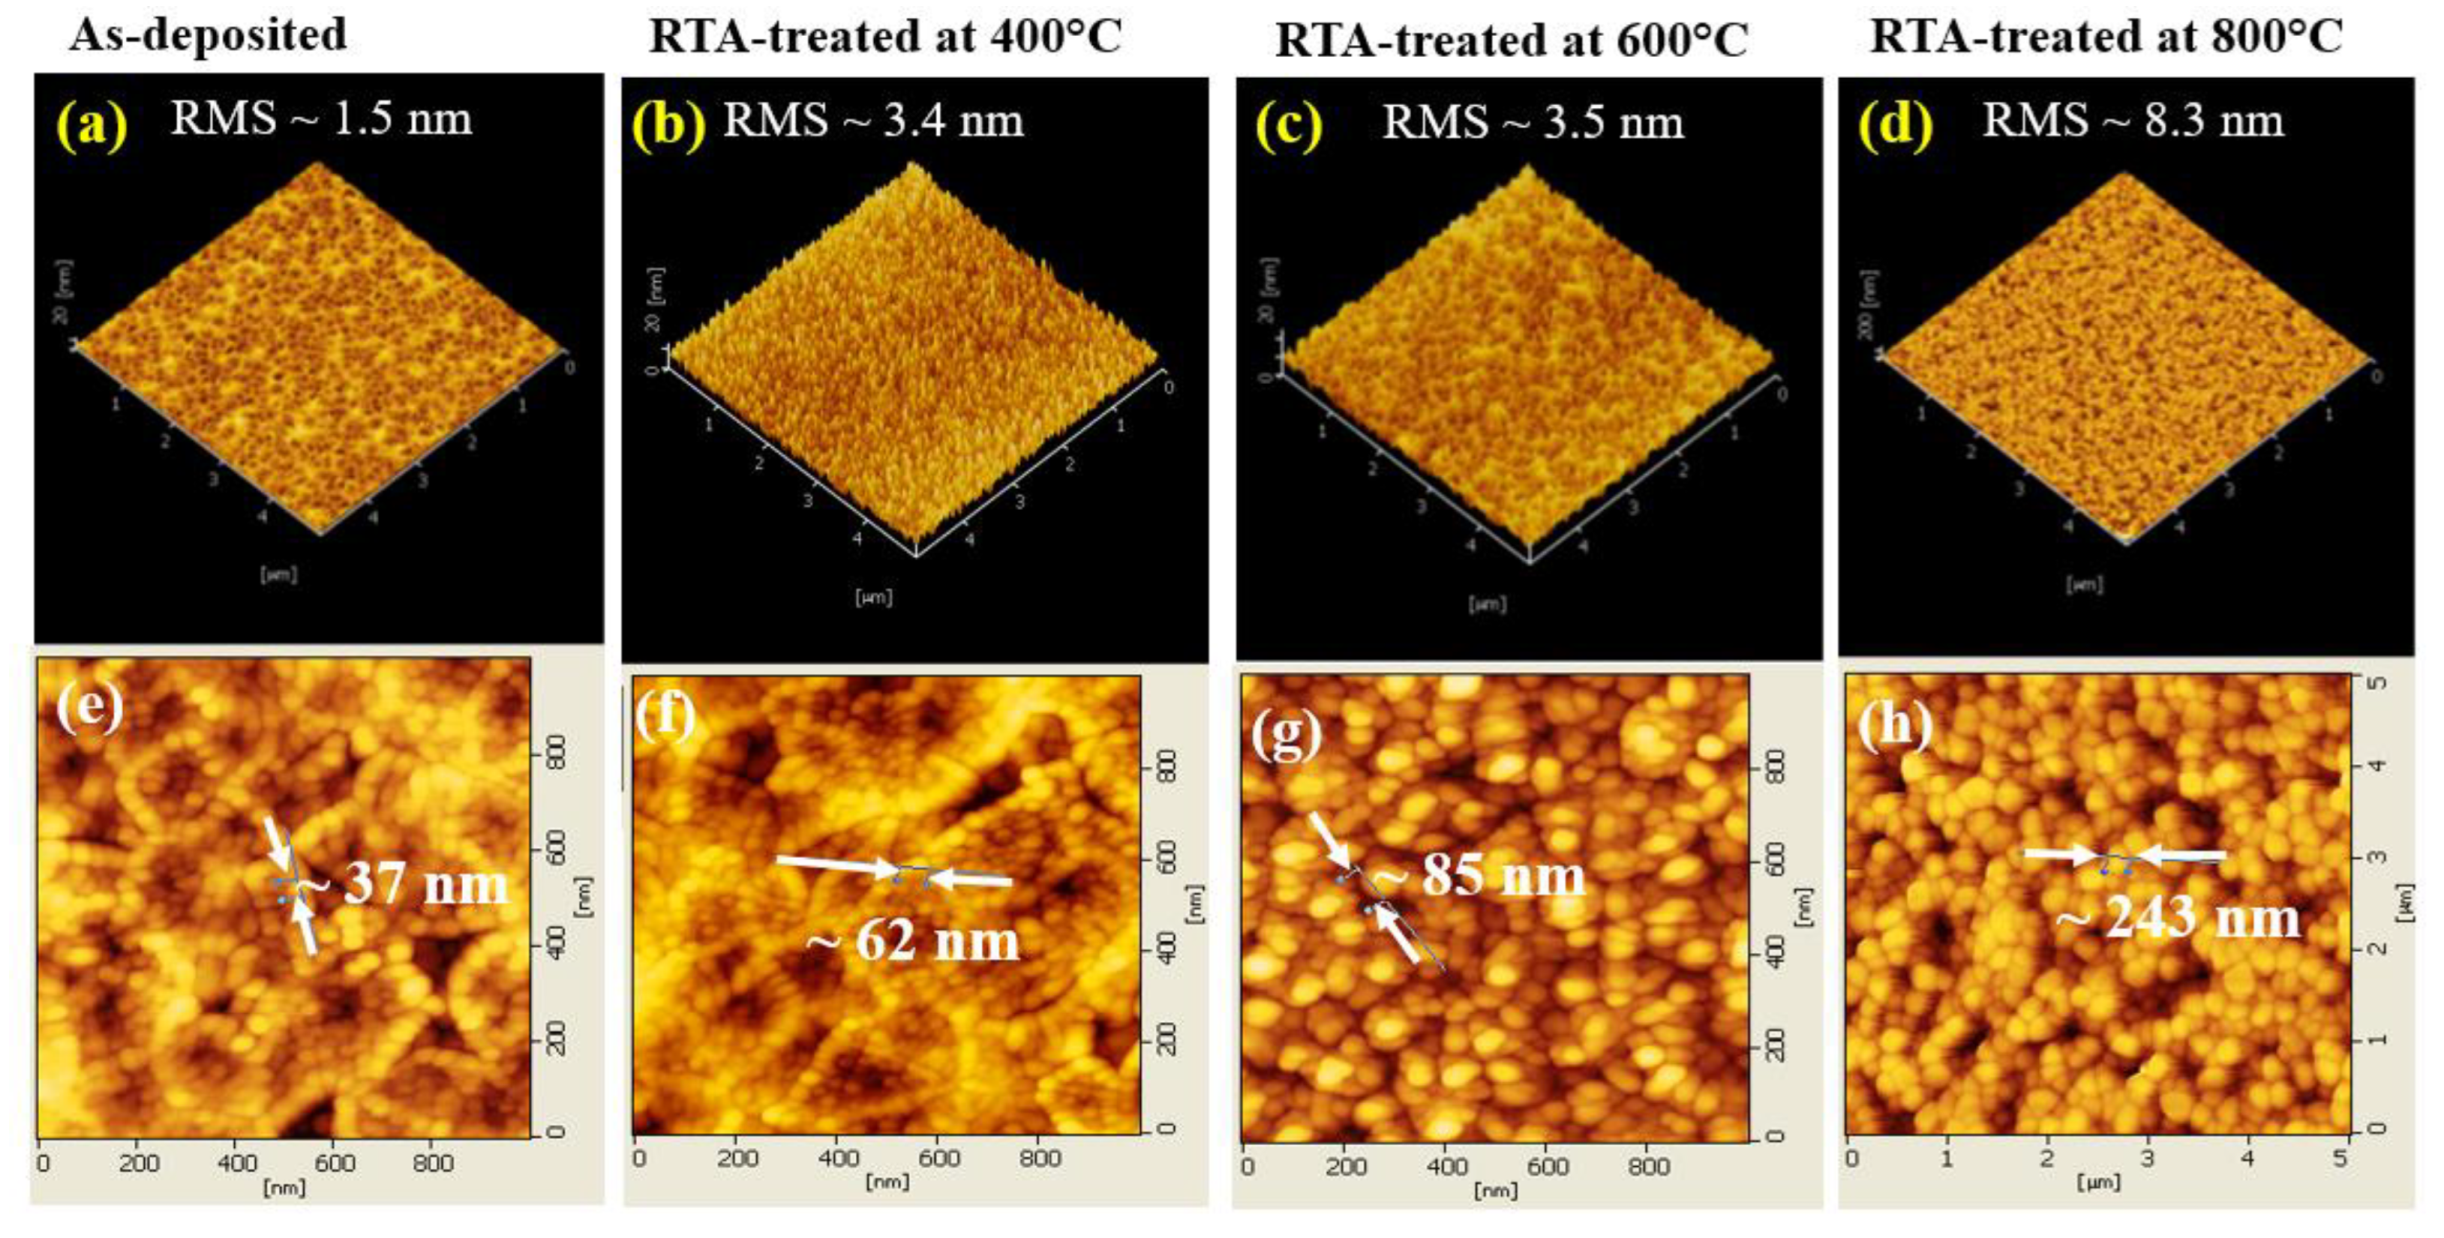

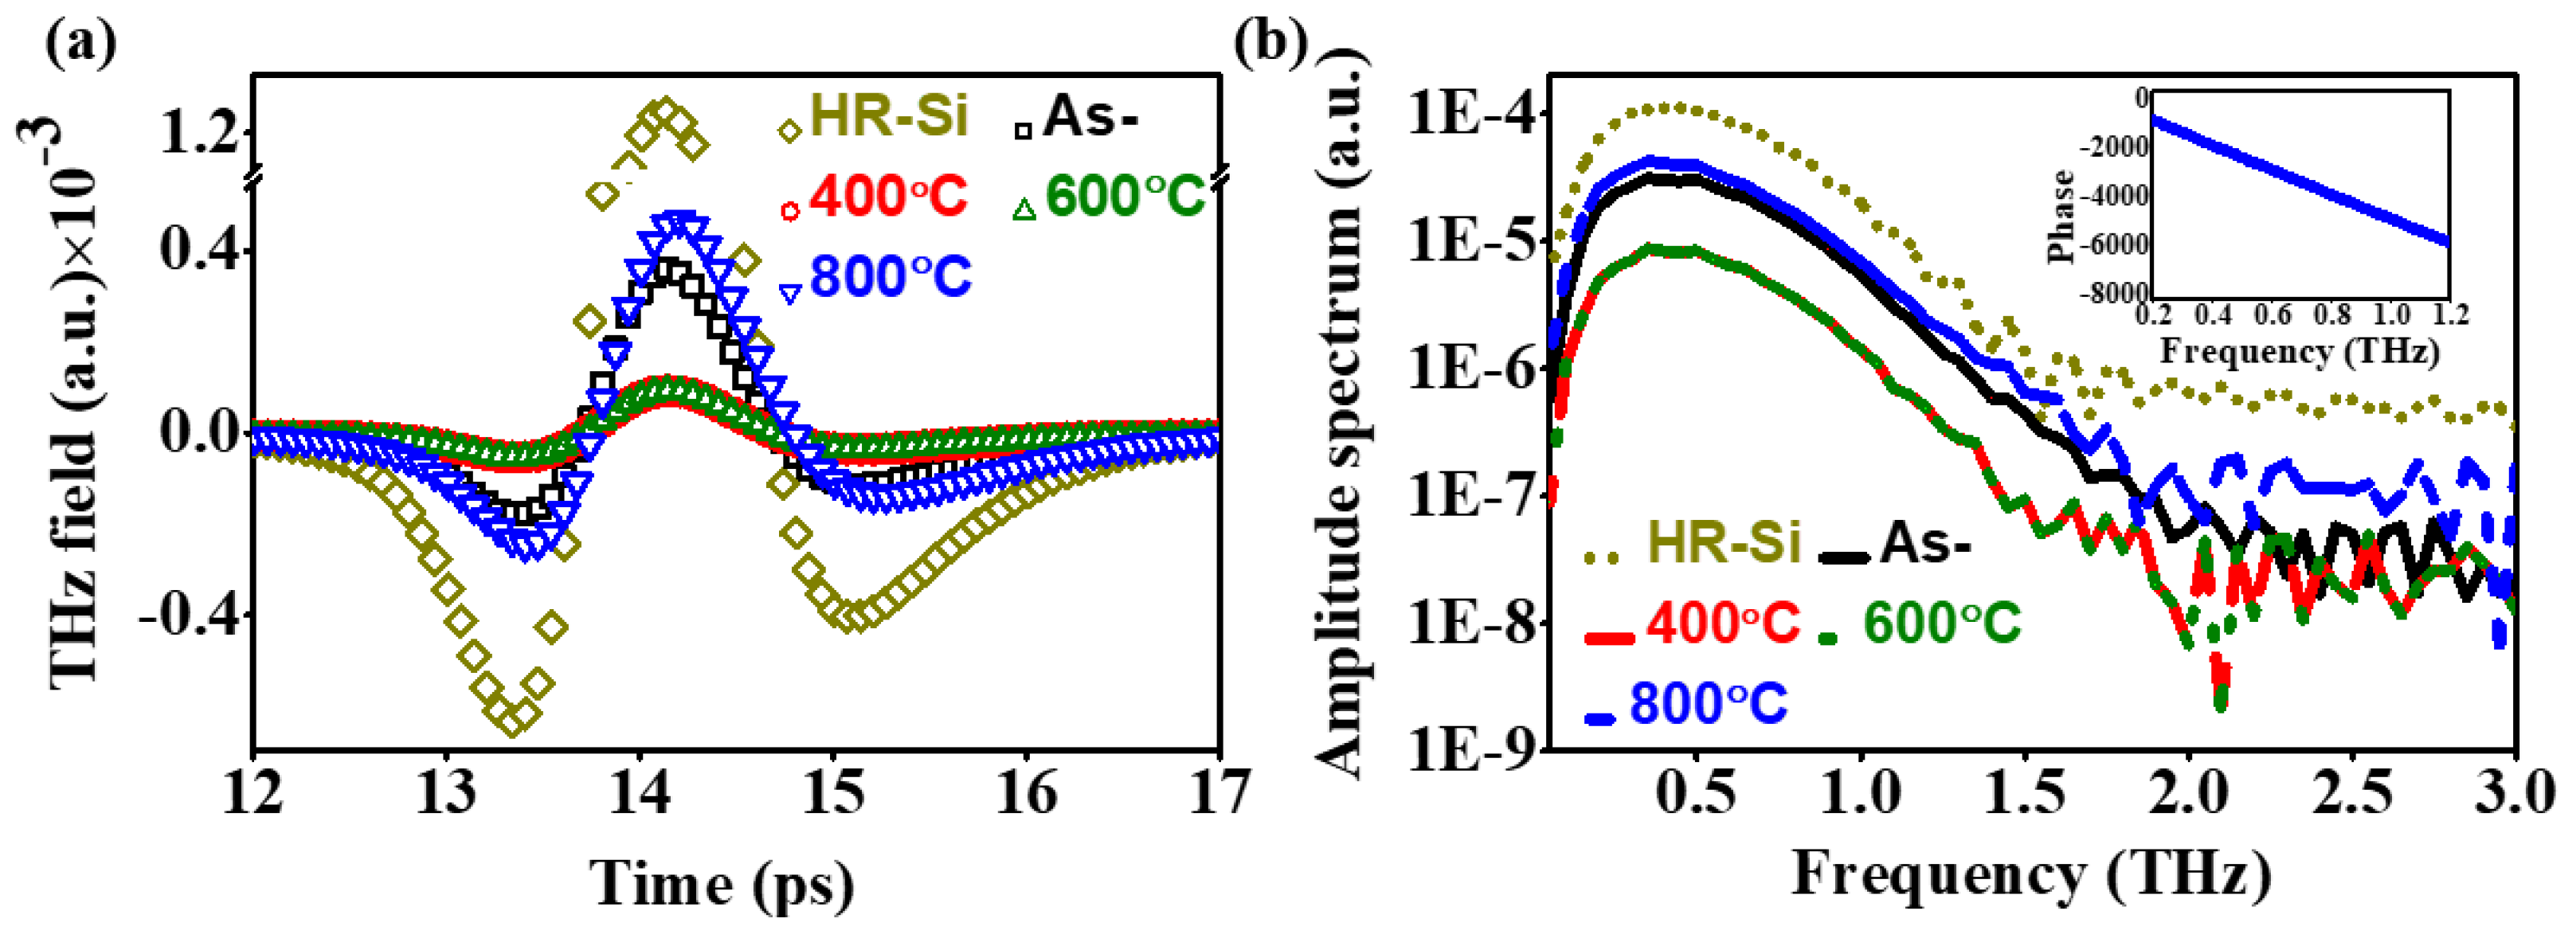

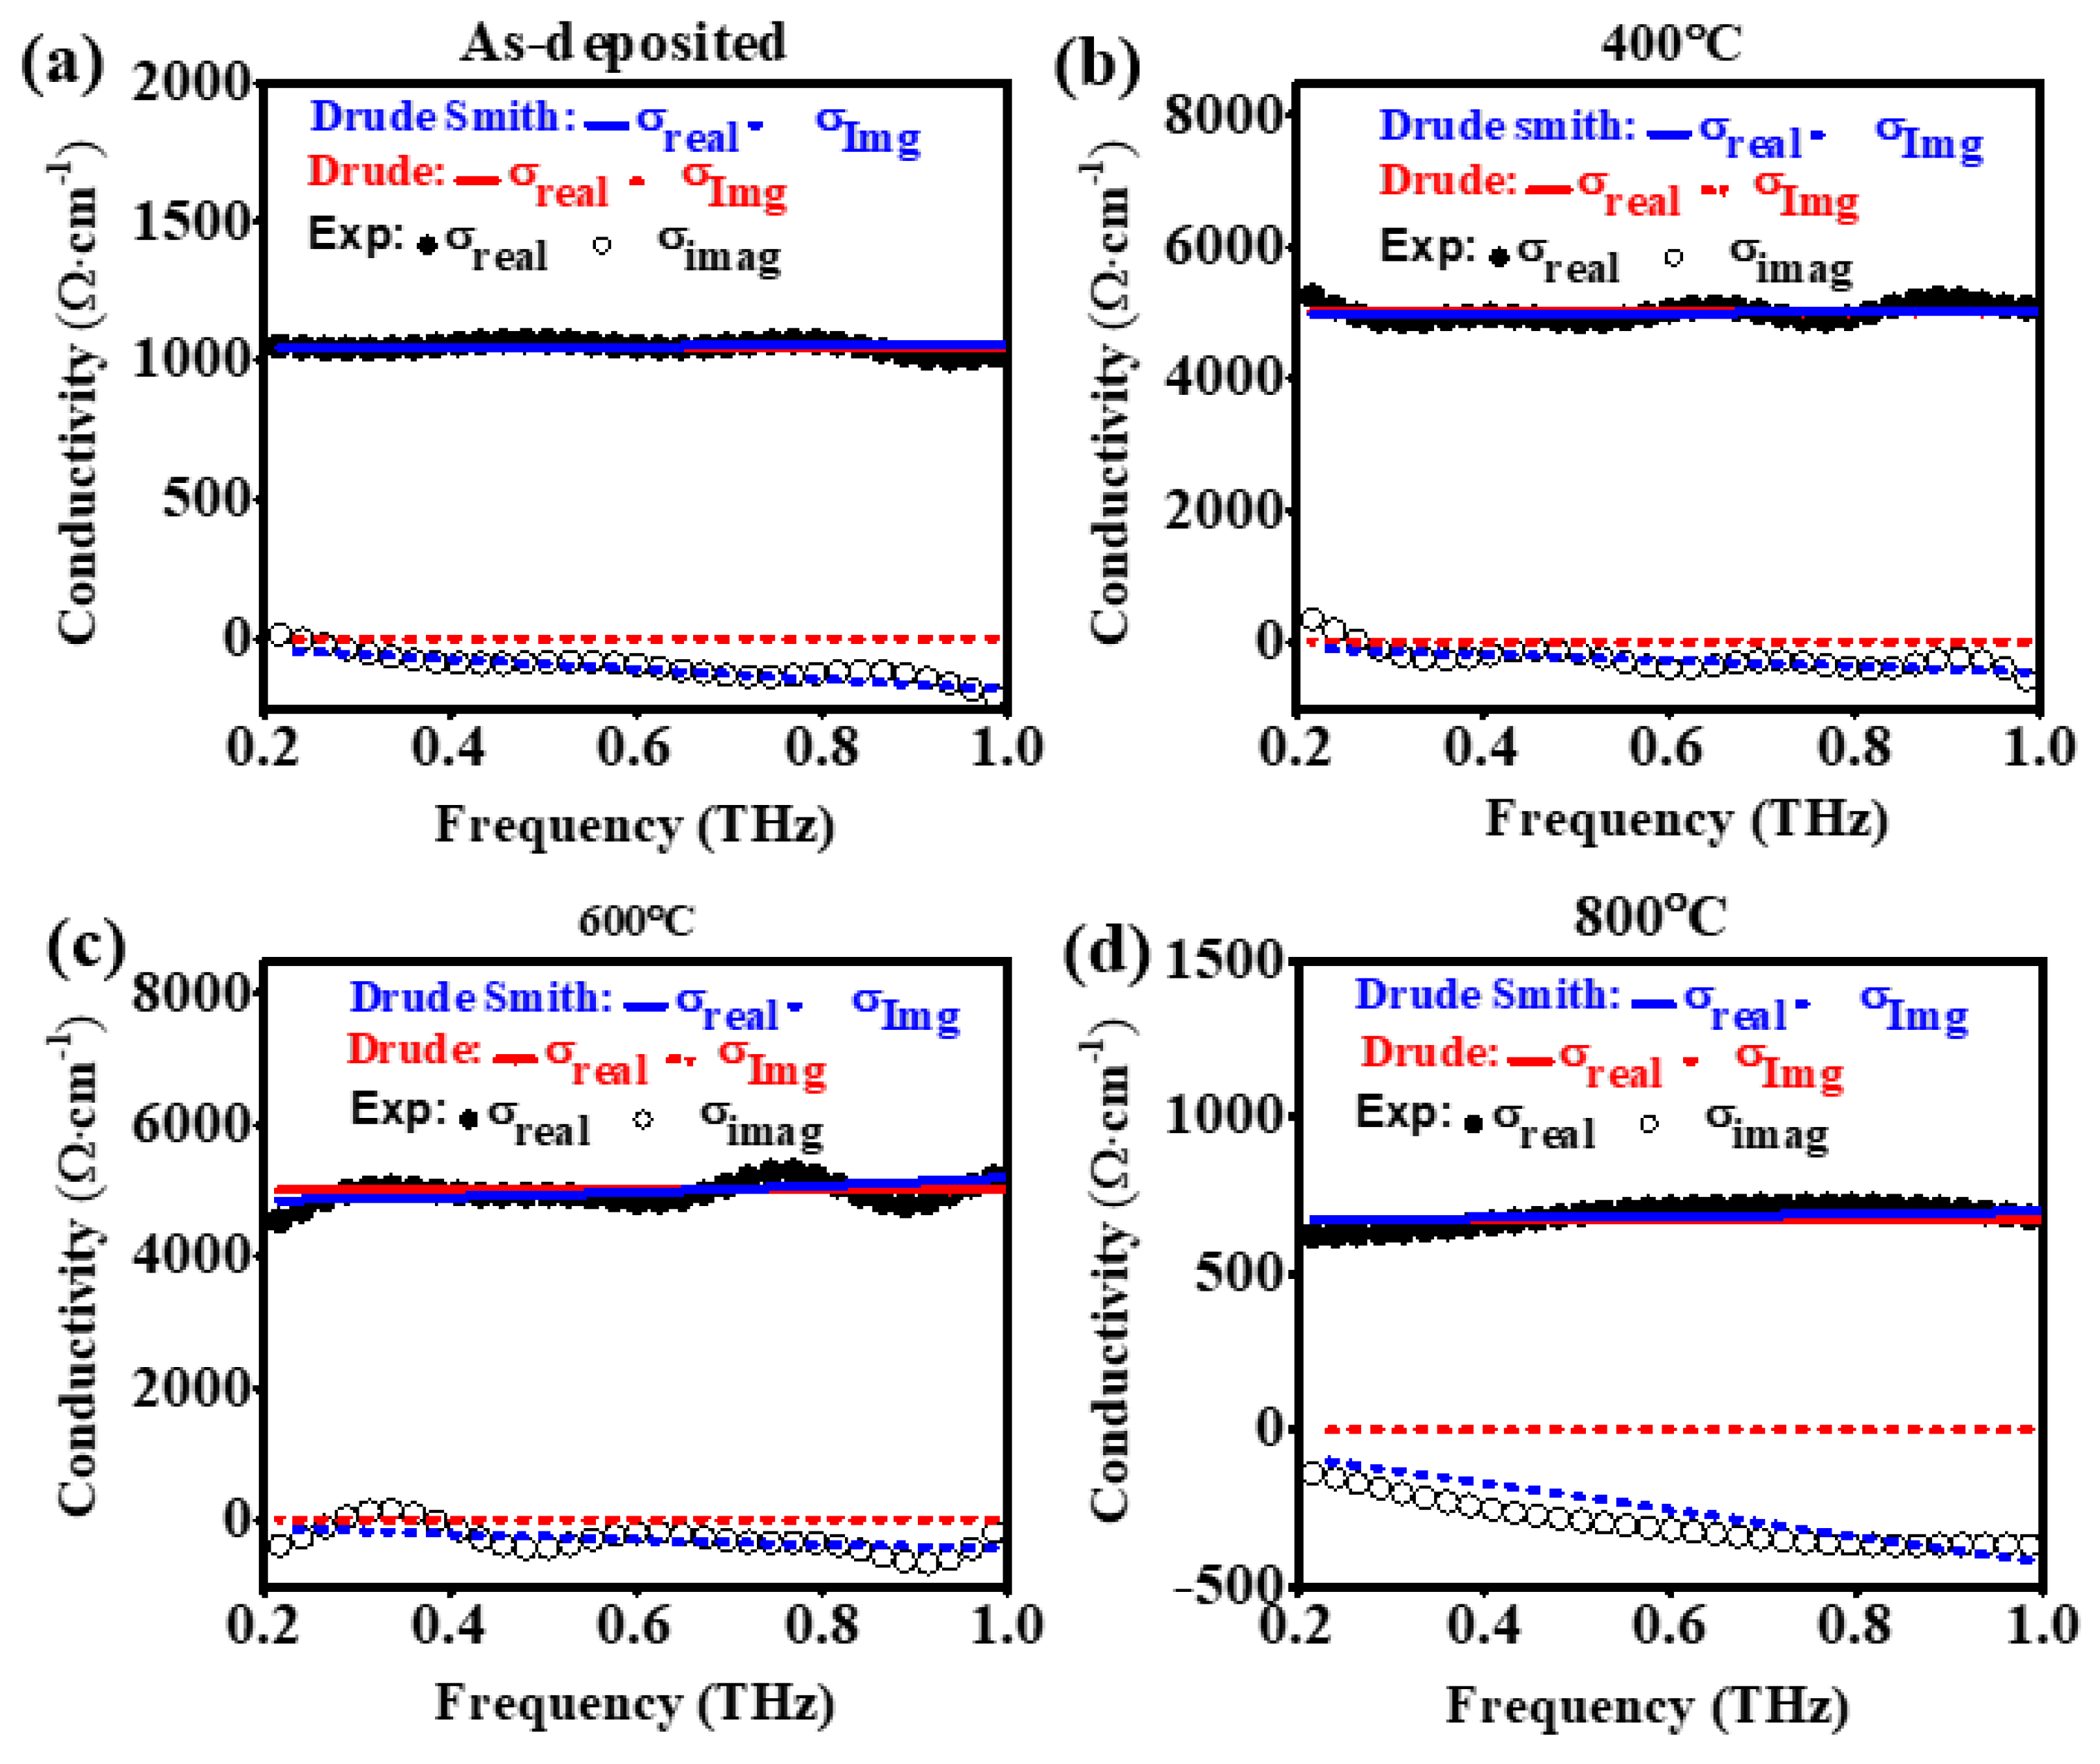

| Sample | O K | In L | Sn L | |||
|---|---|---|---|---|---|---|
| Weight (%) | Atomic (%) | Weight (%) | Atomic (%) | Weight (%) | Atomic (%) | |
| As- | 22.78 | 68.01 | 67.44 | 28.05 | 9.77 | 3.93 |
| 600°C | 22.98 | 68.23 | 69.48 | 28.75 | 7.54 | 3.02 |
| 800°C | 24.71 | 70.27 | 66.90 | 26.51 | 8.38 | 3.21 |
| Parameters | As- | 400°C | 600°C | 800°C |
|---|---|---|---|---|
| µ (cm2/V∙s) | 5.3 | 22 | 47 | 14 |
| ωp* (rad·THz) | 1784 | 1865 | 1294 | 839 |
| τ (fs) | 6 | 12 | 21 | 20 |
| c | -0.83 | -0.68 | -0.63 | -0.87 |
| N (cm-3) | 1.02×10²¹ | 1.31×10²¹ | 6.31×10²⁰ | 2.65×10¹⁹ |
| σDC( Ω-1‧cm-1) | 1019 | 4815 | 4792 | 628 |
| ρ (Ω‧cm) | 9.8×10⁻⁴ | 2.0×10⁻⁴ | 2.0×10⁻⁴ | 15.9×10⁻⁴ |
Disclaimer/Publisher’s Note: The statements, opinions and data contained in all publications are solely those of the individual author(s) and contributor(s) and not of MDPI and/or the editor(s). MDPI and/or the editor(s) disclaim responsibility for any injury to people or property resulting from any ideas, methods, instructions or products referred to in the content. |
© 2024 by the authors. Licensee MDPI, Basel, Switzerland. This article is an open access article distributed under the terms and conditions of the Creative Commons Attribution (CC BY) license (http://creativecommons.org/licenses/by/4.0/).


